Attached files
| file | filename |
|---|---|
| EX-32.2 - EXHIBIT 32.2 - Neenah Inc | np20161231ex-322.htm |
| EX-32.1 - EXHIBIT 32.1 - Neenah Inc | np20161231ex-321.htm |
| EX-31.2 - EXHIBIT 31.2 - Neenah Inc | np20161231ex-312.htm |
| EX-31.1 - EXHIBIT 31.1 - Neenah Inc | np20161231ex-311.htm |
| EX-24 - EXHIBIT 24 - Neenah Inc | powerofattorney.htm |
| EX-23 - EXHIBIT 23 - Neenah Inc | consent.htm |
| EX-21 - EXHIBIT 21 - Neenah Inc | listofsubsidiaries.htm |
| EX-12 - EXHIBIT 12 - Neenah Inc | ratioofearningstofixedchar.htm |
| EX-10.5 - EXHIBIT 10.5 - Neenah Inc | neenahpaperamendedandresta.htm |
UNITED STATES
SECURITIES AND EXCHANGE COMMISSION
Washington, D.C. 20549
__________________________________________________
FORM 10-K
__________________________________________________
(Mark One)
ý | ANNUAL REPORT PURSUANT TO SECTION 13 OR 15(d) OF THE SECURITIES EXCHANGE ACT OF 1934 | |
For the fiscal year ended December 31, 2016 | ||
OR | ||
o | TRANSITION REPORT PURSUANT TO SECTION 13 OR 15(d) OF THE SECURITIES EXCHANGE ACT OF 1934 | |
For the transition period from to | ||
Commission file number 001-32240 | ||
NEENAH PAPER, INC.
(Exact name of registrant as specified in its charter)
Delaware | 20-1308307 | |
(State or other jurisdiction of incorporation or organization) | (I.R.S. Employer Identification No.) | |
3460 Preston Ridge Road Alpharetta, Georgia | 30005 | |
(Address of principal executive offices) | (Zip Code) | |
Registrant's telephone number, including area code: (678) 566-6500 | ||
Securities registered pursuant to Section 12(b) of the Act:
Securities registered pursuant to Section 12(g) of the Act: None
Title of Each Class | Name of Each Exchange on Which Registered | |
Common Stock — $0.01 Par Value | New York Stock Exchange | |
Indicate by check mark if the registrant is a well-seasoned issuer, as defined in Rule 405 of the Securities Act. Yes ý No o
Indicate by check mark if the registrant is not required to file reports pursuant to Section 13 or Section 15(d) of the Act. Yes o No ý
Indicate by check mark whether the registrant (1) has filed all reports required to be filed by Section 13 or 15(d) of the Securities Exchange Act of 1934 during the preceding 12 months (or for such shorter period that the registrant was required to file such reports), and (2) has been subject to such filing requirements for the past 90 days. Yes ý No o
Indicate by check mark whether the registrant has submitted electronically and posted on its corporate Web site, if any, every Interactive Data File required to be submitted and posted pursuant to Rule 405 of Regulation S-T (§232.405 of this chapter) during the preceding 12 months (or such shorter period that the registrant was required to submit and post such files). Yes ý No o
Indicate by check mark if disclosure of delinquent filers pursuant to Item 405 of Regulation S-K is not contained herein, and will not be contained, to the best of registrant's knowledge, in definitive proxy or information statements incorporated by reference in Part III of this Form 10-K or any amendment to this Form 10-K. o
Indicate by check mark whether the registrant is a large accelerated filer, an accelerated filer, a non-accelerated filer, or a smaller reporting company. See definitions of "large accelerated filer," "accelerated filer," and "smaller reporting company" in Rule 12b-2 of the Exchange Act. (Check one):
Large accelerated filer ý | Accelerated filer o | Non-accelerated filer o (Do not check if a smaller reporting company) | Smaller reporting company o | |||
Indicate by check mark whether the registrant is a shell company (as defined in Rule 12b-2 of the Act). Yes o No ý
The aggregate market value of the registrant's common stock held by non-affiliates on June 30, 2016 (based on the closing stock price on the New York Stock Exchange) on such date was approximately $1,190,000,000.
As of February 21, 2017, there were 16,805,000 shares of the Company's common stock outstanding.
DOCUMENTS INCORPORATED BY REFERENCE
Certain information contained in the definitive proxy statement for the Company's Annual Meeting of Stockholders to be held on May 23, 2017 is incorporated by reference into Part III hereof.
TABLE OF CONTENTS
Page | ||||
PART I
In this report, unless the context requires otherwise, references to "we," "us," "our," "Neenah" or the "Company" are intended to mean Neenah Paper, Inc., its consolidated subsidiaries and predecessor companies.
Item 1. Business
Overview
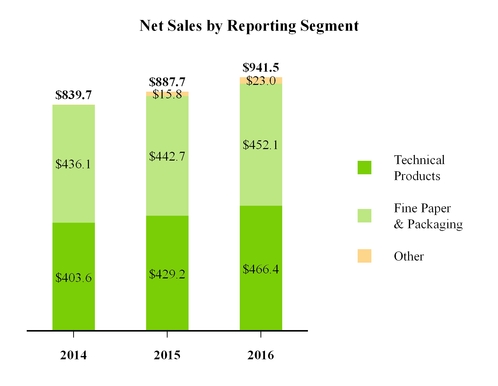
We are organized into two primary businesses: a performance-based technical products business and a premium fine paper and packaging business.
Our technical products business is a leading international producer of transportation, water and other filter media and durable, saturated and coated substrates for a variety of end markets. We focus on categories where we believe we are, or can be, a market leader. These categories include filtration media for transportation, water and other uses, backings for specialty tapes and abrasives, performance labels and other specialty markets. Our dedicated technical products manufacturing facilities are located near Munich, Germany, in Bolton, England, in Munising, Michigan and in Pittsfield, Massachusetts. In addition, certain technical products are manufactured along with fine paper and packaging products in shared facilities located in upstate New York and Quakertown, Pennsylvania. In 2017, a filtration machine (which was converted from a fine paper machine) will begin production in Appleton, Wisconsin, a site also shared with the fine paper and packaging business. For a description of the shared facilities, see Item 2, "Properties."
We believe our fine paper and packaging business is the leading supplier of premium printing and other high end specialty papers in North America. Our products include some of the most recognized and preferred papers in North America, where we enjoy leading market positions in many of our product categories. We sell our products primarily to authorized paper distributors, as well as through converters, major national retailers and specialty businesses. Our primary fine paper and packaging manufacturing facilities are located in Neenah and Whiting, Wisconsin and in Brattleboro, Vermont. In addition, certain products are manufactured in shared facilities located in upstate New York and Quakertown, Pennsylvania, as well as an existing site shared with technical products in 2017 in Appleton, Wisconsin. For a description of the shared facilities, see Item 2, "Properties."
1
Company Structure
Our corporate structure consists of Neenah Paper, Inc. and seven direct wholly owned subsidiaries.
Neenah Paper, Inc. is a Delaware corporation that holds our trademarks and patents related to all of our U.S. businesses (except Neenah Paper FVC, Inc), all of our U.S. fine paper and packaging inventory, the real estate, mills and manufacturing assets associated with our fine paper and packaging operations in Neenah and Whiting, Wisconsin and all of the equity in our subsidiaries listed below. The common stock of Neenah is publicly traded on the New York Stock Exchange under the symbol "NP."
Neenah Paper Michigan, Inc. is a Delaware corporation and a wholly owned subsidiary of Neenah that owns the real estate, mill and manufacturing assets associated with our U.S. technical products business in Munising, Michigan.
Neenah Paper FVC, LLC is a Delaware limited liability company and wholly owned subsidiary of Neenah that owns all of the equity of Neenah Paper FR, LLC. Neenah Paper FR, LLC ("Fox River") is a Delaware limited liability company that owns the real estate, mill and manufacturing assets associated with our fine paper and packaging operation in Appleton, Wisconsin.
Neenah Paper International Holding Company, LLC is a Delaware limited liability company and wholly owned subsidiary of Neenah that owns all of the equity of Neenah Paper International, LLC. Neenah Paper International, LLC is a Delaware limited liability company that owns all of the equity of Neenah Germany GmbH and in conjunction with Neenah Germany GmbH all of the equity of Neenah Services GmbH & Co. KG.
NPCC Holding Company LLC is a Delaware limited liability company and wholly owned subsidiary of Neenah that owns all of the equity of Neenah Paper Company of Canada ("Neenah Canada"). Neenah Canada is a Nova Scotia unlimited liability corporation that holds certain post-employment liabilities of our former Canadian operations.
Neenah Paper International Finance Company BV is a private company with limited liability organized under the laws of the Netherlands and a wholly owned subsidiary of Neenah that facilitates the financing of our international operations.
Neenah Filtration, LLC is a Delaware limited liability company and wholly owned subsidiary of Neenah that owns all of the equity of Neenah Technical Materials, Inc. ("NTM") and Neenah Filtration Appleton, LLC ("NFA"). NTM is a Massachusetts corporation that owns all of the real estate, mills and manufacturing assets associated with our technical materials business in Pittsfield, Massachusetts. NFA is a Delaware limited liability company that owns certain assets associated with our filtration business in Appleton, Wisconsin. The filtration assets in Appleton, Wisconsin have started production in January 2017. See "Management's Discussion and Analysis of Financial Condition and Results of Operations — Liquidity and Capital Resources."
Neenah FMK Holdings, LLC is a Delaware limited liability company and a wholly owned subsidiary of Neenah that owns all of the equity of ASP FiberMark, LLC ("ASP"). ASP is a Delaware limited liability company that owns all of the equity of Neenah Northeast, LLC ("NNE") and Neenah International UK Limited, a United Kingdom corporation ("Neenah UK"). NNE is a Delaware limited liability company that owns certain real estate, mills and manufacturing assets associated with our fine paper and packaging business and technical products business located in Brattleboro, Vermont, West Springfield, Massachusetts, Quakertown and Reading, Pennsylvania, and Brownville and Lowville, New York. Neenah UK is a United Kingdom corporation that owns all of the equity of Neenah Red Bridge International Limited ("Red Bridge"). Red Bridge is a United Kingdom corporation that owns all of the real estate, manufacturing assets and inventory associated with our technical products business in Bolton, England.
History of the Businesses
Neenah was incorporated in April 2004 in contemplation of the spin-off by Kimberly-Clark Corporation ("Kimberly-Clark") of its technical products and fine paper businesses in the United States and its Canadian pulp business (collectively, the "Pulp and Paper Business"). We had no material assets or activities until Kimberly-Clark's transfer to us of the Pulp and Paper business on November 30, 2004. On that date, Kimberly-Clark completed the distribution of all of the shares of our common stock to the stockholders of Kimberly-Clark (the "Spin-Off"). Following the Spin-Off, we are an independent public company and Kimberly-Clark has no ownership interest in us.
Former Pulp Operations. At the Spin-Off, our pulp operations consisted of mills located in Terrace Bay, Ontario and Pictou, Nova Scotia and approximately 975,000 acres of related woodlands. We disposed of these mills and woodlands in a series of transactions from 2006 to 2010.
Technical Products. The Munising, Michigan mill was purchased by Kimberly-Clark in 1952. Subsequent to the purchase, the mill was converted to produce durable, saturated and coated papers for sale and use in a variety of industrial applications for our technical products business.
2
In October 2006, we purchased the outstanding interests of FiberMark Services GmbH & Co. KG and the outstanding interests of FiberMark Beteiligungs GmbH (collectively "Neenah Germany"). At acquisition, the Neenah Germany assets consisted of two mills located near Munich, Germany and a third mill near Frankfurt, Germany. These mills produced a wide range of products, including transportation filter media, nonwoven wall coverings, masking and other tapes, abrasive backings, and specialized printing and coating substrates.
In July 2014, we purchased all of the outstanding equity of Crane Technical Materials, Inc. from Crane & Co., Inc. The acquired business provides performance-oriented wet laid nonwoven media for water filtration end markets as well as environmental, energy and industrial uses. The business has two manufacturing facilities in Pittsfield, Massachusetts.
On October 31, 2015, we sold our paper mill located near Frankfurt, Germany (the "Lahnstein Mill") to the Kajo Neukirchen Group (the "Buyer") for net cash proceeds of approximately $5.4 million. The Lahnstein Mill, which had annual sales of approximately €50 million, had been operating as a stand-alone business, manufacturing non-woven wallcoverings and various other specialty papers. See Note 13 of Notes to Consolidated Financial Statements, "Discontinued Operations."
Fine Paper and Packaging. The fine paper and packaging business was incorporated in 1885 as Neenah Paper Company, which initially operated a single paper mill in Neenah, Wisconsin. Kimberly-Clark acquired the mill in 1956. In 1981, Kimberly-Clark purchased an additional mill located in Whiting, Wisconsin and in the late 1980s and early 1990s, the capacity of the fine paper and packaging business was expanded by building two new paper machines at the Whiting mill and completing a major expansion of the Neenah facility with the installation of a new paper machine, finishing center, customer service center and an expanded distribution center.
In March 2007, we acquired the assets and brands of Fox River, which was a consolidating acquisition. In January 2012, we purchased certain premium fine paper brands and other assets from Wausau Paper Mills, LLC, a subsidiary of Wausau Paper Corp. ("Wausau") and in January 2013, we purchased certain premium business paper brands from the Southworth Company ("Southworth").
FiberMark Acquisition. On August 1, 2015, we purchased all of the outstanding equity of ASP FiberMark, LLC ("FiberMark") from ASP FiberMark Holdings, LLC ("American Securities") for approximately $118 million (the "FiberMark Acquisition"). We added specialty coating and finishing capabilities with this acquisition, particularly in luxury packaging and technical products. The results of operations and assets related to the FiberMark Acquisition are reflected in each of our business segments.
Business Strategy
Our mission is to create value by improving the image and performance of everything we touch. We expect to create value by growing in specialized niche markets that value performance or image and where we have competitive advantages. In managing our businesses, we believe that achieving and maintaining a leadership position in our markets, responding effectively to customer needs and competitive challenges, employing capital optimally, controlling costs and managing risks are important to our long-term success. Strategies to deliver value include:
Leading in profitable, specialty niche markets — We will increase our participation in niche markets that can provide us with leading positions and value our core competencies in performance-based fiber and non-woven media production, coating and saturating. Key markets include filtration, specialty backings and technical products, and premium fine paper and packaging.
Increasing our size, growth rate and portfolio diversification — We will invest and focus resources in higher growth specialty markets to grow with customers in new geographies and to enter into adjacent markets that are growing and profitable. We will do this both through organic initiatives that build on our technologies and capabilities, and through acquisitions that fit with our competencies and provide attractive financial returns.
Delivering consistent, attractive returns to our shareholders — We will continue to use Return on Invested Capital ("ROIC") as a key metric to evaluate investment decisions, measure our performance, maintain a prudent capital structure and deploy cash flows in ways that can provide value, including direct cash returns to shareholders through a meaningful dividend.
Products
Technical Products. Our technical products business is a leading international producer of performance-based substrates such as filtration media for transportation, water and other filtration markets, and saturated and coated performance materials used for industrial backings, labels and a variety of other end markets. In general, our technical products are sold to other manufacturers as key components for their finished products. Several of our key market segments served, including filtration and specialty backings for tape and abrasives, are global in scope. JET-PRO®SofStretchTM , KIMDURA®, PREVAILTM, NEENAH®, and GESSNER® are brands of our technical products business.
3
The following is a description of certain key products and markets:
Filtration media for transportation including induction air, fuel, oil, and cabin air applications. Transportation filtration media are sold to suppliers of automotive companies as original equipment on new cars and trucks as well as to the automotive aftermarket, which represents the large majority of sales.
Filtration media for water and other industrial end markets. Primary applications include reverse osmosis, catalytic conversion, nanofiltration, ultrafiltration, pervaporation and vapor permeation, as well as other applications for specialty markets.
Specialty backings including a) saturated and unsaturated crepe and flat paper tapes sold to manufacturers to produce finished pressure sensitive products for sale in automotive, transportation, manufacturing, building construction, and industrial general purpose applications, including sales in the consumer do-it-yourself retail channel and b) coated lightweight abrasive paper used in the automotive, construction, metal and woodworking industries for both dry and wet sanding applications.
Label and tag products made from both saturated base label stock and purchased synthetic base label stock, with coatings applied to allow for high quality variable and digital printing. The synthetic label stock is recognized as a high quality, UV (ultra-violet) stable product used for outdoor applications. Label and tag stock is sold to pressure sensitive coaters, who in turn sell the coated label and tag stock to the label printing community.
Other latex saturated and coated papers for use by a wide variety of manufacturers. Premask paper is used as a protective over wrap for products during the manufacturing process and for applying signs, labeling and other finished products. Medical packaging paper is a polymer impregnated base sheet that provides a breathable sterilization barrier that provides unique properties. Image transfer papers used to transfer an image from paper to tee shirts, hats, coffee mugs, and other surfaces using a proprietary imaging coating for use in digital printing applications. Publishing and security papers used to produce book covers, stationery, fancy packaging and passports. Other specialty products include clean room papers, durable printing papers, release papers and furniture backers.
Fine Paper and Packaging. Our fine paper and packaging business manufactures and sells world-class branded premium writing, text, cover and specialty papers and envelopes used in corporate identity packages, advertising collateral, premium labels and packaging, and wide format applications. Often these papers are characterized by distinctive coating, finishing, colors, and textures.
Commercial printing papers include premium writing, text and cover papers, and envelopes. Uses include advertising collateral, stationery, corporate identity packages and brochures, pocket folders, annual reports, advertising inserts, direct mail, business cards, scrapbooks, and a variety of other uses where colors, texture, coating, unique finishes or heavier weight papers are desired. Our market leading brands in this category include CLASSIC®, CLASSIC CREST®, ESSE®, ENVIRONMENT®, CAPITOL BOND®, ROYAL SUNDANCE®, SOUTHWORTH®, and TOUCHE® trademarks. Our fine paper and packaging business has an exclusive agreement to manufacture, market and distribute Crane & Co.'s CRANE'S CREST®, CRANE'S BOND®, and CRANE'S LETTRA®, branded fine papers in the commercial print category. Our fine paper and packaging business has an exclusive agreement to market and distribute Gruppo Cordenons SpA's SO...SILK®, PLIKE® and STARDREAM® branded fine papers in the U.S. and Canada. The fine paper and packaging business also sells private watermarked paper and other specialty writing, text, and cover papers. Additionally, the fine paper and packaging business provides leading solutions in the wide format arena, led by its Neenah Wide Format® and CONVERD® brands.
Premium packaging and label papers are used for wine, spirits and beer labels, folding cartons, box wrap, bags, hang tags, and stored value cards servicing high-end retail, cosmetics, spirits, and electronics end-use markets. Our market leading brands in these categories include NEENAH® Folding Board, "ESTATE LABEL®, Neenah® Box Wrap, PELLAQ®, KIVAR®, SKIVERTEX®, ILLUSIO®, and SENZO®.
Bright papers are used in applications such as direct mail, advertising inserts, scrapbooks and marketing collateral. Our brands in this category include ASTROBRIGHTS® and CREATIVE COLLECTIONTM. Additionally, business papers for professionals and small businesses are sold under our Southworth® brand through major retailers.
The fine paper and packaging business also produces and sells other specialty papers that address a consumer's need for enhanced image such as translucent papers, art papers, papers for optical scanning and other specialized applications.
Markets and Customers
Technical Products. The technical products business sells its products globally into product categories generally used as base materials in the following applications: filtration, component backing materials for manufactured products such as tape and abrasives, and other specialized product uses such as graphics and identification.
4
Several products (filtration media, abrasives, specialty tapes, labels) are used in markets that are directly affected by economic business cycles. Other market segments such as image transfer papers used in small/home office and consumer applications are relatively stable. Most products are performance-based and require qualification at customers; however, certain categories may also be subject to price competition and the substitution of lower cost substrates in some less demanding applications.
The technical products business relies on a team of direct sales representatives and customer service representatives to market and sell approximately 95 percent of its sales volume directly to customers and converters.
The technical products business has more than 500 customers worldwide. The distribution of sales in 2016 was approximately 43 percent in North America, 35 percent in Europe and 22 percent in Latin America and Asia. Customers typically convert and transform base papers and film into finished rolls and sheets by adding adhesives, coatings, and finishes. These transformed products are then sold to end-users.
Sales to the technical products business's three largest customers represented approximately 14 percent of total sales for the segment in 2016. Although a complete loss of any of these customers would cause a temporary decline in the business's sales volume, the decline could be partially offset by expanding sales to existing customers, and further offset over a several month period with the addition of new customers.
Fine Paper and Packaging. We believe our fine paper and packaging business is the leading supplier of premium writing, text and cover papers, bright papers and specialty papers in North America. These products are used in high-end collateral material, business and legal professions, and corporate identity products. Our premium packaging business includes products such as food and beverage labels and high-end packaging materials such as folding cartons and box wrap used for luxury retail goods. Bright papers are generally used by consumers for flyers, direct mail and packaging.
The fine paper and packaging business sells its products in a variety of channels including authorized paper distributors, converters, retailers, and direct to end users. Sales to distributors account for approximately 60 percent of revenue in the fine paper and packaging business. During 2016, approximately 10 percent of the sales of our fine paper and packaging business were exported to markets outside the United States.
Sales to the largest customer of the fine paper and packaging business represented approximately 15 percent of its total sales in 2016. We practice limited sales distribution to improve our ability to control the marketing of our products. Although a complete loss of this customer would cause a temporary decline in the business's sales volume, the decline could be partially offset by expanding sales to existing customers, and further offset over a several month period with the addition of new customers.
Concentration. In July 2014, Unisource Worldwide, Inc ("Unisource") and xpedx, formerly owned by International Paper ("xpedx") merged to form Veritiv Corporation ("Veritiv"). For the year ended December 31, 2016, sales to Veritiv represented approximately 8 percent of consolidated net sales and approximately 15 percent of net sales of the fine paper and packaging business. For the year ended December 31, 2015 and 2014 sales to Unisource and xpedx (and as merged Veritiv) represented approximately 10 percent of consolidated net sales and approximately 20 percent of net sales of the fine paper and packaging business.
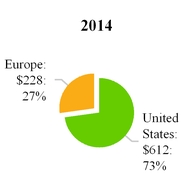
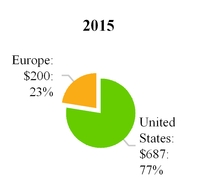
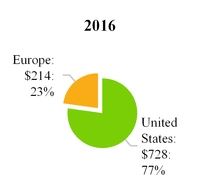
The following graphs present further information about our businesses by geographic area (dollars in millions):
Net Sales from Geographic Region
(in Millions)
5
Total Assets by Geographic Region
(in Millions)
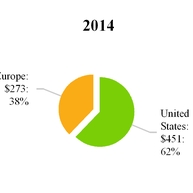
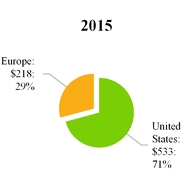
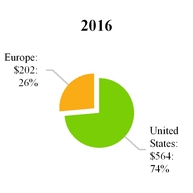
Net sales and total assets are attributed to geographic areas based on the physical location of the selling entities and the physical location of the assets. See Note 14 of Notes to Consolidated Financial Statements, "Business Segment and Geographic Information", for information with respect to net sales, profits and total assets by business segment.
Raw Materials
Technical Products. Softwood pulp, specialty pulp and fibers, and latex are the primary raw materials consumed by our technical products business. The technical products business purchases softwood pulp, specialty pulp and fibers, and latex from various external suppliers. We believe that all of the raw materials for our technical products operations, except for certain specialty latex grades and specialty softwood pulp, are readily available from several sources and that the loss of a single supplier would not cause a shutdown of our manufacturing operations.
Our technical products business acquires all of its specialized pulp requirements from two global suppliers and certain critical specialty latex grades from four suppliers. In general, these supply arrangements are not covered by formal contracts, but represent multi-year business relationships that have historically been sufficient to meet our needs. We expect these relationships to continue to operate in a satisfactory manner in the future. In the event of an interruption of production at any one supplier, we believe that each of these suppliers individually would be able to satisfy our short-term requirements for specialized pulp or specialty latex. In the event of a long-term disruption in our supply of specialized pulp or specialty latex, we believe we would be able to substitute other pulp grades or other latex grades that would allow us to meet required product performance characteristics and incur only a limited disruption in our production. As a result, we do not believe that the substitution of such alternative pulp or latex grades would have a material effect on our operations.
Fine Paper and Packaging. Hardwood pulp is the primary fiber used to produce products of the fine paper and packaging business. Other significant raw material inputs in the production of fine paper and packaging products include softwood pulp, recycled fiber, cotton fiber, dyes and fillers. The fine paper and packaging business purchases all of its raw materials externally. We believe that all of the raw materials for our fine paper and packaging operations are readily available from several sources and that the loss of a single supplier would not cause a shutdown of our manufacturing operations.
Energy and Water
The equipment used to manufacture the products of our technical products and fine paper and packaging businesses uses significant amounts of energy, primarily electricity, natural gas, oil and coal. We generate substantially all of our electrical energy at the Munising mill and approximately 25 percent of the electrical energy at our mills in Appleton, Wisconsin and Bruckmühl, Germany. We also purchase electrical energy from external sources, including electricity generated from renewable sources.
Availability of energy is not expected to be a problem in the foreseeable future, but the purchase price of such energy can and likely will fluctuate significantly based on changes in demand and other factors.
6
An adequate supply of water is needed to manufacture our products. We believe that there is an adequate supply of water for this purpose at each of our manufacturing locations.
Working Capital
Technical Products. The technical products business maintains approximately 25 to 30 days of raw materials and supplies inventories to support its manufacturing operations and approximately 25 to 35 days of finished goods and semi-finished goods inventory to support customer orders for its products. Sales terms in the technical products business vary depending on the type of product sold and customer category. Extended credit terms of up to 120 days are offered to customers located in certain international markets. In general, sales are collected in approximately 45 to 55 days and supplier invoices are paid within 20 to 30 days.
Fine Paper and Packaging. The fine paper and packaging business maintains approximately 10 days of raw material inventories to support its paper making operations and about 55 days of finished goods inventory to fill customer orders. Fine paper and packaging sales terms range between 20 and 30 days with discounts of zero to two percent for customer payments, with discounts of one percent and 20-day terms used most often. Extended credit terms are offered to customers located in certain international markets. Supplier invoices are typically paid within 60 days.
Competition
Technical Products. Our technical products business competes in global markets with a number of large multinational competitors, including Ahlstrom Corporation, Munksjö, ArjoWiggins SAS and Hollingsworth & Vose Company. It also competes in some, but not all, of these segments with smaller regional manufacturers, such as Monadnock Paper Mills, Inc., Expera Specialty Solutions LLC., Potsdam Specialty Paper, Inc. and Paper Line S.p.A. We believe the basis of competition in most of these segments are the ability to design and develop customized product features to meet customer specifications while maintaining quality, customer service and price. We believe our research and development program gives us an advantage in customizing base papers and developing advanced filter media to meet customer needs.
Fine Paper and Packaging. We believe our fine paper and packaging business is the leading supplier of premium printing and other high end specialty papers in North America. Our fine paper and packaging business also competes in the premium segment of the uncoated free sheet market. The fine paper and packaging business competes directly in North America with Mohawk Fine Paper Inc. and other smaller companies. We believe the primary basis of competition for premium fine papers are brand recognition, product quality, customer service, product availability, promotional support and variety of colors and textures. Price also can be a factor particularly for lower quality printing needs that may compete with opaque and offset papers. We have and will continue to invest in advertising and other programs aimed at graphic designers, printers and corporate end-users in order to maintain a high level of brand awareness as well as communicate the advantages of using our products. Our premium packaging business is focused on high-end packaging needs in end market verticals like beauty products, spirits and retail. Primary bases of competition are similarly brand recognition, product quality, customer service, product availability, and a variety of colors and textures. Premium packaging is primarily a North American business, but we also sell to customers in Asia and other markets outside the U.S. We believe the premium packaging market to be highly fragmented, with multiple competitors, many of which produce premium packaging products as a small subset of larger packaging operations.
Research and Development
Our technical products business maintains research and development laboratories in Feldkirchen-Westerham, Germany, Munising, Michigan and Pittsfield, Massachusetts to support its strategy of developing new products and technologies, and to support growth in its existing product lines and other strategically important markets. We also have a research and development laboratory in West Springfield, Massachusetts that supports both our technical products and fine paper and packaging businesses. We have continually invested in product research and development with spending of $9.4 million in 2016, $6.8 million in 2015 and $5.7 million in 2014.
Intellectual Property
We own more than 100 granted patents and have multiple pending patent applications in the United States, Canada, Europe and certain other countries covering image transfer paper, abrasives and medical packaging, and other paper processing. We also own more than 150 trademarks with registrations in approximately 80 countries. Our image transfer patents have contributed to establishing the technical products business as a leading global supplier of image transfer papers through our highly recognized JET-PRO®, 3G JET-OPAQUE®, TECHNIPRINT®, LASER-ONE OPAQUE® and IMAGE CLIP® brands, and our global trademark collection demonstrates strong product brand recognition.
For more than 100 years, Neenah’s fine paper and packaging business has built its market leading reputation on creating and manufacturing trademarked brands for premium writing, text, cover, digital, packaging, and specialty needs. The Neenah Paper
7
signature portfolio includes innovative, market leading brands such as ASTROBRIGHTS®, CLASSIC® (including CLASSIC CREST®, CLASSIC® Linen, CLASSIC® Laid, CLASSIC COLUMNS®, CLASSIC® Stipple, CLASSIC® Woodgrain, and CLASSIC® Techweave), ENVIRONMENT®, The Design Collection, ROYAL SUNDANCE® Papers, and many more. Our fine paper and packaging business provides unique and sustainable packaging papers and custom solutions for premium packaging needs. With brands that stand for consistency and quality such as NEENAH® Folding Board, NEENAH® Box Wrap, ESTATE LABEL®, BELLA® Label, and NEENAH IMAGEMAX® Paper Card, our fine paper and packaging business enables leading and emerging brands to deliver on their brand’s promise. In 2012, we entered the retail channel by acquiring the brand portfolio of Wausau Paper including ASTROBRIGHTS® Papers, the first brightly colored paper in the industry, followed by the SOUTHWORTH Brand, a time-honored product for business professionals. Our fine paper and packaging business maintains a well-rounded and well-respected portfolio of brands allowing us to be recognized as an industry leader setting standards for quality, consistency, and dependability on press.
The 2015 acquisition of FiberMark added other trademarks recognized in both the publishing and packaging markets, including SKIVERTEX®, KIVAR®, CORVON®, HYFLEX®, TOUCHE®, and MULTICOLOR®. Development work after the acquisition added the MONTELENA® mark to our portfolio as well.
The KIMDURA® and MUNISING LP® trademarks have made a significant contribution to the marketing of synthetic film and clean room papers of the technical products business. Finally, the GESSNER® trademark has played an important role in the marketing of Neenah’s filtration product lines.
Backlog and Seasonality
Technical Products. In general, sales and profits for the technical products business have been relatively stronger in the first half of the year with reductions in the third quarter due to reduced customer converting schedules and in the fourth quarter due to a reduction in year-end inventory levels by our customers. The order flow for the technical products business is subject to seasonal peaks for several of its products, such as the larger volume grades of specialty tape, abrasives, premask, and label stock used primarily in the downstream finished goods manufacturing process. To assure timely shipments during these seasonal peaks, the technical products business provides certain customers with finished goods inventory on consignment. Historically, consignment sales have represented approximately 15 percent of the technical products business's annual sales. Orders are typically shipped within six to eight weeks of receipt of the order. However, the technical products business periodically experiences periods where order entry levels surge, and order backlogs can increase substantially. Raw materials are purchased and manufacturing schedules are planned based on customer forecasts, current market conditions and individual orders for custom products. The order backlog in the technical products business on December 31, 2016 was approximately $101 million and represented approximately 22 percent of prior year sales. The order backlog in the technical products business on December 31, 2015 was approximately $103 million and represented approximately 25 percent of prior year sales. We previously filled the order backlog from December 31, 2015 and expect to fill the order backlog from December 31, 2016 within the next year.
Fine Paper and Packaging. The fine paper and packaging business has historically not experienced seasonality. Orders for stock products are typically shipped within two days, while custom orders are shipped within two to three weeks of receipt. Raw material purchases and manufacturing schedules are planned based on a combination of historical trends, customer forecasts and current market conditions. The order backlogs in the fine paper and packaging business on December 31, 2016 and 2015 were $19.6 million and $19.2 million, respectively, which represent approximately 15 days of sales. The order backlogs from December 31, 2016 and 2015 were filled in the respective following years.
The operating results at each of our businesses are influenced by the timing of our annual maintenance downs, which are generally scheduled in the third quarter.
Employee and Labor Relations
As of December 31, 2016, we had approximately 2,303 regular full-time employees of whom 1,099 hourly and 526 salaried employees were located in the United States and 405 hourly and 273 salaried employees were located in Europe.
Approximately 50 percent of salaried employees and 80 percent of hourly employees of Neenah Germany are eligible to be represented by the Mining, Chemicals and Energy Trade Union, Industriegewerkschaft Bergbau, Chemie and Energie (the "IG BCE"). In June 2015, the IG BCE and a national trade association representing all employers in the industry signed a collective bargaining agreement covering union employees of Neenah Germany that expires in June 2017. Under German law union membership is voluntary and does not need to be disclosed to the Company. As a result, the number of employees covered by the collective bargaining agreement with the IG BCE that expires in June 2017 cannot be determined.
8
As of December 31, 2016, no employees are covered under collective bargaining agreements that expire in the next 12 months, with the exception of the employees covered by the collective bargaining arrangement with the IG BCE. We believe we have satisfactory relations with our employees covered by collective bargaining agreements and do not expect the negotiation of new collective bargaining agreements to have a material effect on our results of operations or cash flows. See Note 12 of Notes to Consolidated Financial Statements, "Contingencies and Legal Matters — Employees and Labor Relations."
Environmental, Health and Safety Matters
Our operations are subject to federal, state and local laws, regulations and ordinances relating to various environmental, health and safety matters. We believe our operations are in compliance with, or we are taking actions designed to ensure compliance with, these laws, regulations and ordinances. However, the nature of our operations exposes us to the risk of claims concerning non-compliance with environmental, health and safety laws or standards, and there can be no assurance that material costs or liabilities will not be incurred in connection with those claims. Except for certain orders issued by environmental, health and safety regulatory agencies with which we believe we are in compliance and which we believe are immaterial to our financial condition, results of operations and liquidity, we are not currently named as a party in any judicial or administrative proceeding relating to environmental, health and safety matters.
Greenhouse gas ("GHG") emissions have increasingly become the subject of political and regulatory focus. Concern over potential climate change, including global warming, has led to legislative and regulatory initiatives directed at limiting GHG emissions. In addition to certain federal proposals in the United States to regulate GHG emissions, Germany, the United Kingdom (“U.K.”) and all the states in which we operate are currently considering GHG legislation or regulations, either individually and/or as part of regional initiatives. While not all are likely to become law it is reasonably possible that additional climate change related mandates will be forthcoming, and it is expected that they may adversely impact our costs by increasing energy costs and raw material prices, requiring operational or equipment modifications to reduce emissions and creating costs to comply with regulations or to mitigate the financial consequences of such compliance.
While we have incurred in the past several years, and will continue to incur, capital and operating expenditures in order to comply with environmental, health and safety laws, regulations and ordinances, we believe that our future cost of compliance with environmental, health and safety laws, regulations and ordinances, and our exposure to liability for environmental, health and safety claims will not have a material effect on our financial condition, results of operations or liquidity. However, future events, such as changes in existing laws and regulations, new legislation to limit GHG emissions or contamination of sites owned, operated or used for waste disposal by us (including currently unknown contamination and contamination caused by prior owners and operators of such sites or other waste generators) may give rise to additional costs which could have a material effect on our financial condition, results of operations or liquidity.
We have planned capital expenditures to comply with environmental, health and safety laws, regulations and ordinances during the period 2017 through 2018 of approximately $1 million to $2 million annually. Our anticipated capital expenditures for environmental projects are not expected to have a material effect on our financial condition, results of operations or liquidity.
AVAILABLE INFORMATION
We are subject to the reporting requirements of Section 13(a) or 15(d) of the Securities Exchange Act of 1934. As such, we file annual, quarterly and current reports, proxy statements and other information with the Securities and Exchange Commission ("SEC"). Our SEC filings are available to the public on the SEC's web site at www.sec.gov. You may also read and copy any document we file at the SEC's Public Reference Room located at 100 F Street, N.E., Washington, D.C. 20549. Please call the SEC at 1-800-SEC-0330 for further information on the Public Reference Room. Our common stock is traded on the New York Stock Exchange under the symbol NP. You may inspect the reports, proxy statements and other information concerning us at the offices of the New York Stock Exchange, 20 Broad Street, New York, New York 10005.
Our web site is www.neenah.com. Information on our web site is not incorporated by reference in this document. Our reports on Form 10-K, Form 10-Q and Form 8-K, as well as amendments to those reports, are and will be available free of charge on our web site as soon as reasonably practicable after we file or furnish such reports with the SEC. In addition, you may request a copy of any of these reports (excluding exhibits) at no cost upon written request to us at: Investor Relations, Neenah Paper, Inc., 3460 Preston Ridge Road, Suite 600, Alpharetta, Georgia 30005.
Item 1A. Risk Factors
You should carefully consider each of the following risks and all of the other information contained in this Annual Report on Form 10-K. Some of the risks described below relate principally to our business and the industry in which we operate, while
9
others relate principally to our indebtedness. The remaining risks relate principally to the securities markets generally and ownership of our common stock.
Our business, financial condition, results of operations or liquidity could be materially affected by any of these risks, and, as a result, the trading price of our common stock could decline. The risks described below are not the only ones we face. Additional risks not presently known to us or that we currently deem immaterial may also impair our business operations.
Risks Related to Our Business and Industry
Our business will suffer if we are unable to effectively respond to decreased demand for some of our products due to conditions in the global economy or secular pressures in some markets.
We have experienced and may experience in the future decreased demand for some of our products due to slowing or negative global economic growth, uncertainty in credit markets, declining consumer and business confidence, fluctuating commodity prices, increased unemployment and other challenges affecting the global economy. Parts of our fine paper and packaging business are subject to electronic substitution. In addition, our customers may experience deterioration of their businesses, cash flow shortages, and difficulty obtaining financing. If we are unable to implement business strategies to effectively respond to decreased demand for our products, our financial position, cash flows and results of operations would be adversely affected.
Changes in international geopolitical and macro economic conditions generally, and particularly in Germany, could adversely affect our business and results of operations. Fluctuations in the prices of and the demand for products could result in smaller profit margins and lower sales volumes.
Our operating results and business prospects could be adversely affected by risks related to the countries outside the United States in which we have manufacturing facilities or sell our products, including Germany, the Eurozone and elsewhere. Downturns in economic activity, adverse tax consequences, fluctuations in the value of local currency versus the U.S. dollar, or any change in social, political, macro economic or labor conditions in any of these countries or regions could negatively affect our financial results.
On June 23, 2016, the U.K. voted by referendum to exit the European Union (“E.U.”); this vote is commonly referred to as “Brexit.” The referendum is non-binding and the exit from the E.U. is not immediate. Once the U.K. invokes E.U. Article 50, there is a two-year window in which the U.K. and European Commission can negotiate the future terms for imports, exports, taxes, employment, immigration and other areas. Brexit has caused volatility in global stock markets and currency exchange rates, affecting the markets in which we operate. The implications of Brexit could adversely affect demand for our products, our financial results and operations, and our relationships with customers, suppliers and employees in the short- or long-term.
Historically, economic and market shifts, and fluctuations in capacity have created cyclical changes in prices, sales volume and margins for products in the paper, packaging and related industries. The length and magnitude of industry cycles have varied over time and by product, but generally reflect changes in macroeconomic conditions and levels of industry capacity. The overall levels of demand for many of our products reflect fluctuations in levels of end-user demand, which depend in large part on general macroeconomic conditions in North America and regional economic conditions in our markets (including Europe, Asia, and Central and South America), as well as foreign currency exchange rates. The foregoing factors could materially and adversely impact our sales, cash flows, profitability and results of operations.
The availability of and prices for raw materials and energy will significantly impact our business.
We purchase a substantial portion of the raw materials and energy necessary to produce our products on the open market, and, as a result, the price and other terms of those purchases are subject to change based on factors such as worldwide supply and demand and government regulation. We do not have significant influence over our raw material or energy prices and our ability to pass increases in those prices along to purchasers of our products may be challenged, unless those increases coincide with increased demand for the product. Therefore, raw material or energy prices could increase at the same time that prices for our products are steady or decreasing. In addition, we may not be able to recoup other cost increases we may experience, such as those resulting from inflation or from increases in wages or salaries or increases in health care, pension or other employee benefits costs, insurance costs or other costs.
Our technical products business acquires all of its specialized pulp requirements from two global suppliers and certain critical specialty latex grades from four suppliers. In general, these supply arrangements are not covered by formal contracts, but represent multi-year business relationships that have historically been sufficient to meet our needs. We expect these relationships to continue to operate in a satisfactory manner in the future. In the event of an interruption of production at any one supplier, we believe that each of these suppliers individually would be able to satisfy our short-term requirements for
10
specialized pulp or specialty latex. In the event of a long-term disruption in our supply of specialized pulp or specialty latex, we believe we would be able to substitute other pulp grades or other latex grades that would allow us to meet required product performance characteristics and incur only a limited disruption in our production.
Our fine paper and packaging business acquires a substantial majority of the cotton fiber used in the production of certain branded bond paper products pursuant to annual agreements with two North American producers. The balance of our cotton fiber requirements are acquired through "spot market" purchases from a variety of other producers. We believe that a partial or total disruption in the production of cotton fibers at our two primary suppliers would increase our reliance on "spot market" purchases with a likely corresponding increase in cost.
Our operating results are likely to fluctuate.
Our operating results are subject to substantial quarterly and annual fluctuations due to a number of factors, many of which are beyond our control. Operating results could be adversely affected by general economic conditions causing a downturn in the market for paper products. Additional factors that could affect our results include, among others, changes in the market price of pulp, the effects of competitive pricing pressures, production capacity levels and manufacturing yields, availability and cost of products from our suppliers, the gain or loss of significant customers, our ability to develop, introduce and market new products and technologies on a timely basis, changes in the mix of products produced and sold, seasonal customer demand, the relative strength of the Euro versus the U.S. dollar, increasing interest rates and environmental costs. The timing and effect of the foregoing factors are difficult to predict, and these or other factors could materially adversely affect our quarterly or annual operating results.
We face many competitors, several of which have greater financial and other resources.
We face competition in each of our business segments from companies that produce the same type of products that we produce or that produce lower priced alternative products that customers may use instead of our products. Some of our competitors have greater financial, sales and marketing, or research and development resources than we do. Greater financial resources and product development capabilities may also allow our competitors to respond more quickly to new opportunities or changes in customer requirements.
Our businesses are significantly dependent on sales to their largest customers.
Sales to the largest customer of the fine paper and packaging business represented approximately 15 percent of total sales for the segment in 2016. Sales to the three largest customers of the technical products business represented approximately 14 percent of total sales for the segment in 2016. A significant loss of business from any of our major fine paper and packaging or technical products customers may have a material adverse effect on our financial condition, results of operations and liquidity. We are also subject to credit risk associated with our customer concentration. If one or more of our largest fine paper and packaging or technical products customers were to become bankrupt, insolvent or otherwise were unable to pay for services provided, we may incur significant write-offs of accounts receivable.
We cannot be certain that our tax planning strategies will be effective and that our research and development tax credits will continue to be available to offset our tax liability.
We are continuously undergoing examination by the Internal Revenue Service (the "IRS") as well as taxing authorities in various state and foreign jurisdictions in which we operate. The IRS and other taxing authorities routinely challenge certain deductions and credits reported on our income tax returns.
As of December 31, 2016, we had $25.2 million of U.S. federal and state research and development credits ("R&D Credits") which, if not used, will expire between 2027 and 2035 for the U.S. federal R&D Credits and between 2017 and 2031 for the state R&D Credits. The availability of state NOLs and state credits to offset taxable income and income tax, respectively, could also be substantially reduced if we were to undergo an "ownership change" as defined within certain state tax codes.
In accordance with Accounting Standards Codification ("ASC") Topic 740, Income Taxes ("ASC Topic 740"), as of December 31, 2016, we have recorded a liability of $10.3 million for uncertain tax positions where we believe it is "more likely than not" that the benefit reported on our income tax return will not be realized. There can be no assurance, however, that the actual amount of unrealized deductions will not exceed the amounts we have recognized for uncertain tax positions.
We have significant obligations for pension and other postretirement benefits.
We have significant obligations for pension and other postretirement benefits which could require future funding beyond that which we have funded in the past or which we currently anticipate. At December 31, 2016, our projected pension benefit obligations were $370.9 million and exceeded the fair value of pension plan assets by $52.8 million. In 2016, we made total contributions to qualified pension trusts of $17.8 million. In addition, during 2016 we paid pension benefits for unfunded
11
qualified and supplemental retirement plans of $0.6 million. At December 31, 2016, our projected other postretirement benefit obligations were $40.7 million. No assets have been set aside to satisfy our other postretirement benefit obligations. In 2016, we made payments for postretirement benefits other than pensions of $3.8 million. A material increase in funding requirements or benefit payments could have a material effect on our cash flows.
We may be required to pay material amounts under multiemployer pension plans.
We contribute to The PACE Industry Union-Management Pension Fund ("the PIUMPF"), a multiemployer pension plan. The amount of our annual contributions to the PIUMPF is negotiated with the plan and the bargaining unit representing our employees covered by the plan. In 2016, we contributed approximately $0.1 million to the PIUMPF. In addition, in the event of a partial or complete withdrawal by us from the PIUMPF at a time when the plan is underfunded, we would be liable for a proportionate share of such plan's unfunded vested benefits, referred to as a withdrawal liability. In the event that any other contributing employer withdrew from the PIUMPF at a time when the plan is underfunded, and such employer cannot satisfy its obligations to the plan at the time of withdrawal, then the proportionate share of the plan's unfunded vested benefits that would be allocable to us and to the other remaining contributing employers, would increase and there could be an increase to our required annual contributions. In future negotiations of collective bargaining agreements with the labor union that participates in the PIUMPF, we may decide to discontinue participation in the plan.
The PIUMPF was certified to be in "critical status" for the plan year beginning January 1, 2010, and continued to be in critical status for the plan year beginning January 1, 2016. In 2013, two large employers withdrew from the PIUMPF. Further withdrawals by other contributing employers could cause a "mass withdrawal" from, or effectively a termination of, the PIUMPF or alternatively we could elect to withdraw. Although we have no current intention to withdraw from the PIUMPF, if we were to withdraw, either completely or partially, we would incur a withdrawal liability based on our share of the PIUMPF's unfunded vested benefits. Based on information as of December 31, 2015 provided by the PIUMPF and reviewed by our actuarial consultant, we estimate that, as of December 31, 2016, the payments that we would be required to make to PIUMPF in the event of our complete withdrawal would be approximately $0.1 million per year on a pre-tax basis. These payments would continue for 20 years, unless we were deemed to be included in a "mass withdrawal" from the PIUMPF, in which case these payments would continue in perpetuity. However, we are not able to determine the exact amount of our withdrawal liability because the amount could be higher or lower depending on the nature and timing of any triggering event, the funded status of the plan and our level of contributions to the plan prior to the triggering event. These withdrawal liability payments would be in addition to pension contributions to any new pension plan adopted or contributed to by us to replace the PIUMPF and could have a material effect on our cash flows. Adverse changes to pension laws and regulations could increase the likelihood and amount of our liabilities arising under the PIUMPF.
The outcome of legal actions and claims may adversely affect us.
We are involved in legal actions and claims arising in the ordinary course of our business. The outcome of such legal actions and claims against us cannot be predicted with certainty. Legal actions and claims against us could have a material effect on our financial condition, results of operations and liquidity.
Labor interruptions would adversely affect our business.
Except for our Pittsfield, Massachusetts, Brownville, New York and Quakertown, Pennsylvania manufacturing facilities which are non-union, substantially all of our hourly employees are unionized. In addition, some key customers and suppliers are also unionized. Strikes, lockouts or other work stoppages or slowdowns involving our unionized employees could have a material effect on us.
If we are unable to continue to implement our business strategies, our financial conditions and operating results could be materially affected.
Our future operating results will depend, in part, on the extent to which we can successfully implement our business strategies in a cost effective manner. However, our strategies are subject to significant business, economic and competitive uncertainties and contingencies, many of which are beyond our control. If we are unable to successfully implement our business strategies, our business, financial condition and operating results could be materially adversely affected.
We may not successfully integrate acquisitions and may be unable to achieve anticipated cost savings or other synergies.
The integration of the operations of acquired companies involves a number of risks and presents financial, managerial, legal and operational challenges. We may have difficulty, and may incur unanticipated expenses related to, integrating information systems, financial reporting activities, and integrating and retaining management and personnel from acquired companies. We may not be able to achieve anticipated cost savings or commercial or growth synergies, for a number of reasons, including contractual constraints and obligations or an inability to take advantage of expected commercial opportunities, increased
12
operating efficiencies or commercial expansion of key technologies. Failure to successfully integrate acquired companies may have an adverse effect on our business, financial condition, results of operations, and cash flows.
We may not be able to adequately protect our intellectual property and proprietary rights, which could harm our future success and competitive position.
Our future success and competitive position also depends, in part, upon our ability to obtain and maintain protection for our intellectual property and proprietary rights. Failure to protect our existing intellectual property rights may result in the loss of valuable technologies or may require us to license other companies' intellectual property rights. It is possible that any of our patents may be invalidated, rendered unenforceable, circumvented, challenged or licensed to others or any of our pending or future patent applications may not be issued within the scope of the claims sought by us, if at all. Further, others may develop technologies that are similar or superior to our technologies, duplicate our technologies or design around our patents, and steps taken by us to protect our technologies may not prevent misappropriation of such technologies.
Future dividends on our common stock may be restricted or eliminated.
Dividends are declared at the discretion of our Board of Directors, and future dividends will depend on our future earnings, cash flow, financial requirements and other factors. Our ability to pay cash dividends on our common stock is limited under the terms of both our bank credit agreement and the indenture for our $175 million of senior notes due November 2021 (the "2021 Senior Notes"). As of December 31, 2016, under the most restrictive terms of our bank credit agreement and the indenture for the 2021 Senior Notes, our ability to pay cash dividends on our common stock is limited, as described under "Risks Relating to Our Indebtedness." There can be no assurance that we will continue to pay dividends in the future.
We may be required to record a charge to our earnings if our goodwill or intangible assets become impaired.
As of December 31, 2016, we had goodwill of $70.4 million and other intangible assets of $74.0 million. Goodwill and other intangible assets are recorded at fair value on the date of acquisition. In accordance with applicable accounting guidance, we review goodwill and other indefinite-lived intangible assets at least annually for impairment, and long-lived intangible assets when facts and circumstances warrant an impairment review. Impairment may result from, among other things, deterioration in performance, adverse market conditions, adverse changes in applicable laws or regulations, and a variety of other factors. The amount of any non-cash impairment would be recognized immediately through our consolidated statement of operations. Any future goodwill or other intangible asset impairment could have a material adverse effect on our results of operations and financial position.
If we have a catastrophic loss or unforeseen or recurring operational problems at any of our facilities, we could suffer significant lost production and/or cost increases.
Our technical products and fine paper and packaging businesses may suffer catastrophic loss due to fire, flood, terrorism, mechanical failure, or other natural or man-made events. If any of our facilities were to experience a catastrophic loss, it could disrupt our operations, delay production, delay or reduce shipments, reduce revenue, and result in significant expenses to repair or replace the facility. These expenses and losses may not be adequately covered by property or business interruption insurance. Even if covered by insurance, our inability to deliver our products to customers, even on a short-term basis, may cause us to lose market share on a more permanent basis.
Fluctuations in currency exchange rates could adversely affect our results.
Exchange rate fluctuations for the Euro do not have a material effect on the operations or cash flows of our German technical products business. Our German technical products business incurs most of its costs and sells most of its production in Europe and, therefore, its operations and cash flows are not materially affected by changes in the exchange rate of the Euro relative to the U.S. dollar. Changes in the Euro exchange rate relative to the U.S. dollar will, however, have an effect on our balance sheet and reported results of operations. See Item 7A, "Quantitative and Qualitative Disclosures About Market Risk — Foreign Currency Risk."
In addition, because we transact business in other foreign countries, some of our revenues and expenses are denominated in a currency other than the local currency of our operations. As a result, changes in exchange rates between the currency in which the transaction is denominated and the local currency of our operations into which the transaction is being recorded can impact the amount of local currency recorded for such transaction. This can result in more or less local currency revenues or costs related to such transaction, and thus have an effect on our reported sales and income before income taxes.
13
Our activities are subject to extensive government regulation, which could increase our costs, cause us to incur liabilities and adversely affect the manufacturing and marketing of our products.
Our operations are subject to federal, state and local laws, regulations and ordinances in the United States and Germany relating to various environmental, health and safety matters. The nature of our operations requires that we invest capital and incur operating costs to comply with those laws, regulations and ordinances and exposes us to the risk of claims concerning non-compliance with environmental, health and safety laws or standards. We cannot assure that significant additional expenditures will not be required to maintain compliance with, or satisfy potential claims arising from, such laws, regulations and ordinances. Future events, such as changes in existing laws and regulations or contamination of sites owned, operated or used for waste disposal by us (including currently unknown contamination and contamination caused by prior owners and operators of such sites or other waste generators) may give rise to additional costs that could require significantly higher capital expenditures and operating costs, which would reduce the funds otherwise available for operations, capital expenditures, future business opportunities or other purposes.
We are subject to risks associated with possible climate change legislation and various cost and manufacturing issues associated with such legislation.
GHG emissions have increasingly become the subject of political and regulatory focus. Concern over potential climate change, including global warming, has led to legislative and regulatory initiatives directed at limiting GHG emissions. In addition to certain federal proposals in the United States to regulate GHG emissions, Germany, the U.K. and all the states in which we operate are currently considering GHG legislation or regulations, either individually and/or as part of regional initiatives. While not all are likely to become law it is reasonably possible that additional climate change related mandates will be forthcoming, and it is expected that they may adversely impact our costs by increasing energy costs and raw material prices, requiring operational or equipment modifications to reduce emissions and creating costs to comply with regulations or to mitigate the financial consequences of compliance.
We are subject to cybersecurity risks related to breaches of security pertaining to sensitive company, customer, employee and vendor information as well as breaches in the technology that manages operations and other business processes.
We use information technologies to securely manage operations and various business functions. We rely on various technologies to process, store and report on our business and interact with customers, vendors and employees. The secure processing, maintenance and transmission of this information is critical to our operations and business strategy. Despite our security design and controls, and those of our third party providers, our information technology and infrastructure may be vulnerable to cyber attacks by hackers or breaches due to employee error, malfeasance or other disruptions. Any such breach could result in operational disruptions or the misappropriation of sensitive data that could subject us to civil and criminal penalties, litigation or have a negative impact on our reputation. There can be no assurance that such disruptions or misappropriations and the resulting repercussions will not negatively impact our cash flows and materially affect our results of operations or financial condition. The U.S. Congress is considering cybersecurity legislation that, if enacted, could impose additional obligations on us and could expand our potential liability in the event of a cyber-security incident.
Our business may suffer if we do not retain our senior management.
We depend on our senior management. The loss of services of members of our senior management team could adversely affect our business until suitable replacements can be found. There may be a limited number of persons with the requisite skills to serve in these positions and we may be unable to locate or employ qualified personnel on acceptable terms. In addition, our future success requires us to continue to attract and retain competent personnel.
Risks Relating to Our Indebtedness
We may not be able to fund our future capital requirements internally or obtain third-party financing.
We may be required or choose to obtain additional debt or equity financing to meet our future working capital requirements, as well as to fund capital expenditures and acquisitions. To the extent we must obtain financing from external sources to fund our capital requirements, we cannot guarantee financing will be available on favorable terms, if at all. As of December 31, 2016, we have required debt payments of $1.2 million during the year ending December 31, 2017.
We may not be able to generate sufficient cash flow to meet our debt obligations, including the 2021 Senior Notes.
Our ability to make scheduled payments or to refinance our obligations with respect to the 2021 Senior Notes, our other debt and our other liabilities will depend on our financial and operating performance, which, in turn, is subject to prevailing economic conditions and to certain financial, business and other factors beyond our control. If our cash flow and capital
14
resources are insufficient to fund our debt obligations and other liabilities, we could face substantial liquidity problems and may be forced to reduce or delay scheduled expansions and capital expenditures, sell material assets or operations, obtain additional capital or restructure our debt. We cannot assure that our operating performance, cash flow and capital resources will be sufficient to repay our debt in the future. In the event that we are required to dispose of material assets or operations or restructure our debt to meet our debt and other obligations, we can make no assurances as to the terms of any such transaction or how quickly any such transaction could be completed.
If we cannot make scheduled payments on our debt, we will be in default and, as a result:
• | our debt holders could declare all outstanding principal and interest to be due and payable; |
• | our senior secured lenders could terminate their commitments and commence foreclosure proceedings against our assets; and |
• | we could be forced into bankruptcy or liquidation. |
If our operating performance declines in the future or we breach our covenants under our revolving credit facility, we may need to obtain waivers from the lenders under our revolving credit facility to avoid being in default. We may not be able to obtain these waivers. If this occurs, we would be in default under our revolving credit facility.
We have significant indebtedness which subjects us to restrictive covenants relating to the operation of our business.
As of December 31, 2016, we had $175 million of 2021 Senior Notes, $42.9 million in revolving credit borrowings and $6.8 million of project financing outstanding. In addition, availability under our bank credit agreement was approximately $125 million. Our leverage could have important consequences. For example, it could:
• | make it difficult for us to satisfy our financial obligations, including making scheduled principal and interest payments on the 2021 Senior Notes and our other indebtedness; |
• | place us at a disadvantage to our competitors; |
• | require us to dedicate a substantial portion of our cash flow from operations to service payments on our indebtedness, thereby reducing funds available for other purposes; |
• | increase our vulnerability to a downturn in general economic conditions or the industry in which we operate; |
• | limit our ability to obtain additional financing for working capital, capital expenditures, acquisitions and general corporate and other purposes; and |
• | limit our ability to plan for and react to changes in our business and the industry in which we operate. |
The terms of our indebtedness, including our bank credit agreement and the indenture governing the 2021 Senior Notes, contain covenants restricting our ability to, among other things, incur certain additional debt, incur or create certain liens, make specified restricted payments, pay dividends, authorize or issue capital stock, enter into transactions with our affiliates, consolidate or merge with or acquire another business, sell certain of our assets or liquidate, dissolve or wind-up our Company. Under the most restrictive terms of the Third Amended and Restated Credit Agreement, we are permitted to pay cash dividends on or repurchase shares of our common stock up to the amount available under the Third Amended and Restated Credit Agreement, as long as the availability under the Third Amended and Restated Credit Agreement exceeds $25 million. If the availability is below $25 million, we are restricted from paying dividends or repurchasing shares. Under the most restrictive terms of the 2021 Senior Notes, we are permitted to pay cash dividends of up to $25 million in a calendar year, but not permitted to repurchase shares of our common stock. However, as long as the net leverage ratio (net debt/EBITDA) under the 2021 Senior Notes is below 2.5x, we can pay dividends or repurchase shares without limitation. Refer to Item 7A, "Management's Discussion and Analysis of Financial Condition and Results of Operations — Liquidity and Capital Resources" for the current limitations on our ability to pay dividends on or repurchase shares of our common stock.
In addition, if the aggregate availability under our revolving credit facilities is less than the greater of (i) $25 million and (ii) 12.5 percent of the maximum aggregate commitments under our revolving credit facilities as then in effect, we will be subject to increased reporting obligations and controls until such time as availability is more than the greater of (a) $35 million and (b) 17.5 percent of the maximum aggregate commitments under our revolving credit facilities as then in effect for at least 60 consecutive days and no default or event of default has occurred or is continuing during such 60-day period.
If aggregate availability under our revolving credit facilities is less than the greater of (i) $20 million and (ii) 10 percent of the maximum aggregate commitments under our revolving credit facilities as then in effect, we are required to comply with a fixed charge coverage ratio (as defined in our bank credit agreement) of not less than 1.1 to 1.0 for the preceding four-quarter period, tested as of the end of each quarter. Such compliance, once required, would no longer be necessary once (x) aggregate
15
availability under our revolving credit facilities exceeds the greater of (i) 17.5 percent of the aggregate commitment for our revolving credit facilities and (ii) $35 million for 60 consecutive days and (y) no default or event of default has occurred and is continuing during such 60- day period. As of December 31, 2016, aggregate availability under our revolving credit facilities exceeded the minimum required amount, and we are not required to comply with such fixed charge coverage ratio.
Our revolving credit facilities accrue interest at variable rates. As of December 31, 2016, we had $42.9 million of revolving credit borrowings outstanding. We may reduce our exposure to rising interest rates by entering into interest rate hedging arrangements, although those arrangements may result in us incurring higher interest expenses than we would incur without the arrangements. If interest rates increase in the absence of such arrangements, we will need to dedicate more of our cash flow from operations to make payments on our debt. For more information on our liquidity, see Item 7A, "Management's Discussion and Analysis of Financial Condition and Results of Operations — Liquidity and Capital Resources."
Our failure to comply with the covenants contained in our revolving credit facility or the indenture governing the 2021 Senior Notes could result in an event of default that could cause acceleration of our indebtedness.
Our failure to comply with the covenants and other requirements contained in the indenture governing the 2021 Senior Notes, our revolving credit facility or our other debt instruments could cause an event of default under the relevant debt instrument. The occurrence of an event of default could trigger a default under our other debt instruments, prohibit us from accessing additional borrowings and permit the holders of the defaulted debt to declare amounts outstanding with respect to that debt to be immediately due and payable. Our assets or cash flows may not be sufficient to fully repay borrowings under our outstanding debt instruments, and we may be unable to refinance or restructure the payments on indebtedness on favorable terms, or at all.
Despite our indebtedness levels, we and our subsidiaries may be able to incur substantially more indebtedness, which may increase the risks created by our substantial indebtedness.
Because the terms of our bank credit agreement and the indenture governing the 2021 Senior Notes do not fully prohibit us or our subsidiaries from incurring additional indebtedness, we and our subsidiaries may be able to incur substantial additional indebtedness in the future, some of which may be secured. If we or any of our subsidiaries incur additional indebtedness, the related risks that we and they face may intensify.
Our bank credit agreement is secured by a majority of our assets.
Our bank credit agreement is secured by a majority of our assets. Availability under our bank credit agreement will fluctuate over time depending on the value of our inventory, receivables and various capital assets. An extended work stoppage or decline in sales volumes would result in a decrease in the value of the assets securing the bank credit agreement. A reduction in availability under the bank credit agreement could have a material effect on our liquidity.
Changes in credit ratings issued by nationally recognized statistical rating organizations could adversely affect our cost of financing and have an adverse effect on the market price of our securities.
Our debt currently has a non-investment grade rating, and there can be no assurance that any rating assigned by the rating agencies will remain for any given period of time or that a rating will not be lowered or withdrawn entirely by a rating agency if, in that rating agency's judgment, future circumstances relating to the basis of the rating, such as adverse changes, so warrant. A lowering or withdrawal of the ratings assigned to our debt securities by rating agencies may increase our future borrowing costs and reduce our access to capital, which could have a material adverse impact on our financial condition and results of operations.
We depend on our subsidiaries to generate cash flow to meet our debt service obligations.
We conduct a substantial portion of our business through our subsidiaries. Consequently, our cash flow and ability to service our debt obligations depend upon the earnings of our subsidiaries and the distribution of those earnings to us, or upon loans, advances or other payments made by these entities to us. The ability of these entities to pay dividends or make other payments or advances to us will be subject to applicable laws and contractual restrictions contained in the instruments governing their debt, including our revolving credit facility and the indenture governing the 2021 Senior Notes. These limitations are also subject to important exceptions and qualifications.
The ability of our subsidiaries to generate sufficient cash flow from operations to allow us to make scheduled payments on our debt will depend upon their future financial performance, which will be affected by a range of economic, competitive and business factors, many of which are outside of our control as well as their ability to repatriate cash to us. If our subsidiaries do not generate sufficient cash flow from operations to help us satisfy our debt obligations, including payments on the 2021 Senior Notes, or if they are unable to distribute sufficient cash flow to us, we may have to undertake alternative financing plans, such as refinancing or restructuring our debt, selling assets, reducing or delaying capital expenditures or seeking to raise additional
16
capital. Refinancing may not be possible, and any assets may not be saleable, or, if sold, we may not realize sufficient amounts from those sales. Additional financing may not be available on acceptable terms, if at all, or we may be prohibited from incurring it, if available, under the terms of our various debt instruments then in effect. Our inability to generate sufficient cash flow to satisfy our debt obligations or to refinance our obligations on commercially reasonable terms would have an adverse effect on our business, financial condition and results of operations.
FORWARD-LOOKING STATEMENTS
Certain statements in this Annual Report on Form 10-K may constitute "forward-looking" statements as defined in Section 27A of the Securities Act of 1933 (the "Securities Act"), Section 21E of the Securities Exchange Act of 1934 (the "Exchange Act"), the Private Securities Litigation Reform Act of 1995 (the "PSLRA"), or in releases made by the SEC, all as may be amended from time to time. Statements contained in this Annual Report on Form 10-K that are not historical facts may be forward-looking statements within the meaning of the PSLRA. Any such forward-looking statements reflect our beliefs and assumptions and are based on information currently available to us. Forward-looking statements are only predictions and involve known and unknown risks, uncertainties and other factors that may cause our actual results, performance or achievements, or industry results, to be materially different from any future results, performance or achievements expressed or implied by such forward-looking statements. These cautionary statements are being made pursuant to the Securities Act, the Exchange Act and the PSLRA with the intention of obtaining the benefits of the "safe harbor" provisions of such laws. We caution investors that any forward-looking statements we make are not guarantees or indicative of future performance. For additional information regarding factors that may cause our results of operations to differ materially from those presented herein, please see "Risk Factors" contained in this Annual Report on Form 10-K and as are detailed from time to time in other reports we file with the SEC.
You can identify forward-looking statements as those that are not historical in nature, particularly those that use terminology such as "may," "will," "should," "expect," "anticipate," "contemplate," "estimate," "believe," "plan," "project," "predict," "potential" or "continue," or the negative of these, or similar terms. In evaluating these forward-looking statements, you should consider the following factors, as well as others contained in our public filings from time to time, which may cause our actual results to differ materially from any forward-looking statement:
• | changes in market demand for our products due to global economic and political conditions; |
• | the impact of competition, both domestic and international, changes in industry production capacity, including the construction of new mills or new machines, the closing of mills and incremental changes due to capital expenditures or productivity increases; |
• | the enactment of adverse state, federal or foreign tax or other legislation or changes in government policy or regulation; |
• | fluctuations in (i) exchange rates (in particular changes in the U.S. dollar/Euro currency exchange rates) and (ii) interest rates; |
• | increases in commodity prices, (particularly for pulp, energy and latex) due to constrained global supplies or unexpected supply disruptions; |
• | the availability of raw materials and energy; |
• | strikes, labor stoppages and changes in our collective bargaining agreements and relations with our employees and unions; |
• | capital and credit market volatility and fluctuations in global equity and fixed-income markets; |
• | unanticipated expenditures related to the cost of compliance with environmental and other governmental regulations; |
• | our ability to control costs and implement measures designed to enhance operating efficiencies; |
• | the loss of current customers or the inability to obtain new customers; |
• | loss of key personnel; |
• | increases in the funding requirements for our pension and postretirement liabilities; |
• | changes in asset valuations including write-downs of assets including property, plant and equipment; inventory, accounts receivable, deferred tax assets or other assets for impairment or other reasons; |
• | our existing and future indebtedness; |
• | our ability to successfully integrate acquired businesses into our existing operations; |
17
• | our net operating losses may not be available to offset our tax liability and other tax planning strategies may not be effective; |
• | other risks that are detailed from time to time in reports we file with the SEC; and |
• | other factors described under "Risk Factors." |
You are cautioned not to unduly rely on such forward-looking statements, which speak only as of the date made, when evaluating the information presented in this information statement. We undertake no duty to update these forward-looking statements after the date of this Form 10-K, even though our situation may change in the future.
Item 1B. Unresolved Staff Comments
None.
Item 2. Properties
Our principal executive offices are located in Alpharetta, Georgia, a suburb of Atlanta, Georgia. We operate 10 manufacturing facilities in the United States that produce printing and writing, text, cover, durable saturated and coated substrates and other specialty papers for a variety of end uses. In 2016, we converted one of the two machines at the Appleton, Wisconsin, mill into a machine that produces transportation and other filtration media, and the mill will now be a shared facility with our fine paper and packaging business. We own and operate two manufacturing facilities in Germany that produce transportation and other filter media, and durable and saturated substrates. We own and operate one manufacturing facility in the U.K. that produces durable printing and specialty paper.
We believe that each of these facilities is adequately maintained and is suitable for conducting our operations and business. We manage machine operating schedules at our manufacturing locations to fulfill customer orders in a timely manner and control inventory levels.
As of December 31, 2016, following are the locations of our principal facilities and operating equipment and the products produced at each location:
18
Location | Equipment/Resources | Owned or Leased | Products | |||
Fine Paper and Packaging Segment | ||||||
Neenah Mill Neenah, Wisconsin | Two paper machines; paper finishing equipment | Owned | Printing and writing, text, cover and other specialty papers | |||
Whiting Mill Whiting, Wisconsin | Four paper machines; paper finishing equipment | Owned | Printing and writing, text, cover and other specialty papers | |||
Converting Center Neenah, Wisconsin | Paper finishing equipment | Owned | Printing and writing, text, cover and other specialty papers | |||
Technical Products Segment | ||||||
Munising Mill Munising, Michigan | Two paper machines; two off line saturators; two off line coaters; specialty finishing equipment | Owned | Tapes, abrasives, premask, medical packaging and other durable, saturated and coated substrates | |||
Pittsfield Mill Pittsfield, Massachusetts | Three paper machines; paper finishing equipment | Owned | Reverse osmosis filtration and glass applications | |||
Bruckmühl Mill Bruckmühl, Germany | One paper machine; two saturator/coaters; finishing equipment | Owned | Masking tape backings and abrasive backings | |||
Weidach Mill Feldkirchen-Westerham, Germany | Two paper machines; three saturators; one laminator; three meltblown machines; specialty finishing equipment | Owned | Transportation filtration and other industrial filter media | |||
Red Bridge Mill Bolton, England | Saturating, coating, and finishing equipment | Owned | Durable printing and specialty paper | |||
Shared Facilities | ||||||
Appleton Mill Appleton, Wisconsin | Two paper machines; saturating equipment; paper finishing equipment | Owned | Transportation filtration, printing and writing, text, cover and other specialty papers | |||
Brattleboro Mill Brattleboro, Vermont | One paper machine;paper finishing equipment | Owned | Printing and specialty paper board | |||
Brownville Mill Brownville, New York | One paper machine; one off-line coater | Owned | Durable printing and specialty paper | |||
Lowville Mill Lowville, New York | Saturating, coating, embossing and finishing equipment | Owned | Durable printing and specialty paper | |||
Quakertown Mill Quakertown, Pennsylvania | Saturating, coating, embossing and finishing equipment | Owned | Durable printing and specialty paper | |||
Reading Mill (1) Reading, Pennsylvania | Embossing and finishing equipment | Leased | Durable printing and specialty paper | |||
_______________________
(1) | In December 2016, we ceased manufacturing operations at the Reading, Pennsylvania, facility. The facility is leased and the lease will expire June 30, 2017. |
See Note 7 of Notes to Consolidated Financial Statements, "Debt", for a description of the material encumbrances attached to the properties described in the table above.
As of December 31, 2016, following are the locations of our owned and leased office and laboratory space and the functions performed at each location.
19
Administrative Location | Office/Other Space | Function | ||
Alpharetta, Georgia | Leased Office Space | Corporate Headquarters, Administration and Design Center | ||
Neenah and Appleton, Wisconsin | Owned Office Space | Administration | ||
Munising, Michigan | Owned Office and Laboratory Space | Administration and Research and Development for our technical products businesses | ||
Pittsfield, Massachusetts | Owned Office and Laboratory Space | Administration and Research and Development for our technical products businesses | ||
West Springfield, Massachusetts | Owned Office and Laboratory Space | Administration and Research and Development for our technical products and fine paper and packaging businesses | ||
Feldkirchen-Westerham, Germany | Owned Office and Laboratory Space | Administration and Research and Development for our technical product businesses | ||
Capacity Utilization
Paper machines in our manufacturing facilities generally operate on a combination of five- or seven-day schedules to meet demand. We are not constrained by input factors and the maximum operating capacity of our manufacturing facilities is calculated based on operating days to account for variations in mix and different units of measure between assets. Due to required maintenance downtime and contract holidays, the maximum number of operating days is defined as 350 days per year. We generally expect to utilize approximately 80 to 90 percent of our maximum operating capacity. The following table presents our percentage utilization of maximum operating capacity by segment:
Year Ended December 31, | |||||||||
2016 | 2015 | 2014 | |||||||
Technical Products | 87 | % | 84 | % | 85 | % | |||
Fine Paper and Packaging | 80 | % | 80 | % | 77 | % | |||
Item 3. Legal Proceedings
Litigation
We are involved in certain legal actions and claims arising in the ordinary course of business. While the outcome of these legal actions and claims cannot be predicted with certainty, it is the opinion of management that the outcome of any such claim which is pending or threatened, either individually or on a combined basis, will not have a material effect on our consolidated financial condition, results of operations or liquidity.
Income Taxes
We periodically undergo examination by the IRS as well as various state and foreign jurisdictions. The IRS and other taxing authorities routinely challenge certain deductions and credits we report on our income tax returns.
Item 4. Mine Safety Disclosures
Not applicable.
20
PART II
Item 5. Market for Registrant's Common Equity, Related Stockholder Matters and Issuer Purchases of Equity Securities
Neenah common stock is listed on the New York Stock Exchange and is traded under the ticker symbol NP. Trading, as reported on the New York Stock Exchange, Inc. Composite Transactions Tape, and dividend information follows:
Common Stock Market Price | ||||||||||||
Dividends Declared | ||||||||||||
High | Low | |||||||||||
2016 | ||||||||||||
Fourth quarter | $ | 90.23 | $ | 75.50 | $ | 0.33 | ||||||
Third quarter | $ | 82.24 | $ | 70.62 | $ | 0.33 | ||||||
Second quarter | $ | 74.15 | $ | 61.77 | $ | 0.33 | ||||||
First quarter | $ | 64.10 | $ | 63.37 | $ | 0.33 | ||||||
2015 | ||||||||||||
Fourth quarter | $ | 69.63 | $ | 57.68 | $ | 0.30 | ||||||
Third quarter | $ | 62.75 | $ | 54.90 | $ | 0.30 | ||||||
Second quarter | $ | 62.88 | $ | 58.23 | $ | 0.30 | ||||||
First quarter | $ | 63.87 | $ | 55.14 | $ | 0.30 | ||||||
For the year ended December 31, 2016 we paid cash dividends of $1.32 per common share or $22.4 million. For the year ended December 31, 2015, we paid cash dividends of $1.20 per common share or $20.3 million. In November 2016, our Board of Directors approved a 12 percent increase in the annual dividend rate on our common stock to $1.48 per share. The dividend is scheduled to be paid in four equal quarterly installments beginning in March 2017.
Dividends are declared at the discretion of the Board of Directors, and future dividends will depend on our future earnings, cash flow, financial requirements and other factors. Our ability to pay cash dividends on our common stock is limited under the terms of both our bank credit agreement and our 2021 Senior Notes. Under the most restrictive terms of the Third Amended and Restated Credit Agreement, we are permitted to pay cash dividends on or repurchase shares of our common stock up to the amount available under the Third Amended and Restated Credit Agreement, as long as the availability under the Third Amended and Restated Credit Agreement exceeds $25 million. If the availability is below $25 million, we are restricted from paying dividends or repurchasing shares. As of December 31, 2016, our availability exceeded $25 million, so this restriction did not apply. Under the most restrictive terms of the 2021 Senior Notes, we are permitted to pay cash dividends of up to $25 million in a calendar year, but not permitted to repurchase shares of our common stock. However, as long as the net leverage ratio (net debt/EBITDA) under the 2021 Senior Notes is below 2.5x, we can pay dividends or repurchase shares without limitation. In the event the net leverage ratio exceeds 2.5x, we may still pay dividends in excess of $25 million or repurchase shares by utilizing "restricted payment baskets" as defined in the indenture for the 2021 Senior Notes. As of December 31, 2016, since our leverage ratio was less than 2.5x, none of these covenants were restrictive to our ability to pay dividends on or repurchase shares of our common stock.
As of February 22, 2017, Neenah had approximately 1,400 holders of record of its common stock. The closing price of Neenah's common stock on February 22, 2017 was $75.90.
Purchases of Equity Securities:
The following table sets forth certain information regarding purchases of our common stock during the fourth quarter of 2016.
21
Period | Total Number of Shares Purchased (a) | Average Price Paid Per Share (c) | Total Number of Shares Purchased as Part of Publicly Announced Plans or Programs (b) | Approximate Dollar Value of Shares that May Yet Be Purchased Under Publicly Announced Plans or Programs | ||||||||||
October 2016 | 19,497 | $ | 80.15 | 19,497 | $ | 20,815,812 | ||||||||
November 2016 | 20,439 | $ | 81.78 | 20,439 | $ | 19,151,525 | ||||||||
December 2016 | 61,746 | $ | 86.91 | 17,945 | $ | 17,591,939 | ||||||||
_______________________
(a) | Transactions include the purchase of vested restricted shares from employees to satisfy minimum tax withholding requirements upon vesting of stock-based awards. See Note 9 of Notes to Consolidated Financial Statements, "Stock Compensation Plans." |
(b) | In May 2016, our Board of Directors authorized a program that would allow for the purchase of up to $25 million of outstanding common stock through May 21, 2017. |
(c) | Average price paid per share for shares purchased as part of our program. |
Equity Compensation Plan Information
The following table summarizes information about outstanding options, share appreciation rights and restricted stock units and shares reserved for future issuance under our existing equity compensation plans as of December 31, 2016.
Plan Category | (a) Number of securities to be issued upon exercise of outstanding options, warrants, and rights | (b) Weighted- average exercise price of outstanding options, warrants, and rights (1) | (c) Number of securities remaining available for future issuance under equity compensation plans (excluding securities reflected in column (a)) | |||||||
Equity compensation plans approved by security holders | 380,820 | (2)(3) | $ | 38.35 | 950,000 | |||||
Equity compensation plans not approved by security holders | — | — | — | |||||||
Total | 380,820 | $ | 38.35 | 950,000 | ||||||
_______________________
(1) | The weighted-average exercise price of outstanding options, warrants and rights does not take into account restricted stock units since they do not have an exercise price. |
(2) | Includes (i) 226,000 shares issuable upon the exercise of outstanding options and stock appreciation rights ("SARs"), (ii) 74,100 shares issuable following the vesting and conversion of outstanding performance share unit awards, and (iii) 80,720 shares issuable upon the vesting and conversion of outstanding restricted stock units, all as of December 31, 2016. As of December 31, 2016, we had an aggregate of 530,462 stock options and SARs outstanding. The weighted average exercise price of the stock options and SARs was $38.35 per share and the remaining contractual life of such awards was 6.3 years. |
(3) | Includes 218,400 shares that would be issued upon the assumed exercise of 307,518 SARs at the $85.20 per share closing price of our common stock on December 31, 2016. |
Item 6. Selected Financial Data
The following table sets forth our selected historical financial and other data. You should read the information set forth below in conjunction with "Management's Discussion and Analysis of Financial Condition and Results of Operations" and our historical consolidated financial statements and the notes to those consolidated financial statements included elsewhere in this Annual Report. The statement of operations data for the years ended December 31, 2016, 2015 and 2014 and the balance sheet data as of December 31, 2016 and 2015 set forth below are derived from our audited historical consolidated financial statements included elsewhere in this Annual Report on Form 10-K. The balance sheet data as of December 31, 2014, 2013 and 2012 and the statement of operations data for the years ended December 31, 2013 and 2012 set forth below are derived from our historical consolidated financial statements not included in this Annual Report on Form 10-K.
On October 31, 2015, we sold the Lahnstein Mill for net cash proceeds of approximately $5.4 million. For the years ended December 31, 2016 and December 31, 2015, discontinued operations reported on the consolidated statements of operations reflect the results of operations and the estimated loss on sale of the Lahnstein Mill. The consolidated statements of operations for the years ended December 31, 2014, 2013 and 2012 have been restated to report results of the Lahnstein Mill as discontinued operations. As of December 31, 2015, 2014, 2013 and 2012, the assets and liabilities of the Lahnstein Mill are classified as assets held for sale on the consolidated balance sheet. See Note 13 of Notes to Consolidated Financial Statements, "Discontinued Operations."
22
Year Ended December 31, | ||||||||||||||||||||
2016 | 2015 | 2014 | 2013 | 2012 | ||||||||||||||||
Consolidated Statement of Operations Data | ||||||||||||||||||||
Net sales | $ | 941.5 | $ | 887.7 | $ | 839.7 | $ | 781.7 | $ | 738.3 | ||||||||||
Cost of products sold | 727.0 | 692.3 | 668.9 | 621.8 | 588.6 | |||||||||||||||
Gross profit | 214.5 | 195.4 | 170.8 | 159.9 | 149.7 | |||||||||||||||
Selling, general and administrative expenses | 92.2 | 86.5 | 78.0 | 74.7 | 71.3 | |||||||||||||||
Integration/restructuring costs (a) | 7.0 | 6.5 | 2.3 | 0.4 | 5.8 | |||||||||||||||
Pension plan settlement charge (b) | 0.8 | — | 3.5 | 0.2 | 3.5 | |||||||||||||||
Loss on early extinguishment of debt (c) | — | — | 0.2 | 0.5 | 0.6 | |||||||||||||||
Other (income) expense — net | 0.4 | 1.0 | 0.2 | 1.5 | 1.6 | |||||||||||||||
Operating income | 114.1 | 101.4 | 86.6 | 82.6 | 66.9 | |||||||||||||||
Interest expense — net | 11.1 | 11.5 | 11.1 | 11.0 | 13.4 | |||||||||||||||
Income from continuing operations before income taxes | 103.0 | 89.9 | 75.5 | 71.6 | 53.5 | |||||||||||||||
Provision for income taxes (h) | 29.6 | 29.4 | 7.5 | 23.1 | 16.1 | |||||||||||||||
Income from continuing operations | 73.4 | 60.5 | 68.0 | 48.5 | 37.4 | |||||||||||||||
Income (loss) from discontinued operations, net of taxes (e) | (0.4 | ) | (9.4 | ) | 0.7 | 3.5 | 6.9 | |||||||||||||
Net income | $ | 73.0 | $ | 51.1 | $ | 68.7 | $ | 52.0 | $ | 44.3 | ||||||||||
Earnings from continuing operations per basic share | $ | 4.33 | $ | 3.58 | $ | 4.05 | $ | 2.97 | $ | 2.30 | ||||||||||
Earnings from continuing operations per diluted share | $ | 4.26 | $ | 3.53 | $ | 3.99 | $ | 2.91 | $ | 2.26 | ||||||||||
Cash dividends per common share | $ | 1.32 | $ | 1.20 | $ | 1.02 | $ | 0.70 | $ | 0.48 | ||||||||||
Other Financial Data | ||||||||||||||||||||
Net cash flow provided by (used for): | ||||||||||||||||||||
Operating activities (h) | $ | 115.8 | $ | 111.2 | $ | 94.5 | $ | 83.5 | $ | 40.1 | ||||||||||
Capital expenditures (g) | (68.5 | ) | (48.1 | ) | (27.9 | ) | (28.7 | ) | (25.1 | ) | ||||||||||
Other investing activities (f) | 0.3 | (112.0 | ) | (77.0 | ) | (4.6 | ) | (7.2 | ) | |||||||||||
Financing activities (c)(h) | (48.4 | ) | (18.8 | ) | 10.2 | 15.0 | (13.0 | ) | ||||||||||||
Ratio of earnings to fixed charges (d) | 8.7x | 7.7x | 6.9x | 6.7x | 4.6x | |||||||||||||||
December 31, | ||||||||||||||||||||
2016 | 2015 | 2014 | 2013 | 2012 | ||||||||||||||||
(Dollars in millions) | ||||||||||||||||||||
Consolidated Balance Sheet Data | ||||||||||||||||||||
Cash and cash equivalents | $ | 3.1 | $ | 4.2 | $ | 72.6 | $ | 73.4 | $ | 7.8 | ||||||||||
Working capital, less cash and cash equivalents | 125.2 | 136.3 | 129.5 | 123.9 | 132.0 | |||||||||||||||
Total assets (h) | 765.6 | 751.4 | 724.5 | 670.9 | 608.0 | |||||||||||||||
Long-term debt (c)(h) | 219.7 | 228.2 | 226.8 | 185.5 | 174.9 | |||||||||||||||
Total liabilities (h) | 427.3 | 439.8 | 435.8 | 403.4 | 410.2 | |||||||||||||||
Total stockholders' equity | 338.3 | 311.6 | 288.7 | 267.5 | 197.8 | |||||||||||||||
_______________________
(a) | For the year ended December 31, 2016, we incurred $7.0 million of integration and restructuring costs and $0.8 million of pension settlement charges. For the year ended December 31, 2015, we incurred $5.3 million of integration |
23
costs related to the FiberMark Acquisition and $1.2 million of restructuring costs. For the year ended December 31, 2014, we incurred $1.0 million of integration costs related to the acquisition of the Crane technical materials business and $1.3 million of restructuring costs. For the year ended December 31, 2013, we incurred $0.4 million of integration costs related to the acquisition of the Southworth brands. For the year ended December 31, 2012, we incurred $5.8 million integration costs related to the acquisition of the Wausau brands.
(b) | For the year ended December 31, 2016, we elected settlement accounting even though the benefit payments did not exceed the sum of expected service cost and interest costs of the affected plans, and recognized a settlement loss of $0.8 million. For the years ended December 31, 2014, 2013 and 2012, benefit payments under certain pension plans exceeded the sum of expected service cost and interest costs for the plan for the respective calendar years. In accordance with ASC Topic 715, Compensation — Retirement Benefits ("ASC Topic 715"), we measured the liabilities of the post-retirement benefit plans and recognized settlement losses of $3.5 million, $0.2 million and $3.5 million, respectively. |
(c) | For the year ended December 31, 2014, we amended and restated our existing bank credit facility and recognized a pre-tax loss of $0.2 million for the write-off of unamortized debt issuance costs. For the year ended December 31, 2013, we redeemed $90 million of 2014 Senior Notes and repaid all outstanding term loan borrowings ($29.3 million). In connection with the early extinguishment of debt we recognized a pre-tax loss of $0.5 million for the write-off of unamortized debt issuance costs. For the year ended December 31, 2012, we completed an early redemption of $68 million in aggregate principal amount of the 2014 Senior Notes. In connection with the early redemption we recognized a pre-tax loss of $0.6 million, including a call premium and the write-off of unamortized debt issuance costs. |
(d) | For purposes of determining the ratio of earnings to fixed charges, earnings consist of income before income taxes (less interest) plus fixed charges. Fixed charges consist of interest expense, including amortization of debt issuance costs, and the estimated interest portion of rental expense. |
(e) | The following table presents the results of discontinued operations: |
Year Ended December 31, | ||||||||||||||||||||
2016 (1) | 2015 (2) | 2014 | 2013 (3) | 2012 (4) | ||||||||||||||||
Discontinued operations: (5) | ||||||||||||||||||||
Income from operations | $ | — | $ | 0.2 | $ | 0.9 | $ | 5.4 | $ | (0.1 | ) | |||||||||
Loss on sale of the Lahnstein Mill (5) | (0.6 | ) | (13.6 | ) | — | — | — | |||||||||||||
Income (loss) before income taxes | (0.6 | ) | (13.4 | ) | 0.9 | 5.4 | (0.1 | ) | ||||||||||||
Provision (benefit) for income taxes | (0.2 | ) | (4.0 | ) | 0.2 | 1.9 | (4.5 | ) | ||||||||||||
Income (loss) from discontinued operations, net of taxes | $ | (0.4 | ) | $ | (9.4 | ) | $ | 0.7 | $ | 3.5 | $ | 4.4 | ||||||||
(1) | The loss in 2016 was due to the final adjustment of the sales price of the Lahnstein Mill. |
(2) | The loss on sale of the Lahnstein Mill includes a net curtailment gain related to the divesture of the pension plan of $15.8 million, including a $5.5 million write-off of deferred actuarial losses in 2015. |
(3) | During the first quarter of 2013, we received a refund of excess pension contributions from the terminated Terrace Bay pension plan. As a result, we recorded income before income taxes from discontinued operations of $4.2 million and a related provision for income taxes of $1.6 million. |
(4) | In November 2012, audits of the 2007 and 2008 tax years were finalized with a finding of no additional taxes due. As a result, we recognized a non-cash tax benefit of $4.5 million related to the reversal of certain liabilities for uncertain income tax positions. |
(5) | On October 31, 2015, we sold the Lahnstein Mill. For the year ended December 31, 2016, 2015, 2014, 2013 and 2012, the results of operations and the loss on sale of the Lahnstein Mill are reported as discontinued operations in the Consolidated Statement of Operations Data. |
(f) | In August 2015, we purchased all of the outstanding equity of FiberMark for approximately $118 million. In July 2014, we purchased all of the outstanding equity of Crane for approximately $72 million. |
(g) | During the year ended December 31, 2016, we completed our U.S. Filtration project. |
(h) | At December 31, 2016, we adopted ASC Topic No. 2016-09 and applied the guidance retroactively to January 1, 2016. At December 31, 2015, we adopted ASC Topic No. 2015-03 and ASC Topic No. 2015-17 and elected to apply the guidance retroactively to all periods presented. See Note 2 of Notes to Consolidated Financial Statements, "Summary of Significant Accounting Policies — Recently Adopted Accounting Standards." |
24
Item 7. Management's Discussion and Analysis of Financial Condition and Results of Operations
The following discussion and analysis presents the factors that had a material effect on our results of operations during the years ended December 31, 2016, 2015 and 2014. Also discussed is our financial position as of the end of those years. You should read this discussion in conjunction with our consolidated financial statements and the notes to those consolidated financial statements included elsewhere in this Annual Report on Form 10-K. This Management's Discussion and Analysis of Financial Condition and Results of Operations contains forward-looking statements. See "Forward-Looking Statements" for a discussion of the uncertainties, risks and assumptions associated with these statements.
Introduction
This Management's Discussion and Analysis of Financial Condition is intended to provide investors with an understanding of the historical performance of our business, its financial condition and its prospects. We will discuss and provide our analysis of the following:
• | Overview of Business; |
• | Business Segments; |
• | Results of Operations and Related Information; |
• | Liquidity and Capital Resources; |
• | Adoption of New Accounting Pronouncements; and |
• | Critical Accounting Policies and Use of Estimates. |
Overview of Business
We are a leading producer of technical products and premium fine papers and packaging. We have two primary operations: our technical products business and our fine paper and packaging business.
Our mission is to create value by improving the image and performance of everything we touch. We expect to create value by growing in specialized niche markets that value performance or image and where we have competitive advantages. In managing our businesses, we believe that achieving and maintaining a leadership position in our markets, responding effectively to customer needs and competitive challenges, employing capital optimally, controlling costs and managing risks are important to long-term success. Changes in input costs and general economic conditions can also impact our results. In this discussion and analysis, we will refer to these factors.
• | Competitive Environment — Our past results have been and our future prospects will be significantly affected by the competitive environment in which we operate. While our businesses are oriented to premium performance and quality, they may also face competitive pressures from lower value products and in most of our markets our businesses compete directly with well-known competitors, some of which are larger and more diversified. |
• | Economic Conditions and Input Costs — The markets for all of our products are affected to a significant degree by economic conditions, including rapid changes in input costs, particularly for pulp, latex and natural gas that may not be recovered immediately through pricing or other actions. Our results are also affected by fluctuations in exchange rates, particularly for the Euro. |
Business Segments
Our reportable operating segments consist of Technical Products, Fine Paper and Packaging, and Other.
Our technical products business is a leading international producer of transportation, water and other filter media and durable, saturated and coated substrates for a variety of end markets. We focus on categories where we believe we are, or can be, a market leader. These categories include filtration media for transportation, water and other uses, backings for specialty tapes and abrasives, performance labels and other specialty markets. Our dedicated technical products manufacturing facilities are located near Munich, Germany, in Bolton, England, in Munising, Michigan and in Pittsfield, Massachusetts. In addition, certain technical products are manufactured along with fine paper and packaging products in shared facilities located in upstate New York and Quakertown, Pennsylvania. In 2017, a filtration machine (which was converted from a fine paper machine) will begin production in Appleton, Wisconsin, a site also shared with the fine paper and packaging business.
25
We believe our fine paper and packaging business is the leading supplier of premium printing and other high end specialty papers in North America. Our products include some of the most recognized and preferred papers in North America, where we enjoy leading market positions in many of our product categories. We sell our products primarily to authorized paper distributors, as well as through converters, major national retailers and specialty businesses. Our primary fine paper and packaging manufacturing facilities are located in Neenah and Whiting, Wisconsin and in Brattleboro, Vermont. In addition, certain products are manufactured in shared facilities located in upstate New York and Quakertown, Pennsylvania, as well as an existing site shared with technical products in 2017 in Appleton, Wisconsin.
Our other segment includes certain product lines composed of papers sold to converters for end uses such as covering materials for datebooks, diaries, yearbooks and traditional photo albums. These products are primarily manufactured at our mill in Brattleboro, Vermont that also makes fine paper and packaging.
Results of Operations and Related Information
In this section, we discuss and analyze our net sales, income before interest and income taxes (which we refer to as "operating income") and other information relevant to an understanding of our results of operations.
Executive Summary
For the year ended December 31, 2016, consolidated net sales of $941.5 million increased $53.8 million, or 6 percent, from $887.7 million in 2016. The increase reflects a full year of the acquired volume from the August 1, 2015 FiberMark Acquisition and other incremental volume growth which more than offset lower net selling prices and currency effects.
Consolidated operating income of $114.1 million for the year ended December 31, 2016 increased $12.7 million, or 13 percent, from the prior year. The favorable comparison to the prior year was primarily due to lower manufacturing material costs (including purchasing synergies resulting from the FiberMark Acquisition), and increased sales as a result of incremental volume growth. These favorable variances were partially offset by incremental acquired selling, general and administrative costs ("SG&A"), lower net selling prices, and higher integration and restructuring costs, primarily due to costs related to the Appleton filtration machine conversion and a pension settlement charge. Excluding aggregate charges of $7.8 million in 2016 for integration and restructuring costs and pension settlement losses, and aggregate charges of $6.5 million in 2015 for integration and restructuring costs, operating income for the year ended December 31, 2016 increased $14.0 million from the prior year. See later in this section for further information regarding the presentation of operating income, as adjusted.
Cash provided by operating activities of $115.8 million for the year ended December 31, 2016 was $4.6 million higher than cash provided by operating activities of $111.2 million in the prior year primarily due to higher operating earnings with commensurate benefits of increased utilization of federal research and development tax credits, partly offset by higher post-retirement benefit plan contributions.
Capital expenditures for the year ended December 31, 2016 were $68.5 million compared to spending of $48.1 million in the prior year. Higher spending in 2016 was due to an incremental investment in filtration assets in the U.S. that was completed at the end of 2016.
Analysis of Net Sales — Years Ended December 31, 2016, 2015 and 2014
The following table presents net sales by segment and net sales expressed as a percentage of total net sales:
Year Ended December 31, | |||||||||||||||||||||
Net sales | 2016 | 2016 | 2015 | 2015 | 2014 | 2014 | |||||||||||||||
Technical Products | $ | 466.4 | 50 | % | $ | 429.2 | 48 | % | $ | 403.6 | 48 | % | |||||||||
Fine Paper and Packaging | 452.1 | 48 | % | 442.7 | 50 | % | 436.1 | 52 | % | ||||||||||||
Other | 23.0 | 2 | % | 15.8 | 2 | % | — | — | % | ||||||||||||
Consolidated | $ | 941.5 | 100 | % | $ | 887.7 | 100 | % | $ | 839.7 | 100 | % | |||||||||
26
Commentary:
Year 2016 versus 2015
Change in Net Sales Compared to the Prior Year | ||||||||||||||||||||||||
For the Year Ended December 31, | Change Due To | |||||||||||||||||||||||
Total Change | Net Price | |||||||||||||||||||||||
2016 | 2015 | Volume | Currency | |||||||||||||||||||||
Technical Products | $ | 466.4 | $ | 429.2 | $ | 37.2 | $ | 49.8 | $ | (11.0 | ) | $ | (1.6 | ) | ||||||||||
Fine Paper and Packaging | 452.1 | 442.7 | 9.4 | 18.2 | (8.8 | ) | — | |||||||||||||||||
Other | 23.0 | 15.8 | 7.2 | 7.2 | — | — | ||||||||||||||||||
Consolidated | $ | 941.5 | $ | 887.7 | $ | 53.8 | $ | 75.2 | $ | (19.8 | ) | $ | (1.6 | ) | ||||||||||
Consolidated net sales for the year ended December 31, 2016 were $53.8 million (6%) higher than the prior year. The increase reflects a full year of the acquired volume from the August 1, 2015 FiberMark Acquisition and other incremental volume growth which more than offset lower net selling prices and currency effects. Excluding currency exchange effects, consolidated net sales increased $55.4 million from the prior year.
• | Net sales in our technical products business increased $37.2 million (9%) from the prior year due to acquired volume and organic volume growth, which were partially offset by lower net selling prices. Excluding currency exchange effects, technical product sales increased $38.8 million (9%). Organic volumes increased from the prior year period due to growth in transportation filtration and backings for tapes and abrasives. Net selling prices were down primarily due to a lower-priced mix of products sold but also for reduced selling prices on products with contractual adjusters for certain input costs. |
• | Net sales in our fine paper and packaging business increased $9.4 million (2%) from the prior year due to acquired volume, which was partially offset by lower net selling prices. Net selling prices were down from the prior year due to a lower-priced mix of products sold in 2016, which reflected a higher proportion of sales of non-branded products. |
• | Net sales in our other business segment increased $7.2 million from the prior year period due to acquired volume. |
Year 2015 versus 2014
Change in Net Sales Compared to the Prior Year | ||||||||||||||||||||||||
For the Years Ended December 31, | Change Due To | |||||||||||||||||||||||
2015 | 2014 | Total Change | Volume | Net Price | Currency | |||||||||||||||||||
Technical Products | $ | 429.2 | $ | 403.6 | $ | 25.6 | $ | 66.5 | $ | (2.4 | ) | $ | (38.5 | ) | ||||||||||
Fine Paper and Packaging | 442.7 | 436.1 | 6.6 | (4.5 | ) | 11.1 | — | |||||||||||||||||
Other | 15.8 | — | 15.8 | 15.8 | — | — | ||||||||||||||||||
Consolidated | $ | 887.7 | $ | 839.7 | $ | 48.0 | $ | 77.8 | $ | 8.7 | $ | (38.5 | ) | |||||||||||
Consolidated net sales for the year ended December 31, 2015 were $48.0 million (6%) higher than the prior year due to organic technical products volume growth, incremental sales from the FiberMark Acquisition and higher average selling prices, partially offset by unfavorable currency exchange effects. Excluding incremental FiberMark sales and currency exchange effects, consolidated net sales increased $28.4 million from the prior year.
• | Net sales in our technical products business increased $25.6 million (6%) from the prior year as organic volume growth, incremental sales from the FiberMark Acquisition and higher selling prices were only partially offset by unfavorable currency exchange effects. Unfavorable currency exchange effects resulted from the Euro weakening by approximately 16 percent relative to the U.S. dollar in the year ended December 31, 2015 as compared to the prior year. Excluding currency exchange effects and incremental FiberMark sales, technical product sales increased $40.7 million (10%) and |
27
volumes increased approximately 11% from the prior year period due to growth in shipments of filtration and specialty performance products and incremental sales from the technical materials business acquired in July 2014.
• | Net sales in our fine paper and packaging business increased $6.6 million (2%) from the prior year due to higher average net prices and incremental FiberMark sales. Excluding acquired revenues, fine paper and packaging sales decreased $12.3 million (3%) as higher average net price was more than offset by a four percent decrease in sales volumes. Sales volumes were unfavorable to the prior year as increases in premium packaging and retail products were more than offset by lower sales of other grades; including lower margin special make business. Average net price improved from the prior year due to a two percent increase in average selling prices and a more favorable product mix. |
Analysis of Operating Income — Years Ended December 31, 2016, 2015 and 2014
The following table sets forth line items from our consolidated statements of operations as a percentage of net sales for the periods indicated and is intended to provide a perspective of trends in our historical results:
Year Ended December 31, | |||||||||
2016 | 2015 | 2014 | |||||||
Net sales | 100.0 | % | 100.0 | % | 100.0 | % | |||
Cost of products sold | 77.2 | % | 78.0 | % | 79.7 | % | |||
Gross profit | 22.8 | % | 22.0 | % | 20.3 | % | |||
Selling, general and administrative expenses | 9.8 | % | 9.8 | % | 9.3 | % | |||
Integration costs and settlement charges | 0.8 | % | 0.7 | % | 0.7 | % | |||
Other (income) expense — net | 0.1 | % | 0.1 | % | — | % | |||
Operating income | 12.1 | % | 11.4 | % | 10.3 | % | |||
Interest expense — net | 1.2 | % | 1.3 | % | 1.3 | % | |||
Income from continuing operations before income taxes | 10.9 | % | 10.1 | % | 9.0 | % | |||
Provision for income taxes | 3.1 | % | 3.3 | % | 0.9 | % | |||
Income from continuing operations | 7.8 | % | 6.8 | % | 8.1 | % | |||
Commentary:
Year 2016 versus 2015
Change in Operating Income (Loss) Compared to the Prior Year | ||||||||||||||||||||||||||||||||
For the Years Ended December 31, | Change Due To | |||||||||||||||||||||||||||||||
2016 | 2015 | Total Change | Volume | Net Price (a) | Input Costs (b) | Currency | Other | |||||||||||||||||||||||||
Technical Products | $ | 65.6 | $ | 54.1 | $ | 11.5 | $ | 9.1 | $ | (5.5 | ) | $ | 11.0 | $ | (0.5 | ) | $ | (2.6 | ) | |||||||||||||
Fine Paper and Packaging | 70.7 | 67.3 | 3.4 | 0.2 | (4.1 | ) | 10.4 | — | (3.1 | ) | ||||||||||||||||||||||
Other | (1.1 | ) | (2.0 | ) | 0.9 | 0.7 | — | — | — | 0.2 | ||||||||||||||||||||||
Unallocated corporate costs | (21.1 | ) | (18.0 | ) | (3.1 | ) | — | — | — | — | (3.1 | ) | ||||||||||||||||||||
Consolidated | $ | 114.1 | $ | 101.4 | $ | 12.7 | $ | 10.0 | $ | (9.6 | ) | $ | 21.4 | $ | (0.5 | ) | $ | (8.6 | ) | |||||||||||||
_______________________
(a) | Includes price changes, net of changes in product mix. |
(b) | Includes price changes for raw materials and energy. |
Consolidated operating income of $114.1 million for the year ended December 31, 2016 increased $12.7 million (13%) from the prior year. The favorable comparison to the prior year was primarily due to lower manufacturing material costs (including purchasing synergies resulting from the FiberMark Acquisition), and increased sales as a result of incremental volume growth.
28
These favorable variances were partially offset by incremental acquired SG&A, lower net selling prices, and higher integration and restructuring costs, primarily due to costs related to the Appleton filtration machine conversion and a pension settlement charge. Excluding aggregate charges of $7.8 million in 2016 for integration and restructuring costs and pension settlement losses, and aggregate charges of $6.5 million in 2015 for integration and restructuring costs, operating income for the year ended December 31, 2016 increased $14.0 million (13%) from the prior year.
• | Operating income for our technical products business increased $11.5 million (21%) from the prior year primarily due to lower manufacturing input costs and operational efficiencies, organic and acquired volume growth, and lower integration and restructuring costs. These favorable variances were partially offset by added SG&A from the acquisition, lower net selling prices and currency effects. Results for the years ended December 31, 2016 and 2015 include $1.4 million and $1.8 million for integration/restructuring costs, respectively. Excluding integration/restructuring costs, operating income for the technical products business increased $11.1 million (20%). |
• | Operating income for our fine paper and packaging business increased $3.4 million (5%) from the prior year period primarily due to lower manufacturing material prices and increased volume, partially offset by a lower-priced mix of products sold and added SG&A from the acquisition. Results for the years ended December 31, 2016 and 2015 include $1.8 million and 1.5 million for integration costs related to the FiberMark Acquisition, respectively. Excluding integration costs, operating income for the fine paper and packaging business increased $3.7 million (5%). |
• | Unallocated corporate costs for the year ended December 31, 2016 were $21.1 million, or $3.1 million unfavorable to the prior year. The unfavorable comparison to the prior year period is primarily due to pre-operating costs related to conversion of a fine paper machine to filtration, which went into production in early 2017. Excluding charges of $2.7 million of restructuring costs and a pension plan settlement charge of $0.8 million in 2016, and $0.8 million of restructuring costs in 2015, unallocated corporate expenses were $0.4 million unfavorable to the prior year. |
Year 2015 versus 2014
Change in Operating Income (Loss) Compared to the Prior Year | ||||||||||||||||||||||||||||||||
For the Years Ended December 31, | Change Due To | |||||||||||||||||||||||||||||||
2015 | 2014 | Total Change | Volume | Net Price (a) | Input Costs (b) | Currency | Other | |||||||||||||||||||||||||
Technical Products | $ | 54.1 | $ | 46.0 | $ | 8.1 | $ | 10.8 | $ | 0.6 | $ | 4.4 | $ | (4.9 | ) | $ | (2.8 | ) | ||||||||||||||
Fine Paper and Packaging | 67.3 | 60.8 | 6.5 | (7.2 | ) | 8.5 | 8.7 | — | (3.5 | ) | ||||||||||||||||||||||
Other | (2.0 | ) | — | (2.0 | ) | 0.2 | — | — | — | (2.2 | ) | |||||||||||||||||||||
Unallocated corporate costs | (18.0 | ) | (20.2 | ) | 2.2 | — | — | — | — | 2.2 | ||||||||||||||||||||||
Consolidated | $ | 101.4 | $ | 86.6 | $ | 14.8 | $ | 3.8 | $ | 9.1 | $ | 13.1 | $ | (4.9 | ) | $ | (6.3 | ) | ||||||||||||||
_______________________
(a) | Includes price changes, net of changes in product mix. |
(b) | Includes price changes for raw materials and energy. |
Consolidated operating income of $101.4 million for the year ended December 31, 2015 increased $14.8 million (17%) from the prior year. The favorable comparison was primarily due to lower manufacturing input costs, higher net price for the fine paper and packaging business, and organic technical products volume growth; partially offset by higher manufacturing costs, increased SG&A, including amounts acquired as part of the FiberMark Acquisition; lower fine paper and packaging volume and unfavorable currency effects. Excluding results of the FiberMark Acquisition, currency effects and aggregate charges of $6.5 million in 2015 for integration and restructuring costs and aggregate charges of $6.0 million in 2014 for integration and restructuring costs, costs related to the early extinguishment of debt and a pension plan settlement charge, operating income for the year ended December 31, 2015 increased $18.8 million (20%) from the prior year.
• | Operating income for our technical products business increased $8.1 million (18%) from the prior year primarily due to lower manufacturing input costs, organic volume growth and higher selling prices. These favorable variances were partially offset by unfavorable currency exchange effects and higher manufacturing costs. Results for the years ended December 31, 2015 and 2014 include $1.8 million and $1.6 million for integration/restructuring costs, respectively. |
29
Excluding incremental volume from the FiberMark Acquisition, unfavorable currency exchange effects and acquisition integration/restructuring costs, operating income for the technical products business increased $11.2 million (24%).
• | Operating income for our fine paper and packaging business increased $6.5 million (11%) from the prior year period primarily due to lower manufacturing input costs principally as a result of lower natural gas prices and higher net price. Extreme winter weather conditions during the first quarter of 2014 resulted in a temporary increase in natural gas prices. These favorable variances were partially offset by lower shipment volume and higher manufacturing costs. Results for the ended December 31, 2015 include $1.5 million for acquisition related integration costs. Excluding incremental volume from the FiberMark Acquisition and acquisition integration costs, operating income for the fine paper and packaging business increased $8.8 million (14%). |
• | Unallocated corporate costs for the year ended December 31, 2015 were $18.0 million, or $2.2 million favorable to the prior year. Excluding charges of $0.8 million in 2015 for restructuring costs and aggregate charges of $4.4 million in 2014 for a pension plan settlement charge, restructuring costs and costs related to the early extinguishment of debt, unallocated corporate expenses were $1.4 million unfavorable to the prior year primarily due to increased employee compensation costs. |
The following table sets forth our operating income by segment for the periods indicated:
Year Ended December 31, | ||||||||||||
2016 | 2015 | 2014 | ||||||||||
Operating income | ||||||||||||
Technical Products | $ | 65.6 | $ | 54.1 | $ | 46.0 | ||||||
Fine Paper and Packaging | 70.7 | 67.3 | 60.8 | |||||||||
Other | (1.1 | ) | (2.0 | ) | — | |||||||
Unallocated corporate costs | (21.1 | ) | (18.0 | ) | (20.2 | ) | ||||||
Operating Income as Reported | 114.1 | 101.4 | 86.6 | |||||||||
Non-GAAP Adjustments | ||||||||||||
Technical Products | ||||||||||||
Acquisition/integration/restructuring costs | 1.4 | 1.8 | 1.6 | |||||||||
Fine Paper and Packaging | ||||||||||||
Acquisition/integration costs | 1.8 | 1.5 | — | |||||||||
Other | ||||||||||||
Acquisition/integration costs | 1.1 | 2.4 | — | |||||||||
Unallocated corporate costs | ||||||||||||
Pension plan settlement charge | 0.8 | — | 3.5 | |||||||||
Restructuring costs | 2.7 | 0.8 | 0.7 | |||||||||
Loss on early extinguishment of debt | — | — | 0.2 | |||||||||
Total | 3.5 | 0.8 | 4.4 | |||||||||
Total non-GAAP Adjustments | 7.8 | 6.5 | 6.0 | |||||||||
Operating Income as Adjusted | $ | 121.9 | $ | 107.9 | $ | 92.6 | ||||||
In accordance with generally accepted accounting principles in the United States ("GAAP"), consolidated operating income includes the pre-tax effects of integration and restructuring costs, pension plan settlement charges, and loss on early extinguishment of debt. We believe that by adjusting reported operating income to exclude the effects of these items, the resulting adjusted operating income is on a basis that reflects the results of our ongoing operations. We believe that providing adjusted operating results will help investors gain an additional perspective of underlying business trends and results. Adjusted operating income is not a recognized term under GAAP and should not be considered in isolation or as a substitute for operating income derived in accordance with GAAP. Other companies may use different methodologies for calculating their non-GAAP financial measures and, accordingly, our non-GAAP financial measures may not be comparable to their measures.
30
Additional Statement of Operations Commentary:
• | SG&A expense of $92.2 million for the year ended December 31, 2016 was $5.7 million higher than the prior year due to incremental selling and administrative costs related to the FiberMark Acquisition. SG&A expense as a percentage of net sales for the year ended December 31, 2016, was approximately 9.8 percent and was comparable to the prior year. |
• | SG&A expense of $86.5 million for the year ended December 31, 2015 was $8.5 million higher than the prior year due to incremental selling and administrative costs related to the FiberMark Acquisition. SG&A expense as a percentage of net sales for the year ended December 31, 2015, was approximately 9.8 percent and was 0.5 percentage points higher than the prior year as the increase in net sales in the current year was more than offset by higher SG&A expenses. |
• | For the years ended December 31, 2016, 2015 and 2014, we incurred $11.2 million, $11.7 million and $11.4 million of interest expense, respectively. |
• | In general, our effective tax rate differs from the U.S. statutory tax rate of 35 percent primarily due to impacts of our corporate tax structure, benefits from R&D credits earned, and the mix of pre-tax income in jurisdictions with marginal tax rates that differ from the U.S. statutory tax rate. For the years ended December 31, 2016 and 2015, our effective income tax rate related to continuing operations was 29 percent and 33 percent, respectively. For 2016, the adoption of ASU 2016-09, as discussed in Note 2 of Notes to Consolidated Financial Statements, "Summary of Significant Accounting Policies — Recently Adopted Accounting Standards", allowed excess tax benefits from share-based payments to be shown as a reduction to income tax expense and reduced the rate for the year by 3 percent. For the year ended December 31, 2014, our effective income tax rate related to continuing operations was 10 percent and included the benefit from recognizing R&D credits earned in prior periods. Excluding the benefit of R&D Credits related to prior year activities, our effective income tax rate for the year ended December 31, 2014 would be approximately 33 percent. For a reconciliation of effective tax rate to the U.S. federal statutory tax rate, see Note 6 of Notes to Consolidated Financial Statements, "Income Taxes." |
Liquidity and Capital Resources
Year Ended December 31, | ||||||||||||
2016 | 2015 | 2014 | ||||||||||
Net cash flow provided by (used in): | ||||||||||||
Operating activities | $ | 115.8 | $ | 111.2 | $ | 94.5 | ||||||
Investing activities: | ||||||||||||
Capital expenditures | (68.5 | ) | (48.1 | ) | (27.9 | ) | ||||||
Acquisitions | — | (118.2 | ) | (72.4 | ) | |||||||
Purchase of equity investment | — | — | (2.9 | ) | ||||||||
Proceeds on sale of discontinued operations | — | 5.4 | — | |||||||||
Other investing activities | 0.3 | 0.8 | (1.7 | ) | ||||||||
Total | (68.2 | ) | (160.1 | ) | (104.9 | ) | ||||||
Financing activities | (48.4 | ) | (18.8 | ) | 10.2 | |||||||
Effect of exchange rate changes on cash and cash equivalents | (0.3 | ) | (0.7 | ) | (0.6 | ) | ||||||
Net decrease in cash and cash equivalents | $ | (1.1 | ) | $ | (68.4 | ) | $ | (0.8 | ) | |||
Operating Cash Flow Commentary
• | Cash provided by operating activities of $115.8 million for the year ended December 31, 2016 was $4.6 million favorable to cash provided by operating activities of $111.2 million in the prior year. The favorable comparison was primarily due to a $12.7 million increase in operating income and the benefits of higher utilization of federal research and development tax credits. These favorable variances were partially offset by higher post-retirement benefit contributions in the current year and a decrease of $1.8 million in our investment in working capital in the prior year compared to an increase of $1.2 million in our investment in working capital for the year ended December 31, 2016. |
• | Cash provided by operating activities of $111.2 million for the year ended December 31, 2015 was $16.7 million favorable to cash provided by operating activities of $94.5 million in the prior year. The favorable comparison was primarily due to a $16.1 million increase in operating income and lower contributions and benefit payments for post-retirement benefit obligations. These favorable variances were partially offset by a decrease of $9.0 million in our investment in working |
31
capital in the prior year compared to a decrease of $1.8 million in our investment in working capital for the year ended December 31, 2015.
Investing Commentary:
• | For the years ended December 31, 2016 and 2015, cash used by investing activities was $68.2 million and $160.1 million, respectively. Capital expenditures for the year ended December 31, 2016 were $68.5 million compared to spending of $48.1 million in the prior year. In general, we expect aggregate annual capital expenditures of approximately 3 to 5 percent of net sales. For the year ended December 31, 2016, annual capital expenditures were above that range due to incremental investment in filtration assets in the U.S. We expect capital spending in 2017 to return to the normal range. We believe that the level of our capital spending can be more than adequately funded from cash provided from operating activities and allows us to maintain the efficiency and cost effectiveness of our assets and also invest in expanded manufacturing capabilities to successfully pursue strategic initiatives and deliver attractive returns. |
• | For the year ended December 31, 2015, cash used by investing activities includes $118.2 million for the FiberMark Acquisition. For the year ended December 31, 2014, cash used by investing activities includes $72.4 million for the purchase of the Crane Technical Materials business and $2.9 million for the acquisition of a non-controlling equity investment in a joint venture in India. |
• | For the year ended December 31, 2015, we received net cash proceeds of $5.4 million from the sale of the Lahnstein Mill. |
• | Capital expenditures for the year ended December 31, 2015 were $48.1 million compared to spending of $27.9 million in the prior year. |
Financing Commentary:
Our liquidity requirements are provided by cash generated from operations and short and long-term borrowings.
• | For the year ended December 31, 2016, cash used by financing activities was $48.4 million compared to cash used by financing activities of $18.8 million for the prior year. The increase was due to higher net debt repayments, as well as higher share repurchases and dividends paid in 2016. For the year ended December 31, 2015, cash used by financing activities was $18.8 million compared to cash provided by financing activities of $10.2 million for the prior year. The change was due to lower net borrowings, and higher share repurchases and dividends paid in 2015. |
• | We have the following short- and long-term borrowings: |
Secured Bank Credit Facility
In December 2014, we entered into the Third Amended Credit Agreement. The Third Amended Credit Agreement, among other things: (1) increased the maximum principal amount of our existing credit facility for the U.S. Revolving Credit Facility to $125 million; (2) established the German Revolving Credit Facility in the maximum principal amount of $75 million; (3) caused Neenah and the other domestic borrowers to guarantee, among other things, the obligations arising under the German Revolving Credit Facility; (4) provides for the Global Revolving Credit Facilities to mature on December 18, 2019; and (5) provides for an accordion feature permitting one or more increases in the Global Revolving Credit Facilities in an aggregate principal amount not exceeding $50 million, such that the aggregate commitments under the Global Revolving Credit Facilities do not exceed $250 million. In addition, domestic borrowers may request letters of credit under the U.S. Revolving Credit Facility in an aggregate face amount not to exceed $20 million outstanding at any time, and German borrowers may request letters of credit under the German Revolving Credit Facility in an aggregate face amount not to exceed $2 million outstanding at any time. See Note 7 of Notes to Consolidated Financial Statements, "Debt."
Unsecured Senior Notes
We have $175 million of 2021 Senior Notes. Proceeds from this offering were used to retire the remaining principal amount of 2014 Senior Notes, to repay approximately $56 million in outstanding revolver borrowings under our bank credit agreement and for general corporate purposes. See Note 7 of Notes to Consolidated Financial Statements, "Debt."
Other Debt
In June 2014, we repaid the remaining €3.7 million ($5.2 million) in outstanding project financing borrowings under the German Loan Agreement.
The Second German Loan Agreement provides for €9.0 million of construction financing which is secured by the melt blown machine. The loan matures in September 2022 and principal is repaid in equal quarterly installments. At
32
December 31, 2016, €6.5 million ($6.8 million, based on exchange rates at December 31, 2016) was outstanding under the Second German Loan Agreement.
• | Availability under our revolving credit facility varies over time depending on the value of our inventory, receivables and various capital assets. As of December 31, 2016, we had $42.9 million outstanding under our Revolver and $125.2 million of available credit (based on exchange rates at December 31, 2016). |
• | We have required debt payments through December 31, 2017 of $1.2 million on the Second German Loan Agreement. |
• | For the year ended December 31, 2016, cash and cash equivalents decreased $1.1 million to $3.1 million at December 31, 2016 from $4.2 million at December 31, 2015. Total debt decreased $8.5 million to $220.9 million at December 31, 2016 from $229.4 million at December 31, 2015. Net debt (total debt minus cash and cash equivalents) decreased by $7.4 million primarily due to cash flow from operations. |
• | As of December 31, 2016, our cash balance consists of $1.1 million in the U.S. and $2.0 million held at entities outside of the U.S. As of December 31, 2016, there were no restrictions regarding the repatriation of our non-U.S. cash and, we believe, the repatriation of these cash balances to the U.S. would not materially increase our income tax provision. |
Transactions with Shareholders
• | For the years ended December 31, 2016 and 2015, we paid cash dividends of $1.32 per common share or $22.4 million and $1.20 per common share or $20.3 million, respectively. |
• | In November 2016, our Board of Directors approved a 12 percent increase in the annual dividend rate on our common stock to $1.48 per share. The dividend is scheduled to be paid in four equal quarterly installments beginning in March 2017. |
• | In May 2016, our Board of Directors authorized the 2016 Stock Purchase Plan. The 2016 Stock Purchase Plan allows us to repurchase up to $25 million of our outstanding Common Stock through May 2017. Purchases under the 2016 Stock Purchase Plan will be made from time to time in the open market or in privately negotiated transactions in accordance with the requirements of applicable law. The timing and amount of any purchases will depend on share price, market conditions and other factors. The 2016 Stock Purchase Plan does not require us to purchase any specific number of shares and may be suspended or discontinued at any time. For the year ended December 31, 2016, we acquired approximately 185,200 shares of Common Stock at a cost of $12.6 million. For further details on our Stock Purchase Plans refer to Note 10 of Notes to Consolidated Financial Statements, "Stockholders' Equity." |
• | For the years ended December 31, 2016 and 2015, we acquired approximately 46,000 and 40,000 of Common Stock, respectively, at a cost of $3.8 million and $2.5 million, respectively, for shares surrendered by employees to pay taxes due on vested restricted stock awards and stock appreciation rights exercised. In addition, we received $0.4 million and $1.2 million in proceeds from the exercise of employee stock options for the years ended December 31, 2016 and 2015, respectively. |
• | Under the most restrictive terms of the Third Amended and Restated Credit Agreement, we are permitted to pay cash dividends on or repurchase shares of our common stock up to the amount available under the Third Amended and Restated Credit Agreement, as long as the availability under the Third Amended and Restated Credit Agreement exceeds $25 million. If the availability is below $25 million, we are restricted from paying dividends or repurchasing shares. As of December 31, 2016, our availability exceeded $25 million, so this restriction did not apply. See our availability under the Third Amended and Restated Credit Agreement in Note 7 of Notes to Consolidated Financial Statements, "Debt." Under the most restrictive terms of the 2021 Senior Notes, we are permitted to pay cash dividends of up to $25 million in a calendar year, but not permitted to repurchase shares of our common stock. However, as long as the net leverage ratio (net debt/EBITDA) under the 2021 Senior Notes is below 2.5x, we can pay dividends or repurchase shares without limitation. In the event the net leverage ratio exceeds 2.5x, we may still pay dividends in excess of $25 million or repurchase shares by utilizing "restricted payment baskets" as defined in the indenture for the 2021 Senior Notes. As of December 31, 2016, since our leverage ratio was less than 2.5x, none of these covenants were restrictive to our ability to pay dividends on or repurchase shares of our common stock. |
Other Items:
• | As of December 31, 2016, we had $48.8 million of state NOLs. Our state NOLs may be used to offset approximately $2.3 million in state income taxes. If not used, substantially all of the state NOLs will expire in various amounts between 2017 and 2035. In addition, we had $25.2 million of U.S. federal and state R&D Credits which, if not used, will expire between 2027 and 2036 for the U.S. federal R&D Credits and between 2017 and 2031 for the state R&D Credits. As of December 31, 2016, we recorded a valuation allowance of $3.1 million against a portion of the R&D Credits. |
33
Management believes that our ability to generate cash from operations and our borrowing capacity are adequate to fund working capital, capital spending and other cash needs for the next 12 months. Our ability to generate adequate cash from operations beyond 2016 will depend on, among other things, our ability to successfully implement our business strategies, control costs in line with market conditions and manage the impact of changes in input prices and currencies. We can give no assurance we will be able to successfully implement these items.
Contractual Obligations
The following table presents the total contractual obligations for which cash flows are fixed or determinable as of December 31, 2016:
(In millions) | 2017 | 2018 | 2019 | 2020 | 2021 | Beyond 2021 | Total | |||||||||||||||||||||
Long-term debt payments | $ | 1.2 | $ | 1.2 | $ | 44.1 | $ | 1.2 | $ | 176.2 | $ | 0.8 | $ | 224.7 | ||||||||||||||
Interest payments on long-term debt (a) | 10.5 | 10.5 | 10.4 | 9.3 | 4.2 | — | 44.9 | |||||||||||||||||||||
Open purchase orders (b) | 69.4 | — | — | — | — | — | 69.4 | |||||||||||||||||||||
Other post-employment benefit obligations (c) | 4.3 | 3.5 | 3.8 | 4.1 | 4.1 | 16.9 | 36.7 | |||||||||||||||||||||
Contributions to pension trusts | 14.0 | — | — | — | — | — | 14.0 | |||||||||||||||||||||
Minimum purchase commitments (d) | 14.3 | 2.2 | 1.3 | — | — | — | 17.8 | |||||||||||||||||||||
Operating leases | 3.1 | 2.4 | 1.3 | 1.0 | 1.0 | 4.0 | 12.8 | |||||||||||||||||||||
Total contractual obligations | $ | 116.8 | $ | 19.8 | $ | 60.9 | $ | 15.6 | $ | 185.5 | $ | 21.7 | $ | 420.3 | ||||||||||||||
_______________________
(a) | Interest payments on long-term debt includes interest on variable rate debt at December 31, 2016 weighted average interest rates. |
(b) | The open purchase orders displayed in the table represent amounts we anticipate will become payable within the next 12 months for goods and services that we have negotiated for delivery. |
(c) | The above table includes future payments that we will make for postretirement benefits other than pensions. Those amounts are estimated using actuarial assumptions, including expected future service, to project the future obligations. |
(d) | The minimum purchase commitments in 2017 are primarily for coal and corn starch contracts. Although we are primarily liable for payments on the above operating leases and minimum purchase commitments, based on historic operating performance and forecasted future cash flows, we believe our exposure to losses, if any, under these arrangements is not material. |
Adoption of New Accounting Pronouncements
See Note 2 of Notes to Consolidated Financial Statements, "Summary of Significant Accounting Policies — Recently Adopted Accounting Standards" for a description of accounting standards adopted in the year ended December 31, 2016.
Critical Accounting Policies and Use of Estimates
The preparation of financial statements in conformity with GAAP in the United States requires estimates and assumptions that affect the reported amounts and related disclosures of assets and liabilities at the date of the financial statements and net sales and expenses during the reporting period. Actual results could differ from these estimates, and changes in these estimates are recorded when known. The critical accounting policies used in the preparation of the consolidated financial statements are those that are important both to the presentation of financial condition and results of operations and require significant judgments with regard to estimates used. These critical judgments relate to the reported amounts of assets and liabilities, disclosure of contingent assets and liabilities, and the reported amounts of expenses.
34
The following summary provides further information about the critical accounting policies and should be read in conjunction with the notes to the consolidated financial statements. We believe that the consistent application of our policies provides readers of our financial statements with useful and reliable information about our operating results and financial condition.
We have discussed the application of these critical accounting policies with our Board of Directors and Audit Committee.
Inventories
We value U.S. inventories at the lower of cost, using the Last-In, First-Out ("LIFO") method, or market. German inventories are valued at the lower of cost, using a weighted-average cost method, or market. The First-In, First-Out value of U.S. inventories valued on the LIFO method was $106.8 million and $118.2 million at December 31, 2016 and 2015, respectively and exceeded such LIFO value by $8.2 million and $10.0 million, respectively. Cost includes labor, materials and production overhead. Under the LIFO inventory valuation method, changes in the cost of raw materials and production activities are recognized in cost of sales in the current period even though these materials and other costs may have been incurred at significantly different values due to the length of time of our production cycle. Since we value most of our inventory utilizing the LIFO inventory costing methodology, rapid changes in raw material costs have an impact on our operating results.
Income Taxes
Significant judgment is required in determining our worldwide provision for income taxes and recording the related assets and liabilities. In the ordinary course of our business, there are many transactions and calculations where the ultimate tax determination is less than certain. Our effective income tax rates include the tax effects of certain special items such as foreign tax rate differences, inter-company financing structures, research and development credits, and domestic production activities. While we believe that these judgments and estimates are appropriate and reasonable under the circumstances, actual resolution of these matters may differ from recorded estimated amounts.
As of December 31, 2016, we have recorded aggregate deferred income tax assets of $6.1 million related to temporary differences, net operating losses and research and development and other tax credits. As of December 31, 2015, our aggregate deferred income tax assets were $20.0 million. As of December 31, 2016 and 2015, we recorded a valuation allowance of $3.1 million and $2.9 million, respectively, against a portion of our R&D Credits. In determining the need for a valuation allowance, we consider many factors, including specific taxing jurisdictions, sources of taxable income, income tax strategies and forecasted earnings for the entities in each jurisdiction. A valuation allowance would be recognized if, based on the weight of available evidence, we conclude that it is more likely than not that some portion or all of the deferred income tax assets will not be realized.
As of December 31, 2016 and 2015, our liability for uncertain income taxes positions was $10.3 million and $12.9 million, respectively. In evaluating and estimating tax positions and tax benefits, we consider many factors which may result in periodic adjustments and which may not accurately anticipate actual outcomes.
Pension and Other Postretirement Benefits
Consolidated pension expense related to continuing operations for defined benefit pension plans was $9.5 million, $6.5 million and $10.8 million for the years ended December 31, 2016, 2015 and 2014, respectively. Accounting for defined benefit pension plans requires various assumptions, including, but not limited to, discount rates, expected long-term rates of return on plan assets, future compensation growth rates and mortality rates. Accounting for our postretirement benefit plans also requires various assumptions, which include, but are not limited to, discount rates and annual rates of increase in the per capita costs of health care benefits.
The following chart summarizes the more significant assumptions used in the actuarial valuation of our defined benefit plans for each of the past three years:
35
2016 | 2015 | 2014 | |||||||
Pension plans | |||||||||
Weighted average discount rate for benefit expense | 4.54 | % | 3.91 | % | 4.88 | % | |||
Weighted average discount rate for benefit obligation | 4.16 | % | 4.54 | % | 3.91 | % | |||
Expected long-term rate on plan assets | 6.20 | % | 6.50 | % | 6.50 | % | |||
Rate of compensation increase | 2.18 | % | 2.92 | % | 2.96 | % | |||
Postretirement benefit plans | |||||||||
Weighted average discount rate for benefit expense | 4.07 | % | 4.05 | % | 4.84 | % | |||
Weighted average discount rate for benefit obligation | 3.69 | % | 4.07 | % | 4.05 | % | |||
Health care cost trend rate assumed for next year | 7.00 | % | 7.30 | % | 7.00 | % | |||
Ultimate cost trend rate | 4.50 | % | 4.50 | % | 4.50 | % | |||
Year that the ultimate cost trend rate is reached | 2037 | 2037 | 2027 | ||||||
The expected long-term rate of return on pension fund assets held by our pension trusts was determined based on several factors, including input from pension investment consultants and projected long-term returns of broad equity and bond indices. We also considered the plans' historical 10-year and 15-year compounded annual returns. We evaluate our investment strategy and long-term rate of return on pension asset assumptions at least annually.
The discount (or settlement) rate that is utilized for determining the present value of future pension obligations in the U.S. is generally based on the yield for a theoretical basket of AA-rated corporate bonds currently available in the market place, whose duration matches the timing of expected pension benefit payments. The discount (or settlement) rate that is utilized for determining the present value of future pension obligations in Germany is generally based on the IBOXX index of AA-rated corporate bonds adjusted to match the timing of expected pension benefit payments.
For the years ended December 31, 2016, 2015 and 2014, consolidated postretirement health care and life insurance plan benefit expense was $3.3 million, $3.4 million and $3.8 million, respectively. The discount (or settlement) rate that is utilized for determining the present value of future postretirement health care and life insurance plan benefit obligations in the U.S. is generally based on the yield for a theoretical basket of AA-rated corporate bonds currently available in the market place, whose duration matches the timing of expected postretirement health care and life insurance benefit payments. The discount (or settlement) rate that is utilized for determining the present value of future postretirement health care and life insurance obligations for our foreign benefit plans is generally based on an index of AA-rated corporate bonds adjusted to match the timing of expected benefit payments.
We evaluate these assumptions at least once each year or as facts and circumstances dictate and we make changes as conditions warrant. Changes to these assumptions will increase or decrease our reported net periodic benefit expense, which will result in changes to the recorded benefit plan assets and liabilities.
Useful Life and Impairment of Long-Lived Assets
Property, Plant and Equipment
For financial reporting purposes, depreciation is principally computed on the straight-line method over estimated useful asset lives. The weighted average remaining useful lives for buildings, land improvements and machinery and equipment are approximately 18 years, 13 years and 10 years, respectively. We also use units-of-production method of depreciation for $68.6 million of production assets, which reflects the nature of the assets' utilization.
Property, plant and equipment are tested for impairment in accordance with ASC Topic 360, Property, Plant, and Equipment("ASC Topic 360"), whenever events or changes in circumstances indicate that the carrying amounts of such long-lived assets may not be recoverable from future net pre-tax cash flows. Impairment testing requires significant management judgment including estimating the future success of product lines, future sales volumes, growth rates for selling prices and costs, alternative uses for the assets and estimated proceeds from disposal of the assets. Impairment testing is conducted at the lowest level where cash flows can be measured and are independent of cash flows of other assets. An asset impairment would be indicated if the sum of the expected future net pre-tax cash flows from the use of the asset (undiscounted and without interest charges) is less than the carrying amount of the asset. An impairment loss would be measured based on the difference between the fair value of the asset and its carrying amount. We determine fair value based on an expected present value technique using multiple cash flow scenarios that reflect a range of possible outcomes and a risk free rate of interest are used to estimate fair value.
36
The estimates and assumptions used in the impairment analysis are consistent with the business plans and estimates we use to manage our business operations. The use of different assumptions would increase or decrease the estimated fair value of the asset and would increase or decrease the impairment charge. Actual outcomes may differ from the estimates.
Goodwill and Other Intangible Assets with Indefinite Lives
We test goodwill for impairment at least annually on November 30 in conjunction with preparation of Neenah's annual business plan, or more frequently if events or circumstances indicate it might be impaired.
We tested goodwill for impairment as of November 30, 2016. We elected the option under ASC Topic 350, Intangibles — Goodwill and Other, to perform a qualitative assessment of our reporting units to determine whether further impairment testing is necessary. In this qualitative assessment, we considered the following items for each of the reporting units: macroeconomic conditions, industry and market conditions, overall financial performance and other entity specific events. In addition, for each of these reporting units, the most recent fair value determination results in an amount that exceeds the carrying amount of the reporting units. Based on these assessments, we determined that the likelihood that a current fair value determination would be less than the current carrying amount of the reporting unit is not more likely than not. As of November 30, 2016 no impairment was indicated.
Other Intangible Assets
Certain trade names are estimated to have indefinite useful lives and as such are not amortized. Intangible assets with indefinite lives are annually reviewed for impairment in accordance with ASC Topic 350.
Acquired intangible assets with finite useful lives are amortized on a straight-line basis over their respective estimated useful lives, and reviewed for impairment in accordance with ASC Topic 360. Intangible assets consist primarily of customer relationships, trade names and acquired intellectual property. Such intangible assets are amortized using the straight-line method over estimated useful lives of between 10 and 15 years.
Our annual test of other intangible assets for impairment at November 30, 2016, 2015 and 2014 indicated that the carrying amount of such assets was recoverable.
Acquisition Accounting
We account for acquisitions under ASC Topic 805, which requires companies to record assets acquired and liabilities assumed at their respective fair market values at the date of acquisition. The accounting for acquisitions involves a considerable amount of judgment and estimate, including the fair value of certain forms of consideration; fair value of acquired intangible assets involving projections of future revenues and cash flows that are then either discounted at an estimated discount rate or measured at an estimated royalty rate; fair value of other acquired assets and assumed liabilities, including potential contingencies; and the useful lives of the acquired assets. The assumptions used are determined at the time of the acquisition in accordance with accepted valuation models. Projections are developed using internal forecasts, available industry and market data and estimates of long-term rates of growth for our business. The impact of prior or future acquisitions on our financial position or results of operations may be materially impacted by the change in or initial selection of assumptions and estimates. Refer to Note 4, “Acquisitions”, of Notes to Consolidated Financial Statements included elsewhere in this Annual Report for further discussion of business combination accounting valuation methodology and assumptions.
Item 7A. Quantitative and Qualitative Disclosures About Market Risk
As a multinational enterprise, we are exposed to risks such as changes in commodity prices, foreign currency exchange rates, interest rates and environmental regulation. A variety of practices are employed to manage these risks, including operating and financing activities and, where deemed appropriate, the use of derivative instruments. Derivative instruments are used only for risk management purposes and not for speculation or trading.
Presented below is a description of our most significant risks.
Foreign Currency Risk
Our reported operating results are affected by changes in the exchange rates of the local currencies of our non-U.S. operations relative to the U.S. dollar. For the year ended December 31, 2016, a hypothetical 10 percent strengthening of the U.S dollar
37
relative to the local currencies of our non-U.S. operations would have decreased our income before income taxes by approximately $3.3 million. We do not hedge our exposure to exchange risk on reported operating results.
The translation of the balance sheets of our non-U.S. operations from their local currencies into U.S. dollars is also sensitive to changes in the exchange rate of the U.S. dollar. Consequently, we performed a sensitivity test to determine if changes in the exchange rate would have a significant effect on the translation of the balance sheets of our non-U.S. operations into U.S. dollars. These translation gains or losses are recorded as unrealized translation adjustments ("UTA", a component of accumulated other comprehensive income) within stockholders' equity. The hypothetical change in UTA is calculated by multiplying the net assets of our non-U.S. operations by a 10 percent change in the exchange rate of their local currencies compared to the U.S. dollar. As of December 31, 2016, the net assets of our non-U.S. operations exceeded their net liabilities by approximately $113 million. As of December 31, 2016, a 10 percent strengthening of the U.S. dollar relative to the local currencies of our non-U.S. operations would have decreased our stockholders' equity by approximately $12 million.
Commodity Risk
Pulp
We purchase the wood pulp used to produce our products on the open market, and, as a result, the price and other terms of those purchases are subject to change based on factors such as worldwide supply and demand and government regulation. We do not have significant influence over the price paid for our wood pulp purchases. Therefore, an increase in wood pulp prices could occur at the same time that prices for our products are decreasing and have an adverse effect on our results of operations, financial position and cash flows.
Based on 2016 pulp purchases, a $100 per ton increase in the average market price for pulp would have increased our annual costs for pulp purchases by approximately $23 million.
Other Manufacturing Inputs
We purchase a substantial portion of the other manufacturing inputs necessary to produce our products on the open market, and, as a result, the price and other terms of those purchases are subject to change based on factors such as worldwide supply and demand and government regulation. We do not have significant influence over our costs for such manufacturing inputs. Therefore, an increase in other manufacturing inputs could occur at the same time that prices for our products are decreasing and have an adverse effect on our results of operations, financial position and cash flows.
Our technical products business acquires certain of its specialized pulp requirements from two global suppliers and certain critical specialty latex grades from four suppliers. In general, these supply arrangements are not covered by formal contracts, but represent multi-year business relationships that have historically been sufficient to meet our needs. We expect these relationships to continue to operate in a satisfactory manner in the future. In the event of an interruption of production at any one supplier, we believe that each of these suppliers individually would be able to satisfy our short-term requirements for specialized pulp or specialty latex. In the event of a long-term disruption in our supply of specialized pulp or specialty latex, we believe we would be able to substitute other pulp grades or other latex grades that would allow us to meet required product performance characteristics and incur only a limited disruption in our production. As a result, we do not believe that the substitution of such alternative pulp or latex grades would have a material effect on our operations.
We generate substantially all of the electrical energy used by our Munising mill and approximately 25 percent of the electrical energy at our Appleton and Bruckmühl mills. Availability of energy is not expected to be a problem in the foreseeable future, but the purchase price of such energy can and likely will fluctuate significantly based on fluctuations in demand and other factors. There is no assurance that that we will be able to obtain electricity or natural gas purchases on favorable terms in the future.
Except for certain specialty latex grades and specialty softwood pulp used by our technical products business, we are not aware of any significant concentration of business transacted with a particular supplier.
Interest Rate Risk
We are exposed to interest rate risk on our variable rate bank debt. At December 31, 2016, we had $42.9 million of variable rate borrowings outstanding. A 100 basis point increase in interest rates would increase our annual interest expense on outstanding variable rate borrowings by approximately $0.4 million.
Environmental Regulation/Climate Change Legislation
Our manufacturing operations are subject to extensive regulation primarily by U.S., German and other international authorities. We have made significant capital expenditures to comply with environmental laws, rules and regulations. Due to changes in
38
environmental laws and regulations, including potential future legislation to limit GHG emissions, the application of such regulations and changes in environmental control technology, we are not able to predict with certainty the amount of future capital spending to be incurred for environmental purposes. Taking these uncertainties into account, we have planned capital expenditures for environmental projects during the period 2017 through 2018 of approximately $1 million to $2 million annually.
We believe these risks can be managed and will not have a material effect on our business or our consolidated financial position, results of operations or cash flows.
Item 8. Financial Statements and Supplementary Data
The information required in Item 8 is contained in and incorporated herein by reference from pages F-1 through F-47 of this Annual Report on Form 10-K.
Item 9. Changes in and Disagreements with Accountants on Accounting and Financial Disclosure
None.
39
Item 9A. Controls and Procedures
Conclusion Regarding the Effectiveness of Disclosure Controls and Procedures
Our management, with the participation of its Chief Executive Officer and Chief Financial Officer, has evaluated the effectiveness of the Company's disclosure controls and procedures (as such term is defined in Rules 13a-15(e) and 15d-15(e) under the Securities Exchange Act of 1934, as amended (the Exchange Act)) as of the end of the period covered by this report. Based on such evaluation, our Chief Executive Officer and Chief Financial Officer have concluded that, as of the end of such period, the Company's disclosure controls and procedures are effective in recording, processing, summarizing and reporting, on a timely basis, information required to be disclosed by us in the reports that we file or submit under the Exchange Act and are effective in ensuring that information required to be disclosed by us in the reports that we file or submit under the Exchange Act is accumulated and communicated to our management, including our Chief Executive Officer and Chief Financial Officer, as appropriate to allow timely decisions regarding required disclosure.
Management's Annual Report on Internal Control Over Financial Reporting
Our management is responsible for establishing and maintaining effective internal control over financial reporting as defined in Rules 13a-15(f) or 15a-15(f) under the Securities Exchange Act of 1934. The Company's internal control over financial reporting is designed to provide reasonable assurance to our management and board of directors regarding the preparation and fair presentation of published financial statements.
Because of its inherent limitations, internal control over financial reporting may not prevent or detect misstatements. Therefore, even those systems determined to be effective can provide only reasonable assurance with respect to financial statement preparation and presentation.
Management assessed the effectiveness of the Company's internal control over financial reporting as of December 31, 2016. In making this assessment, management used the criteria set forth by the Committee of Sponsoring Organizations of the Treadway Commission (COSO) in Internal Control — Integrated Framework (2013). Based upon its assessment, management believes that as of December 31, 2016, the Company's internal controls over financial reporting were effective.
The effectiveness of internal control over financial reporting as of December 31, 2016, has been audited by Deloitte & Touche LLP, the independent registered public accounting firm who also audited our consolidated financial statements. Deloitte & Touche's attestation report on the Company's internal control over financial reporting is included herein. See "Item 15, Exhibits and Financial Statement Schedule."
Neenah Paper, Inc
February 24, 2017
Changes in Internal Control Over Financial Reporting
There has been no significant change in the Company's internal control over financial reporting during the three months ended December 31, 2016 that has materially affected, or is reasonably likely to materially affect, the Company's internal control over financial reporting.
Item 9B. Other Information
None.
40
PART III
Item 10. Directors and Executive Officers of the Registrant
The information required to be set forth herein, except for the information included under Executive Officers of the Company, relating to nominees for director of Neenah and compliance with Section 16(a) of the Securities Exchange Act of 1934 is set forth under the captions "Election of Directors", "Meetings and Committees of the Board of Directors", "Corporate Governance" and "Section 16(a) Beneficial Ownership Reporting Compliance", respectively, in the Proxy Statement for the Annual Meeting of Stockholders to be held on May 23, 2017. Such information is incorporated herein by reference. The definitive Proxy Statement will be filed with the Securities and Exchange Commission no later than 120 days after December 31, 2016.
Executive Officers of the Company
Set forth below is information concerning our executive officers.
Name | Position | |
John P. O'Donnell | President, Chief Executive Officer and Director | |
Matthew L. Duncan | Senior Vice President, Chief Human Resource Officer | |
Steven S. Heinrichs | Senior Vice President, General Counsel and Secretary | |
Bonnie C. Lind | Senior Vice President, Chief Financial Officer and Treasurer | |
James R. Piedmonte | Senior Vice President — Operations | |
Julie A. Schertell | Senior Vice President — President, Fine Paper and Packaging | |
Armin S. Schwinn | Senior Vice President — Managing Director of Neenah Germany | |
Larry N. Brownlee | Vice President — Controller and Principal Accounting Officer | |
John P. O'Donnell, born in 1960, is our President and Chief Executive Officer and serves as a Director. He has been in that role since May 2011. Prior to becoming President and Chief Executive Office, Mr. O'Donnell served as our Senior Vice President, Chief Operating Officer since June 2010. In November 2007, Mr. O'Donnell joined Neenah as President, Fine Paper. Mr. O'Donnell was employed by Georgia-Pacific Corporation from 1985 until 2007 and held increasingly senior roles in the Consumer Products division. Mr. O'Donnell served as President of the North America Retail Business from 2004 through 2007, and as President of the North American Commercial Tissue business from 2002 through 2004.
Matthew L. Duncan, born in 1973, is our Senior Vice President, Chief Human Resources Officer and has been in that role since joining Neenah in March 2016. Prior to his employment with Neenah, Mr. Duncan served as Vice President Human Resources for Coca-Cola Refreshments, the North American operating unit of The Coca-Cola Company. Before joining The Coca-Cola Company in 2008, Mr. Duncan served in a variety of Human Resource leadership roles with The Home Depot and Nestle.
Steven S. Heinrichs, born in 1968, is our Senior Vice President, General Counsel and Secretary and has been in that role since June 2004 when he joined Kimberly-Clark as Chief Counsel, Pulp and Paper and General Counsel for Neenah Paper, Inc. Prior to his employment with Kimberly-Clark, Mr. Heinrichs served as Associate General Counsel and Assistant Secretary for Mariner Health Care, Inc., a nursing home and long-term acute care hospital company. Before joining Mariner Health Care in 2003, Mr. Heinrichs served as Associate General Counsel and Assistant Secretary for American Commercial Lines LLC, a leading inland barge and shipbuilding company from 1998 through 2003. Mr. Heinrichs engaged in the private practice of law with Skadden, Arps, Slate, Meagher and Flom LLP and Shuttleworth, Smith, McNabb and Williams PLLC from 1994 through 1998. Mr. Heinrichs received his MBA from the Kellogg School of Management at Northwestern University in 2008.
Bonnie C. Lind, born in 1958, is our Senior Vice President, Chief Financial Officer and Treasurer and has been in that role since June 2004. Ms. Lind was an employee of Kimberly-Clark from 1982 until 2004, holding a variety of increasingly senior financial and operations positions. From 1999 until June 2004, Ms. Lind served as the Assistant Treasurer of Kimberly-Clark and was responsible for managing Kimberly-Clark's global treasury operations. Prior to that, she was Director of Kimfibers with overall responsibility for the sourcing and distribution of pulp to Kimberly-Clark's global operations.
James R. Piedmonte, born in 1956, is our Senior Vice President — Operations and has been in that role since June 2004. Mr. Piedmonte had been employed by Kimberly-Clark from 1978 until 2004, and held increasingly senior positions within
41
Kimberly-Clark's operations function. Mr. Piedmonte was responsible for Kimberly-Clark's pulp mill and forestry operations in Pictou, Nova Scotia, from 2001 until 2004. Previously he was the Director of Operations for the fine paper business operations, as well as mill manager at the Whiting, Wisconsin mill.
Julie A. Schertell, born in 1969, is our Senior Vice President — President, Fine Paper and Packaging and has been in that role since January 2014. Ms. Schertell joined Neenah in 2008 and served as Vice President of Sales and Marketing for the Fine Paper division through December 2010 and as a Senior Vice President and President, Fine Paper through December 2013. Ms. Schertell was employed by Georgia-Pacific Corporation in the Consumer Products Retail division, where she served as Vice President of Sales Strategy from 2007-2008, and as Vice President of Customer Solutions from 2003 through 2007.
Armin S. Schwinn, born in 1959, has been our Senior Vice President — Managing Director of Neenah Germany since April 2010, and he is responsible for our filtration operating unit. Mr. Schwinn had been Vice President, Finance of Neenah Germany since our acquisition of FiberMark Germany in October 2006. Mr. Schwinn joined FiberMark Germany in 1995 and held increasingly senior positions within FiberMark Germany's financial, purchasing and administrative functions. Prior to this, Mr. Schwinn served in various leadership positions in other German manufacturing and service companies.
Larry N. Brownlee, born in 1956, is our Vice President — Controller and Principal Accounting Officer and has been in that role since July 2004. From 1990 to 2004, Mr. Brownlee served as Controller of several public companies in the electric utility, telephone and healthcare industries. From 1979 to 1990, Mr. Brownlee was with Arthur Andersen & Co. and provided audit services to clients primarily in the manufacturing, utility and healthcare industries. Mr. Brownlee received his Masters of Accountancy from the University of Georgia in 1979.
There are no family relationships among our directors or executive officers.
Code of Ethics
The Neenah Paper, Inc. Code of Business Conduct and Ethics, applies to all directors, officers and employees of Neenah. The Code of Business Conduct and Ethics meets the requirements of a "code of ethics" as defined by Item 406 of Regulation S-K, and applies to our Chief Executive Officer, Chief Financial Officer (our principal financial officer) and Vice President — Controller (our principal accounting officer), as well as all other employees, as indicated above. The Code of Business Conduct and Ethics also meets the requirements of a code of conduct under New York Stock Exchange listing standards. The Code of Business Conduct and Ethics is posted on our web site at www.neenah.com under the links "Investor Relations — Corporate Governance — Code of Ethics" and print copies are available upon request without charge. You can request print copies by contacting our General Counsel in writing at Neenah Paper, Inc., 3460 Preston Ridge Road, Suite 600, Alpharetta, Georgia 30005 or by telephone at 678-566-6500. We intend to disclose any amendments to the Code of Business Conduct and Ethics, as well as any waivers for executive officers or directors, on our web site at www.neenah.com. Information on our web site is not incorporated by reference in this document.
Item 11. Executive Compensation
Information relating to executive compensation and other matters is set forth under the captions "Compensation, Discussion and Analysis", "Additional Executive Compensation", "Director Compensation", and "Compensation Committee Report" in the Proxy Statement referred to in Item 10 above. Such information is incorporated herein by reference.
Item 12. Security Ownership of Certain Beneficial Owners and Management
Information relating to ownership of common stock of Neenah by certain persons is set forth under the caption "Security Ownership of Certain Beneficial Owners and Management" in the Proxy Statement referred to in Item 10 above. Such information is incorporated herein by reference. Information regarding securities authorized for issuance under equity compensation plans of Neenah is set forth under the caption "Equity Compensation Plan Information" in the Proxy Statement referred to in Item 10 above. Such information is incorporated herein by reference.
Item 13. Certain Relationships and Related Transactions and Director Independence
Information relating to existing or proposed relationships or transactions between Neenah and any affiliate of Neenah is set forth under the caption "Certain Relationships and Related Transactions" in the Proxy Statement referred to in Item 10 above. Such information is incorporated herein by reference.
42
Item 14. Principal Accountant Fees and Services
Information relating to Neenah's principal accounting fees and services is set forth under the caption "Independent Registered Public Accounting Firm Fees and Services" in the Proxy Statement referred to in Item 10 above. Such information is incorporated herein by reference.
43
PART IV
Item 15. Exhibits and Financial Statement Schedule
(a) Documents filed as part of this report:
1. Consolidated Financial Statements
The following reports and financial statements are filed herewith on the pages indicated:
Page | ||
2. Financial Statement schedule
The following schedule is filed herewith:
All other schedules for which provision is made in the applicable accounting regulations of the Securities and Exchange Commission are not required under the related instructions or are inapplicable and, therefore, have been omitted.
3. Exhibits
See (b) below
(b) Exhibits
The following exhibits are filed with or incorporated by reference in this report. Where such filing is made by incorporation by reference to a previously filed registration statement or report, such registration statement or report is identified in parentheses. We will furnish any exhibit at no cost upon written request to us at: Investor Relations, Neenah Paper, Inc., 3460 Preston Ridge Road, Suite 600, Alpharetta, Georgia 30005.
Exhibit Number | Exhibit |
2.1 | Interest Purchase Agreement by and among ASP FiberMark Holdings, LLC, ASP FiberMark, LLC, Neenah FMK Holdings, LLC and Neenah Paper, Inc. dated as of July 16, 2015 (filed as Exhibit 2.1 to the Neenah Paper, Inc. Quarterly Report on Form 10-Q for the three months ended September 30, 2015, filed November 9, 2015 and incorporated herein by reference). |
2.2 | Asset Purchase Agreement, by and among Neenah Paper, Inc., Wausau Paper Corp. and Wausau Paper Mills, LLC, dated as of December 7, 2011 (filed as Exhibit 2.1 to the Neenah Paper, Inc. Current Report on Form 8-K filed January 31, 2012 and incorporated herein by reference). |
2.30 | Securities Purchase Agreement by and among Crane Technical Materials, Inc., Crane & Co., Inc., Neenah Paper, Inc. and Neenah Filtration, LLC dated as of June 2, 2014 (filed as Exhibit 2.1 to the Neenah Paper, Inc. Quarterly Report on Form 10-Q for the three months ended June 30, 2014, filed August 7, 2014) (confidential treatment has been granted for certain portions of this exhibit pursuant to a Confidential Treatment Request filed with the Securities Exchange Commission). |
44
Exhibit Number | Exhibit |
3.1 | Amended and Restated Certificate of Incorporation of Neenah Paper, Inc. (filed as Exhibit 3.1 to the Neenah Paper, Inc. Current Report on Form 8-K filed November 30, 2004 and incorporated herein by reference). |
3.2 | Amended and Restated Bylaws of Neenah Paper, Inc. (filed as Exhibit 3.2 to the Neenah Paper, Inc. Current Report on Form 8-K filed November 30, 2004 and incorporated herein by reference). |
4.1 | Indenture dated as of May 23, 2013, by and among the Company, the Guarantors named therein, and the 2021 Notes Trustee filed as Exhibit 4.1 to the Neenah Paper, Inc. Current Report on Form 8-K, filed May 24, 2013 and incorporated herein by reference). |
4.2 | Form of Notation of Subsidiary Guarantee (included as Exhibit E to Exhibit 4.1). |
10.1 | Tax Sharing Agreement dated as of November 30, 2004 by and between Kimberly-Clark Corporation and Neenah Paper, Inc. (filed as Exhibit 10.2 to the Neenah Paper, Inc. Current Report on Form 8-K filed November 30, 2004 and incorporated herein by reference). |
10.2 | Lease Agreement dated June 29, 2004 between Neenah Paper, Inc. and Germania Property Investors XXXIV, L.P. (filed as Exhibit 10.3 to the Neenah Paper, Inc. Current Report on Form 8-K filed November 30, 2004 and incorporated herein by reference). |
10.3* | Neenah Paper Supplemental Pension Plan (filed as Exhibit 10.5 to the Neenah Paper, Inc. Annual Report on Form 10-K for the year ended December 31, 2012, filed March 7, 2013 and incorporated herein by reference). |
10.4* | First Amendment to Neenah Paper Supplemental Pension Plan (filed as Exhibit 10.31 to the Neenah Paper, Inc. Annual Report on Form 10-K for the year ended December 31, 2013, filed on March 4, 2014 and incorporated herein by reference). |
10.5* | Neenah Paper Amended and Restated Supplemental Retirement Contribution Plan, effective as of January 1, 2016 (filed herewith). |
10.6* | Neenah Paper Executive Severance Plan (filed as Exhibit 10.7 to the Neenah Paper, Inc. Annual Report on Form 10-K for the year ended December 31, 2012, filed March 7, 2013 and incorporated herein by reference). |
10.7* | First Amendment to Neenah Paper Executive Severance Plan (filed as Exhibit 10.33 to the Neenah Paper, Inc. Annual Report on Form 10-K for the year ended December 31, 2013, filed on March 4, 2014 and incorporated herein by reference). |
10.8* | Neenah Paper, Inc. Amended and Restated 2004 Omnibus Stock and Incentive Compensation Plan (filed as Annex A to the Neenah Paper, Inc. Definitive Proxy Statement on Schedule 14A for the year ended December 31, 2013, filed April 12, 2013 and incorporated herein by reference). |
10.9* | Neenah Paper Deferred Compensation Plan approved on December 11, 2006 (filed as Exhibit 10.21 to the Neenah Paper, Inc. Annual Report on Form 10-K for the year ended December 31, 2012, filed March 7, 2013 and incorporated herein by reference). |
10.10* | Neenah Paper Directors' Deferred Compensation Plan approved on December 11, 2006. (filed as Exhibit 10.7 to the Neenah Paper, Inc. Annual Report on Form 10-K for the year ended December 31, 2012, filed March 7, 2013 and incorporated herein by reference). |
10.11 | Third Amended and Restated Credit Agreement dated December 18, 2014 by and among Neenah Paper, Inc., certain of its subsidiaries, the lenders listed therein and JPMorgan Chase Bank, N.A., as agent for the Lenders (filed as Exhibit 10.31 to the Neenah Paper, Inc. Annual Report on Form 10-K for the year ended December 31, 2014, filed February 27, 2015 and incorporated herein by reference) (confidential treatment has been granted for certain portions of this exhibit pursuant to a Confidential Treatment Request filed with the Securities Exchange Commission). |
10.12 | First Amendment, dated as of July 28, 2016, to the Third Amended and Restated Credit Agreement dated December 18, 2014 by and among Neenah Paper, Inc., certain of its subsidiaries, the lenders listed therein and JPMorgan Chase Bank, N.A., as agent for the Lenders (filed as Exhibit 99.1 to the Neenah Paper, Inc. Current Report on Form 8-K, filed August 2, 2016 and incorporated herein by reference). |
10.13 | Second Amendment, dated as of December 13, 2016, to the Third Amended and Restated Credit Agreement dated December 18, 2014 by and among Neenah Paper, Inc., certain of its subsidiaries, the lenders listed therein and JPMorgan Chase Bank, N.A., as agent for the Lenders (filed as Exhibit 99.1 to the Neenah Paper, Inc. Current Report on Form 8-K, filed December 16, 2016 and incorporated herein by reference). |
10.14* | Form of Performance Share Award as of 2017 (filed as Exhibit 10.1 to Neenah Paper, Inc. Current Report on Form 8-K filed February 3, 2017 and incorporated by reference herein). |
12 | Statement Regarding Computation of Ratio of Earnings to Fixed Charges (filed herewith) |
21 | List of Subsidiaries of Neenah Paper, Inc. (filed herewith). |
23 | Consent of Deloitte & Touche LLP (filed herewith) |
45
Exhibit Number | Exhibit |
24 | Power of Attorney (filed herewith) |
31.1 | Certification of Chief Executive Officer required by Rule 13a-14(a) or Rule 15d-14(a) of the Securities Exchange Act of 1934, as amended (the "Exchange Act") (filed herewith). |
31.2 | Certification of Chief Financial Officer required by Rule 13a-14(a) or Rule 15d-14(a) of the Exchange Act (filed herewith). |
32.1 | Certification of Chief Executive Officer required by Rule 13a-14(b) or Rule 15d-14(b) of the Exchange Act and Section 1350 of Chapter 63 of Title 18 of the United States Code (filed herewith). |
32.2 | Certification of Chief Financial Officer required by Rule 13a-14(b) or Rule 15d-14(b) of the Exchange Act and Section 1350 of Chapter 63 of Title 18 of the United States Code (filed herewith). |
101.INS | XBRL Instance Document (filed herewith). |
101.SCH | XBRL Taxonomy Extension Schema Document (filed herewith). |
101.CAL | XBRL Taxonomy Extension Calculation Linkbase Document (filed herewith). |
101.DEF | XBRL Taxonomy Extension Definition Linkbase Document (filed herewith). |
101.LAB | XBRL Taxonomy Extension Label Linkbase Document (filed herewith). |
101.PRE | XBRL Taxonomy Extension Presentation Linkbase Document (filed herewith). |
_______________________
* | Indicates management contract or compensatory plan or arrangement. |
+ | Pursuant to a confidential treatment request portions of this exhibit have been furnished separately to the Securities and Exchange Commission. |
(c) | Financial Statement Schedule |
See Item 15(a) (2) above
Item 16. Form 10-K Summary
None.
46
SIGNATURES
Pursuant to the requirements of Section 13 or 15(d) of the Securities Exchange Act of 1934, the registrant has duly caused this report to be signed on its behalf by the undersigned, thereunto duly authorized.
NEENAH PAPER, INC. | ||
By: | /s/ JOHN P. O'DONNELL | |
Name: | John P. O'Donnell | |
Title: | President, Chief Executive Officer and Director (in his capacity as a duly authorized officer of the Registrant and in his capacity as Chief Executive Officer) | |
Date: | February 24, 2017 | |
Pursuant to the requirements of the Securities Exchange Act of 1934, this report has been signed below by the following persons on behalf of the registrant and in the capacities and on the dates indicated.
/s/ JOHN P. O'DONNELL | President, Chief Executive Officer and Director (Principal Executive Officer) | |||||
John P. O'Donnell | February 24, 2017 | |||||
/s/ BONNIE C. LIND | Senior Vice President, Chief Financial Officer and Treasurer (Principal Financial Officer) | |||||
Bonnie C. Lind | February 24, 2017 | |||||
/s/ LARRY N. BROWNLEE | Vice President — Controller (Principal Accounting Officer) | |||||
Larry N. Brownlee | February 24, 2017 | |||||
/s/ SEAN T. ERWIN* | Chairman of the Board and Director | |||||
Sean T. Erwin | February 24, 2017 | |||||
/s/ WILLIAM M. COOK* | Director | |||||
William M. Cook | February 24, 2017 | |||||
/s/ MARGARET S. DANO* | Director | |||||
Margaret S. Dano | February 24, 2017 | |||||
/s/ TIMOTHY S. LUCAS* | Director | |||||
Timothy S. Lucas | February 24, 2017 | |||||
/s/ JOHN F. MCGOVERN* | Director | |||||
John F. McGovern | February 24, 2017 | |||||
/s/ PHILIP C. MOORE* | Director | |||||
Philip C. Moore | February 24, 2017 | |||||
/s/ STEPHEN M. WOOD* | Director | |||||
Stephen M. Wood | February 24, 2017 | |||||
*By: | /s/ STEVEN S. HEINRICHS | |||||
Steven S. Heinrichs Senior Vice President, General Counsel and Secretary Attorney-in-fact | ||||||
47
TABLE OF CONTENTS
Page | ||
48
REPORT OF INDEPENDENT REGISTERED PUBLIC ACCOUNTING FIRM
To the Board of Directors and Stockholders of
Neenah Paper, Inc.
Alpharetta, Georgia
We have audited the internal control over financial reporting of Neenah Paper, Inc. and subsidiaries (the “Company”) as of December 31, 2016 based on criteria established in Internal Control — Integrated Framework (2013) issued by the Committee of Sponsoring Organizations of the Treadway Commission. The Company’s management is responsible for maintaining effective internal control over financial reporting and for its assessment of the effectiveness of internal control over financial reporting, included in the accompanying Management’s Annual Report on Internal Control Over Financial Reporting. Our responsibility is to express an opinion on the Company’s internal control over financial reporting based on our audit.
We conducted our audit in accordance with the standards of the Public Company Accounting Oversight Board (United States). Those standards require that we plan and perform the audit to obtain reasonable assurance about whether effective internal control over financial reporting was maintained in all material respects. Our audit included obtaining an understanding of internal control over financial reporting, assessing the risk that a material weakness exists, testing and evaluating the design and operating effectiveness of internal control based on the assessed risk, and performing such other procedures as we considered necessary in the circumstances. We believe that our audit provides a reasonable basis for our opinion.
A company’s internal control over financial reporting is a process designed by, or under the supervision of, the company’s principal executive and principal financial officers, or persons performing similar functions, and effected by the company’s board of directors, management, and other personnel to provide reasonable assurance regarding the reliability of financial reporting and the preparation of financial statements for external purposes in accordance with generally accepted accounting principles. A company’s internal control over financial reporting includes those policies and procedures that (1) pertain to the maintenance of records that, in reasonable detail, accurately and fairly reflect the transactions and dispositions of the assets of the company; (2) provide reasonable assurance that transactions are recorded as necessary to permit preparation of financial statements in accordance with generally accepted accounting principles, and that receipts and expenditures of the company are being made only in accordance with authorizations of management and directors of the company; and (3) provide reasonable assurance regarding prevention or timely detection of unauthorized acquisition, use, or disposition of the company’s assets that could have a material effect on the financial statements.
Because of the inherent limitations of internal control over financial reporting, including the possibility of collusion or improper management override of controls, material misstatements due to error or fraud may not be prevented or detected on a timely basis. Also, projections of any evaluation of the effectiveness of the internal control over financial reporting to future periods are subject to the risk that the controls may become inadequate because of changes in conditions, or that the degree of compliance with the policies or procedures may deteriorate.
In our opinion, the Company maintained, in all material respects, effective internal control over financial reporting as of December 31, 2016, based on the criteria established in Internal Control — Integrated Framework (2013) issued by the Committee of Sponsoring Organizations of the Treadway Commission.
We have also audited, in accordance with the standards of the Public Company Accounting Oversight Board (United States), the consolidated financial statements and financial statement schedule as of and for the year ended December 31, 2016, of the Company and our report dated February 24, 2017, expressed an unqualified opinion on those financial statements and financial statement schedule.
/s/ Deloitte & Touche LLP
Atlanta, Georgia
February 24, 2017
F-2
REPORT OF INDEPENDENT REGISTERED PUBLIC ACCOUNTING FIRM
To the Board of Directors and Stockholders of
Neenah Paper, Inc.
Alpharetta, Georgia
We have audited the accompanying consolidated balance sheets of Neenah Paper, Inc. and subsidiaries (the “Company”) as of December 31, 2016 and 2015, and the related consolidated statements of operations, comprehensive income, changes in stockholders’ equity, and cash flows for each of the three years in the period ended December 31, 2016. Our audits also included the financial statement schedule listed in the Index at Item 15. These consolidated financial statements and financial statement schedule are the responsibility of the Company’s management. Our responsibility is to express an opinion on the consolidated financial statements and financial statement schedule based on our audits.
We conducted our audits in accordance with the standards of the Public Company Accounting Oversight Board (United States). Those standards require that we plan and perform the audit to obtain reasonable assurance about whether the financial statements are free of material misstatement. An audit includes examining, on a test basis, evidence supporting the amounts and disclosures in the financial statements. An audit also includes assessing the accounting principles used and significant estimates made by management, as well as evaluating the overall financial statement presentation. We believe that our audits provide a reasonable basis for our opinion.
In our opinion, such consolidated financial statements present fairly, in all material respects, the consolidated financial position of Neenah Paper Inc. and subsidiaries as of December 31, 2016 and 2015, and the results of their operations and their cash flows for each of the three years in the period ended December 31, 2016, in conformity with accounting principles generally accepted in the United States of America. Also, in our opinion, such financial statement schedule, when considered in relation to the basic consolidated financial statements taken as a whole, presents fairly, in all material respects, the information set forth therein.
We have also audited, in accordance with the standards of the Public Company Accounting Oversight Board (United States), the Company’s internal control over financial reporting as of December 31, 2016, based on the criteria established in Internal Control — Integrated Framework (2013) issued by the Committee of Sponsoring Organizations of the Treadway Commission, and our report dated February 24, 2017 expressed an unqualified opinion on the Company’s internal control over financial reporting.
/s/ Deloitte & Touche LLP
Atlanta, Georgia
February 24, 2017
F-3
NEENAH PAPER, INC. AND SUBSIDIARIES
CONSOLIDATED STATEMENTS OF OPERATIONS
(In millions, except share and per share data)
Year Ended December 31, | ||||||||||||
2016 | 2015 | 2014 | ||||||||||
Net sales | $ | 941.5 | $ | 887.7 | $ | 839.7 | ||||||
Cost of products sold | 727.0 | 692.3 | 668.9 | |||||||||
Gross profit | 214.5 | 195.4 | 170.8 | |||||||||
Selling, general and administrative expenses | 92.2 | 86.5 | 78.0 | |||||||||
Integration/restructuring costs | 7.0 | 6.5 | 2.3 | |||||||||
Pension plan settlement charge | 0.8 | — | 3.5 | |||||||||
Loss on early extinguishment of debt | — | — | 0.2 | |||||||||
Other expense — net | 0.4 | 1.0 | 0.2 | |||||||||
Operating income | 114.1 | 101.4 | 86.6 | |||||||||
Interest expense | 11.2 | 11.7 | 11.4 | |||||||||
Interest income | (0.1 | ) | (0.2 | ) | (0.3 | ) | ||||||
Income from continuing operations before income taxes | 103.0 | 89.9 | 75.5 | |||||||||
Provision for income taxes | 29.6 | 29.4 | 7.5 | |||||||||
Income from continuing operations | 73.4 | 60.5 | 68.0 | |||||||||
(Loss) income from discontinued operations, net of taxes (Note 13) | (0.4 | ) | (9.4 | ) | 0.7 | |||||||
Net income | $ | 73.0 | $ | 51.1 | $ | 68.7 | ||||||
Earnings (Loss) Per Common Share | ||||||||||||
Basic | ||||||||||||
Continuing operations | 4.33 | 3.58 | 4.05 | |||||||||
Discontinued operations | (0.02 | ) | (0.56 | ) | 0.04 | |||||||
$ | 4.31 | $ | 3.02 | $ | 4.09 | |||||||
Diluted | ||||||||||||
Continuing operations | 4.26 | 3.53 | 3.99 | |||||||||
Discontinued operations | (0.02 | ) | (0.55 | ) | 0.04 | |||||||
$ | 4.24 | $ | 2.98 | $ | 4.03 | |||||||
Weighted Average Common Shares Outstanding (in thousands) | ||||||||||||
Basic | 16,773 | 16,754 | 16,584 | |||||||||
Diluted | 17,087 | 17,012 | 16,872 | |||||||||
See Notes to Consolidated Financial Statements
F-4
NEENAH PAPER, INC. AND SUBSIDIARIES
CONSOLIDATED STATEMENTS OF COMPREHENSIVE INCOME
(In millions)
Year Ended December 31, | ||||||||||||
2016 | 2015 | 2014 | ||||||||||
Net income | $ | 73.0 | $ | 51.1 | $ | 68.7 | ||||||
Reclassification of amounts recognized in the consolidated statement of operations: | ||||||||||||
Amortization of adjustments to pension and other postretirement benefit liabilities | 7.2 | 7.1 | 4.7 | |||||||||
Pension plan settlement/curtailment charge (2015 amount in discontinued operations) | 0.8 | 5.5 | 3.5 | |||||||||
Amounts recognized in the consolidated statement of operations | 8.0 | 12.6 | 8.2 | |||||||||
Unrealized foreign currency translation loss | (7.1 | ) | (15.0 | ) | (23.7 | ) | ||||||
Net loss from pension and other postretirement benefit plans | (18.0 | ) | (6.3 | ) | (34.3 | ) | ||||||
Loss from other comprehensive income items before income taxes | (17.1 | ) | (8.7 | ) | (49.8 | ) | ||||||
(Benefit) provision for income taxes | (3.4 | ) | 1.2 | (8.7 | ) | |||||||
Other comprehensive loss | (13.7 | ) | (9.9 | ) | (41.1 | ) | ||||||
Comprehensive income | $ | 59.3 | $ | 41.2 | $ | 27.6 | ||||||
See Notes to Consolidated Financial Statements
F-5
NEENAH PAPER, INC. AND SUBSIDIARIES
CONSOLIDATED BALANCE SHEETS
(In millions, except share data)
December 31, | ||||||||
2016 | 2015 | |||||||
ASSETS | ||||||||
Current Assets | ||||||||
Cash and cash equivalents | $ | 3.1 | $ | 4.2 | ||||
Accounts receivable, net | 96.5 | 97.3 | ||||||
Inventories | 116.3 | 120.6 | ||||||
Prepaid and other current assets | 20.4 | 24.5 | ||||||
Total Current Assets | 236.3 | 246.6 | ||||||
Property, Plant and Equipment — net | 364.6 | 323.0 | ||||||
Deferred Income Taxes | 6.1 | 20.0 | ||||||
Goodwill (Note 5) | 70.4 | 72.2 | ||||||
Intangible Assets — net (Note 5) | 74.0 | 79.1 | ||||||
Other Assets | 14.2 | 10.5 | ||||||
TOTAL ASSETS | $ | 765.6 | $ | 751.4 | ||||
LIABILITIES AND STOCKHOLDERS' EQUITY | ||||||||
Current Liabilities | ||||||||
Debt payable within one year | $ | 1.2 | $ | 1.2 | ||||
Accounts payable | 55.6 | 53.7 | ||||||
Accrued expenses | 51.2 | 51.2 | ||||||
Total Current Liabilities | 108.0 | 106.1 | ||||||
Long-Term Debt | 219.7 | 228.2 | ||||||
Deferred Income Taxes | 10.1 | 11.8 | ||||||
Noncurrent Employee Benefits | 86.7 | 89.7 | ||||||
Other Noncurrent Obligations | 2.8 | 4.0 | ||||||
TOTAL LIABILITIES | 427.3 | 439.8 | ||||||
Commitments and Contingencies (Notes 11 and 12) | ||||||||
Stockholders' Equity | ||||||||
Common stock, par value $0.01 — authorized: 100,000,000 shares; issued and outstanding: 16,771,000 shares and 16,819,000 shares | 0.2 | 0.2 | ||||||
Treasury stock, at cost: 1,475,000 shares and 1,244,000 shares | (56.5 | ) | (40.1 | ) | ||||
Additional paid-in capital | 317.0 | 310.8 | ||||||
Retained earnings | 169.6 | 119.0 | ||||||
Accumulated other comprehensive loss | (92.0 | ) | (78.3 | ) | ||||
Total Stockholders' Equity | 338.3 | 311.6 | ||||||
TOTAL LIABILITIES AND STOCKHOLDERS' EQUITY | $ | 765.6 | $ | 751.4 | ||||
See Notes to Consolidated Financial Statements
F-6
NEENAH PAPER, INC. AND SUBSIDIARIES
CONSOLIDATED STATEMENTS OF CHANGES IN STOCKHOLDERS' EQUITY
(In millions, shares in thousands)
Common Stock | |||||||||||||||||||||||
Shares | Amount | Treasury Stock | Additional Paid-In Capital | Retained Earnings | Accumulated Other Comprehensive Loss | ||||||||||||||||||
Balance, December 31, 2013 | 17,383 | $ | 0.2 | $ | (27.2 | ) | $ | 285.2 | $ | 36.6 | $ | (27.3 | ) | ||||||||||
Net income | — | — | — | — | 68.7 | — | |||||||||||||||||
Other comprehensive income, net of income taxes | — | — | — | — | — | (41.1 | ) | ||||||||||||||||
Dividends declared | — | — | — | — | (17.1 | ) | — | ||||||||||||||||
Excess tax benefits from stock-based compensation | — | — | — | 5.6 | — | — | |||||||||||||||||
Shares purchased (Note 10) | — | — | (1.1 | ) | — | — | — | ||||||||||||||||
Stock options exercised | 316 | — | — | 3.6 | — | — | |||||||||||||||||
Restricted stock vesting (Note 10) | 150 | — | (3.4 | ) | — | — | — | ||||||||||||||||
Stock-based compensation | — | — | — | 6.0 | — | — | |||||||||||||||||
Balance, December 31, 2014 | 17,849 | 0.2 | (31.7 | ) | 300.4 | 88.2 | (68.4 | ) | |||||||||||||||
Net income | — | — | — | — | 51.1 | — | |||||||||||||||||
Other comprehensive loss, net of income taxes | — | — | — | — | — | (9.9 | ) | ||||||||||||||||
Dividends declared | — | — | — | — | (20.3 | ) | — | ||||||||||||||||
Excess tax benefits from stock-based compensation | — | — | — | 2.6 | — | — | |||||||||||||||||
Shares purchased (Note 10) | — | — | (5.9 | ) | — | — | — | ||||||||||||||||
Stock options exercised | 108 | — | — | 1.2 | — | — | |||||||||||||||||
Restricted stock vesting (Note 10) | 106 | — | (2.5 | ) | — | — | — | ||||||||||||||||
Stock-based compensation | — | — | — | 6.5 | — | — | |||||||||||||||||
Other/Currency | — | — | — | 0.1 | — | — | |||||||||||||||||
Balance, December 31, 2015 | 18,063 | 0.2 | (40.1 | ) | 310.8 | 119.0 | (78.3 | ) | |||||||||||||||
Net income | — | — | — | — | 73.0 | — | |||||||||||||||||
Other comprehensive loss, net of income taxes | — | — | — | — | — | (13.7 | ) | ||||||||||||||||
Dividends declared | — | — | — | — | (22.4 | ) | — | ||||||||||||||||
Shares purchased (Note 10) | — | — | (12.6 | ) | — | — | — | ||||||||||||||||
Stock options exercised | 71 | — | — | 0.4 | — | — | |||||||||||||||||
Restricted stock vesting (Note 10) | 111 | — | (3.8 | ) | — | — | — | ||||||||||||||||
Stock-based compensation | — | — | — | 5.8 | — | — | |||||||||||||||||
Balance, December 31, 2016 | 18,245 | $ | 0.2 | $ | (56.5 | ) | $ | 317.0 | $ | 169.6 | $ | (92.0 | ) | ||||||||||
See Notes to Consolidated Financial Statements
F-7
NEENAH PAPER, INC. AND SUBSIDIARIES
CONSOLIDATED STATEMENTS OF CASH FLOWS
(In millions)
Year Ended December 31, | ||||||||||||
2016 | 2015 | 2014 | ||||||||||
OPERATING ACTIVITIES | ||||||||||||
Net income | $ | 73.0 | $ | 51.1 | $ | 68.7 | ||||||
Adjustments to reconcile net income to net cash provided by operating activities: | ||||||||||||
Depreciation and amortization | 32.0 | 31.5 | 30.0 | |||||||||
Stock-based compensation | 5.8 | 6.5 | 6.0 | |||||||||
Excess tax benefit from stock-based compensation (Note 2 and 9) | — | (2.6 | ) | (5.6 | ) | |||||||
Deferred income tax provision | 16.9 | 8.3 | 3.7 | |||||||||
Non-cash effects of changes in liabilities for uncertain income tax positions | (1.5 | ) | (0.1 | ) | (2.0 | ) | ||||||
Loss on early extinguishment of debt | — | — | 0.2 | |||||||||
Pension settlement charge, net of plan payments | 0.8 | — | 3.5 | |||||||||
Non-cash loss on discontinued operations | — | 12.0 | — | |||||||||
Loss (gain) on asset dispositions | 0.1 | (0.1 | ) | 0.2 | ||||||||
Net cash (used in) provided by changes in operating working capital, net of effect of acquisitions (Note 15) | (1.2 | ) | 1.8 | 9.0 | ||||||||
Pension and other post-employment benefits | (10.9 | ) | 2.9 | (18.3 | ) | |||||||
Other | 0.8 | (0.1 | ) | (0.9 | ) | |||||||
NET CASH PROVIDED BY OPERATING ACTIVITIES | 115.8 | 111.2 | 94.5 | |||||||||
INVESTING ACTIVITIES | ||||||||||||
Capital expenditures | (68.5 | ) | (48.1 | ) | (27.9 | ) | ||||||
Purchases of marketable securities | (0.1 | ) | (0.2 | ) | (0.6 | ) | ||||||
Net proceeds from sale of discontinued operations | — | 5.4 | — | |||||||||
Proceeds from sale of property, plant and equipment | 0.1 | 0.5 | — | |||||||||
Acquisitions (Note 4) | — | (118.2 | ) | (72.4 | ) | |||||||
Purchase of equity investment | — | — | (2.9 | ) | ||||||||
Other | 0.3 | 0.5 | (1.1 | ) | ||||||||
NET CASH USED IN INVESTING ACTIVITIES | (68.2 | ) | (160.1 | ) | (104.9 | ) | ||||||
FINANCING ACTIVITIES | ||||||||||||
Proceeds from issuance of long-term debt (Note 7) | 243.0 | 151.6 | 49.5 | |||||||||
Debt issuance costs | (0.1 | ) | — | (2.4 | ) | |||||||
Repayments of long-term debt (Note 7) | (252.9 | ) | (145.6 | ) | (5.6 | ) | ||||||
Short-term borrowings | — | — | 6.5 | |||||||||
Repayments of short-term borrowings | — | — | (25.4 | ) | ||||||||
Proceeds from exercise of stock options | 0.4 | 1.2 | 3.6 | |||||||||
Excess tax benefit from stock-based compensation (Note 2 and 9) | — | 2.6 | 5.6 | |||||||||
Cash dividends paid | (22.4 | ) | (20.3 | ) | (17.1 | ) | ||||||
Shares purchased (Note 10) | (16.4 | ) | (8.4 | ) | (4.5 | ) | ||||||
Other | — | 0.1 | — | |||||||||
NET CASH (USED IN) PROVIDED BY FINANCING ACTIVITIES | (48.4 | ) | (18.8 | ) | 10.2 | |||||||
EFFECT OF EXCHANGE RATE CHANGES ON CASH AND CASH EQUIVALENTS | (0.3 | ) | (0.7 | ) | (0.6 | ) | ||||||
NET DECREASE IN CASH AND CASH EQUIVALENTS | (1.1 | ) | (68.4 | ) | (0.8 | ) | ||||||
CASH AND CASH EQUIVALENTS, BEGINNING OF YEAR | 4.2 | 72.6 | 73.4 | |||||||||
CASH AND CASH EQUIVALENTS, END OF YEAR | $ | 3.1 | $ | 4.2 | $ | 72.6 | ||||||
See Notes to Consolidated Financial Statements
F-8
NEENAH PAPER INC. AND SUBSIDIARIES
NOTES TO CONSOLIDATED FINANCIAL STATEMENTS
(Dollars in millions, except as noted)
Note 1. Background and Basis of Presentation
Background
Neenah Paper, Inc. ("Neenah" or the "Company"), is a Delaware corporation incorporated in April 2004. The Company has two primary operations: its technical products business and its fine paper and packaging business.
The technical products business is an international producer of fiber-formed, coated and/or saturated specialized media that delivers high performance benefits to customers. Included in this segment are filtration media, tape and abrasives backings products, and durable label and specialty substrate products. The fine paper and packaging business is a supplier of branded premium printing, packaging and other high end specialty papers primarily in North America. The Company's premium writing, text and cover papers, and specialty papers are used in commercial printing and imaging applications for corporate identity packages, invitations, personal stationery and high-end advertising, as well as premium labels and luxury packaging.
Basis of Presentation
The consolidated financial statements include the financial statements of the Company and its wholly owned and majority owned subsidiaries. All inter-company balances and transactions have been eliminated in consolidation.
Note 2. Summary of Significant Accounting Policies
Use of Estimates
The preparation of financial statements in conformity with accounting principles generally accepted in the United States ("GAAP") requires management to make estimates and assumptions that affect the reported amounts of assets and liabilities at the date of the financial statements and the reported amounts of net sales and expenses during the reporting periods. Actual results could differ from these estimates, and changes in these estimates are recorded when known. Significant management judgment is required in determining the accounting for, among other things, pension and postretirement benefits, retained insurable risks, reserves for sales discounts and allowances, purchase price allocations, useful lives for depreciation and amortization, future cash flows associated with impairment testing for tangible and intangible long-lived assets, goodwill, income taxes, contingencies, inventory obsolescence and market reserves and the valuation of stock-based compensation.
Revenue Recognition
The Company recognizes sales revenue when all of the following have occurred: (1) delivery has occurred, (2) persuasive evidence of an agreement exists, (3) pricing is fixed or determinable, and (4) collection is reasonably assured. Delivery is not considered to have occurred until the customer takes title and assumes the risks and rewards of ownership. The timing of revenue recognition is largely dependent on shipping terms. Sales are reported net of allowable discounts and estimated returns. Reserves for cash discounts, trade allowances and sales returns are estimated using historical experience.
Cash and Cash Equivalents
Cash and cash equivalents include all cash balances and highly liquid investments with an initial maturity of three months or less. The Company places its temporary cash investments with high credit quality financial institutions. As of December 31, 2016 and 2015, $0.3 million of the Company's cash and cash equivalents is restricted to the payment of postretirement benefits for certain former Fox River executives.
Inventories
U.S. inventories are valued at the lower of cost, using the Last-In, First-Out (LIFO) method for financial reporting purposes, or market. German inventories are valued at the lower of cost, using a weighted-average cost method, or market. Cost includes labor, materials and production overhead.
F-9
NEENAH PAPER INC. AND SUBSIDIARIES
NOTES TO CONSOLIDATED FINANCIAL STATEMENTS (Continued)
(Dollars in millions, except as noted)
Foreign Currency
Balance sheet accounts of the Company's operations in Germany, the United Kingdom (the "U.K.") and Canada are translated from Euros, British Pounds and Canadian dollars, respectively, into U.S. dollars at period-end exchange rates, and income and expense accounts are translated at average exchange rates during the period. Translation gains or losses related to net assets located in Germany, the U.K. and Canada are recorded as unrealized foreign currency translation adjustments within Accumulated other comprehensive loss in stockholders' equity. Gains and losses resulting from foreign currency transactions (transactions denominated in a currency other than the entity's functional currency) are included in Other expense — net in the consolidated statements of operations.
Property and Depreciation
Property, plant and equipment are stated at cost, less accumulated depreciation. Certain costs of software developed or obtained for internal use are capitalized. When property, plant and equipment is sold or retired, the costs and the related accumulated depreciation are removed from the accounts, and the gains or losses are recorded in other (income) expense — net. For financial reporting purposes, depreciation is principally computed on the straight-line method over estimated useful asset lives. The weighted average remaining useful lives for buildings, land improvements and machinery and equipment are approximately 18 years, 13 years and 10 years, respectively. Units-of-production method of depreciation is used for $68.6 million of production assets, which reflects the nature of the assets' utilization. For income tax purposes, accelerated methods of depreciation are used.
The costs of major rebuilds and replacements of plant and equipment are capitalized, and the cost of maintenance performed on manufacturing facilities, composed of labor, materials and other incremental costs, is expensed as incurred. Start-up costs for new or expanded facilities, including costs related to trial production, are expensed as incurred.
The Company accounts for asset retirement obligations ("AROs") in accordance with ASC Topic 410, Asset Retirements and Environmental Obligations, which requires companies to make estimates regarding future events in order to record a liability for AROs in the period in which a legal obligation is created. Such liabilities are recorded at fair value, with an offsetting increase to the carrying value of the related long-lived asset. As of December 31, 2016, the Company is unable to estimate its AROs for environmental liabilities at its manufacturing facilities.
Stock-Based Compensation
The Company accounts for stock-based compensation in accordance with the fair value recognition provisions of ASC Topic 718, Compensation — Stock Compensation ("ASC Topic 718"). The amount of stock-based compensation cost recognized is based on the fair value of grants that are ultimately expected to vest and is recognized pro-rata over the requisite service period for the entire award.
Research and Development Expense
Research and development costs are charged to expense as incurred and are recorded in "Selling, general and administrative expenses" on the consolidated statement of operations. See Note 15, "Supplemental Data — Supplemental Statement of Operations Data."
Fair Value Measurements
The Company measures the fair value of pension plan assets in accordance with ASC Topic 820, Fair Value Measurements and Disclosures ("ASC Topic 820") which establishes a framework for measuring fair value. ASC Topic 820 provides a fair value hierarchy that prioritizes the inputs to valuation techniques used to measure fair value. The hierarchy gives the highest priority to unadjusted quoted prices in active markets for identical assets or liabilities (Level 1 measurements) and the lowest priority to unobservable inputs (Level 3 measurements).
Fair Value of Financial Instruments
The carrying amounts reflected in the consolidated balance sheets for cash and cash equivalents, accounts receivable and accounts payable approximate fair value due to their short maturities. The fair value of short and long-term debt is estimated using rates currently available to the Company for debt of the same remaining maturities. The following table presents the carrying value and the fair value of the Company's debt.
F-10
NEENAH PAPER INC. AND SUBSIDIARIES
NOTES TO CONSOLIDATED FINANCIAL STATEMENTS (Continued)
(Dollars in millions, except as noted)
December 31, 2016 | December 31, 2015 | |||||||||||||||
Carrying Value | Fair Value (a) | Carrying Value | Fair Value (a) | |||||||||||||
2021 Senior Notes (5.25% fixed rate) | $ | 175.0 | $ | 169.5 | $ | 175.0 | $ | 169.9 | ||||||||
Global Revolving Credit Facilities (variable rates) | 42.9 | 42.9 | 51.1 | 51.1 | ||||||||||||
Second German Loan Agreement (2.5% fixed rate) | 6.8 | 6.8 | 8.3 | 8.3 | ||||||||||||
Total debt | $ | 224.7 | $ | 219.2 | $ | 234.4 | $ | 229.3 | ||||||||
_______________________
(a) | Fair value for all debt instruments was estimated from Level 2 measurements. |
The Company's investments in marketable securities are accounted for as "available-for-sale securities" in accordance with ASC Topic 320, Investments — Debt and Equity Securities ("ASC Topic 320"). Pursuant to ASC Topic 320, marketable securities are reported at fair value on the consolidated balance sheet and unrealized holding gains and losses are reported in other comprehensive income until realized upon sale. At December 31, 2016, the Company had $3.5 million in marketable securities classified as Other assets on the consolidated balance sheet. The cost of such marketable securities was $3.4 million. Fair value for the Company's marketable securities was estimated from Level 1 inputs. The Company's marketable securities are designated for the payment of benefits under its supplemental employee retirement plan (the "SERP").
Fair Value of Pension Plan Assets
With the exception of cash and cash equivalents which are considered Level 1, pension plan assets are measured at NAV (or its equivalent) as an alternative to fair market value due to the absence of readily available market prices, and as such are not subject to the fair value hierarchy. Following is the fair value of each investment category:
• | Cash and cash equivalents ($1.5 million and $6.9 million at December 31, 2016 and 2015, respectively). |
• | U.S and non-U.S. Equities ($112.2 million and $92.4 million at December 31, 2016 and 2015, respectively) — These proprietary mutual funds have observable net asset values (based on the fair value of the underlying investments of the funds) that are provided to investors and provide for liquidity either immediately of within a few days. |
• | U.S and non-U.S. Fixed Income Securities ($181.1 million and $185.8 million at December 31, 2016 and 2015, respectively) — These proprietary mutual funds have observable net asset values (based on the fair value of the underlying investments of the funds) that are provided to investors and provide for liquidity either immediately of within a few days. |
• | Hedge Funds ($23.3 million and $23.2 million at December 31, 2016 and 2015, respectively) — These funds are valued using net asset values calculated by the fund managers and allow for quarterly or more frequent redemptions. |
Recently Adopted Accounting Standards
In March 2016, the FASB issued ASU 2016-09, Compensation — Stock Compensation (Topic 718): Improvements to Employee Share-Based Payment Accounting (“ASU 2016-09”). ASU 2016-09 modifies the accounting for excess tax benefits and tax deficiencies associated with share-based payments and amends the associated cash flow presentation. ASU 2016-09 (i) eliminates the requirement to recognize excess tax benefits in additional paid-in capital (“APIC”), (ii) eliminates the requirement to evaluate tax deficiencies for APIC or income tax expense classification and (iii) provides for these benefits or deficiencies to be recorded as an income tax expense or benefit in the income statement. Additionally, the tax benefits related to dividends paid on share-based payment awards will be reflected as an income tax benefit in the income statement. With these changes, tax-related cash flows resulting from share-based payments will be classified as operating activities as opposed to financing activities. ASU 2016-09 is effective for fiscal years beginning after December 15, 2016, although early adoption is permitted. The Company has elected to early adopt the standard in the three month period ended September 30, 2016, effective as if adopted on the first day of the fiscal year, January 1, 2016. As of December 31, 2015, there were no unrecognized deferred tax assets attributable to excess tax benefits. The adoption of the new standard decreased the provision for income taxes and
F-11
NEENAH PAPER INC. AND SUBSIDIARIES
NOTES TO CONSOLIDATED FINANCIAL STATEMENTS (Continued)
(Dollars in millions, except as noted)
increased income from continuing operations by $0.4 million and $1.8 million in the third quarter and the fourth quarter of 2016, respectively. In addition, the Company recast its previously reported provision for income taxes and increased income from continuing operations by $0.2 million and $0.7 million for the first and second quarter of 2016, respectively. Further, as part of the adoption, the Company elected to account for forfeitures in compensation cost as they occur. The cumulative impact for the change in election was not material. The Company elected to adopt prospectively the classification of tax-related cash flows resulting from share-based payments in operating cash flows.
Accounting Standards Changes
In May 2014, the FASB issued ASU 2014-09, Revenue from Contracts with Customers (Topic 606). This guidance specifies how and when an entity will recognize revenue arising from contracts with customers and requires entities to disclose information about the nature, amount, timing and uncertainty of revenue and cash flows arising from contracts with customers. The FASB has subsequently issued additional, clarifying standards to address issues arising from implementation of the new revenue recognition standard. The new revenue recognition standard and clarifying standards are effective for interim and annual periods beginning on January 1, 2018, and may be adopted earlier, but not before January 1, 2017. The Company has substantially completed its assessment of the new standards and does not believe there will be a material impact from adoption on its consolidated financial statements. The Company will continue to evaluate any additional changes, modifications or interpretations of the standard which may impact its current conclusions, and believes it will adopt the new standards using the modified retrospective method as of January 1, 2018.
In February 2016, the FASB issued ASU 2016-02, Leases (Topic 842) (“ASU 2016-02”). ASU 2016-02 requires lessees to put most leases on their balance sheets but recognize expenses on their income statements in a manner similar to current lease accounting. The guidance also eliminates current real estate-specific provisions for all entities. ASU 2016-09 is effective for fiscal years beginning after December 15, 2018, although early adoption is permitted. The Company is currently assessing the impact of the adoption of ASU 2016-09 on its consolidated financial statements.
As of December 31, 2016, no other amendments to the ASC had been issued and not adopted by the Company that will have or are reasonably likely to have a material effect on the its financial position, results of operations or cash flows.
Note 3. Earnings per Share ("EPS")
The Company's restricted stock units ("RSUs") are paid non-forfeitable common stock dividends and thus meet the criteria of participating securities. Accordingly, basic EPS has been calculated using the two-class method, under which earnings are allocated to both common stock and participating securities. Basic EPS has been computed by dividing net income allocated to common stock by the weighted average common shares outstanding. For the computation of basic EPS, weighted average RSUs outstanding are excluded from the calculation of weighted average shares outstanding.
Accounting Standards Codification ("ASC") Topic 260, Earnings per Share ("ASC Topic 260") requires companies with participating securities to calculate diluted earnings per share using the "Two Class" method. The "Two Class" method requires first calculating diluted earnings per share using a denominator that includes the weighted average share equivalents from the assumed conversion of dilutive securities. Diluted earnings per share is then calculated using net income reduced by the amount of distributed and undistributed earnings allocated to participating securities calculated using the "Treasury Stock" method and a denominator that includes the weighted average share equivalents from the assumed conversion of dilutive securities excluding participating securities. Companies are required to report the lower of the diluted earnings per share amounts under the two calculations subject to the anti-dilution provisions of ASC Topic 260.
Diluted EPS has been computed by dividing net income allocated to common stock by the weighted average number of common shares used in computing basic EPS, further adjusted to include the dilutive impact of the exercise or conversion of common stock equivalents, such as stock options, stock appreciation rights ("SARs") and target awards of Restricted Stock Units with performance conditions ("Performance Units"), into shares of common stock as if those securities were exercised or converted. For the years ended December 31, 2016, 2015 and 2014, approximately 35,000, 45,000 and 15,000 potentially dilutive options, respectively, were excluded from the computation of dilutive common shares because the exercise price of such options exceeded the average market price of the Company's common stock for the respective 12-month periods during which the options were outstanding.
The following table presents the computation of basic and diluted shares of common stock used in the calculation of EPS (amounts in millions, except share and per share amounts):
F-12
NEENAH PAPER INC. AND SUBSIDIARIES
NOTES TO CONSOLIDATED FINANCIAL STATEMENTS (Continued)
(Dollars in millions, except as noted)
Earnings per basic common share
Year Ended December 31, | ||||||||||||
2016 | 2015 | 2014 | ||||||||||
Income from continuing operations | $ | 73.4 | $ | 60.5 | $ | 68.0 | ||||||
Amounts attributable to participating securities | (0.7 | ) | (0.6 | ) | (0.8 | ) | ||||||
Income from continuing operations available to common stockholders | 72.7 | 59.9 | 67.2 | |||||||||
Income (loss) from discontinued operations, net of income taxes | (0.4 | ) | (9.4 | ) | 0.7 | |||||||
Amounts attributable to participating securities | — | 0.1 | — | |||||||||
Net income available to common stockholders | $ | 72.3 | $ | 50.6 | $ | 67.9 | ||||||
Weighted-average basic shares outstanding | 16,773 | 16,754 | 16,584 | |||||||||
Basic earnings (loss) per share | ||||||||||||
Continuing operations | $ | 4.33 | $ | 3.58 | $ | 4.05 | ||||||
Discontinued operations | (0.02 | ) | (0.56 | ) | 0.04 | |||||||
$ | 4.31 | $ | 3.02 | $ | 4.09 | |||||||
Earnings per diluted common share
Year Ended December 31, | ||||||||||||
2016 | 2015 | 2014 | ||||||||||
Income from continuing operations | $ | 73.4 | $ | 60.5 | $ | 68.0 | ||||||
Amounts attributable to participating securities | (0.6 | ) | (0.5 | ) | (0.8 | ) | ||||||
Income from continuing operations available to common stockholders | 72.8 | 60.0 | 67.2 | |||||||||
Income (loss) from discontinued operations, net of income taxes | (0.4 | ) | (9.4 | ) | 0.7 | |||||||
Amounts attributable to participating securities | — | 0.1 | — | |||||||||
Net income available to common stockholders | $ | 72.4 | $ | 50.7 | $ | 67.9 | ||||||
Weighted-average basic shares outstanding | 16,773 | 16,754 | 16,584 | |||||||||
Add: Assumed incremental shares under stock-based compensation plans | 314 | 258 | 288 | |||||||||
Weighted average diluted shares | 17,087 | 17,012 | 16,872 | |||||||||
Diluted earnings (loss) per share | ||||||||||||
Continuing operations | $ | 4.26 | $ | 3.53 | $ | 3.99 | ||||||
Discontinued operations | (0.02 | ) | (0.55 | ) | 0.04 | |||||||
$ | 4.24 | $ | 2.98 | $ | 4.03 | |||||||
F-13
NEENAH PAPER INC. AND SUBSIDIARIES
NOTES TO CONSOLIDATED FINANCIAL STATEMENTS (Continued)
(Dollars in millions, except as noted)
Note 4. Acquisitions
Acquisition of FiberMark
On August 1, 2015, the Company purchased all of the outstanding equity of FiberMark from American Securities for approximately $118 million. FiberMark is a specialty coatings and finishing company with a strong presence in luxury packaging and technical products. In September 2015, the Company announced the planned closure of the Fitchburg Mill, acquired in the FiberMark Acquisition to consolidate its manufacturing footprint. Manufacturing operations at the Fitchburg Mill ceased in December 2015. See Note 13, "Discontinued Operations."
The Company accounted for the transaction using the acquisition method in accordance with ASC Topic 805, Business Combinations ("ASC Topic 805"). The allocation of the purchase price was based on estimates of the fair value of assets acquired and liabilities assumed as of August 1, 2015. The Company has not identified any material unrecorded pre-acquisition contingencies. The Company did not recognize any in-process research and development assets as part of the acquisition.
The following table summarizes the allocation of the purchase price to the estimated fair value of the assets acquired and liabilities assumed as of December 31, 2015.
December 31, 2015 | ||||
Assets Acquired | ||||
Cash and cash equivalents | $ | 4.8 | ||
Accounts receivable | 13.7 | |||
Inventories | 27.5 | |||
Deferred income taxes | 2.3 | |||
Prepaid and other current assets | 3.6 | |||
Property, plant and equipment | 68.9 | |||
Non-amortizable intangible assets | 1.3 | |||
Amortizable intangible assets | 25.6 | |||
Acquired goodwill | 25.5 | |||
Total assets acquired | 173.2 | |||
Liabilities Assumed | ||||
Accounts payable | 8.0 | |||
Accrued expenses | 5.6 | |||
Deferred income taxes | 24.1 | |||
Noncurrent employee benefits | 9.1 | |||
Other noncurrent obligations | 3.1 | |||
Total liabilities assumed | 49.9 | |||
Net assets acquired | $ | 123.3 | ||
(1) As a result of finalizing the acquisition accounting for Fibermark in the first quarter of 2016, an adjustment of $0.4 million was recorded as a reduction to the net deferred tax liability and to goodwill.
The Company estimated the fair value of the assets and liabilities acquired in accordance with ASC Topic 820, Fair Value Measurements and Disclosures ("ASC Topic 820"). The fair value of amortizable and non-amortizable intangible assets was estimated by applying a royalty rate to projected revenue, net of tax impacts and adjusted for present value considerations. The Company estimated the fair value of acquired property, plant and equipment using a combination of cost and market approaches. In general, the fair value of other acquired assets and liabilities was estimated using the cost basis of FiberMark.
F-14
NEENAH PAPER INC. AND SUBSIDIARIES
NOTES TO CONSOLIDATED FINANCIAL STATEMENTS (Continued)
(Dollars in millions, except as noted)
The excess of the purchase price over the estimated fair value of the tangible net assets and identifiable intangible assets acquired was recorded as acquired goodwill. The factors contributing to the amount of goodwill recognized are based on several strategic and synergistic benefits that are expected to be realized from the acquisition of FiberMark. These benefits include entry into profitable new markets for premium packaging, performance materials and specialty papers with new capabilities and recognized brands, synergies from combining the business with Neenah's existing infrastructure, and the opportunity to accelerate sales growth in areas like premium packaging. None of the goodwill recognized as part of the FiberMark acquisition will be deductible for income tax purposes. However, the Company did acquire all of the tax attributes associated with the FiberMark assets and liabilities, including an insignificant amount of tax deductible goodwill.
Approximately $18.9 million, $6.2 million and $0.4 million of the goodwill acquired in the FiberMark acquisition was allocated to the Technical Products, Fine Paper and Packaging and Other segments, respectively.
For the year ended December 31, 2016, the Company incurred $4.3 million of integration and restructuring costs. For the year ended December 31, 2015, the Company incurred $5.3 million of acquisition and integration costs. For the year ended December 31, 2015, net sales and income from operations before income taxes for the acquired businesses were $58.1 million and $1.5 million (excluding the acquisition related costs described above), respectively.
In conjunction with the FiberMark acquisition, the Company identified various uncertain tax positions totaling $4.7 million. Such amount was reflected in the purchase price allocation as $3.7 million of goodwill and $1.0 million of other current assets.
The following selected unaudited pro forma consolidated statements of operations data for the year ended December 31, 2015 and 2014 was prepared as though the FiberMark acquisition had occurred on January 1, 2014. The information does not reflect future events that may occur after December 31, 2015 or any operating efficiencies or inefficiencies that may result from the FiberMark acquisition. Therefore, the information is not necessarily indicative of results that would have been achieved had the businesses been combined during the periods presented or the results that the Company will experience going forward.
Year Ended December 31, | ||||||||
2015 | 2014 | |||||||
Net sales | $ | 984.0 | $ | 1,003.8 | ||||
Operating income | 103.7 | 95.6 | ||||||
Income from continuing operations | 61.7 | 72.8 | ||||||
Income (loss) from discontinued operations | (9.4 | ) | 0.7 | |||||
Net income | 52.3 | 73.5 | ||||||
Earnings (Loss) Per Common Share | ||||||||
Basic | ||||||||
Continuing operations | $ | 3.65 | $ | 4.34 | ||||
Discontinued Operations | (0.56 | ) | 0.04 | |||||
$ | 3.09 | $ | 4.38 | |||||
Diluted | ||||||||
Continuing operations | $ | 3.60 | $ | 4.27 | ||||
Discontinued Operations | (0.55 | ) | 0.04 | |||||
$ | 3.05 | $ | 4.31 | |||||
Acquisition of Crane Technical Materials
On July 1, 2014, the Company purchased all of the outstanding equity of the Crane Technical Materials business for approximately $72 million. The acquired business provides performance-oriented wet laid nonwoven media for filtration end markets as well as environmental, energy and industrial uses. The results of this business are reported in the Technical Products segment from the date of acquisition.
F-15
NEENAH PAPER INC. AND SUBSIDIARIES
NOTES TO CONSOLIDATED FINANCIAL STATEMENTS (Continued)
(Dollars in millions, except as noted)
The Company accounted for the transaction using the acquisition method in accordance with ASC Topic 805. The allocation of the purchase price is based on estimates of the fair value of assets acquired and liabilities assumed as of July 1, 2014. The Company did not identify any material unrecorded pre-acquisition contingencies. The Company did not acquire any in-process research and development assets as part of the acquisition.
The excess of the purchase price over the estimated fair value of the tangible net assets and identifiable intangible assets acquired was recorded as acquired goodwill. The factors contributing to the amount of goodwill recognized are based on several long-term strategic benefits that are expected to be realized from the acquisition of the technical materials business. These benefits include entry into growing and profitable global markets for water filtration, environmental/emissions control, and energy management with defensible technologies and brands, and the opportunity to accelerate sales growth through synergies with the Company's existing European-based filtration business. In addition, the acquisition of brands and complementary offerings facilitates the Company's expansion into non-woven product lines containing fiberglass, polymer fibers and carbon fibers. Substantially all of the acquired goodwill will be deductible for income tax purposes and is entirely allocated to the Technical Products segment.
For the year ended December 31, 2014, the Company incurred $1.0 million of acquisition-related integration costs. In addition, the Company incurred approximately $1.1 in capital costs for IT systems and infrastructure projects. For the year ended December 31, 2014, net sales and income from operations before income taxes for the acquired technical materials business were $24.1 million and $3.1 million (excluding the acquisition related integration costs described above), respectively.
The following selected unaudited pro forma consolidated statements of operations data for the year ended December 31, 2014 was prepared as though the acquisition of the technical materials business had occurred on January 1, 2013. The information does not reflect future events that may occur after December 31, 2014 or any operating efficiencies or inefficiencies that may result from the acquisition of the technical materials business. Therefore, the information is not necessarily indicative of results that would have been achieved had the businesses been combined during the periods presented or the results that the Company will experience going forward.
Year Ended December 31, | ||||
2014 | ||||
Net sales | $ | 862.3 | ||
Operating income | 89.2 | |||
Income from continuing operations | 69.6 | |||
Income from discontinued operations | 0.7 | |||
Net income | 70.3 | |||
Earnings Per Common Share | ||||
Basic | ||||
Continuing operations | $ | 4.15 | ||
Discontinued Operations | 0.04 | |||
$ | 4.19 | |||
Diluted | ||||
Continuing operations | $ | 4.08 | ||
Discontinued Operations | 0.04 | |||
$ | 4.12 | |||
Note 5. Goodwill and Other Intangible Assets
The Company follows the guidance of ASC Topic 805, Business Combinations ("ASC Topic 805"), in recording goodwill arising from a business combination as the excess of purchase price over the fair value of identifiable assets acquired and liabilities assumed.
F-16
NEENAH PAPER INC. AND SUBSIDIARIES
NOTES TO CONSOLIDATED FINANCIAL STATEMENTS (Continued)
(Dollars in millions, except as noted)
The Company tests goodwill for impairment at least annually on November 30 in conjunction with preparation of its annual business plan, or more frequently if events or circumstances indicate it might be impaired.
The Company tested goodwill for impairment as of November 30, 2016. The Company elected the option under ASC Topic 350, Intangibles — Goodwill and Other, to perform a qualitative assessment of the Company's reporting units to determine whether further impairment testing is necessary. In this qualitative assessment, the Company considered the following items for each of the reporting units: macroeconomic conditions, industry and market conditions, overall financial performance and other entity specific events. In addition, for each of these reporting units, the most recent fair value determination results in an amount that exceeds the carrying amount of the reporting units. Based on these assessments, the Company determined that the likelihood that a current fair value determination would be less than the current carrying amount of the reporting unit is not more likely than not. There was no impairment in the carrying value of goodwill for the years ended December 31, 2016, 2015 and 2014 .
Intangible assets with finite useful lives are amortized on a straight-line basis over their respective estimated useful lives to their estimated residual values, and reviewed for impairment in accordance with ASC Topic 360, Property, Plant, and Equipment. Intangible assets consist primarily of customer relationships, trade names and acquired intellectual property. Such intangible assets are amortized using the straight-line method over estimated useful lives of between 10 and 15 years. Certain trade names are estimated to have indefinite useful lives and as such are not amortized. Intangible assets with indefinite lives are reviewed for impairment at least annually.
The following table presents the carrying value of goodwill by business segment and changes in the carrying value of goodwill.
Technical Products | Fine Paper and Packaging | Other | ||||||||||||||||||||||
Gross Amount | Accumulated Impairment Losses | Gross Amount | ||||||||||||||||||||||
Net | Gross Amount | Net | ||||||||||||||||||||||
Balance at December 31, 2014 | $ | 100.8 | $ | (50.3 | ) | $ | 50.5 | $ | — | $ | — | $ | 50.5 | |||||||||||
Goodwill acquired in the Fibermark Acquisition | 18.9 | — | 18.9 | 6.2 | 0.4 | 25.5 | ||||||||||||||||||
Foreign currency translation | (9.0 | ) | 5.2 | (3.8 | ) | — | — | (3.8 | ) | |||||||||||||||
Balance at December 31, 2015 | 110.7 | (45.1 | ) | 65.6 | 6.2 | 0.4 | 72.2 | |||||||||||||||||
Adjustment of goodwill acquired in the Fibermark Acquisition (1) | (0.4 | ) | — | (0.4 | ) | — | — | (0.4 | ) | |||||||||||||||
Foreign currency translation | (2.9 | ) | 1.5 | (1.4 | ) | — | — | (1.4 | ) | |||||||||||||||
Balance at December 31, 2016 | $ | 107.4 | $ | (43.6 | ) | $ | 63.8 | $ | 6.2 | $ | 0.4 | $ | 70.4 | |||||||||||
______________________________________________________________________
(1) | As a result of finalizing the acquisition accounting for Fibermark in the first quarter of 2016, an adjustment of $0.4 million was recorded as a reduction to the net deferred tax liability and to goodwill. |
Other Intangible Assets
As of December 31, 2016, the Company had net identifiable intangible assets of $74.0 million. All such intangible assets were acquired in the acquisitions of Neenah Germany, Fox River, FiberMark and the Crane technical materials business, and the acquisition of the Wausau and Southworth brands. The following table details amounts related to those assets.
F-17
NEENAH PAPER INC. AND SUBSIDIARIES
NOTES TO CONSOLIDATED FINANCIAL STATEMENTS (Continued)
(Dollars in millions, except as noted)
December 31, 2016 | December 31, 2015 | |||||||||||||||
Gross Amount | Accumulated Amortization | Gross Amount | Accumulated Amortization | |||||||||||||
Amortizable intangible assets | ||||||||||||||||
Customer based intangibles | $ | 34.4 | $ | (11.1 | ) | $ | 35.5 | $ | (9.2 | ) | ||||||
Trade names and trademarks | 6.8 | (4.2 | ) | 4.4 | (1.8 | ) | ||||||||||
Acquired technology | 14.6 | (2.7 | ) | 16.0 | (1.4 | ) | ||||||||||
Total amortizable intangible assets | 55.8 | (18.0 | ) | 55.9 | (12.4 | ) | ||||||||||
Trade names | 36.2 | — | 35.6 | — | ||||||||||||
Total | $ | 92.0 | $ | (18.0 | ) | $ | 91.5 | $ | (12.4 | ) | ||||||
The following table presents intangible assets acquired in conjunction with the FiberMark acquisition:
Intangibles | Estimated Useful Lives (Years) | |||||
Intangible assets — definite lived | ||||||
Trade names and trademarks | $ | 2.3 | 15 | |||
Customer based intangibles | 14.1 | 15 | ||||
Acquired technology | 8.7 | 13 | ||||
Total | 25.1 | |||||
Non-amortizable trade names | 1.8 | |||||
Total intangible assets | $ | 26.9 | ||||
As of December 31, 2015, $49.8 million, $28.3 million and $1.0 million of such intangible assets are reported within the Technical Products, Fine Paper and Packaging and Other segments, respectively. See Note 14, "Business Segment and Geographic Information." Aggregate amortization expense of acquired intangible assets for the years ended December 31, 2016, 2015 and 2014 was $3.9 million, $2.9 million and $2.3 million, respectively and was reported in Cost of products sold on the Consolidated Statement of Operations. Estimated amortization expense for the years ended December 31, 2017, 2018, 2019, 2020 and 2021 is $3.6 million, $3.6 million, $3.6 million, $3.6 million and $3.3 million, respectively.
Note 6. Income Taxes
The Company accounts for income taxes in accordance with ASC Topic 740, Income Taxes. Income tax expense represented 28.7 percent, 32.7 percent and 9.9 percent of income from continuing operations before income taxes for the years ended December 31, 2016, 2015 and 2014, respectively. The following table presents the principal reasons for the difference between the Company's effective income tax rate and the U.S. federal statutory income tax rate:
F-18
NEENAH PAPER INC. AND SUBSIDIARIES
NOTES TO CONSOLIDATED FINANCIAL STATEMENTS (Continued)
(Dollars in millions, except as noted)
Year Ended December 31, | |||||||||||||||||||||
2016 | 2016 | 2015 | 2015 | 2014 | 2014 | ||||||||||||||||
U.S. federal statutory income tax rate | 35.0 | % | $ | 36.1 | 35.0 | % | $ | 31.5 | 35.0 | % | $ | 26.4 | |||||||||
U.S. state income taxes, net of federal income tax benefit | 1.9 | % | 2.0 | 2.1 | % | 1.9 | 2.1 | % | 1.6 | ||||||||||||
Tax on foreign dividends | 4.5 | % | 4.6 | 3.6 | % | 3.2 | 3.0 | % | 2.3 | ||||||||||||
Foreign tax rate differences (a) | (2.7 | )% | (2.8 | ) | (2.2 | )% | (2.0 | ) | (2.8 | )% | (2.1 | ) | |||||||||
Foreign financing structure (b) | (1.6 | )% | (1.7 | ) | (1.3 | )% | (1.2 | ) | (2.5 | )% | (1.9 | ) | |||||||||
Excess tax benefits from stock compensation (c) | (3.0 | )% | (3.1 | ) | — | — | — | — | |||||||||||||
Research and development and other tax credits (d) | (2.8 | )% | (2.9 | ) | (3.9 | )% | (3.5 | ) | (31.9 | )% | (24.1 | ) | |||||||||
Domestic production activities deduction | (1.5 | )% | (1.5 | ) | (2.2 | )% | (2.0 | ) | — | % | — | ||||||||||
Uncertain income tax positions | (0.4 | )% | (0.4 | ) | 1.3 | % | 1.2 | 6.5 | % | 4.9 | |||||||||||
Other differences — net | (0.7 | )% | (0.7 | ) | 0.3 | % | 0.3 | 0.5 | % | 0.4 | |||||||||||
Effective income tax rate | 28.7 | % | $ | 29.6 | 32.7 | % | $ | 29.4 | 9.9 | % | $ | 7.5 | |||||||||
(a) | Represents the impact on the Company's effective tax rate due to changes in the mix of earnings among taxing jurisdictions with differing statutory rates. |
(b) | Represents the impact on the Company's effective tax rate of the Company's financing strategies. |
(c) | In 2016, the Company adopted ASU 2016-09, Compensation — Stock Compensation (Topic 718). See Note 2, "Summary of Significant Accounting Policies — Recently Adopted Accounting Standards." |
(d) | For 2015, the Company recognized a $1.4 million benefit related to research and development ("R&D") tax credits of FiberMark for the period 2012 through July 2015. For 2014, following an extensive study of the Company's R&D activities for the years 2005 through 2013 and a change in methodology, the Company recognized a $21.9 million net benefit related to R&D tax credits. |
The Company's effective income tax rate can be affected by many factors, including but not limited to, changes in the mix of earnings in taxing jurisdictions with differing statutory rates, the availability of R&D and other tax credits, changes in corporate structure as a result of business acquisitions and dispositions, changes in the valuation of deferred tax assets and liabilities, the results of audit examinations of previously filed tax returns and changes in tax laws. The Company or one of its subsidiaries files income tax returns in the U.S. federal jurisdiction, various U.S. state jurisdictions and foreign jurisdictions. The Company is no longer subject to U.S. federal examination for years before 2013, to state and local examinations for years before 2012 and to non-U.S. income tax examinations for years before 2012.
The following table presents the U.S. and foreign components of income from continuing operations before income taxes:
Year Ended December 31, | ||||||||||||
2016 | 2015 | 2014 | ||||||||||
Income from continuing operations before income taxes: | ||||||||||||
U.S. | $ | 68.3 | $ | 62.2 | $ | 46.5 | ||||||
Foreign | 34.7 | 27.7 | 29.0 | |||||||||
Total | $ | 103.0 | $ | 89.9 | $ | 75.5 | ||||||
The following table presents the components of the provision (benefit) for income taxes:
F-19
NEENAH PAPER INC. AND SUBSIDIARIES
NOTES TO CONSOLIDATED FINANCIAL STATEMENTS (Continued)
(Dollars in millions, except as noted)
Year Ended December 31, | ||||||||||||
2016 | 2015 | 2014 | ||||||||||
Provision (benefit) for income taxes: | ||||||||||||
Current: | ||||||||||||
Federal | $ | 7.1 | $ | 12.7 | $ | 0.5 | ||||||
State | (0.5 | ) | 1.3 | — | ||||||||
Foreign | 5.9 | 5.1 | 3.4 | |||||||||
Total current tax provision | 12.5 | 19.1 | 3.9 | |||||||||
Deferred: | ||||||||||||
Federal | 14.8 | 7.7 | 6.9 | |||||||||
State | 1.8 | 2.3 | (5.9 | ) | ||||||||
Foreign | 0.5 | 0.3 | 2.6 | |||||||||
Total deferred tax provision | 17.1 | 10.3 | 3.6 | |||||||||
Total provision for income taxes | $ | 29.6 | $ | 29.4 | $ | 7.5 | ||||||
The Company has elected to treat its Canadian operations as a branch for U.S. income tax purposes. Therefore, the amount of income (loss) before income taxes from Canadian operations are included in the Company's consolidated U.S. income tax returns and such amounts are subject to U.S. income taxes.
The asset and liability approach is used to recognize deferred tax assets and liabilities for the expected future tax consequences of temporary differences between the carrying amounts and the tax basis of assets and liabilities. The components of deferred tax assets and liabilities, net of reserves for uncertain tax positions and valuation allowances, are as follows:
December 31, | ||||||||
2016 | 2015 | |||||||
Net deferred income tax assets | ||||||||
Employee benefits | $ | 26.0 | $ | 27.8 | ||||
Research and development tax credits | 15.0 | 20.9 | ||||||
Net operating losses and credits | 10.5 | 10.7 | ||||||
Accrued liabilities | 3.2 | 2.9 | ||||||
Inventories | (0.5 | ) | 1.3 | |||||
Accelerated depreciation | (34.0 | ) | (34.8 | ) | ||||
Intangibles | (10.8 | ) | (10.2 | ) | ||||
Undistributed foreign earnings | (4.4 | ) | — | |||||
Other | 1.1 | 1.4 | ||||||
Net deferred income tax assets | $ | 6.1 | $ | 20.0 | ||||
Net deferred income tax liabilities | ||||||||
Accelerated depreciation | $ | 12.3 | $ | 12.8 | ||||
Intangibles | 2.8 | 3.5 | ||||||
Employee benefits | (5.0 | ) | (3.9 | ) | ||||
Interest limitation | 0.3 | (0.5 | ) | |||||
Net operating losses | (0.3 | ) | (0.1 | ) | ||||
Net deferred income tax liabilities | $ | 10.1 | $ | 11.8 | ||||
F-20
NEENAH PAPER INC. AND SUBSIDIARIES
NOTES TO CONSOLIDATED FINANCIAL STATEMENTS (Continued)
(Dollars in millions, except as noted)
The net deferred tax assets relate to U.S. federal and state jurisdictions and the net deferred tax liabilities relate to operations of Germany and the U.K. As of December 31, 2016, the Company had $12.5 million of undistributed earnings (net of foreign taxes) of foreign subsidiaries. There were no undistributed earnings of foreign subsidiaries as of December 31, 2015.
As of December 31, 2016, the Company had $25.2 million of U.S. federal and state R&D credits which, if not used, will expire between 2029 and 2036 for the U.S. federal R&D credits and between 2017 and 2031 for the state R&D credits. As of December 31, 2016, we had $48.8 million of state NOLs which may be used to offset state taxable income. The NOLs are reflected in the consolidated financial statements as a deferred tax asset of $2.3 million. If not used, substantially all of the NOLs will expire in various amounts between 2017 and 2035. The Company also had pre-acquisition and recognized built-in loss carryovers of $10.2 million, reflected as a deferred tax asset of $3.6 million. In addition, the Company had $3.4 million of federal Alternative Minimum Tax Credit carryovers, which can be carried forward indefinitely.
The following is a tabular reconciliation of the total amounts of uncertain tax positions as of and for the years ended December 31, 2016, 2015 and 2014:
For the Years Ended December 31, | ||||||||||||
2016 | 2015 | 2014 | ||||||||||
Balance at January 1, | $ | 12.9 | $ | 7.0 | $ | 4.3 | ||||||
Increases in prior period tax positions | — | 0.5 | — | |||||||||
Decreases in prior period tax positions | (2.6 | ) | — | (2.2 | ) | |||||||
Increases in current period tax positions | 0.6 | 5.5 | 5.3 | |||||||||
Decreases due to lapse of statute of limitations | (0.3 | ) | — | — | ||||||||
Decreases due to settlements with tax authorities | — | — | (0.2 | ) | ||||||||
Decreases from foreign exchange rate changes | (0.3 | ) | (0.1 | ) | (0.2 | ) | ||||||
Balance at December 31, | $ | 10.3 | $ | 12.9 | $ | 7.0 | ||||||
The $10.3 million of reserves for uncertain tax positions as of December 31, 2016 were reflected on the consolidated balance sheets as follows: $7.6 million netted against deferred tax assets, $1.2 million netted against (added to) deferred tax liabilities and $1.5 million in other noncurrent obligations. The $12.9 million of reserves for uncertain tax positions as of December 31, 2015 were reflected on the consolidated balance sheets as follows: $8.9 million netted against deferred tax assets, $1.2 million netted against (added to) deferred tax liabilities and $2.8 million in other noncurrent obligations.
If recognized, $9.3 million of the benefit for uncertain tax positions at December 31, 2016 would favorably affect the Company's effective tax rate in future periods. The Company does not expect that the expiration of the statute of limitations or the settlement of audits in the next 12 months will result in liabilities for uncertain income tax positions that are materially different than the amounts that were accrued as of December 31, 2016.
The Company recognizes accrued interest and penalties related to uncertain income tax positions in the Provision for income taxes on the consolidated statements of operations. As of December 31, 2016 and 2015, the Company had $0.2 million and $0.4 million, respectively, accrued for interest and penalties related to uncertain income tax positions.
As of December 31, 2016, the Company had a valuation allowance of $3.1 million against its state R&D credits and $0.4 million against its other state tax credits. As of December 31, 2015, the Company had a valuation allowance of $2.9 million against its state R&D credits and $0.1 million against its state NOLs. In determining the need for a valuation allowance, the Company considers many factors, including specific taxing jurisdictions, sources of taxable income, income tax strategies and forecasted earnings for the entities in each jurisdiction. A valuation allowance is recognized if, based on the weight of available evidence, the Company concludes that it is more likely than not that some portion or all of the deferred income tax asset will not be realized.
F-21
NEENAH PAPER INC. AND SUBSIDIARIES
NOTES TO CONSOLIDATED FINANCIAL STATEMENTS (Continued)
(Dollars in millions, except as noted)
Note 7. Debt
Long-term debt consisted of the following:
December 31, | ||||||||
2016 | 2015 | |||||||
2021 Senior Notes (5.25% fixed rate) due May 2021 | $ | 175.0 | $ | 175.0 | ||||
Global Revolving Credit Facilities (variable rates) due December 2019 | 42.9 | 51.1 | ||||||
Second German Loan Agreement (2.45% fixed rate) due in 32 equal quarterly installments ending September 2022 | 6.8 | 8.3 | ||||||
Deferred financing costs | (3.8 | ) | (5.0 | ) | ||||
Total Debt | 220.9 | 229.4 | ||||||
Less: Debt payable within one year | 1.2 | 1.2 | ||||||
Long-term debt | $ | 219.7 | $ | 228.2 | ||||
Unsecured Senior Notes
2021 Senior Notes
In May 2013, the Company completed an underwritten offering of eight-year senior unsecured notes (the "2021 Senior Notes") at a face amount of $175 million. The 2021 Senior Notes bear interest at a rate of 5.25%, payable in arrears on May 15 and November 15 of each year, commencing on November 15, 2013, and mature on May 15, 2021. Proceeds from this offering were used to redeem the remaining $70 million outstanding principal amount of ten-year 7.375% senior unsecured notes, originally issued on November 30, 2004, to repay approximately $56 million in outstanding revolving credit agreement borrowings and for general corporate purposes. The 2021 Senior Notes are fully and unconditionally guaranteed by substantially all of the Company's domestic subsidiaries (the "Guarantors"). The 2021 Senior Notes were sold in a private placement transaction, have not been registered under the Securities Act of 1933, as amended, and may not be offered or sold absent registration or an applicable exemption from registration requirements.
The 2021 Senior Notes rank equally in right of payment with all the Company's existing and future senior unsecured indebtedness. The guarantees of the 2021 Senior Notes are senior unsecured obligations of the Guarantors and rank equally in right of payment with all existing and future senior unsecured indebtedness of the Guarantors. The 2021 Senior Notes and the guarantees of the 2021 Senior Notes are effectively subordinated to the Company's and the Guarantors' existing and future secured indebtedness (to the extent of the value of the collateral) and are structurally subordinated to all indebtedness and other obligations of the Company's subsidiaries that do not guarantee the 2021 Senior Notes, including the trade creditors of such non-guarantor subsidiaries.
The 2021 Senior Notes contain terms, covenants and events of default with which the Company must comply, which the Company believes are ordinary and standard for notes of this nature. Among other things, the 2021 Senior Notes contain covenants restricting the Company's ability to incur certain additional debt, make specified restricted payments, pay dividends, authorize or issue capital stock, enter into transactions with the Company's affiliates, consolidate or merge with or acquire another business, sell certain of the Company's assets or liquidate, dissolve or wind-up the Company. As of December 31, 2016, the Company was in compliance with all terms of the indenture for the 2021 Senior Notes.
Amended and Restated Secured Revolving Credit Facility
In December 2014, the Company amended and restated its existing credit facility by entering into the Third Amended and Restated Credit Agreement (the "Third Amended Credit Agreement") by and among the Company and certain of its domestic subsidiaries as the "Domestic Borrowers", Neenah Services GmbH & Co. KG ("Neenah Services") and certain of its German subsidiaries as the "German Borrowers", certain other subsidiaries as the "German Guarantors", the financial institutions signatory to the Third Amended Credit Agreement as lenders (the "Lenders"), and JPMorgan Chase Bank, N.A., as agent for the Lenders (the "Administrative Agent").
F-22
NEENAH PAPER INC. AND SUBSIDIARIES
NOTES TO CONSOLIDATED FINANCIAL STATEMENTS (Continued)
(Dollars in millions, except as noted)
The Third Amended Credit Agreement, among other things: (1) increased the maximum principal amount of the existing credit facility for the Domestic Borrowers to $125 million (the "U.S. Revolving Credit Facility"); (2) established a secured, multicurrency, revolving credit facility for the German Borrowers in the maximum principal amount of $75 million (the "German Revolving Credit Facility," and together with the U.S. Revolving Credit Facility, the "Global Revolving Credit Facilities"); (3) caused the Company and the other Domestic Borrowers to guarantee, among other things, the obligations of the German Borrowers arising under the German Revolving Credit Facility; (4) provides for the Global Revolving Credit Facilities to mature on December 18, 2019; and (5) provides for an accordion feature permitting one or more increases in the Global Revolving Credit Facilities in an aggregate principal amount not exceeding $50 million, such that the aggregate commitments under the Global Revolving Credit Facilities do not exceed $250 million. In addition, the Domestic Borrowers may request letters of credit under the U.S. Revolving Credit Facility in an aggregate face amount not to exceed $20 million outstanding at any time, and the German Borrowers may request letters of credit under the German Revolving Credit Facility in an aggregate face amount not to exceed $2 million outstanding at any time.
Proceeds of borrowings under the Global Revolving Credit Facilities may be used to finance working capital needs, permitted acquisitions, permitted investments (including certain inter-company loans), certain dividends, distributions and other restricted payments, and for other general corporate purposes.
The consolidated statements of cash flows present borrowings and repayments under the Global Revolving Credit Facilities and the predecessor revolving bank credit facility using a gross approach. This approach presents not only discrete borrowings for transactions such as a business acquisition, but also reflects all borrowings and repayments that occur as part of daily management of cash receipts and disbursements. For the year ended December 31, 2016, all of the borrowings related to daily cash management. For the year ended December 31, 2015, $38.0 million was borrowed in conjunction with the FiberMark Acquisition and the remaining $113.6 million included borrowings for daily cash management. For the year ended December 31, 2014, all of the borrowings related to daily cash management.
The right of the Domestic Borrowers to borrow and obtain letters of credit under the U.S. Revolving Credit Facility is subject to, among other things, the borrowing base of the Domestic Borrowers on a consolidated basis (the "Domestic Borrowing Base"). The right of the German Borrowers to borrow and obtain letters of credit under the German Revolving Credit Facility is similarly subject to a borrowing base requirement (the "German Borrowing Base"). The German Borrowing Base is initially determined on a combined basis for all German Borrowers. Under certain circumstances (including the occurrence of an event of default resulting from an act or omission of any German Borrower or German Guarantor), the Administrative Agent may require the German Borrowing Base to be determined separately for each of the German Borrowers. At its option the Company may, from time to time, allocate a portion of the Domestic Borrowing Base to the German Borrowing Base (resulting in a corresponding reduction of the Domestic Borrowing Base); however, the principal amount of borrowings and the outstanding letter of credit exposure under the German Revolving Credit Facility may not at any time exceed the German Revolving Credit Facility commitment amount then in effect.
The guarantees of the German Guarantors are limited solely to the German Revolving Credit Facility obligations. Under the terms of the Third Amended Credit Agreement and related loan documentation, neither the German Borrowers nor the German Guarantors (collectively, the "German Loan Parties") will be liable for any obligations relating to the U.S. Revolving Credit Facility. The Global Revolving Credit Facilities are secured by liens on all or substantially all of the assets of the Domestic Borrowers. The German Revolving Credit Facility is secured by liens on all or substantially all of the assets of the German Borrowers and certain assets of the German Guarantors. Any liens granted by the German Loan Parties secure only the German Revolving Credit Facility obligations.
Terms, Covenants and Events of Default. In general, borrowings under the Global Revolving Credit Facilities will bear interest at LIBOR (which cannot be less than zero percent) plus an applicable margin ranging from 1.50% to 2.00%, depending on the amount of availability under the Third Amended Credit Agreement. In addition, the Company may elect an Alternate Borrowing Rate ("ABR") for borrowings under the Global Revolving Credit Facilities. ABR borrowings under the Global Revolving Credit Facilities will bear interest at the highest interest rate shown in the following table:
F-23
NEENAH PAPER INC. AND SUBSIDIARIES
NOTES TO CONSOLIDATED FINANCIAL STATEMENTS (Continued)
(Dollars in millions, except as noted)
Applicable Margin | ||||
U.S. Revolving Credit Facility | German Revolving Credit Facility | |||
Prime rate | 0.00%-0.50% | Not applicable | ||
Federal funds rate +0.50% | 0.00%-0.50% | Not applicable | ||
Monthly LIBOR (which cannot be less than zero percent) +1.00% | 0.00%-0.50% | Not applicable | ||
Overnight LIBOR (which cannot be less than zero percent) | Not applicable | 1.50%-2.00% | ||
The Company is also required to pay a monthly commitment fee on the unused amounts available under the Global Revolving Credit Facilities at a per annum rate of 0.25%.
If aggregate availability under the Global Revolving Credit Facilities is less than the greater of (i) $20 million and (ii) 10% of the maximum aggregate commitments under the Global Revolving Credit Facilities as then in effect, the Company is required to comply with a fixed charge coverage ratio (as defined in the Third Amended Credit Agreement) of not less than 1.1 to 1.0 for the preceding four-quarter period, tested as of the end of each quarter. Such compliance, once required, would no longer be necessary once (x) aggregate availability under the Global Revolving Credit Facilities exceeds the greater of (i) 17.5% of the aggregate commitment for the Global Revolving Credit Facilities and (ii) $35 million for 60 consecutive days and (y) no default or event of default has occurred and is continuing during such 60-day period. As of December 31, 2016, aggregate availability under the Global Revolving Credit Facilities exceeded the minimum required amount, and the Company is not required to comply with such fixed charge coverage ratio.
The Third Amended Credit Agreement contains covenants, which the Company believes are ordinary and standard for agreements of this nature, with which the Company and its subsidiaries must comply during the term of the agreement. Among other things, such covenants restrict the ability of the Company and its subsidiaries to incur certain debt, incur or create certain liens, make specified restricted payments, authorize or issue capital stock, enter into transactions with their affiliates, consolidate, merge with or acquire another business, sell certain of their assets, or dissolve or wind up. In addition, if the aggregate availability under the Global Revolving Credit Facilities is less than the greater of (i) $25 million and (ii) 12.5% of the maximum aggregate commitments under the Global Revolving Credit Facilities as then in effect, the Company will be subject to increased reporting obligations and controls until such time as availability is more than the greater of (a) $35 million and (b) 17.5% of the maximum aggregate commitments under the Global Revolving Credit Facilities as then in effect.
Under the most restrictive terms of the Third Amended and Restated Credit Agreement, we are permitted to pay cash dividends on or repurchase shares of our common stock up to the amount available under the Third Amended and Restated Credit Agreement, as long as the availability under the Third Amended and Restated Credit Agreement exceeds $25 million. If the availability is below $25 million, we are restricted from paying dividends or repurchasing shares. As of December 31, 2016, the Company's availability exceeded $25 million, so this restriction did not apply.
The Third Amended Credit Agreement also contains events of default customary for financings of this type, including failure to pay principal or interest, materially false representations or warranties, failure to observe covenants and certain other terms of the Third Amended Credit Agreement, cross-defaults to certain other indebtedness, bankruptcy, insolvency, various ERISA and foreign pension violations, the incurrence of material judgments and changes in control.
Availability under the Global Revolving Credit Facilities varies over time depending on the value of the Company's inventory, receivables and various capital assets. As of December 31, 2016, the Company had $42.9 million of borrowings and $1.2 million in letters of credit outstanding under the Global Revolving Credit Facilities and $125.2 million of available credit (based on exchanges rates at December 31, 2016). As of December 31, 2016 and 2015, the weighted-average interest rate on outstanding Revolver borrowings was 2.8 percent and 1.8 percent per annum, respectively.
Under the most restrictive terms of the 2021 Senior Notes, the Company is permitted to pay cash dividends of up to $25 million in a calendar year, but not permitted to repurchase shares of the Company's common stock. However, as long as the net leverage ratio (net debt/EBITDA) under the 2021 Senior Notes is below 2.5x, the Company can pay dividends or repurchase shares without limitation. In the event the net leverage ratio exceeds 2.5x, the Company may still pay dividends in excess of $25 million or repurchase shares by utilizing "restricted payment baskets" as defined in the indenture for the 2021 Senior Notes.
F-24
NEENAH PAPER INC. AND SUBSIDIARIES
NOTES TO CONSOLIDATED FINANCIAL STATEMENTS (Continued)
(Dollars in millions, except as noted)
As of December 31, 2016, since the Company's leverage ratio was less than 2.5x, none of these covenants were restrictive to the Company's ability to pay dividends on or repurchase shares of the Company's common stock.
Other Debt
In January 2013, Neenah Germany entered into a project financing agreement for the construction of a melt blown machine (the "Second German Loan Agreement"). The agreement provides for €9.0 million of construction financing which is secured by the melt blown machine. The loan matures in September 2022 and principal is repaid in equal quarterly installments beginning in December 2014. The interest rate on amounts outstanding is 2.45% based on actual days elapsed in a 360-day year and is payable quarterly. At December 31, 2016, €6.5 million ($6.8 million, based on exchange rates at December 31, 2016) was outstanding under the Second German Loan Agreement.
Principal Payments
The following table presents the Company's required debt payments:
2017 | 2018 | 2019 | 2020 | 2021 | Thereafter | Total | ||||||||||||||||||||||
Debt payments | $ | 1.2 | $ | 1.2 | $ | 44.1 | $ | 1.2 | $ | 176.2 | $ | 0.8 | $ | 224.7 | ||||||||||||||
Note 8. Pension and Other Postretirement Benefits
Pension Plans
Except as described below for FiberMark, substantially all active employees of the Company's U.S. operations participate in defined benefit pension plans and/or defined contribution retirement plans. Neenah Germany has defined benefit plans designed to provide a monthly pension upon retirement for substantially all its employees in Germany. In addition, the Company maintains a SERP which is a non-qualified defined benefit plan. The Company provides benefits under the SERP to the extent necessary to fulfill the intent of its defined benefit retirement plans without regard to the limitations set by the Internal Revenue Code on qualified defined benefit plans.
During 2016, the Company offered a lump sum payout option to all eligible U.S. participants in the Neenah Paper Pension Plan and the FiberMark Pension Plan with a deferred vested pension benefit (the participant had a vested pension benefit but was no longer an employee of the Company). For the year ended December 31, 2016, 265 individuals elected the option and the Company paid a total of $8.1 million in lump-sum payments. For the year ended December 31, 2016, as allowed under ASC Topic 715, Compensation — Retirement Benefits ("ASC Topic 715"), the Company adopted a policy to recognize settlement losses for deferred vested pension benefit payments regardless of whether the amount exceeded the sum of expected service cost and interest costs of the pension plan for the respective calendar year. In accordance with ASC Topic 715, for the year ended December 31, 2016, the Company measured the liabilities of the post-retirement benefit plans and recognized a settlement loss of $0.8 million.
During 2014, the Company offered a lump sum payout option to all eligible U.S. participants in the Neenah Paper Pension Plan with a deferred vested pension benefit (the participant had a vested pension benefit but was no longer an employee of the Company). For the year ended December 31, 2014, 425 individuals elected the option and the Company paid a total of $14.0 million in lump-sum payments. For the year ended December 31, 2014, benefit payments under certain post-retirement benefit plans exceeded the sum of expected service cost and interest costs for these plans. In accordance with ASC Topic 715, for the year ended December 31, 2014, the Company measured the liabilities of the post-retirement benefit plans and recognized a settlement loss of $3.5 million.
The Company's funding policy for its U.S. qualified defined benefit plan and its U.K. defined benefit plan is to contribute assets to fully fund the projected benefit obligation. Subject to regulatory and tax deductibility limits, any funding shortfall is to be eliminated over a reasonable number of years. Nonqualified plans providing pension benefits in excess of limitations imposed by taxing authorities are not funded. There is no legal or governmental obligation to fund Neenah Germany's benefit plans and as such the Neenah Germany defined benefit plans are currently unfunded. As of December 31, 2016, Neenah Germany had investments of $1.6 million that were restricted to the payment of certain post-retirement employee benefits. As of December 31, 2016, $0.6 million and $1.0 million of such investments are classified as Prepaid and other current assets and Other assets, respectively, on the consolidated balance sheet. The Company also holds $3.5 million of marketable securities that
F-25
NEENAH PAPER INC. AND SUBSIDIARIES
NOTES TO CONSOLIDATED FINANCIAL STATEMENTS (Continued)
(Dollars in millions, except as noted)
are designated for the payment of benefits under the SERP as of December 31, 2016, classified as Other assets on the consolidated balance sheet.
The Company uses the fair value of pension plan assets to determine pension expense, rather than averaging gains and losses over a period of years. Investment gains or losses represent the difference between the expected return calculated using the fair value of the assets and the actual return based on the fair value of assets. The Company's pension obligations are measured annually as of December 31.
FiberMark
Defined benefit plans
FiberMark has a qualified defined benefit plan covering certain U.S. employees. During 2009, FiberMark fully froze this plan so that additional benefits cannot be earned as a result of additional years of service or increases in annual earnings. Plan assets are principally invested in equity, government and corporate debt securities and fixed income mutual funds. FiberMark has a defined benefit plan covering all U.K. employees, which is designed to provide a monthly pension upon retirement. This plan was fully frozen during 2011 and plan assets are primarily invested in equity mutual funds.
Multi-Employer plan
The hourly employees of the Lowville, New York facility are covered by a multi-employer defined benefit plan. The Company's expense under this plan was less than $0.1 million for the year ended December 31, 2016. The Company contributes to the multi-employer pension plan under a collective bargaining agreement which provides retirement benefits for certain union employees. The risks of participating in a multi-employer plan are different from single employer plans as assets contributed are available to provide benefits to employees of other employers and unfunded obligations from an employer that discontinues contributions are the responsibility of all remaining employers. In addition, in the event of a plan's termination or the Company's withdrawal from the plan, the Company may be liable for a portion of the plan's unfunded vested benefits. The Company does not anticipate withdrawing from the plan, nor is it aware of any expected plan terminations.
The most recent Pension Protection Act zone status available is for the plan's year-end at December 31, 2015. The zone status in the following table is based on information that the Company received from the plan and is certified by the plan's actuary. Among other factors, plans in the red zone are generally less than 65% funded, plans in the yellow zone are less than 80% funded, and plans in the green zone are at least 80% funded. Information for the multi-employer pension plan in which the Company participates is shown in the table below. The "FIP/RP Status Pending/Implemented" column indicates a financial improvement plan ("FIP") or a rehabilitation plan ("RP") is either pending or has been implemented for the plan. For the year ended December 31, 2015, FiberMark's contributions to the plan were less than 5% of total plan contributions.
Pension Fund | EIN/Pension Plan Number | Pension Zone Status 2015 | FIP/RP Status Pending or Implemented | Contributions 2016 | Surcharge Imposed | ExpirationDate of Collective Bargaining Agreement | |||||||
PACE Industry Union Management Pension Fund | 11-6166763 | Red | Implemented | $ | 0.1 | million | Yes | 11/9/2021 | |||||
Other Postretirement Benefit Plans
The Company maintains postretirement health care and life insurance benefit plans for active employees of the Company and former employees of the Canadian pulp operations. The plans are generally noncontributory for employees who were eligible to retire on or before December 31, 1992 and contributory for most employees who became eligible to retire on or after January 1, 1993. The Company does not provide a subsidized benefit to most employees hired after 2003.
The Company's obligations for postretirement benefits other than pensions are measured annually as of December 31. At December 31, 2016, the assumed inflationary health care cost trend rates used to determine obligations at December 31, 2016 and costs for the year ended December 31, 2017 is 7.0 percent gradually decreasing to an ultimate rate of 4.5 percent in 2037. The assumed inflationary health care cost trend rates used to determine obligations at December 31, 2015 and costs for the year ended December 31, 2016 were 7.3 percent gradually decreasing to an ultimate rate of 4.5 percent in 2037.
F-26
NEENAH PAPER INC. AND SUBSIDIARIES
NOTES TO CONSOLIDATED FINANCIAL STATEMENTS (Continued)
(Dollars in millions, except as noted)
The following table reconciles the benefit obligations, plan assets, funded status and net liability information of the Company's pension and other postretirement benefit plans.
Pension Benefits | Postretirement Benefits Other than Pensions | |||||||||||||||
Year Ended December 31, | ||||||||||||||||
2016 | 2015 | 2016 | 2015 | |||||||||||||
Change in Benefit Obligation: | ||||||||||||||||
Benefit obligation at beginning of year | $ | 360.1 | $ | 330.2 | $ | 40.5 | $40.7 | |||||||||
Service cost | 4.9 | 5.5 | 1.3 | 1.7 | ||||||||||||
Interest cost | 15.9 | 13.8 | 1.6 | 1.6 | ||||||||||||
Currency | (3.1 | ) | (4.0 | ) | 0.1 | (0.5 | ) | |||||||||
Actuarial (gain) loss | 18.2 | (18.8 | ) | (1.2 | ) | 1.5 | ||||||||||
Benefit payments from plans | (17.1 | ) | (14.9 | ) | (3.8 | ) | (4.0 | ) | ||||||||
Settlement payments | (8.1 | ) | — | — | — | |||||||||||
Net transfer in/(out) (1) | 0.1 | 48.3 | — | (0.5 | ) | |||||||||||
Other | — | — | 2.2 | — | ||||||||||||
Benefit obligation at end of year | $ | 370.9 | $ | 360.1 | $ | 40.7 | $ | 40.5 | ||||||||
Change in Plan Assets: | ||||||||||||||||
Fair value of plan assets at beginning of year | $ | 308.3 | $ | 288.3 | $ | — | $ | — | ||||||||
Actual gain (loss) on plan assets | 17.6 | (6.0 | ) | — | — | |||||||||||
Employer contributions | 17.8 | 1.0 | — | — | ||||||||||||
Currency | (1.7 | ) | (0.5 | ) | — | — | ||||||||||
Benefit payments | (15.8 | ) | (13.6 | ) | — | — | ||||||||||
Settlement payments | (8.1 | ) | — | — | — | |||||||||||
Net transfers in (1) | — | 39.1 | — | — | ||||||||||||
Fair value of plan assets at end of year | $ | 318.1 | $ | 308.3 | $ | — | $ | — | ||||||||
Reconciliation of Funded Status | ||||||||||||||||
Fair value of plan assets | $ | 318.1 | $ | 308.3 | $ | — | $ | — | ||||||||
Projected benefit obligation | 370.9 | 360.1 | 40.7 | 40.5 | ||||||||||||
Net liability recognized in statement of financial position | $ | (52.8 | ) | $ | (51.8 | ) | $ | (40.7 | ) | $ | (40.5 | ) | ||||
Amounts recognized in statement of financial position consist of: | ||||||||||||||||
Current liabilities | $ | (3.8 | ) | $ | (1.5 | ) | $ | (4.3 | ) | $ | (3.8 | ) | ||||
Noncurrent liabilities | (49.0 | ) | (50.3 | ) | (36.4 | ) | (36.7 | ) | ||||||||
Net amount recognized | $ | (52.8 | ) | $ | (51.8 | ) | $ | (40.7 | ) | $ | (40.5 | ) | ||||
_______________________
(1) | For the year ended December 31, 2015, the Company acquired $48.3 million of pension liabilities and $39.1 million of pension assets in conjunction with the FiberMark Acquisition. |
F-27
NEENAH PAPER INC. AND SUBSIDIARIES
NOTES TO CONSOLIDATED FINANCIAL STATEMENTS (Continued)
(Dollars in millions, except as noted)
Amounts recognized in accumulated other comprehensive income consist of:
Pension Benefits | Postretirement Benefits Other than Pensions | |||||||||||||||
December 31, | ||||||||||||||||
2016 | 2015 | 2016 | 2015 | |||||||||||||
Accumulated actuarial loss | $ | 95.8 | $ | 84.1 | $ | 4.9 | $ | 5.8 | ||||||||
Prior service cost | 0.9 | 1.2 | (0.4 | ) | (0.5 | ) | ||||||||||
Total recognized in accumulated other comprehensive income | $ | 96.7 | $ | 85.3 | $ | 4.5 | $ | 5.3 | ||||||||
Summary disaggregated information about the pension plans follows:
December 31, | ||||||||||||||||||||||||
Assets Exceed ABO | ABO Exceed Assets | Total | ||||||||||||||||||||||
2016 | 2015 | 2016 | 2015 | 2016 | 2015 | |||||||||||||||||||
Projected benefit obligation | $ | 291.3 | $ | 280.1 | $ | 79.6 | $ | 80.0 | $ | 370.9 | $ | 360.1 | ||||||||||||
Accumulated benefit obligation | 281.5 | 269.1 | 79.4 | 79.8 | 360.9 | 348.9 | ||||||||||||||||||
Fair value of plan assets | 284.2 | 270.4 | 33.9 | 37.9 | 318.1 | 308.3 | ||||||||||||||||||
Components of Net Periodic Benefit Cost
Pension Benefits | Postretirement Benefits Other than Pensions | |||||||||||||||||||||||
Year Ended December 31, | ||||||||||||||||||||||||
2016 | 2015 | 2014 | 2016 | 2015 | 2014 | |||||||||||||||||||
Service cost | $ | 4.9 | $ | 5.5 | $ | 5.0 | $ | 1.3 | $ | 1.7 | $ | 1.7 | ||||||||||||
Interest cost | 15.9 | 13.8 | 14.5 | 1.6 | 1.6 | 1.9 | ||||||||||||||||||
Expected return on plan assets (a) | (18.9 | ) | (19.3 | ) | (16.7 | ) | — | — | — | |||||||||||||||
Recognized net actuarial loss | 6.6 | 6.3 | 4.2 | 0.6 | 0.3 | 0.4 | ||||||||||||||||||
Amortization of prior service cost (credit) | 0.2 | 0.2 | 0.3 | (0.2 | ) | (0.2 | ) | (0.2 | ) | |||||||||||||||
Amount of settlement loss recognized | 0.8 | — | 3.5 | — | — | — | ||||||||||||||||||
Net periodic benefit cost (credit) | 9.5 | 6.5 | 10.8 | 3.3 | 3.4 | 3.8 | ||||||||||||||||||
Amounts related to discontinued operations | — | (14.9 | ) | 1.0 | — | — | — | |||||||||||||||||
Net periodic benefit cost | $ | 9.5 | $ | (8.4 | ) | $ | 11.8 | $ | 3.3 | $ | 3.4 | $ | 3.8 | |||||||||||
_______________________
(a) | The expected return on plan assets is determined by multiplying the fair value of plan assets at the prior year-end (adjusted for estimated current year cash benefit payments and contributions) by the expected long-term rate of return. |
F-28
NEENAH PAPER INC. AND SUBSIDIARIES
NOTES TO CONSOLIDATED FINANCIAL STATEMENTS (Continued)
(Dollars in millions, except as noted)
Other Changes in Plan Assets and Benefit Obligations Recognized in Other Comprehensive Income
Pension Benefits | Postretirement Benefits Other than Pensions | |||||||||||||||||||||||
Year Ended December 31, | ||||||||||||||||||||||||
2016 | 2015 | 2014 | 2016 | 2015 | 2014 | |||||||||||||||||||
Net periodic benefit expense | $ | 9.5 | $ | (8.4 | ) | $ | 11.8 | $ | 3.3 | $ | 3.4 | $ | 3.8 | |||||||||||
Accumulated actuarial gain (loss) | 11.7 | (7.1 | ) | 26.4 | (0.9 | ) | 1.1 | — | ||||||||||||||||
Prior service cost (credit) | (0.3 | ) | (0.3 | ) | (0.3 | ) | 0.1 | 0.2 | 0.2 | |||||||||||||||
Total recognized in other comprehensive income | 11.4 | (7.4 | ) | 26.1 | (0.8 | ) | 1.3 | 0.2 | ||||||||||||||||
Total recognized in net periodic benefit cost and other comprehensive income | $ | 20.9 | $ | (15.8 | ) | $ | 37.9 | $ | 2.5 | $ | 4.7 | $ | 4.0 | |||||||||||
The estimated net actuarial loss and prior service cost for the defined benefit pension plans expected to be amortized from accumulated other comprehensive income into net periodic benefit cost over the next fiscal year are $7.3 million and $0.2 million, respectively. The estimated net actuarial loss and prior service (credit) for postretirement benefits other than pensions expected to be amortized from accumulated other comprehensive income into net periodic benefit cost over the next fiscal year is $0.2 million and $(0.2) million, respectively.
Weighted-Average Assumptions Used to Determine Benefit Obligations at December 31
Pension Benefits | Postretirement Benefits Other than Pensions | |||||||||||
2016 | 2015 | 2016 | 2015 | |||||||||
Discount rate | 4.16 | % | 4.54 | % | 3.69 | % | 4.07 | % | ||||
Rate of compensation increase | 2.22 | % | 2.18 | % | — | % | — | % | ||||
Weighted-Average Assumptions Used to Determine Net Periodic Benefit Cost for Years Ended December 31
Pension Benefits | Postretirement Benefits Other than Pensions | |||||||||||||||||
Year Ended December 31, | ||||||||||||||||||
2016 | 2015 | 2014 | 2016 | 2015 | 2014 | |||||||||||||
Discount rate | 4.54 | % | 3.91 | % | 4.88 | % | 4.07 | % | 4.05 | % | 4.84 | % | ||||||
Expected long-term return on plan assets | 6.20 | % | 6.50 | % | 6.50 | % | — | % | — | % | — | % | ||||||
Rate of compensation increase | 2.18 | % | 2.92 | % | 2.96 | % | — | % | — | % | — | % | ||||||
Expected Long-Term Rate of Return and Investment Strategies
The expected long-term rate of return on pension fund assets held by the Company's pension trusts was determined based on several factors, including input from pension investment consultants and projected long-term returns of broad equity and bond indices. Also considered were the plans' historical 10-year and 15-year compounded annual returns. It is anticipated that, on average, actively managed U.S. pension plan assets will generate annual long-term rates of return of at least 6.20 percent. The
F-29
NEENAH PAPER INC. AND SUBSIDIARIES
NOTES TO CONSOLIDATED FINANCIAL STATEMENTS (Continued)
(Dollars in millions, except as noted)
expected long-term rate of return on the assets in the plans was based on an asset allocation assumption of approximately 43 percent with equity managers, with expected long-term rates of return of approximately 8 to 10 percent, and 57 percent with fixed income managers, with an expected long-term rate of return of about 4 to 6 percent. The actual asset allocation is regularly reviewed and periodically rebalanced to the targeted allocation when considered appropriate.
Plan Assets
Pension plan asset allocations are as follows:
Percentage of Plan Assets At December 31, | |||||||||
2016 | 2015 | 2014 | |||||||
Asset Category | |||||||||
Equity securities | 43 | % | 34 | % | 35 | % | |||
Debt securities | 57 | % | 64 | % | 65 | % | |||
Cash and money-market funds | — | % | 2 | % | — | % | |||
Total | 100 | % | 100 | % | 100 | % | |||
The Company's investment objective for pension plan assets are to ensure, over the long-term life of the pension plans, an adequate pool of assets to support the benefit obligations to participants, retirees, and beneficiaries. Specifically, these objectives include the desire to: (a) invest assets in a manner such that future assets are available to fund liabilities, (b) maintain liquidity sufficient to pay current benefits when due and (c) diversify, over time, among asset classes so assets earn a reasonable return with acceptable risk to capital.
The target investment allocation and permissible allocation range for plan assets by category are as follows:
Strategic Target | Permitted Range | ||||
Asset Category | |||||
Equity securities | 43 | % | 38-48% | ||
Debt securities / Fixed Income | 57 | % | 52-62% | ||
As of December 31, 2016, no company or group of companies in a single industry represented more than five percent of plan assets.
The Company's investment assumptions are established by an investment committee composed of members of senior management and are validated periodically against actual investment returns. As of December 31, 2016, the Company's investment assumptions are as follows:
(a) | The plan should be substantially fully invested in debt and equity securities at all times because substantial cash holdings will reduce long-term rates of return; |
(b) | Equity investments will provide greater long-term returns than fixed income investments, although with greater short-term volatility; |
(c) | It is prudent to diversify plan investments across major asset classes; |
(d) | Allocating a portion of plan assets to foreign equities will increase portfolio diversification, decrease portfolio risk and provide the potential for long-term returns; |
(e) | Investment managers with active mandates can reduce portfolio risk below market risk and potentially add value through security selection strategies, and a portion of plan assets should be allocated to such active mandates; |
(f) | A component of passive, indexed management can benefit the plans through greater diversification and lower cost, and a portion of the plan assets should be allocated to such passive mandates, and |
(g) | It is appropriate to retain more than one investment manager, given the size of the plans, provided that such managers offer asset class or style diversification. |
F-30
NEENAH PAPER INC. AND SUBSIDIARIES
NOTES TO CONSOLIDATED FINANCIAL STATEMENTS (Continued)
(Dollars in millions, except as noted)
For the years ended December 31, 2016, 2015 and 2014, no plan assets were invested in the Company's securities.
Cash Flows
At December 31, 2016, the Company expects to make aggregate contributions to qualified pension trusts and payments of pension benefits for unfunded pension plans in 2017 of approximately $14.0 million (based on exchange rates at December 31, 2016).
Future Benefit Payments
The following benefit payments, which reflect expected future service, as appropriate, are expected to be paid:
Pension Plans | Postretirement Benefits Other than Pensions | |||||||
2017 | $ | 20.7 | $ | 4.3 | ||||
2018 | 19.3 | 3.5 | ||||||
2019 | 22.1 | 3.8 | ||||||
2020 | 20.0 | 4.1 | ||||||
2021 | 21.4 | 4.1 | ||||||
Years 2022-2026 | 113.2 | 16.9 | ||||||
Health Care Cost Trends
Assumed health care cost trend rates affect the amounts reported for postretirement health care benefit plans. A one percentage-point change in assumed health care cost trend rates would have the following effects:
One Percentage- Point | ||||||||
Increase | Decrease | |||||||
Effect on total of service and interest cost components | $ | — | $ | — | ||||
Effect on post-retirement benefit other than pension obligation | 0.3 | (0.3 | ) | |||||
Defined Contribution Retirement Plans
Company contributions to defined contribution retirement plans are primarily based on the age and compensation of covered employees. Contributions to these plans, all of which were charged to expense, were $2.7 million in 2016, $2.5 million in 2015 and $1.9 million in 2014. In addition, the Company maintains a supplemental retirement contribution plan (the "SRCP") which is a non-qualified, unfunded defined contribution plan. The Company provides benefits under the SRCP to the extent necessary to fulfill the intent of its defined contribution retirement plans without regard to the limitations set by the Internal Revenue Code on qualified defined contribution plans. For the years ended December 31, 2016, 2015 and 2014, the Company recognized expense related to the SRCP of $0.4 million, $0.2 million and $0.1 million, respectively. At December 31, 2016 and December 31, 2015, the unfunded obligation of the SRCP was $1.3 million and $0.9 million, respectively.
Investment Plans
The Company provides voluntary contribution investment plans to substantially all North American employees. Under the plans, the Company matches a portion of employee contributions. For the years ended December 31, 2016, 2015 and 2014,
F-31
NEENAH PAPER INC. AND SUBSIDIARIES
NOTES TO CONSOLIDATED FINANCIAL STATEMENTS (Continued)
(Dollars in millions, except as noted)
costs charged to expense for Company matching contributions under these plans were $3.1 million, $2.7 million and $1.9 million, respectively.
Note 9. Stock Compensation Plans
The Company established the 2004 Omnibus Stock and Incentive Plan (the "2004 Omnibus Plan") in December 2004 and reserved 3,500,000 shares of $0.01 par value common stock ("Common Stock") for issuance under the Omnibus Plan. Pursuant to the terms of the 2004 Omnibus Plan, the compensation committee of the Company's Board of Directors may grant various types of equity-based compensation awards, including incentive and nonqualified stock options, SARs, restricted stock, RSUs, RSUs with performance conditions and performance units, in addition to certain cash-based awards. All grants under the Omnibus Plan will be made at fair market value and no grant may be repriced. In general, the options expire 10 years from the date of grant and vest over a 3-year service period.
At the 2013 Annual Meeting of Stockholders, the Company's stockholders approved an amendment and restatement of the 2004 Omnibus Plan (as amended and restated the "2013 Omnibus Plan"). The amendment and restatement authorized the Company to reserve an additional 1,577,000 shares of Common Stock for future issuance. As of December 31, 2016, the Company had 950,000 shares of Common Stock reserved for future issuance under the 2013 Omnibus Plan. As of December 31, 2016, the number of shares available for future issuance was reduced by approximately 17,000 shares for outstanding SARs where the closing market price for the Company's common stock was greater than the exercise price of the SAR. The Company accounts for stock-based compensation pursuant to the fair value recognition provisions of ASC Topic 718, Compensation — Stock Compensation ("ASC Topic 718").
Valuation and Expense Information Under ASC Topic 718
Substantially all stock-based compensation expense has been recorded in selling, general and administrative expenses. The following table summarizes stock-based compensation costs and related income tax benefits.
Year Ended December 31, | ||||||||||||
2016 | 2015 | 2014 | ||||||||||
Stock-based compensation expense | $ | 5.8 | $ | 6.5 | $ | 6.0 | ||||||
Income tax benefit | (2.2 | ) | (2.5 | ) | (2.3 | ) | ||||||
Stock-based compensation, net of income tax benefit | $ | 3.6 | $ | 4.0 | $ | 3.7 | ||||||
The following table summarizes total compensation costs related to the Company's equity awards and amounts recognized in the year ended December 31, 2016.
Stock Options | Performance Shares and RSUs | |||||||
Unrecognized compensation cost — December 31, 2015 | $ | 0.8 | $ | 1.6 | ||||
Grant date fair value current year grants | 1.5 | 4.2 | ||||||
Compensation expense recognized | (1.7 | ) | (4.1 | ) | ||||
Unrecognized compensation cost — December 31, 2016 | $ | 0.6 | $ | 1.7 | ||||
Expected amortization period (in years) | 1.7 | 1.5 | ||||||
Stock Options/SARs
In August 2014, the Compensation Committee of the Board of Directors approved the conversion of approximately 545,000 outstanding non-qualified stock options held by U.S. employees and U.S. non-employee directors to an equal number of SARs.
F-32
NEENAH PAPER INC. AND SUBSIDIARIES
NOTES TO CONSOLIDATED FINANCIAL STATEMENTS (Continued)
(Dollars in millions, except as noted)
Upon exercise, the holder of an SAR will receive common shares equal to the number of SARs exercised multiplied by a fraction where the numerator is equal to the market price at the time of exercise minus the exercise price of the SAR and the denominator is equal to the market price at the time of exercise. The SARs can only be settled for shares of Common Stock and the Company will not receive any cash proceeds upon exercise. All other contractual terms of the SARs are unchanged from those of the converted non-qualified stock options. At the date of conversion the fair value of the SARs was equal to the fair value of the stock options exchanged. As a result, the Company did not recognize any additional compensation expense due to the conversion.
The following tables present information regarding stock options awarded during the years ended December 31, 2016, 2015 and 2014.
2016 | 2015 | 2014 | ||||||||||
Nonqualified stock options granted | 113,935 | 87,930 | 95,670 | |||||||||
Per share weighted-average exercise price | $ | 58.03 | $ | 59.72 | $ | 43.17 | ||||||
Per share weighted-average grant date fair value | $ | 13.51 | $ | 16.47 | $ | 12.72 | ||||||
The weighted-average grant date fair value for stock options granted for the years ended December 31, 2016, 2015 and 2014 was estimated using the Black-Scholes option valuation model with the following assumptions:
2016 | 2015 | 2014 | |||||||
Expected term in years | 5.8 | 5.8 | 5.9 | ||||||
Risk free interest rate | 1.8 | % | 1.4 | % | 1.9 | % | |||
Volatility | 32.1 | % | 34.4 | % | 36.5 | % | |||
Dividend yield | 3.0 | % | 2.0 | % | 2.2 | % | |||
Expected volatility and the expected term were estimated by reference to the historical stock price performance of the Company and historical data for the Company's stock option awards, respectively. The risk-free interest rate was based on the yield on U.S. Treasury bonds with a remaining term approximately equal to the expected term of the stock option awards. Forfeitures were estimated at the date of grant.
During the year ended December 31, 2012, the Company awarded nonqualified stock options to its President and Chief Executive Officer to purchase 125,000 shares of Common Stock (subject to forfeiture due to termination of employment and other conditions). The exercise price of such nonqualified stock option awards was $24.09 per share and the options expire in ten years. As of December 31, 2016, 100 percent of the option award had been earned. The grant date fair value of such stock options was $9.55 per share and was estimated using a "Monte Carlo" simulation valuation model.
The following table summarizes stock option activity under the Omnibus Plan for the year ended December 31, 2016:
Number of Stock Options | Weighted-Average Exercise Price | ||||||
Options outstanding — December 31, 2015 | 526,611 | $ | 31.94 | ||||
Add: Options granted | 113,935 | $ | 58.03 | ||||
Less: Options exercised | 105,806 | $ | 27.29 | ||||
Less: Options forfeited/cancelled | 4,278 | $ | 46.89 | ||||
Options outstanding — December 31, 2016 | 530,462 | $ | 38.35 | ||||
The status of outstanding and exercisable stock options as of December 31, 2016, summarized by exercise price follows:
F-33
NEENAH PAPER INC. AND SUBSIDIARIES
NOTES TO CONSOLIDATED FINANCIAL STATEMENTS (Continued)
(Dollars in millions, except as noted)
Options Vested or Expected to Vest | Options Exercisable | |||||||||||||||||||||||
Exercise Price | Number of Options | Weighted- Average Remaining Contractual Life (Years) | Weighted- Average Exercise Price | Aggregate Intrinsic Value (a) | Number of Options | Weighted- Average Exercise Price | Aggregate Intrinsic Value (a) | |||||||||||||||||
$7.41 — $19.42 | 65,095 | 3.1 | $ | 13.15 | $ | 4.7 | 65,095 | $ | 13.15 | $ | 4.7 | |||||||||||||
$21.13 — $32.84 | 202,695 | 5.2 | $ | 25.67 | 12.1 | 202,695 | $ | 25.67 | 12.1 | |||||||||||||||
$32.87 — $42.82 | 66,550 | 6.4 | $ | 42.26 | 2.9 | 39,699 | $ | 41.88 | 1.7 | |||||||||||||||
$50.60 — $59.72 | 192,553 | 8.6 | $ | 58.45 | 5.2 | 28,847 | $ | 58.09 | 0.8 | |||||||||||||||
>$60.55 | 3,569 | 9.2 | $ | 60.56 | 0.1 | — | $ | 60.56 | — | |||||||||||||||
530,462 | 6.3 | $ | 38.35 | $ | 25.0 | 336,336 | $ | 27.94 | $ | 19.3 | ||||||||||||||
_______________________
(a) | Represents the total pre-tax intrinsic value as of December 31, 2016 that option holders would have received had they exercised their options as of such date. The pre-tax intrinsic value is based on the closing market price for the Company's common stock of $85.20 on December 31, 2016. |
The aggregate pre-tax intrinsic value of stock options exercised for the years ended December 31, 2016, 2015 and 2014 was $4.7 million, $5.5 million and $12.7 million, respectively.
The following table summarizes the status of the Company's unvested stock options as of December 31, 2016 and activity for the year then ended:
Number of Stock Options | Weighted-Average Grant Date Fair Value | ||||||
Outstanding — December 31, 2015 | 294,017 | $ | 12.09 | ||||
Add: Options granted | 113,935 | $ | 13.51 | ||||
Less: Options vested | 213,826 | $ | 10.07 | ||||
Outstanding — December 31, 2016 | 194,126 | $ | 15.15 | ||||
As of December 31, 2016, certain participants met age and service requirements that allowed their options to qualify for accelerated vesting upon retirement. As of December 31, 2016, there were approximately 114,000 stock options subject to accelerated vesting that such participants would have been eligible to exercise if they had retired as of such date. The aggregate grant date fair value of options subject to accelerated vesting was $1.6 million. For the year ended December 31, 2016, stock-based compensation expense for such options was $0.9 million. For the year ended December 31, 2016, the aggregate grant date fair value of options vested, including options subject to accelerated vesting, was $2.1 million. Stock options that reflect accelerated vesting for expense recognition become exercisable according to the contract terms of the stock option grant.
Performance Units/RSUs
For the year ended December 31, 2016, the Company granted target awards of 54,364 Performance Units. The measurement period for the Performance Units is January 1, 2016 through December 31, 2016. The Performance Units vest on December 31, 2018. Common Stock equal to not less than 40 percent and not more than 200 percent of the Performance Unit target will be awarded based on the Company's return on invested capital, consolidated revenue growth and total return to shareholders relative to the companies in the Russell 2000® Value small cap index. As of December 31, 2016, the Company expects that Common Stock equal to approximately 138 percent of the Performance Unit targets will be earned. The market price on the date of grant for the Performance Units was $57.95 per share. The Company is recognizing stock-based compensation expense pro-rata over the vesting term of the RSUs.
F-34
NEENAH PAPER INC. AND SUBSIDIARIES
NOTES TO CONSOLIDATED FINANCIAL STATEMENTS (Continued)
(Dollars in millions, except as noted)
For the year ended December 31, 2016, the Company awarded 8,083 RSUs to non-employee members of the Board of Directors and 1,652 RSUs (net of forfeitures) to employees. The weighted-average grant date fair value of such awards was $67.77 per share and the awards vest one year from the date of grant. During the vesting period, the holders of the RSUs are entitled to dividends, but the RSUs do not have voting rights and are forfeited in the event the holder is no longer an employee or member of the Board of Directors on the vesting date.
The following table summarizes the activity of the Company's unvested stock-based awards (other than stock options) for the years ended December 31, 2016, 2015 and 2014:
RSUs | Weighted-Average Grant Date Fair Value | Performance Units | Weighted-Average Grant Date Fair Value | |||||||||||
Outstanding — December 31, 2013 | 152,191 | $ | 24.36 | 77,000 | $ | 49.28 | ||||||||
Shares granted (a) | 11,492 | $ | 49.78 | 60,900 | $ | 74.79 | ||||||||
Shares vested | (150,270 | ) | $ | 22.60 | — | $ | — | |||||||
Performance Shares vested | 94,710 | $ | 29.15 | (77,000 | ) | $ | 35.85 | |||||||
Shares expired or cancelled | (2,829 | ) | $ | 29.15 | (2,630 | ) | $ | 74.79 | ||||||
Outstanding — December 31, 2014 | 105,294 | $ | 31.15 | 58,270 | $ | 74.79 | ||||||||
Shares granted (a) | 13,415 | $ | 61.41 | 45,060 | $ | 78.32 | ||||||||
Shares vested | (105,564 | ) | $ | 32.12 | (810 | ) | $ | 78.32 | ||||||
Performance Shares vested | 107,219 | $ | 40.65 | (58,270 | ) | $ | 74.79 | |||||||
Shares expired or cancelled | (1,526 | ) | $ | 51.14 | (1,200 | ) | $ | 78.32 | ||||||
Outstanding — December 31, 2015 | 118,838 | $ | 43.29 | 43,050 | $ | 78.32 | ||||||||
Shares granted (a) | 10,047 | $ | 68.25 | 54,364 | $ | 73.82 | ||||||||
Shares vested | (110,749 | ) | $ | 42.96 | — | $ | — | |||||||
Performance Shares vested | 62,874 | $ | 53.63 | (43,050 | ) | $ | 78.32 | |||||||
Shares expired or cancelled | (291 | ) | $ | 40.65 | (858 | ) | $ | 75.98 | ||||||
Outstanding — December 31, 2016 (b) | 80,719 | $ | 54.91 | 53,506 | $ | 73.79 | ||||||||
______________________________________________________________________
(a) | For the years ended December 31, 2016, 2015 and 2014, includes 312 RSUs, 495 RSUs and 622 RSUs, respectively, that were granted in lieu of cash dividends. Such dividends-in-kind vest concurrently with the underlying RSUs. |
(b) | The aggregate pre-tax intrinsic value of outstanding RSUs as of December 31, 2016 was $6.9 million. |
The aggregate pre-tax intrinsic value of restricted stock and RSUs that vested for the years ended December 31, 2016, 2015 and 2014 was $9.3 million, $6.6 million and $8.9 million, respectively.
Excess Tax Benefits
Excess tax benefits represent the difference between the tax deduction the Company will receive on its tax return for compensation recognized by employees upon the vesting or exercise of stock-based awards and the tax benefit recognized for the grant date fair value of such awards. For the years ended December 31, 2016, 2015 and 2014, the Company recognized excess tax benefits related to the exercise or vesting of stock-based awards of $3.1 million, $2.6 million and $5.6 million, respectively. In 2016, the Company adopted ASC Topic No. 2016-09. See Note 2, "Summary of Significant Accounting Policies — Recently Adopted Accounting Standards."
F-35
NEENAH PAPER INC. AND SUBSIDIARIES
NOTES TO CONSOLIDATED FINANCIAL STATEMENTS (Continued)
(Dollars in millions, except as noted)
Note 10. Stockholders' Equity
Common Stock
The Company has authorized 100 million shares of Common Stock. Holders of the Company's Common Stock are entitled to one vote per share.
In May 2016, the Company's Board of Directors authorized a program that would allow the Company to repurchase up to $25 million of its outstanding Common Stock over the next 12 months (the "2016 Stock Purchase Plan"). Purchases by the Company under the 2016 Stock Purchase Plan would be made from time to time in the open market or in privately negotiated transactions in accordance with the requirements of applicable law. The timing and amount of any purchases will depend on share price, market conditions and other factors. The 2016 Stock Purchase Plan does not require the Company to purchase any specific number of shares and may be suspended or discontinued at any time. The 2016 Stock Purchase Plan is expected to be funded using cash on hand or borrowings under the Company's bank credit facility. The Company had a substantially identical $25 million repurchase program in place during the preceding 12 months that expired in May 2016 (the "2015 Stock Purchase Plan"). The Company had a $10 million share repurchase program in place during the preceding 12 months that expired in May 2014 (the "2013 Stock Purchase Plan"). The following table shows shares purchased under the respective stock purchase plans:
Year Ended December 31, | |||||||||||||||||||||
2016 | 2015 | 2014 | |||||||||||||||||||
Shares | $ | Shares | $ | Shares | $ | ||||||||||||||||
2016 Stock Purchase Plan | 91,542 | $ | 7.4 | ||||||||||||||||||
2015 Stock Purchase Plan | 93,600 | $ | 5.2 | 42,100 | $ | 2.4 | — | $ | — | ||||||||||||
2014 Stock Purchase Plan | 60,900 | $ | 3.5 | 22,600 | $ | 1.2 | |||||||||||||||
2013 Stock Purchase Plan | |||||||||||||||||||||
As of December 31, 2016, under the terms of the Third Amended and Restated Credit Agreement and the 2021 Senior Notes, the Company has limitations on its ability to repurchase shares of its Common Stock, as further discussed in Note 7, "Debt."
For the years ended December 31, 2016, 2015 and 2014, the Company acquired 46,000 shares, 40,000 shares and 56,000 shares of Common Stock, respectively, at a cost of $3.8 million, $2.5 million and $3.4 million, respectively, for shares surrendered by employees to pay taxes due on vested restricted stock awards and SARs exercised.
Each share of Common Stock contains a preferred stock purchase right that is associated with the share. These preferred stock purchase rights are transferred only with shares of Common Stock. The preferred stock purchase rights become exercisable and separately certificated only upon a "Rights Distribution Date" as that term is defined in the stockholder rights agreement adopted by the Company at the time of the Spin-Off. In general, a Rights Distribution Date occurs 10 business days following either of these events: (i) a person or group has acquired or obtained the right to acquire beneficial ownership of 15 percent or more of the outstanding shares of the Company's Common Stock then outstanding or (ii) a tender offer or exchange offer is commenced that would result in a person or group acquiring 15 percent or more of the outstanding shares of Common Stock then outstanding.
Preferred Stock
The Company has authorized 20 million shares of $0.01 par value preferred stock. The preferred stock may be issued in one or more series and with such designations and preferences for each series as shall be stated in the resolutions providing for the designation and issue of each such series adopted by the Board of Directors of the Company. The Board of Directors is authorized by the Company's articles of incorporation to determine the voting, dividend, redemption and liquidation preferences pertaining to each such series. No shares of preferred stock have been issued by the Company.
Other Comprehensive Income (Loss)
Comprehensive income (loss) includes, in addition to net income (loss), gains and losses recorded directly into stockholders' equity on the consolidated balance sheet. These gains and losses are referred to as other comprehensive income items.
F-36
NEENAH PAPER INC. AND SUBSIDIARIES
NOTES TO CONSOLIDATED FINANCIAL STATEMENTS (Continued)
(Dollars in millions, except as noted)
Accumulated other comprehensive income (loss) consists of foreign currency translation gains and (losses), deferred gains and (losses) on "available-for-sale" securities, and adjustments related to pensions and other post-retirement benefits. The Company does not provide income taxes for foreign currency translation adjustments related to indefinite investments in foreign subsidiaries.
The components of accumulated other comprehensive income (loss), net of applicable income taxes are as follows:
December 31, | ||||||||
2016 | 2015 | |||||||
Unrealized foreign currency translation losses, net of income tax benefit of $0.4 and $0.0, respectively | $ | (27.5 | ) | $ | (20.8 | ) | ||
Net loss from pension and other postretirement benefit liabilities (net of income tax benefits of $36.8 million and $33.8 million, respectively) | (64.5 | ) | (57.5 | ) | ||||
Accumulated other comprehensive loss | $ | (92.0 | ) | $ | (78.3 | ) | ||
The following table presents changes in accumulated other comprehensive income ("AOCI"):
Year Ended December 31, | ||||||||||||||||||||||||||||||||||||
2016 | 2015 | 2014 | ||||||||||||||||||||||||||||||||||
Pretax Amount | Tax Effect | Net Amount | Pretax Amount | Tax Effect | Net Amount | Pretax Amount | Tax Effect | Net Amount | ||||||||||||||||||||||||||||
Unrealized foreign currency translation gains (losses) | $ | (7.1 | ) | $ | 0.4 | $ | (6.7 | ) | $ | (15.0 | ) | $ | — | $ | (15.0 | ) | $ | (23.7 | ) | $ | — | $ | (23.7 | ) | ||||||||||||
Adjustment to pension and other benefit liabilities | (10.0 | ) | 3.0 | (7.0 | ) | 6.3 | (1.2 | ) | 5.1 | (26.1 | ) | 8.7 | (17.4 | ) | ||||||||||||||||||||||
Other comprehensive income (loss) | $ | (17.1 | ) | $ | 3.4 | $ | (13.7 | ) | $ | (8.7 | ) | $ | (1.2 | ) | $ | (9.9 | ) | $ | (49.8 | ) | $ | 8.7 | $ | (41.1 | ) | |||||||||||
For the years ended December 31, 2016, 2015 and 2014, the Company reclassified $7.2 million, $7.1 million and $4.7 million, respectively, of costs from accumulated other comprehensive income to cost of products sold and selling, general and administrative expenses on the Consolidated Statements of Operations. For the years ended December 31, 2016, 2015 and 2014, the Company recognized an income tax benefit of $2.8 million, $2.7 million and $1.7 million, respectively, related to such reclassifications classified as Provision for income taxes on the Consolidated Statements of Operations.
For the year ended December 31, 2016, the Company reclassified $0.8 million of costs from accumulated other comprehensive income to pension plan settlement charge on the Consolidated Statements of Operations. For the year ended December 31, 2015, the Company reclassified $5.5 million of costs from accumulated other comprehensive income to loss from discontinued operations on the Consolidated Statements of Operations. For the year ended December 31, 2014, the Company reclassified $3.5 million of costs from accumulated other comprehensive income to pension plan settlement charge on the Consolidated Statements of Operations. For the years ended December 31, 2016 and 2014, the Company recognized an income tax benefit of $0.2 million and $1.3 million, respectively, related to such reclassifications classified as Provision for income taxes on the Consolidated Statements of Operations. For the year ended December 31, 2015, the Company recognized an income tax benefit of $2.1 million, related to reclassifications classified as Loss from discontinued operations, net of income taxes on the Consolidated Statements of Operations.
F-37
Note 11. Commitments
Leases
The future minimum obligations under operating leases having a noncancelable term in excess of one year as of December 31, 2016, are as follows:
2017 | $ | 3.1 | ||
2018 | 2.4 | |||
2019 | 1.3 | |||
2020 | 1.0 | |||
2021 | 1.0 | |||
Thereafter | 4.0 | |||
Future minimum lease obligations | $ | 12.8 | ||
For the years ended December 31, 2016, 2015 and 2014 rent expense under operating leases was $6.4 million, $5.4 million and $4.5 million, respectively.
Purchase Commitments
The Company has certain minimum purchase commitments that extend beyond December 31, 2016. Commitments under these contracts are approximately $14.3 million, $2.2 million and $1.3 million for the years ended December 31, 2017, 2018 and 2019, respectively. Such purchase commitments for the year ended December 31, 2017 are primarily for coal and corn starch contracts. Although the Company is primarily liable for payments on the above-mentioned leases and purchase commitments, management believes exposure to losses, if any, under these arrangements is not material.
Note 12. Contingencies and Legal Matters
Litigation
The Company is involved in certain legal actions and claims arising in the ordinary course of business. While the outcome of these legal actions and claims cannot be predicted with certainty, it is the opinion of management that the outcome of any such claim which is pending or threatened, either individually or on a combined basis, will not have a material effect on the consolidated financial condition, results of operations or liquidity of the Company.
Income Taxes
The Company periodically undergoes examination by the Internal Revenue Service (the "IRS") as well as various state and foreign jurisdictions. These tax authorities routinely challenge certain deductions and credits reported by the Company on its income tax returns. No significant tax audit findings are being contested at this time with either the IRS or any state or foreign tax authority.
Environmental, Health and Safety Matters
The Company is subject to federal, state and local laws, regulations and ordinances relating to various environmental, health and safety matters. The Company is in compliance with, or is taking actions designed to ensure compliance with, these laws, regulations and ordinances. However, the nature of the Company's business exposes it to the risk of claims with respect to environmental, health and safety matters, and there can be no assurance that material costs or liabilities will not be incurred in connection with such claims. Except for certain orders issued by environmental, health and safety regulatory agencies, with which management believes the Company is in compliance and which management believes are immaterial to the results of operations of the Company's business, Neenah is not currently named as a party in any judicial or administrative proceeding relating to environmental, health and safety matters.
While the Company has incurred in the past several years, and will continue to incur, capital and operating expenditures in order to comply with environmental, health and safety laws, regulations and ordinances, management believes that the Company's future cost of compliance with environmental, health and safety laws, regulations and ordinances, and its exposure to liability for environmental, health and safety claims will not have a material effect on its financial condition, results of
F-38
NEENAH PAPER INC. AND SUBSIDIARIES
NOTES TO CONSOLIDATED FINANCIAL STATEMENTS (Continued)
(Dollars in millions, except as noted)
operations or liquidity. However, future events, such as changes in existing laws and regulations or contamination of sites owned, operated or used for waste disposal by the Company (including currently unknown contamination and contamination caused by prior owners and operators of such sites or other waste generators) may give rise to additional costs which could have a material effect on the Company's financial condition, results of operations or liquidity.
The Company incurs capital expenditures necessary to meet legal requirements and otherwise relating to the protection of the environment at its facilities in the United States and internationally. The Company's anticipated capital expenditures for environmental projects are not expected to have a material effect on the Company's financial condition, results of operations or liquidity.
Employees and Labor Relations
As of December 31, 2016, the Company had approximately 2,303 regular full-time employees of whom 1,099 hourly and 526 salaried employees were located in the United States and 405 hourly and 273 salaried employees were located in Europe. All of the Company's U.S. hourly union employees are represented by the United Steelworkers Union (the "USW"). Hourly union employees at the Company's Bolton, England manufacturing facility are represented by Unite the Union ("UNITE"). The following table shows the status of the Company's bargaining agreements as of December 31, 2016.
Contract Expiration Date | Location | Union | Number of Employees | |||
June 2017 | Neenah Germany | IG BCE | (a) | |||
January 2018 | Whiting, WI (b) | USW | 201 | |||
June 2018 | Neenah, WI (b) | USW | 267 | |||
July 2018 | Munising, MI (b) | USW | 198 | |||
May 2019 | Appleton, WI (b) | USW | 75 | |||
August 2021 | Brattleboro, VT | USW | 69 | |||
November 2021 | Lowville, NY | USW | 98 | |||
_______________________
(a) Under German law union membership is voluntary and does not need to be disclosed to the Company. As a result, the number of employees covered by the collective bargaining agreement with the IG BCE cannot be determined.
(b) On pension matters the Whiting, Neenah, Munising and Appleton paper mills have bargained jointly with the USW. The current agreement on pension matters will remain in effect until September 2019.
Approximately 50 percent of salaried employees and 80 percent of hourly employees of Neenah Germany are eligible to be represented by the Mining, Chemicals and Energy Trade Union, Industriegewerkschaft Bergbau, Chemie and Energie (the "IG BCE"). In June 2015, the IG BCE and a national trade association representing all employers in the industry signed a collective bargaining agreement covering union employees of Neenah Germany that expires in June 2017. Under German law union membership is voluntary and does not need to be disclosed to the Company. As a result, the number of employees covered by the collective bargaining agreement with the IG BCE that expires in June 2017 cannot be determined. As of December 31, 2016, no employees are covered under collective bargaining agreements that expire in the next 12 months, with the exception of the employees covered by the collective bargaining arrangement with the IG BCE.
Note 13. Discontinued Operations
Discontinued Operations
On October 31, 2015, the Company sold the Lahnstein Mill to a privately-owned enterprise specializing in equity holdings in German medium-sized companies, for net cash proceeds of approximately $5.4 million. The buyer acquired all the assets and liabilities of the Lahnstein Mill, including pension and related liabilities of approximately $21 million. The Lahnstein Mill, which had annual sales of approximately €50 million, had been operating as a stand-alone business, manufacturing non-woven
F-39
NEENAH PAPER INC. AND SUBSIDIARIES
NOTES TO CONSOLIDATED FINANCIAL STATEMENTS (Continued)
(Dollars in millions, except as noted)
wallcoverings and various other specialty papers. The sale focuses the Company's portfolio on targeted growth markets such as filtration, premium fine papers and packaging and other performance materials.
Upon reaching an agreement for the sale of the Lahnstein Mill, the Company compared the carrying value of the Lahnstein Mill assets to the fair value of such assets reflected in the sales agreement. As a result, the Company recognized an impairment charge of $12.0 million to reduce the carrying value of the Lahnstein Mill assets to fair value. In addition, the Company recognized approximately $1.7 million of transaction costs related to the sale in 2015. For the year ended December 31, 2016, discontinued operations reported on the consolidated statements of operations includes an additional loss on sale arising from final adjustments to the transaction price.
The following table presents selected financial information for discontinued operations:
Year Ended December 31, | ||||||||||||
2016 | 2015 | 2014 | ||||||||||
Net sales | $ | — | $ | 43.2 | $ | 63.0 | ||||||
Cost of products sold | — | 39.7 | 56.6 | |||||||||
Gross Profit | — | 3.5 | 6.4 | |||||||||
Selling, general and administrative expenses | — | 3.5 | 5.2 | |||||||||
Restructuring costs | — | 0.1 | 0.6 | |||||||||
Other income — net | — | (0.3 | ) | (0.3 | ) | |||||||
Income (Loss) From Discontinued Operations Before Income Taxes | — | 0.2 | 0.9 | |||||||||
Loss on sale (a) | (0.6 | ) | (13.6 | ) | — | |||||||
Income (loss) before income taxes | (0.6 | ) | (13.4 | ) | 0.9 | |||||||
Income tax provision (benefit) (a) | (0.2 | ) | (4.0 | ) | 0.2 | |||||||
Income (loss) from discontinued operations | $ | (0.4 | ) | $ | (9.4 | ) | $ | 0.7 | ||||
_______________________
(a) For 2015, this amount includes a net curtailment gain related to the divesture of the pension plan of $15.8 million, including a $5.5 million write-off of deferred actuarial losses.
The following table presents selected cash flow information for discontinued operations for the years ended December 31, 2015 and 2014:
Year Ended December 31, | ||||||||
2015 | 2014 | |||||||
Depreciation and amortization | $ | 2.7 | $ | 3.9 | ||||
Capital expenditures | $ | 0.6 | $ | 0.7 | ||||
Note 14. Business Segment and Geographic Information
On July 1, 2015, the Company reorganized its internal management structure and, accordingly, addressed its segment reporting structure. As a result of this reorganization, the Other operating segment (composed of the non-premium Index, Tag and Vellum Bristol product lines acquired as part of the purchase of the Wausau brands) was combined with the Fine Paper and Packaging operating segment to reflect the manner in which this business is managed. Segment information for prior periods has been restated to conform to the current period presentation. In addition, as part of the FiberMark acquisition, the Company acquired certain product lines composed of papers sold to converters for end uses such as covering materials for datebooks, diaries, yearbooks and traditional photo albums. Due to the dissimilar nature of these products, management decided that they would
F-40
NEENAH PAPER INC. AND SUBSIDIARIES
NOTES TO CONSOLIDATED FINANCIAL STATEMENTS (Continued)
(Dollars in millions, except as noted)
not be managed as part of either the existing Fine Paper and Packaging or Technical Products businesses. These product lines represent an operating segment which does not meet the quantitative threshold for a reportable segment.
The Company's reportable operating segments now consist of Technical Products, Fine Paper and Packaging and Other. The Technical Products segment is an aggregation of the Company's filtration and performance materials businesses which are similar in terms of economic characteristics, nature of products, processes, customer class and product distribution methods.
The technical products business is an international producer of fiber-formed, coated and/or saturated specialized media that delivers high performance benefits to customers. Included in this segment are filtration media ("Filtration"), tape and abrasives backings products ("Backings"), and durable label and specialty substrate products ("Specialty"). The following table presents sales by product category for the technical products business:
For the Year ended December 31, | |||||||||
2016 | 2015 | 2014 | |||||||
Filtration | 42 | % | 45 | % | 42 | % | |||
Backings | 31 | % | 30 | % | 29 | % | |||
Specialty | 27 | % | 25 | % | 29 | % | |||
Total | 100 | % | 100 | % | 100 | % | |||
The fine paper and packaging business is a leading supplier of premium printing and other high end specialty papers ("Graphic Imaging"), premium packaging ("Packaging") and specialty office papers ("Filing/Office") primarily in North America. The following table presents sales by product category for the fine paper and packaging business:
For the Year ended December 31, | |||||||||
2016 | 2015 | 2014 | |||||||
Graphic Imaging | 81 | % | 80 | % | 91 | % | |||
Packaging | 14 | % | 15 | % | 9 | % | |||
Filing/Office | 5 | % | 5 | % | — | % | |||
Total | 100 | % | 100 | % | 100 | % | |||
Each segment employs different technologies and marketing strategies. Disclosure of segment information is on the same basis that management uses internally for evaluating segment performance and allocating resources. Transactions between segments are eliminated in consolidation. The costs of shared services, and other administrative functions managed on a common basis, are allocated to the segments based on usage, where possible, or other factors based on the nature of the activity. General corporate expenses that do not directly support the operations of the business segments are shown as Unallocated corporate costs. The accounting policies of the reportable operating segments are the same as those described in Note 2, "Summary of Significant Accounting Policies."
F-41
NEENAH PAPER INC. AND SUBSIDIARIES
NOTES TO CONSOLIDATED FINANCIAL STATEMENTS (Continued)
(Dollars in millions, except as noted)
Business Segments
Year Ended December 31, | ||||||||||||
2016 | 2015 | 2014 | ||||||||||
Net sales | ||||||||||||
Technical Products | $ | 466.4 | $ | 429.2 | $ | 403.6 | ||||||
Fine Paper and Packaging | 452.1 | 442.7 | 436.1 | |||||||||
Other | 23.0 | 15.8 | — | |||||||||
Consolidated | $ | 941.5 | $ | 887.7 | $ | 839.7 | ||||||
Year Ended December 31, | ||||||||||||
2016 | 2015 | 2014 | ||||||||||
Operating income (loss) | ||||||||||||
Technical Products (a) | $ | 65.6 | $ | 54.1 | $ | 46.0 | ||||||
Fine Paper and Packaging (b) | 70.7 | 67.3 | 60.8 | |||||||||
Other (c) | (1.1 | ) | (2.0 | ) | — | |||||||
Unallocated corporate costs (d) | (21.1 | ) | (18.0 | ) | (20.2 | ) | ||||||
Consolidated | $ | 114.1 | $ | 101.4 | $ | 86.6 | ||||||
_______________________
(a) | Operating income for the year ended December 31, 2016 included integration costs of $1.4 million. Operating income for the year ended December 31, 2015 included acquisition, integration and restructuring costs of $1.7 million. Operating income for the year ended December 31, 2014 includes integration and restructuring costs of $1.6 million. |
(b) | Operating income for the years ended December 31, 2016 and 2015 included acquisition and integration costs of $1.8 million and $1.5 million, respectively. |
(c) | Operating income for the year ended December 31, 2016 and 2015 included acquisition and integration costs of $1.1 million and $2.4 million, respectively. |
(d) | Unallocated corporate costs for the year ended December 31, 2016 included $2.7 million of pre-operating costs related to conversion of a fine paper machine to filtration and $0.8 million for a pension plan settlement charge. December 31, 2015 included $0.8 million of costs related to this filtration project. Unallocated corporate costs for the year ended December 31, 2014 included a pension plan settlement charge of $3.5 million, a loss on the early extinguishment of debt of $0.2 million and $0.7 million of restructuring costs. |
Year Ended December 31, | ||||||||||||
2016 | 2015 | 2014 | ||||||||||
Depreciation and amortization | ||||||||||||
Technical Products | $ | 18.1 | $ | 16.5 | $ | 14.6 | ||||||
Fine Paper and Packaging | 11.1 | 9.8 | 8.6 | |||||||||
Other | 1.3 | 0.6 | — | |||||||||
Corporate | 1.5 | 1.9 | 2.9 | |||||||||
Total Continuing Operations | 32.0 | 28.8 | 26.1 | |||||||||
Discontinued operations | — | 2.7 | 3.9 | |||||||||
Consolidated | $ | 32.0 | $ | 31.5 | $ | 30.0 | ||||||
F-42
NEENAH PAPER INC. AND SUBSIDIARIES
NOTES TO CONSOLIDATED FINANCIAL STATEMENTS (Continued)
(Dollars in millions, except as noted)
Year Ended December 31, | ||||||||||||
2016 | 2015 | 2014 | ||||||||||
Capital expenditures | ||||||||||||
Technical Products | $ | 57.9 | $ | 36.0 | $ | 16.1 | ||||||
Fine Paper and Packaging | 7.6 | 10.3 | 10.0 | |||||||||
Other | 0.3 | 0.4 | — | |||||||||
Corporate | 2.7 | 0.8 | 1.1 | |||||||||
Total Continuing Operations | 68.5 | 47.5 | 27.2 | |||||||||
Discontinued operations | — | 0.6 | 0.7 | |||||||||
Consolidated | $ | 68.5 | $ | 48.1 | $ | 27.9 | ||||||
December 31, | ||||||||
2016 | 2015 | |||||||
Total Assets (a) | ||||||||
Technical Products | $ | 487.6 | $ | 483.4 | ||||
Fine Paper and Packaging | 248.9 | 261.9 | ||||||
Corporate and other (b) | 29.1 | 6.1 | ||||||
Total | $ | 765.6 | $ | 751.4 | ||||
(a) | Segment identifiable assets are those that are directly used in the segments operations. |
(b) | Corporate assets are primarily cash and deferred income taxes. |
Geographic Information
Year Ended December 31, | ||||||||||||
2016 | 2015 | 2014 | ||||||||||
Net sales | ||||||||||||
United States | $ | 727.6 | $ | 687.3 | $ | 612.0 | ||||||
Europe | 213.9 | 200.4 | 227.7 | |||||||||
Consolidated | $ | 941.5 | $ | 887.7 | $ | 839.7 | ||||||
Net sales are attributed to geographic areas based on the physical location of the selling entities.
December 31, | ||||||||
2016 | 2015 | |||||||
Total Assets | ||||||||
United States | $ | 563.6 | $ | 533.2 | ||||
Europe | 201.9 | 218.1 | ||||||
Canada | 0.1 | 0.1 | ||||||
Total | $ | 765.6 | $ | 751.4 | ||||
F-43
NEENAH PAPER INC. AND SUBSIDIARIES
NOTES TO CONSOLIDATED FINANCIAL STATEMENTS (Continued)
(Dollars in millions, except as noted)
December 31, | ||||||||
2016 | 2015 | |||||||
Long-Lived Assets | ||||||||
United States | $ | 377.4 | $ | 342.0 | ||||
Europe | 151.9 | 162.8 | ||||||
Total | $ | 529.3 | $ | 504.8 | ||||
Long-lived assets consist principally of property and equipment, intangibles, goodwill and other assets.
Concentrations
In July 2014, Unisource Worldwide, Inc ("Unisource") and xpedx, formerly owned by International Paper ("xpedx") merged to form Veritiv Corporation ("Veritiv"). For the year ended December 31, 2016, sales to Veritiv represented approximately 8 percent of consolidated net sales and approximately 15 percent of net sales of the fine paper and packaging business. For the years ended December 31, 2015 and 2014 sales to Unisource and xpedx (and as merged Veritiv) represented approximately 10 percent of consolidated net sales and approximately 20 percent of net sales of the fine paper and packaging business. Except for certain specialty latex grades and specialty softwood pulp used by Technical Products, management is not aware of any significant concentration of business transacted with a particular supplier that could, if suddenly eliminated, have a material effect on its operations.
Note 15. Supplemental Data
Supplemental Statement of Operations Data
Summary of Advertising and Research and Development Expenses
Year Ended December 31, | ||||||||||||
2016 | 2015 | 2014 | ||||||||||
Advertising expense | $ | 6.2 | $ | 6.8 | $ | 7.0 | ||||||
Research and development expense | 9.4 | 6.8 | 5.7 | |||||||||
(a) | Adverting expense and research and development expense are recorded in selling, general and administrative expenses on the consolidated statements of operations. |
Supplemental Balance Sheet Data
Summary of Accounts Receivable — net
December 31, | ||||||||
2016 | 2015 | |||||||
From customers | $ | 98.0 | $ | 99.0 | ||||
Less allowance for doubtful accounts and sales discounts | (1.5 | ) | (1.7 | ) | ||||
Total | $ | 96.5 | $ | 97.3 | ||||
F-44
NEENAH PAPER INC. AND SUBSIDIARIES
NOTES TO CONSOLIDATED FINANCIAL STATEMENTS (Continued)
(Dollars in millions, except as noted)
Summary of Inventories
December 31, | ||||||||
2016 | 2015 | |||||||
Inventories by Major Class: | ||||||||
Raw materials | $ | 31.6 | $ | 30.4 | ||||
Work in progress | 26.8 | 28.9 | ||||||
Finished goods | 63.0 | 67.2 | ||||||
Supplies and other | 3.1 | 4.1 | ||||||
124.5 | 130.6 | |||||||
Excess of FIFO over LIFO cost | (8.2 | ) | (10.0 | ) | ||||
Total | $ | 116.3 | $ | 120.6 | ||||
The FIFO value of inventories valued on the LIFO method was $106.8 million and $118.2 million at December 31, 2016 and 2015, respectively. For the year ended December 31, 2016 and 2015, income from continuing operations before income taxes was reduced by approximately $0.1 million due to a decrease in certain LIFO inventory quantities.
Summary of Prepaid and Other Current Assets
December 31, | ||||||||
2016 | 2015 | |||||||
Prepaid and other current assets | $ | 10.5 | $ | 13.5 | ||||
Spare parts | 5.8 | 9.9 | ||||||
Receivable for income taxes | 4.1 | 1.1 | ||||||
Total | $ | 20.4 | $ | 24.5 | ||||
Summary of Property, Plant and Equipment — Net
December 31, | ||||||||
2016 | 2015 | |||||||
Land and land improvements | $ | 18.3 | $ | 19.6 | ||||
Buildings | 126.1 | 121.4 | ||||||
Machinery and equipment | 597.5 | 512.2 | ||||||
Construction in progress | 13.7 | 41.3 | ||||||
755.6 | 694.5 | |||||||
Less accumulated depreciation | 391.0 | 371.5 | ||||||
Net Property, Plant and Equipment | $ | 364.6 | $ | 323.0 | ||||
Depreciation expense for the years ended December 31, 2016, 2015 and 2014 was $27.1 million, $24.8 million and $23.2 million, respectively. Interest expense capitalized as part of the costs of capital projects was $0.8 million, $0.2 million and $0.1 million, respectively, for the years ended December 31, 2016, 2015 and 2014.
F-45
NEENAH PAPER INC. AND SUBSIDIARIES
NOTES TO CONSOLIDATED FINANCIAL STATEMENTS (Continued)
(Dollars in millions, except as noted)
Summary of Accrued Expenses
December 31, | ||||||||
2016 | 2015 | |||||||
Accrued salaries and employee benefits | $ | 26.3 | $ | 25.2 | ||||
Amounts due to customers | 7.3 | 9.5 | ||||||
Accrued interest | 1.3 | 1.2 | ||||||
Accrued income taxes | 2.0 | 0.7 | ||||||
Other | 14.3 | 14.6 | ||||||
Total | $ | 51.2 | $ | 51.2 | ||||
Summary of Noncurrent Employee Benefits
December 31, | ||||||||
2016 | 2015 | |||||||
Pension benefits | $ | 49.0 | $ | 51.2 | ||||
Post-employment benefits other than pensions (a) | 37.7 | 38.5 | ||||||
Total | $ | 86.7 | $ | 89.7 | ||||
(a) | Includes $1.3 million of SRCP benefits as of December 31, 2016 and $2.7 million of long-term disability benefits due to Terrace Bay retirees and SRCP benefits as of December 31, 2015. |
Supplemental Cash Flow Data
Supplemental Disclosure of Cash Flow Information
Year Ended December 31, | ||||||||||||
2016 | 2015 | 2014 | ||||||||||
Cash paid during the year for interest, net of interest expense capitalized | $ | 10.0 | $ | 10.6 | $ | 10.3 | ||||||
Cash paid during the year for income taxes, net of refunds | 15.0 | 16.2 | 6.3 | |||||||||
Non-cash investing activities: | ||||||||||||
Liability for equipment acquired | 11.1 | 6.6 | 4.1 | |||||||||
F-46
NEENAH PAPER INC. AND SUBSIDIARIES
NOTES TO CONSOLIDATED FINANCIAL STATEMENTS (Continued)
(Dollars in millions, except as noted)
Net cash provided by (used in) changes in operating working capital, net of effect of acquisitions
Year Ended December 31, | ||||||||||||
2016 | 2015 | 2014 | ||||||||||
Accounts receivable | $ | 1.5 | $ | (5.2 | ) | $ | 4.7 | |||||
Inventories | 4.3 | 7.7 | (5.6 | ) | ||||||||
Income taxes receivable/payable | (1.5 | ) | 1.0 | (0.3 | ) | |||||||
Prepaid and other current assets | — | (4.8 | ) | 1.2 | ||||||||
Accounts payable | (2.7 | ) | (0.5 | ) | 6.8 | |||||||
Accrued expenses | (2.8 | ) | 3.2 | 2.0 | ||||||||
Other | — | 0.4 | 0.2 | |||||||||
Total | $ | (1.2 | ) | $ | 1.8 | $ | 9.0 | |||||
Note 16. Unaudited Quarterly Data
2016 Quarters | ||||||||||||||||||||
First (c) | Second (c) | Third | Fourth | Year (a)(b) | ||||||||||||||||
Net Sales | $ | 242.1 | $ | 246.0 | $ | 232.9 | $ | 220.5 | $ | 941.5 | ||||||||||
Gross Profit | 58.8 | 60.0 | 49.2 | 46.5 | 214.5 | |||||||||||||||
Operating Income | 31.4 | 33.9 | 26.9 | 21.9 | 114.1 | |||||||||||||||
Income From Continuing Operations | 19.2 | 21.4 | 16.4 | 16.4 | 73.4 | |||||||||||||||
Earnings Per Common Share From Continuing Operations: | ||||||||||||||||||||
Basic | $ | 1.13 | $ | 1.26 | $ | 0.97 | $ | 0.97 | $ | 4.33 | ||||||||||
Diluted | $ | 1.11 | $ | 1.24 | $ | 0.95 | $ | 0.95 | $ | 4.26 | ||||||||||
(a) | Includes integration/restructuring costs of $7.0 million. |
(b) | Includes a pension plan settlement charge of $0.8 million. |
(c) | Includes recasting for excess tax benefits from stock compensation. See Note 2, "Summary of Significant Accounting Policies — Recently Adopted Accounting Standards." |
2015 Quarters | ||||||||||||||||||||
First | Second | Third | Fourth | Year (a) | ||||||||||||||||
Net Sales | $ | 214.4 | $ | 211.3 | $ | 231.6 | $ | 230.4 | $ | 887.7 | ||||||||||
Gross Profit | 49.5 | 48.0 | 48.4 | 49.5 | 195.4 | |||||||||||||||
Operating Income | 28.4 | 27.7 | 24.4 | 20.9 | 101.4 | |||||||||||||||
Income From Continuing Operations | 16.1 | 16.4 | 13.5 | 14.5 | 60.5 | |||||||||||||||
Earnings Per Common Share From Continuing Operations: | ||||||||||||||||||||
Basic | $ | 0.95 | $ | 0.97 | $ | 0.79 | $ | 0.86 | $ | 3.58 | ||||||||||
Diluted | $ | 0.94 | $ | 0.96 | $ | 0.78 | $ | 0.85 | $ | 3.53 | ||||||||||
_______________________
(a) | Includes integration/restructuring costs of $6.5 million. |
F-47
SCHEDULE II
NEENAH PAPER, INC. AND SUBSIDIARIES
SCHEDULE OF VALUATION AND QUALIFYING ACCOUNTS
(Dollars in millions)
Description | Balance at Beginning of Period | Charged to Costs and Expenses | Charged to Other Accounts | Write-offs and Reclassifications | Balance at End of Period | |||||||||||||||
December 31, 2016 | ||||||||||||||||||||
Allowances deducted from assets to which they apply | ||||||||||||||||||||
Allowance for doubtful accounts | $ | 1.1 | $ | (0.1 | ) | $ | — | $ | — | $ | 1.0 | |||||||||
Allowance for sales discounts | 0.6 | (0.1 | ) | — | — | 0.5 | ||||||||||||||
Valuation allowance — deferred income taxes | 3.0 | 0.1 | — | 0.4 | 3.5 | |||||||||||||||
December 31, 2015 | ||||||||||||||||||||
Allowances deducted from assets to which they apply | ||||||||||||||||||||
Allowance for doubtful accounts | $ | 0.9 | $ | (0.4 | ) | $ | 1.0 | $ | (0.4 | ) | $ | 1.1 | ||||||||
Allowance for sales discounts | 0.6 | — | — | — | 0.6 | |||||||||||||||
Valuation allowance — deferred income taxes | — | 3.0 | — | — | 3.0 | |||||||||||||||
December 31, 2014 | ||||||||||||||||||||
Allowances deducted from assets to which they apply | ||||||||||||||||||||
Allowance for doubtful accounts | $ | 0.8 | $ | 0.3 | $ | — | $ | (0.2 | ) | $ | 0.9 | |||||||||
Allowance for sales discounts | 0.6 | — | — | — | 0.6 | |||||||||||||||
F-48