Attached files
| file | filename |
|---|---|
| EX-99.1 - EXHIBIT 99.1 - W. P. Carey Inc. | wpc2016q48-kerexh991.htm |
| 8-K - 8-K - W. P. Carey Inc. | wpc2016q48-ksupplemental.htm |
Exhibit 99.2
W. P. Carey Inc.
Supplemental Information
Fourth Quarter 2016

Important Disclosures About This Supplemental Package
As used in this supplemental package, the terms “W. P. Carey,” “WPC,” “the Company,” “we,” “us” and “our” include W. P. Carey Inc., its consolidated subsidiaries and its predecessors, unless otherwise indicated. “CPA® REITs” means Corporate Property Associates 17 – Global Incorporated, or CPA®:17 – Global, and Corporate Property Associates 18 – Global Incorporated, or CPA®:18 – Global. “CWI REITs” means Carey Watermark Investors Incorporated, or CWI 1, and Carey Watermark Investors 2 Incorporated, or CWI 2. “Managed REITs” means the CPA® REITs and the CWI REITs. “Managed Programs” means the Managed REITs, Carey Credit Income Fund, or CCIF, and Carey European Student Housing Fund I, L.P., or CESH I. “U.S.” means United States. “AUM” means assets under management.
Important Note Regarding Non-GAAP Financial Measures
This supplemental package includes certain “non-GAAP” supplemental measures that are not defined by generally accepted accounting principles, or GAAP, including funds from operations, or FFO; adjusted funds from operations, or AFFO; earnings before interest, taxes, depreciation and amortization, or EBITDA; adjusted EBITDA; pro rata cash net operating income, or pro rata cash NOI; and normalized pro rata cash NOI. A description of these non-GAAP financial measures and reconciliations to their most directly comparable GAAP measures, as well as a description of other metrics presented, are provided within the Appendix to this supplemental package. FFO is a non-GAAP measure defined by the National Association of Real Estate Investments Trusts, or NAREIT.
Amounts may not sum to totals due to rounding.
W. P. Carey Inc.
Supplemental Information – Fourth Quarter 2016
Table of Contents | |
Overview | |
Financial Results | |
Statements of Income – Last Five Quarters | |
FFO and AFFO – Last Five Quarters | |
Balance Sheets and Capitalization | |
Owned Real Estate | |
Investment Management | |
Appendix | |
Adjusted EBITDA – Last Five Quarters | |
W. P. Carey Inc.
Overview – Fourth Quarter 2016
Summary Metrics | |
As of or for the three months ended December 31, 2016.
Financial Results | |||||||||||||||||||
Segment | |||||||||||||||||||
Owned Real Estate | Investment Management | Consolidated | |||||||||||||||||
Revenues, excluding reimbursable costs – consolidated ($'000) | $ | 165,269 | $ | 37,249 | $ | 202,518 | |||||||||||||
Net income attributable to W. P. Carey ($'000) | 40,431 | 7,273 | 47,704 | ||||||||||||||||
Net income attributable to W. P. Carey per diluted share | 0.37 | 0.07 | 0.44 | ||||||||||||||||
Normalized pro rata cash NOI from real estate ($'000) (a) (b) | 161,107 | N/A | 161,107 | ||||||||||||||||
Adjusted EBITDA ($'000) (a) (b) | 168,838 | 14,484 | 183,322 | ||||||||||||||||
AFFO attributable to W. P. Carey ($'000) (a) (b) | 127,410 | 4,114 | 131,524 | ||||||||||||||||
AFFO attributable to W. P. Carey per diluted share (a) (b) | 1.18 | 0.04 | 1.22 | ||||||||||||||||
Distributions declared per share – fourth quarter | 0.9900 | ||||||||||||||||||
Distributions declared per share – fourth quarter annualized | 3.96 | ||||||||||||||||||
Dividend yield – annualized, based on quarter end share price of $59.09 | 6.7 | % | |||||||||||||||||
Dividend payout ratio – fourth quarter (c) | 81.1 | % | |||||||||||||||||
Balance Sheet and Capitalization | |||||||||||||||||||
Equity market capitalization – based on quarter end share price of $59.09 ($'000) | $ | 6,280,922 | |||||||||||||||||
Pro rata net debt ($'000) (d) | 4,236,843 | ||||||||||||||||||
Enterprise value ($'000) | 10,517,765 | ||||||||||||||||||
Total capitalization ($'000) (e) | 10,673,247 | ||||||||||||||||||
Total consolidated debt ($'000) | 4,440,814 | ||||||||||||||||||
Gross assets ($'000) (f) | 8,938,391 | ||||||||||||||||||
Liquidity ($'000) (g) | 978,131 | ||||||||||||||||||
Pro rata net debt to enterprise value (b) | 40.3 | % | |||||||||||||||||
Pro rata net debt to adjusted EBITDA (annualized) (a) (b) | 5.8x | ||||||||||||||||||
Total consolidated debt to gross assets | 49.7 | % | |||||||||||||||||
Weighted-average interest rate (b) | 3.7 | % | |||||||||||||||||
Weighted-average debt maturity (years) (b) | 4.7 | ||||||||||||||||||
Standard & Poor's Ratings Services – issuer rating | BBB (stable) | ||||||||||||||||||
Moody's Investors Service – corporate rating | Baa2 (stable) | ||||||||||||||||||
Owned Real Estate Portfolio (Pro Rata) | |||||||||||||||||||
Number of net-leased properties | 903 | ||||||||||||||||||
Number of operating properties | 2 | ||||||||||||||||||
Number of tenants – net-leased properties | 217 | ||||||||||||||||||
ABR from Investment Grade tenants as a % of total ABR – net-leased properties (h) | 16.2 | % | |||||||||||||||||
ABR from Implied Investment Grade tenants as a % of total ABR – net-leased properties (i) | 9.2 | % | |||||||||||||||||
Net-leased properties – square footage (millions) | 87.9 | ||||||||||||||||||
Occupancy – net-leased properties (j) | 99.1 | % | |||||||||||||||||
Weighted-average remaining lease term (years) | 9.7 | ||||||||||||||||||
Acquisitions and completed build-to-suits, redevelopments and expansions – fourth quarter ($'000) | $ | 158,234 | |||||||||||||||||
Dispositions – fourth quarter ($'000) | 157,518 | ||||||||||||||||||
Managed Programs | CPA® REITs | CWI REITs | CCIF | CESH I | Total | ||||||||||||||
AUM ($'000) (k) | $ | 8,190,355 | $ | 4,281,004 | $ | 301,252 | $ | 102,196 | $ | 12,874,807 | |||||||||
Acquisitions – fourth quarter ($'000) | 178,727 | 289,705 | N/A | 42,721 | 511,153 | ||||||||||||||
Dispositions – fourth quarter ($'000) | — | — | N/A | — | — | ||||||||||||||
________
 | Investing for the long runTM | 1 | |
W. P. Carey Inc.
Overview – Fourth Quarter 2016
(a) | Normalized pro rata cash NOI, Adjusted EBITDA and AFFO are non-GAAP measures. See the Terms and Definitions section in the Appendix for a description of our non-GAAP measures and for details on how certain non-GAAP measures are calculated. |
(b) | Presented on a pro rata basis. See the Terms and Definitions section in the Appendix for a description of pro rata. |
(c) | Represents distributions declared per share divided by AFFO per diluted share. |
(d) | Represents total pro rata debt outstanding less consolidated cash and cash equivalents. See the Terms and Definitions section in the Appendix for a description of pro rata. |
(e) | Represents equity market capitalization plus total pro rata debt outstanding. See the Terms and Definitions section in the Appendix for a description of pro rata. |
(f) | Gross assets represent consolidated total assets before accumulated depreciation. |
(g) | Represents availability on our Senior Unsecured Credit Facility - Revolver plus cash and cash equivalents. |
(h) | Includes tenants or guarantors with a rating of BBB- or higher from Standard & Poor’s Ratings Services or Baa3 or higher from Moody’s Investors Service. Percentage of portfolio based on ABR, as of December 31, 2016. See the Terms and Definitions section in the Appendix for a description of ABR. |
(i) | Includes subsidiaries of non-guarantor parent companies with a rating of BBB- or higher from Standard & Poor’s Ratings Services or Baa3 or higher from Moody’s Investors Service. Percentage of portfolio based on ABR, as of December 31, 2016. See the Terms and Definitions section in the Appendix for a description of ABR. |
(j) | Average occupancy for our two hotels was 76.7% for the three months ended December 31, 2016. |
(k) | Represents estimated value of real estate assets plus cash and cash equivalents, less distributions payable for the Managed REITs and fair value of investments plus cash for CCIF and CESH I. |
| | Investing for the long runTM | 2 | |
W. P. Carey Inc.
Overview – Fourth Quarter 2016
Components of Net Asset Value | |
In thousands, except shares, per share amounts and percentages.
Real Estate | Three Months Ended Dec. 31, 2016 | Annualized | |||||||
Owned Real Estate: | A | A x 4 | |||||||
Normalized pro rata cash NOI (a) | $ | 161,107 | $ | 644,428 | |||||
Operating Partnership Interests in Real Estate Cash Flow of Managed REITs: (b) | |||||||||
CPA®:17 – Global (10% of Available Cash) | 6,962 | 27,848 | |||||||
CPA®:18 – Global (10% of Available Cash) | 2,267 | 9,068 | |||||||
CWI 1 (8% of Available Cash) | 2,011 | 8,044 | |||||||
CWI 2 (7.5% of Available Cash) | 1,020 | 4,080 | |||||||
12,260 | 49,040 | ||||||||
Investment Management | Three Months Ended Dec. 31, 2016 | Twelve Months Ended Dec. 31, 2016 | |||||||
Adjusted EBITDA (a) | $ | 14,484 | $ | 48,057 | |||||
Balance Sheet - Selected Information (Consolidated Unless Otherwise Stated) | As of Dec. 31, 2016 | ||||||||
Assets | |||||||||
Book value of real estate excluded from NOI (c) | $ | 29,882 | |||||||
Cash and cash equivalents | 155,482 | ||||||||
Due from affiliates (d) | 299,610 | ||||||||
Other assets, net: | |||||||||
Securities and derivatives | $ | 61,158 | |||||||
Restricted cash, including escrow | 55,248 | ||||||||
Straight-line rent adjustments | 53,677 | ||||||||
Other intangible assets, net | 40,100 | ||||||||
Deferred charges | 31,045 | ||||||||
Accounts receivable | 26,882 | ||||||||
Prepaid expenses | 20,412 | ||||||||
Note receivable | 10,351 | ||||||||
Leasehold improvements, furniture and fixtures | 5,684 | ||||||||
Other | 217 | ||||||||
Total other assets, net | $ | 304,774 | |||||||
Liabilities | |||||||||
Total pro rata debt outstanding (e) | $ | 4,392,325 | |||||||
Distributions payable | 107,090 | ||||||||
Deferred income taxes | 90,825 | ||||||||
Accounts payable, accrued expenses and other liabilities: | |||||||||
Accounts payable and accrued expenses | $ | 112,282 | |||||||
Prepaid and deferred rents | 79,541 | ||||||||
Tenant security deposits | 29,836 | ||||||||
Accrued taxes payable | 22,321 | ||||||||
Straight-line rent adjustments | 2,911 | ||||||||
Other | 20,026 | ||||||||
Total accounts payable, accrued expenses and other liabilities | $ | 266,917 | |||||||
| | Investing for the long runTM | 3 | |
W. P. Carey Inc.
Overview – Fourth Quarter 2016
Other | Number of Shares/Units Owned | NAV / Offering Price Per Share | Implied Value | |||||||
A | B | A x B | ||||||||
Ownership in Managed Programs: (f) | ||||||||||
CPA®:17 – Global (3.5% ownership) | 11,874,009 | $ | 10.24 | (g) | $ | 121,590 | ||||
CPA®:18 – Global (1.6% ownership) | 2,229,196 | 7.90 | (h) | 17,611 | ||||||
CWI 1 (1.1% ownership) | 1,501,028 | 10.66 | (i) | 16,001 | ||||||
CWI 2 (0.8% ownership) | 488,388 | 10.53 | (j) | 5,143 | ||||||
CCIF (13.3% ownership) | 2,777,778 | 9.00 | (k) | 25,000 | ||||||
CESH I (2.4% ownership) | 2,821 | 1,000.00 | (l) | 2,821 | ||||||
$ | 188,166 | |||||||||
________
(a) | Normalized pro rata cash NOI and Adjusted EBITDA are non-GAAP measures. See the Terms and Definitions section in the Appendix for a description of our non-GAAP measures and for details on how they are calculated. |
(b) | We are entitled to receive distributions of our share of earnings up to 10% of the Available Cash of each of the Managed REITs, as defined in their respective operating partnership agreements. Pursuant to the terms of their subadvisory agreements, however, 20% of the distributions of Available Cash we receive from CWI 1 and 25% of the distributions of Available Cash we receive from CWI 2 are paid to their respective subadvisors. |
(c) | Represents the value of real estate not included in net operating income, such as vacant assets and in-progress build-to-suit properties. |
(d) | As of December 31, 2016, this amount includes short-term loans to our affiliates CWI 2 and CPA®:18 – Global totaling $237.6 million, including accrued interest. Subsequent to December 31, 2016 and through February 23, 2017, CWI 2 repaid in full the $210.0 million loan that was outstanding to us at December 31, 2016. |
(e) | See the Terms and Definitions section in the Appendix for a description of pro rata. |
(f) | Separate from operating partnership interests. |
(g) | The estimated net asset value per share, or NAV, for CPA®:17 – Global was determined as of December 31, 2015. We calculated CPA®:17 – Global’s NAV by relying in part on an estimate of the fair market value of CPA®:17 – Global’s real estate portfolio and debt provided by third parties, adjusted to give effect to the estimated fair value of mortgage loans encumbering its assets (also provided by a third party) as well as other adjustments. |
(h) | We own shares of CPA®:18 – Global’s Class A common stock. The NAV for CPA®:18 – Global’s Class A common stock was determined as of September 30, 2016. We calculated the NAV for CPA®:18 – Global’s Class A common stock by relying in part on an estimate of the fair market value of CPA®:18 – Global’s real estate portfolio and debt provided by third parties, adjusted to give effect to the estimated fair value of mortgage loans encumbering its assets (also provided by a third party), as well as other adjustments. |
(i) | The NAV for CWI 1 was based on shares of common stock outstanding at December 31, 2015. We calculated CWI 1’s NAV relying in part on appraisals of the fair market value of CWI 1’s real estate portfolio and mortgage debt provided by third parties. The net amount was then adjusted for estimated disposition costs (including estimates of expenses, commissions and fees payable to us) and CWI 1’s other net assets and liabilities at the same date. |
(j) | We own shares of CWI 2’s Class A common stock. The NAV for CWI 2’s Class A common stock was determined as of December 31, 2015. We calculated the NAV for CWI 2’s Class A common stock by relying in part on an appraisal of the fair market value of CWI 2’s real estate portfolio and estimates of the fair market value of CWI 2’s mortgage debt at December 31, 2015. The net amount was then adjusted for other net assets and liabilities and our interest in disposition proceeds at December 31, 2015. |
(k) | In December 2014, we purchased 2,777,778 shares of CCIF at $9.00 per share for a total purchase price of $25.0 million. We account for our interest in this investment using the equity method of accounting because we share the decision making with the third-party investment partner. The $9.00 purchase price does not reflect CCIF’s NAV at December 31, 2016. |
(l) | We own limited partnership units of CESH I at its private placement price of $1,000.00 per share; we have not calculated a NAV for CESH I. |
| | Investing for the long runTM | 4 | |
W. P. Carey Inc.
Financial Results
Fourth Quarter 2016

| | Investing for the long runTM | 5 | |
W. P. Carey Inc.
Financial Results – Fourth Quarter 2016
Consolidated Statements of Income – Last Five Quarters | |
In thousands, except share and per share amounts.
Three Months Ended | |||||||||||||||||||
Dec. 31, 2016 | Sep. 30, 2016 | Jun. 30, 2016 | Mar. 31, 2016 | Dec. 31, 2015 | |||||||||||||||
Revenues | |||||||||||||||||||
Owned Real Estate: | |||||||||||||||||||
Lease revenues | $ | 157,105 | $ | 163,786 | $ | 167,328 | $ | 175,244 | $ | 169,476 | |||||||||
Operating property revenues (a) | 7,071 | 8,524 | 8,270 | 6,902 | 6,870 | ||||||||||||||
Reimbursable tenant costs | 6,201 | 6,537 | 6,391 | 6,309 | 5,423 | ||||||||||||||
Lease termination income and other (b) | 1,093 | 1,224 | 838 | 32,541 | 15,826 | ||||||||||||||
171,470 | 180,071 | 182,827 | 220,996 | 197,595 | |||||||||||||||
Investment Management: | |||||||||||||||||||
Reimbursable costs from affiliates | 20,061 | 14,540 | 12,094 | 19,738 | 27,436 | ||||||||||||||
Asset management revenue | 16,375 | 15,978 | 15,005 | 14,613 | 13,748 | ||||||||||||||
Structuring revenue | 16,338 | 12,301 | 5,968 | 12,721 | 24,382 | ||||||||||||||
Dealer manager fees | 2,623 | 1,835 | 1,372 | 2,172 | 2,089 | ||||||||||||||
Other advisory revenue | 1,913 | 522 | — | — | — | ||||||||||||||
57,310 | 45,176 | 34,439 | 49,244 | 67,655 | |||||||||||||||
228,780 | 225,247 | 217,266 | 270,240 | 265,250 | |||||||||||||||
Operating Expenses | |||||||||||||||||||
Depreciation and amortization | 62,675 | 62,802 | 66,581 | 84,452 | 74,237 | ||||||||||||||
Reimbursable tenant and affiliate costs | 26,262 | 21,077 | 18,485 | 26,047 | 32,859 | ||||||||||||||
General and administrative | 24,230 | 15,733 | 20,951 | 21,438 | 24,186 | ||||||||||||||
Property expenses, excluding reimbursable tenant costs | 10,956 | 10,193 | 10,510 | 17,772 | 20,695 | ||||||||||||||
Impairment charges | 9,433 | 14,441 | 35,429 | — | 7,194 | ||||||||||||||
Subadvisor fees (c) | 4,131 | 4,842 | 1,875 | 3,293 | 2,747 | ||||||||||||||
Dealer manager fees and expenses | 3,808 | 3,028 | 2,620 | 3,352 | 3,519 | ||||||||||||||
Stock-based compensation expense | 3,051 | 4,356 | 4,001 | 6,607 | 5,562 | ||||||||||||||
Property acquisition and other expenses (d) (e) | 18 | — | (207 | ) | 5,566 | (20,097 | ) | ||||||||||||
Restructuring and other compensation (f) | — | — | 452 | 11,473 | — | ||||||||||||||
144,564 | 136,472 | 160,697 | 180,000 | 150,902 | |||||||||||||||
Other Income and Expenses | |||||||||||||||||||
Interest expense | (43,913 | ) | (44,349 | ) | (46,752 | ) | (48,395 | ) | (49,001 | ) | |||||||||
Equity in earnings of equity method investments in the Managed Programs and real estate | 16,476 | 16,803 | 16,429 | 15,011 | 12,390 | ||||||||||||||
Other income and (expenses) | (3,731 | ) | 5,101 | 426 | 3,871 | (7,830 | ) | ||||||||||||
(31,168 | ) | (22,445 | ) | (29,897 | ) | (29,513 | ) | (44,441 | ) | ||||||||||
Income before income taxes and gain on sale of real estate | 53,048 | 66,330 | 26,672 | 60,727 | 69,907 | ||||||||||||||
(Provision for) benefit from income taxes | (7,826 | ) | (3,154 | ) | 8,217 | (525 | ) | (17,270 | ) | ||||||||||
Income before gain on sale of real estate | 45,222 | 63,176 | 34,889 | 60,202 | 52,637 | ||||||||||||||
Gain on sale of real estate, net of tax | 3,248 | 49,126 | 18,282 | 662 | 3,507 | ||||||||||||||
Net Income | 48,470 | 112,302 | 53,171 | 60,864 | 56,144 | ||||||||||||||
Net income attributable to noncontrolling interests | (766 | ) | (1,359 | ) | (1,510 | ) | (3,425 | ) | (5,095 | ) | |||||||||
Net Income Attributable to W. P. Carey | $ | 47,704 | $ | 110,943 | $ | 51,661 | $ | 57,439 | $ | 51,049 | |||||||||
Basic Earnings Per Share | $ | 0.44 | $ | 1.03 | $ | 0.48 | $ | 0.54 | $ | 0.48 | |||||||||
Diluted Earnings Per Share | $ | 0.44 | $ | 1.03 | $ | 0.48 | $ | 0.54 | $ | 0.48 | |||||||||
Weighted-Average Shares Outstanding | |||||||||||||||||||
Basic | 107,487,181 | 107,221,668 | 106,310,362 | 105,939,161 | 105,818,926 | ||||||||||||||
Diluted | 107,715,965 | 107,468,029 | 106,530,036 | 106,405,453 | 106,383,786 | ||||||||||||||
________
(a) | Comprised of revenues of $7.1 million from two hotels for the three months ended December 31, 2016. During the three months ended March 31, 2016, we sold our remaining self-storage facility. |
(b) | Amounts for the three months ended March 31, 2016 and December 31, 2015 include $32.2 million and $15.0 million, respectively, of lease termination income related to a property classified as held for sale as of December 31, 2015 and sold during the three months ended March 31, 2016. |
(c) | We earn investment management revenue from CWI 1 and CWI 2 in our role as their advisor. Pursuant to the terms of their subadvisory agreements, however, 20% of the fees we receive from CWI 1 and 25% of the fees we receive from CWI 2 are paid to their respective subadvisors. In connection with the acquisitions of multi-family properties on behalf of CPA®:18 – Global, we entered into agreements with third-party advisors for the day-to-day management of the properties for which we pay 30% of the initial acquisition fees and 100% of asset management fees paid to us by CPA®:18 – Global. |
| | Investing for the long runTM | 6 | |
W. P. Carey Inc.
Financial Results – Fourth Quarter 2016
(d) | Amount for the three months ended December 31, 2015 includes a reversal of $25.0 million of reserves for German real estate transfer taxes, of which $7.9 million was previously recorded as merger expenses in connection with our merger with one of our managed funds, CPA®:15, or the CPA®:15 Merger, in September 2012 and $17.1 million was previously recorded in connection with the restructuring of a German investment, Hellweg 2, in October 2013. At the time of the restructuring, we owned an equity interest in the Hellweg 2 investment, which we jointly owned with CPA®:16 – Global. In connection with our merger with another one of our managed funds, CPA®:16 – Global, or the CPA®:16 Merger, in January 2014, we acquired CPA®:16 – Global’s controlling interest in the investment. Therefore, the reversal related to the Hellweg 2 investment has been recorded in Property acquisition and other expenses in the consolidated financial statements for the three months ended December 31, 2015, since we now consolidate the Hellweg 2 investment. |
(e) | Amounts for the three months ended June 30, 2016, March 31, 2016 and December 31, 2015 include expenses related to our formal strategic review of $(0.2) million, $5.5 million and $4.5 million, respectively. |
(f) | Amount represents restructuring and other compensation-related expenses resulting from a reduction in headcount and employee severance arrangements. |
| | Investing for the long runTM | 7 | |
W. P. Carey Inc.
Financial Results – Fourth Quarter 2016
Statements of Income, Owned Real Estate – Last Five Quarters | |
In thousands, except share and per share amounts.
Three Months Ended | |||||||||||||||||||
Dec. 31, 2016 | Sep. 30, 2016 | Jun. 30, 2016 | Mar. 31, 2016 | Dec. 31, 2015 | |||||||||||||||
Revenues | |||||||||||||||||||
Lease revenues | $ | 157,105 | $ | 163,786 | $ | 167,328 | $ | 175,244 | $ | 169,476 | |||||||||
Operating property revenues (a) | 7,071 | 8,524 | 8,270 | 6,902 | 6,870 | ||||||||||||||
Reimbursable tenant costs | 6,201 | 6,537 | 6,391 | 6,309 | 5,423 | ||||||||||||||
Lease termination income and other (b) | 1,093 | 1,224 | 838 | 32,541 | 15,826 | ||||||||||||||
171,470 | 180,071 | 182,827 | 220,996 | 197,595 | |||||||||||||||
Operating Expenses | |||||||||||||||||||
Depreciation and amortization | 61,717 | 61,740 | 65,457 | 83,360 | 73,189 | ||||||||||||||
Property expenses, excluding reimbursable tenant costs | 10,956 | 10,193 | 10,510 | 17,772 | 20,695 | ||||||||||||||
Impairment charges | 9,433 | 14,441 | 35,429 | — | 7,194 | ||||||||||||||
General and administrative | 8,938 | 7,453 | 8,656 | 9,544 | 10,513 | ||||||||||||||
Reimbursable tenant costs | 6,201 | 6,537 | 6,391 | 6,309 | 5,423 | ||||||||||||||
Stock-based compensation expense | 908 | 1,572 | 907 | 1,837 | 1,929 | ||||||||||||||
Property acquisition and other expenses (c) (d) | 18 | — | 78 | 2,897 | (21,123 | ) | |||||||||||||
Restructuring and other compensation (e) | — | — | (13 | ) | 4,426 | — | |||||||||||||
98,171 | 101,936 | 127,415 | 126,145 | 97,820 | |||||||||||||||
Other Income and Expenses | |||||||||||||||||||
Interest expense | (43,913 | ) | (44,349 | ) | (46,752 | ) | (48,395 | ) | (49,001 | ) | |||||||||
Equity in earnings of equity method investments in the Managed REITs and real estate | 15,953 | 15,705 | 15,900 | 15,166 | 13,564 | ||||||||||||||
Other income and (expenses) | (4,016 | ) | 3,244 | 662 | 3,775 | (7,593 | ) | ||||||||||||
(31,976 | ) | (25,400 | ) | (30,190 | ) | (29,454 | ) | (43,030 | ) | ||||||||||
Income before income taxes and gain on sale of real estate | 41,323 | 52,735 | 25,222 | 65,397 | 56,745 | ||||||||||||||
(Provision for) benefit from income taxes | (3,374 | ) | (530 | ) | 9,410 | (2,088 | ) | (10,129 | ) | ||||||||||
Income before gain on sale of real estate | 37,949 | 52,205 | 34,632 | 63,309 | 46,616 | ||||||||||||||
Gain on sale of real estate, net of tax | 3,248 | 49,126 | 18,282 | 662 | 3,507 | ||||||||||||||
Net Income from Owned Real Estate | 41,197 | 101,331 | 52,914 | 63,971 | 50,123 | ||||||||||||||
Net income attributable to noncontrolling interests | (766 | ) | (1,359 | ) | (1,510 | ) | (3,425 | ) | (5,090 | ) | |||||||||
Net Income from Owned Real Estate Attributable to W. P. Carey | $ | 40,431 | $ | 99,972 | $ | 51,404 | $ | 60,546 | $ | 45,033 | |||||||||
Basic Earnings Per Share | $ | 0.37 | $ | 0.93 | $ | 0.48 | $ | 0.57 | $ | 0.43 | |||||||||
Diluted Earnings Per Share | $ | 0.37 | $ | 0.93 | $ | 0.48 | $ | 0.57 | $ | 0.42 | |||||||||
Weighted-Average Shares Outstanding | |||||||||||||||||||
Basic | 107,487,181 | 107,221,668 | 106,310,362 | 105,939,161 | 105,818,926 | ||||||||||||||
Diluted | 107,715,965 | 107,468,029 | 106,530,036 | 106,405,453 | 106,383,786 | ||||||||||||||
________
(a) | Comprised of revenues of $7.1 million from two hotels for the three months ended December 31, 2016. During the three months ended March 31, 2016, we sold our remaining self-storage facility. |
(b) | Amounts for the three months ended March 31, 2016 and December 31, 2015 include $32.2 million and $15.0 million, respectively, of lease termination income related to a property classified as held for sale as of December 31, 2015 and sold during the three months ended March 31, 2016. |
(c) | Amount for the three months ended December 31, 2015 includes a reversal of $25.0 million of reserves for German real estate transfer taxes, of which $7.9 million was previously recorded as merger expenses in connection with the CPA®:15 Merger in September 2012 and $17.1 million was previously recorded in connection with the restructuring of a German investment, Hellweg 2, in October 2013. At the time of the restructuring, we owned an equity interest in the Hellweg 2 investment, which we jointly owned with CPA®:16 – Global. In connection with the CPA®:16 Merger, we acquired CPA®:16 – Global’s controlling interest in the investment. Therefore, the reversal related to the Hellweg 2 investment has been recorded in Property acquisition and other expenses in the consolidated financial statements for the three months ended December 31, 2015, since we now consolidate the Hellweg 2 investment. |
(d) | Amounts for the three months ended June 30, 2016, March 31, 2016 and December 31, 2015 include expenses related to our formal strategic review of $0.1 million, $2.8 million and $3.5 million, respectively. |
(e) | Amount represents restructuring and other compensation-related expenses resulting from a reduction in headcount and employee severance arrangements. |
| | Investing for the long runTM | 8 | |
W. P. Carey Inc.
Financial Results – Fourth Quarter 2016
Statements of Income, Investment Management – Last Five Quarters | |
In thousands, except share and per share amounts.
Three Months Ended | |||||||||||||||||||
Dec. 31, 2016 | Sep. 30, 2016 | Jun. 30, 2016 | Mar. 31, 2016 | Dec. 31, 2015 | |||||||||||||||
Revenues | |||||||||||||||||||
Reimbursable costs from affiliates | $ | 20,061 | $ | 14,540 | $ | 12,094 | $ | 19,738 | $ | 27,436 | |||||||||
Asset management revenue | 16,375 | 15,978 | 15,005 | 14,613 | 13,748 | ||||||||||||||
Structuring revenue | 16,338 | 12,301 | 5,968 | 12,721 | 24,382 | ||||||||||||||
Dealer manager fees | 2,623 | 1,835 | 1,372 | 2,172 | 2,089 | ||||||||||||||
Other advisory revenue | 1,913 | 522 | — | — | — | ||||||||||||||
57,310 | 45,176 | 34,439 | 49,244 | 67,655 | |||||||||||||||
Operating Expenses | |||||||||||||||||||
Reimbursable costs from affiliates | 20,061 | 14,540 | 12,094 | 19,738 | 27,436 | ||||||||||||||
General and administrative | 15,292 | 8,280 | 12,295 | 11,894 | 13,673 | ||||||||||||||
Subadvisor fees (a) | 4,131 | 4,842 | 1,875 | 3,293 | 2,747 | ||||||||||||||
Dealer manager fees and expenses | 3,808 | 3,028 | 2,620 | 3,352 | 3,519 | ||||||||||||||
Stock-based compensation expense | 2,143 | 2,784 | 3,094 | 4,770 | 3,633 | ||||||||||||||
Depreciation and amortization | 958 | 1,062 | 1,124 | 1,092 | 1,048 | ||||||||||||||
Restructuring and other compensation (b) | — | — | 465 | 7,047 | — | ||||||||||||||
Property acquisition and other expenses (c) | — | — | (285 | ) | 2,669 | 1,026 | |||||||||||||
46,393 | 34,536 | 33,282 | 53,855 | 53,082 | |||||||||||||||
Other Income and Expenses | |||||||||||||||||||
Equity in earnings (losses) of equity method investment in CCIF | 523 | 1,098 | 529 | (155 | ) | (1,174 | ) | ||||||||||||
Other income and (expenses) | 285 | 1,857 | (236 | ) | 96 | (237 | ) | ||||||||||||
808 | 2,955 | 293 | (59 | ) | (1,411 | ) | |||||||||||||
Income (loss) before income taxes | 11,725 | 13,595 | 1,450 | (4,670 | ) | 13,162 | |||||||||||||
(Provision for) benefit from income taxes | (4,452 | ) | (2,624 | ) | (1,193 | ) | 1,563 | (7,141 | ) | ||||||||||
Net Income (Loss) from Investment Management | 7,273 | 10,971 | 257 | (3,107 | ) | 6,021 | |||||||||||||
Net income attributable to noncontrolling interests | — | — | — | — | (5 | ) | |||||||||||||
Net Income (Loss) from Investment Management Attributable to W. P. Carey | $ | 7,273 | $ | 10,971 | $ | 257 | $ | (3,107 | ) | $ | 6,016 | ||||||||
Basic Earnings (Loss) Per Share | $ | 0.07 | $ | 0.10 | $ | 0.00 | $ | (0.03 | ) | $ | 0.06 | ||||||||
Diluted Earnings (Loss) Per Share | $ | 0.07 | $ | 0.10 | $ | 0.00 | $ | (0.03 | ) | $ | 0.06 | ||||||||
Weighted-Average Shares Outstanding | |||||||||||||||||||
Basic | 107,487,181 | 107,221,668 | 106,310,362 | 105,939,161 | 105,818,926 | ||||||||||||||
Diluted | 107,715,965 | 107,468,029 | 106,530,036 | 106,405,453 | 106,383,786 | ||||||||||||||
________
(a) | We earn investment management revenue from CWI 1 and CWI 2 in our role as their advisor. Pursuant to the terms of their subadvisory agreements, however, 20% of the fees we receive from CWI 1 and 25% of the fees we receive from CWI 2 are paid to their respective subadvisors. In connection with the acquisitions of multi-family properties on behalf of CPA®:18 – Global, we entered into agreements with third-party advisors for the day-to-day management of the properties for which we pay 30% of the initial acquisition fees and 100% of asset management fees paid to us by CPA®:18 – Global. |
(b) | Amount represents restructuring and other compensation-related expenses resulting from a reduction in headcount and employee severance arrangements. |
(c) | Amounts for the three months ended June 30, 2016, March 31, 2016 and December 31, 2015 include expenses related to our formal strategic review of $(0.3) million, $2.7 million and $1.0 million, respectively. |
| | Investing for the long runTM | 9 | |
W. P. Carey Inc.
Financial Results – Fourth Quarter 2016
FFO and AFFO, Consolidated – Last Five Quarters | |
In thousands, except share and per share amounts.
Three Months Ended | |||||||||||||||||||
Dec. 31, 2016 | Sep. 30, 2016 | Jun. 30, 2016 | Mar. 31, 2016 | Dec. 31, 2015 | |||||||||||||||
Net income attributable to W. P. Carey | $ | 47,704 | $ | 110,943 | $ | 51,661 | $ | 57,439 | $ | 51,049 | |||||||||
Adjustments: | |||||||||||||||||||
Depreciation and amortization of real property | 61,373 | 61,396 | 65,096 | 82,957 | 72,729 | ||||||||||||||
Impairment charges | 9,433 | 14,441 | 35,429 | — | 7,194 | ||||||||||||||
Gain on sale of real estate, net | (3,248 | ) | (49,126 | ) | (18,282 | ) | (662 | ) | (3,507 | ) | |||||||||
Proportionate share of adjustments for noncontrolling interests to arrive at FFO | (3,184 | ) | (3,254 | ) | (2,662 | ) | (2,625 | ) | (3,585 | ) | |||||||||
Proportionate share of adjustments to equity in net income of partially owned entities to arrive at FFO | 1,059 | 1,354 | 1,331 | 1,309 | 1,275 | ||||||||||||||
Total adjustments | 65,433 | 24,811 | 80,912 | 80,979 | 74,106 | ||||||||||||||
FFO Attributable to W. P. Carey (as defined by NAREIT) (a) | 113,137 | 135,754 | 132,573 | 138,418 | 125,155 | ||||||||||||||
Adjustments: | |||||||||||||||||||
Above- and below-market rent intangible lease amortization, net (b) | 12,653 | 12,564 | 13,105 | (1,818 | ) | 6,810 | |||||||||||||
Other amortization and non-cash items (c) (d) (e) | 5,584 | (4,897 | ) | 404 | (3,202 | ) | 1,714 | ||||||||||||
Straight-line and other rent adjustments (f) | (4,953 | ) | (5,116 | ) | (2,234 | ) | (26,912 | ) | (17,558 | ) | |||||||||
Stock-based compensation | 3,051 | 4,356 | 4,001 | 6,607 | 5,562 | ||||||||||||||
Tax (benefit) expense – deferred | (2,433 | ) | (2,999 | ) | (16,535 | ) | (2,988 | ) | 6,147 | ||||||||||
Realized losses (gains) on foreign currency | 1,102 | 1,559 | 1,222 | (212 | ) | 591 | |||||||||||||
Amortization of deferred financing costs | 926 | 1,007 | 541 | 723 | 630 | ||||||||||||||
Loss (gain) on extinguishment of debt | 224 | 2,072 | (112 | ) | 1,925 | 7,950 | |||||||||||||
Property acquisition and other expenses (g) (h) | 18 | — | (207 | ) | 5,566 | (20,097 | ) | ||||||||||||
Restructuring and other compensation (i) | — | — | 452 | 11,473 | — | ||||||||||||||
Allowance for credit losses | — | — | — | 7,064 | 8,748 | ||||||||||||||
Proportionate share of adjustments to equity in net income of partially owned entities to arrive at AFFO | 2,810 | 261 | (841 | ) | 1,321 | 3,473 | |||||||||||||
Proportionate share of adjustments for noncontrolling interests to arrive at AFFO (j) | (595 | ) | (90 | ) | (131 | ) | 1,499 | 6,426 | |||||||||||
Total adjustments | 18,387 | 8,717 | (335 | ) | 1,046 | 10,396 | |||||||||||||
AFFO Attributable to W. P. Carey (a) | $ | 131,524 | $ | 144,471 | $ | 132,238 | $ | 139,464 | $ | 135,551 | |||||||||
Summary | |||||||||||||||||||
FFO attributable to W. P. Carey (as defined by NAREIT) (a) | $ | 113,137 | $ | 135,754 | $ | 132,573 | $ | 138,418 | $ | 125,155 | |||||||||
FFO attributable to W. P. Carey (as defined by NAREIT) per diluted share (a) | $ | 1.05 | $ | 1.26 | $ | 1.24 | $ | 1.30 | $ | 1.18 | |||||||||
AFFO attributable to W. P. Carey (a) | $ | 131,524 | $ | 144,471 | $ | 132,238 | $ | 139,464 | $ | 135,551 | |||||||||
AFFO attributable to W. P. Carey per diluted share (a) | $ | 1.22 | $ | 1.34 | $ | 1.24 | $ | 1.31 | $ | 1.27 | |||||||||
Diluted weighted-average shares outstanding | 107,715,965 | 107,468,029 | 106,530,036 | 106,405,453 | 106,383,786 | ||||||||||||||
________
(a) | FFO and AFFO are non-GAAP measures. See the Terms and Definitions section in the Appendix for a description of our non-GAAP measures. |
(b) | Amount for the three months ended March 31, 2016 includes an adjustment of $15.6 million due to the acceleration of a below-market lease from a tenant of a domestic property that was sold during the period. |
(c) | Represents primarily unrealized gains and losses from foreign exchange and derivatives. |
(d) | Effective July 1, 2016, the amortization of debt premiums and discounts, which was previously included in Other amortization and non-cash items, is included in Amortization of deferred financing costs. Prior periods are retrospectively adjusted to reflect this change. Amortization of debt premiums and discounts for the three months ended June 30, 2016, March 31, 2016 and December 31, 2015 was $0.8 million, $0.6 million and $0.8 million, respectively. |
(e) | Amount for the three months ended September 30, 2016 includes an adjustment of $0.6 million to exclude a portion of a gain recognized on the deconsolidation of an affiliate. |
(f) | Amount for the three months ended March 31, 2016 includes an adjustment to exclude $27.2 million of the $32.2 million of lease termination income recognized in connection with a domestic property that was sold during the period, as such amount was determined to be non-core income. Amount for the three months ended March 31, 2016 also reflects an adjustment to include $1.8 million of lease termination income received in December 2015 that represented core income for the three months ended March 31, 2016. Amount for the three months ended December 31, 2015 includes an adjustment to exclude $15.0 million related to lease termination income recognized in connection with the aforementioned domestic property, which was determined to be non-core income. |
| | Investing for the long runTM | 10 | |
W. P. Carey Inc.
Financial Results – Fourth Quarter 2016
(g) | Amount for the three months ended December 31, 2015 includes a reversal of $25.0 million of reserves for German real estate transfer taxes, of which $7.9 million was previously recorded as merger expenses in connection with the CPA®:15 Merger in September 2012 and $17.1 million was previously recorded in connection with the restructuring of a German investment, Hellweg 2, in October 2013. At the time of the restructuring, we owned an equity interest in the Hellweg 2 investment, which we jointly owned with CPA®:16 – Global. In connection with the CPA®:16 Merger, we acquired CPA®:16 – Global’s controlling interest in the investment. Therefore, the reversal related to the Hellweg 2 investment has been recorded in Property acquisition and other expenses in the consolidated financial statements for the three months ended December 31, 2015, since we now consolidate the Hellweg 2 investment. |
(h) | Amounts for the three months ended June 30, 2016, March 31, 2016 and December 31, 2015 include expenses related to our formal strategic review of $(0.2) million, $5.5 million and $4.5 million, respectively. |
(i) | Amount represents restructuring and other compensation-related expenses resulting from a reduction in headcount and employee severance arrangements. |
(j) | Amount for the three months ended December 31, 2015 includes CPA®:17 – Global’s $6.3 million share of the reversal of liabilities for German real estate transfer taxes, as described above. |
| | Investing for the long runTM | 11 | |
W. P. Carey Inc.
Financial Results – Fourth Quarter 2016
FFO and AFFO, Owned Real Estate – Last Five Quarters | |
In thousands, except share and per share amounts.
Three Months Ended | |||||||||||||||||||
Dec. 31, 2016 | Sep. 30, 2016 | Jun. 30, 2016 | Mar. 31, 2016 | Dec. 31, 2015 | |||||||||||||||
Net income from Owned Real Estate attributable to W. P. Carey | $ | 40,431 | $ | 99,972 | $ | 51,404 | $ | 60,546 | $ | 45,033 | |||||||||
Adjustments: | |||||||||||||||||||
Depreciation and amortization of real property | 61,373 | 61,396 | 65,096 | 82,957 | 72,729 | ||||||||||||||
Impairment charges | 9,433 | 14,441 | 35,429 | — | 7,194 | ||||||||||||||
Gain on sale of real estate, net | (3,248 | ) | (49,126 | ) | (18,282 | ) | (662 | ) | (3,507 | ) | |||||||||
Proportionate share of adjustments for noncontrolling interests to arrive at FFO | (3,184 | ) | (3,254 | ) | (2,662 | ) | (2,625 | ) | (3,585 | ) | |||||||||
Proportionate share of adjustments to equity in net income of partially owned entities to arrive at FFO | 1,059 | 1,354 | 1,331 | 1,309 | 1,275 | ||||||||||||||
Total adjustments | 65,433 | 24,811 | 80,912 | 80,979 | 74,106 | ||||||||||||||
FFO Attributable to W. P. Carey (as defined by NAREIT) - Owned Real Estate (a) | 105,864 | 124,783 | 132,316 | 141,525 | 119,139 | ||||||||||||||
Adjustments: | |||||||||||||||||||
Above- and below-market rent intangible lease amortization, net (b) | 12,653 | 12,564 | 13,105 | (1,818 | ) | 6,810 | |||||||||||||
Other amortization and non-cash items (c) (d) (e) | 5,698 | (4,356 | ) | 15 | (3,246 | ) | 1,290 | ||||||||||||
Straight-line and other rent adjustments (f) | (4,953 | ) | (5,116 | ) | (2,234 | ) | (26,912 | ) | (17,558 | ) | |||||||||
Tax expense (benefit) – deferred | 2,273 | (3,387 | ) | (14,826 | ) | (1,499 | ) | 1,804 | |||||||||||
Realized losses (gains) on foreign currency | 1,136 | 1,559 | 1,204 | (245 | ) | 594 | |||||||||||||
Amortization of deferred financing costs | 926 | 1,007 | 541 | 723 | 630 | ||||||||||||||
Stock-based compensation | 908 | 1,572 | 907 | 1,837 | 1,929 | ||||||||||||||
Loss (gain) on extinguishment of debt | 224 | 2,072 | (112 | ) | 1,925 | 7,950 | |||||||||||||
Property acquisition and other expenses (g) (h) | 18 | — | 78 | 2,897 | (21,123 | ) | |||||||||||||
Restructuring and other compensation (i) | — | — | (13 | ) | 4,426 | — | |||||||||||||
Allowance for credit losses | — | — | — | 7,064 | 8,748 | ||||||||||||||
Proportionate share of adjustments to equity in net income of partially owned entities to arrive at AFFO | 3,258 | 884 | (312 | ) | 1,038 | 1,767 | |||||||||||||
Proportionate share of adjustments for noncontrolling interests to arrive at AFFO (j) | (595 | ) | (90 | ) | (131 | ) | 1,499 | 6,426 | |||||||||||
Total adjustments | 21,546 | 6,709 | (1,778 | ) | (12,311 | ) | (733 | ) | |||||||||||
AFFO Attributable to W. P. Carey - Owned Real Estate (a) | $ | 127,410 | $ | 131,492 | $ | 130,538 | $ | 129,214 | $ | 118,406 | |||||||||
Summary | |||||||||||||||||||
FFO attributable to W. P. Carey (as defined by NAREIT) - Owned Real Estate (a) | $ | 105,864 | $ | 124,783 | $ | 132,316 | $ | 141,525 | $ | 119,139 | |||||||||
FFO attributable to W. P. Carey (as defined by NAREIT) per diluted share - Owned Real Estate (a) | $ | 0.98 | $ | 1.16 | $ | 1.24 | $ | 1.33 | $ | 1.12 | |||||||||
AFFO attributable to W. P. Carey - Owned Real Estate (a) | $ | 127,410 | $ | 131,492 | $ | 130,538 | $ | 129,214 | $ | 118,406 | |||||||||
AFFO attributable to W. P. Carey per diluted share - Owned Real Estate (a) | $ | 1.18 | $ | 1.22 | $ | 1.22 | $ | 1.21 | $ | 1.11 | |||||||||
Diluted weighted-average shares outstanding | 107,715,965 | 107,468,029 | 106,530,036 | 106,405,453 | 106,383,786 | ||||||||||||||
________
(a) | FFO and AFFO are non-GAAP measures. See the Terms and Definitions section in the Appendix for a description of our non-GAAP measures. |
(b) | Amount for the three months ended March 31, 2016 includes an adjustment of $15.6 million due to the acceleration of a below-market lease from a tenant of a domestic property that was sold during the period. |
(c) | Represents primarily unrealized gains and losses from foreign exchange and derivatives. |
(d) | Effective July 1, 2016, the amortization of debt premiums and discounts, which was previously included in Other amortization and non-cash items, is included in Amortization of deferred financing costs. Prior periods are retrospectively adjusted to reflect this change. Amortization of debt premiums and discounts for the three months ended June 30, 2016, March 31, 2016 and December 31, 2015 was $0.8 million, $0.6 million and $0.8 million, respectively. |
(e) | Amount for the three months ended September 30, 2016 includes an adjustment of $0.6 million to exclude a portion of a gain recognized on the deconsolidation of an affiliate. |
(f) | Amount for the three months ended March 31, 2016 includes an adjustment to exclude $27.2 million of the $32.2 million of lease termination income recognized in connection with a domestic property that was sold during the period, as such amount was determined to be non-core income. Amount for the three months ended March 31, 2016 also reflects an adjustment to include $1.8 million of lease termination income received in December 2015 that represented core income for the three months ended March 31, 2016. Amount for the three months ended December 31, 2015 includes an adjustment to exclude $15.0 million related to lease termination income recognized in connection with the aforementioned domestic property, which was determined to be non-core income. |
| | Investing for the long runTM | 12 | |
W. P. Carey Inc.
Financial Results – Fourth Quarter 2016
(g) | Amount for the three months ended December 31, 2015 includes a reversal of $25.0 million of reserves for German real estate transfer taxes, of which $7.9 million was previously recorded as merger expenses in connection with the CPA®:15 Merger in September 2012 and $17.1 million was previously recorded in connection with the restructuring of a German investment, Hellweg 2, in October 2013. At the time of the restructuring, we owned an equity interest in the Hellweg 2 investment, which we jointly owned with CPA®:16 – Global. In connection with the CPA®:16 Merger, we acquired CPA®:16 – Global’s controlling interest in the investment. Therefore, the reversal related to the Hellweg 2 investment has been recorded in Property acquisition and other expenses in the consolidated financial statements for the three months ended December 31, 2015, since we now consolidate the Hellweg 2 investment. |
(h) | Amounts for the three months ended June 30, 2016, March 31, 2016 and December 31, 2015 include expenses related to our formal strategic review of $0.1 million, $2.8 million and $3.5 million, respectively. |
(i) | Amount represents restructuring and other compensation-related expenses resulting from a reduction in headcount and employee severance arrangements. |
(j) | Amount for the three months ended December 31, 2015 includes CPA®:17 – Global’s $6.3 million share of the reversal of liabilities for German real estate transfer taxes, as described above. |
| | Investing for the long runTM | 13 | |
W. P. Carey Inc.
Financial Results – Fourth Quarter 2016
FFO and AFFO, Investment Management – Last Five Quarters | |
In thousands, except share and per share amounts.
Three Months Ended | |||||||||||||||||||
Dec. 31, 2016 | Sep. 30, 2016 | Jun. 30, 2016 | Mar. 31, 2016 | Dec. 31, 2015 | |||||||||||||||
Net income (loss) from Investment Management attributable to W. P. Carey | $ | 7,273 | $ | 10,971 | $ | 257 | $ | (3,107 | ) | $ | 6,016 | ||||||||
FFO Attributable to W. P. Carey (as defined by NAREIT) - Investment Management (a) | 7,273 | 10,971 | 257 | (3,107 | ) | 6,016 | |||||||||||||
Adjustments: | |||||||||||||||||||
Tax (benefit) expense – deferred | (4,706 | ) | 388 | (1,709 | ) | (1,489 | ) | 4,343 | |||||||||||
Stock-based compensation | 2,143 | 2,784 | 3,094 | 4,770 | 3,633 | ||||||||||||||
Other amortization and non-cash items (b) | (114 | ) | (541 | ) | 389 | 44 | 424 | ||||||||||||
Realized (gains) losses on foreign currency | (34 | ) | — | 18 | 33 | (3 | ) | ||||||||||||
Restructuring and other compensation (c) | — | — | 465 | 7,047 | — | ||||||||||||||
Property acquisition and other expenses (d) | — | — | (285 | ) | 2,669 | 1,026 | |||||||||||||
Proportionate share of adjustments to equity in net income of partially owned entities to arrive at AFFO | (448 | ) | (623 | ) | (529 | ) | 283 | 1,706 | |||||||||||
Total adjustments | (3,159 | ) | 2,008 | 1,443 | 13,357 | 11,129 | |||||||||||||
AFFO Attributable to W. P. Carey - Investment Management (a) | $ | 4,114 | $ | 12,979 | $ | 1,700 | $ | 10,250 | $ | 17,145 | |||||||||
Summary | |||||||||||||||||||
FFO attributable to W. P. Carey (as defined by NAREIT) - Investment Management (a) | $ | 7,273 | $ | 10,971 | $ | 257 | $ | (3,107 | ) | $ | 6,016 | ||||||||
FFO attributable to W. P. Carey (as defined by NAREIT) per diluted share - Investment Management (a) | $ | 0.07 | $ | 0.10 | $ | 0.00 | $ | (0.03 | ) | $ | 0.06 | ||||||||
AFFO attributable to W. P. Carey - Investment Management (a) | $ | 4,114 | $ | 12,979 | $ | 1,700 | $ | 10,250 | $ | 17,145 | |||||||||
AFFO attributable to W. P. Carey per diluted share - Investment Management (a) | $ | 0.04 | $ | 0.12 | $ | 0.02 | $ | 0.10 | $ | 0.16 | |||||||||
Diluted weighted-average shares outstanding | 107,715,965 | 107,468,029 | 106,530,036 | 106,405,453 | 106,383,786 | ||||||||||||||
________
(a) | FFO and AFFO are non-GAAP measures. See the Terms and Definitions section in the Appendix for a description of our non-GAAP measures. |
(b) | Represents primarily unrealized gains and losses from foreign exchange and derivatives. |
(c) | Amount represents restructuring and other compensation-related expenses resulting from a reduction in headcount and employee severance arrangements. |
(d) | Amounts for the three months ended June 30, 2016, March 31, 2016 and December 31, 2015 include expenses related to our formal strategic review of $(0.3) million, $2.7 million and $1.0 million, respectively. |
| | Investing for the long runTM | 14 | |
W. P. Carey Inc.
Financial Results – Fourth Quarter 2016
Reconciliation of Consolidated Statement of Income to AFFO | |
In thousands, except per share amounts. Three months ended December 31, 2016.
We believe that the table below is useful for investors to help them better understand our business by illustrating the impact of each of our AFFO adjustments on our GAAP statement of income. This presentation is not an alternative to the GAAP statement of income, nor is AFFO an alternative to net income as determined by GAAP.
GAAP Basis (a) | Add: Equity Investments (b) | Less: Noncontrolling Interests (c) | WPC's Pro Rata Share (d) | AFFO Adjustments | AFFO | ||||||||||||||||||
Revenues | A | B | C | A + B + C = D | E | D + E | |||||||||||||||||
Owned Real Estate: | |||||||||||||||||||||||
Lease revenues | $ | 157,105 | $ | 4,717 | $ | (5,713 | ) | $ | 156,109 | $ | 7,519 | (e) | $ | 163,628 | |||||||||
Operating property revenues: | |||||||||||||||||||||||
Hotel revenues | 7,071 | — | — | 7,071 | — | 7,071 | |||||||||||||||||
Reimbursable tenant costs | 6,201 | 22 | (142 | ) | 6,081 | — | 6,081 | ||||||||||||||||
Lease termination income and other | 1,093 | — | (1 | ) | 1,092 | (445 | ) | (f) | 647 | ||||||||||||||
171,470 | 4,739 | (5,856 | ) | 170,353 | 7,074 | 177,427 | |||||||||||||||||
Investment Management: | |||||||||||||||||||||||
Reimbursable costs from affiliates | 20,061 | — | — | 20,061 | — | 20,061 | |||||||||||||||||
Asset management revenue | 16,375 | — | — | 16,375 | — | 16,375 | |||||||||||||||||
Structuring revenue | 16,338 | — | — | 16,338 | — | 16,338 | |||||||||||||||||
Dealer manager fees | 2,623 | — | — | 2,623 | — | 2,623 | |||||||||||||||||
Other advisory revenue | 1,913 | — | — | 1,913 | — | 1,913 | |||||||||||||||||
57,310 | — | — | 57,310 | — | 57,310 | ||||||||||||||||||
228,780 | 4,739 | (5,856 | ) | 227,663 | 7,074 | 234,737 | |||||||||||||||||
Operating Expenses | |||||||||||||||||||||||
Depreciation and amortization | 62,675 | 356 | (2,579 | ) | 60,452 | (59,168 | ) | (g) | 1,284 | ||||||||||||||
Reimbursable tenant and affiliate costs | 26,262 | 21 | (142 | ) | 26,141 | — | 26,141 | ||||||||||||||||
General and administrative | 24,230 | — | (8 | ) | 24,222 | — | 24,222 | ||||||||||||||||
Property expenses, excluding reimbursable tenant costs: | |||||||||||||||||||||||
Hotel expenses | 5,551 | — | — | 5,551 | — | 5,551 | |||||||||||||||||
Non-reimbursable property expenses | 5,405 | 41 | (75 | ) | 5,371 | 57 | (h) | 5,428 | |||||||||||||||
Impairment charges | 9,433 | — | (612 | ) | 8,821 | (8,821 | ) | (h) | — | ||||||||||||||
Subadvisor fees (i) | 4,131 | — | — | 4,131 | — | 4,131 | |||||||||||||||||
Dealer manager fees and expenses | 3,808 | — | — | 3,808 | — | 3,808 | |||||||||||||||||
Stock-based compensation expense | 3,051 | — | — | 3,051 | (3,051 | ) | (h) | — | |||||||||||||||
Property acquisition and other expenses | 18 | — | — | 18 | (18 | ) | (j) | — | |||||||||||||||
144,564 | 418 | (3,416 | ) | 141,566 | (71,001 | ) | 70,565 | ||||||||||||||||
Other Income and Expenses | |||||||||||||||||||||||
Interest expense | (43,913 | ) | (568 | ) | 1,731 | (42,750 | ) | 877 | (k) | (41,873 | ) | ||||||||||||
Equity in earnings of equity method investments in the Managed Programs and real estate: | |||||||||||||||||||||||
Income related to our general partnership interests in the Managed REITs (l) | 13,103 | — | (503 | ) | 12,600 | — | 12,600 | ||||||||||||||||
Joint ventures | 3,343 | (3,822 | ) | — | (479 | ) | 703 | (m) | 224 | ||||||||||||||
Income related to our ownership in the Managed Programs | 30 | — | — | 30 | 3,002 | (n) | 3,032 | ||||||||||||||||
Equity in earnings of equity method investments in the Managed Programs and real estate | 16,476 | (3,822 | ) | (503 | ) | 12,151 | 3,705 | 15,856 | |||||||||||||||
Other income and (expenses) | (3,731 | ) | (16 | ) | 128 | (3,619 | ) | 7,019 | (o) | 3,400 | |||||||||||||
(31,168 | ) | (4,406 | ) | 1,356 | (34,218 | ) | 11,601 | (22,617 | ) | ||||||||||||||
Income before income taxes and gain on sale of real estate | 53,048 | (85 | ) | (1,084 | ) | 51,879 | 89,676 | 141,555 | |||||||||||||||
Provision for income taxes | (7,826 | ) | 85 | 318 | (7,423 | ) | (2,608 | ) | (p) | (10,031 | ) | ||||||||||||
Income before gain on sale of real estate | 45,222 | — | (766 | ) | 44,456 | 87,068 | 131,524 | ||||||||||||||||
Gain on sale of real estate, net of tax | 3,248 | — | — | 3,248 | (3,248 | ) | — | ||||||||||||||||
Net Income | 48,470 | — | (766 | ) | 47,704 | 83,820 | 131,524 | ||||||||||||||||
Net income attributable to noncontrolling interests | (766 | ) | — | 766 | — | — | — | ||||||||||||||||
Net Income / AFFO Attributable to W. P. Carey | $ | 47,704 | $ | — | $ | — | $ | 47,704 | $ | 83,820 | $ | 131,524 | |||||||||||
Earnings / AFFO Attributable to W. P. Carey Per Diluted Share | $ | 0.44 | $ | 1.22 | |||||||||||||||||||
________
| | Investing for the long runTM | 15 | |
W. P. Carey Inc.
Financial Results – Fourth Quarter 2016
(a) | Consolidated amounts shown represent WPC's consolidated statement of income for the three months ended December 31, 2016. |
(b) | Represents the break-out by line item of amounts recorded in Equity in earnings of equity method investments in the Managed Programs and real estate. |
(c) | Represents the break-out by line item of amounts recorded in Net income attributable to noncontrolling interests. |
(d) | Represents our share in fully and co-owned entities. See the Terms and Definitions section in the Appendix for a description of pro rata. |
(e) | For the three months ended December 31, 2016, represents the reversal of amortization of above- or below-market lease intangibles of $12.1 million and the elimination of non-cash amounts related to straight-line rent of $4.6 million. |
(f) | Primarily represents an adjustment of other income received from a tenant in May 2016 that was straight-lined for GAAP purposes. |
(g) | Adjustment is a non-cash adjustment excluding corporate depreciation and amortization. |
(h) | Adjustment to exclude a non-cash item. |
(i) | We earn investment management revenue from CWI 1 and CWI 2 in our role as their advisor. Pursuant to the terms of their subadvisory agreements, however, 20% of the fees we receive from CWI 1 and 25% of the fees we receive from CWI 2 are paid to their respective subadvisors. In connection with the acquisitions of multi-family properties on behalf of CPA®:18 – Global, we entered into agreements with third-party advisors for the day-to-day management of the properties for which we pay 30% of the initial acquisition fees and 100% of asset management fees paid to us by CPA®:18 – Global. |
(j) | Adjustment to exclude a non-core item. |
(k) | Represents the elimination of non-cash components of interest expense, such as deferred financing costs, debt premiums and discounts. |
(l) | Amount includes 100% of CWI 2 general operating partnership distribution, including $0.3 million paid to subadvisors. |
(m) | Adjustments to include our pro rata share of AFFO adjustments from equity investments. |
(n) | Represents Adjusted MFFO from the Managed Programs in place of our pro rata share of net income from our ownership in the Managed Programs. Adjusted MFFO is defined as MFFO adjusted for deferred taxes and excluding the adjustment for realized gains and losses on hedges. |
(o) | Represents eliminations of gains (losses) related to the extinguishment of debt, foreign currency, unrealized gains (losses) on derivatives and other items. |
(p) | Represents primarily the elimination of deferred taxes. |
| | Investing for the long runTM | 16 | |
W. P. Carey Inc.
Financial Results – Fourth Quarter 2016
Capital Expenditures | |
In thousands. For the three months ended December 31, 2016.
Tenant Improvements and Leasing Costs | |||
Tenant improvements | $ | 251 | |
Leasing costs | 1,047 | ||
Tenant Improvements and Leasing Costs | 1,298 | ||
Maintenance Capital Expenditures | |||
Net-lease properties | 483 | ||
Operating properties | 47 | ||
Maintenance Capital Expenditures | 530 | ||
Total: Tenant Improvements and Leasing Costs, and Maintenance Capital Expenditures | $ | 1,828 | |
Non-maintenance Capital Expenditures | |||
Build-to-suits, redevelopments and expansions | $ | 13,152 | |
Other non-maintenance capital expenditures | 1,197 | ||
Total: Non-maintenance Capital Expenditures | $ | 14,349 | |
Build-to-Suits, Redevelopments and Expansions (a) (b) | |
Dollars in thousands.
Property Type | Estimated /Actual Completion | Estimated New Square Footage | Lease Term (Years) | Funded During Three Months Ended Dec. 31, 2016 | Total Funded Through Dec. 31, 2016 | Maximum Commitment | ||||||||||||||||||||||
Tenant | Location | Remaining | Total | |||||||||||||||||||||||||
Active | ||||||||||||||||||||||||||||
Inghams (c) (d) | Australia | Industrial | 1Q17 | 386,705 | 18 | $ | — | $ | 10,025 | 4,989 | $ | 14,744 | ||||||||||||||||
Nord Anglia (e) | Coconut Creek, FL | Education Facility | 1Q17 | 40,000 | 25 | 3,328 | 15,505 | 2,675 | 18,578 | |||||||||||||||||||
Leipold | Windsor, CT | Industrial | 1Q17 | 22,704 | 20 | 1,044 | 3,044 | 486 | 3,530 | |||||||||||||||||||
Gestamp (c) | McCalla, AL | Industrial | 3Q17 | 178,000 | 20 | 4,663 | 4,663 | 16,813 | 21,476 | |||||||||||||||||||
Completed | ||||||||||||||||||||||||||||
Tire Rack, Inc. | Doraville, GA | Industrial | 4Q16 | 365,640 | 10 | 4,117 | 13,764 | — | 13,764 | |||||||||||||||||||
$ | 13,152 | $ | 47,001 | $ | 24,963 | $ | 72,092 | |||||||||||||||||||||
________
(a) | This schedule includes future estimates for which we can give no assurance as to timing or amounts. |
(b) | Funding amounts exclude land acquisition costs and capitalized construction interest. |
(c) | Rent commences at funding. |
(d) | Commitment amounts are based on foreign exchange rate of the Australian dollar at period end. |
(e) | Remaining commitment is reduced by construction rent incurred to date. |
| | Investing for the long runTM | 17 | |
W. P. Carey Inc.
Balance Sheets and Capitalization
Fourth Quarter 2016
| | Investing for the long runTM | 18 | |
W. P. Carey Inc.
Balance Sheets and Capitalization – Fourth Quarter 2016
Consolidated Balance Sheets | |
In thousands.
Dec. 31, | |||||||
2016 | 2015 | ||||||
Assets | |||||||
Investments in real estate: | |||||||
Real estate, at cost | $ | 5,204,126 | $ | 5,309,925 | |||
Operating real estate, at cost | 81,711 | 82,749 | |||||
Accumulated depreciation | (484,437 | ) | (381,529 | ) | |||
Net investments in properties | 4,801,400 | 5,011,145 | |||||
Net investments in direct financing leases | 684,059 | 756,353 | |||||
Assets held for sale (a) | 26,247 | 59,046 | |||||
Net investments in real estate | 5,511,706 | 5,826,544 | |||||
Equity investments in the Managed Programs and real estate (b) | 298,893 | 275,473 | |||||
Cash and cash equivalents | 155,482 | 157,227 | |||||
Due from affiliates (c) | 299,610 | 62,218 | |||||
In-place lease and tenant relationship intangible assets, net | 826,113 | 902,848 | |||||
Goodwill | 635,920 | 681,809 | |||||
Above-market rent intangible assets, net | 421,456 | 475,072 | |||||
Other assets, net | 304,774 | 360,898 | |||||
Total Assets | $ | 8,453,954 | $ | 8,742,089 | |||
Liabilities and Equity | |||||||
Liabilities: | |||||||
Senior Unsecured Notes, net | $ | 1,807,200 | $ | 1,476,084 | |||
Non-recourse debt, net | 1,706,921 | 2,269,421 | |||||
Senior Unsecured Credit Facility - Revolver | 676,715 | 485,021 | |||||
Senior Unsecured Credit Facility - Term Loan, net | 249,978 | 249,683 | |||||
Accounts payable, accrued expenses and other liabilities | 266,917 | 342,374 | |||||
Below-market rent and other intangible liabilities, net | 122,203 | 154,315 | |||||
Deferred income taxes | 90,825 | 86,104 | |||||
Distributions payable | 107,090 | 102,715 | |||||
Total liabilities | 5,027,849 | 5,165,717 | |||||
Redeemable noncontrolling interest | 965 | 14,944 | |||||
Equity: | |||||||
W. P. Carey stockholders' equity: | |||||||
Preferred stock (none issued) | — | — | |||||
Common stock | 106 | 104 | |||||
Additional paid-in capital | 4,399,651 | 4,282,042 | |||||
Distributions in excess of accumulated earnings | (893,827 | ) | (738,652 | ) | |||
Deferred compensation obligation | 50,222 | 56,040 | |||||
Accumulated other comprehensive loss | (254,485 | ) | (172,291 | ) | |||
Total W. P. Carey stockholders' equity | 3,301,667 | 3,427,243 | |||||
Noncontrolling interests | 123,473 | 134,185 | |||||
Total equity | 3,425,140 | 3,561,428 | |||||
Total Liabilities and Equity | $ | 8,453,954 | $ | 8,742,089 | |||
(a) | At December 31, 2016, we had one property classified as Assets held for sale. Subsequent to December 31, 2016, we sold this property. At December 31, 2015, we had two properties classified as Assets held for sale, both of which were disposed of during the year ended December 31, 2016. |
(b) | Our equity investments in the Managed Programs totaled $160.8 million and $133.5 million as of December 31, 2016 and 2015, respectively. Our equity investments in real estate joint ventures totaled $138.1 million and $142.0 million as of December 31, 2016 and 2015, respectively. |
(c) | As of December 31, 2016, this amount includes short-term loans to our affiliates CWI 2 and CPA®:18 – Global totaling $237.6 million, including accrued interest. Subsequent to December 31, 2016 and through February 23, 2017, CWI 2 repaid in full the $210.0 million loan that was outstanding to us at December 31, 2016. |
| | Investing for the long runTM | 19 | |
W. P. Carey Inc.
Balance Sheets and Capitalization – Fourth Quarter 2016
Capitalization | |
In thousands, except share and per share amounts. As of December 31, 2016.
Description | Shares | Share Price | Market Value | ||||||||||
Equity | |||||||||||||
Common Equity | 106,294,162 | $ | 59.09 | $ | 6,280,922 | ||||||||
Preferred Equity | — | ||||||||||||
Total Equity Market Capitalization | 6,280,922 | ||||||||||||
Outstanding Balance | |||||||||||||
Pro Rata Debt | |||||||||||||
Non-Recourse Debt | 1,638,560 | ||||||||||||
Senior Unsecured Credit Facility – Revolver | 676,715 | ||||||||||||
Senior Unsecured Credit Facility – Term Loan | 250,000 | ||||||||||||
Senior Unsecured Notes: | |||||||||||||
Senior Unsecured Notes (due January 20, 2023) | 527,050 | ||||||||||||
Senior Unsecured Notes (due April 1, 2024) | 500,000 | ||||||||||||
Senior Unsecured Notes (due February 1, 2025) | 450,000 | ||||||||||||
Senior Unsecured Notes (due October 1, 2026) | 350,000 | ||||||||||||
Total Pro Rata Debt | 4,392,325 | ||||||||||||
Total Capitalization | $ | 10,673,247 | |||||||||||
| | Investing for the long runTM | 20 | |
W. P. Carey Inc.
Balance Sheets and Capitalization – Fourth Quarter 2016
Debt Overview | |
Dollars in thousands. Pro rata. As of December 31, 2016.
Weighted - Average Maturity (Years) | Weighted- Average Interest Rate | Total Outstanding Balance (a) (b) | Percent | |||||||||
Non-Recourse Debt | ||||||||||||
Fixed | 4.1 | 5.6 | % | $ | 1,303,929 | 29.7 | % | |||||
Variable: | ||||||||||||
Floating | 1.5 | 1.6 | % | 188,730 | 4.3 | % | ||||||
Swapped | 3.5 | 5.0 | % | 129,307 | 2.9 | % | ||||||
Capped | 4.6 | 3.3 | % | 16,594 | 0.4 | % | ||||||
Total Pro Rata Non-Recourse Debt | 3.7 | 5.1 | % | 1,638,560 | 37.3 | % | ||||||
Recourse Debt | ||||||||||||
Fixed: | ||||||||||||
Senior Unsecured Notes (due January 20, 2023) | 6.1 | 2.0 | % | 527,050 | ||||||||
Senior Unsecured Notes (due April 1, 2024) | 7.3 | 4.6 | % | 500,000 | ||||||||
Senior Unsecured Notes (due February 1, 2025) | 8.1 | 4.0 | % | 450,000 | ||||||||
Senior Unsecured Notes (due October 1, 2026) | 9.8 | 4.3 | % | 350,000 | ||||||||
Total Senior Unsecured Notes | 7.6 | 3.6 | % | 1,827,050 | 41.6 | % | ||||||
Variable: | ||||||||||||
Senior Unsecured Credit Facility – Revolver (due January 31, 2018) (c) (d) | 1.1 | 1.4 | % | 676,715 | 15.4 | % | ||||||
Senior Unsecured Credit Facility – Term Loan (due January 31, 2018) (d) | 0.1 | 1.9 | % | 250,000 | 5.7 | % | ||||||
Total Recourse Debt | 5.3 | 2.9 | % | 2,753,765 | 62.7 | % | ||||||
Total Pro Rata Debt Outstanding (a) | 4.7 | 3.7 | % | $ | 4,392,325 | 100.0 | % | |||||
________
(a) | Debt data is presented on a pro rata basis. See the Terms and Definitions section in the Appendix for a description of pro rata. |
(b) | Excludes unamortized discount, net totaling $8.6 million and unamortized deferred financing costs totaling $13.8 million as of December 31, 2016. |
(c) | Based on the applicable currency, we incurred interest at the London Interbank Offered Rate (LIBOR) or the Euro Interbank Offered Rate (EURIBOR) plus 1.10% on our Senior Unsecured Credit Facility – Revolver. Availability under our Senior Unsecured Credit Facility – Revolver was $822.6 million as of December 31, 2016. |
(d) | On January 26, 2017, we exercised our option to extend the maturity date of our Senior Unsecured Credit Facility – Term Loan by one year; the new maturity date was January 31, 2018. On February 22, 2017, we amended and restated our existing $1.75 billion unsecured credit facility, to be comprised of a $1.5 billion revolving credit facility maturing in four years with two six-month extension options and a €236.3 million ($250.0 million) term loan maturing in five years. We also entered into a new $100.0 million unsecured delayed draw term loan maturing in five years. |
| | Investing for the long runTM | 21 | |
W. P. Carey Inc.
Balance Sheets and Capitalization – Fourth Quarter 2016
Debt by Currency | ||||
Dollars in thousands. Pro rata. As of December 31, 2016.
USD | EUR | Other Currencies (a) | Total | ||||||||||||||||
Outstanding Balance (in USD) | Weighted- Average Interest Rate | Outstanding Balance (in USD) | Weighted- Average Interest Rate | Outstanding Balance (in USD) | Weighted- Average Interest Rate | Outstanding Balance (in USD) (b) (c) | Weighted- Average Interest Rate | ||||||||||||
Non-Recourse Debt | |||||||||||||||||||
Fixed | $ | 966,030 | $ | 310,962 | $ | 26,937 | $ | 1,303,929 | |||||||||||
Variable | 170,394 | 164,237 | — | 334,631 | |||||||||||||||
Total Pro Rata Non-Recourse Debt | 1,136,424 | 5.5% | 475,199 | 3.9% | 26,937 | 6.2% | 1,638,560 | 5.1% | |||||||||||
Recourse Debt | |||||||||||||||||||
Fixed: | |||||||||||||||||||
Senior Unsecured Notes | 1,300,000 | 527,050 | — | 1,827,050 | |||||||||||||||
Variable: | |||||||||||||||||||
Senior Unsecured Credit Facility – Revolver | 390,000 | 286,715 | — | 676,715 | |||||||||||||||
Senior Unsecured Credit Facility – Term Loan | 250,000 | — | — | 250,000 | |||||||||||||||
Total Recourse Debt | 1,940,000 | 3.5% | 813,765 | 1.6% | — | —% | 2,753,765 | 2.9% | |||||||||||
Total Pro Rata Debt Outstanding (b) (c) | $ | 3,076,424 | 4.3% | $ | 1,288,964 | 2.4% | $ | 26,937 | 6.2% | $ | 4,392,325 | 3.7% | |||||||
________
(a) | Other currencies include debt denominated in Canadian dollar, British pound sterling, Japanese yen, Malaysian ringgit and Thai baht. |
(b) | Debt data is presented on a pro rata basis. See the Terms and Definitions section in the Appendix for a description of pro rata. |
(c) | Excludes unamortized discount, net totaling $8.6 million and unamortized deferred financing costs totaling $13.8 million as of December 31, 2016. |
| | Investing for the long runTM | 22 | |
W. P. Carey Inc.
Balance Sheets and Capitalization – Fourth Quarter 2016
Debt Maturity | |
Dollars in thousands. Pro rata. As of December 31, 2016.
Real Estate | Debt | ||||||||||||||||||||
Number of Properties (a) | Weighted- Average Interest Rate | Total Outstanding Balance (b) (c) | |||||||||||||||||||
Year of Maturity | ABR (a) | Balloon | Percent | ||||||||||||||||||
Non-Recourse Debt | |||||||||||||||||||||
2017 | 68 | 55,200 | 5.2 | % | 374,636 | 377,691 | 8.6 | % | |||||||||||||
2018 | 34 | 38,761 | 3.8 | % | 214,599 | 224,482 | 5.1 | % | |||||||||||||
2019 | 11 | 17,144 | 6.1 | % | 51,450 | 60,422 | 1.4 | % | |||||||||||||
2020 | 22 | 46,026 | 4.7 | % | 215,621 | 253,795 | 5.8 | % | |||||||||||||
2021 | 14 | 24,406 | 5.6 | % | 105,448 | 126,568 | 2.9 | % | |||||||||||||
2022 | 30 | 42,110 | 5.1 | % | 201,610 | 243,702 | 5.5 | % | |||||||||||||
2023 | 26 | 36,544 | 5.2 | % | 91,087 | 149,248 | 3.4 | % | |||||||||||||
2024 | 22 | 20,493 | 5.9 | % | 3,444 | 62,396 | 1.4 | % | |||||||||||||
2025 | 13 | 13,723 | 5.0 | % | 46,366 | 83,289 | 1.9 | % | |||||||||||||
2026 | 7 | 9,921 | 6.6 | % | 18,992 | 45,425 | 1.0 | % | |||||||||||||
2027 | 1 | 2,422 | 5.8 | % | — | 11,542 | 0.3 | % | |||||||||||||
Total Pro Rata Non-Recourse Debt | 248 | $ | 306,750 | 5.1 | % | $ | 1,323,253 | 1,638,560 | 37.3 | % | |||||||||||
Recourse Debt | |||||||||||||||||||||
Senior Unsecured Notes (due January 20, 2023) | 2.0 | % | 527,050 | ||||||||||||||||||
Senior Unsecured Notes (due April 1, 2024) | 4.6 | % | 500,000 | ||||||||||||||||||
Senior Unsecured Notes (due February 1, 2025) | 4.0 | % | 450,000 | ||||||||||||||||||
Senior Unsecured Notes (due October 1, 2026) | 4.3 | % | 350,000 | ||||||||||||||||||
Total Senior Unsecured Notes | 3.6 | % | 1,827,050 | 41.6 | % | ||||||||||||||||
Senior Unsecured Credit Facility – Revolver (due January 31, 2018) (d) (e) | 1.4 | % | 676,715 | 15.4 | % | ||||||||||||||||
Senior Unsecured Credit Facility – Term Loan (due January 31, 2018) (e) | 1.9 | % | 250,000 | 5.7 | % | ||||||||||||||||
Total Recourse Debt (e) | 2.9 | % | 2,753,765 | 62.7 | % | ||||||||||||||||
Total Pro Rata Debt Outstanding | 3.7 | % | $ | 4,392,325 | 100.0 | % | |||||||||||||||
________
(a) | Represents the number of properties and ABR associated with the debt that is maturing in each respective year. |
(b) | Debt maturity data is presented on a pro rata basis. See the Terms and Definitions section in the Appendix for a description of pro rata. Total outstanding balance includes balloon payments and scheduled amortization for our non-recourse debt. |
(c) | Excludes unamortized discount, net totaling $8.6 million and unamortized deferred financing costs totaling $13.8 million as of December 31, 2016. |
(d) | Based on the applicable currency, we incurred interest at the LIBOR or the EURIBOR plus 1.10% on our Senior Unsecured Credit Facility – Revolver. Availability under our Senior Unsecured Credit Facility – Revolver was $822.6 million as of December 31, 2016. |
(e) | On January 26, 2017, we exercised our option to extend the maturity date of our Senior Unsecured Credit Facility – Term Loan by one year; the new maturity date was January 31, 2018. On February 22, 2017, we amended and restated our existing $1.75 billion unsecured credit facility, to be comprised of a $1.5 billion revolving credit facility maturing in four years with two six-month extension options and a €236.3 million ($250.0 million) term loan maturing in five years. We also entered into a new $100.0 million unsecured delayed draw term loan maturing in five years. |
| | Investing for the long runTM | 23 | |
W. P. Carey Inc.
Balance Sheets and Capitalization – Fourth Quarter 2016
Senior Unsecured Notes | |
As of December 31, 2016.
Ratings
Issuer / Corporate | Senior Unsecured Notes | |||||||
Ratings Agency | Rating | Outlook | Rating | Outlook | ||||
Standard & Poor's | BBB | Stable | BBB | Stable | ||||
Moody's | Baa2 | Stable | Baa2 | Stable | ||||
Senior Unsecured Note Covenants
The following is a summary of the key financial covenants for the Senior Unsecured Notes, along with our estimated calculations of our compliance with those covenants at the end of the period presented. These ratios are not measures of our liquidity or performance and serve only to demonstrate our ability to incur additional debt, as permitted by the covenants for the Senior Unsecured Notes.
Covenant | Metric | Required | As of December 31, 2016 | |||
Limitation on the incurrence of debt | "Total Debt" / "Total Assets" | ≤ 60% | 46.5% | |||
Limitation on the incurrence of secured debt | "Secured Debt" / "Total Assets" | ≤ 40% | 17.8% | |||
Limitation on the incurrence of debt based on consolidated EBITDA to annual debt service charge | "Consolidated EBITDA" / "Annual Debt Service Charge" | ≥ 1.5x | 4.3x | |||
Maintenance of unencumbered asset value | "Unencumbered Assets" / "Total Unsecured Debt" | ≥ 150% | 179.0% | |||
| | Investing for the long runTM | 24 | |
W. P. Carey Inc.
Owned Real Estate
Fourth Quarter 2016
| | Investing for the long runTM | 25 | |
W. P. Carey Inc.
Owned Real Estate Portfolio – Fourth Quarter 2016
Investment Activity – Acquisitions and Dispositions | |
Dollars in thousands. Pro rata. For the year ended December 31, 2016.
Acquisitions and Construction Projects Tenant / Lease Guarantor | Property Location(s) | Purchase Price | Closing Date / Asset Completion Date | Property Type(s) | Gross Square Footage | ||||||||
Constructed Properties Upon Purchase | |||||||||||||
1Q16 (N/A) | |||||||||||||
2Q16 | |||||||||||||
Nord Anglia Education (3 properties) (a) | Coconut Creek and Windermere, FL; and Houston, TX | $ | 167,673 | Apr-16; May-16 | Education Facility | 591,874 | |||||||
Forterra Building Products (49 properties) (b) | Various, United States (43 properties) and Canada (6 properties) | 218,162 | Apr-16 | Industrial | 4,069,982 | ||||||||
2Q16 Total | 385,835 | 4,661,856 | |||||||||||
3Q16 (N/A) | |||||||||||||
4Q16 | |||||||||||||
Forterra Building Products | San Antonio, TX | 3,801 | Oct-16 | Industrial | 84,589 | ||||||||
ABC Group Inc. (14 properties) (c) (d) | Various, Canada (6 properties); Mexico (4 properties); and United States (4 properties) | 140,669 | Nov-16; Dec-16 | Industrial; Office; Warehouse | 2,376,462 | ||||||||
4Q16 Total | 144,470 | 2,461,051 | |||||||||||
Year-to-Date Total | 530,305 | 7,122,907 | |||||||||||
Completed Build-to-Suit, Redevelopment and Expansion Properties | |||||||||||||
1Q16 (N/A) | |||||||||||||
2Q16 (N/A) | |||||||||||||
3Q16 (N/A) | |||||||||||||
4Q16 | |||||||||||||
Tire Rack, Inc. (e) (f) | Doraville, GA | 13,764 | Oct-16 | Industrial | 365,640 | ||||||||
13,764 | 365,640 | ||||||||||||
Year-to-Date Total | 13,764 | 365,640 | |||||||||||
Year-to-Date Total Acquisitions and Construction Projects | $ | 544,069 | 7,488,547 | ||||||||||
| | Investing for the long runTM | 26 | |
W. P. Carey Inc.
Owned Real Estate Portfolio – Fourth Quarter 2016
Investment Activity – Acquisitions and Dispositions (continued) | |
Dollars in thousands. Pro rata. For the year ended December 31, 2016.
Dispositions Tenant / Lease Guarantor | Property Location(s) | Gross Sale Price | Closing Date | Property Type(s) | Gross Square Footage | ||||||||
1Q16 | |||||||||||||
Carey Storage (sold 38.3% interest) | Taunton, MA | $ | 1,532 | Feb-16 | Self Storage | 19,754 | |||||||
Kraft Foods Group, Inc. (g) | Northfield, IL | 44,700 | Feb-16 | Office | 679,109 | ||||||||
Humco Holding Group, Inc. (vacant land parcel) | Orem, UT | 1,000 | Mar-16 | Land | N/A | ||||||||
Amylin Pharmaceuticals, Inc. (2 properties) | San Diego, CA | 55,000 | Mar-16 | Office | 144,311 | ||||||||
1Q16 Total | 102,232 | 843,174 | |||||||||||
2Q16 | |||||||||||||
Vacant (formerly Pohjola Insurance Company) (b) (h) | Helsinki, Finland | 60,898 | Apr-16 | Office | 391,522 | ||||||||
Ericsson | Piscataway, NJ | 92,500 | May-16 | Office | 491,966 | ||||||||
Vacant (formerly Hibbett Sports, Inc.) | Birmingham, AL | 6,000 | Jun-16 | Warehouse | 219,312 | ||||||||
AutoZone, Inc. | Bessemer, AL | 337 | Jun-16 | Retail | 5,400 | ||||||||
2Q16 Total | 159,735 | 1,108,200 | |||||||||||
3Q16 | |||||||||||||
Logidis (b) | Cholet, France | 8,351 | Jul-16 | Warehouse | 216,712 | ||||||||
Vacant (formerly Fiserv, Inc.) (i) | Norcross, GA | 24,307 | Jul-16 | Office | 220,676 | ||||||||
Advanced Micro Devices | Sunnyvale, CA | 175,000 | Aug-16 | Office | 362,000 | ||||||||
Atrium Windows and Doors, Inc. | Wylie, TX | 9,000 | Aug-16 | Industrial | 207,700 | ||||||||
3Q16 Total | 216,658 | 1,007,088 | |||||||||||
4Q16 | |||||||||||||
Forterra Building Products (b) | Mascouche, Canada | 3,801 | Oct-16 | Industrial | 28,548 | ||||||||
John McGavigan Limited (b) (j) | Glasgow, United Kingdom | 4,461 | Oct-16 | Industrial | 112,099 | ||||||||
Carrefour France SAS (14 properties) (b) | Various, France | 115,521 | Oct-16 | Warehouse; Retail | 5,826,446 | ||||||||
SAPA Canada, Inc. (b) | Guelph, Canada | 4,777 | Oct-16 | Industrial | 72,352 | ||||||||
Carrefour France SAS (b) | Lagnieu, France | 11,960 | Oct-16 | Warehouse | 454,845 | ||||||||
Vacant (formerly Humco Holding Group, Inc.) | Orem, UT | 3,550 | Nov-16 | Industrial | 40,528 | ||||||||
Vacant (formerly Plexus Corporation) | Neenah, WI | 2,000 | Dec-16 | Industrial | 152,618 | ||||||||
JDS Uniphase Corporation | Robbinsville, NJ | 11,448 | Dec-16 | Industrial | 134,637 | ||||||||
4Q16 Total | 157,518 | 6,822,073 | |||||||||||
Year-to-Date Total Dispositions | $ | 636,143 | 9,780,535 | ||||||||||
________
(a) | We have also agreed to provide an additional $128.1 million of build-to-suit financing over the next four years in order to fund expansions of the existing facilities. The consummation of build-to-suit financing is subject to the satisfaction of various closing conditions, and there can be no assurance that we will enter into the build-to-suit financing. |
(b) | Amount reflects the applicable exchange rate on the date of the transaction. |
(c) | Purchase price for international properties is denominated in U.S. dollars. |
(d) | Tenant has 15 addresses for 14 properties, subject to three master leases denominated in U.S. dollars. |
(e) | Square footage represents total property square footage. A portion of this property is vacant as of December 31, 2016. |
(f) | Amount placed into service excludes capitalized interest of $0.1 million. |
(g) | In connection with this disposition, we recognized lease termination income of $32.2 million during the year ended December 31, 2016. |
(h) | In April 2016, we transferred ownership of this property and the related non-recourse mortgage loan to the mortgage lender. Amount represents the carrying value of the mortgage loan on date of transfer. |
(i) | In July 2016, this property was foreclosed upon. Amount represents the carrying value of the mortgage loan on date of foreclosure, less cash held in escrow that was retained by the mortgage lender. |
(j) | In October 2016, we transferred ownership of this property and the related non-recourse mortgage loan to the mortgage lender. Amount represents the carrying value of the mortgage loan on date of transfer. |
| | Investing for the long runTM | 27 | |
W. P. Carey Inc.
Owned Real Estate Portfolio – Fourth Quarter 2016
Joint Ventures | |
Dollars in thousands. As of December 31, 2016.
Joint Venture or JV (Principal Tenant) | JV Partnership | Consolidated | Pro Rata (a) | |||||||||||||||||
Partner | WPC % | Debt Outstanding | ABR | Debt Outstanding | ABR | |||||||||||||||
Unconsolidated Joint Ventures (Equity Method Investments) | ||||||||||||||||||||
Wanbishi Archives Co. Ltd. (b) | CPA®:17 – Global | 3.00% | $ | 22,209 | $ | 2,606 | $ | 666 | $ | 78 | ||||||||||
C1000 Logistiek Vastgoed B.V. (b) | CPA®:17 – Global | 15.00% | 68,740 | 12,904 | 10,311 | 1,936 | ||||||||||||||
Actebis Peacock GmbH (b) | CPA®:17 – Global | 30.00% | — | 3,447 | — | 1,034 | ||||||||||||||
Waldaschaff Automotive GmbH and Wagon Automotive Nagold GmbH (b) | CPA®:17 – Global | 33.33% | — | 2,980 | — | 993 | ||||||||||||||
Frontier Spinning Mills, Inc. | CPA®:17 – Global | 40.00% | — | 5,135 | — | 2,054 | ||||||||||||||
The New York Times Company | CPA®:17 – Global | 45.00% | 103,959 | 26,844 | 46,782 | 12,080 | ||||||||||||||
Total Unconsolidated Joint Ventures | 194,908 | 53,916 | 57,759 | 18,175 | ||||||||||||||||
Consolidated Joint Ventures | ||||||||||||||||||||
Berry Plastics Corporation | CPA®:17 – Global | 50.00% | 24,227 | 7,310 | 12,113 | 3,655 | ||||||||||||||
Tesco PLC (b) | CPA®:17 – Global | 51.00% | 32,537 | 5,993 | 16,594 | 3,056 | ||||||||||||||
Dick’s Sporting Goods, Inc. | CPA®:17 – Global | 55.10% | 19,436 | 3,410 | 10,709 | 1,879 | ||||||||||||||
Hellweg Die Profi-Baumärkte GmbH & Co. KG (b) | CPA®:17 – Global | 63.48% | 240,940 | 29,690 | 152,157 | 18,846 | ||||||||||||||
Eroski Sociedad Cooperativa (b) | CPA®:17 – Global | 70.00% | — | 2,142 | — | 1,499 | ||||||||||||||
Multi-tenant property in Illkirch-Graffens, France (b) | Third party | 75.00% | 6,993 | 590 | 5,245 | 443 | ||||||||||||||
U-Haul Moving Partners, Inc. and Mercury Partners, LP | CPA®:17 – Global | 88.46% | — | 36,008 | — | 31,853 | ||||||||||||||
McCoy-Rockford, Inc. | Third party | 90.00% | 3,594 | 857 | 3,235 | 771 | ||||||||||||||
Total Consolidated Joint Ventures | 327,727 | 86,000 | 200,053 | 62,002 | ||||||||||||||||
Total Unconsolidated and Consolidated Joint Ventures | $ | 522,635 | $ | 139,916 | $ | 257,812 | $ | 80,177 | ||||||||||||
________
(a) | See the Terms and Definitions section in the Appendix for a description of pro rata. |
(b) | Amounts are based on the applicable exchange rate at the end of the period. |
| | Investing for the long runTM | 28 | |
W. P. Carey Inc.
Owned Real Estate Portfolio – Fourth Quarter 2016
Top Ten Tenants | |
In thousands, except percentages. Pro rata. As of December 31, 2016.
Tenant / Lease Guarantor | Property Type | Tenant Industry | Location | Number of Properties | ABR | ABR Percent | ||||||||||
Hellweg Die Profi-Baumärkte GmbH & Co. KG (a) | Retail | Retail Stores | Germany | 53 | $ | 32,019 | 4.9 | % | ||||||||
U-Haul Moving Partners Inc. and Mercury Partners, LP | Self Storage | Cargo Transportation, Consumer Services | Various U.S. | 78 | 31,853 | 4.8 | % | |||||||||
State of Andalucia (a) | Office | Sovereign and Public Finance | Spain | 70 | 25,253 | 3.8 | % | |||||||||
Pendragon Plc (a) | Retail | Retail Stores, Consumer Services | United Kingdom | 73 | 20,682 | 3.1 | % | |||||||||
Marriott Corporation | Hotel | Hotel, Gaming and Leisure | Various U.S. | 18 | 19,774 | 3.0 | % | |||||||||
Forterra Building Products (a) (b) | Industrial | Construction and Building | Various U.S. and Canada | 49 | 16,981 | 2.6 | % | |||||||||
True Value Company | Warehouse | Retail Stores | Various U.S. | 7 | 15,372 | 2.3 | % | |||||||||
OBI Group (a) | Office, Retail | Retail Stores | Poland | 18 | 14,375 | 2.2 | % | |||||||||
UTI Holdings, Inc. | Education Facility | Consumer Services | Various U.S. | 5 | 14,359 | 2.2 | % | |||||||||
ABC Group Inc. (c) | Industrial, Office, Warehouse | Automotive | Various Canada, Mexico, and U.S. | 14 | 13,771 | 2.1 | % | |||||||||
Total (d) | 385 | $ | 204,439 | 31.0 | % | |||||||||||
________
(a) | ABR amounts are subject to fluctuations in foreign currency exchange rates. |
(b) | Of the 49 properties leased to Forterra Building Products, 44 are located in the United States and five are located in Canada. |
(c) | Of the 14 properties leased to ABC Group Inc., six are located in Canada, four are located in Mexico and four are located in the United States. Tenant has 15 addresses for 14 properties, subject to three master leases denominated in U.S. dollars. |
(d) | See the Terms and Definitions section in the Appendix for a description of pro rata. |
| | Investing for the long runTM | 29 | |
W. P. Carey Inc.
Owned Real Estate Portfolio – Fourth Quarter 2016
Diversification by Property Type | |
In thousands, except percentages. Pro rata. As of December 31, 2016.
Total Net-Lease Portfolio | Unencumbered Net-Lease Portfolio (a) | ||||||||||||||||||||||||||
Property Type | ABR | ABR Percent | Square Footage | Sq. ft. Percent | ABR | ABR Percent | Square Footage | Sq. ft. Percent | |||||||||||||||||||
U.S. | |||||||||||||||||||||||||||
Industrial | $ | 137,340 | 20.8 | % | 28,245 | 32.2 | % | $ | 63,839 | 18.1 | % | 13,988 | 28.0 | % | |||||||||||||
Office | 101,590 | 15.4 | % | 6,237 | 7.1 | % | 37,465 | 10.6 | % | 2,772 | 5.5 | % | |||||||||||||||
Retail | 27,500 | 4.2 | % | 2,248 | 2.6 | % | 10,627 | 3.0 | % | 1,039 | 2.1 | % | |||||||||||||||
Warehouse | 71,181 | 10.8 | % | 14,530 | 16.5 | % | 32,567 | 9.3 | % | 6,997 | 14.0 | % | |||||||||||||||
Self Storage | 31,853 | 4.8 | % | 3,535 | 4.0 | % | 31,853 | 9.0 | % | 3,535 | 7.1 | % | |||||||||||||||
Other (b) | 66,401 | 10.1 | % | 4,333 | 4.9 | % | 25,524 | 7.3 | % | 1,610 | 3.2 | % | |||||||||||||||
U.S. Total | 435,865 | 66.1 | % | 59,128 | 67.3 | % | 201,875 | 57.3 | % | 29,941 | 59.9 | % | |||||||||||||||
International | |||||||||||||||||||||||||||
Industrial | 59,463 | 9.1 | % | 11,536 | 13.1 | % | 54,968 | 15.6 | % | 10,580 | 21.2 | % | |||||||||||||||
Office | 66,019 | 10.0 | % | 5,413 | 6.1 | % | 43,127 | 12.2 | % | 3,892 | 7.8 | % | |||||||||||||||
Retail | 75,187 | 11.4 | % | 7,614 | 8.7 | % | 42,111 | 12.0 | % | 3,684 | 7.4 | % | |||||||||||||||
Warehouse | 22,395 | 3.4 | % | 4,175 | 4.8 | % | 10,098 | 2.9 | % | 1,862 | 3.7 | % | |||||||||||||||
Self Storage | — | — | % | — | — | % | — | — | % | — | — | % | |||||||||||||||
Other | — | — | % | — | — | % | — | — | % | — | — | % | |||||||||||||||
International Total | 223,064 | 33.9 | % | 28,738 | 32.7 | % | 150,304 | 42.7 | % | 20,018 | 40.1 | % | |||||||||||||||
Total | |||||||||||||||||||||||||||
Industrial | 196,803 | 29.9 | % | 39,781 | 45.3 | % | 118,807 | 33.7 | % | 24,568 | 49.2 | % | |||||||||||||||
Office | 167,609 | 25.4 | % | 11,650 | 13.2 | % | 80,592 | 22.8 | % | 6,664 | 13.3 | % | |||||||||||||||
Retail | 102,687 | 15.6 | % | 9,862 | 11.3 | % | 52,738 | 15.0 | % | 4,723 | 9.5 | % | |||||||||||||||
Warehouse | 93,576 | 14.2 | % | 18,705 | 21.3 | % | 42,665 | 12.2 | % | 8,859 | 17.7 | % | |||||||||||||||
Self Storage | 31,853 | 4.8 | % | 3,535 | 4.0 | % | 31,853 | 9.0 | % | 3,535 | 7.1 | % | |||||||||||||||
Other (b) | 66,401 | 10.1 | % | 4,333 | 4.9 | % | 25,524 | 7.3 | % | 1,610 | 3.2 | % | |||||||||||||||
Total (c) (d) | $ | 658,929 | 100.0 | % | 87,866 | 100.0 | % | $ | 352,179 | 100.0 | % | 49,959 | 100.0 | % | |||||||||||||
________
(a) | Represents properties unencumbered by non-recourse mortgage debt. |
(b) | Includes ABR from tenants with the following property types: hotel, education facility, theater, net-lease student housing and fitness facility. |
(c) | Includes square footage for vacant properties. |
(d) | See the Terms and Definitions section in the Appendix for a description of pro rata. |
| | Investing for the long runTM | 30 | |
W. P. Carey Inc.
Owned Real Estate Portfolio – Fourth Quarter 2016
Diversification by Tenant Industry | |
In thousands, except percentages. Pro rata. As of December 31, 2016.
Total Net-Lease Portfolio | Unencumbered Net-Lease Portfolio (a) | ||||||||||||||||||||||||||
Industry Type | ABR | ABR Percent | Square Footage | Sq. ft. Percent | ABR | ABR Percent | Square Footage | Sq. ft. Percent | |||||||||||||||||||
Retail Stores (b) | $ | 110,802 | 16.8 | % | 14,961 | 17.0 | % | $ | 41,476 | 11.8 | % | 4,848 | 9.7 | % | |||||||||||||
Consumer Services | 68,557 | 10.4 | % | 5,565 | 6.3 | % | 49,420 | 14.0 | % | 4,137 | 8.3 | % | |||||||||||||||
Automotive | 52,296 | 7.9 | % | 8,864 | 10.1 | % | 38,085 | 10.8 | % | 6,010 | 12.0 | % | |||||||||||||||
Sovereign and Public Finance | 37,846 | 5.7 | % | 3,408 | 3.9 | % | 28,614 | 8.1 | % | 3,000 | 6.0 | % | |||||||||||||||
Construction and Building | 35,986 | 5.5 | % | 8,142 | 9.3 | % | 24,559 | 7.0 | % | 6,170 | 12.4 | % | |||||||||||||||
Hotel, Gaming and Leisure | 34,614 | 5.3 | % | 2,254 | 2.6 | % | 12,854 | 3.7 | % | 951 | 1.9 | % | |||||||||||||||
High Tech Industries | 33,138 | 5.0 | % | 2,905 | 3.3 | % | 15,955 | 4.5 | % | 1,386 | 2.8 | % | |||||||||||||||
Beverage, Food and Tobacco | 29,204 | 4.4 | % | 6,680 | 7.6 | % | 22,482 | 6.4 | % | 5,889 | 11.8 | % | |||||||||||||||
Cargo Transportation | 27,711 | 4.2 | % | 3,860 | 4.4 | % | 21,314 | 6.1 | % | 3,423 | 6.9 | % | |||||||||||||||
Media: Advertising, Printing and Publishing | 27,695 | 4.2 | % | 1,695 | 1.9 | % | 5,787 | 1.6 | % | 655 | 1.3 | % | |||||||||||||||
Healthcare and Pharmaceuticals | 27,537 | 4.2 | % | 1,988 | 2.3 | % | 9,936 | 2.8 | % | 750 | 1.5 | % | |||||||||||||||
Containers, Packaging and Glass | 26,665 | 4.1 | % | 5,325 | 6.1 | % | 7,496 | 2.1 | % | 1,556 | 3.1 | % | |||||||||||||||
Capital Equipment | 25,891 | 3.9 | % | 4,873 | 5.5 | % | 16,798 | 4.8 | % | 2,777 | 5.6 | % | |||||||||||||||
Wholesale | 14,414 | 2.2 | % | 2,806 | 3.2 | % | 4,365 | 1.2 | % | 741 | 1.5 | % | |||||||||||||||
Business Services | 12,060 | 1.8 | % | 1,730 | 2.0 | % | 8,116 | 2.3 | % | 1,468 | 2.9 | % | |||||||||||||||
Durable Consumer Goods | 11,089 | 1.7 | % | 2,486 | 2.8 | % | 1,329 | 0.4 | % | 370 | 0.7 | % | |||||||||||||||
Aerospace and Defense | 10,697 | 1.6 | % | 1,183 | 1.4 | % | 6,250 | 1.8 | % | 788 | 1.6 | % | |||||||||||||||
Grocery | 10,515 | 1.6 | % | 1,260 | 1.4 | % | 4,734 | 1.3 | % | 421 | 0.8 | % | |||||||||||||||
Chemicals, Plastics and Rubber | 9,568 | 1.5 | % | 1,108 | 1.3 | % | 1,911 | 0.5 | % | 245 | 0.5 | % | |||||||||||||||
Metals and Mining | 8,885 | 1.3 | % | 1,341 | 1.5 | % | 3,404 | 1.0 | % | 772 | 1.5 | % | |||||||||||||||
Oil and Gas | 8,014 | 1.2 | % | 368 | 0.4 | % | 7,540 | 2.1 | % | 333 | 0.7 | % | |||||||||||||||
Non-Durable Consumer Goods | 7,689 | 1.2 | % | 1,883 | 2.1 | % | 4,744 | 1.4 | % | 1,320 | 2.6 | % | |||||||||||||||
Telecommunications | 7,254 | 1.1 | % | 447 | 0.5 | % | 3,140 | 0.9 | % | 166 | 0.3 | % | |||||||||||||||
Banking | 7,155 | 1.1 | % | 596 | 0.7 | % | — | — | % | — | — | % | |||||||||||||||
Other (c) | 13,647 | 2.1 | % | 2,138 | 2.4 | % | 11,870 | 3.4 | % | 1,783 | 3.6 | % | |||||||||||||||
Total (d) | $ | 658,929 | 100.0 | % | 87,866 | 100.0 | % | $ | 352,179 | 100.0 | % | 49,959 | 100.0 | % | |||||||||||||
________
(a) | Represents properties unencumbered by non-recourse mortgage debt. |
(b) | Includes automotive dealerships. |
(c) | Includes ABR from tenants in the following industries: insurance, electricity, media: broadcasting and subscription, forest products and paper and environmental industries. Also includes square footage for vacant properties. |
(d) | See the Terms and Definitions section in the Appendix for a description of pro rata. |
| | Investing for the long runTM | 31 | |
W. P. Carey Inc.
Owned Real Estate Portfolio – Fourth Quarter 2016
Diversification by Geography | |
In thousands, except percentages. Pro rata. As of December 31, 2016.
Total Net-Lease Portfolio | Unencumbered Net-Lease Portfolio (a) | ||||||||||||||||||||||||||
Region | ABR | ABR Percent | Square Footage | Sq. ft. Percent | ABR | ABR Percent | Square Footage | Sq. ft. Percent | |||||||||||||||||||
U.S. | |||||||||||||||||||||||||||
South | |||||||||||||||||||||||||||
Texas | $ | 55,891 | 8.5 | % | 8,217 | 9.4 | % | $ | 29,524 | 8.4 | % | 4,976 | 10.0 | % | |||||||||||||
Florida | 27,928 | 4.2 | % | 2,600 | 3.0 | % | 24,794 | 7.0 | % | 2,344 | 4.7 | % | |||||||||||||||
Georgia | 19,795 | 3.0 | % | 3,293 | 3.7 | % | 11,214 | 3.2 | % | 2,087 | 4.2 | % | |||||||||||||||
Tennessee | 15,317 | 2.3 | % | 2,306 | 2.6 | % | 4,684 | 1.3 | % | 1,061 | 2.1 | % | |||||||||||||||
Other (b) | 9,717 | 1.5 | % | 1,987 | 2.3 | % | 8,100 | 2.3 | % | 1,715 | 3.4 | % | |||||||||||||||
Total South | 128,648 | 19.5 | % | 18,403 | 21.0 | % | 78,316 | 22.2 | % | 12,183 | 24.4 | % | |||||||||||||||
East | |||||||||||||||||||||||||||
North Carolina | 19,680 | 3.0 | % | 4,518 | 5.1 | % | 10,243 | 2.9 | % | 2,266 | 4.5 | % | |||||||||||||||
Pennsylvania | 18,518 | 2.8 | % | 2,526 | 2.9 | % | 7,374 | 2.1 | % | 1,477 | 3.0 | % | |||||||||||||||
New Jersey | 18,339 | 2.8 | % | 1,097 | 1.2 | % | 8,111 | 2.3 | % | 601 | 1.2 | % | |||||||||||||||
New York | 18,063 | 2.7 | % | 1,178 | 1.3 | % | 758 | 0.2 | % | 66 | 0.1 | % | |||||||||||||||
Massachusetts | 14,895 | 2.3 | % | 1,390 | 1.6 | % | 10,857 | 3.1 | % | 1,163 | 2.3 | % | |||||||||||||||
Virginia | 8,048 | 1.2 | % | 1,093 | 1.2 | % | 4,929 | 1.4 | % | 413 | 0.8 | % | |||||||||||||||
Other (b) | 24,005 | 3.6 | % | 4,894 | 5.6 | % | 7,398 | 2.1 | % | 1,552 | 3.1 | % | |||||||||||||||
Total East | 121,548 | 18.4 | % | 16,696 | 18.9 | % | 49,670 | 14.1 | % | 7,538 | 15.0 | % | |||||||||||||||
West | |||||||||||||||||||||||||||
California | 42,097 | 6.4 | % | 3,303 | 3.8 | % | 10,017 | 2.8 | % | 1,235 | 2.5 | % | |||||||||||||||
Arizona | 26,434 | 4.0 | % | 3,049 | 3.5 | % | 8,348 | 2.4 | % | 685 | 1.4 | % | |||||||||||||||
Colorado | 10,768 | 1.6 | % | 1,268 | 1.4 | % | 6,141 | 1.7 | % | 509 | 1.0 | % | |||||||||||||||
Utah | 6,781 | 1.0 | % | 920 | 1.1 | % | 2,654 | 0.8 | % | 477 | 1.0 | % | |||||||||||||||
Other (b) | 18,265 | 2.8 | % | 2,322 | 2.6 | % | 10,339 | 2.9 | % | 1,321 | 2.6 | % | |||||||||||||||
Total West | 104,345 | 15.8 | % | 10,862 | 12.4 | % | 37,499 | 10.6 | % | 4,227 | 8.5 | % | |||||||||||||||
Midwest | |||||||||||||||||||||||||||
Illinois | 21,041 | 3.2 | % | 3,246 | 3.7 | % | 7,599 | 2.2 | % | 1,678 | 3.4 | % | |||||||||||||||
Michigan | 11,894 | 1.8 | % | 1,396 | 1.6 | % | 7,677 | 2.2 | % | 1,005 | 2.0 | % | |||||||||||||||
Indiana | 9,163 | 1.4 | % | 1,418 | 1.6 | % | 3,153 | 0.9 | % | 433 | 0.9 | % | |||||||||||||||
Ohio | 8,407 | 1.3 | % | 1,911 | 2.2 | % | 4,350 | 1.2 | % | 934 | 1.9 | % | |||||||||||||||
Missouri | 6,900 | 1.1 | % | 1,305 | 1.5 | % | 3,154 | 0.9 | % | 324 | 0.6 | % | |||||||||||||||
Minnesota | 6,854 | 1.0 | % | 811 | 0.9 | % | 4,212 | 1.2 | % | 414 | 0.8 | % | |||||||||||||||
Other (b) | 17,065 | 2.6 | % | 3,080 | 3.5 | % | 6,245 | 1.8 | % | 1,205 | 2.4 | % | |||||||||||||||
Total Midwest | 81,324 | 12.4 | % | 13,167 | 15.0 | % | 36,390 | 10.4 | % | 5,993 | 12.0 | % | |||||||||||||||
U.S. Total | 435,865 | 66.1 | % | 59,128 | 67.3 | % | 201,875 | 57.3 | % | 29,941 | 59.9 | % | |||||||||||||||
International | |||||||||||||||||||||||||||
Germany | 56,683 | 8.6 | % | 7,131 | 8.1 | % | 31,497 | 8.9 | % | 3,937 | 7.9 | % | |||||||||||||||
United Kingdom | 31,778 | 4.8 | % | 2,569 | 2.9 | % | 29,902 | 8.5 | % | 2,356 | 4.7 | % | |||||||||||||||
Spain | 26,753 | 4.1 | % | 2,927 | 3.3 | % | 26,753 | 7.6 | % | 2,927 | 5.9 | % | |||||||||||||||
Finland | 18,707 | 2.8 | % | 1,588 | 1.8 | % | 6,605 | 1.9 | % | 640 | 1.3 | % | |||||||||||||||
Poland | 16,163 | 2.5 | % | 2,189 | 2.5 | % | 1,788 | 0.5 | % | 362 | 0.7 | % | |||||||||||||||
The Netherlands | 13,662 | 2.1 | % | 2,233 | 2.6 | % | 10,783 | 3.1 | % | 1,792 | 3.6 | % | |||||||||||||||
France | 13,247 | 2.0 | % | 1,338 | 1.5 | % | 5,724 | 1.6 | % | 1,025 | 2.1 | % | |||||||||||||||
Canada | 12,232 | 1.9 | % | 2,196 | 2.5 | % | 12,232 | 3.5 | % | 2,196 | 4.4 | % | |||||||||||||||
Australia | 11,162 | 1.7 | % | 3,160 | 3.6 | % | 11,163 | 3.2 | % | 3,160 | 6.3 | % | |||||||||||||||
Other (c) | 22,677 | 3.4 | % | 3,407 | 3.9 | % | 13,857 | 3.9 | % | 1,623 | 3.2 | % | |||||||||||||||
International Total | 223,064 | 33.9 | % | 28,738 | 32.7 | % | 150,304 | 42.7 | % | 20,018 | 40.1 | % | |||||||||||||||
Total (d) (e) | $ | 658,929 | 100.0 | % | 87,866 | 100.0 | % | $ | 352,179 | 100.0 | % | 49,959 | 100.0 | % | |||||||||||||
________
| | Investing for the long runTM | 32 | |
W. P. Carey Inc.
Owned Real Estate Portfolio – Fourth Quarter 2016
(a) | Represents properties unencumbered by non-recourse mortgage debt. |
(b) | Other properties within South include assets in Louisiana, Alabama, Arkansas, Mississippi and Oklahoma. Other properties within East include assets in Connecticut, South Carolina, Kentucky, New Hampshire, Maryland and West Virginia. Other properties within West include assets in Washington, Nevada, Oregon, Wyoming, New Mexico, Alaska and Montana. Other properties within Midwest include assets in Nebraska, Kansas, Wisconsin, Iowa, South Dakota and North Dakota. |
(c) | Includes assets in Norway, Mexico, Thailand, Hungary, Austria, Sweden, Belgium, Malaysia and Japan. |
(d) | Includes square footage for vacant properties. |
(e) | See the Terms and Definitions section in the Appendix for a description of pro rata. |
| | Investing for the long runTM | 33 | |
W. P. Carey Inc.
Owned Real Estate Portfolio – Fourth Quarter 2016
Contractual Rent Increases | |
In thousands, except percentages. Pro rata. As of December 31, 2016.
Total Net-Lease Portfolio | Unencumbered Net-Lease Portfolio (a) | ||||||||||||||||||||||||||
Rent Adjustment Measure | ABR | ABR Percent | Square Footage | Sq. ft. Percent | ABR | ABR Percent | Square Footage | Sq. ft. Percent | |||||||||||||||||||
(Uncapped) CPI | $ | 279,192 | 42.4 | % | 35,450 | 40.3 | % | $ | 147,841 | 42.0 | % | 17,759 | 35.5 | % | |||||||||||||
CPI-based | 173,259 | 26.3 | % | 24,523 | 27.9 | % | 97,499 | 27.7 | % | 15,556 | 31.1 | % | |||||||||||||||
Fixed | 171,762 | 26.0 | % | 24,481 | 27.9 | % | 95,101 | 27.0 | % | 14,973 | 30.0 | % | |||||||||||||||
Other (b) | 28,047 | 4.3 | % | 1,981 | 2.3 | % | 9,444 | 2.7 | % | 835 | 1.7 | % | |||||||||||||||
None | 6,669 | 1.0 | % | 612 | 0.7 | % | 2,294 | 0.6 | % | 253 | 0.5 | % | |||||||||||||||
Vacant | — | — | % | 819 | 0.9 | % | — | — | % | 583 | 1.2 | % | |||||||||||||||
Total (c) | $ | 658,929 | 100.0 | % | 87,866 | 100.0 | % | $ | 352,179 | 100.0 | % | 49,959 | 100.0 | % | |||||||||||||
________
(a) | Represents properties unencumbered by non-recourse mortgage debt. |
(b) | Represents leases attributable to percentage rent. |
(c) | See the Terms and Definitions section in the Appendix for a description of pro rata. |
| | Investing for the long runTM | 34 | |
W. P. Carey Inc.
Owned Real Estate Portfolio – Fourth Quarter 2016
Same Store Analysis | |
Dollars in thousands. Pro rata.
Same store portfolio includes leases that were continuously in place during the period from December 31, 2015 to December 31, 2016. Excludes leases for properties that were acquired, sold or vacated, or were subject to lease renewals, extensions or modifications at any time that affected ABR during that period. For purposes of comparability, ABR is presented on a constant currency basis using exchange rates as of December 31, 2016.
________
ABR | Percent | ||||||||||||||
Property Type | As of December 31, 2016 | As of December 31, 2015 | Increase | Increase | |||||||||||
Office | $ | 158,270 | $ | 156,505 | $ | 1,765 | 1.1 | % | |||||||
Industrial | 157,783 | 155,445 | 2,338 | 1.5 | % | ||||||||||
Retail | 102,476 | 101,741 | 735 | 0.7 | % | ||||||||||
Warehouse | 85,148 | 84,319 | 829 | 1.0 | % | ||||||||||
Self Storage | 31,853 | 31,853 | — | — | % | ||||||||||
Other (a) | 49,690 | 48,989 | 701 | 1.4 | % | ||||||||||
Total | $ | 585,220 | $ | 578,852 | $ | 6,368 | 1.1 | % | |||||||
Rent Adjustment Measure | |||||||||||||||
(Uncapped) CPI | $ | 259,752 | $ | 258,412 | $ | 1,340 | 0.5 | % | |||||||
CPI-based | 147,255 | 145,900 | 1,355 | 0.9 | % | ||||||||||
Fixed | 143,708 | 140,058 | 3,650 | 2.6 | % | ||||||||||
Other | 27,836 | 27,813 | 23 | 0.1 | % | ||||||||||
None | 6,669 | 6,669 | — | — | % | ||||||||||
Total | $ | 585,220 | $ | 578,852 | $ | 6,368 | 1.1 | % | |||||||
Geography | |||||||||||||||
U.S. | $ | 380,752 | $ | 375,791 | $ | 4,961 | 1.3 | % | |||||||
Europe | 191,728 | 190,577 | 1,151 | 0.6 | % | ||||||||||
Other International | 12,740 | 12,484 | 256 | 2.1 | % | ||||||||||
Total | $ | 585,220 | $ | 578,852 | $ | 6,368 | 1.1 | % | |||||||
Same Store Portfolio Summary | |||||||||||||||
Number of properties | 801 | ||||||||||||||
Square footage (in thousands) | 74,499 | ||||||||||||||
(a) | Includes ABR from tenants with the following property types: education facility, hotel, theater, fitness facility and net-lease student housing. |
| | Investing for the long runTM | 35 | |
W. P. Carey Inc.
Owned Real Estate Portfolio – Fourth Quarter 2016
Leasing Activity | |
For the three months ended December 31, 2016, except ABR. Pro rata.
Lease Renewals and Extensions (a) | Expected Tenant Improvements/Leasing Commissions ($’000) | ||||||||||||||||||||||
ABR | |||||||||||||||||||||||
Property Type | Square Feet | Number of Leases | Prior Lease ($’000s) | New Lease ($'000s) (b) | Releasing Spread | Incremental Lease Term | |||||||||||||||||
Industrial | 130,094 | 1 | $ | 728 | $ | 911 | 25.1 | % | $ | 360 | 5 years | ||||||||||||
Office | — | — | — | — | — | % | — | N/A | |||||||||||||||
Warehouse | — | — | — | — | — | % | — | N/A | |||||||||||||||
Retail | 79,136 | 1 | 1,159 | 1,470 | 26.8 | % | 5,777 | 12.1 years | |||||||||||||||
Self Storage | — | — | — | — | — | % | — | N/A | |||||||||||||||
Other | 38,432 | 1 | 898 | 700 | (22.0 | )% | 1,312 | 8 years | |||||||||||||||
Total / Weighted Average (c) | 247,662 | 3 | $ | 2,785 | $ | 3,081 | 10.6 | % | $ | 7,449 | 9.1 years | ||||||||||||
Q4 Summary | |||||||||||||||||||||||
Prior Lease ABR (% of Total Portfolio) | 0.4 | % | |||||||||||||||||||||
________
(a) | We did not enter into any new leases during the three months ended December 31, 2016. |
(b) | New Lease amounts are based on in-place rents at time of lease commencement. Does not include any free rent periods. |
(c) | Weighted average refers to the incremental lease term. |
| | Investing for the long runTM | 36 | |
W. P. Carey Inc.
Owned Real Estate Portfolio – Fourth Quarter 2016
Lease Expirations – Total Net-Lease Portfolio | |
In thousands, except percentages and number of leases. Pro rata. As of December 31, 2016.
Year of Lease Expiration (a) | Number of Leases Expiring | ABR | ABR Percent | Square Footage | Sq. ft. Percent | |||||||||||
December 31, 2016 (b) | 2 | $ | 7,222 | 1.1 | % | 466 | 0.5 | % | ||||||||
2017 (c) | 11 | 8,238 | 1.3 | % | 1,530 | 1.7 | % | |||||||||
2018 | 11 | 12,059 | 1.8 | % | 1,528 | 1.7 | % | |||||||||
2019 | 23 | 30,459 | 4.6 | % | 3,375 | 3.8 | % | |||||||||
2020 | 23 | 34,430 | 5.2 | % | 3,433 | 3.9 | % | |||||||||
2021 | 81 | 41,602 | 6.3 | % | 6,639 | 7.6 | % | |||||||||
2022 | 38 | 66,337 | 10.1 | % | 8,732 | 10.0 | % | |||||||||
2023 | 17 | 38,334 | 5.8 | % | 5,387 | 6.1 | % | |||||||||
2024 | 43 | 91,362 | 13.9 | % | 11,441 | 13.0 | % | |||||||||
2025 | 43 | 32,344 | 4.9 | % | 3,553 | 4.1 | % | |||||||||
2026 | 24 | 21,489 | 3.3 | % | 3,275 | 3.7 | % | |||||||||
2027 | 27 | 42,704 | 6.5 | % | 6,911 | 7.9 | % | |||||||||
2028 | 9 | 18,693 | 2.8 | % | 2,166 | 2.5 | % | |||||||||
2029 | 11 | 19,272 | 2.9 | % | 2,897 | 3.3 | % | |||||||||
2030 | 11 | 45,853 | 7.0 | % | 4,804 | 5.5 | % | |||||||||
Thereafter (>2030) | 86 | 148,531 | 22.5 | % | 20,910 | 23.8 | % | |||||||||
Vacant | — | — | — | % | 819 | 0.9 | % | |||||||||
Total (d) | 460 | $ | 658,929 | 100.0 | % | 87,866 | 100.0 | % | ||||||||
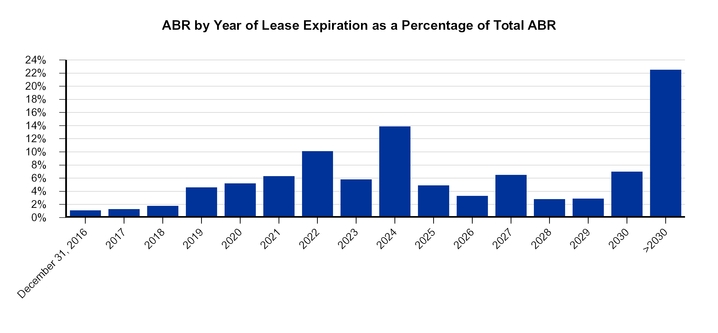
________
(a) | Assumes tenant does not exercise any renewal option. |
(b) | Reflects ABR for leases that expired on December 31, 2016. |
(c) | One month-to-month lease with ABR of $0.1 million is included in 2017 ABR. |
(d) | See the Terms and Definitions section in the Appendix for a description of pro rata. |
| | Investing for the long runTM | 37 | |
W. P. Carey Inc.
Owned Real Estate Portfolio – Fourth Quarter 2016
Lease Expirations – Unencumbered Net-Lease Portfolio | |
In thousands, except percentages and number of leases. Pro rata. As of December 31, 2016.
Year of Lease Expiration (a) | Number of Leases Expiring | ABR | ABR Percent | Square Footage | Sq. ft. Percent | |||||||||||
December 31, 2016 | — | $ | — | — | % | — | — | % | ||||||||
2017 | 5 | 2,315 | 0.7 | % | 316 | 0.6 | % | |||||||||
2018 | 11 | 12,058 | 3.4 | % | 1,528 | 3.1 | % | |||||||||
2019 | 11 | 6,748 | 1.9 | % | 1,145 | 2.3 | % | |||||||||
2020 | 11 | 10,446 | 3.0 | % | 1,462 | 2.9 | % | |||||||||
2021 | 66 | 19,999 | 5.7 | % | 3,041 | 6.1 | % | |||||||||
2022 | 19 | 16,364 | 4.6 | % | 2,749 | 5.5 | % | |||||||||
2023 | 10 | 10,152 | 2.9 | % | 2,045 | 4.1 | % | |||||||||
2024 | 15 | 46,805 | 13.3 | % | 6,122 | 12.3 | % | |||||||||
2025 | 33 | 19,102 | 5.4 | % | 1,612 | 3.2 | % | |||||||||
2026 | 12 | 13,842 | 3.9 | % | 2,087 | 4.2 | % | |||||||||
2027 | 16 | 19,696 | 5.6 | % | 3,116 | 6.2 | % | |||||||||
2028 | 6 | 7,808 | 2.2 | % | 1,268 | 2.5 | % | |||||||||
2029 | 9 | 17,756 | 5.0 | % | 2,547 | 5.1 | % | |||||||||
2030 | 6 | 20,287 | 5.8 | % | 2,053 | 4.1 | % | |||||||||
Thereafter (>2030) | 75 | 128,801 | 36.6 | % | 18,285 | 36.6 | % | |||||||||
Vacant | — | — | — | % | 583 | 1.2 | % | |||||||||
Total (b) (c) | 305 | $ | 352,179 | 100.0 | % | 49,959 | 100.0 | % | ||||||||
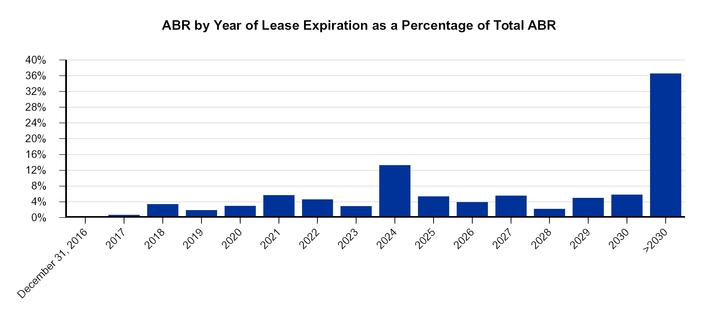
________
(a) | Assumes tenant does not exercise any renewal option. |
(b) | See the Terms and Definitions section in the Appendix for a description of pro rata. |
(c) | Represents properties unencumbered by non-recourse mortgage debt. |
| | Investing for the long runTM | 38 | |
W. P. Carey Inc.
Investment Management
Fourth Quarter 2016
| | Investing for the long runTM | 39 | |
W. P. Carey Inc.
Investment Management – Fourth Quarter 2016
Selected Information – Managed Programs | |
Dollars and square footage in thousands. As of or for the three months ended December 31, 2016.
Managed Programs | |||||||||||||||||||||||
CPA®:17 – Global | CPA®:18 – Global | CWI 1 | CWI 2 | CCIF | CESH I | ||||||||||||||||||
General | |||||||||||||||||||||||
Year established | 2007 | 2013 | 2010 | 2015 | 2015 | 2016 | |||||||||||||||||
Total AUM (a) (b) | $ | 5,963,841 | $ | 2,226,514 | $ | 2,884,695 | $ | 1,396,309 | $ | 301,252 | $ | 102,196 | |||||||||||
Portfolio | |||||||||||||||||||||||
Investment type | Net lease / Diversified REIT | Net lease / Diversified REIT | Lodging REIT | Lodging REIT | BDC | Student Housing | |||||||||||||||||
Number of net-leased properties | 395 | 59 | N/A | N/A | N/A | N/A | |||||||||||||||||
Number of operating properties | 38 | 76 | 35 | 10 | N/A | 3 | |||||||||||||||||
Number of tenants – net-leased properties (c) | 121 | 103 | N/A | N/A | N/A | N/A | |||||||||||||||||
Square footage (c) | 46,119 | 16,156 | 6,848 | 2,877 | N/A | N/A | |||||||||||||||||
Occupancy (d) | 99.7 | % | 100.0 | % | 71.5 | % | 71.9 | % | N/A | N/A | |||||||||||||
Acquisitions – fourth quarter | $ | 134,830 | $ | 43,897 | $ | — | $ | 289,705 | N/A | 42,721 | |||||||||||||
Dispositions – fourth quarter | — | — | — | — | N/A | — | |||||||||||||||||
Balance Sheet (Book Value) | |||||||||||||||||||||||
Total assets | $ | 4,698,331 | $ | 2,209,446 | $ | 2,477,966 | $ | 1,407,717 | $ | 302,911 | $ | 102,992 | |||||||||||
Total debt | 2,072,001 | 1,157,411 | 1,478,937 | 571,935 | 124,505 | 579 | |||||||||||||||||
Total debt / total assets | 44.1 | % | 52.4 | % | 59.7 | % | 40.6 | % | 41.1 | % | 0.6 | % | |||||||||||
Investor Capital | |||||||||||||||||||||||
Gross offering proceeds – fourth quarter (e) | N/A | N/A | N/A | $ | 80,561 | $ | 33,863 | $ | 71,076 | ||||||||||||||
Status | Closed | Closed | Closed | Open | Open | Open | |||||||||||||||||
Amount raised: | |||||||||||||||||||||||
Initial offering (e) | $ | 1,537,187 | $ | 1,243,518 | $ | 575,810 | $ | 616,336 | $ | 125,092 | $ | 112,837 | |||||||||||
Follow-on offering (e) | 1,347,280 | N/A | 577,358 | N/A | N/A | N/A | |||||||||||||||||
________
(a) | Represents estimated value of real estate assets plus cash and cash equivalents, less distributions payable for the Managed REITs and fair value of investments plus cash for CCIF and CESH I. |
(b) | CCIF Total AUM includes $50.0 million of initial investment, including $25.0 million made by W. P. Carey Inc. |
(c) | For CPA®:17 – Global and CPA®:18 – Global, excludes operating properties. For CESH I, the investments are build-to-suit projects, and gross square footage cannot be determined at this time. |
(d) | Represents occupancy for net-leased properties for CPA®:17 – Global and single-tenant net-leased properties for CPA®:18 – Global. Represents occupancy for hotels owned by CWI 1 and CWI 2 for the year ended December 31, 2016. Occupancy for CPA®:17 – Global's 37 self-storage properties was 93.0% as of December 31, 2016. Occupancy for CPA®:18 – Global's 68 self-storage properties and eight multi-family properties was 91.0% and 93.9%, respectively, as of December 31, 2016. CPA®:18 – Global’s multi-tenant net-leased properties had an occupancy of 98.4% and square footage of 0.4 million. |
(e) | Excludes distribution reinvestment plan proceeds. Net distribution reinvestment plan proceeds for the three months ended December 31, 2016 were $6.1 million for CPA®:17 – Global, $8.4 million for CPA®:18 – Global, $7.2 million for CWI 1, and $3.6 million for CWI 2. |
| | Investing for the long runTM | 40 | |
W. P. Carey Inc.
Investment Management – Fourth Quarter 2016
Managed Programs Fee Summary | |
Dollars in thousands. For the three months ended December 31, 2016.
Managed Programs | ||||||||||||||||||||||||||||
CPA®:17 – Global | CPA®:18 – Global | CWI 1 | CWI 2 | CCIF (a) | CESH I (b) | Total | ||||||||||||||||||||||
Year established | 2007 | 2013 | 2010 | 2015 | 2015 | 2016 | ||||||||||||||||||||||
Status | Closed | Closed | Closed | Open | Open | Open | ||||||||||||||||||||||
1. Structuring Fees | ||||||||||||||||||||||||||||
Structuring fee, gross (% of total aggregate cost) | 4.50% (c) | 4.50% (c) | 2.50% | 2.50% | N/A | 2.00% | ||||||||||||||||||||||
Net of subadvisor fees (d) | 4.50% | 4.50% | 2.00% | 1.875% | N/A | 2.00% | ||||||||||||||||||||||
Gross acquisition volume - fourth quarter | $ | 134,830 | $ | 43,897 | $ | — | $ | 289,705 | N/A | $ | 42,721 | $ | 511,153 | |||||||||||||||
Structuring revenue - fourth quarter | $ | 6,016 | $ | 2,300 | $ | — | $ | 7,190 | N/A | $ | 832 | $ | 16,338 | |||||||||||||||
2. Asset Management Fees | ||||||||||||||||||||||||||||
Asset management fee, gross (% of average AUM, per annum) | 0.50% (e) | 0.50% (e) | 0.50% (e) | 0.55% (e) | 1.75% - 2.00% (f) | 1.00% (g) | ||||||||||||||||||||||
Net of subadvisor fees (d) | 0.50% | 0.50% | 0.40% | 0.41% | 0.875% - 1.00% | 1.00% | ||||||||||||||||||||||
Total AUM - current quarter | $ | 5,963,841 | $ | 2,226,514 | $ | 2,884,695 | $ | 1,396,309 | $ | 301,252 | $ | 102,196 | $ | 12,874,807 | ||||||||||||||
Total AUM - prior quarter | $ | 5,863,248 | $ | 2,095,647 | $ | 2,895,724 | $ | 1,115,971 | $ | 234,721 | $ | 38,167 | $ | 12,243,478 | ||||||||||||||
Average AUM | $ | 5,913,545 | $ | 2,161,081 | $ | 2,890,210 | $ | 1,256,140 | $ | 267,987 | $ | 70,182 | $ | 12,559,143 | ||||||||||||||
Asset management revenue - fourth quarter | $ | 7,249 | $ | 2,702 | $ | 3,553 | $ | 1,458 | $ | 1,313 | $ | 69 | $ | 16,375 | (h) | |||||||||||||
3. Operating Partnership Interests (i) | ||||||||||||||||||||||||||||
Operating partnership interests, gross (% of Available Cash) | 10.00% | 10.00% | 10.00% | 10.00% | N/A | N/A | ||||||||||||||||||||||
Net of subadvisor fees (d) | 10.00% | 10.00% | 8.00% | 7.50% | N/A | N/A | ||||||||||||||||||||||
Equity in earnings of equity method investments in the Managed Programs and real estate (profits interest) - fourth quarter | $ | 6,962 | $ | 2,267 | $ | 2,514 | $ | 1,360 | N/A | N/A | $ | 13,103 | ||||||||||||||||
4. Distribution Fees / Expenses | ||||||||||||||||||||||||||||
Dealer manager fee | We receive a dealer manager fee for the sale of shares in the Managed Programs, a portion of which may be re-allowed to selected broker dealers. | |||||||||||||||||||||||||||
Selling commission | We receive selling commissions for the sale of shares in the Managed Programs, which are re-allowed to selected broker dealers. | |||||||||||||||||||||||||||
Distribution and shareholder servicing fee | We receive an annual distribution and shareholder servicing fee in connection with shares of CPA®:18 – Global’s Class C common stock, CWI 2’s Class T common stock, CCIF 2016 T’s common shares and CCIF 2018 T’s common shares, which may be re-allowed to selected broker dealers. | |||||||||||||||||||||||||||
Dealer manager fees received (revenues) - fourth quarter | $ | — | $ | — | $ | — | $ | 991 | $ | 522 | $ | 1,087 | $ | 2,623 | (j) | |||||||||||||
Dealer manager fees paid and expenses (operating) - fourth quarter | $ | — | $ | — | $ | — | $ | 1,526 | $ | 876 | $ | 1,406 | $ | 3,808 | ||||||||||||||
Net impact of dealer manager fees and expenses - fourth quarter | $ | — | $ | — | $ | — | $ | (535 | ) | $ | (354 | ) | $ | (319 | ) | $ | (1,185 | ) | (j) | |||||||||
________
(a) | In addition to the fees shown, we may earn incentive fees on income and capital gains. Incentive fees on income are paid quarterly, if earned, and are calculated as the sum of (i) 100% of quarterly pre-incentive fee net investment income in excess of 1.875% of average adjusted capital up to a limit of 2.344% of average adjusted capital and (ii) 20% of pre-incentive fee net investment income in excess of 2.344% of average adjusted capital. The incentive fee on capital gains is paid annually, if earned, and is equal to 20% of realized capital gains on a cumulative basis from inception, net of (i) all realized capital losses and unrealized depreciation on a cumulative basis from inception and (ii) the aggregate amount, if any, of previously paid incentive fees on capital gains. |
(b) | In addition to the fees shown, and in lieu of reimbursing us for organization and offering costs, we receive limited partnership units of CESH I equal to 2.5% of gross offering proceeds. For the three months ended December 31, 2016, this other advisory revenue was $1.9 million. We may also receive distributions from CESH I upon liquidation of the fund in an amount potentially equal to 20% of available cash after the limited partners have received certain cumulative distributions. |
(c) | Comprised of an initial acquisition fee (generally 2.50% of the total aggregate cost of net-leased properties) paid when the transaction is completed and a subordinated acquisition fee (generally 2.00% of the total aggregate cost of net-leased properties) paid in annual installments over three years, provided certain performance criterion are met. The acquisition fee for other properties is generally 1.75% of the total aggregate cost. |
| | Investing for the long runTM | 41 | |
W. P. Carey Inc.
Investment Management – Fourth Quarter 2016
(d) | The subadvisors for CWI 1, CWI 2, and CCIF earn a percentage of gross fees recorded, which are expenses for us and are recorded as Subadvisor fees in our consolidated statements of income. The amounts paid to the subadvisors are the difference between gross and net fees. |
(e) | Based on average market value of assets. Under the terms of the respective advisory agreements of the Managed REITs, we may elect to receive cash or shares of CWI 1 and CWI 2’s stock for asset management fees due, while the CPA® REITs have an option to pay asset management fees in cash or shares upon our recommendation. Asset management fees are recorded in Asset management revenue in our consolidated financial statements. |
(f) | Based on average of gross assets at the end of the two most recently completed calendar months. Management fees are incurred at 2.00% on portion of assets below $1.0 billion; 1.875% on portion of assets between $1.0 billion and $2.0 billion; and 1.75% on portion of assets above $2.0 billion. |
(g) | Based on gross assets at fair value. |
(h) | Total asset management revenue includes approximately $31,000 of other fees not related to the Managed Programs. |
(i) | Available Cash means cash generated by operating partnership operations and investments, excluding cash from sales and refinancings, after the payment of debt service and other operating expenses, but before distributions to partners. Recorded in Equity in earnings of equity method investments in the Managed Programs and real estate in our consolidated financial statements. |
(j) | Total dealer manager fees received includes approximately $23,000 representing an immaterial true-up from a prior quarter’s activity. |
| | Investing for the long runTM | 42 | |
W. P. Carey Inc.
Investment Management – Fourth Quarter 2016
Investment Activity – Managed Programs | |
Dollars in thousands. Pro rata. For the year ended December 31, 2016.
Acquisitions – Net-Leased Properties | Gross Square Footage | ||||||||||||||
Portfolio(s) | Tenant / Lease Guarantor | Property Location(s) | Purchase Price | Closing Date | Property Type(s) | ||||||||||
1Q16 | |||||||||||||||
CPA®:17 – Global | Jacksonville University (a) | Jacksonville, FL | $ | 18,263 | Jan-16 | Student Housing | 65,450 | ||||||||
CPA®:17 – Global (2 properties) | Matthew Warren, Inc.(a) | Houston, TX | 8,848 | Feb-16 | Industrial | 139,560 | |||||||||
CPA®:18 – Global | University of Ghana (b) | Accra, Ghana | 65,681 | Feb-16 | Education Facility | BTS | |||||||||
1Q16 Total | 92,792 | 205,010 | |||||||||||||
2Q16 | |||||||||||||||
CPA®:17 – Global (6 properties) | Civitas Media, LLC | Various, United States | 11,957 | Apr-16 | Industrial | 240,743 | |||||||||
CPA®:17 – Global | FM Slovenska, s.r.o. (b) (c) | Sered, Slovakia | 9,609 | Apr-16 | Warehouse | BTS | |||||||||
2Q16 Total | 21,566 | 240,743 | |||||||||||||
3Q16 | |||||||||||||||
CPA®:17 – Global | Master Lock (a) | Oak Creek, WI | 17,720 | Sep-16 | Industrial | 120,883 | |||||||||
CPA®:17 – Global | First Solar, Inc. (a) | Perrysburg, OH | 13,454 | Sep-16 | Warehouse | 391,662 | |||||||||
3Q16 Total | 31,174 | 512,545 | |||||||||||||
4Q16 | |||||||||||||||
CPA®:17 – Global (5 properties) | Concordance Healthcare Solutions, LLC | Shelbyville, IN; Kalamazoo, MI; Tiffin, OH; Andersonville, TN; and Millwood, WV | 38,248 | Nov-16 | Warehouse | 957,540 | |||||||||
CPA®:17 – Global | Greenyard Foods NV (c) | Zabia Wola, Poland | 32,608 | Nov-16 | Warehouse | 309,870 | |||||||||
CPA®:17 – Global | Kesko Senukai (c) | Kaunas, Lithuania | 63,974 | Dec-16 | Warehouse | 768,909 | |||||||||
4Q16 Total | 134,830 | 2,036,319 | |||||||||||||
Year-to-Date Total Acquisitions – Net-Leased Properties | 280,362 | 2,994,617 | |||||||||||||
| | Investing for the long runTM | 43 | |
W. P. Carey Inc.
Investment Management – Fourth Quarter 2016
Investment Activity – Managed Programs (continued) | |
Dollars in thousands. Pro rata. For the year ended December 31, 2016.
Acquisitions – Self-Storage | |||||||
Portfolio(s) | Property Location(s) | Purchase Price (a) | Closing Date | ||||
1Q16 | |||||||
CPA®:18 – Global | Kissimmee, FL | 6,619 | Jan-16 | ||||
CPA®:18 – Global | Avondale, LA | 6,137 | Jan-16 | ||||
CPA®:18 – Global | Gilroy, CA | 11,807 | Feb-16 | ||||
1Q16 Total | 24,563 | ||||||
2Q16 | |||||||
CPA®:18 – Global (5 properties) | Various, United States | 51,063 | Apr-16 | ||||
CPA®:17 – Global (5 properties) (acquired remaining 15.0% interest) | New York, NY | 25,662 | Apr-16 | ||||
CPA®:18 – Global (b) (c) | Ontario, Canada | 15,533 | May-16 | ||||
2Q16 Total | 92,258 | ||||||
3Q16 (N/A) | |||||||
4Q16 | |||||||
CPA®:18 – Global | Chicago, IL | 3,387 | Nov-16 | ||||
4Q16 Total | 3,387 | ||||||
Year-to-Date Total Acquisitions – Self-Storage Properties | 120,208 | ||||||
Acquisitions – Hotels | |||||||
Portfolio(s) | Property Location(s) | Purchase Price | Closing Date | ||||
1Q16 | |||||||
CWI 2 (a) | Bellevue, WA | 186,950 | Jan-16 | ||||
CWI 1 (acquired remaining 25.0% interest) (d) | Sonoma, CA | 21,087 | Feb-16 | ||||
CWI 1 (a) | Manchester Village, VT | 86,314 | Feb-16 | ||||
1Q16 Total | 294,351 | ||||||
2Q16 | |||||||
CWI 2 (a) | Rosslyn, VA | 59,517 | Jun-16 | ||||
2Q16 Total | 59,517 | ||||||
3Q16 | |||||||
CWI 2 (a) | San Jose, CA | 165,288 | Jul-16 | ||||
CWI 2 (a) | La Jolla, CA | 146,630 | Jul-16 | ||||
CWI 1 (e) | Manchester Village, VT | 1,150 | Aug-16 | ||||
CWI 2 (a) | Atlanta, GA | 87,864 | Aug-16 | ||||
3Q16 Total | 400,932 | ||||||
4Q16 | |||||||
CWI 2 (a) | San Francisco, CA | 289,705 | Dec-16 | ||||
4Q16 Total | 289,705 | ||||||
Year-to-Date Total Acquisitions – Hotels | 1,044,505 | ||||||
| | Investing for the long runTM | 44 | |
W. P. Carey Inc.
Investment Management – Fourth Quarter 2016
Investment Activity – Managed Programs (continued) | |
Dollars in thousands. Pro rata. For the year ended December 31, 2016.
Acquisitions – Student Housing | |||||||
Portfolio(s) | Property Location(s) | Purchase Price | Closing Date | ||||
1Q16 (N/A) | |||||||
2Q16 | |||||||
CESH I (b) (c) (f) | Lisbon, Portugal | 30,603 | May-16 | ||||
2Q16 Total | 30,603 | ||||||
3Q16 (N/A) | |||||||
4Q16 | |||||||
CESH I (b) (c) | Valencia, Spain | 22,352 | Dec-16 | ||||
CESH I (b) (c) | Salamanca, Spain | 20,369 | Dec-16 | ||||
42,721 | |||||||
Year-to-Date Total Acquisitions – Student Housing | 73,324 | ||||||
Acquisitions – Other | ||||||||||
Portfolio(s) | Security Type | Property Location(s) | Purchase Price | Closing Date | ||||||
1Q16 (N/A) | ||||||||||
2Q16 (N/A) | ||||||||||
3Q16 (N/A) | ||||||||||
4Q16 | ||||||||||
CPA®:18 – Global (d) (g) | Mezzanine Loan | Various: Iowa, Minnesota and Wisconsin | 40,510 | Nov-16 | ||||||
40,510 | ||||||||||
Year-to-Date Total Acquisitions – Other | 40,510 | |||||||||
Year-to-Date Total Acquisitions | $ | 1,558,909 | ||||||||
| | Investing for the long runTM | 45 | |
W. P. Carey Inc.
Investment Management – Fourth Quarter 2016
Investment Activity – Managed Programs (continued) | |
Dollars in thousands. Pro rata. For the year ended December 31, 2016.
Dispositions | ||||||||||
Portfolio(s) | Tenant / Lease Guarantor | Property Location(s) | Gross Sale Price | Closing Date | ||||||
1Q16 | ||||||||||
CPA®:17 – Global (3 properties) | Safeguard Self-Storage | Miami, Palm Harbor, and St. Petersburg, FL | $ | 47,925 | Mar-16 | |||||
1Q16 Total | 47,925 | |||||||||
2Q16 | ||||||||||
CPA®:17 – Global (5 properties) | CubeSmart Self Storage | Mobile, AL; Baton Rouge and Slidell, LA; and Gulfport, MS | 25,614 | Apr-16 | ||||||
CPA®:17 – Global (4 properties) | Odessa Storage | Midland and Odessa, TX | 37,500 | Jun-16 | ||||||
2Q16 Total | 63,114 | |||||||||
3Q16 | ||||||||||
CPA®:17 – Global (22 properties) | A-American Self Storage and National Self Storage | Various, California | 154,044 | Aug-16 | ||||||
3Q16 Total | 154,044 | |||||||||
4Q16 (N/A) | ||||||||||
Year-to-Date Total Dispositions | $ | 265,083 | ||||||||
________
(a) | Acquisition was deemed to be a business combination and purchase price includes acquisition-related costs and fees, which were expensed. |
(b) | Acquisition includes a build-to-suit transaction. Purchase price represents total commitment for build-to-suit funding. Gross square footage cannot be determined at this time. |
(c) | Amount reflects the applicable exchange rate on the date of the transaction. |
(d) | Purchase price includes acquisition-related costs and fees, which were expensed. |
(e) | Acquisition is a property adjacent to the hotel in Manchester Village, Vermont acquired by CWI 1 in February 2016, which CWI 1 intends to renovate to create additional available rooms and event space at the hotel. |
(f) | In May 2016, we structured this investment on behalf of CESH I, a limited partnership which we consolidated as of the date of acquisition. During the three months ended September 30, 2016, we deconsolidated CESH I. |
(g) | Mezzanine loan investment is collateralized by 27 retail facilities. |
| | Investing for the long runTM | 46 | |
W. P. Carey Inc.
Appendix
Fourth Quarter 2016
| | Investing for the long runTM | 47 | |
W. P. Carey Inc.
Appendix – Fourth Quarter 2016
Normalized Pro Rata Cash Net Operating Income (NOI) | |
In thousands. From real estate.
Three Months Ended Dec. 31, 2016 | |||
Consolidated Lease Revenues | |||
Total lease revenues – as reported | $ | 157,105 | |
Less: Consolidated Non-Reimbursable Property Expenses | |||
Non-reimbursable property expenses – as reported | 5,405 | ||
151,700 | |||
Plus: NOI from Operating Properties | |||
Hotels NOI | 1,520 | ||
153,220 | |||
Adjustments for Pro Rata Ownership of Real Estate Joint Ventures: | |||
Add: Pro rata share of NOI from equity investments | 4,676 | ||
Less: Pro rata share of NOI attributable to noncontrolling interests | (5,638 | ) | |
(962 | ) | ||
152,258 | |||
Adjustments for Pro Rata Non-Cash Items: | |||
Add: Above- and below-market rent intangible lease amortization | 12,082 | ||
Less: Straight-line rent amortization | (4,564 | ) | |
Add: Other non-cash items | 85 | ||
7,603 | |||
Pro Rata Cash NOI (a) | 159,861 | ||
Adjustment to normalize for intra-period acquisitions, build-to-suit projects placed into service, and dispositions (b) | 1,246 | ||
Normalized Pro Rata Cash NOI (a) | $ | 161,107 | |
________
(a) | Pro rata cash NOI and normalized pro rata cash NOI are non-GAAP measures. See the Terms and Definitions section that follows for a description of our non-GAAP measures and for details on how pro rata cash NOI and normalized pro rata cash NOI are calculated. |
(b) | For properties acquired or placed into service during the three months ended December 31, 2016, the adjustment modifies our pro rata share of cash NOI for the partial period with an amount estimated to be equivalent to the additional pro rata share of cash NOI necessary to reflect ownership for the full quarter. For properties disposed of during the three months ended December 31, 2016, the adjustment eliminates our pro rata share of cash NOI for the period. |
| | Investing for the long runTM | 48 | |
W. P. Carey Inc.
Appendix – Fourth Quarter 2016
Reconciliation of Net Income to Adjusted EBITDA, Consolidated – Last Five Quarters | |
In thousands.
Three Months Ended | |||||||||||||||||||
Dec. 31, 2016 | Sep. 30, 2016 | Jun. 30, 2016 | Mar. 31, 2016 | Dec. 31, 2015 | |||||||||||||||
Net income attributable to W. P. Carey | $ | 47,704 | $ | 110,943 | $ | 51,661 | $ | 57,439 | $ | 51,049 | |||||||||
Adjustments to Derive Consolidated EBITDA | |||||||||||||||||||
Depreciation and amortization | 62,675 | 62,802 | 66,581 | 84,452 | 74,237 | ||||||||||||||
Interest expense | 43,913 | 44,349 | 46,752 | 48,395 | 49,001 | ||||||||||||||
Provision for (benefit from) income taxes | 7,826 | 3,154 | (8,217 | ) | 525 | 17,270 | |||||||||||||
EBITDA (a) | 162,118 | 221,248 | 156,777 | 190,811 | 191,557 | ||||||||||||||
Adjustments to Derive Adjusted EBITDA | |||||||||||||||||||
Adjustments for Non-Cash Items: | |||||||||||||||||||
Impairment charges | 9,433 | 14,441 | 35,429 | — | 7,194 | ||||||||||||||
Above- and below-market rent intangible and straight-line rent adjustments | 8,154 | 7,927 | 9,908 | (3,409 | ) | 4,270 | |||||||||||||
Unrealized losses (gains) (b) | 4,719 | (2,760 | ) | 536 | (3,274 | ) | 1,189 | ||||||||||||
Stock-based compensation expense | 3,051 | 4,356 | 4,001 | 6,607 | 5,562 | ||||||||||||||
Allowance for credit losses | — | — | — | 7,064 | 8,748 | ||||||||||||||
25,357 | 23,964 | 49,874 | 6,988 | 26,963 | |||||||||||||||
Adjustments for Non-Core Items: (c) | |||||||||||||||||||
Gain on sale of real estate, net | (3,248 | ) | (49,126 | ) | (18,282 | ) | (662 | ) | (3,507 | ) | |||||||||
Loss (gain) on extinguishment of debt | 224 | 2,072 | (112 | ) | 1,925 | 7,950 | |||||||||||||
Property acquisition and other expenses (d) | 18 | — | 146 | 5,650 | 4,905 | ||||||||||||||
Restructuring and other compensation (e) | — | — | 452 | 11,473 | — | ||||||||||||||
Merger income (f) | — | — | (353 | ) | (84 | ) | (25,002 | ) | |||||||||||
Other (g) | 736 | 523 | 2,439 | (25,407 | ) | (14,312 | ) | ||||||||||||
(2,270 | ) | (46,531 | ) | (15,710 | ) | (7,105 | ) | (29,966 | ) | ||||||||||
Adjustments for Pro Rata Ownership | |||||||||||||||||||
Real Estate Joint Ventures: (h) | |||||||||||||||||||
Add: Pro rata share of adjustments for equity investments | 1,387 | 1,795 | 1,781 | 1,714 | 1,418 | ||||||||||||||
Less: Pro rata share of adjustments for amounts attributable to noncontrolling interests | (5,736 | ) | (5,363 | ) | (5,225 | ) | (3,180 | ) | (1,067 | ) | |||||||||
(4,349 | ) | (3,568 | ) | (3,444 | ) | (1,466 | ) | 351 | |||||||||||
Adjustments for Equity Investments in the Managed Programs: (i) | |||||||||||||||||||
Add: Distributions received from equity investments in the Managed Programs | 2,496 | 2,773 | (321 | ) | 4,939 | 2,524 | |||||||||||||
Less: (Income) loss from equity investments in the Managed Programs | (30 | ) | (2,716 | ) | (3,069 | ) | (873 | ) | 1,242 | ||||||||||
2,466 | 57 | (3,390 | ) | 4,066 | 3,766 | ||||||||||||||
Adjusted EBITDA (a) | $ | 183,322 | $ | 195,170 | $ | 184,107 | $ | 193,294 | $ | 192,671 | |||||||||
________
(a) | EBITDA and adjusted EBITDA are non-GAAP measures. See the Terms and Definitions section that follows for a description of our non-GAAP measures. |
(b) | Comprised of gains and losses on interest rate derivatives and gains and losses on foreign currency. |
(c) | Comprised of items that we do not consider to be part of our core operating business plan or representative of our overall long-term operating performance, based on a number of factors, including the nature of the item and/or the frequency with which it occurs. We believe that these adjustments provide a more representative view of EBITDA from our core operating business and allow for more meaningful comparisons. |
(d) | Amounts for the three months ended June 30, 2016, March 31, 2016 and December 31, 2015 include expenses related to our formal strategic review of $(0.2) million, $5.5 million and $4.5 million, respectively. |
(e) | Amount represents restructuring and other compensation-related expenses resulting from a reduction in headcount and employee severance arrangements. |
(f) | Amount for the three months ended December 31, 2015 includes a reversal of $25.0 million of reserves for German real estate transfer taxes, of which $7.9 million was previously recorded as merger expenses in connection with the CPA®:15 Merger in September 2012 and $17.1 million was previously recorded in connection with the restructuring of a German investment, Hellweg 2, in October 2013. At the time of the restructuring, we owned an equity interest in the Hellweg 2 investment, which we jointly owned with CPA®:16 – Global. In connection with the CPA®:16 Merger, we acquired CPA®:16 – Global’s controlling interest in the investment. Therefore, the reversal related to the Hellweg 2 investment has been recorded in Property acquisition and other expenses in the consolidated financial statements for the three months ended December 31, 2015, since we now consolidate the Hellweg 2 investment. |
| | Investing for the long runTM | 49 | |
W. P. Carey Inc.
Appendix – Fourth Quarter 2016
(g) | Other for the three months ended March 31, 2016 and December 31, 2015 includes $27.2 million and $15.0 million, respectively, of lease termination income related to a property classified as held for sale as of December 31, 2015 and sold during the three months ended March 31, 2016. |
(h) | Adjustments to include our pro rata share of depreciation and amortization, interest expense, provision for income taxes, non-cash items and non-core items from joint ventures. |
(i) | Adjustments to include cash distributions received from the Managed Programs in place of our pro rata share of net income from our ownership in the Managed Programs. |
.
| | Investing for the long runTM | 50 | |
W. P. Carey Inc.
Appendix – Fourth Quarter 2016
Reconciliation of Net Income to Adjusted EBITDA, Owned Real Estate – Last Five Quarters | |
In thousands.
Three Months Ended | |||||||||||||||||||
Dec. 31, 2016 | Sep. 30, 2016 | Jun. 30, 2016 | Mar. 31, 2016 | Dec. 31, 2015 | |||||||||||||||
Net income from Owned Real Estate attributable to W. P. Carey | $ | 40,431 | $ | 99,972 | $ | 51,404 | $ | 60,546 | $ | 45,033 | |||||||||
Adjustments to Derive Consolidated EBITDA | |||||||||||||||||||
Depreciation and amortization | 61,717 | 61,740 | 65,457 | 83,360 | 73,189 | ||||||||||||||
Interest expense | 43,913 | 44,349 | 46,752 | 48,395 | 49,001 | ||||||||||||||
Provision for (benefit from) income taxes | 3,374 | 530 | (9,410 | ) | 2,088 | 10,129 | |||||||||||||
EBITDA - Owned Real Estate (a) | 149,435 | 206,591 | 154,203 | 194,389 | 177,352 | ||||||||||||||
Adjustments to Derive Adjusted EBITDA | |||||||||||||||||||
Adjustments for Non-Cash Items: | |||||||||||||||||||
Impairment charges | 9,433 | 14,441 | 35,429 | — | 7,194 | ||||||||||||||
Above- and below-market rent intangible and straight-line rent adjustments | 8,154 | 7,927 | 9,908 | (3,409 | ) | 4,270 | |||||||||||||
Unrealized losses (gains) (b) | 4,581 | (2,531 | ) | 147 | (3,308 | ) | 1,018 | ||||||||||||
Stock-based compensation expense | 908 | 1,572 | 907 | 1,837 | 1,929 | ||||||||||||||
Allowance for credit losses | — | — | — | 7,064 | 8,748 | ||||||||||||||
23,076 | 21,409 | 46,391 | 2,184 | 23,159 | |||||||||||||||
Adjustments for Non-Core Items: (c) | |||||||||||||||||||
Gain on sale of real estate, net | (3,248 | ) | (49,126 | ) | (18,282 | ) | (662 | ) | (3,507 | ) | |||||||||
Loss (gain) on extinguishment of debt | 224 | 2,072 | (112 | ) | 1,925 | 7,950 | |||||||||||||
Property acquisition and other expenses (d) | 18 | — | 431 | 2,981 | 3,879 | ||||||||||||||
Merger income (e) | — | — | (353 | ) | (84 | ) | (25,002 | ) | |||||||||||
Restructuring and other compensation (f) | — | — | (13 | ) | 4,426 | — | |||||||||||||
Other (g) | 770 | 523 | 2,421 | (25,440 | ) | (14,307 | ) | ||||||||||||
(2,236 | ) | (46,531 | ) | (15,908 | ) | (16,854 | ) | (30,987 | ) | ||||||||||
Adjustments for Pro Rata Ownership | |||||||||||||||||||
Real Estate Joint Ventures: (h) | |||||||||||||||||||
Add: Pro rata share of adjustments for equity investments | 1,387 | 1,795 | 1,781 | 1,714 | 1,418 | ||||||||||||||
Less: Pro rata share of adjustments for amounts attributable to noncontrolling interests | (5,736 | ) | (5,363 | ) | (5,225 | ) | (3,180 | ) | (1,067 | ) | |||||||||
(4,349 | ) | (3,568 | ) | (3,444 | ) | (1,466 | ) | 351 | |||||||||||
Adjustments for Equity Investments in the Managed REITs: (i) | |||||||||||||||||||
Add: Distributions received from equity investments in the Managed REITs | 2,419 | 2,299 | (321 | ) | 4,810 | 1,753 | |||||||||||||
Less: Loss (income) from equity investments in the Managed REITs | 493 | (1,618 | ) | (2,540 | ) | (1,028 | ) | 68 | |||||||||||
2,912 | 681 | (2,861 | ) | 3,782 | 1,821 | ||||||||||||||
Adjusted EBITDA - Owned Real Estate (a) | $ | 168,838 | $ | 178,582 | $ | 178,381 | $ | 182,035 | $ | 171,696 | |||||||||
________
(a) | EBITDA and adjusted EBITDA are non-GAAP measures. See the Terms and Definitions section that follows for a description of our non-GAAP measures. |
(b) | Comprised of gains and losses on interest rate derivatives and gains and losses on foreign currency. |
(c) | Comprised of items that we do not consider to be part of our core operating business plan or representative of our overall long-term operating performance, based on a number of factors, including the nature of the item and/or the frequency with which it occurs. We believe that these adjustments provide a more representative view of EBITDA from our core operating business and allow for more meaningful comparisons. |
(d) | Amounts for the three months ended June 30, 2016, March 31, 2016 and December 31, 2015 include expenses related to our formal strategic review of $0.1 million, $2.8 million and $3.5 million, respectively. |
(e) | Amount for the three months ended December 31, 2015 includes a reversal of $25.0 million of reserves for German real estate transfer taxes, of which $7.9 million was previously recorded as merger expenses in connection with the CPA®:15 Merger in September 2012 and $17.1 million was previously recorded in connection with the restructuring of a German investment, Hellweg 2, in October 2013. At the time of the restructuring, we owned an equity interest in the Hellweg 2 investment, which we jointly owned with CPA®:16 – Global. In connection with the CPA®:16 Merger, we acquired CPA®:16 – Global’s controlling interest in the investment. Therefore, the reversal related to the Hellweg 2 investment has been recorded in Property acquisition and other expenses in the consolidated financial statements for the three months ended December 31, 2015, since we now consolidate the Hellweg 2 investment. |
(f) | Amount represents restructuring and other compensation-related expenses resulting from a reduction in headcount and employee severance arrangements. |
| | Investing for the long runTM | 51 | |
W. P. Carey Inc.
Appendix – Fourth Quarter 2016
(g) | Other for the three months ended March 31, 2016 and December 31, 2015 includes $27.2 million and $15.0 million, respectively, of lease termination income related to a property classified as held for sale as of December 31, 2015 and sold during the three months ended March 31, 2016. |
(h) | Adjustments to include our pro rata share of depreciation and amortization, interest expense, provision for income taxes, non-cash items and non-core items from joint ventures. |
(i) | Adjustments to include cash distributions received from the Managed REITs in place of our pro rata share of net income from our ownership in the Managed REITs. |
| | Investing for the long runTM | 52 | |
W. P. Carey Inc.
Appendix – Fourth Quarter 2016
Reconciliation of Net Income to Adjusted EBITDA, Investment Management – Last Five Quarters | |
In thousands.
Three Months Ended | |||||||||||||||||||
Dec. 31, 2016 | Sep. 30, 2016 | Jun. 30, 2016 | Mar. 31, 2016 | Dec. 31, 2015 | |||||||||||||||
Net income (loss) from Investment Management attributable to W. P. Carey | $ | 7,273 | $ | 10,971 | $ | 257 | $ | (3,107 | ) | $ | 6,016 | ||||||||
Adjustments to Derive Consolidated EBITDA | |||||||||||||||||||
Provision for (benefit from) income taxes | 4,452 | 2,624 | 1,193 | (1,563 | ) | 7,141 | |||||||||||||
Depreciation and amortization | 958 | 1,062 | 1,124 | 1,092 | 1,048 | ||||||||||||||
EBITDA - Investment Management (a) | 12,683 | 14,657 | 2,574 | (3,578 | ) | 14,205 | |||||||||||||
Adjustments to Derive Adjusted EBITDA | |||||||||||||||||||
Adjustments for Non-Cash Items: | |||||||||||||||||||
Stock-based compensation expense | 2,143 | 2,784 | 3,094 | 4,770 | 3,633 | ||||||||||||||
Unrealized losses (gains) (b) | 138 | (229 | ) | 389 | 34 | 171 | |||||||||||||
2,281 | 2,555 | 3,483 | 4,804 | 3,804 | |||||||||||||||
Adjustments for Non-Core Items: (c) | |||||||||||||||||||
Restructuring and other compensation (d) | — | — | 465 | 7,047 | — | ||||||||||||||
Property acquisition and other expenses (e) | — | — | (285 | ) | 2,669 | 1,026 | |||||||||||||
Other | (34 | ) | — | 18 | 33 | (5 | ) | ||||||||||||
(34 | ) | — | 198 | 9,749 | 1,021 | ||||||||||||||
Adjustments for Equity Investment in CCIF: (f) | |||||||||||||||||||
Add: Distributions received from equity investment in CCIF | 77 | 474 | — | 129 | 771 | ||||||||||||||
Less: (Income) loss from equity investment in CCIF | (523 | ) | (1,098 | ) | (529 | ) | 155 | 1,174 | |||||||||||
(446 | ) | (624 | ) | (529 | ) | 284 | 1,945 | ||||||||||||
Adjusted EBITDA - Investment Management (a) | $ | 14,484 | $ | 16,588 | $ | 5,726 | $ | 11,259 | $ | 20,975 | |||||||||
________
(a) | EBITDA and adjusted EBITDA are non-GAAP measures. See the Terms and Definitions section that follows for a description of our non-GAAP measures. |
(b) | Comprised of gains and losses on foreign currency. |
(c) | Comprised of items that we do not consider to be part of our core operating business plan or representative of our overall long-term operating performance, based on a number of factors, including the nature of the item and/or the frequency with which it occurs. We believe that these adjustments provide a more representative view of EBITDA from our core operating business and allow for more meaningful comparisons. |
(d) | Amount represents restructuring and other compensation-related expenses resulting from a reduction in headcount and employee severance arrangements. |
(e) | Amounts for the three months ended June 30, 2016, March 31, 2016 and December 31, 2015 include expenses related to our formal strategic review of $(0.3) million, $2.7 million and $1.0 million, respectively. |
(f) | Adjustments to include cash distributions received from CCIF in place of our pro rata share of net income from our ownership in CCIF. |
| | Investing for the long runTM | 53 | |
W. P. Carey Inc.
Appendix – Fourth Quarter 2016
The below charts highlight the changes in our debt maturities from December 31, 2016 to February 23, 2017, the date of this filing.
Debt Maturity – as of December 31, 2016 (a) | |
In millions. Pro rata. Foreign currency debt balances converted at December 31, 2016 foreign exchange rates.
Debt Maturity – as of February 23, 2017 (a) | |
In millions. Pro rata. Foreign currency debt balances converted at December 31, 2016 foreign exchange rates.
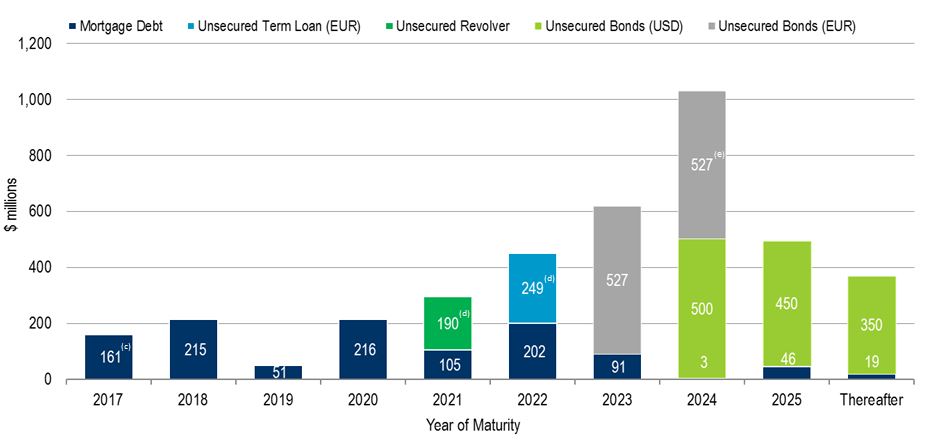
________
(a) | Debt maturity data is presented on a pro rata basis. See the Terms and Definitions section in the Appendix for a description of pro rata. Balances include balloon payments after scheduled amortization for our non-recourse debt. Excludes unamortized discount and unamortized deferred financing costs. |
(b) | Prior to December 31, 2016, we provided notification to exercise our option to extend the maturity date of our Senior Unsecured Credit Facility – Term Loan by one year; the new maturity date was January 31, 2018. On January 26, 2017, we exercised this option. |
(c) | From January 1, 2017 to February 23, 2017, we repaid five non-recourse mortgage loans and transferred ownership of two international properties and the related non-recourse mortgage loan to the mortgage lender. A portion of these amounts were denominated in euros. |
| | Investing for the long runTM | 54 | |
W. P. Carey Inc.
Appendix – Fourth Quarter 2016
(d) | On February 22, 2017, we amended and restated our existing $1.75 billion unsecured credit facility, to be comprised of a $1.5 billion revolving credit facility maturing in four years with two six-month extension options and a €236.3 million ($250.0 million) term loan maturing in five years. We also entered into a new $100.0 million unsecured delayed draw term loan maturing in five years. From January 1, 2017 to February 23, 2017, we repaid certain amounts under our Senior Unsecured Credit Facility – Revolver. |
(e) | On January 19, 2017, we completed a public offering of €500.0 million aggregate principal amount of 2.25% Senior Notes due July 19, 2024. |
| | Investing for the long runTM | 55 | |
W. P. Carey Inc.
Appendix – Fourth Quarter 2016
Terms and Definitions | |
Non-GAAP Financial Disclosures
AFFO
Due to certain unique operating characteristics of real estate companies, as discussed below, the National Association of Real Estate Investment Trusts, Inc., or NAREIT, an industry trade group, has promulgated a non-GAAP measure known as FFO, which we believe to be an appropriate supplemental measure, when used in addition to and in conjunction with results presented in accordance with GAAP, to reflect the operating performance of a REIT. The use of FFO is recommended by the REIT industry as a supplemental non-GAAP measure. FFO is not equivalent to nor a substitute for net income or loss as determined under GAAP.
We define FFO, a non-GAAP measure, consistent with the standards established by the White Paper on FFO approved by the Board of Governors of NAREIT, as revised in February 2004. The White Paper defines FFO as net income or loss computed in accordance with GAAP, excluding gains or losses from sales of property, impairment charges on real estate, and depreciation and amortization from real estate assets; and after adjustments for unconsolidated partnerships and jointly owned investments. Adjustments for unconsolidated partnerships and jointly owned investments are calculated to reflect FFO. Our FFO calculation complies with NAREIT’s policy described above.
We modify the NAREIT computation of FFO to include other adjustments to GAAP net income to adjust for certain non-cash charges such as amortization of real estate-related intangibles, deferred income tax benefits and expenses, straight-line rents, stock compensation, gains or losses from extinguishment of debt and deconsolidation of subsidiaries and unrealized foreign currency exchange gains and losses. Our assessment of our operations is focused on long-term sustainability and not on such non-cash items, which may cause short-term fluctuations in net income but have no impact on cash flows. Additionally, we exclude non-core income and expenses such as property acquisition and other expenses, which includes costs recorded related to the restructuring of Hellweg 2, the reversal of liabilities for German real estate transfer taxes that were previously recorded in connection with the CPA®:15 merger and our formal strategic review, certain lease termination income, and expenses related to restructuring and other compensation-related expenses resulting from a reduction in headcount and employee severance arrangements. We also exclude realized gains/losses on foreign exchange transactions (other than those realized on the settlement of foreign currency derivatives), which are not considered fundamental attributes of our business plan and do not affect our overall long-term operating performance. We refer to our modified definition of FFO as AFFO. We exclude these items from GAAP net income to arrive at AFFO as they are not the primary drivers in our decision making process and excluding these items provides investors a view of our portfolio performance over time and makes it more comparable to other REITs which are currently not engaged in acquisitions, mergers and restructuring which are not part of our normal business operations. We use AFFO as one measure of our operating performance when we formulate corporate goals, evaluate the effectiveness of our strategies, and determine executive compensation.
We believe that AFFO is a useful supplemental measure for investors to consider as we believe it will help them to better assess the sustainability of our operating performance without the potentially distorting impact of these short-term fluctuations. However, there are limits on the usefulness of AFFO to investors. For example, impairment charges and unrealized foreign currency losses that we exclude may become actual realized losses upon the ultimate disposition of the properties in the form of lower cash proceeds or other considerations. We use our FFO and AFFO measures as supplemental financial measures of operating performance. We do not use our FFO and AFFO measures as, nor should they be considered to be, alternatives to net earnings computed under GAAP or as alternatives to cash from operating activities computed under GAAP or as indicators of our ability to fund our cash needs.
Pro Rata Cash NOI
Cash net operating income, or cash NOI, is a non-GAAP financial measure that is intended to reflect the performance of our net leased and operating properties. We define cash NOI as cash rents from our leased and operating properties less non-reimbursable property expenses. Cash NOI excludes amortization of intangibles and straight-line rent adjustments that are included in GAAP lease revenues. We present cash NOI on a pro rata basis, referred to as pro rata cash NOI, to account for our share of income related to unconsolidated joint ventures and noncontrolling interests. We believe that pro rata cash NOI is a helpful measure that both investors and management can use to evaluate the financial performance of our leased and operating properties and it allows for comparison of our operating performance between periods and to other REITs. Pro rata cash NOI should not be considered as an alternative to net income as an indication of our financial performance or to cash flows as a measure of liquidity or our ability to fund all needs. The method by which we calculate and present cash NOI and/or pro rata cash NOI, may not be directly comparable to the way other REITs present cash NOI.
Normalized Pro Rata Cash NOI
Normalized pro rata cash NOI is pro rata cash NOI as defined above adjusted primarily to exclude our pro rata share of cash NOI from properties disposed of during the most recent quarter and to include a full quarter’s pro rata cash NOI related to properties acquired or placed into service during the period. We believe this measure provides a helpful representation of our net operating income from our in-place leased and operating properties.
| | Investing for the long runTM | 56 | |
W. P. Carey Inc.
Appendix – Fourth Quarter 2016
Adjusted EBITDA
We believe that EBITDA is a useful supplemental measure to investors and analysts for assessing the performance of our business segments because (i) it removes the impact of our capital structure from our operating results and (ii) because it is helpful when comparing our operating performance to that of companies in our industry without regard to such items, which can vary substantially from company to company. Adjusted EBITDA as disclosed represents EBITDA, modified to include other adjustments to GAAP net income for certain non-cash charges, such as impairments, non-cash rent adjustments, and unrealized gains and losses from our hedging activity. Additionally, we exclude merger expenses related to the CPA®:16 merger, which are considered non-core, and gains and losses in real estate, which are not considered fundamental attributes of our business plans and do not affect our overall long-term operating performance. We exclude these items from adjusted EBITDA as they are not the primary drivers in our decision-making process. Our assessment of our operations is focused on long-term sustainability and not on such non-cash and non-core items, which may cause short-term fluctuations in net income but have no impact on cash flows. We believe that adjusted EBITDA is a useful supplemental measure to investors and analysts, although it does not represent net income that is computed in accordance with GAAP. Accordingly, adjusted EBITDA should not be considered as an alternative to net income or as an indicator of our financial performance. EBITDA and adjusted EBITDA as calculated by us may not be comparable to similarly titled measures of other companies.
Other Metrics
Pro Rata Metrics
This supplemental package contains certain metrics prepared under the pro rata consolidation method. We refer to these metrics as pro rata metrics. We have a number of investments, usually with our affiliates, in which our economic ownership is less than 100%. Under the full consolidation method, we report 100% of the assets, liabilities, revenues and expenses of those investments that are deemed to be under our control or for which we are deemed to be the primary beneficiary, even if our ownership is less than 100%. Also, for all other jointly owned investments, which we do not control, we report our net investment and our net income or loss from that investment. Under the pro rata consolidation method, we present our proportionate share, based on our economic ownership of these jointly owned investments, of the assets, liabilities, revenues and expenses of those investments.
ABR
ABR represents contractual minimum annualized base rent for our net-leased properties and reflects exchange rates as of the date of this report. If there is a rent abatement, we annualize the first monthly contractual base rent following the free rent period. ABR is not applicable to operating properties.
| | Investing for the long runTM | 57 | |