Attached files
Table of Contents
UNITED STATES
SECURITIES AND EXCHANGE COMMISSION
Washington, D.C. 20549
FORM 10-K
| ☒ | ANNUAL REPORT PURSUANT TO SECTION 13 OR 15(d) OF THE SECURITIES EXCHANGE ACT OF 1934 |
For the fiscal year ended December 31, 2016
| ☐ | TRANSITION REPORT PURSUANT TO SECTION 13 OR 15(d) OF THE SECURITIES EXCHANGE ACT OF 1934 |
For the transition period from to
Commission File No. 333-198807
Valeritas Holdings, Inc.
(Exact name of registrant as specified in its charter)
| Delaware | 46-5648907 | |
| (State or other jurisdiction of incorporation or organization) |
(I.R.S. Employer Identification No.) |
| 750 Route 202 South, Suite 600 Bridgewater, NJ |
08807 | |
| (Address of principal executive offices) | (Zip code) |
(908) 927-9920
(Registrant’s telephone number, including area code)
Securities registered pursuant to Section 12(b) of the Act: None.
Securities registered pursuant to Section 12(g) of the Act: None
Indicate by check mark if the registrant is a well-known seasoned issuer, as defined in Rule 405 of the Securities Act. YES ☐ NO ☒
Indicate by check mark if the registrant is not required to file reports pursuant to Section 13 or 15(d) of the Act. YES ☒ NO ☐
Indicate by check mark whether the registrant: (1) has filed all reports required to be filed by Section 13 or 15(d) of the Securities Exchange Act of 1934 during the preceding 12 months (or for such shorter period that the registrant was required to file such reports), and (2) has been subject to such filing requirements for the past 90 days. YES ☒ NO ☐
Indicate by check mark whether the registrant has submitted electronically and posted on its corporate Web site, if any, every Interactive Data File required to be submitted and posted pursuant to Rule 405 of Regulation S-T (§232.405 of this chapter) during the preceding 12 months (or for such shorter period that the registrant was required to submit and post such files). YES ☒ NO ☐
Indicate by check mark if disclosure of delinquent filers pursuant to Item 405 of Regulation S-K (§229.405) is not contained herein, and will not be contained, to the best of registrant’s knowledge, in definitive proxy or information statements incorporated by reference in Part III of this Form 10-K or any amendment to this Form 10-K. ☒
Indicate by check mark whether the registrant is a large accelerated filer, an accelerated filer, a non-accelerated filer, or a smaller reporting company. See the definitions of “large accelerated filer,” “accelerated filer” and “smaller reporting company” in Rule 12b-2 of the Exchange Act.
| Large accelerated filer | ☐ | Accelerated filer | ☐ | |||
| Non-accelerated filer | ☐ (Do not check if a smaller reporting company) | Smaller reporting company | ☒ |
Indicate by check mark whether the registrant is a shell company (as defined in Rule 12b-2 of the Exchange Act). YES ☐ NO ☒
The aggregate market value of the voting common equity held by non-affiliates as of June 30, 2016, the last business day of the registrant’s most recently completed second fiscal quarter, was approximately $15,153,089. The registrant has no non-voting common equity.
The number of outstanding shares of common stock of the registrant as of February 13, 2017 was 13,127,311.
Table of Contents
VALERITAS HOLDINGS, INC.
ANNUAL REPORT ON FORM 10-K
i
Table of Contents
CAUTIONARY NOTE REGARDING FORWARD-LOOKING STATEMENTS
This report contains forward-looking statements, including, without limitation, in the sections captioned “Risk Factors”, “Management’s Discussion and Analysis of Financial Condition and Plan of Operations”, and “Business”. Any and all statements contained in this report that are not statements of historical fact may be deemed forward-looking statements. Terms such as “may,” “might,” “would,” “should,” “could,” “project,” “estimate,” “pro-forma,” “predict,” “potential,” “strategy,” “anticipate,” “attempt,” “develop,” “plan,” “help,” “believe,” “continue,” “intend,” “expect,” “future,” and terms of similar import (including the negative of any of the foregoing) may be intended to identify forward-looking statements. However, not all forward-looking statements may contain one or more of these identifying terms. Forward-looking statements in this report may include, without limitation, statements regarding (i) the plans and objectives of management for future operations, including plans or objectives relating to the development of commercially viable new products, (ii) a projection of income (including income/loss), earnings (including earnings/loss) per share, capital expenditures, dividends, capital structure or other financial items, (iii) our future financial performance, including any such statement contained in a discussion and analysis of financial condition by management or in the results of operations included pursuant to the rules and regulations of the SEC, and (iv) the assumptions underlying or relating to any statement described in points (i), (ii) or (iii) above.
The forward-looking statements are not meant to predict or guarantee actual results, performance, events or circumstances and may not be realized because they are based upon our current projections, plans, objectives, beliefs, expectations, estimates and assumptions and are subject to a number of risks and uncertainties and other influences, many of which we have no control over. Actual results and the timing of certain events and circumstances may differ materially from those described by the forward-looking statements as a result of these risks and uncertainties. Factors that may influence or contribute to the inaccuracy of the forward-looking statements or cause actual results to differ materially from expected or desired results may include, without limitation:
| • | our history of operating losses and uncertainty regarding our ability to achieve profitability; |
| • | our reliance on V-Go to generate all of our revenue; |
| • | our inability to retain a high percentage of our patient customer base or our significant wholesale customers; |
| • | the failure of V-Go to achieve and maintain market acceptance; |
| • | competitive products and other technological breakthroughs that may render V-Go obsolete or less desirable; |
| • | our inability to maintain or expand our sales and marketing infrastructure; |
| • | our inability to operate in a highly competitive industry and to compete successfully against competitors with greater resources; |
| • | any inaccuracies in our assumptions about the insulin-dependent diabetes market; |
| • | manufacturing risks, including risks related to manufacturing in Southern China, damage to facilities or equipment and failure to efficiently increase production to meet demand; |
| • | our dependence on limited source suppliers and our inability to obtain components for our product; |
| • | our failure to secure or retain adequate coverage or reimbursement for V-Go by third-party payors; |
| • | our inability to enhance and broaden our product offering, including through the successful commercialization of the pre-fill V-Go; |
| • | our inability to protect our intellectual property and proprietary technology; |
ii
Table of Contents
| • | our failure to comply with the applicable governmental regulations to which our product and operations are subject; and |
| • | other risks and uncertainties, including those listed under the section entitled “Risk Factors.” |
Readers are cautioned not to place undue reliance on forward-looking statements because of the risks and uncertainties related to them and to the risk factors. We disclaim any obligation to update the forward-looking statements contained in this report to reflect any new information or future events or circumstances or otherwise, except as required by law.
Readers should read this report in conjunction with the discussion under the caption “Risk Factors”, our financial statements and the related notes thereto in this report.
iii
Table of Contents
PART I
About this Annual Report
On May 3, 2016, pursuant to an Agreement and Plan of Merger and Reorganization, or the Merger Agreement, by and among Valeritas Holdings, Inc., Valeritas Acquisition Corp., a Delaware corporation and a direct wholly owned subsidiary of Valeritas Holdings, Inc., or the Acquisition Subsidiary, and Valeritas, Inc., Acquisition Subsidiary was merged with and into Valeritas, with Valeritas being the surviving entity and as a wholly owned subsidiary of Valeritas Holdings, Inc., or the 2016 Merger. Immediately prior to the 2016 Merger, all shares of common stock, Series D Preferred Stock, Series AA Preferred Stock, and shares underlying common stock options and shares underlying the warrants were canceled without consideration. Concurrent with the 2016 merger, the shares of Valeritas private company Series AB Preferred Stock were canceled and each share of private company Series AB Preferred Stock of Valeritas was replaced with 0.23856 shares of common stock of Valeritas Holdings, Inc.
Upon the closing of the Merger, under the terms of a split-off agreement and a general release agreement, Valeritas Holdings, Inc. transferred all of its pre-Merger operating assets and liabilities to its wholly owned special purpose subsidiary, or the Split-Off Subsidiary, and transferred all of the outstanding shares of capital stock of Split-Off Subsidiary to the pre-Merger majority stockholder of Valeritas Holdings, Inc., or the Split-Off, in consideration of and in exchange for (i) the surrender and cancellation of 40,486,000 shares of Valeritas Holdings, Inc. common stock held by such stockholder (which will be cancelled and will resume the status of authorized but unissued shares of Valeritas Holdings, Inc. common stock) and (ii) certain representations, covenants and indemnities.
The Merger was accounted for as a “reverse merger,” and Valeritas is deemed to be the accounting acquirer in the reverse merger. The historical financial statements of the Valeritas Holding, Inc. prior to the 2016 Merger have been replaced with the historical financial statements of Valeritas.
As used in this Annual Report on Form 10-K, unless otherwise stated or the context otherwise indicates, references to “Valeritas,” the “Company,” “we,” “our,” “us” or similar terms refer to Valeritas Holdings, Inc. and its subsidiary Valeritas, Inc.
Overview
We are a commercial-stage medical technology company focused on improving health and simplifying life for people with diabetes by developing and commercializing innovative technologies. We designed our first commercialized product, the V-Go Wearable Insulin Delivery Device, or V-Go, to help patients with Type 2 diabetes who require insulin to achieve and maintain their target blood glucose goals. V-Go is indicated for continuous subcutaneous infusion of insulin over 24 hours and on-demand bolus dosing in two-unit increments in adult patients requiring insulin. V-Go is a small, discreet and easy-to-use disposable insulin delivery device that a patient adheres to his or her skin every 24 hours. V-Go enables patients to closely mimic the body’s normal physiologic pattern of insulin delivery throughout the day and to manage their diabetes with insulin without the need to plan a daily routine around multiple daily injections.
We currently focus on the treatment of patients with Type 2 diabetes—a pervasive and costly disease that, according to the 2014 National Diabetes Statistics Report released by the U.S. Centers for Disease Control and Prevention, or CDC, currently affects 90% to 95% of the approximately 21 million U.S. adults diagnosed with diabetes. The CDC estimates that the combined direct medical and drug costs and indirect lost productivity costs of diabetes in the United States in 2012 were approximately $245 billion annually. We believe the majority of the 12.6 million U.S. adults treating their Type 2 diabetes with more than one daily oral anti-diabetic drug, or OAD, or an injectable diabetes medicine can benefit from the innovative approach of V-Go to manage Type 2 diabetes.
1
Table of Contents
Our near-term market consists of approximately 5.6 million of these patients who currently take insulin, of which up to 4.5 million may not be achieving their target blood glucose goal. This patient population represents a $16.5 billion annual U.S. market when applying the annual wholesale acquisition cost, or WAC, of V-Go to the 4.5 million patients not achieving glycemic control. WAC is the gross price paid by wholesalers and does not take into account fees, discounts, and rebates from us.
Insulin therapies using syringes, pens and programmable insulin pumps are often burdensome to a Type 2 diabetes patient’s daily routine, which can lead to poor adherence to prescribed insulin regimens and, as a result, ineffective diabetes management. We developed V-Go utilizing our core technology, the h-Patch platform, as a patient-focused solution to address the challenges of traditional insulin therapies. Our h-Patch platform facilitates the simple and effective subcutaneous delivery of injectable medicines to patients across a broad range of therapeutic areas. V-Go enables patients to closely mimic the body’s normal physiologic pattern of insulin delivery by releasing a single type of insulin at a continuous preset background, or basal, rate over a 24-hour period and on demand around mealtime, or bolus dosing. We believe V-Go is an attractive management tool for patients with Type 2 diabetes requiring insulin because it only requires a single fill of insulin prior to use and provides comprehensive basal-bolus therapy without the burden and inconvenience associated with multiple daily injections. V-Go is available in three different dosages depending on the patient’s needs and is generally cost competitive for both patients and third-party payors when compared to insulin pens or programmable insulin pumps.
V-Go was one of the first insulin delivery device cleared by the U.S. Food and Drug Administration, or FDA, under its Infusion Pump Improvement Initiative, which established additional device manufacturing requirements designed to foster the development of safer, more effective infusion pumps, and is the only FDA-cleared mechanical basal-bolus insulin delivery device on the market in the United States. All other FDA-cleared basal-bolus insulin delivery products currently available in the United States are electronic and are classified as Durable Medical Equipment and, although cleared for both Type 1 and Type 2 diabetes, were designed primarily for patients with Type 1 diabetes. As V-Go is a mechanical device, it does not include any electronics, batteries or audible alarms and does not require any recharging or programming, which allows for simple and discreet use. Unlike electronic insulin delivery devices, V-Go is not classified as durable medical equipment by the Centers for Medicare and Medicaid Services, or CMS, allowing for potential Medicare reimbursement under Medicare Part D. The Medicare Part D outpatient drug benefit defines V-Go and certain other supplies used for injecting insulin as “drugs,” which allows V-Go to be available for coverage by Part D Plans under Medicare Part D. In addition to Medicare, a majority of commercially insured patients are currently covered for V-Go under their insurance plans.
We commenced commercial sales of V-Go in the United States during 2012. During the first half of 2012, we initiated an Early Access Program to provide a limited number of physicians with free V-Go products for patients and began shipments to major wholesalers in anticipation of commercial launch. In the second half of 2012, we began hiring sales representatives in selected U.S. markets. In February 2016, we underwent a reduction-in-force of our sales representatives to focus our resources on prioritized higher-volume territories. At the end of 2016, our sales team, which consisted of 37 sales representatives, covered 37 territories primarily within the East, South, Midwest and Southwest regions of the United States. We currently have 36 sales representatives.
Our net loss was $46.4 million and $67.2 million for the years ended December 31, 2016 and 2015, respectively. Our accumulated deficit as of December 31, 2016 and 2015 was $424.2 million and $377.9 million, respectively. Based on prescription data, we estimate that there were approximately 89,600 prescriptions reported for V-Go filled during the year ended December 31, 2016. Refill prescriptions account for slightly more than two-thirds of our total prescriptions, and generally move in parallel with our patient retention rates, so can be used as a proxy to determine patient retention. We estimate that as of December 31, 2016, V-Go had been used for over 10 million cumulative patient days with over 10 million V-Go’s dispensed to patients.
2
Table of Contents
Market Opportunity
Diabetes is a chronic, life-threatening disease and was reported in 2014 to impact an estimated 422 million people worldwide and is characterized by the body’s inability to properly metabolize glucose. Management of glucose is regulated by insulin, a hormone that allows cells in the body to absorb glucose from blood and convert it into energy. In people without diabetes, the body releases small amounts of insulin regularly over 24 hours and additional amounts of insulin when eating meals. Diabetes is classified into two main types. Type 1 diabetes is caused by an autoimmune response in which the body attacks and destroys the insulin-producing cells of the pancreas. As a result, the pancreas can no longer produce insulin, requiring patients to administer daily insulin injections to survive. Type 2 diabetes, the more prevalent form of the disease, occurs when either the body does not produce enough insulin to regulate the amount of glucose in the blood or cells become resistant to insulin and are unable to use it effectively. Type 1 diabetes is frequently diagnosed during childhood or adolescence, and the onset of Type 2 diabetes generally occurs in adulthood, but its incidence is growing among the younger population primarily due to the increasing incidence of childhood obesity. In addition, other factors commonly thought to be contributing to the prevalence and growth of Type 2 diabetes include aging populations, sedentary lifestyles, worsening diets and increased adult obesity.
In 2014, the CDC estimated that 29.1 million people in the United States have diabetes while only 21 million people have been formally diagnosed with the disease by a medical professional. The CDC further estimates that 86 million Americans over the age of 20 had “pre-diabetes,” which means a higher than normal blood glucose level that, without intervention, is likely to result in Type 2 diabetes within 10 years. In 2010, the prevalence of diagnosed and undiagnosed patients with diabetes aged 20 to 64 years old was estimated by the CDC to be 20% and 26% in patients over 65 years of age. In 2010, an additional 1.9 million individuals in the United States were diagnosed with diabetes, according to the CDC, a rate that could result in as many as one in every three Americans having diabetes by 2050. The CDC estimated the total cost burden of diagnosed diabetes of both types in the United States in 2012 to be $245 billion annually, which includes direct medical costs of $176 billion.
Type 2 diabetes is a progressive disease. Data from the United Kingdom Prospective Diabetes Study suggest that individuals with Type 2 diabetes lose on average approximately 50% of the function of their beta cells, the cells that produce insulin, prior to diagnosis. If not closely monitored and properly treated, diabetes can lead to serious medical complications. According to the CDC, diabetes is the leading cause of kidney failure, non-traumatic lower limb amputations and new cases of blindness in the United States. The prevalence of other chronic disorders commonly occurring in patients with Type 2 diabetes, including high blood pressure and high cholesterol, can significantly impact a patient’s lifestyle given the various daily treatment regimens often used to treat these conditions. Diabetes has a significant impact on overall patient mortality; according to the CDC, the risk for death among people with diabetes is approximately one and a half that of similarly aged people without diabetes.
A hemoglobin A1C test, which measures a patient’s trailing three-month average blood glucose level, or A1C level, is a key indicator of how well a patient is controlling his or her diabetes. Specifically, the A1C test measures the percentage of a patient’s hemoglobin, a protein in red blood cells that carries oxygen that is coated with sugar. A higher A1C level correlates with poorer blood sugar control and an increased risk of diabetes complications. The American Diabetes Association, or ADA, recommends an A1C goal of no more than 7% for most patients.
Once Type 2 diabetes has been diagnosed, physicians and patients often first seek to manage the disease through meal planning and physical activity before progressing to medications designed to manage A1C levels. Patients often begin medical treatment with a once-daily OAD. If OAD monotherapy does not achieve or maintain the A1C target, combination therapy is recommended, which can include additional oral agents, a glucagon-like peptide 1 receptor agonist or once-daily, or basal, insulin. If basal insulin has been appropriately titrated and glucose levels remain elevated, advancement to an insulin regimen including additional mealtime insulin, or
3
Table of Contents
bolus dosing, is a recommended option. Generally, the introduction of insulin occurs within 10 years of diagnosis.
The following diagram depicts an illustrative treatment progression of a typical patient with Type 2 diabetes, as well as the number of patients currently in each category according to the 2014 U.S. Roper Diabetes Patient Market Study.
Illustrative Type 2 Diabetes Treatment Progression
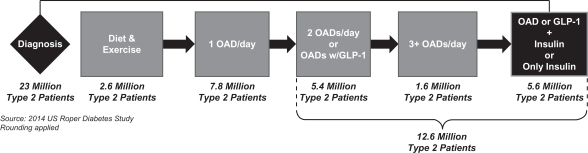
There are approximately 12.6 million patients with Type 2 diabetes in the United States, of which approximately 5.6 million patients currently inject insulin. Our near-term target market consists of the up to 4.5 million patients in this group who may not be achieving the recommended target blood glucose goal (A1C <7%). Of these patients, nearly 3.0 million have an A1C greater than or equal to 8%. In addition, of the remaining approximately 7.0 million U.S. adults with Type 2 diabetes who do not inject insulin, we believe those who are treating their diabetes with more than one OAD per day and/or an injectable GLP-1 diabetes medicine other than insulin can also benefit from the innovative approach of V-Go to manage Type 2 diabetes.
We believe we compete primarily with insulin injections by either insulin pens or insulin syringes. We do not consider insulin pumps as competition because these are electronic devices that are replaced every two to four years based on medical necessity, which we consider common industry practice; have annual medical deductibles and require monthly medical co-insurance due to their classification as durable medical equipment; and, although cleared for Type 1 and Type 2 diabetes, are designed primarily for patients with Type 1 diabetes.
Therapeutic Challenges and Limitations of Current Insulin Delivery Mechanisms
Multiple studies indicate that, when taken as prescribed, a basal-bolus insulin regimen is a very effective means for lowering blood glucose levels of patients with Type 2 diabetes because it most closely mimics the body’s normal physiologic pattern of insulin delivery throughout the day:
| • | basal insulin provides approximately 50% of the daily insulin requirement—insulin is released regularly over 24 hours to control blood glucose—however, this nearly constant rate of insulin release is inadequate to handle post-mealtime glucose excursions (the change in blood glucose concentration from before to after a meal); and |
| • | bolus insulin provides the remaining, approximately 50%, of the daily insulin requirement and is released in response to food intake or a meal to control post-mealtime hyperglycemia—the exaggerated rise in blood glucose following a meal. |
Patient adherence and compliance with basal-bolus insulin therapy using syringes and/or pens has proven difficult because these therapies require the use of various forms of insulin, including long- and short-acting insulin preparations, and due to the inconvenience to patients, who need to plan a routine around multiple daily injections.
4
Table of Contents
The Diabetes Control and Complications Trial, a study of patients with Type 1 diabetes conducted by the National Institute of Diabetes and Digestive and Kidney Diseases, or NIDDK, the results of which were published in The New England Journal of Medicine in 1993, indicated that conventional insulin therapy, defined as one or two insulin injections per day without changing the insulin dose in response to blood glucose levels, is less effective in achieving recommended blood glucose levels over time than intensive insulin therapy in which a patient administers three or more insulin injections per day with varying doses depending upon blood glucose levels. Additionally, the Treating to Target in Type 2 Diabetes study of 708 men and women with suboptimal A1C levels published in The New England Journal of Medicine in 2009, found that by three years or study end, 81.6% of patients initiated on a basal insulin-based regimen required the addition of mealtime insulin three times daily. Sixty-three percent of patients in this basal insulin-based subgroup achieved the A1C goal of less than 7% by study end. We believe the outcomes of these studies confirm that an important factor of any insulin therapy is its ability to mimic the body’s normal physiologic pattern of insulin delivery.
Challenges Associated with Type 2 Diabetes Management
Regardless of the type of insulin therapy, many patients with Type 2 diabetes on insulin fail to reach their A1C goal. Adding mealtime insulin to a basal-only regimen can help, but patient adherence to the prescribed treatment regimen is often a challenge. In a database analysis of 27,897 adult patients prescribed insulin in the United States, the results of which were published in the journal ClinicoEconomics and Outcomes Research in 2013, only 20.4% of patients had reached the ADA’s recommended A1C goal of less than 7%. Similarly poor results were observed across each patient group in the study regardless of whether they were prescribed basal-only insulin, basal-bolus insulin or a combination of both long-acting and fast-acting insulin.
Patient non-adherence to prescribed insulin therapy is often an important contributing factor in a patient’s failure to achieve target A1C goals. In a 2012 survey of 1,250 physicians who treat patients with diabetes and 1,530 insulin-treated patients (180 with Type 1 diabetes and 1,350 with Type 2 diabetes) published in Diabetic Medicine, patients reported insulin omission/non-adherence an average of 3.3 days per month. Additionally, 72.5% of physicians in the study reported that a typical patient did not take his or her insulin as prescribed, with an average of 4.3 days per month of non-compliance with a basal insulin regimen and 5.7 days per month of noncompliance with mealtime administration of insulin. Common reasons cited by patients for failing to comply with a prescribed treatment regimen include the burden of multiple daily injections, the potential embarrassment about injecting medication around family and friends or in public, and interference with the patient’s daily activities and resulting loss of freedom. Similarly, in the 2011 US Roper Diabetes Patient Market Study, or the 2011 Roper Study, of 2,104 patients with diabetes, of which 692 were on insulin, 72% of respondents who had been prescribed to take three or more insulin injections per day did not inject themselves when they were away from home. Failure to comply with prescribed insulin therapy, particularly mealtime insulin therapy, reduces the overall efficacy of insulin treatment in managing Type 2 diabetes.
Limitations of Current Insulin Therapy
OADs are the first line of diabetic therapy for patients with Type 2 diabetes, along with diet and lifestyle changes. However, given that Type 2 diabetes is progressive in nature and that the effectiveness of oral agents and other therapies may decline over time, patients are typically prescribed insulin therapy within 10 years of diagnosis. Depending on the progression of diabetes, there are four primary types of insulin therapy prescribed today for patients with Type 2 diabetes that seek to control or manage their blood glucose levels:
| • | a once-daily dose of basal insulin, typically a long-acting insulin such as Levemir® or Lantus®; |
| • | a twice-daily injection regimen comprised of either a daily injection of long-acting basal insulin in addition to a dose of insulin, typically a short- or fast-acting insulin, such as Humalog®, Apidra® or NovoLog®, with the largest meal or two injections of premixed insulin, which combines long-acting and fast-acting formulations within a single insulin dose; |
5
Table of Contents
| • | intensive therapy requiring multiple daily injections, or MDI, with syringes or preloaded insulin pens; and |
| • | continuous subcutaneous insulin infusion using programmable insulin pumps. |
We believe conventional insulin therapy is among the least expensive insulin-based diabetes treatments and is typically initiated with a once-daily dose of a long-acting insulin. MDI intensive therapy with syringes can be effective and less costly than other therapies. MDI intensive therapy with insulin pens offers a more convenient alternative to syringes but can be more expensive. In addition, programmable insulin pumps offer an effective means of implementing intensive diabetes management with the goal of achieving near-normal blood glucose levels. However, we believe that patient concerns with lifestyle factors, ease of use, convenience and high costs have limited overall adherence to insulin regimens, resulting in a significant number of patients with Type 2 diabetes failing to meet their A1C goals with MDI or the use of programmable insulin pumps.
We believe, based on customer feedback and experience, that the current insulin therapies described below present the following advantages and limitations for patients with Type 2 diabetes.
| • Basal Insulin | ||
| Description: A once-daily dose of long-acting insulin (such as Lantus® and Levemir®) at bedtime or in the morning, although some patients require two injections (morning and bedtime). | ||
| • Advantages |
• Limitations/Challenges | |
| • Easiest to train, learn and correctly administer insulin as injections and can be performed at home
• Least costly analog insulin therapy, which uses genetically altered (or chemically altered) human insulin designed to release injected insulin to more closely mimic human insulin, for patients with most favorable reimbursement coverage
• Lowest risk for patient dosing error |
• Insulin absorption can have variability from day to day or between different patients such that insulin is not released over the entire intended delivery period
• Basal insulin addresses fasting and pre-mealtime glucose levels only, no impact on mealtime glucose excursions
• Most patients eventually need mealtime insulin to achieve their A1C goal | |
| • Basal Insulin + 1 or Premixed Insulin | ||
| Description: Considered a transition regimen towards MDI or intensive therapy typically consisting of a twice-daily injection regimen of either: (i) a daily injection of long-acting insulin (such as Lantus® and Levemir ®) at bedtime (basal) plus an injection of fast acting insulin (such as Humalog® and NovoLog®), before the day’s largest meal, or basal + 1; or (ii) premixed insulin injections before breakfast and dinner. | ||
| • Advantages |
• Limitations/Challenges | |
| • Basal +1 and Premix
• Compared to basal only insulin regimens, provides insulin for at least one, or in the case of premix, two of the patient’s meals
|
• Basal +1 and Premix
• No insulin coverage for at least one meal each day, or in the case of Basal+1, two meals each day
| |
6
Table of Contents
| • Premix
• Injections can normally be performed at home
• Single type of insulin used in a single device |
• Basal +1
• Additional patient co-pay for additional dose of mealtime insulin
• Potential for dosing error increased with two types of insulin
• Premix
• Patients typically use more insulin, may be at increased risk of hypoglycemia and may gain more weight
• Requires planning activities and eating around the timing of injections and absorption of insulin | |
| • Multiple Daily Injections—MDI (Intensive Therapy) | ||
| Description: A once- or twice-daily injection of long-acting insulin at bedtime or in the morning (basal rate) plus an injection of fast-acting insulin before meals and, if appropriate, with snacks (bolus dose). | ||
| • Advantages |
• Limitations/Challenges | |
| • With strict adherence, can closely mimic the body’s normal physiologic pattern of insulin release
• Allows insulin dosing based on the requirements of individual meals
• Lower cost with favorable reimbursement coverage compared to programmable insulin pumps
• Easier to teach, learn and correctly administer compared to programmable insulin pumps |
• Frequent injections (usually at least four per day)
• Requires training around two different types of insulin and the need to carry two types of insulin or insulin pens
• Potential for dosing error increased with two types of insulin
• Requires significant planning of meals and other activities
• Injections often administered outside the home creating adherence challenges especially around meals
• Requires two patient co-pays | |
| • Programmable Insulin Pumps | ||
| Description: A wearable electronic insulin pump filled with a fast-acting insulin that delivers a continuous dose of insulin (basal rate) and the ability to deliver insulin with meals or snacks (bolus dose), based upon programmable settings and patient input. Most pumps require an infusion set to deliver the insulin in addition to the pump. | ||
| • Advantages |
• Limitations/Challenges | |
| • When used properly, can most closely mimic the body’s normal physiologic pattern of insulin release
• Customized basal and bolus insulin doses
• Eliminates the need for daily needle injections |
• Most complicated to teach, learn and correctly administer and normally requires a proactive and adherent patient
• Bothersome to wear and least discreet alternative | |
7
Table of Contents
| • Most significant risk of dosing errors due to the wide range of programmable functions and features
• Highest up-front and maintenance cost
• Reimbursement coverage for patients with Type 2 diabetes significantly less accessible than for injections |
Given the reasons cited by patients for non-adherence to and the limitations of currently prescribed insulin therapy, we believe simplicity of insulin delivery contributes to adherence with therapy. In turn, when patients more fully comply with their prescribed treatment regimen, we believe that insulin therapy will be more effective. While insulin syringes, insulin pens and programmable insulin pumps are capable of facilitating basal-bolus therapy, we believe these methods of administration generally lack the simplicity of operation and lifestyle adaptability desired by patients with Type 2 diabetes. We believe that, in general, programmable insulin pump therapies tend to have more advantages for Type 1 patients who may require varying basal rates over a 24-hour period or more complex bolus dosing regimens. These complexities are generally not encountered by patients with Type 2 diabetes.
The following diagram demonstrates the benefits of V-Go as compared to other currently available insulin therapies in terms of simplicity of use and ability to mimic the body’s normal physiologic pattern of insulin delivery. We estimate that more than 95% of patients with type 2 diabetes are prescribed a regimen that relies on an insulin pen device or insulin syringe to deliver insulin including basal, basal + 1, premix and intensive therapy or multiple daily injection regimens.
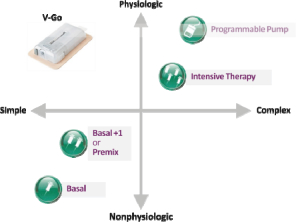
We believe V-Go is appealing to healthcare providers and patients because it combines the benefits of basal-bolus therapy with the convenience of a once-daily injection using just one type of insulin and a smaller amount of it compared to injection. Our internal studies indicate that these characteristics help support patient compliance with basal-bolus regimens, thereby improving glycemic control. We also believe V-Go is an attractive option because it is discreet and simple to operate, yet mimics the body’s normal physiologic pattern of insulin delivery without the inconvenience associated with syringes and pens or the complexities associated with programmable pumps.
8
Table of Contents
Our Solution
Simple, Discreet and Effective Type 2 Diabetes Management
V-Go fills a critical need of patients with Type 2 diabetes who, we believe, desire and benefit from an easy-to-use, more discreet, basal-bolus insulin regimen. As depicted in the following image, V-Go is designed to be worn on the skin under clothing and measures just 2.4 inches wide by 1.3 inches long by 0.5 inches thick (excluding the adhesive component), weighing approximately one ounce when filled with insulin.
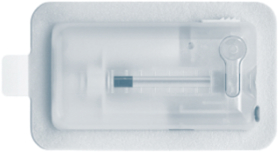
Specifically Designed for Patients with Type 2 Diabetes
Patients with Type 2 diabetes who are prescribed intensive insulin therapy report the burden of multiple injections, embarrassment of injection and interference with daily activities as key factors for non-compliance with insulin therapy. Unlike programmable insulin pumps, V-Go is a 24 hour, disposable mechanical device that operates without electronics, batteries, infusion sets or programming and with fewer injections then using insulin syringes or pens. In the 2011 Roper Study, 72% of patients with Type 2 diabetes prescribed basal-bolus injectable insulin regimens reported not taking injections away from home, making it difficult for many of them to remain in compliance with their prescribed therapy. V-Go was designed to facilitate basal-bolus therapy compliance by removing the complexity and stigma of insulin injections in patients with Type 2 diabetes. In patients we surveyed prior to starting V-Go and again 30 days after being on V-Go, 53% of patients found V-Go very convenient compared to only 10% reporting their prior therapy was very convenient. In this same survey, 64% of patients felt their quality of life, based on how they felt physically or mentally, was generally good to excellent compared to only 35% prior to V-Go.
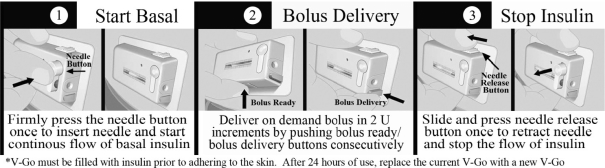
The following diagram demonstrates the basal and bolus functions of V-Go. The bolus operation can be completed through the patient’s clothing.
Simple, Effective and Innovative Approach to Insulin-Based Diabetes Management
V-Go utilizes our proprietary h-Patch drug delivery technology to enable patients to closely mimic the body’s normal physiologic pattern of insulin delivery by delivering a single type of insulin at a predictable and
9
Table of Contents
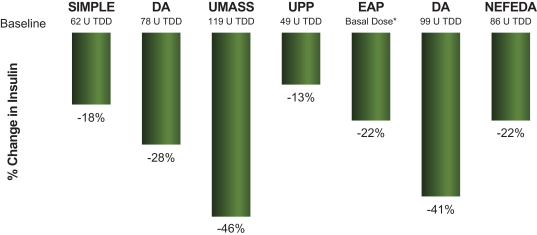
continuous preset basal rate over a 24-hour period and providing convenient and discreet on-demand bolus dosing at mealtimes. We believe V-Go is a simple and effective approach to insulin therapy and facilitates patient adherence to basal-bolus insulin regimens, which leads to better patient results. In a series of clinical studies examining patients with diabetes using V-Go, clinically relevant reductions in A1C levels were observed after switching to or initiating V-Go therapy, as well as reductions in the prescribed total daily insulin dose. These findings are summarized in the following charts and are described in more detail under “—Extensive Clinical Evidence Demonstrating Results.”
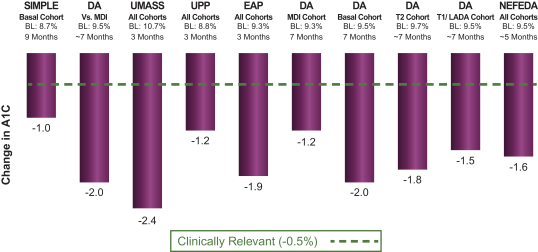
SIMPLE=prospective observational study. DA=Diabetes America- retrospective database analysis. UMass=University of Massachusetts third-party observational case series. UPP=User Preference Program. EAP=Early Access Program. NEFEDA=Northeast Florida Endocrine & Diabetes Associates- retrospective database analysis
SIMPLE=prospective observational study. DA=Diabetes America- retrospective database analysis. UMass=University of Massachusetts third-party observational case series. UPP=User Preference Program. EAP= Early Access Program. NEFEDA=Northeast Florida Endocrine & Diabetes Associates- retrospective database analysis
10
Table of Contents
User-Friendly Design
In addition to its small size and dosage versatility, V-Go offers many additional user-friendly features designed to treat and improve the quality of life of patients with Type 2 diabetes requiring insulin, including:
| • | using a single fast-acting insulin, such as Humalog® or NovoLog ®, rather than a combination of multiple types or premixed insulin; |
| • | not requiring patients to carry syringes, pens or other supplies for mealtime bolus dosing; |
| • | offering the convenience of pressing buttons for on-demand bolus dosing through clothing; |
| • | allowing patients to easily maintain their daily routines and activities, including showering, exercising and sleeping; |
| • | only requiring application of a new V-Go every 24 hours, which offers patients the flexibility to selectively choose an application site that best suits the day’s activities; and |
| • | not burdening patients with the complexities associated with learning to use an electronic device or programming a pump. |
Cost Effective for Payor and Patient Alike
V-Go is generally a cost competitive option for payors and patients when compared to insulin pens, which is the delivery method prescribed for a majority of all insulin therapies and approximately 66% of newly prescribed basal and mealtime insulin therapies. V-Go is available at retail and mail order pharmacies and is covered by Medicare as well as commercial insurance plans covering a majority of patients. As a result, out-of-pocket costs for covered patients using V-Go are generally equivalent to what they would pay if taking basal-bolus injections with insulin pens or syringes. We believe that, from a payor’s perspective, using V-Go for insulin delivery will generally be associated with an equal or lower cost, net of rebates and co-pays, to treat a patient compared to the cost of using multiple daily injections to deliver basal-bolus insulin therapy. Moreover, insulin delivery with V-Go is significantly less expensive, especially in the first year, than treatment with programmable insulin pumps. This cost difference in the first year is attributed to the programmable durable medical equipment component associated with electronic insulin pumps that are not needed for V-Go. This durable medical equipment component can have initial costs for the pump and supplies of approximately $5,000 per device. In addition, daily consumables such as tubing and insertion sets are required for electronic pump therapy and not on V-Go.
Another consideration is out-of-pocket costs for patients with different diabetes regimens. Pharmacy formularies are separated into multiple tiers, of which Tier 2 and Tier 3 are most applicable to the V-Go. Tier 1 products are the lowest cost tier of prescription products, which mainly consists of generic drugs; Tier 2 products are generally preferred brand name products, for which co-pays are more than Tier 1; and Tier 3 consists mainly of non-preferred brand name products, which are more expensive than Tier 2. We believe that patient costs can be neutral when switching from basal-bolus insulin pen therapy to V-Go therapy. As every payor and every employer plan within a payor has their own co-pay structure, we reached this conclusion by utilizing national averages provided by a national employer health benefits survey conducted in 2014 by Kaiser Permanente to make comparisons. We estimated co-pays for insulin pens and pen needles to be $73 per month, which assumes national Tier 2 co-pay equal to $31 for each pen box and $11 for pen needles. The V-Go co-pay can be $31 for Tier 2 or $53 for Tier 3 for a month supply, depending on which formulary Tier it is assigned to . Insulin vials for V-Go would be similar to insulin pens at $31 per month. Therefore, expected monthly co-pay for V-Go can be $62 when in Tier 2 or $84 when in Tier 3, which is essentially cost neutral to patients.
Comprehensive Customer Support
The majority of patients using V-Go are trained to use the device by their healthcare provider or a Certified Diabetes Educator, or CDE, who has been trained by our sales force using a “train the trainer” approach. Our
11
Table of Contents
sales force has the ability to train patients directly and also trains physicians, physicians’ assistants, nurse practitioners, CDEs and any other staff in a healthcare provider’s office, who are responsible for training their patients to properly use V-Go. Additionally, we provide a starter kit for new V-Go patients, which contains all the materials a patient needs to deliver basal-bolus insulin therapy with V-Go. We also offer supplemental training support and resources when healthcare providers or patients need additional V-Go training assistance, including online resources such as a learning management system and online videos.
Our V-Go Customer Care Center, or VCC, is a live customer care center operating 24 hours a day, seven days a week. The VCC provides broad-based V-Go operational assistance to healthcare providers, patients, caregivers and pharmacists. Every patient is encouraged to call the VCC in order to opt-in for support and, once a patient does opt- in, a VCC staff-member proactively contacts the patient at various times to provide additional patient support and promote proper use of V-Go. VCC representatives can also train patients on the operational aspects of V-Go either via phone or video. The VCC also offers a reimbursement support service to answer patients’ reimbursement-related questions.
Extensive Clinical Evidence Demonstrating Results
The V-Go solution to Type 2 diabetes management is focused both on A1C management and on providing patients the requisite support to achieve their goal of improved health. We and others have conducted several studies, analyses and research surveys to evaluate the role of V-Go in A1C management. These studies include a prospective observational study, user preference studies, retrospective analyses of diabetic patient’s electronic medical records and patient and physician surveys. The results of these studies and analyses are described below.
User Preference Program
In 2008, we conducted a user preference program, or UPP, designed to gain feedback about V-Go. We surveyed 10 healthcare professionals and 31 patients to determine their impressions about usability, convenience, comfort, educational materials and effectiveness of V-Go. Patients were asked to rate, on a 10-point scale, their overall experience as well as their impressions of various parameters associated with V-Go, such as ease of use, how discreet it was, how comfortable the device was to wear, whether they would recommend V-Go to a friend or family member and how helpful our patient education teams were. For each measure evaluated, V-Go received an average score of between 8.7 and 9.4 on a 10-point scale, which we consider to be highly positive. We also surveyed patients about their adherence to V-Go therapy as part of the UPP and found a patient-reported adherence rate of 98%.
To obtain information on the efficacy of V-Go in helping to manage blood glucose control, we performed a retrospective analysis of 23 of the patients who participated in the UPP, of which 22 had Type 2 diabetes and one had Type 1 diabetes, the results of which were published in the journal Endocrine Practice in 2012. Data was collected before V-Go initiation, after 12 weeks of V-Go use, at the end of V-Go treatment and 12 weeks after discontinuing V-Go. After 12 weeks of V-Go use, compared to before V-Go initiation, the average A1C level improved from 8.8% to 7.6%, with a p-value of 0.005, and patients reported using an average of 13% less daily insulin not tested for statistical significance) from a baseline of 49 units per day. Once they stopped using V-Go and were switched to other diabetes therapies, their average A1C level rebounded to 8.2%, with a p-value of 0.011, and their average daily insulin dose increased (not tested for statistical significance). An experimental result, such as those derived from a clinical or non-clinical study is statistically significant if it is unlikely to have occurred by chance. The statistical significance of experimental results is determined by a widely used statistical method that establishes the p-value of the results, which is a statistical measure of the probability that the difference in results between treatment and control groups in a study could have occurred by chance. Under this method, the smaller the p-value the greater the confidence that the results are significant, and a p-value of less than .05, reflecting a less than one-in-twenty probability that the result occurred by chance, is generally considered by the FDA to represent statistical significance. The UPP was not a clinical trial, but it did represent real world experiences with the V-Go.
12
Table of Contents
V-Go was generally well tolerated during the UPP. The average body weight of patients was steady through use of V-Go and increased slightly after treatment cessation. Two instances of low blood glucose, or hypoglycemia, were reported during the UPP, of which one met the defined criteria for a serious adverse event. No other serious adverse events were observed during V-Go use based on the retrospective analysis. A total of seven patients in the retrospective analysis reported at least one application site reaction, such as irritation, redness, rash, itching, tenderness or discomfort, while only one patient reported pain at the injection site.
This analysis suggested that average A1C improved when insulin was delivered using V-Go. The investigators suggested that a possible reason for the improvements in blood glucose levels was due to better patient adherence with this insulin regimen due to the simplicity of V-Go.
The SIMPLE Study
We conducted a multicenter prospective clinical trial of 89 patients to evaluate the effectiveness of V-Go for patients with diabetes in a real-world setting. Findings from this study have been presented in past years at the American Diabetes Association and American Association of Clinical Endocrinologists Annual Scientific Congresses. The primary objective was to compare changes of average glycemic control as measured by A1C from baseline to the end of V-Go use. Patients with Type 2 diabetes who were administering one or more insulin injections per day and not meeting target A1C control of less than 7% were included in the study. The patient types included in this trial were:
| • | Basal: Patients receiving once or twice daily injections of an intermediate- or long-acting insulin regardless of oral anti-diabetes medication use (26 patients). |
| • | Premix: Patients receiving one to three daily injections of premix insulin regardless of oral anti-diabetes medication use (13 patients). |
| • | MDI: Patients receiving any insulin therapy with three or more insulin injections a day regardless of oral anti-diabetes medication use (47 patients). |
| • | Other: Patients receiving OADs only and patients receiving OADs plus non-insulin injectable (3 patients). |
A1C levels in the overall population (n=89) decreased from 8.8% at baseline to 8.1% at month three, representing a statistically significant reduction of 0.7% with a p-value less than 0.0001.
When classifying the data by subgroups, both the basal and MDI subgroups demonstrated statistically significant A1C reductions from baseline (basal -0.76%, p=0.0003; Premix -0.66%, p=0.3006; MDI -0.66%, p=0.0002). A nine-month interim analysis in 59 patients from the basal subgroup with a baseline A1C of 8.7% demonstrated a progressive and statistically significant A1C improvement at three, six and nine months (p<0.001 compared to baseline at all the time points). A1C reduction at nine months was 1.0% from baseline in this subgroup. In addition to the significant improvements in blood glucose, the average daily dose of insulin across all patients was also reduced by 18% (62.4 to 51.0 units, p=0.001) from baseline. A small but statistically significant decrease in body weight (-0.71 lbs., p<0.0001) was observed, although not clinically meaningful given the baseline weight of the patient population. Overall, the incidence of hypoglycemia after three months of V-Go use was low, with 90% of patients reporting no hypoglycemia.
The Diabetes America Study: Use of V-Go in Patients with Sub-Optimally Controlled Diabetes
Diabetes America, a group of 13 specialized diabetes care clinics located across the major metropolitan areas of Texas, conducted a study to evaluate the effect of switching patients with sub-optimally controlled diabetes to V-Go. The only funding provided by us for this study was to cover the expense for an independent review board to review the study protocol in request of a waiver of patient consent due to the retrospective nature of the study. Data from this study were disclosed in presentations at the American Association of Clinical
13
Table of Contents
Endocrinologists’ 24th Annual Scientific and Clinical Congress, the 75th Scientific Sessions of the American Diabetes Association and the 15th Annual Diabetes and Technology Meeting, as well as being published in four peer reviewed journals. The study was conducted as a retrospective review using data from electronic medical records of patients treated at the various Diabetes America treatment facilities. Patients treated at these facilities were prescribed V-Go by health care providers with the goal of improving A1C levels. The study evaluated the change in A1C from baseline in addition to changes in daily insulin dose, body weight and hypoglycemic events.
Patients diagnosed with diabetes (Type 1, Type 2, or Latent Autoimmune Diabetes in Adults, or LADA) at least 21 years old with an A1C between 7% and 14% were switched to V-Go. The overall analysis, as published in the journal Diabetes Therapy in 2015, included 204 patients. Twenty-four of these patients had not used insulin at baseline and the remainder were already prescribed insulin at baseline. Of the patients, 175 were diagnosed with Type 2 diabetes and 29 were diagnosed with Type 1 diabetes or LADA. The average time from starting V-Go to the first follow-up visit was 14 weeks and the average time to the second follow-up visit was 27 weeks.
The A1C change for the overall patient population and by patient type of diabetes were evaluated and, as summarized in the graphs below, there was a statistically significant improvement in A1C at 14 and 27 weeks after switching to V-Go across all patient types.
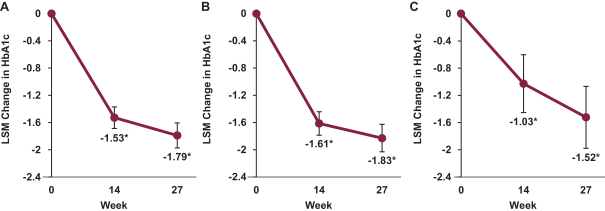
Effects of insulin delivery by V-Go on A1C. (A) All patients (n=204, baseline A1C= 9.6%). (B) Patients with Type 2 diabetes (n=175, baseline A1C=9.7%) and (C) Patients with Type 1 or LADA Diabetes (n=29, baseline A1C= 9.5%. Time points represent the mean time elapsed between V-Go initiation and follow-up A1C results for the total population.
| “*” | denotes a p-value less than 0.001. |
Within the overall group, A1C was statistically significantly reduced by 1.5% (p < 0.001) at 14 weeks and by 1.8% (p<0.001) at 27 weeks. In patients with Type 2 diabetes, statistically significant reductions in A1C of 1.6% (p<0.001) at 14 weeks and 1.8% (p<0.001) at 27 weeks were observed. For patients with Type 1 diabetes or LADA, statistically significant reductions in A1C of 1.0%( p<0.0001) at 14 weeks and 1.5%( p<0.001) at 27 weeks were also observed. When combining the data for all 180 patients prescribed insulin at baseline there were statistically significant reductions in A1C of 1.3% (p<0.001) at 14 weeks and 1.6% (p<0.001) at 27 weeks. Patients naïve to insulin with a baseline of 11.3%, experienced the most substantial decrease in A1C after initiating V-Go with statistically significant reductions in A1C of 3.0% (p<0.001) at 14 weeks and 3.4% (p<0.001) at 27 weeks.
An analysis of the overall dataset evaluating changes in A1C based on baseline insulin regimen was published in the journal Practical Diabetology in 2016. The findings in this analysis showed that the 70 patients previously administering MDI therapy at baseline had a statistically significant reduction in A1C of 1.2% (p<0.0001) from a
14
Table of Contents
mean baseline A1C of 9.3% after 27 weeks while the 47 patients previously administering basal insulin at baseline had a statistically significant reduction in A1C of 2.0% (p<0.0001) from a mean baseline A1C of 9.5%.
In addition to the A1C improvements, there were also statistically significant reductions in the daily insulin requirements for patients receiving V-Go. At 27 weeks, for patients previously prescribed insulin, the total daily insulin dose was significantly lower (33% to 41%, p<0.001) than the prescribed baseline insulin mean dose ranges (86 units per day as the lower range to 99 units per day as the upper range) prior to switching to V-Go. Basal insulin rates were significantly lower (39% to 46%, p<0.001) than the prescribed baseline insulin dose range. The average daily insulin dose administered with V-Go at week 27 was 0.6 units per kilogram per day. Patients naïve to insulin at baseline, administered an average of 54 units per day (p<0.0001) at 27 weeks on V-Go.
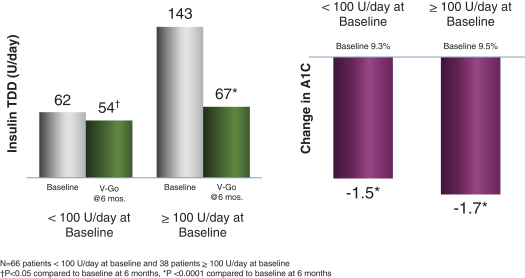
A subset analysis of the data from the Diabetes America study was performed by Diabetes America to evaluate insulin dose changes in patients receiving moderate and higher baseline insulin doses. The aim of this analysis presented at the 2015 Diabetes Technology Meeting was to evaluate the clinical impact of the baseline insulin total daily dose when switching to insulin delivery with V-Go from subcutaneous insulin injections. One hundred four total patients were evaluated who were prescribed moderate baseline insulin doses (less than 100 units per day) before V-Go or high baseline insulin doses (greater than or equal to 100 units per day) before V-Go. Statistically significant improvements in A1C and decreased insulin requirements were observed after an average of six months using V-Go for insulin delivery in patients whose hyperglycemic levels were previously not controlled despite the administration of insulin injections. As shown in the graph below, both arms regardless of baseline insulin dose (moderate or high) observed statistically significant A1C reductions (1.5%, p<0.001 and 1.7%, p<0.0001, respectively). Furthermore, despite significant differences in baseline insulin doses before V-Go, both groups observed statistically significant insulin reductions (p<0.05) and administered similar total daily insulin doses of 0.6 units per kilogram after switching to V-Go, equating to 54 units per day and 67 units per day for the moderate and high insulin dose groups from baseline insulin doses of 62 units per day and 143 units per day, respectively. These results are illustrated in the following graphs.
Across the entire study population for Diabetes America, there was a statistically significant but minor change in body weight of approximately 1.5 kg (p<0.001) after switching to V-Go. Hypoglycemia during V-Go use was similar to that experienced with the previous baseline therapies. Of the 204 subjects included in the study, 32 discontinued use of V-Go after an average of 6 months for reasons including skin irritation, cost and/or lack of adequate insurance coverage, transitioned to traditional pump, weight gain, did not prefer V-Go, pain, GI effect, hyperglycemia, hypoglycemia and lack of adherence to skin.
15
Table of Contents
Diabetes America Comparative Study; Clinical and Cost Effectiveness of Insulin Delivery with V-Go Wearable Insulin Delivery Device versus Multiple Daily Injections in Patients with Type 2 Diabetes Inadequately Controlled on Basal Insulin
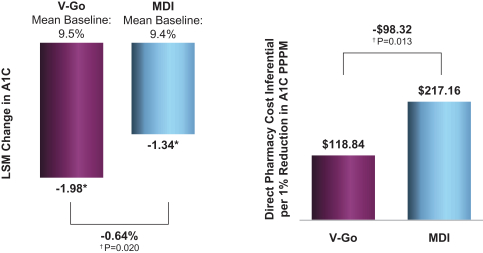
The objective of this study conducted by Diabetes America was to compare two methods of delivering intensified insulin therapy, or IIT, in patients with Type 2 diabetes inadequately controlled on basal insulin with or without concomitant antihyperglycemic agents in a real-world clinical setting. A retrospective analysis was conducted utilizing the electronic medical records from Diabetes America. The only funding provided by us for this study was to cover the expense for an independent review board to review the study protocol in request of a waiver of patient consent due to the retrospective nature of the study. 116 patients were evaluated, 56 patients utilizing V-Go and 60 patients utilizing MDI. At 27 weeks, both groups experienced statistically significant improvements in A1C from baseline. By week 27, A1C decreased from 9.5% to 7.6% (p<0.001) with V-Go and decreased from 9.4% to 8.1% (p<0.001) with MDI. A statistically significant treatment difference between the groups was observed of 0.64% (p<0.0201) in favor of V-Go based on the statistical analysis. On average, there was a statistically significant difference in insulin dose between the two groups at 27 weeks. Patients using V-Go administered 28% less insulin compared to patients using MDI, (56 versus 78 units per day, p<0.0001).
Total direct pharmacy costs pertaining to diabetes therapeutic agents before and with IIT were calculated. Insulin costs included both the insulin and associated delivery method. All costs were normalized based on a 30-day supply. Non-branded concomitant antihyperglycemic agents were not included in total therapeutic costs. Pricing was based on published wholesale acquisition costs as of September 1, 2015. In this analysis, monthly diabetes-related direct pharmacy costs were $55.70 per patient less with V-Go compared to MDI.
When evaluating the cost-effectiveness of both insulin delivery methods by dividing the cost difference from baseline in total monthly direct pharmacy costs for all diabetes agents at 27 weeks by the A1C reduction, the monthly per patient cost per 1% reduction in A1C was statistically significantly less with V-Go compared to MDI ($118.84 compared to $217.16 per patient per month, p<0.013), as illustrated in the graph below. These results were published in 2016 in Endocrine Practice, the journal of the American Association of Clinical Endocrinologists.
V-Go Reduced Monthly Direct Pharmacy Costs by 45% per 1% Reduction in A1C
16
Table of Contents
Early Access Program
We provided V-Go therapy to patients as part of an early access research survey and the results of this survey were published in Practical Diabetology in 2013. In this survey, clinicians provided detailed treatment histories for the patients who had access to receive treatment with V-Go. After initiating V-Go, the average A1C decreased from 9.3% before V-Go to 7.4% after V-Go initiation, representing a 1.9% improvement (not tested for statistical significance). Clinicians who participated in this survey also reported a 22% reduction in daily basal insulin dose (not tested for statistical significance) in patients receiving V-Go.
Northeast Florida Endocrine and Diabetes Associates (NEFEDA)
In 2015, we provided an educational grant to a large specialty clinical practice in Northeast Florida to conduct a retrospective analysis to evaluate the impact on glycemic control of switching to V-Go for patients with diabetes that were sub-optimally controlled. Ninety-five patients were evaluated with one follow-up visit, 83 patients with two follow-up visits, and 68 patients had a third visit in this cross sectional analysis after initiating V-Go. Duration of V-Go use was approximately two, five and nine months for the first, second and third follow-up visits. The baseline A1C was 9.7%. Statistically significant A1C reductions from baselines were seen at each of the three follow-up office visits. After five months of V-Go use, a reduction in A1C of 1.6% (p<0.001) was observed. For the 65 patients previously administering insulin at baseline, a substantial reduction in total daily insulin from baseline was also observed at all three follow-up visits. Insulin was reduced from 86 to 67 units/day (p<0.001) in the 65 patients administering insulin at baseline after five months of V-Go use based on insulin doses. There was no change in the incidence of hypoglycemia reported compared to baseline. These results were published and presented at the 76th Scientific Sessions of the American Diabetes Association in June 2016.
The University of Massachusetts Clinical Evaluation
In 2013, researchers at the University of Massachusetts examined 21 patients with Type 2 diabetes who lacked glycemic control and switched from MDI therapy to V-Go. The clinical evaluation observed that, after 88 days of V-Go use, based on data from 14 of the 21 patients observed, A1C levels decreased from 10.7% to 8.3% (p<0.001) and total daily doses of insulin decreased by 46% from 119 units to 64 units (p=0.01). These results were also published and presented at the 73rd Scientific Sessions of the American Diabetes Association in June 2013. We did not commission nor sponsor this study.
The Jones Center for Diabetes & Endocrine Wellness Clinical Evaluation
We conducted a retrospective clinical analysis to evaluate the clinical experience with V-Go in 91 patients treated at the Jones Center for Diabetes and Endocrine Wellness, a specialized diabetes care clinic. Using electronic medical records, clinical data was collected at V-Go initiation and up to one year of follow-up. Prior to V-Go initiation, 39.6% of patients were prescribed only insulin and 58.2% were prescribed combination therapy that included insulin. Of the 86 patients with type 2 diabetes, 69 patients, or 80%, had at least one follow-up visit. Mean baseline A1C in this group was 9.1% at baseline and 8.3% at follow-up for an average improvement in A1C of 0.8% (not tested for statistical significance). The mean total daily dose of insulin at baseline was 76 units and decreased to 61 units, a 20% (not tested for statistical significance) reduction, on V-Go. These results were also published and presented in the Journal of Diabetes Science and Technology. We did not commission the Jones Center to conduct this study.
Clinical Evidence Summaries
Across these multiple peer-reviewed and published clinical trials, analyses and surveys using both prospective and retrospective study designs, switching patients who had suboptimal glycemic control to V-Go for insulin delivery resulted in statistically significant improvements in A1C, with A1C reductions ranging from 0.7% to 3.4%, depending on the patient population. Moreover, across this body of evidence, switching patients who had
17
Table of Contents
suboptimal glycemic control to V-Go for insulin delivery resulted in with less insulin being used. Daily insulin dose reductions ranged from 13% to 46%, depending on the study and influenced by the amount of insulin patients were prescribed prior to using V-Go. Currently, clinical evidence in support of V-Go has been disclosed across 11 publications and 37 poster presentations and represents clinical experience in approximately 750 patients with diabetes.
Our Current and Future Products
We believe our technologies represent a fundamentally different approach to basal-bolus insulin delivery. To facilitate therapy compliance, we have sought to eliminate the need for complex electronics and software by utilizing mechanical technology that delivers prescribed dosages of insulin and other injectable drugs with great accuracy without any electronics, batteries, recharging or programming.
V-Go Wearable Insulin Delivery Device
V-Go is a disposable insulin delivery device for basal-bolus therapy that deploys our innovative proprietary h-Patch technology. Unlike programmable insulin pumps, V-Go is a small, discreet, daily-disposable insulin delivery device that operates without electronics, batteries, infusion sets or programming. V-Go measures just 2.4 inches wide by 1.3 inches long by 0.5 inches thick and weighs approximately one ounce when filled with insulin.
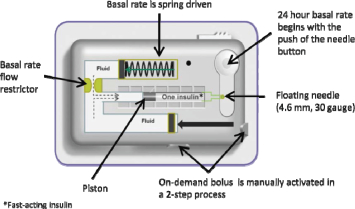
V-Go enables patients to closely mimic the body’s normal physiologic pattern of insulin delivery by delivering a single type of insulin at a continuous preset basal rate over a 24-hour period and also providing for on-demand bolus dosing at mealtimes, without the need for electronics or programming. A patient adheres V-Go to his or her skin and presses a button that inserts a small needle that commences a continuous preset basal rate of insulin. At mealtimes, a patient can discreetly press the bolus ready and bolus delivery buttons to deliver insulin on-demand at meals.
Each day prior to applying V-Go, a patient fills it with insulin using a filling accessory known as EZ Fill, which is included with each monthly supply of V-Go. V-Go uses a single type of fast-acting insulin, such as Humalog® or NovoLog®, and is available in a preset basal rate to continuously deliver 20, 30 or 40 units of insulin in one 24-hour period (0.83, 1.25 or 1.67 units per hour, respectively) and on-demand bolus dosing in two unit increments (up to 36 units per 24-hour time period). Our proprietary Floating Needle is deployed with the press of a button after V-Go is applied to the skin making the connection between the insulin reservoir and the patient’s tissue. The Floating Needle then pivots with the body’s natural movements, allowing for maximum comfort. After 24 hours of use, a patient presses a button that retracts the needle and then removes V-Go from the skin, discards V-Go in regular trash and replaces it with a new insulin-filled V-Go for the next 24 hours. The EZ fill device makes the filling process simple and does not require calculations, measuring or needles. The use of the EZ fill device can also prevent accidental needle sticks that occur with pen needles or syringes.
h-Patch Controlled Delivery Technology Platform
Our proprietary hydraulic h-Patch drug delivery core technology, which is a critical component of V-Go, facilitates the simple and effective delivery of injectable medicines to patients across a broad range of therapeutic areas. The deployment of our h-Patch technology results in a device specifically designed for patients with Type 2 diabetes who, we believe, do not require complex and costly programmable insulin pumps generally designed to meet the needs of Type 1 patients.
The hydraulic approach of our h-Patch technology can be used to deliver constant basal or on-demand bolus dosing of any drug than can be delivered subcutaneously. We believe it combines the user advantages of transdermal patches with the accuracy and flexibility of conventional electronic pumps. Once activated, our h-Patch system places a custom-formulated viscous fluid under pressure, which is separately compartmentalized
18
Table of Contents
and therefore designed not to come into contact with the active drug. Once pressurized, the fluid is forced through a flow restrictor that is designed to control the flow rate. After passing through the flow restrictor, the viscous fluid couples with and moves a piston in a cartridge that contains active drug. The viscous fluid continually pushes the piston, dispensing the drug at the prescribed preset basal rate through a needle into the patient’s subcutaneous tissue. Bolus delivery on demand is similarly driven by viscous fluid dispensed from a separate side chamber, which allows a patient to dispense active drug in two unit increments through a user-activated bolus button. Our h-Patch basal drug delivery technology results in a simple, yet innovative, device that operates without complex controls or an infusion set.
The operation of our h-Patch technology is depicted in the graphic below:
h-Patch Controlled Delivery Technology
We will continue to explore the use of our h-Patch technology in other drug delivery applications beyond the use of insulin to treat Type 2 diabetes. We believe it has the potential to improve the utility of a variety of drugs that require frequent and cumbersome dosing regimens.
Next-Generation V-Go: V-Go Prefill & V-Go Link.
We are developing a next-generation, single-use disposable V-Go device that will feature a separate prefilled insulin cartridge that can be snapped by the patient into V-Go. While the current V-Go simplifies the use of insulin for patients with Type 2 diabetes, we believe that a pre-filled V-Go will make insulin therapy even simpler by eliminating the device-filling process by the patient and the need for EZ fill refrigeration, which we expect could further promote adoption by patients with Type 2 diabetes. Additionally, we believe V-Go Prefill could lower the number of co-pays because the insulin and V-Go would be packaged together, generate revenue from the sale of insulin and extend the patent life to 2032. A pre-filled V-Go would also enable V-Go usage for other injectable therapeutic drugs beyond insulin that are used by patients who could benefit from simple, convenient and continuous drug delivery. Currently, the V-Go Prefill is in the design-development stage, with a focus on ease of customer use and optimization of manufacturing efficiency.
We are in the early stages of developing V-Go Link, which we intend to feature one-way communication to glucose meters and smart devices such as phones and tablets through RF/Bluetooth technology. We intend V-Go Link to provide real-time tracking information of basal and bolus dosing utilization, allowing patients and their healthcare professionals to have a deeper understanding of their current dosing habits. We believe access to this technology could increase patient adherence and could be used as a diagnostic tool to make treatment adjustments.
19
Table of Contents
Non-Core Technologies
We are actively seeking to sell our two non-core technologies, the Mini-Ject Needle Free Technology and the Micro-Trans Microneedle Array Patch Technology. We do not anticipate receiving a material amount of proceeds from the sale of these assets.
Mini-Ject Needle-Free Technology
Mini-Ject is a fully disposable needle-free injection system that offers a variety of pre-filled options and comfortable administration within a patient-friendly, easy-to-use design. Mini-Ject can deliver a wide range of drugs, from small molecules to large proteins as well as antibodies and vaccines. Our Mini-Ject system has been cleared by the FDA under Section 510(k).
Micro-Trans Microneedle Array Patch Technology
We have also developed our Micro-Trans microneedle array patch technology to deliver drugs into the dermis layer of the skin. Each Micro-Trans patch consists of multiple small, solid needles constructed with metal or biodegradable polymers and fabricated on a single surface. The patches can be manufactured in various lengths, diameters, wall thicknesses and shapes and can be used to deliver drugs without regard to drug size, structure or a patient’s skin characteristics. Micro-Trans patches are designed to penetrate only the shallow layers of the skin, avoiding close proximity to pain receptors. We believe this characteristic makes the Micro-Trans patch comfortable for a patient to wear. We have not commercialized a device with this technology and it has not received regulatory approval.
Our Strategy
Our long term goal is to significantly expand and further penetrate the Type 2 diabetes market and become a leading provider of simple-to-use insulin delivery devices designed for basal-bolus insulin therapy.
In 2016, we made a significant adjustment in our commercialization strategy by shifting from aggressively expanding sales representative headcount to focusing on fewer high—volume insulin prescribers and on maximizing our sales and marketing infrastructure’s frequency of interactions and contact points and methods with high-prescribing physicians. We estimate our current sales force structure can directly focus on approximately 1,000 prescribers. This restructuring reduced our monthly cash burn rate significantly and resulted in a business plan that is more capital efficient. Specifically, we reduced headcount and expenses and reduced the number of sales territories staffed by field sales professionals to 28 while at the same time increasing the level of resources in each of these prioritized markets to drive demand.
We have learned that, in the competitive Type 2 diabetes market, those prescribers of diabetes products who had more contacts with our sales representatives and marketing programs, both directly and indirectly, remember and prescribe V-Go to more patients, and more appropriate patients, and we believe that, under our prior sales and marketing model, we had diluted our resources across too many sales territories. By focusing on fewer and prioritized markets, while increasing the contacts each healthcare professional has through supplemental inside sales team, an inside peer to peer clinical sales team and through other marketing resources, we can be more competitive in those markets.
20
Table of Contents
Our short-term business strategies include the following:
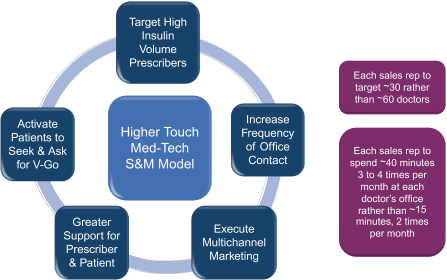
We intend to focus the majority of our resources towards the prioritized markets through the use of sales professionals, inside sales, peer-to-peer programs, targeted direct-to-patient promotions, customer care and additional multi-channel promotional services. Some examples of multi-channel promotion include direct mail, search engine optimization, peer-to-peer email, and other forms of advertising. We intend to optimize our customer acquisition, conversion and retention programs by focusing all our resources. We believe this should allow us to significantly increase our promotional efforts on a per-territory basis, which will allow us to grow these markets. In addition, we plan to improve on and leverage our patient programs such as V-Go life, patient forums, enhanced starter kits and in-office material and promotion, such as context media to empower patients to ask for V-Go as an option for their diabetes treatment.
We intend to drive V-Go sales growth by:
| • | Leveraging the clinical and economic data that has been published in the last year, including several recent manuscripts, with healthcare professionals and payors. We believe this new data will help more prescribers see the value and understand the benefits or V-Go across a wider spectrum of patients. |
| • | Expanding third-party reimbursement for V-Go in the United States. We intend to expand patient coverage of V-Go by commercial insurance plans as a pharmacy benefit rather than a medical benefit. We believe that more than 70% of the approximate 158 million commercially insured lives in the United States and 60% of the approximate 43.5 million lives insured by Medicare Part D cover V-Go. In addition, TRICARE, a health care program of the United States Department of Defense Military Health System, covers V-Go as a pharmacy benefit and some State Medicaid plans cover V-Go as a pharmacy or medical benefit. We also offer reimbursement support services to assist patients in gaining access to V-Go throughout the reimbursement process. |
| • | Pursing our new business model. We intend to increase use and grow V-Go share by initially targeting approximately 30 doctors per sales representative and increasing to approximately 50 potential targets. We will either add new territories or split existing territories when adding new sales reps. We will expand our direct sales reach to approximately 300 additional prescribers so that we can provide the same higher level of inside sales, clinical sales and promotion as we provide our current prioritized markets. We believe we can grow these markets more quickly than our territories have grown in the past, since they will have significantly more support with our new strategy. |
21
Table of Contents
Our long-term business strategies include the following.
| • | Continue to expand our U.S. sales force in a capital efficient and disciplined manner utilizing our new business model. We intend to eventually establish a national sales force, internally or through other means, such as contract sales organization, co-promotion or other strategic relationships to ensure we can reach all the very high volume prescribers or explore other means to increase the number of prescribers we can reach. |
| • | Continue to explore international expansion. We intend to continue exploring international expansion through strategic collaborations, in-licensing arrangements or alliances outside the United States which not only would provide a revenue stream, but would also increase our production volume thereby improving our gross margins in the United States. |
| • | Capture Improved Economics Through the Commercialization of V-Go Prefill. We are developing and intend to commercialize our V-Go Prefill product, if it is approved by the FDA, which we believe would offer patients an even more simplified user experience, thereby increasing our target market to include patients with Type 2 diabetes not currently on insulin. In addition, we expect to have additional opportunities to generate revenue through the sale of insulin in connection with V-Go Prefill. We believe a prefilled option would also lay the foundation for using our proprietary h-Patch technology with other injectable therapies where patients could benefit from simple, convenient and continuous drug delivery. |
| • | Advance our V-Go Link next generation technology, which will feature one-way communication to smart devices such as phones and tablets through RF/Bluetooth technology. V-Go Link will provide real-time tracking information of basal and bolus dosing utilization, allowing patients and their healthcare professionals to have a deeper understanding of their current dosing habits. |
| • | Advance our Proprietary h-patch Drug Delivery Technologies into Other Therapeutic Areas. We have built a significant portfolio of proprietary technologies, designed to simply and effectively deliver injectable medicines to patients across a broad range of therapeutic areas. We intend to continue to advance these technologies, either by working with third parties to incorporate them into existing commercial products or by licensing the rights to them to third parties for further development and commercialization. |
| • | Leverage Our Scalable Manufacturing Operations to Increase Gross Margin. We intend to leverage our scalable and flexible manufacturing infrastructure and related operational efficiencies to increase our gross margin by reducing our product costs. We believe the existing production lines of our contract manufacturer, or CMO, will have the ability to meet our current and expected near-term V-Go demand. Our CMO also has the ability to replicate additional production lines within its current facility footprint. In addition, we believe that due to shared product design features with V-Go, our production processes are readily adaptable to the manufacture of new products, including a prefilled V-Go. |
Sales, Marketing and Distribution
Currently, our sales team covers 33 territories primarily within the East, South, and Midwest regions of the United States. We also have a team of inside sales representatives to take incoming calls from interested healthcare professionals as well as a targeted list of V-Go prescribers around the country. To date, we have focused our sales and marketing efforts in the regions where we have the greatest reimbursement coverage for patients. According to Symphony Health Solutions, there are approximately 16,000 high-volume insulin prescribers in the United States, generating 40% of all U.S. annual insulin prescriptions. Our sales representatives call on approximately 1,000 of these targeted, high-volume insulin prescribers, which include endocrinologists and primary care physicians. Our sales team has been supplemented by our V-Go Customer Care Center that provides support to customers and healthcare providers.
V-Go is distributed primarily through retail pharmacies and, to a lesser extent, medical supply companies. Similar to a pharmaceutical company, our overall distribution strategy focuses on making V-Go available at retail
22
Table of Contents
and mail-order pharmacies. We have adopted this strategy because patients with Type 2 diabetes frequently visit their local retail pharmacies to fill other prescriptions prescribed for their other chronic conditions. We have distribution agreements with all of the national and many regional wholesalers, as well as with important medical supply companies. For the year ended December 31, 2016, the wholesale distributors McKesson Corporation, Cardinal Health and AmerisourceBergen Drug Corporation represented 35%, 25% and 31%, respectively, of our total product shipments. Our agreements with our distributors allow a patient whose insurance covers V-Go as either a pharmacy benefit or a medical benefit to be able to fill his or her V-Go prescription conveniently. Our agreements with each of Cardinal Health and AmerisourceBergen Drug Corporation are each on a one-year continuous renewal basis unless otherwise terminated by either party. Our agreement with McKesson Corporation has an indefinite term unless otherwise terminated by either party.
A patient using V-Go requires two separate prescriptions, one for V-Go itself and one for fast-acting insulin, such as Humalog® or NovoLog®, in vials. As V-Go is only available by prescription, we believe that educating physicians and other healthcare providers regarding the benefits of V-Go is an important step in promoting its patient acceptance. In addition to calling on healthcare providers, our marketing initiatives include presentations and product demonstrations at local, regional and national tradeshows, including ADA Scientific Sessions and the American Association of Diabetes Educators Annual Meeting.
Reimbursement
In contrast to all other basal-bolus insulin delivery devices currently on the market in the United States, V-Go is not classified as a durable medical device, thereby allowing for potential Medicare reimbursement under Medicare Part D. As a result, a patient with Medicare, whose Medicare Part D Plan chooses to cover V-Go, can fill his or her V-Go prescription at a retail pharmacy that participates in the plan. Even for those Medicare patients whose Medicare Part D Plan elects not to cover V-Go on formulary, those patients may still get V-Go at the pharmacy if the patient’s Medicare Part D Plan determines that other products currently on formulary are not medically appropriate upon an the patient making an appeal to the patient’s Medicare Part D Plan regarding V-Go coverage. In addition to the 60% of patients insured by Medicare who have V-Go covered under their plans, a majority of commercially insured patients currently are covered for V-Go under their plans as either a pharmacy benefit or a medical benefit. For the year ended December 31, 2016, over 90% of our V-Go prescriptions were filled by retail or mail order pharmacies with the remainder filled by medical supply companies.
Manufacturing and Quality Assurance
We currently manufacture V-Go and EZ Fill in clean rooms at our CMO in Southern China in accordance with current good manufacturing practices, or cGMP. Our CMO uses Valeritas-owned custom-designed, semi-automated manufacturing equipment and production lines to meet our quality requirements. Separate CMOs in Southern China perform release testing, sterilization, inspection and packaging functions.
V-Go is produced on flexible semi-automated production lines. In 2016, our CMO operated two manufacturing lines producing 3.0 million V-Go units. We have two additional lines outfitted at our CMO on standby that can be quickly brought on-line as demand increases. We believe these production lines will have the ability to meet our current and expected near-term V-Go demand. We also believe our CMO has the ability to scale production even further by replicating these production lines within its current facility. We also believe that, due to shared product design features, our production processes are readily adaptable to new products, including a pre-fill V-Go.
V-Go is packaged with one EZ Fill accessory per 30 V-Go devices. Due to its lower-volume requirements, one manufacturing line is dedicated to EZ Fill production, with a second line on standby.
Both V-Go and its insulin filling accessory, EZ Fill, are assembled from components that are manufactured to our specifications. Each completed device is tested to ensure compliance with our engineering and quality
23
Table of Contents
assurance specifications. A series of automated inspection checks, including x-ray assessments and lot-released testing, are also conducted throughout the manufacturing process to verify proper assembly and functionality. When mechanical components are sourced from outside vendors, those vendors must meet our detailed qualification and process control requirements. We maintain a team of product and process engineers, supply chain and quality personnel who provide product and production line support for V-Go and EZ-Fill. We also employ a full-time employee based in China.
We have received ISO 13485 certification of our quality system from BSI Group, a Notified Body to the International Standards Organization, or ISO. This certification process requires satisfaction of design control requirements. The processes utilized in the manufacturing and testing of our devices have been verified and validated to the extent required by the FDA and other regulatory bodies. As a medical device manufacturer, our manufacturing facilities and the facilities of our sterilization and other critical suppliers are subject to periodic inspection by the FDA and corresponding state and foreign agencies. We believe that our manufacturing and quality systems are robust and ensure high product quality. To date, we have had no product recalls.
Some of the parts and components of V-Go and EZ Fill are purchased from sole-source vendors, and we manage any single-source components and suppliers through our global supply chain operation. We believe that, if necessary, alternative sources of supply would, in most cases, be available in a relatively short period of time and on commercially reasonable terms.
Research, Development and Engineering
Our research, development and engineering staff has significant experience in developing insulin-delivery systems and are focused on the continuous improvement and support of current product, as well as our products in development. We have a staff of experienced engineers specializing in mechanical engineering, material science and fluid mechanics. Because we do not incorporate electronics or software into our devices, our development and engineering teams are able to focus on these other technical areas. We utilize design and analysis tools to accelerate design times and reduce development risk. Through frequent usability testing, we seek to ensure that our product not only functions properly, but also meets patient needs and desires with respect to an insulin-delivery system, while at the same time reducing our development and commercialization risks.
We spent $6.5 million on research, development and engineering activities for the year ended December 31, 2015 and $4.9 million for the year ended December 31, 2016.
Intellectual Property
From our inception, we have understood that the strength of our competitive position will depend substantially upon our ability to obtain and enforce intellectual property rights protecting our technology, and we have developed what we consider to be a strong intellectual property portfolio, including patents, trademarks, copyrights, trade secrets and know-how. We continue to actively pursue a broad array of intellectual property protection in the United States, and in significant markets elsewhere in North America, as well as in Europe, Australia and Asia, including China. We believe our intellectual property portfolio effectively protects the products we currently market and we are actively building our intellectual property portfolio to protect our next-generation products, as well as additional drug delivery technologies for those products.
As more fully described below, our patents and patent applications are primarily directed to our h-Patch technology or aspects thereof including the commercialized V-Go, a hydraulically driven ambulatory insulin delivery device.
We also have patents and patent applications directed to other drug delivery platforms, the Mini-Ject and the Micro-Trans microneedle array patch.
24
Table of Contents
In addition to patent protection, we rely on materials and manufacturing trade secrets, and careful monitoring of our proprietary information to protect aspects of our business that are not amenable to, or that we do not consider appropriate for, patent protection.
We plan to continue to expand our intellectual property portfolio by filing patent applications directed to novel drug delivery systems and methods of their use.
Patents
As of February 15, 2017, we owned 21 U.S. and 56 international issued or allowed patents and 8 U.S. and 46 international patents pending directed to various features of our commercial V-Go device and our proprietary h-Patch drug delivery technology. These patents are directed to the hydraulic drive for a basal-bolus delivery system as well as many of the other features of the h-Patch technology.
The following is a summary of our current and pending patents:
| • | U.S. Patent Nos. 7,530,968, 8,070,726, 9,072,828, 9,125,983, and 9,511,187 are directed to the hydraulically driven pump system having basal and bolus fluid delivery. These patents are expected to expire in 2024, 2024, 2027, 2025, and 2024, respectively. Foreign counterparts to these patents have been granted in Australia, Canada and Japan. We have one application allowed in Australia and we have patent applications pending in Japan and in Europe. One U.S. continuation application is pending. |
| • | U.S. Patent Nos. 6,939,324, 7,481,792, 8,858,511, and 8,992,478 are directed to the Floating Needle and bolus button configuration, and are expected to expire in each case in 2021. Three Canadian counterparts to these patents have been granted and the European counterpart has been granted and validated in Germany, Spain, France, the United Kingdom, and Italy. A patent application is pending in Europe. One U.S. and one Canadian continuation applications are allowed. |
| • | U.S. Patent 9,101,706 is directed to an ambulatory fluid delivery device in which transitioning the needle from the storage position to the armed position transitions the piston from the locked position to the released position and thermally coupling the hydraulic chamber to the patient. This patent is expected to expire in 2031. The Australian, Canadian, Chinese, Japanese, Hong Kong, Israel and Singapore counterparts to this patent application have been granted. Patent applications are pending in Australia, Canada, China, Europe, India, Japan and Korea. One U.S. continuation application is pending. |
| • | U.S. Patent Nos. 8,667,996 and 9,376,224 are directed to the closed looped filling configuration of the EZ Fill device. These patents are expected to expire in October 2032 and January 2031. The Chinese and Japanese counterparts to this patent have been granted and patent applications are pending in China, Europe, Hong Kong, India, and Japan. We have one application allowed in Korea and one in Canada. One U.S. continuation application is pending. |
| • | U.S. Design Patent Nos. D667946, D687948 and D706415 are directed to the ornamental appearance of the EZ Fill device and are expected to expire in September 2026, August 2027 and June 2028, respectively. A Chinese counterpart to these patents has been granted. |
| • | U.S. Patent No. 8,740,847 is directed to a fluid delivery device having a pre-filled cartridge. This patent is expected to expire in March 2032. Australian, Chinese, Japanese and Singapore counterparts to this patent have been granted, patent applications are pending in Australia, Canada, China, Europe, India, Japan and Korea, and an Israel application is allowed. One U.S. continuation application is pending. |
| • | U.S. Patent Nos. 7,914,499, 8,361,053 and 8,821,443 are directed to fluid delivery devices having two or more fluid delivery reservoirs covering both composition and methods. These patents expire in March 2027. Foreign counterparts to these patents have been granted in Australia, Canada, China, |
25
Table of Contents
| Europe (with validations in Germany, Spain, France, the United Kingdom, and Italy), Korea, Japan, Russia and Singapore. We also have counterpart patent applications pending in Australia, Europe, and India, and an Israel application is allowed. One U.S. continuation applications is pending. |
| • | We own 8 U.S. and 2 international issued patents for needle-free injection systems related to aspects of the Mini-Ject technology. |
| • | We own 10 U.S. and 5 international issued patents and have 9 patents pending in the area of microneedle design, fabrication and drug delivery related to aspects of the Micro-Trans technology. |
Trademarks
We believe we have protected our trademarks, including our trademark of V-Go, through applications in all major markets worldwide as well as the United States. Our trademark portfolio consists of 16 registered trademarks, six of which are registered in the United States, including our V-Go logo. We also have nine trademark applications pending registration in several major markets outside the United States.
Trade Secrets and Know-How
We rely, in some circumstances, on trade secrets and know-how to protect our proprietary manufacturing processes and materials critical to our product. We seek to preserve the integrity and confidentiality of our trade secrets and know-how in part by limiting the employees and third parties who have access to certain information and requiring employees and third parties to execute confidentiality and invention assignment agreements, under which they are bound to assign to us inventions made during the term of their employment. These agreements further require employees to represent that they have no existing obligations and hold no interest that conflicts with any of their obligations under their agreements with us. We also generally require consultants, independent contractors and other third parties to sign agreements providing that any inventions that relate to our business are owned by us, and prohibiting them from disclosing or using our proprietary information except as may be authorized by us.
Competition
The medical technology and biopharmaceutical industries are characterized by rapidly advancing technologies, intense competition and a strong emphasis on proprietary products. Competition in the diabetes market is particularly intense, due largely to the fact that products designed to treat diabetes currently compete with both traditional and new products. We compete with these products based on efficacy, price, reimbursement, ease of use and healthcare provider education.
Within the diabetes market, V-Go is cleared by the FDA for adult patients who require insulin, with either Type 1 or Type 2 diabetes, although we position V-Go to compete primarily in the market for adult patients with Type 2 diabetes requiring insulin, particularly as part of a basal-bolus insulin regimen. Our primary competitors in the basal-bolus insulin therapy market are manufacturers of insulin and insulin pens, such as Novo Nordisk, Sanofi S.A. and Eli Lilly and Company.
In addition to basal-bolus insulin therapy, glucagon-like peptide-1, or GLP-1, analog injection products are another potential competitor to V-Go. GLP-1 analog injection products are used in combination with OADs or basal insulin injection. Some physicians, when faced with a patient who is unable to reach or maintain glucose levels at his or her goal with OADs, will add a GLP-1 through twice-daily, once-daily or once-weekly injections. As a result, we also compete with pharmaceutical manufacturers of GLP-1 analog injection products, such as AstraZeneca, Novo Nordisk and GlaxoSmithKline plc. In addition, we may compete with inhaled insulin products for bolus therapy, which have been recently introduced to the market.
In the area of basal-bolus device competition, we do not consider programmable insulin pumps to be products that compete directly with V-Go, as those products, although cleared for both Type 1 and Type 2 diabetes, have
26
Table of Contents
been primarily designed and marketed for patients with Type 1 diabetes. We believe that the simple and discreet design and interface of V-Go more directly addresses the needs of patients with Type 2 diabetes. Patients with Type 2 diabetes, for example, are often taking many drugs for multiple diseases, including medications to treat high blood pressure and elevated cholesterol, and, as a result, they desire a simple to use and discreet method to deliver their insulin. We are not aware of any other single-use disposable, mechanical (which means the device does not include any electronics, batteries or audible alarms and does not require any recharging or programming), basal-bolus insulin delivery devices currently marketed or in development at this time.
Government Regulation
V-Go, our first commercialized product, received 510(k) clearance by the FDA in December 2010. Our product and our operations are subject to extensive regulation by the FDA and other federal and state authorities in the United States, as well as comparable authorities in foreign jurisdictions. Our product is subject to regulation as a medical device in the United States under the Federal Food, Drug, and Cosmetic Act, or FDCA, and related regulations enforced by the FDA. The FDA regulates, among other things, the development, design, non-clinical and clinical research, manufacturing, safety, efficacy, labeling, packaging, storage, installation, servicing, recordkeeping, premarket clearance or approval, import, export, adverse event reporting, advertising, promotion, marketing and distribution of medical devices to ensure that medical devices distributed domestically are safe and effective for their intended uses and otherwise meet the requirements of the FDCA.
FDA Premarket Clearance and Approval Requirements
Unless an exemption applies, each medical device commercially distributed in the United States requires either FDA clearance of a 510(k) premarket notification submission, granting of a de novo classification request, or approval of a premarket approval application, or PMA. Under the FDCA, medical devices are classified into one of three classes—Class I, Class II or Class III— depending on the degree of risk associated with each medical device. Class I includes devices with the lowest risk to the patient and are subject to the FDA’s general controls for medical devices, which include compliance with the applicable portions of the Quality System Regulation, or QSR, facility registration and product listing, reporting of adverse medical events, and truthful and non-misleading labeling, advertising, and promotional materials. Class II devices are subject to the FDA’s general controls, and special controls as deemed necessary by the FDA to ensure the safety and effectiveness of the device. These special controls can include performance standards, post-market surveillance, patient registries and FDA guidance documents.
While most Class I devices are exempt from the 510(k) requirements, manufacturers of most Class II devices are required to submit to the FDA a premarket notification under Section 510(k) of the FDCA requesting permission to commercially distribute the device. The FDA’s permission to commercially distribute a device subject to a 510(k) premarket notification is generally known as 510(k) clearance. Devices deemed by the FDA to pose the greatest risks, such as life sustaining, life supporting or some implantable devices, or devices that have a new intended use, or use advanced technology that is not substantially equivalent to that of a legally marketed device, are placed in Class III, requiring approval of a PMA. Our currently marketed products are Class II devices subject to 510(k) clearance.
510(k) Marketing Clearance and De Novo Pathways
To obtain 510(k) clearance, a premarket notification submission must be submitted to the FDA demonstrating that the proposed device is “substantially equivalent” to a predicate device. A predicate device is a legally marketed device that is not subject to premarket approval, i.e., a device that was legally marketed prior to May 28, 1976 (pre-amendments device) and for which a PMA is not required, a device that has been reclassified from Class III to Class II or I, or a device that was found substantially equivalent another device cleared through the 510(k) process. The FDA’s 510(k) review process usually takes from three to six months, but may take longer. The FDA may require additional information, including clinical data, to make a determination regarding substantial equivalence.
27
Table of Contents
If the FDA agrees that the device is substantially equivalent to a predicate device, it will grant 510(k) clearance to market the device. If the FDA determines that the device is “not substantially equivalent” to a previously cleared device, the device is automatically designated as a Class III device. The device sponsor must then fulfill more rigorous PMA requirements, or can request a risk-based classification determination for the device in accordance with the “de novo” process, which may determine that the new device is of low to moderate risk and that it can be appropriately be regulated as a Class I or II device. If a de novo request is granted, the device may be legally marketed and a new classification is established. If the device is classified as Class II, the device may serve as a predicate for future 510(k) submissions.
After a device receives 510(k) marketing clearance, any modification that could significantly affect its safety or effectiveness, or that would constitute a major change or modification in its intended use, will require a new 510(k) marketing clearance or, depending on the modification, PMA approval. The FDA requires each manufacturer to determine whether the proposed change requires submission of a 510(k) or a PMA in the first instance, but the FDA can review that decision and disagree with a manufacturer’s determination. If the FDA disagrees with a manufacturer’s determination, the FDA can require the manufacturer to cease marketing and/or request the recall of the modified device until 510(k) marketing clearance or PMA approval is obtained. Also, in these circumstances, we may be subject to significant regulatory fines or penalties. We have made and plan to continue to make additional product enhancements to our 510(k)-cleared products. We cannot be assured that the FDA would agree with any of our decisions to not submit 510(k) premarket notifications for these modified devices.
V-Go is one of the first insulin delivery devices to be cleared under the FDA’s Infusion Pump Improvement Initiative, which established additional device manufacturing requirements designed to foster the development of safer, more effective infusion pumps. The FDA launched this initiative in 2010 to support the benefits of external infusion pumps while minimizing the risks associated with these devices. As part of the initiative, FDA issued guidance requesting the inclusion of additional information in premarket submissions for infusion pumps beyond what has traditionally been provided, including detailed engineering information, a comprehensive discussion of steps taken to mitigate risks and additional design validation testing specific to the environment in which the device is intended to be used.
PMA Approval Pathway
Class III devices require PMA approval before they can be marketed. The PMA process is more demanding than the 510(k) process. In a PMA the manufacturer must demonstrate that the device is safe and effective, and the PMA must be supported by extensive data, including data from preclinical studies and human clinical trials. The PMA must also contain, among other things, a full description of the device and its components, a full description of the methods, facilities and controls used for manufacturing, and proposed labeling. Following receipt of a PMA, the FDA determines whether the application is sufficiently complete to permit a substantive review. If FDA accepts the application for review, it has 180 days under the FDCA to complete its review of the PMA, although in practice, the FDA’s review often takes significantly longer, and can take up to several years. An advisory panel of experts from outside the FDA may be convened to review and evaluate the application and provide recommendations to the FDA as to the approvability of the device. The FDA may or may not accept the panel’s recommendation. In addition, the FDA will generally conduct a pre-approval inspection of the applicant or its third-party manufacturers’ or suppliers’ manufacturing facility or facilities to ensure compliance with the QSR. The FDA will approve the new device for commercial distribution if it determines that the data and information in the PMA constitute valid scientific evidence and that there is reasonable assurance that the device is safe and effective for its intended use(s). The FDA may approve a PMA with post-approval conditions intended to ensure the safety and effectiveness of the device, including, among other things, restrictions on labeling, promotion, sale and distribution, and collection of long-term follow-up data from patients in the clinical trial that supported PMA approval or requirements to conduct additional clinical trials post-approval. The FDA may condition PMA approval on some form of post-market surveillance when deemed necessary to protect the public health or to provide additional safety and efficacy data for the device in a larger population or for a longer
28
Table of Contents
period of use. In such cases, the manufacturer might be required to follow certain patient groups for a number of years and to make periodic reports to the FDA on the clinical status of those patients. Failure to comply with the conditions of approval can result in material adverse enforcement action, including withdrawal of the approval.
Certain changes to an approved device, such as changes in manufacturing facilities, methods, or quality control procedures, or changes in the design performance specifications, that affect the safety or effectiveness of the device, require submission of a PMA supplement. PMA supplements often require submission of the same type of information as a PMA, except that the supplement is limited to information needed to support any changes from the device covered by the original PMA and may not require as extensive clinical data or the convening of an advisory panel. Certain other changes to an approved device require the submission of a new PMA, such as when the design change causes a different intended use, mode of operation, and technical basis of operation, or when the design change is so significant that a new generation of the device will be developed, and the data that were submitted with the original PMA are not applicable for the change in demonstrating a reasonable assurance of safety and effectiveness. Our product is not currently subject to PMA requirements. However, we may in the future develop devices that will require the submission of a PMA.
Clinical Trials
Clinical trials are almost always required to support a PMA and are sometimes required to support a 510(k) submission. All clinical investigations of devices to determine safety and effectiveness must be conducted in accordance with the FDA’s investigational device exemption, or IDE, regulations which govern investigational device labeling, prohibit promotion of the investigational device, and specify an array of recordkeeping, reporting and monitoring responsibilities of study sponsors and study investigators. If the device presents a “significant risk,” to human health, as defined by the FDA, the FDA requires the device sponsor to submit an IDE application to the FDA, which must be approved prior to commencing human clinical trials. A significant risk device is one that presents a potential for serious risk to the health, safety or welfare of a patient and either is implanted, used in supporting or sustaining human life, substantially important in diagnosing, curing, mitigating or treating disease or otherwise preventing impairment of human health, or otherwise presents a potential for serious risk to a subject. An IDE application must be supported by appropriate data, such as animal and laboratory test results, showing that it is safe to test the device in humans and that the testing protocol is scientifically sound. The IDE will automatically become effective 30 days after receipt by the FDA unless the FDA notifies us that the investigation may not begin. If the FDA determines that there are deficiencies or other concerns with an IDE for which it requires modification, the FDA may permit a clinical trial to proceed under a conditional approval.
In addition, the clinical trial must be approved by, and conducted under the oversight of, an Institutional Review Board, or IRB, for each clinical site. The IRB is responsible for the initial and continuing review of the trial, and may pose additional requirements for the conduct of the trial. If an IDE application is approved by the FDA and one or more IRBs, human clinical trials may begin at a specific number of investigational sites with a specific number of patients, as approved by the FDA. If the device presents a non-significant risk to the patient, a sponsor may begin the clinical trial after obtaining approval for the trial by one or more IRBs without separate approval from the FDA, but must still certain IDE requirements, such as monitoring the investigation, ensuring that the investigators obtain informed consent, and labeling and record-keeping requirements. An IDE supplement must be submitted to, and approved by, the FDA before a sponsor or investigator may make a change to the investigational plan.
During a clinical trial, the sponsor is required to comply with applicable FDA requirements, and the clinical investigators are also subject to FDA’s regulations. Both must comply with good clinical practice requirements, or GCPs, which among other things requires that informed consent be obtained from each research subject, that the investigational plan and study protocol be followed, that the disposition of the investigational device be controlled, and that reporting and recordkeeping requirements are followed. Additionally, after a trial begins, we, the FDA or the IRB could suspend or terminate a clinical trial at any time for various reasons, including a belief
29
Table of Contents
that the risks to study subjects outweigh the anticipated benefits. Even if a clinical trial is completed, there can be no assurance that the data generated during a clinical trial will meet the safety and effectiveness endpoints or otherwise produce results that will lead the FDA to grant marketing clearance or approval.
Post-Market Regulation
After a device is cleared or approved for marketing, numerous and pervasive regulatory requirements continue to apply. These include:
| • | establishment registration and device listing with the FDA; |
| • | Quality System Regulation, or QSR, requirements, which require manufacturers, including third-party manufacturers, to follow stringent design, testing, control, documentation and other quality assurance procedures during all aspects of the design and manufacturing process; |
| • | labeling regulations and requirements related to promotional activities, including FDA prohibitions against the promotion of investigational products, or “off-label” uses of cleared or approved products; |
| • | clearance or approval of product modifications to 510(k)-cleared devices that could significantly affect safety or effectiveness or that would constitute a major change in intended use of one of our cleared devices; |
| • | medical device reporting requirements, which require that a manufacturer report to the FDA if a device it markets may have caused or contributed to a death or serious injury, or has malfunctioned and the device or a similar device that it markets would be likely to cause or contribute to a death or serious injury, if the malfunction were to recur; |
| • | correction, removal and recall reporting regulations, which require that manufacturers report to the FDA field corrections and product recalls or removals if undertaken to reduce a risk to health posed by the device or to remedy a violation of the FDCA that may present a risk to health; |
| • | the FDA’s mandatory recall authority, whereby the agency can order device manufacturers to recall from the market a product that is in violation of governing laws and regulations; and |
| • | post-market surveillance activities and regulations, which apply when deemed by the FDA to be necessary to protect the public health or to provide additional safety and effectiveness data for the device. |
Our manufacturing processes are required to comply with the applicable portions of the QSR, which cover the methods and the facilities and controls for the design, manufacture, testing, production, processes, controls, quality assurance, labeling, packaging, distribution, installation and servicing of finished devices intended for human use. The QSR also requires, among other things, maintenance of a device master file, device history file, and complaint files. As a manufacturer, we and our third-party manufacturers are subject to periodic scheduled or unscheduled inspections by the FDA. Our failure to maintain compliance with the QSR requirements could result in the shut-down of, or restrictions on, our manufacturing operations and the recall or seizure of our product. The discovery of previously unknown problems with our product, including unanticipated adverse events or adverse events of increasing severity or frequency, whether resulting from the use of the device within the scope of its clearance or off-label by a physician in the practice of medicine, could result in restrictions on the device, including the removal of the product from the market or voluntary or mandatory device recalls. The FDA has broad enforcement powers. If the FDA determines that we failed to comply with applicable regulatory requirements, it can take a variety of or enforcement actions, which may result in any of the following sanctions:
| • | warning letters, fines, injunctions, consent decrees and civil penalties; |
| • | recalls, withdrawals, or administrative detention or seizure of our product; |
| • | operating restrictions or partial suspension or total shutdown of production; |
30
Table of Contents
| • | refusing or delaying requests for 510(k) marketing clearance or PMA approvals of new products or modified products; |
| • | withdrawing 510(k) clearances or PMA approvals that have already been granted; |
| • | refusal to grant export approvals for our product; or |
| • | criminal prosecution. |
U.S. Anti-Kickback, False Claims and Other Healthcare Fraud and Abuse Laws
We are also subject to healthcare regulation and enforcement by the federal government and the states and foreign governments and authorities in the locations in which we conduct our business. These other agencies include, without limitation, the Centers for Medicare and Medicaid Services, or CMS, other divisions of the U.S. Department of Health and Human Services, the U.S. Department of Justice and individual U.S. Attorney offices within the Department of Justice, as well as state and local governments. Such agencies enforce a variety of laws which include, without limitation, state and federal anti-kickback, fraud and abuse, false claims, data privacy and security, and physician sunshine laws and regulations.
The federal Anti-Kickback Statute prohibits, among other things, knowingly and willfully offering, paying, soliciting or receiving any remuneration (including any kickback, bribe or rebate), directly or indirectly, overtly or covertly, to induce or in return for purchasing, leasing, ordering or arranging for or recommending the purchase, lease or order of any good, facility, item or service reimbursable, in whole or part by Medicare, Medicaid or other federal healthcare programs. The term “remuneration” has been broadly interpreted to include anything of value, including cash, improper discounts, and free or reduced price items and services. Among other things, the Anti-Kickback Statute has been interpreted to apply to arrangements between pharmaceutical manufacturers on one hand and prescribers, purchasers and formulary managers on the other. Although there are a number of statutory exceptions and regulatory safe harbors protecting some common activities from prosecution, the exceptions and safe harbors are drawn narrowly. Practices that involve remuneration that may be alleged to be intended to induce prescribing, purchases or recommendations may be subject to scrutiny if they do not qualify for an exception or safe harbor. Failure to meet all of the requirements of a particular applicable statutory exception or regulatory safe harbor does not make the conduct per se illegal under the Anti-Kickback Statute. Instead, the legality of the arrangement will be evaluated on a case-by-case basis based on a cumulative review of all of its facts and circumstances. Several courts have interpreted the statute’s intent requirement to mean that if any one purpose of an arrangement involving remuneration is to induce referrals of federal healthcare covered business, the Anti-Kickback Statute has been violated. The Patient Protection and Affordable Care Act of 2010, as amended by the Health Care and Education Reconciliation Act, collectively the Affordable Care Act, among other things, amended the intent requirement of the federal Anti-Kickback Statute such that a person or entity no longer needs to have actual knowledge of the statute or specific intent to violate, in order to have committed a violation.
The federal civil False Claims Act prohibits, among other things, any person or entity from knowingly presenting, or causing to be presented, a false or fraudulent claim for payment to or approval by the federal government or knowingly making, using or causing to be made or used a false record or statement material to a false or fraudulent claim to the federal government. A claim includes “any request or demand” for money or property presented to the U.S. government. In addition, the Affordable Care Act codified case law that a claim including items or services resulting from a violation of the federal Anti-Kickback Statute constitutes a false or fraudulent claim for purposes of the federal civil False Claims Act. Several pharmaceutical and other healthcare companies have been prosecuted under the federal civil False Claims Act for, among other things, allegedly providing free product to customers with the expectation that the customers would bill federal programs for the product. Other companies have been prosecuted for causing false claims to be submitted because of the companies’ marketing of products for unapproved, and thus non-covered, uses. In addition, the federal civil monetary penalties statute imposes penalties against any person or entity that, among other things, is determined
31
Table of Contents
to have presented or caused to be presented a claim to a federal health program that the person knows or should know is for an item or service that was not provided as claimed or is false or fraudulent.
The federal Health Insurance Portability and Accountability Act of 1996, or HIPAA, created federal criminal statutes that prohibit knowingly and willfully executing, or attempting to execute, a scheme to defraud any healthcare benefit program, including private third-party payors and knowingly and willfully falsifying, concealing or covering up a material fact or making any materially false, fictitious or fraudulent statement in connection with the delivery of or payment for healthcare benefits, items or services. Similar to its amendment of the Anti-Kickback Statute, the Affordable Care Act also broadened the reach of certain criminal healthcare fraud statutes created under HIPAA by amending the intent requirement such that a person or entity no longer needs to have actual knowledge of the statute or specific intent to violate it in order to have committed a violation.
Also, many states have similar fraud and abuse statutes or regulations that may be broader in scope and may apply regardless of payor, in addition to items and services reimbursed under Medicaid and other state programs.
There has been a recent trend of increased federal and state regulation of payments made to physicians and other healthcare providers. The Affordable Care Act imposed, among other things, new annual reporting requirements for covered manufacturers for certain payments and “transfers of value” provided to physicians and teaching hospitals, as well as ownership and investment interests held by physicians and their immediate family members. Failure to submit timely, accurately and completely the required information for all payments, transfers of value and ownership or investment interests may result in civil monetary penalties of up to an aggregate of $150,000 per year and up to an aggregate of $1 million per year for “knowing failures.” Covered manufacturers were required to report detailed payment data for the first reporting period (August 1, 2013—December 31, 2013) under this law and submit legal attestation to the completeness and accuracy of such data by June 30, 2014. Thereafter, covered manufacturers must submit reports by the 90th day of each subsequent calendar year. In addition, certain states require implementation of commercial compliance programs and compliance with the pharmaceutical industry’s voluntary compliance guidelines and the relevant compliance guidance promulgated by the federal government, impose restrictions on marketing practices, and/or tracking and reporting of gifts, compensation and other remuneration or items of value provided to physicians and other healthcare professionals and entities.
If our operations are found to be in violation of any of the health regulatory laws described above or any other laws that apply to us, we may be subject to penalties, including potentially significant criminal, civil and/or administrative penalties, damages, fines, individual imprisonment, disgorgement, exclusion from participation in government healthcare programs, contractual damages, reputational harm, administrative burdens, diminished profits and future earnings, and the curtailment or restructuring of our operations.
Healthcare Reform
A primary trend in the U.S. healthcare industry is cost containment. The federal government and state legislatures have attempted to control healthcare costs in part by limiting coverage and the amount of reimbursement for particular drug products, including implementing price controls, restrictions on coverage and reimbursement and requirements for substitution of generic products. By way of example, the Affordable Care Act contains provisions that may reduce the profitability of drug products.
In January 2017, the U.S. House of Representatives and Senate passed legislation, which, if signed into law by the new administration, would repeal certain aspects of the ACA. Further, on January 20, 2017, the new administration signed an Executive Order directing federal agencies with authorities and responsibilities under the ACA to waive, defer, grant exemptions from, or delay the implementation of any provision of the ACA that would impose a fiscal or regulatory burden on states, individuals, healthcare providers, health insurers, or manufacturers of pharmaceuticals or medical devices. Congress also could consider subsequent legislation to replace elements of the ACA that are repealed.
32
Table of Contents
Other legislative changes have been proposed and adopted since the Affordable Care Act was enacted. On August 2, 2011, President Obama signed into law the Budget Control Act of 2011, which, among other things, created the Joint Select Committee on Deficit Reduction to recommend to Congress proposals in spending reductions. The Joint Select Committee did not recommend and Congress did not enact legislation to reduce the deficit by at least $1.2 trillion for the years 2013 through 2021, triggering the legislation’s automatic reduction to several government programs. This includes reductions to Medicare payments to providers of 2% per fiscal year, which went into effect on April 1, 2013 and will remain in effect through 2025 unless additional Congressional action is taken.
We expect that additional state and federal healthcare reform measures will be adopted in the future, any of which could limit the amounts that federal and state governments will pay for healthcare products and services, which could result in reduced demand for our product or additional pricing pressures.
Coverage and Reimbursement
Sales of our product depend, in significant part, on the extent to which our product is covered and reimbursed by third-party payors, such as government healthcare programs, including, without limitation, Medicare Part D plans, commercial insurance and managed healthcare organizations. Patients who use V-Go generally rely on these third-party payors to pay for all or part of the costs of our product. The containment of healthcare costs has become a priority of federal, state and foreign governments, and the prices of drug products have been a focus in this effort. Third-party payors are increasingly challenging the prices charged for drug products and medical services, examining the medical necessity, reviewing the cost effectiveness, and questioning the safety and efficacy of such products and services. If these third-party payors do not consider our product to be cost-effective compared to other available therapies, they may not cover our product or, if they do, the level of payment may not be sufficient to allow us to sell our product at a profit. In addition, the U.S. government, state legislatures and foreign governments have continued implementing cost-containment programs, including price controls, restrictions on reimbursement and requirements for substitution of generic products. Adoption of price controls and cost-containment measures, and adoption of more restrictive policies in jurisdictions with existing controls and measures, could further limit our net revenue and results.
Currently, a number of third-party payors have coverage policies that permit coverage for V-Go, either under the pharmacy or medical benefit. For example, a majority of Medicare Part D plans make coverage for our product available under the outpatient prescription drug benefit. A number of private payors and Medicaid programs also permit coverage for V-Go under the pharmacy benefit. The process for determining whether a third-party payor will provide coverage for a drug product typically is separate from the process for establishing the reimbursement rate that the payor will pay for the product once coverage is approved. Third-party payors, including, without limitation, Medicare Part D plans, may limit coverage to specific drug products on an approved list, also known as a formulary, which might not include all of the FDA-approved drugs for a particular indication. Continued placement on formularies is therefore critical for reimbursement. A decision by a third-party payor not to cover our product could reduce physician utilization of our product. Moreover, a third-party payor’s decision to provide coverage for a drug product does not imply that an adequate reimbursement rate will be approved. Adequate third-party reimbursement may not be available to enable us to maintain price levels sufficient to realize an appropriate return on our investment in product development, sales and marketing. Additionally, coverage and reimbursement for drug products can differ significantly from payor to payor. One third-party payor’s decision to cover a particular drug product or service does not ensure that other payors will also provide coverage for the medical product or service, or will provide coverage at an adequate reimbursement rate. As a result, the coverage determination process will require us to provide scientific and clinical support for the use of our product to each payor separately and will continue to be a time-consuming process.
V-Go currently is not covered under Medicare Part B because V-Go is a disposable insulin dispensing device, which is not a recognized Part B benefit. In addition, some private third-party payors have determined that there is insufficient data for coverage and concluded that V-Go is investigational or experimental. Those payors may
33
Table of Contents
determine at a future date that our product, including V-Go, will be covered and because coverage and reimbursement varies significantly from payor to payor, the process to obtain favorable recognition is time-consuming.
We currently have contracts establishing reimbursement for V-Go with national and regional third-party payors in the United States. While we anticipate entering into additional contracts with third-party payors, we cannot guarantee that we will succeed in doing so or that the reimbursement contracts we are able to negotiate will enable us to sell our product on a profitable basis. In addition, contracts with third-party payors generally can be modified or terminated by the third-party payor without cause and with little or no notice to us. Moreover, compliance with the administrative procedures or requirements of third-party payors may result in delays in processing approvals by those third-party payors for customers to obtain coverage for V-Go. Failure to secure or retain adequate coverage or reimbursement for V-Go by third-party payors, or delays in processing approvals by those payors, could result in the loss of sales, which could have a material adverse effect on our business, financial condition and operating results.
Employees
As of December 31, 2016, we had 82 full-time employees, including 19 in our manufacturing, quality, compliance and research organization, 55 in our commercial organization and eight in general and administrative functions.
Properties
Our corporate headquarters are located in Bridgewater, New Jersey, where we currently lease approximately 9,700 square feet of office space under a lease that expires on June 30, 2018. We also maintain a research and development facility in Shrewsbury, Massachusetts, where we currently lease approximately 73,000 square feet of space for offices, lab and pilot facilities and process and engineering under a lease that expires on October 31, 2017.
Legal Proceedings
We are currently not a party to any material legal proceedings; but from time to time, we may become involved in various lawsuits and legal proceedings which arise in the ordinary course of business.
Available Information
We make available on our website (http://www.valeritas.com), or through a link posted on our website, free of charge, our annual reports on Form 10-K, quarterly reports on Form 10-Q, current reports on Form 8-K, reports filed pursuant to Section 16 and amendments to those reports filed pursuant to Section 13(a) or 15(d) of the Securities Exchange Act of 1934 as soon as reasonably practicable after we electronically file such material with, or furnish it to, the Securities and Exchange Commission (SEC). In addition, the SEC maintains an internet site that contains these reports, proxy and information statements, and other information regarding issuers that file electronically with the SEC (http://www.sec.gov).
We also make available on our website, in a printable format, the charters for our Board of Directors committees, including the Audit Committee and the Compensation and Organization Committee, in addition to our Corporate Governance Guidelines, Bylaws, Code of Business Conduct and Ethics Policy, Related Party Transactions Policy and Compensation Recovery Policy. Our website is not incorporated into or a part of this Form 10-K.
34
Table of Contents
You should carefully consider the following risk factors, in addition to the other information contained in this Annual Report on Form 10-K, including the section of this report titled “Management’s Discussion and Analysis of Financial Condition and Results of Operations” and our financial statements and related notes. If any of the events described in the following risk factors and the risks described elsewhere in this Annual Report on Form 10-K occurs, our business, operating results and financial condition could be seriously harmed and the trading price of our shares of common stock could decline. This Annual Report on Form 10-K also contains forward-looking statements that involve risks and uncertainties. Our actual results could differ materially from those anticipated in the forward-looking statements as a result of factors that are described below and elsewhere in this Annual Report on Form 10-K.
Risks Related to Our Business
We have incurred significant operating losses since our inception and anticipate that we will continue to incur significant losses for the foreseeable future. These factors raise substantial doubt about our ability to continue as a going concern.
Since our inception in 2006, we have incurred significant net losses. Our recurring losses from operations raise substantial doubt about our ability to continue as a going concern, and as a result our independent registered public accounting firm included an explanatory paragraph regarding the same in its report to this Annual Report on Form 10-K. Substantial doubt about our ability to continue as a going concern may create negative reactions to the price of our common stock and we may have a more difficult time obtaining financing in the future.
Our net losses were $67.2 million for the year ended December 31, 2015 and $46.4 million for the year ended December 31, 2016. As of December 31, 2016, we had an accumulated deficit of $424.2 million. To date, we have financed our operations primarily through sales of our capital stock, debt financings and limited sales of V-Go. We have devoted substantially all of our resources to the research, development and engineering of our products, the commercial launch of V-Go, the development of a sales and marketing team and the assembly of a management team to lead our business.
To implement our business strategy we need to, among other things, increase sales of our products with our existing sales and marketing infrastructure, fund ongoing research, development and engineering activities, expand our manufacturing capabilities, and obtain regulatory clearance in other markets outside the United States and European Union or approval to commercialize our products currently under development. We expect our expenses to increase significantly as we pursue these objectives. The extent of our future operating losses and the timing of profitability are highly uncertain, especially given that we only recently commercialized V-Go, which makes predicting our sales more difficult. We will need to affect a financing or capital raise in the near term in order to sustain operations and implement our business strategy until we can achieve profitability from operations, if ever. Our inability to affect a financing or capital raise and continued losses from operations could have a material adverse effect on the Company. Any additional operating losses will have an adverse effect on our stockholders’ equity/(deficit), and we cannot assure you that we will ever be able to achieve or sustain profitability.
We currently rely on sales of V-Go to generate all of our revenue, and any factors that negatively impact our sales of V-Go would also negatively impact our financial condition and operating results.
V-Go is our only revenue-producing commercial product, which we introduced into the market in the first quarter of 2012. In the near term, we expect to continue to derive all of our revenue from the sale of V-Go. Accordingly, our ability to generate revenue is highly dependent on our ability to market and sell V-Go.
Sales of V-Go may be negatively impacted by many factors, including:
| • | problems relating to our manufacturing capabilities, including, but not limited to, the destruction, loss, or temporary shutdown of our manufacturing facility; |
35
Table of Contents
| • | failure to become or remain the preferred basal-bolus insulin therapy among patients with Type 2 diabetes; |
| • | failure by patients to use V-Go as directed, which could limit its effectiveness and could have an adverse impact on repeat use; |
| • | inadequate coverage and reimbursement or changes in reimbursement rates or policies relating to V-Go or similar products or technologies by third-party payors; |
| • | our inability to enter into contracts with additional third-party payors on a timely basis and on acceptable terms; |
| • | claims that V-Go, or any component thereof, infringes on patent rights or other intellectual property rights of third parties; and |
| • | adverse regulatory or legal actions relating to V-Go or similar products or technologies. |
Because we currently rely on V-Go to generate all of our revenue, any factors that negatively impact our sales of V-Go, or that result in sales of V-Go increasing at a lower rate than expected, would also negatively impact our financial condition and operating results.
Our ability to maintain and grow our revenue depends both on retaining a high percentage of patients using V-Go and on preserving our relationships with a few significant wholesale customers that account for nearly all of our sales.
A key to maintaining and growing our revenue is the retention of a high percentage of patients using V-Go, as a significant and increasing proportion of our business is generated through refill prescriptions. Refill prescriptions account for nearly two-thirds of our total prescriptions and since we do not have reliable data regarding retention rates, and because refill prescriptions generally move in parallel with our patient retention rates, we use these as a proxy to determine patient retention rates. During the year ended December 31, 2016, three wholesale customers accounted for approximately 91% of our total product shipments. If demand for V-Go fluctuates as a result of the introduction of competitive products, negative perceptions with respect to the effectiveness of V-Go, changes in reimbursement policies, manufacturing problems, perceived safety issues with our or our competitors’ products, the failure to secure regulatory clearance or approvals or for other reasons, our ability to attract and retain customers and ultimately patients could be harmed. The failure to retain a high percentage of patients using V-Go could negatively impact our revenue growth. Furthermore, the loss of any one of our significant wholesale customers or a sustained decrease in demand by any of these wholesale customers could result in a substantial loss of revenue or patients losing convenient access to V-Go, either of which would hurt our business, financial condition and results of operations.
The failure of V-Go to achieve and maintain market acceptance could result in our achieving sales below our expectations.
Our current business strategy is highly dependent on V-Go achieving and maintaining market acceptance. In order for us to sell V-Go to people with Type 2 diabetes who require insulin, we must convince them, their caregivers and healthcare providers that V-Go is an attractive alternative to other insulin delivery devices for the treatment of diabetes, including insulin pens and traditional syringes. Market acceptance and adoption of V-Go depends on educating people with diabetes, as well as their caregivers and healthcare providers, as to the distinct features, ease-of-use, positive lifestyle-impact and other perceived benefits of V-Go as compared to competitive products. If we are not successful in convincing existing and potential customers of the benefits of V-Go, or if we are not able to achieve the support of caregivers and healthcare providers for V-Go, our sales may decline or we may fail to increase our sales in line with our anticipated levels.
36
Table of Contents
Achieving and maintaining market acceptance of V-Go could be negatively impacted by many factors, including:
| • | the failure of V-Go to achieve wide acceptance among people with Type 2 diabetes who require insulin, their caregivers, insulin-prescribing healthcare providers, third-party payors and key opinion leaders in the diabetes treatment community; |
| • | lack of availability of adequate coverage and reimbursement for patients and health care providers; |
| • | lack of evidence supporting the safety, ease-of-use or other perceived benefits of V-Go over competitive products or other currently available insulin treatment methods; |
| • | lack of long-term persistency of patients who do start V-Go, as future sales are heavily dependent on patient refills; |
| • | perceived risks associated with the use of V-Go or similar products or technologies generally; |
| • | the introduction of competitive products and the rate of acceptance of those products as compared to V-Go; and |
| • | any negative results of clinical studies relating to V-Go or similar competitive products. |
In addition, V-Go may be perceived by people with Type 2 diabetes requiring insulin, their caregivers or healthcare providers to be more complicated, only marginally more effective or even less effective than traditional insulin-delivery methods, and people may be unwilling to change their current treatment regimens. Moreover, we believe that healthcare providers tend to be slow to change their medical treatment practices because of perceived liability risks arising from the use of new products and the uncertainty of third-party payor reimbursement. Accordingly, healthcare providers may not recommend V-Go until there is sufficient evidence to convince them to alter the treatment methods they typically recommend, such as receiving recommendations from prominent healthcare providers or other key opinion leaders in the diabetes treatment community that our products are effective in providing insulin therapy.
If V-Go does not achieve and maintain widespread market acceptance, we may fail to achieve sales at or above our anticipated levels. If our sales do not meet anticipated levels, we may fail to meet our strategic objectives.
We operate in a very competitive industry, and if we fail to compete successfully against our existing or potential competitors, many of whom have greater resources than we have, our revenue and operating results may be negatively affected.
The diabetes market, and especially the market for patients with Type 2 diabetes, is intensely competitive, subject to change and highly sensitive to promotional effort, the number of sales force representatives, the introduction of new products or technologies, or other activities of industry and diabetes-related associations and participants. V-Go competes directly with a number of insulin-delivery devices, primarily insulin pens and syringes, but also indirectly with any other currently marketed or future marketed diabetes therapeutic intervention such as oral anti-diabetic medications, other injectable anti-diabetic medications such as glucagon- like peptide-1, or GLP-1, and analogs. We do not consider programmable insulin pumps or programmable insulin patch pumps to be products that compete directly with V-Go, as those products have been primarily designed and marketed for patients with Type 1 diabetes. There are a significant number of very large global pharmaceutical companies that promote and sell anti-diabetic products that are aimed to be used either instead of insulin or to deliver insulin using insulin pens or syringes. Many of our existing and potential competitors are major global companies that are either publicly traded companies or divisions or subsidiaries of publicly traded companies that have significant resources available.
These competitors also enjoy several competitive advantages over us, including:
| • | greater financial and human resources for sales and marketing, managed care and reimbursement, medical affairs and product development; |
| • | established relationships with healthcare providers and third-party payors; |
37
Table of Contents
| • | established reputation and name recognition among healthcare providers and other key opinion leaders in the diabetes treatment community; |
| • | in some cases, an established base of repeat, long-time customers; |
| • | products supported by a large volume of short-term and long-term clinical data; |
| • | larger and more established distribution networks; |
| • | greater ability to cross-sell products or provide incentives to healthcare providers to use their products; and |
| • | more experience in conducting research, development and engineering activities, manufacturing, clinical trials, and obtaining regulatory approval or clearance. |
For these and other reasons, we may not be able to compete successfully against our current or potential future competitors. If this occurs, we may fail to meet our strategic objectives, and our revenue and operating results could be negatively affected.
Competitive products or other technological breakthroughs for the treatment or prevention of diabetes may render our products obsolete or less desirable.
Our ability to achieve our strategic objectives will depend, among other things, on our ability to develop and commercialize products for the treatment of diabetes, in both specialist and primary care settings, which are easy-to- train and easy-to-use, provide clinical benefits as well as equivalent or improved patient adherence and persistency, receive adequate coverage and reimbursement from third-party payors with reasonable out-of-pocket costs to patients, and are more appealing than available alternatives. Our current competition is primarily with other non-electronic insulin delivery devices such as insulin pens and syringes. There are other FDA-cleared basal-bolus insulin delivery products, including one that includes a patch component, but these are electronic. These electronic basal-bolus insulin delivery devices and systems are cleared for use by both Type 1 and Type 2 patients. In the future, the insulin-delivery methods for patients with Type 2 diabetes could change if other non-invasive formulations of insulin are approved and successfully commercialized, such as oral insulin in pill form, inhaled insulin or buccal insulin. If longer-acting and safer GLP-1 analogs with fewer side effects are approved and successfully commercialized, they could reduce or delay the use of basal/bolus insulin in patients with Type 2 diabetes. In addition, a number of other companies are pursuing new electronic or mechanical delivery devices, delivery technologies, drugs and other therapies for the treatment and prevention of diabetes that are not currently available on the market. Any technological breakthroughs in diabetes treatment or prevention could reduce the potential market for V-Go or render V-Go obsolete altogether, which would significantly reduce our sales.
Because of the size of the Type 2 diabetes market, we anticipate that companies will continue to dedicate significant resources to developing competitive products, including both drugs and devices. The frequent introduction of non-insulin drugs, for example, may delay the introduction of insulin to patients and create market confusion for us to capture the prescribers’ or payors’ attention or reduce our ability to capture sufficient patient share to realize our business objectives. In addition, the entry of multiple new products or the loss of market exclusivity on some diabetes drugs, including insulin delivered in pens, may lead some of our competitors to employ pricing strategies that could adversely affect the pricing of our products. If a competitor develops a product that is similar or is perceived to be superior to V-Go, or if a competitor employs strategies that place downward pressure on pricing within our industry, our sales may decline significantly or may not increase in line with our anticipated levels.
If we are unable to leverage our current sales and marketing infrastructure, we may fail to increase our sales to meet our anticipated levels.
In order to reduce our expenses, in February 2016, we underwent a reduction-in-force that reduced our sales force by 59%, from 63 individuals to 26. We had an average of 28 field-based sales professionals through the rest
38
Table of Contents
of 2016 after the reduction-in-force. Generally speaking, each sales professional covers one prioritized territory. While we intend to average 28 field-based sales professionals per year, this number is expected to fluctuate based on voluntary and involuntary turnover. Generally speaking, each sales professional covers one prioritized territory. We currently utilize sales professionals along with an inside sales team to focus on select healthcare providers with the most revenue potential. Our profitability will depend on the success of this new sales model.
Because we began commercialization of V-Go in 2012, and because our current sales force is not deployed in every state or major market in the United States, we have less experience marketing and selling our products, as well as training healthcare providers and new customers on the use of V-Go compared to other Type 2 diabetes companies. We derive all of our revenue from the sale of V-Go and we expect that this will continue for the next several years. As a result, our financial condition and operating results are and will continue to be highly dependent on the ability of our sales representatives to adequately promote, market and sell V-Go and the ability of our sales force and other training personnel to successfully train healthcare providers and new customers on the use of V-Go. If our sales and marketing representatives or training personnel fail to achieve their objectives, our sales could decrease or may not increase at levels that are in line with our anticipated levels.
A key element of our business strategy is for our sales and marketing infrastructure to drive adoption of our products. The majority of patients using V-Go are trained to use the device by their healthcare provider who has been trained by our sales force using a “train the trainer” approach. Our sales force trains physicians, physicians’ assistants, nurse practitioners and any other staff in a healthcare provider’s office who interact with patients, on how V-Go works and how to train their patients to properly use V-Go. We can expect to face challenges in recruiting and hiring top personnel as we manage our sales and marketing infrastructure and work to retain the individuals who make up those networks due to the very competitive diabetes industry. If a sales and marketing representative were to depart and be retained by one of our competitors, we may fail to prevent them from helping competitors solicit business from our existing customers, which could further adversely affect our sales. In addition, if we are not able to maintain a sufficient network of training and customer care personnel, we may not be able to successfully train healthcare providers to train new patients on the use of V-Go, which could delay new sales and harm our reputation.
As we increase our sales and marketing expenditures with respect to existing or planned products, we will need to further expand the reach of our sales and marketing networks. Our future success will depend largely on our ability to continue to hire, train, retain and motivate skilled sales and marketing representatives with significant industry-specific knowledge in various areas, such as diabetes treatment techniques and technologies, as well as the competitive landscape for our products. Recently hired sales representatives require training and take time to achieve full productivity. If we fail to train recent hires adequately, or if we experience high turnover in our sales force in the future, we cannot be certain that new hires will become as productive as may be necessary to maintain or increase our sales. In addition, the expansion of our sales and marketing personnel will continue to place significant burdens on our management team.
If important assumptions about the potential market for our products are inaccurate, or if we have failed to understand what people with Type 2 diabetes are seeking in a treatment, we may not be able to increase our revenue or achieve profitability.
Our business strategy was developed based on a number of important assumptions about the diabetes market in general, and the Type 2 diabetes market in particular, any one or more of which may prove to be inaccurate. For example, we believe that the benefits of V-Go as compared to other common insulin delivery devices, such as traditional insulin injection pens, will continue to drive growth in the market for V-Go. In addition, we believe the incidence of diabetes in the United States and worldwide is increasing rapidly. However, each of these trends is uncertain and limited sources exist to obtain reliable market data. The actual incidence of diabetes, and the actual demand for our products or competitive products, could differ materially from our anticipated levels if our assumptions are incorrect. In addition, our strategy of focusing exclusively on patients with Type 2 diabetes who
39
Table of Contents
require insulin may limit our ability to increase sales or achieve profitability, especially if there are any significant clinical breakthroughs or products or drug introductions that significantly delay or reduce the need for insulin therapy in patients with Type 2 diabetes.
Manufacturing risks, including risks related to manufacturing in China, may adversely affect our ability to manufacture our products and could reduce our gross margin and our profitability.
Our business strategy depends on our ability to manufacture our current and future products in sufficient quantities and on a timely basis so as to meet consumer demand, while adhering to product quality standards, complying with regulatory requirements and managing manufacturing costs. We are subject to numerous risks relating to our manufacturing capabilities, including:
| • | quality or reliability defects in product components that we source from third-party suppliers; |
| • | our inability to secure product components in a timely manner, in sufficient quantities or on commercially reasonable terms; |
| • | our failure to increase production of products to meet demand; |
| • | our inability to modify production lines to enable us to efficiently produce future products or implement changes in current products in response to regulatory requirements; |
| • | difficulty identifying and qualifying alternative suppliers for components in a timely manner; and |
| • | potential damage to or destruction of our manufacturing equipment or manufacturing facility. |
In addition, we rely on our contract manufacturer in Southern China to manufacture V-Go. As a result, our business is subject to risks associated with doing business in China, including:
| • | adverse political and economic conditions, particularly those potentially negatively affecting the trade relationship between the United States and China; |
| • | trade protection measures, such as tariff increases, and import and export licensing and control requirements; |
| • | potentially negative consequences from changes in tax laws; |
| • | difficulties associated with the Chinese legal system, including increased costs and uncertainties associated with enforcing contractual obligations in China; |
| • | historically lower protection of intellectual property rights; |
| • | unexpected or unfavorable changes in regulatory requirements; |
| • | changes and volatility in currency exchange rates; |
| • | possible patient or physician preferences for more established pharmaceutical products and medical devices manufactured in the United States; and |
| • | difficulties in managing foreign relationships and operations generally. |
These risks are likely to be exacerbated by our limited experience with our current products and manufacturing processes. As demand for our products increases, we will have to invest additional resources to purchase components, hire and train employees, and enhance our manufacturing processes. If we fail to increase our production capacity efficiently, our sales may not increase in line with our forecasts and our operating margins could fluctuate or decline. In addition, although we expect some of our product candidates in development to share product features and components with V-Go, manufacturing of these product candidates may require the modification of our production lines, the hiring of specialized employees, the identification of new suppliers for specific components, or the development of new manufacturing technologies. It may not be possible for us to manufacture these product candidates at a cost or in quantities sufficient to make these product candidates commercially viable. Any of these factors may affect our ability to manufacture our products and could reduce our gross margin and profitability.
40
Table of Contents
We depend on a limited number of third-party suppliers for some of the components of V-Go, and the loss of any of these suppliers, or their inability to provide us with an adequate supply of materials, could harm our business.
We rely on a limited number of third-party suppliers to supply components of V-Go. For our business strategy to be successful, our suppliers must be able to provide us with components and finished products in sufficient quantities, in compliance with regulatory requirements and quality control standards, in accordance with agreed upon specifications, at acceptable costs and on a timely basis. Increases in our product sales, whether forecasted or unanticipated, could strain the ability of our suppliers to deliver an increasingly large supply of components in a manner that meets these various requirements.
We do not have long-term supply agreements with most of our suppliers and, in many cases, we make our purchases on a purchase order basis. Under most of our supply agreements, we have no obligation to buy any given quantity of products, and our suppliers have no obligation to manufacture for us or sell to us any given quantity of products. As a result, our ability to purchase adequate quantities of the components for our products may be limited. Additionally, our suppliers may encounter problems that limit their ability to manufacture components for us, including financial difficulties or damage to their manufacturing equipment or facilities. If we fail to obtain sufficient quantities of high quality components to meet demand on a timely basis, we could lose customer orders, our reputation may be harmed and our business could suffer.
We generally use a small number of suppliers for our product, some parts and components of which are purchased from single-source vendors. Depending on a limited number of suppliers exposes us to risks, including limited control over pricing, availability, quality and delivery schedules. Moreover, due to the recent commercialization of our products and the limited amount of our sales to date, we do not have long-standing relationships with our manufacturers and may not be able to convince suppliers to continue to make components available to us unless there is demand for such components from their other customers. If any one or more of our suppliers cease to provide us with sufficient quantities of components in a timely manner or on terms acceptable to us, we would have to seek alternative sources of supply. Because of factors such as the proprietary nature of our product, our quality control standards and regulatory requirements, we cannot quickly engage additional or replacement suppliers for some of our critical components. Failure of any of our suppliers to deliver products at the level our business requires would limit our ability to meet our sales commitments, which could harm our reputation and could have a material adverse effect on our business. We may also have difficulty obtaining similar components from other suppliers that meet the requirements of the FDA or other regulatory agencies, and the failure of our suppliers to comply with strictly enforced regulatory requirements could expose us to regulatory action including warning letters, product recalls, termination of distribution, product seizures or civil penalties. It could also require us to cease using the components, seek alternative components or technologies and modify our products to incorporate alternative components or technologies, which could result in a requirement to seek additional regulatory approvals. Any disruption of this nature or increased expenses could harm our commercialization efforts and adversely affect our operating results.
We operate at facilities in three locations, and any disruption at any of these facilities could harm our business.
Our principal offices are located in Bridgewater, New Jersey, and our only manufacturing operations are located at a contract manufacturing facility in Southern China. We also operate a facility in Shrewsbury, Massachusetts, which we primarily use for research and development. Substantially all of our operations are conducted at these locations, including our manufacturing processes, research, development and engineering activities, customer and technical support and management and administrative functions. In addition, substantially all of our inventory of component supplies and finished goods is held at these locations or held with our distributors.
Vandalism, terrorism or a natural or other disaster, such as an earthquake, fire or flood, at any of these facilities could damage or destroy our manufacturing equipment or our inventory of component supplies or finished goods,
41
Table of Contents
cause substantial delays in our operations, result in the loss of key information and cause us to incur additional expenses. Our contract manufacturing facility in Southern China is our only manufacturing facility, and if damaged or rendered inoperable or inaccessible due to political, social, or economic upheaval or due to natural or other disasters, would make it difficult or impossible for us to manufacture our products for a period of time and may lead to a loss of customers and significant impairment of our financial condition and operating results.
We take precautions to safeguard these facilities, including acquiring insurance, employing back-up generators, adopting health and safety protocols and utilizing off-site storage of computer data. Our insurance may not cover our losses in any particular case. In addition, regardless of the level of insurance coverage, damage to our facilities may harm our business, financial condition and operating results.
If we do not enhance our product offerings through our research, development and engineering efforts, including the successful commercialization of our pre-fill V-Go, we may fail to effectively compete in our market or become profitable.
In order to increase our sales and market share in the Type 2 diabetes market, we must enhance and broaden our product offerings, including by commercializing our pre-fill V-Go, in response to the evolving demands of people with Type 2 diabetes who require insulin and healthcare providers and competitive pressures from new technologies and market participants. We may not be successful in developing, obtaining regulatory approval for, or marketing our product candidates, including our pre-fill V-Go. In addition, notwithstanding our market research efforts, our future products may not be accepted by consumers, their caregivers, healthcare providers or third-party payors who reimburse consumers for our product. The success of any of our product candidates, including our pre-fill V-Go, will depend on numerous factors, including our ability to:
| • | identify the product features that people with Type 2 diabetes, their caregivers and healthcare providers are seeking in an insulin treatment and successfully incorporate those features into our product; |
| • | develop and introduce our product candidates in sufficient quantities and in a timely manner; |
| • | offer products at a price that is competitive with that of other products on the market; |
| • | adequately protect our intellectual property and avoid infringing upon the intellectual property rights of third parties; |
| • | demonstrate the safety and efficacy of our product candidates; |
| • | secure adequate financing to fund the research, development, engineering and marketing and sales efforts necessary to commercialize new product offerings; and |
| • | obtain the necessary regulatory approvals for our product candidates. |
With respect to our pre-fill V-Go in particular, we anticipate that we will need to seek additional sources of capital to complete its development and commercialization, which we cannot assure you we will be able to procure at reasonable terms, if at all. Any delays in our anticipated product launches may significantly impede our ability to successfully compete in our markets. In particular, such delays could cause customers to delay or forego purchases of our product, or to purchase our competitors’ products. Even if we are able to successfully develop proposed product candidates when anticipated, these product candidates, including our pre-fill V-Go, may not produce sales in excess of the costs of development, and they may be quickly rendered obsolete by changing consumer preferences or the introduction by our competitors of products embodying new technologies or features.
The safety and efficacy of our products is not supported by long-term clinical data, which could limit sales, and our products could cause unforeseen negative effects.
V-Go, the only product we currently market in the United States, has received pre-market clearance under Section 510(k) of the U.S. Federal Food, Drug, and Cosmetic Act, or FDCA. This process is shorter and typically
42
Table of Contents
requires the submission of less supporting documentation than other FDA approval processes and does not always require long-term clinical studies. As a result, we currently lack significant published long-term clinical data supporting the safety and efficacy of our products and the benefits they offer that might have been generated in connection with other approval processes. For these reasons, people with Type 2 diabetes who require insulin and their healthcare providers may be slower to adopt or recommend our product, we may not have comparative data that our competitors have or are generating and third-party payors may not be willing to provide coverage or reimbursement for our product. Further, future studies or clinical experience may indicate that treatment with our products is not superior to treatment with competitive products. Such results could slow the adoption of our products and significantly reduce our sales, which could prevent us from achieving our forecasted sales targets or achieving or sustaining profitability. Moreover, if future results and experience indicate that our products cause unexpected or serious complications or other unforeseen negative effects, we could be subject to mandatory product recalls, suspension or withdrawal of FDA clearance or approval, significant legal liability or harm to our business reputation.
Undetected errors or defects in V-Go or our future product candidates could harm our reputation, decrease market acceptance of our products or expose us to product liability claims.
V-Go or our future product candidates may contain undetected errors or defects. Disruptions or other performance problems with V-Go or these other product candidates may damage our customers’ businesses and could harm our reputation. If that occurs, we may incur significant costs, the attention of our key personnel could be diverted or other significant customer relations problems may arise. We may also be subject to warranty and liability claims for damages related to errors or defects in V-Go or our future product candidates. A material liability claim or other occurrence that harms our reputation or decreases market acceptance of V-Go or these other product candidates could harm our business and operating results.
The sale and use of V-Go or our other product candidates could lead to the filing of product liability claims if someone were to allege that V-Go or one of our product candidates contained a design or manufacturing defect. A product liability claim could result in substantial damages and be costly and time consuming to defend, either of which could materially harm our business or financial condition. While we currently maintain product liability insurance covering claims up to $5 million per incident, we cannot assure you that such insurance would adequately protect our assets from the financial impact of defending a product liability claim. Any product liability claim brought against us, with or without merit, could increase our product liability insurance rates or prevent us from securing insurance coverage in the future.
We may enter into strategic collaborations, in-licensing arrangements or alliances with third parties that may not result in the development of commercially viable products or the generation of significant future revenue.
In the ordinary course of our business, we may enter into strategic collaborations, in-licensing arrangements or alliances to develop product candidates and to pursue new markets. Proposing, negotiating and implementing strategic collaborations, in-licensing arrangements or alliances may be a lengthy and complex process. Other companies, including those with substantially greater financial, marketing, sales, technology or other business resources, may compete with us for these opportunities or arrangements. We may not identify, secure, or complete any such transactions or arrangements in a timely manner, on a cost-effective basis, on acceptable terms or at all. We have limited institutional knowledge and experience with respect to these business development activities, and we may also not realize the anticipated benefits of any such transaction or arrangement. In particular, these collaborations may not result in the development of products that achieve commercial success or result in significant revenue and could be terminated prior to developing any products.
Additionally, we may not be in a position to exercise sole decision making authority regarding the transaction or arrangement, which could create the potential risk of creating impasses on decisions, and our collaborators may have economic or business interests or goals that are, or that may become, inconsistent with our business interests or goals. We have limited control over the amount and timing of resources that our current collaborators
43
Table of Contents
or any future collaborators devote to our collaborators’ or our future products. Disputes between us and our collaborators may result in litigation or arbitration that would increase our expenses and divert the attention of our management. Further, these transactions and arrangements are contractual in nature and may be terminated or dissolved under the terms of the applicable agreements and, in such event, we may not continue to have rights to the products relating to such transaction or arrangement or may need to purchase such rights at a premium.
We may seek to grow our business through acquisitions of complementary products or technologies, and the failure to manage acquisitions, or the failure to integrate them with our existing business, could impair our ability to execute our business strategies.
From time to time, we may consider opportunities to acquire other products or technologies that may enhance our product platform or technology, expand the breadth of our markets or customer base, or advance our business strategies. Potential acquisitions involve numerous risks, including:
| • | problems assimilating the acquired products or technologies; |
| • | issues maintaining uniform standards, procedures, controls and policies; |
| • | unanticipated costs associated with acquisitions; |
| • | diversion of management’s attention from our existing business; |
| • | risks associated with entering new markets in which we have limited or no experience; and |
| • | increased legal and accounting costs relating to the acquisitions or compliance with regulatory matters. |
We have no current commitments with respect to any acquisition. We do not know if we will be able to identify acquisitions we deem suitable, whether we will be able to successfully complete any such acquisitions on favorable terms or at all, or whether we will be able to successfully integrate any acquired products or technologies. Our inability to integrate any acquired products or technologies effectively could impair our ability to execute our business strategies.
If there are significant disruptions in our information technology systems, our reputation, financial condition and operating results could be harmed.
The efficient operation of our business depends on our information technology systems. We rely on our information technology systems to effectively manage sales and marketing data, accounting and financial functions, inventory management, product development tasks, research, development and engineering data, customer service and technical support functions. Our information technology systems are vulnerable to damage or interruption from earthquakes, fires, floods and other natural disasters, terrorist attacks, attacks by computer viruses or hackers, power losses, and computer system or data network failures.
The failure of our or our service providers’ information technology systems to perform as we anticipate or our failure to effectively implement new information technology systems, could disrupt our operations, which could have a negative impact on our reputation, financial condition and operating results.
If we fail to properly manage our anticipated growth, our business could suffer.
We expect that any potential growth in our business will place a significant strain on our management team and on our financial resources. Failure to manage our growth effectively could cause us to misallocate management or financial resources, and result in losses or weaknesses in our infrastructure. Additionally, our anticipated growth will increase the demands placed on our suppliers, resulting in an increased need for us to manage our suppliers and monitor for quality assurance. Any failure by us to manage our growth effectively could impair our ability to achieve our business objectives.
44
Table of Contents
We depend on the knowledge and skills of our senior management and other key employees, and if we are unable to retain and motivate them or recruit additional qualified personnel, our business may suffer.
We have benefited substantially from the leadership and performance of our senior management, as well as other key employees. Our success will depend on our ability to retain our current management and key employees, and to attract and retain qualified personnel in the future. Competition for senior management and key employees in our industry is intense and we cannot guarantee that we will be able to retain our personnel or attract new, qualified personnel. The loss of the services of members of our senior management or key employees could prevent or delay the implementation and completion of our strategic objectives, or divert management’s attention to seeking qualified replacements. We do not maintain key man life insurance on any of our senior management or key employees. Each of our executive officers may terminate employment without notice and without cause or good reason. Our executive officers are subject to non-competition agreements. Accordingly, the adverse effect resulting from the loss of our senior management could be compounded by our inability to prevent them from competing with us.
In addition, the sale of V-Go is logistically complex, requiring us to maintain a highly integrated, extensive sales, marketing and training infrastructure consisting of sales and marketing representatives, training personnel and customer care personnel. We face considerable challenges in recruiting, training, managing, motivating and retaining the members of these teams, including managing geographically dispersed efforts. These challenges are exacerbated by the fact that our strategic plan requires us to rapidly grow our sales, with limited marketing and training infrastructure growth, while generating increased demand for our product. If we fail to maintain and grow a dedicated team of sales representatives and are unable to retain our sales and marketing, managed care, medical and other personnel, we could fail to take advantage of an opportunity to enhance our brand recognition and grow our revenue.
Risks Related to Our Financial Condition and Capital Requirements
Our future capital needs are uncertain and we may need to raise additional funds in the future, and these funds may not be available on acceptable terms or at all.
At December 31, 2016, we had $9.9 million in cash and cash equivalents. We believe that our cash on hand will be sufficient to satisfy our liquidity requirements through March 2017. The continued growth of our business, including the expansion of our research, development and engineering activities, and our efforts to commercialize our pre-fill V-Go will continue to significantly increase our expenses. In addition, the amount of our future product sales is difficult to predict and actual sales may not be in line with our forecasts. As a result, we will need to raise additional capital, which may not be available on reasonable terms, if at all. Our future capital requirements will depend on many factors, including:
| • | the revenue generated by sales of V-Go and any other future product candidates that we may develop and commercialize; |
| • | the costs associated with expanding our sales and marketing infrastructure; |
| • | the expenses we incur in maintaining our manufacturing facility and adding further manufacturing equipment and capacity; |
| • | the cost associated with developing and commercializing our proposed products or technologies, including our pre-fill V-Go; |
| • | the cost of obtaining and maintaining regulatory clearance or approval for our current or future products; |
| • | the cost of ongoing compliance and regulatory requirements; |
| • | expenses we incur in connection with potential litigation or governmental investigations; |
| • | anticipated or unanticipated capital expenditures; and |
| • | unanticipated general and administrative expenses. |
45
Table of Contents
If we issue equity or debt securities to raise additional funds, our existing stockholders may experience dilution, and the new equity or debt securities may have rights, preferences and privileges senior to those of our existing stockholders. In addition, if we raise additional funds through collaborations, licensing, joint ventures, strategic alliances, partnership arrangements or other similar arrangements, it may be necessary to relinquish valuable rights to our potential future products or proprietary technologies, or grant licenses on terms that are not favorable to us.
If we are unable to raise additional capital, we may not be able to expand our sales and marketing infrastructure, enhance our current products or develop new products, take advantage of future opportunities, or respond to competitive pressures, changes in supplier relationships, or unanticipated changes in customer demand. Any of these events could adversely affect our ability to achieve our strategic objectives and impact our ability to continue as a going concern.
Our operating results may fluctuate significantly from quarter to quarter.
We began commercial sales of V-Go in the first quarter of 2012. Due to our limited operating history, there has been and there may continue to be meaningful variability in our operating results among quarters, as well as within each quarter. Our operating results, and the variability of these operating results, will be affected by numerous factors, including:
| • | our ability to increase sales of V-Go and to commercialize and sell our future products, if any, and the number of our products sold in each quarter; |
| • | acceptance of our products by people with Type 2 diabetes who require insulin, their caregivers, healthcare providers and third-party payors; |
| • | the pricing of our products and competitive products, the effect of third-party coverage and reimbursement policies, and the amount and level of sales discounts or rebates required to obtain or retain effective third-party payor coverage and reimbursement; |
| • | our ability to establish and grow an effective sales and marketing infrastructure; |
| • | the amount of, and the timing of the payment for, insurance deductibles required to be paid by patients and potential patients under their existing insurance plans; |
| • | interruption in the manufacturing or distribution of our product; |
| • | seasonality and other factors affecting the timing of purchases of our product; |
| • | timing of new product offerings, acquisitions, licenses or other significant events by us or our competitors; |
| • | the ability of our suppliers to timely provide us with an adequate supply of components that meet our requirements; |
| • | regulatory clearance or approvals affecting our products or those of our competitors; |
| • | changes in healthcare rules, coverage and reimbursement under government healthcare programs, including Medicare and Medicaid; and |
| • | the timing of revenue recognition associated with our product sales pursuant to applicable accounting standards. |
As a result of our limited operating history, and due to the complexities of the industry in which we operate, it will be difficult for us to forecast demand for our current or future products with any degree of certainty, which means it will be difficult for us to forecast our sales as well as production or inventory requirements. In addition, we will be significantly increasing our operating expenses as we expand our business. Accordingly, we may experience substantial variability in our operating results from quarter to quarter, including unanticipated
46
Table of Contents
quarterly losses. If our quarterly or annual operating results fall below the expectations of investors or securities analysts, the price of our common stock could decline substantially. Furthermore, any quarterly or annual fluctuations in our operating results may, in turn, cause the price of our common stock to fluctuate substantially. We believe that quarterly comparisons of our financial results are not necessarily meaningful and should not be relied upon as an indication of our future performance.
We may not be able to generate sufficient cash to service our credit facility with Capital Royalty Group. If we fail to comply with the obligations under our credit facility, the lender may be able to accelerate amounts owed under the facility and may foreclose upon the assets securing our obligations.
As of December 31, 2016, the aggregate principal amount of our term loan with Capital Royalty Group, or CRG, and certain of its affiliates, or our Term Loan, was $53.9 million. On February 14, 2017, we entered into an agreement with CRG and WCAS Capital Partners IV, L.P., or WCAS, to convert a total of $27.5 million of the outstanding principal amount of our debt, including the Term Loan into shares of our to-be-created Series A Convertible Preferred Stock, at a price set forth in the executed definitive documents. Borrowings under our credit facility are secured by substantially all of our assets, including our material intellectual property. Our ability to make scheduled payments or to refinance our debt obligations depends on numerous factors, including the amount of our cash reserves and our actual and projected financial and operating performance. These amounts and our performance are subject to numerous risks, including the risks in this section, some of which may be beyond our control. We cannot assure you that we will maintain a level of cash reserves or cash flows from operating activities sufficient to permit us to pay the principal, premium, if any, and interest on our existing or future indebtedness. If our cash flows and capital resources are insufficient to fund our debt service obligations, we may be forced to reduce or delay capital expenditures, sell assets or operations, seek additional capital or restructure or refinance our indebtedness. We cannot assure you that we would be able to take any of these actions, or that these actions would permit us to meet our scheduled debt service obligations. In addition, in the event of our breach of the Term Loan, we may be required to repay any outstanding amounts earlier than anticipated. If we fail to comply with our obligations under the Term Loan, the lender would be able to accelerate the required repayment of amounts due and, if they are not repaid, could foreclose upon our assets securing our obligations under the Term Loan. In addition, certain events of default have already occurred under the term loan with CRG in 2015 and we cannot assure you similar future events of default will not occur under the Term Loan. For more information on the Term Loan, see “Management’s Discussion and Analysis of Financial Condition and Results of Operations—Indebtedness—Senior Secured Debt”.
Our Term Loan contains a financial covenant that may limit our operating flexibility.
Our Term Loan contains a restrictive covenant that requires us to maintain an end-of-day balance of $5.0 million in cash or cash equivalents, which may limit our ability to engage in new lines of business, make certain investments, pay dividends, or enter into various transactions. We therefore may not be able to engage in any of the foregoing transactions unless we obtain the consent of the lender or terminate our Term Loan. Furthermore, there is no guarantee that future working capital, borrowings or equity financing will be available to repay or refinance the amounts outstanding under the agreement. On February 9, 2017, we entered into an agreement with CRG to, among other things, reduce the amount required by this liquidity covenant to $2.0 million. The minimum cash balance covenant will, however, revert back to $5.0 million if we are not able to consummate an underwritten public offering with gross proceeds of at least $40.0 million prior to December 31, 2017. For additional information about the Term Loan, see “Management’s Discussion and Analysis of Financial Condition and Results of Operations—Indebtedness—Senior Secured Debt.”
Prolonged negative economic conditions could adversely affect us, our customers and suppliers, which could harm our financial condition.
We are subject to the risks arising from adverse changes in general economic and market conditions. Economic turmoil and uncertainty about future economic conditions could adversely impact our existing and potential
47
Table of Contents
customers, the financial ability of health insurers to pay claims, patients’ ability or willingness to pay out-of- pocket costs, our ability to obtain financing for our operations on favorable terms, or at all, and our relationships with key suppliers.
The use of our net operating loss carryforwards and research tax credits may be limited.
Our net operating loss carryforwards and any future research and development tax credits may expire and not be used. As of December 31, 2016, we had U.S. net operating loss carryforwards of approximately $337.2 million. Our net operating loss carryforwards will begin expiring in 2028 if we have not used them prior to that time. Additionally, our ability to use any net operating loss and credit carryforwards to offset taxable income or tax, respectively, in the future will be limited under Internal Revenue Code Sections 382 and 383, respectively, if we have a cumulative change in ownership of more than 50% within a three year period. The completion of a public offering, together with private placements and other transactions that have occurred, may trigger, or may have already triggered, such an ownership change. In addition, since we will need to raise substantial additional funding to finance our operations, we may undergo further ownership changes in the future. We have never completed an analysis as to whether such a change of ownership has occurred, but in such an event, we will be limited regarding the amount of net operating loss carryforwards and research tax credits that could be utilized annually in the future to offset taxable income or tax, respectively. Any such annual limitation may significantly reduce the utilization of the net operating loss carryforwards and research tax credits before they expire. In addition, certain states have suspended use of net operating loss carryforwards for certain taxable years, and other states are considering similar measures. As a result, we may incur higher state income tax expense in the future. Depending on our future tax position, continued suspension of our ability to use net operating loss carryforwards in states in which we are subject to income tax could have an adverse impact on our results of operations and financial condition.
Risks Related to Intellectual Property
Intellectual property rights may not provide adequate protection, which may permit third parties to compete against us more effectively.
Our success depends significantly on our ability to maintain and protect our proprietary rights in the technologies and inventions used in or embodied by our product. To protect our proprietary technology, we rely on patent protection, as well as a combination of copyright, trade secret and trademark laws, as well as nondisclosure, confidentiality, and other contractual restrictions in our manufacturing, consulting, employment and other third party agreements. These legal means afford only limited protection, however, and may not adequately protect our rights or permit us to gain or keep any competitive advantage.
If we are unable to secure sufficient patent protection for our proprietary rights in our products and processes, and to adequately maintain and protect our existing and new rights, competitors will be able to compete against us more effectively, and our business will suffer.
The process of applying for patent protection itself is time consuming and expensive and we cannot assure you that we have prepared or will be able to prepare, file and prosecute all necessary or desirable patent applications at a reasonable cost or in a timely manner. It is also possible that we will fail to identify patentable aspects of inventions made in the course of development and commercialization activities before it is too late to obtain patent protection on them. In addition, our patents and applications may not be prosecuted and enforced in a manner consistent with the best interests of our business. It is possible that defects of form in the preparation or filing of our patents or patent applications may exist, or may arise in the future, for example, with respect to proper priority claims, inventorship, claim scope or patent term adjustments. Moreover, we cannot assure you that all of our pending patent applications will issue as patents or that, if issued, they will issue in a form that will be advantageous to us. We own numerous issued patents and pending patent applications that relate to insulin- delivery methods and devices. The rights granted to us under our patents, however, including prospective rights
48
Table of Contents
sought in our pending patent applications, may not be of sufficient scope or strength to provide us with any meaningful exclusivity or commercial advantage, and competitors may be able to design around our patents or develop products that provide outcomes comparable to ours without infringing on our intellectual property rights. In addition, we may in the future be subject to claims by our former employees or consultants asserting an ownership right in our patents or patent applications, as a result of the work they performed on our behalf. If any of our patents are challenged, invalidated or legally circumvented by third parties, and if we do not exclusively own other enforceable patents protecting our product, competitors could market products and use processes that are substantially similar to, or superior to, ours, and our business will suffer.
The patent position of medical technology companies is generally highly uncertain. The degree of patent protection we require may be unavailable or severely limited in some cases and may not adequately protect our rights or permit us sufficient exclusivity, or to gain or keep our competitive advantage. For example:
| • | we might not have been the first to invent or the first inventor to file patent applications on the inventions covered by each of our pending patent applications and issued patents; |
| • | others may independently develop similar or alternative technologies or duplicate any of our technologies; |
| • | other companies hold patents stating broad claims in the drug delivery device field which, if construed to cover our products and held to be valid and enforceable, could have a material adverse effect on our business; |
| • | any patents we obtain or license from others in the future may not encompass commercially viable products, may not provide us with any competitive advantages or may be challenged by third parties; |
| • | any patents we obtain or license from others in the future may not be valid or enforceable; and |
| • | we may not develop additional proprietary technologies that are patentable. |
Patents have a limited lifespan. In the United States, the natural expiration of a utility patent typically is 20 years after it is filed. Various extensions may be available; however, the life of a patent, and the protection it affords, is limited. Without patent protection for our insulin-delivery methods and devices, we may be open to competition from generic versions of such methods and devices.
Changes in patent law could diminish the value of patents in general, thereby impairing our ability to protect our products and our technologies.
Patent reform legislation may increase the uncertainties and costs surrounding the prosecution of our patent applications and the enforcement or defense of our issued patents. On September 16, 2011, the Leahy- Smith America Invents Act, or the Leahy-Smith Act, was signed into law. The Leahy-Smith Act includes a number of significant changes to U.S. patent law. These include provisions that affect the way patent applications are prosecuted, redefine prior art, may affect patent litigation, and switch the U.S. patent system from a “first-to- invent” system to a “first-to-file” system. Under a “first-to-file” system, assuming the other requirements for patentability are met, the first inventor to file a patent application generally will be entitled to the patent on an invention regardless of whether another inventor had made the invention earlier. The U.S. Patent and Trademark Office, or USPTO, recently developed new regulations and procedures to govern administration of the Leahy- Smith Act, and many of the substantive changes to patent law associated with the Leahy-Smith Act, in particular, the first-to-file provisions, only became effective on March 16, 2013. Accordingly, it is not clear what, if any, impact the Leahy-Smith Act will have on the operation of our business. However, the Leahy-Smith Act and its implementation could increase the uncertainties and costs surrounding the prosecution of our patent applications and the enforcement or defense of our issued patents.
In addition, patent reform legislation may pass in the future that could lead to additional uncertainties and increased costs surrounding the prosecution, enforcement, and defense of our patents and applications.
49
Table of Contents
Furthermore, the U.S. Supreme Court and the U.S. Court of Appeals for the Federal Circuit have made, and will likely continue to make, changes in how the patent laws of the United States are interpreted. Similarly, foreign courts have made, and will likely continue to make, changes in how the patent laws in their respective jurisdictions are interpreted. We cannot predict future changes in the interpretation of patent laws or changes to patent laws that might be enacted into law by United States and foreign legislative bodies. Those changes may materially affect our patents or patent applications and our ability to obtain and enforce or defend additional patent protection in the future.
Obtaining and maintaining our patent protection depends on compliance with various procedural, document submission, fee payment and other requirements imposed by governmental patent agencies, and our patent protection could be reduced or eliminated for non-compliance with these requirements.
Moreover, the USPTO and various foreign governmental patent agencies require compliance with a number of procedural, documentary, fee payment and other similar provisions during the patent application process. In addition, periodic maintenance fees on issued patents often must be paid to the USPTO and foreign patent agencies over the lifetime of the patent. While an unintentional lapse can in many cases be cured by payment of a late fee or by other means in accordance with the applicable rules, there are situations in which noncompliance can result in abandonment or lapse of the patent or patent application, resulting in partial or complete loss of patent rights in the relevant jurisdiction. Non-compliance events that could result in abandonment or lapse of a patent or patent application include, but are not limited to, failure to respond to official actions within prescribed time limits, non-payment of fees and failure to properly legalize and submit formal documents. If we fail to maintain the patents and patent applications covering our products or procedures, we may not be able to stop a competitor from marketing products that are the same as or similar to our products and technologies.
We may not be able to adequately protect our intellectual property rights throughout the world.
Filing, prosecuting and defending patents on our products and technologies in all countries throughout the world would be prohibitively expensive. The requirements for patentability may differ in certain countries, particularly developing countries, and the breadth of patent claims allowed can be inconsistent. In addition, the laws of some foreign countries may not protect our intellectual property rights to the same extent as laws in the United States. Consequently, we may not be able to prevent third parties from practicing our inventions in all countries outside the United States. Competitors may use our technologies in jurisdictions where we have not obtained patent protection to develop their own products and, further, may export otherwise infringing products to territories where we have patent protection, but enforcement on infringing activities is inadequate.
We do not have patent rights in certain foreign countries in which a market may exist in the future. Moreover, in foreign jurisdictions where we do have patent rights, proceedings to enforce such rights could result in substantial costs and divert our efforts and attention from other aspects of our business, could put our patents at risk of being invalidated or interpreted narrowly, and our patent applications at risk of not issuing, and could provoke third parties to assert claims against us. We may not prevail in any lawsuits that we initiate and the damages or other remedies awarded, if any, may not be commercially meaningful. Thus, we may not be able to stop a competitor from marketing and selling in foreign countries products that are the same as or similar to our product.
We may in the future become involved in lawsuits to protect or enforce our intellectual property, which could be expensive, time consuming and unsuccessful.
The medical device industry has been characterized by frequent and extensive intellectual property litigation. Our competitors or other patent holders may assert that our products and the methods employed in our products are covered by their patents. For example, other companies hold patents stating broad claims in the drug delivery device field which, if construed to cover our products and held to be valid and enforceable, could have a material adverse effect on our business. Although we believe we have adequate defenses available if faced with any
50
Table of Contents
allegations that we infringe third-party patents, it is possible that V-Go could be found to infringe these patents. If our product or methods are found to infringe, we could be prevented from manufacturing or marketing our products.
We do not know whether our competitors or potential competitors have patents, or have applied for, will apply for, or will obtain patents that will prevent, limit or interfere with our ability to make, have made, use, sell, import or export our products. Competitors may infringe our patents or misappropriate or otherwise violate our intellectual property rights. To stop any such infringement or unauthorized use, litigation may be necessary. Our intellectual property has not been tested in litigation. A court may declare our patents invalid or unenforceable, may refuse to stop the other party from using the technology at issue on the grounds that our patents do not cover the technology in question, or may interpret the claims of our patents narrowly, thereby substantially narrowing the scope of patent protection they afford.
In addition, third parties may initiate legal proceedings against us to challenge the validity or scope of our intellectual property rights, or may allege an ownership right in our patents, as a result of their past employment or consultancy with us. Many of our current and potential competitors have the ability to dedicate substantially greater resources to defend their intellectual property rights than we can. Accordingly, despite our efforts, we may not be able to prevent third parties from infringing upon or misappropriating our intellectual property.
Competing products may also be sold in other countries in which our patent coverage might not exist or be as strong. If we lose a foreign patent lawsuit, alleging our infringement of a competitor’s patents, we could be prevented from marketing our products in one or more foreign countries.
Litigation related to infringement and other intellectual property claims such as trade secrets, with or without merit, is unpredictable, can be expensive and time-consuming, and can divert management’s attention from our core business. If we lose this kind of litigation, a court could require us to pay substantial damages, treble damages, and attorneys’ fees, and could prohibit us from using technologies essential to our product, any of which would have a material adverse effect on our business, results of operations, and financial condition. If relevant patents are upheld as valid and enforceable and we are found to infringe, we could be prevented from selling our products unless we can obtain licenses to use technology or ideas covered by such patents. We do not know whether any necessary licenses would be available to us on satisfactory terms, if at all. If we cannot obtain these licenses, we could be forced to design around those patents at additional cost or abandon the products altogether. Furthermore, because of the substantial amount of discovery required in connection with intellectual property litigation, there is a risk that some of our confidential information could be compromised by disclosure during this type of litigation. There could also be public announcements of the results of hearings, motions or other interim proceedings or developments. If securities analysts or investors perceive these results to be negative, it could cause the price of our common stock to decline.
We may be subject to damages resulting from claims that we or our employees have wrongfully used or disclosed alleged trade secrets of our competitors or are in breach of non-competition or non-solicitation agreements with our competitors.
We could in the future be subject to claims that we or our employees have inadvertently or otherwise used or disclosed alleged trade secrets or other proprietary information of former employers, competitors, or other third parties. Although we endeavor to ensure that our employees and consultants do not use the intellectual property, proprietary information, know-how or trade secrets of others in their work for us, we may in the future be subject to claims that we caused an employee to breach the terms of his or her non-competition or non-solicitation agreement, or that we or these individuals have, inadvertently or otherwise, used or disclosed the alleged trade secrets or other proprietary information of a former employer or competitor. Litigation may be necessary to defend against these claims. Even if we are successful in defending against these claims, litigation could result in substantial costs and could be a distraction to management. If our defense to those claims fails, in addition to paying monetary damages, a court could prohibit us from using technologies or features that are essential to our
51
Table of Contents
product, if such technologies or features are found to incorporate or be derived from the trade secrets or other proprietary information of the former employers or other third parties. An inability to incorporate technologies or features that are important or essential to our products may prevent us from selling our product. In addition, we may lose valuable intellectual property rights or personnel. Moreover, any such litigation or the threat thereof may adversely affect our ability to hire employees or contract with independent sales representatives. A loss of key personnel or their work product could hamper or prevent our ability to commercialize our product.
Our trademarks may be infringed or successfully challenged, resulting in harm to our business.
We rely on our trademarks as one means to distinguish our products from the products of our competitors, and we have registered or applied to register many of these trademarks. The USPTO or foreign trademark offices may deny our trademark applications, however, and even if published or registered, these trademarks may be ineffective in protecting our brand and goodwill and may be successfully opposed or challenged. Third parties may oppose our trademark applications, or otherwise challenge our use of our trademarks. In addition, third parties may use marks that are confusingly similar to our own, which could result in confusion among our customers, thereby weakening the strength of our brand or allowing such third parties to capitalize on our goodwill. In such an event, or if our trademarks are successfully challenged, we could be forced to rebrand our product, which could result in loss of brand recognition and could require us to devote resources to advertising and marketing new brands. Our competitors may infringe our trademarks and we may not have adequate resources to enforce our trademark rights in the face of any such infringement.
If we are unable to protect the confidentiality or use of our trade secrets, our competitive position may be harmed.
In addition to patent and trademark protection, we also rely on trade secrets, including unpatented know-how, technology and other proprietary information, to maintain our competitive position. We seek to protect our trade secrets, in part, by entering into non-disclosure and confidentiality agreements with parties who have access to them, such as our manufacturers, consultants and vendors, and our former or current employees. We also enter into invention or assignment agreements with our employees. Despite these efforts, any of these parties may breach the agreements and disclose our trade secrets and other unpatented or unregistered proprietary information. Monitoring unauthorized uses and disclosures of our intellectual property is difficult, and we do not know whether the steps we have taken to protect our intellectual property will be effective. In addition, we may not be able to obtain adequate remedies for any such breaches. Enforcing a claim that a party illegally disclosed or misappropriated a trade secret is difficult, expensive and time-consuming, and the outcome is unpredictable. In addition, some courts inside and outside the United States are less willing or unwilling to protect trade secrets.
Moreover, our competitors may independently develop equivalent knowledge, methods and know-how. Competitors could purchase our products and attempt to replicate some or all of the competitive advantages we derive from our development efforts, willfully infringe our intellectual property rights, design around our protected technology or develop their own competitive technologies that fall outside of our intellectual property rights. If any of our trade secrets were to be lawfully obtained or independently developed by a competitor, we would have no right to prevent them, or those to whom they communicate it, from using that technology or information to compete with us. If our intellectual property is not adequately protected so as to protect our market against competitors’ products and methods, our competitive position could be adversely affected.
Risks Related to Our Legal and Regulatory Environment
Our products and operations are subject to extensive governmental regulation, and failure to comply with applicable requirements could cause our business to suffer.
The medical technology industry is regulated extensively by governmental authorities, principally the FDA and corresponding state regulatory agencies. The regulations are very complex, have become more stringent over
52
Table of Contents
time, and are subject to rapid change and varying interpretations. Regulatory restrictions or changes could limit our ability to carry on or expand our operations or result in higher than anticipated costs or lower than anticipated sales. The FDA and other U.S. governmental agencies regulate numerous elements of our business, including:
| • | product design and development; |
| • | pre-clinical and clinical testing and trials; |
| • | product safety; |
| • | establishment registration and product listing; |
| • | labeling and storage; |
| • | marketing, manufacturing, sales and distribution; |
| • | pre-market clearance or approval; |
| • | servicing and post-marketing surveillance, including reporting of deaths or serious injuries and malfunctions that, if they recurred, could lead to death or serious injury; |
| • | advertising and promotion; |
| • | post-market approval studies; |
| • | product import and export; and |
| • | recalls and field-safety corrective actions. |
Before we can market or sell a new regulated product or a significant modification to an existing product in the United States, we must obtain either clearance under Section 510(k) of the FDCA, grant of a de novo classification request, or approval of a pre-market approval, or PMA, application from the FDA, unless an exemption from pre-market review applies. In the 510(k) clearance process, the FDA must determine that a proposed device is “substantially equivalent” to a device legally on the market, known as a “predicate” device, with respect to intended use, technology and safety and effectiveness, in order to clear the proposed device for marketing. Clinical data is sometimes required to support substantial equivalence. In the de novo request process, the FDA must determine that general and special controls are sufficient to provide reasonable assurance of the safety and effectiveness of a device, which is low to moderate risk and has no predicate. The PMA pathway requires an applicant to demonstrate the safety and effectiveness of the device based on extensive data, including, but not limited to, technical, preclinical, clinical trial, manufacturing and labeling data. The PMA process is typically required for devices that are deemed to pose the greatest risk, such as life-sustaining, life-supporting or implantable devices. Products that are approved through a PMA application generally need FDA approval before they can be modified. Similarly, some modifications made to products cleared through a 510(k) may require a new 510(k). Both the 510(k) and PMA processes can be expensive and lengthy and require the payment of significant fees, unless an exemption applies. The FDA’s 510(k) clearance process usually takes from 3 to 12 months, but may take longer. The FDA’s goal is to review a de novo classification request within 120 days, but the process generally takes longer. The process of obtaining a PMA is much more costly and uncertain than the 510(k) clearance process and generally takes from one to three years, or longer, from the time the application is submitted to the FDA until an approval is obtained. The process of obtaining regulatory clearances or approvals to market a medical device can be costly and time-consuming, and we may not be able to obtain these clearances or approvals on a timely basis, or at all for our proposed products.
We obtained initial pre-market clearance for V-Go under Section 510(k) of the FDCA in December 2010. If the FDA requires us to go through a lengthier, more rigorous examination for future products or modifications to our existing product than we had expected, our product introductions or modifications could be delayed or canceled, which could cause our sales to decline or to not increase in line with our forecasts. In addition, the FDA may determine that future products will require the more costly, lengthy and uncertain PMA process. Although we do not currently market any devices under PMA, the FDA may demand that we obtain a PMA prior to marketing
53
Table of Contents
certain of our future products. Further, even with respect to those future products where a PMA is not required, we cannot assure you that we will be able to obtain the 510(k) clearances with respect to those products.
The FDA can delay, limit or deny clearance or approval of a device for many reasons, including:
| • | we may not be able to demonstrate that our products are safe and effective for their intended users; |
| • | the data from our clinical trials may be insufficient to support clearance or approval; and |
| • | the manufacturing process or facilities we use may not meet applicable requirements. |
In addition, the FDA may change its clearance and approval policies, adopt additional regulations or revise existing regulations, or take other actions which may prevent or delay approval or clearance of our products under development or impact our ability to modify our currently cleared products on a timely basis. Any delay in, or failure to obtain or maintain, clearance or approval for our products under development could prevent us from generating revenue from these products and adversely affect our business operations and financial results. Additionally, the FDA and other regulatory authorities have broad enforcement powers.
Regulatory enforcement or inquiries, or other increased scrutiny on us, could dissuade some customers from using our products and adversely affect our reputation and the perceived safety and efficacy of our product.
Failure to comply with applicable regulations could jeopardize our ability to sell our products and result in enforcement actions such as fines, civil penalties, injunctions, warning letters, recalls of products, delays in the introduction of products into the market, refusal of the FDA or other regulators to grant future clearances or approvals, and the suspension or withdrawal of existing clearances or approvals by the FDA or other regulators. Any of these sanctions could result in higher than anticipated costs or lower than anticipated sales and negatively impact our reputation, business, financial condition and operating results.
Furthermore, we may evaluate international expansion opportunities in the future. If we expand our operations outside of the United States, we will become subject to various additional regulatory and legal requirements under the applicable laws and regulations of the international markets we enter. These additional regulatory requirements may involve significant costs and expenditures and, if we are not able to comply with any such requirements, our international expansion and business could be significantly harmed.
Modifications to our products may require new 510(k) clearances or pre-market approvals, or may require us to cease marketing or recall the modified products until clearances are obtained.
Any modification to a 510(k)-cleared device that could significantly affect its safety or effectiveness, or that would constitute a major change in its intended use, design, or manufacture, requires a new 510(k) clearance or, possibly, a PMA. The FDA requires every manufacturer to make this determination in the first instance, but the FDA may review any manufacturer’s decision. The FDA may not agree with our decisions regarding whether new clearances or approvals are necessary. We have made modifications to our 510(k) cleared product, and have determined based on our review of the applicable FDA guidance that in certain instances new 510(k) clearances or pre-market approvals are not required. If the FDA disagrees with our determination and requires us to submit new 510(k) notifications or PMAs for modifications to our previously cleared or approved products for which we have concluded that new clearances or approvals are unnecessary, we may be required to cease marketing or to recall the modified product until we obtain clearance or approval, and we may be subject to significant regulatory fines or penalties.
If we or our third-party suppliers fail to comply with the FDA’s good manufacturing practice regulations, this could impair our ability to market our products in a cost-effective and timely manner.
We and our third-party suppliers are required to comply with the FDA’s Quality System Regulation, or QSR, which covers the methods and documentation of the design, testing, production, control, quality assurance,
54
Table of Contents
labeling, packaging, sterilization, storage and shipping of our product. The FDA audits compliance with the QSR through periodic announced and unannounced inspections of manufacturing and other facilities. The FDA may impose inspections or audits at any time. If we or our suppliers have significant non-compliance issues or if any corrective action plan that we or our suppliers propose in response to observed deficiencies is not sufficient, the FDA could take enforcement action against us, including any of the following sanctions:
| • | untitled letters, warning letters, fines, injunctions, consent decrees and civil penalties; |
| • | customer notifications or repair, replacement, refunds, recall, detention or seizure of our product; |
| • | operating restrictions or partial suspension or total shutdown of production; |
| • | refusing or delaying our requests for 510(k) clearance or pre-market approval of new products or modified products; |
| • | withdrawing 510(k) clearances or pre-market approvals that have already been granted; |
| • | refusal to grant export approval for our product; or |
| • | criminal prosecution. |
Any of the foregoing actions could have a material adverse effect on our reputation, business, financial condition and operating results.
A recall of our product, or the discovery of serious safety issues with our product, could have a significant adverse impact on us.
The FDA has the authority to require the recall of commercialized products in the event of material deficiencies or defects in design or manufacture or in the event that a product poses an unacceptable risk to health.
Manufacturers may, under their own initiative, recall a product if any material deficiency in a device is found. A government-mandated or voluntary recall by us or one of our distributors could occur as a result of an unacceptable risk to health, component failures, manufacturing errors, design or labeling defects or other deficiencies and issues. Recalls of our products would divert managerial and financial resources and have an adverse effect on our reputation, financial condition and operating results, which could impair our ability to produce our products in a cost-effective and timely manner.
Further, under the FDA’s medical device reporting, or MDR, regulations, we are required to report to the FDA any incident in which our products may have caused or contributed to a death or serious injury or in which our products malfunctioned and, if the malfunction were to recur, would likely cause or contribute to death or serious injury. Repeated product malfunctions may result in a voluntary or involuntary product recall, which could divert managerial and financial resources, impair our ability to manufacture our products in a cost-effective and timely manner and have an adverse effect on our reputation, financial condition and operating results.
Depending on the corrective action we take to redress a product’s deficiencies or defects, the FDA may require, or we may decide, that we will need to obtain new approvals or clearances for the device before we may market or distribute the corrected device. Seeking such approvals or clearances may delay our ability to replace the recalled devices in a timely manner. Moreover, if we do not adequately address problems associated with our devices, we may face additional regulatory enforcement action, including FDA warning letters, product seizure, injunctions, administrative penalties, or civil or criminal fines. We may also be required to bear other costs or take other actions that may have a negative impact on our sales as well as face significant adverse publicity or regulatory consequences, which could harm our business, including our ability to market our products in the future.
Any adverse event involving our products could result in future voluntary corrective actions, such as recalls or customer notifications, or regulatory agency action, which could include inspection, mandatory recall or other
55
Table of Contents
enforcement action. Any corrective action, whether voluntary or involuntary, will require the dedication of our time and capital, distract management from operating our business and may harm our reputation and financial results.
If we are unable to achieve and maintain adequate levels of coverage and reimbursement for V-Go or any future products we may seek to commercialize, their commercial success may be severely hindered.
We have derived all of our revenue from the sale of V-Go in the United States and expect to continue to do so for the next several years. Patients who use V-Go generally rely on third-party payors, including governmental healthcare programs, such as Medicare and Medicaid, and commercial health insurers, health maintenance organizations and other healthcare-related organizations, to reimburse all or part of the costs associated with V- Go. Successful sales of V-Go and any future products depend, therefore, on the availability of adequate coverage and reimbursement from third-party payors.
Securing coverage for new technologies is challenging and uncertain. Third-party payors render coverage decisions based upon clinical and economic standards that disfavor new products when more established or lower cost therapeutic alternatives are already available or subsequently become available. Unless our products demonstrate superior efficacy profiles, it may not qualify for coverage and reimbursement. Even if we obtain coverage for a given product, the resulting reimbursement payment rates might not be adequate or may require co-payments, deductibles or co-insurance payments that patients find unacceptably high.
Not only are third-party payors, whether governmental or commercial, developing increasingly sophisticated methods of controlling healthcare costs, in addition, no uniform policy of coverage and reimbursement for medical products, including V-Go, exists among third-party payors. Therefore, coverage and reimbursement for our products can and do differ significantly from payor to payor. As a result, the coverage determination process is often a time-consuming and costly process that requires us to provide economic, scientific and clinical support for the use of our products to each payor separately, with no assurance that coverage and adequate reimbursement will be obtained. Even where favorable coverage and reimbursement status has been attained for V-Go, less favorable coverage policies and reimbursement rates may be implemented in the future. Moreover, a third-party payor’s decision to provide coverage does not imply that an adequate reimbursement rate will be paid. There can be no assurance that our clinical data will allow for satisfactory pricing of V-Go at current levels, and the failure to obtain and maintain coverage and adequate reimbursement for V-Go would materially and adversely affect our business.
V-Go currently is covered and reimbursed under the policies of a number of third-party payors. The Medicare program recognizes V-Go under the Medicare Part D prescription drug benefit, and a number of Part D drug plans have placed our products on their pharmacy formularies or otherwise allow for individual consideration. Although V-Go is not covered under Medicare Part B, an outpatient medical benefit that does not recognize disposable insulin delivery devices, other third-party payors may have adopted different coverage policies, classifying a disposable insulin delivery device as a coverable device. Some commercial payors, however, have declined to offer any coverage for V-Go, whether on a pharmacy formulary or as a medical benefit, concluding that the delivery system is experimental or investigational, or that the current evidence is insufficient. In addition, coverage policies developed by third-party payors generally can be modified or terminated by the third-party payor without cause and with little or no notice to us.
We believe that future coverage and reimbursement will likely be subject to increased restrictions both in the United States and in international markets. Healthcare cost containment initiatives that limit or deny reimbursement for V-Go would also materially and adversely affect our business. If reimbursement is not available or is available only to limited levels, we may not be able to commercialize our products profitably.
56
Table of Contents
We are subject to additional federal, state and foreign laws and regulations relating to our healthcare business; our failure to comply with those laws could have a material adverse effect on our results of operations and financial condition.
Although we do not provide healthcare services, submit claims for third-party reimbursement, or receive payments directly from Medicare, Medicaid or other third-party payors for our product, we are subject to healthcare fraud and abuse regulation and enforcement by federal and state governments, which could significantly impact our business. Healthcare fraud and abuse laws potentially applicable to our operations include:
| • | the federal Anti-Kickback Statute, which applies to our marketing practices, educational programs, pricing policies and relationships with healthcare providers, by prohibiting, among other things, soliciting, receiving, offering or providing remuneration intended to induce or reward the purchase or recommendation of an item or service reimbursable under a federal healthcare program, such as the Medicare or Medicaid programs; |
| • | federal civil and criminal false claims laws and civil monetary penalty laws, including civil whistleblower or qui tam actions, that prohibit, among other things, knowingly presenting, or causing to be presented, claims for payment or approval to the federal government that are false or fraudulent, knowingly making, or causing to be made, a false statement material to an obligation to pay or transmit money or property to the federal government or knowingly concealing or knowingly and improperly avoiding or decreasing an obligation to pay or transmit money or property to the federal government; |
| • | the federal Health Insurance Portability and Accountability Act of 1996, or HIPAA, and its implementing regulations, which created federal criminal laws that prohibit, among other things, executing a scheme to defraud any healthcare benefit program or making false statements relating to healthcare matters; |
| • | federal “sunshine” requirements imposed by the Patient Protection and Affordable Care Act, as amended by the Health Care and Education Reconciliation Act, or collectively the ACA, on device manufacturers regarding any “transfer of value” made or distributed to physicians and teaching hospitals, as well as ownership and investment interests held by physicians and their immediate family members. Failure to submit required information may result in civil monetary penalties of up to an aggregate of $150,000 per year (or up to an aggregate of $1 million per year for “knowing failures”), for all payments, transfers of value or ownership or investment interests that are not timely, accurately, and completely reported in an annual submission due by the 90th day of each subsequent calendar year; |
| • | federal consumer protection and unfair competition laws, which broadly regulate marketplace activities and activities that potentially harm consumers; and |
| • | state law equivalents of each of the above federal laws, such as anti-kickback and false claims laws that may apply to items or services reimbursed by any third-party payor, including commercial insurers; state laws that require device and pharmaceutical companies to comply with the industry’s voluntary compliance guidelines and the relevant compliance guidance promulgated by the federal government or otherwise restrict payments that may be made to healthcare providers; and state laws that require drug and device manufacturers to report information related to payments and other transfers of value to physicians, other healthcare providers and healthcare entities or marketing expenditures. |
The risk of our being found in violation of these laws and regulations is increased by the fact that many of them have not been fully interpreted by the regulatory authorities or the courts, and their provisions are open to a variety of interpretations. Moreover, recent health care reform legislation has strengthened these laws. For example, the ACA, among other things, amended the intent requirement of the federal anti-kickback and criminal health care fraud statutes, such that a person or entity no longer needs to have actual knowledge of these statutes or specific intent to violate them. In addition, the ACA provided that the government may assert that a claim including items or services resulting from a violation of the federal anti-kickback statute constitutes a false or fraudulent claim for purposes of the false claims statutes. We are unable to predict what additional federal or
57
Table of Contents
state legislation or regulatory initiatives may be enacted in the future regarding our business or the healthcare industry in general, or what effect such legislation or regulations may have on us. Federal or state governments may impose additional restrictions or adopt interpretations of existing laws that could have a material adverse effect on us.
Because of the breadth of these laws and the narrowness of the statutory exceptions and safe harbors available under such laws, it is possible that some of our business activities, including without limitation certain of the marketing and distribution programs for V-Go, as well as our relationships with physicians and other health care providers, some of whom recommend, purchase and/or prescribe our product, could be subject to challenge under one or more of such laws. Any action against us for violation of these laws, even if we successfully defend against it, could cause us to incur significant legal expenses and divert our management’s attention from the operation of our business. If our operations are found to be in violation of any of the laws described above or any other governmental regulations that apply to us, we may be subject to penalties, including civil and criminal penalties, damages, fines, exclusion from governmental health care programs, individual imprisonment, disgorgement, contractual damages, reputational harm, diminished profits and future earnings, suspension or revocation of certifications or licenses that are required to operate our business, injunctions and other associated remedies, denial or withdrawal of product clearances, private “qui tam” actions brought by individual whistleblowers in the name of the government, and the curtailment or restructuring of our operations, any of which could impair our ability to operate our business and our financial results.
We may be liable if the FDA or other U.S. enforcement agencies determine we have engaged in the off-label promotion of our products or have disseminated false or misleading labeling or promotional materials.
Our promotional materials and training methods must comply with FDA and other applicable laws and regulations, including laws and regulations prohibiting marketing claims that promote the off-label use of our products or that make false or misleading statements. Healthcare providers may use our products off-label, as the FDA does not restrict or regulate a physician’s choice of treatment within the practice of medicine. For example, although V-Go is only cleared for insulin delivery in adult patients, a physician might independently choose to use it for insulin delivery in children. FDA also could conclude that a performance claim is misleading if it determines that there are inadequate non-clinical and/or clinical data supporting the claim. If the FDA determines that our promotional materials or training promote of an off-label use or make false or misleading claims, it could request that we modify our training or promotional materials or subject us to regulatory or enforcement actions, including the issuance of an untitled letter, a warning letter, injunction, seizure, civil fine and criminal penalties. It is also possible that other federal, state or foreign enforcement authorities might take action if they determine that our promotional or training materials promote an unapproved use or make false or misleading claims, which could result in significant fines or penalties. Although our policy is to refrain from statements that could be considered off-label promotion of our products or false or misleading, the FDA or another regulatory agency could disagree. Violations of the FDCA may also lead to investigations alleging violations of federal and state health care fraud and abuse laws, as well as state consumer protection laws, which may lead to costly penalties and may adversely impact our business. In addition, the off-label use of our products may increase the risk of product liability claims. Product liability claims are expensive to defend and could result in substantial damage awards against us and harm our reputation.
Legislative or regulatory healthcare reforms may make it more difficult and costly for us to obtain reimbursement for our products or regulatory clearance or approval of our future products, and to produce, market and distribute those products after clearance or approval is obtained.
Recent political, economic and regulatory influences are subjecting the healthcare industry to fundamental changes. Both the federal and state governments in the United States and foreign governments continue to propose and pass new legislation and regulations designed to contain or reduce the cost of healthcare. Such legislation and regulations may result in decreased reimbursement for our product, which may further exacerbate industry-wide pressure to reduce the prices charged for our product. This could harm our ability to market our
58
Table of Contents
products and generate sales. In addition, FDA regulations and guidance are often revised or reinterpreted by the FDA in ways that may significantly affect our business and our current products and future products. Any new regulations or revisions or reinterpretations of existing regulations may impose additional costs or lengthen review times of our products. Delays in receipt of or failure to receive regulatory clearances or approvals for any future products would negatively impact our long-term business strategy.
In the U.S., there have been a number of legislative and regulatory changes and proposed changes regarding the healthcare system that restrict or regulate post-approval activities, which may affect our ability to profitably sell V-Go or any other product candidates for which we obtain marketing approval. Such government-adopted reform measures may adversely impact the pricing of healthcare products and services in the United States or internationally and the amount of reimbursement available from third-party payors.
For example, in March 2010, the ACA was signed into law. While the goal of healthcare reform is to expand coverage to more individuals, it also involved increased government price controls, additional regulatory mandates and other measures designed to constrain medical costs. The ACA substantially changed the way healthcare is financed by both governmental and commercial insurers, encouraged improvements in the quality of healthcare items and services and significantly impacted the medical device industries. The ACA, among other things, established annual fees and taxes on manufacturers of certain branded prescription drugs and medical devices (discussed in more detail below), required manufacturers to participate in a discount program for certain outpatient drugs under Medicare Part D, and promoted programs that increase the federal government’s comparative effectiveness research.
In January 2017, the U.S. House of Representatives and Senate passed legislation, which, if signed into law by the President, would repeal certain aspects of the ACA. Further, on January 20, 2017, the President signed an Executive Order directing federal agencies with authorities and responsibilities under the ACA to waive, defer, grant exemptions from, or delay the implementation of any provision of the ACA that would impose a fiscal or regulatory burden on states, individuals, healthcare providers, health insurers, or manufacturers of pharmaceuticals or medical devices. Congress also could consider subsequent legislation to replace elements of the ACA that are repealed.
In the future there may continue to be additional proposals relating to the reform of the U.S. healthcare system generally, or operation of the Medicare Part D program specifically. Certain of these proposals could limit the prices we are able to charge for our product, or the amount of reimbursement available for our product, and could limit the acceptance and availability of our product.
Our financial performance may be adversely affected by medical device tax provisions in the ACA.
Beginning in 2013 through the end of 2015, the ACA imposed, among other things, an annual excise tax of 2.3% on any entity that manufactures or imports medical devices offered for sale in the United States beginning in 2013. Congress suspended this tax on December 18, 2015 for two years, for sales of devices during the period January 1, 2016 through December 31, 2017. We do not believe that V-Go was subject to this tax based on the retail exemption under applicable Treasury Regulations. However, the guidance regarding this exemption as applied to V-Go is not clear, and the availability of this exemption is subject to interpretation by the IRS, and the IRS may disagree with our analysis. We do not know if this provision will be repealed or if there will be changes to the retail exemption when the suspension of the device tax ends at the end of 2017. The potential financial impact this tax may have on our business is unclear and there can be no assurance that our business and financial results will not be negatively impacted.
Risks Related to Ownership of Our Common Stock
The price of our common stock may be volatile and fluctuate substantially.
The quoted price of our common stock has been, and we expect it to continue to be, volatile. The stock market in general and the market for smaller medical device and pharmaceutical companies in particular have experienced
59
Table of Contents
extreme volatility that has often been unrelated to the operating performance of particular companies. As a result of this volatility, you may not be able to sell your shares of common stock at or above your purchase price. The market price for our common stock may be influenced by many factors, including:
| • | the success of competitive products or technologies; |
| • | developments related to our existing or any future collaborations; |
| • | regulatory or legal developments in the United States and other countries; |
| • | developments or disputes concerning patent applications, issued patents or other proprietary rights; |
| • | the recruitment or departure of key personnel; |
| • | the level of expenses related to any of our product candidates; |
| • | the results of our efforts to discover, develop, acquire or in-license additional product candidates or products; |
| • | actual or anticipated changes in estimates as to financial results, development timelines or recommendations by securities analysts; |
| • | variations in our financial results or those of companies that are perceived to be similar to us; |
| • | changes in the structure of healthcare payment systems; |
| • | market conditions in the pharmaceutical and biotechnology sectors; |
| • | general economic, industry and market conditions; and |
| • | the other factors described in this “Risk Factors” section. |
Raising additional funds by issuing securities may cause dilution to existing stockholders and raising funds through lending and licensing arrangements may restrict our operations or require us to relinquish proprietary rights.
In the future, we may issue our authorized but previously unissued equity securities, resulting in the dilution of the ownership interests of our present stockholders and the purchasers of our common stock offered hereby. On February 14, 2017, we entered into an agreement with CRG and WCAS, or the Debt Conversion, to convert a total of $27.5 million of the outstanding principal amount of our debt, including the Term Loan into shares of our to-be-created Series A Convertible Preferred Stock, at a price set forth in the executed definitive documents. The Debt Conversion is contingent upon the Company receiving gross proceeds of at least $40 million in a public offering before December 31, 2017. We are authorized to issue an aggregate of 300,000,000 shares of common stock and 10,000,000 shares of “blank check” preferred stock. During the first quarter of 2017, we intend to hold a special meeting of our stockholders to approve an increase in authorized number of preferred stock we may issue to 50,000,000 shares. We may issue additional shares of our common stock or other securities that are convertible into or exercisable for our common stock in connection with hiring or retaining employees, future acquisitions, future sales of our securities for capital raising purposes, or for other business purposes. The future issuance of any such additional shares of our common stock may create downward pressure on the trading price of the common stock. We expect we will need to raise additional capital in the near future to meet our working capital needs, and there can be no assurance that we will not be required to issue additional shares, warrants or other convertible securities in the future in conjunction with these capital raising efforts, including at a price (or exercise prices) below the price you paid for your stock.
There is not now and there may never be an active, liquid and orderly trading market for our common stock, which may make it difficult for you to sell your shares of our common stock.
Our common stock has been quoted on the OTC Market Group Inc.’s over-the-counter inter-dealer quotation system, known as OTC Markets, and there is not now, nor has there been since our inception, any significant
60
Table of Contents
trading activity in our common stock, and an active trading market for our shares may never develop or be sustained. If an active market for our common stock does not develop, it may be difficult for you to sell shares you purchase without depressing the market price for the shares or at all.
We do not have a class of our securities registered under Section 12 of the Exchange Act. Until we do or we become subject to Section 15(d) of the Exchange Act, we will be a “voluntary filer.”
We are not currently required under Section 13 or Section 15(d) of the Exchange Act to file periodic reports with the SEC. We have in the past voluntarily elected to file some or all of these reports to ensure that sufficient information about us and our operations is publicly available to our stockholders and potential investors. Because we are a voluntary filer, we are considered a non-reporting issuer under the Exchange Act. Until we become subject to the reporting rules under the Exchange Act, we are not required to file annual, quarterly or current reports and could cease doing so at any time. Additionally, until we register a class of our securities under Section 12 of the Exchange Act, we are not subject to the SEC’s proxy rules, and large holders of our capital stock will not be subject to beneficial ownership reporting requirements under Sections 13 or 16 of the Exchange Act and their related rules. As a result, our stockholders and potential investors may not have available to them as much or as robust information as they may have if and when we become subject to those requirements.
The ability of our Board of Directors to issue additional stock may prevent or make more difficult certain transactions, including a sale or merger.
Our Board of Directors is authorized to issue up to 10,000,000 shares of preferred stock with powers, rights and preferences designated by it. During the first quarter of 2017, we intend to hold a special meeting of our stockholders to approve an increase in authorized number of preferred stock we may issue to 50,000,000 shares. Shares of voting or convertible preferred stock could be issued, or rights to purchase such shares could be issued, to create voting impediments or to frustrate persons seeking to effect a takeover or otherwise gain control of us. The ability of the Board of Directors to issue such additional shares of preferred stock, with rights and preferences it deems advisable, could discourage an attempt by a party to acquire control of us by tender offer or other means. Such issuances could therefore deprive stockholders of benefits that could result from such an attempt, such as the realization of a premium over the market price for their shares in a tender offer or the temporary increase in market price that such an attempt could cause. Moreover, the issuance of such additional shares of preferred stock to persons friendly to the Board of Directors could make it more difficult to remove incumbent managers and directors from office even if such change were to be favorable to stockholders generally.
We are an “emerging growth company”, and we cannot be certain whether the reduced reporting requirements applicable to emerging growth companies will make our common stock less attractive to investors.
We are an “emerging growth company,” as defined in the JOBS Act. For as long as we continue to be an emerging growth company, we may take advantage of exemptions from various reporting requirements that are applicable to other public companies that are not emerging growth companies, including not being required to comply with the auditor attestation requirements of Section 404 of the Sarbanes-Oxley Act of 2002 or the Sarbanes-Oxley Act’s reduced disclosure obligations regarding executive compensation in our periodic reports and proxy statements and exemptions from the requirements of holding a nonbinding advisory vote on executive compensation and stockholder approval of any golden parachute payments not previously approved.
We will remain an emerging growth company until the earlier of (1) the last day of the fiscal year (a) following the fifth anniversary of our first sale of common equity securities pursuant to an effective registration statement under the Securities Act, which occurred in May 2015; (b) in which we have total annual gross revenue of at least $1.0 billion; or (c) in which we are deemed to be a “large accelerated filer,” which means the market value of our common stock that is held by non-affiliates exceeds $700 million as of the prior June 30th and (2) the date on
61
Table of Contents
which we have issued more than $1.0 billion in non-convertible debt securities during the prior three-year period. We cannot predict if investors will find our common stock less attractive because we may rely on these exemptions. If some investors find our common stock less attractive as a result, there may be a less active trading market for our common stock and our stock price may suffer or be more volatile.
Section 102 of the JOBS Act also provides that an “emerging growth company” can take advantage of the extended transition period provided in Section 7(a)(2)(B) of the Securities Act for complying with new or revised accounting standards. An “emerging growth company” can therefore delay the adoption of certain accounting standards until those standards would otherwise apply to private companies. However, we are choosing to “opt out” of such extended transition period, and as a result, we will comply with new or revised accounting standards on the relevant dates on which adoption of such standards is required for non-emerging growth companies.
Section 107 of the JOBS Act provides that our decision to opt out of the extended transition period for complying with new or revised accounting standards is irrevocable.
We are a smaller reporting company, and we cannot be certain if the reduced disclosure requirements applicable to smaller reporting companies will make our common stock less attractive to investors.
We are currently a “smaller reporting company”, meaning that we are not an investment company, an asset- backed issuer, or a majority-owned subsidiary of a parent company that is not a smaller reporting company and have a non-affiliated public float of less than $75 million and annual revenues of less than $50.0 million during the most recently completed fiscal year. In the event that we are still considered a “smaller reporting company,” at such time as we cease being an “emerging growth company,” we will be required to provide additional disclosure in our SEC filings. However, similar to an “emerging growth companies”, “smaller reporting companies” are able to provide simplified executive compensation disclosures in their filings; are exempt from the provisions of Section 404(b) of the Sarbanes-Oxley Act requiring that independent registered public accounting firms provide an attestation report on the effectiveness of internal control over financial reporting; and have certain other decreased disclosure obligations in their SEC filings, including, among other things, only being required to provide two years of audited financial statements in annual reports and in a registration statement under the Exchange Act on Form 10. Decreased disclosures in our SEC filings due to our status as a “smaller reporting company” may make it harder for investors to analyze our results of operations and financial prospects.
If securities or industry analysts do not publish research or reports about our business, or if they issue an adverse or misleading opinion regarding our stock, our stock price and trading volume could decline.
The trading market for our common stock will be influenced by the research and reports that industry or securities analysts publish about us or our business. We do not currently have and may never obtain research coverage by securities and industry analysts. If no or few securities or industry analysts commence coverage of us, the trading price for our stock would be negatively impacted. In the event we obtain securities or industry analyst coverage, if any of the analysts who cover us issue an adverse or misleading opinion regarding us, our business model, our intellectual property or our stock performance, or if our operating results fail to meet the expectations of analysts, our stock price would likely decline. If one or more of these analysts cease coverage of us or fail to publish reports on us regularly, we could lose visibility in the financial markets, which in turn could cause our stock price or trading volume to decline.
Our principal stockholders own a significant percentage of our stock and will be able to exert significant control over matters subject to stockholder approval.
As of February 13, 2017, our 5% stockholders and their affiliates beneficially owned an aggregate of 10,467,763 shares, or 79.7% of our outstanding common stock. As a result, these stockholders will have significant influence and may be able to determine all matters requiring stockholder approval. For example, these stockholders may be
62
Table of Contents
able to control elections of directors, amendments of our organizational documents, or approval of any merger, sale of assets, or other major corporate transactions. This concentration of ownership could delay or prevent any acquisition of our company on terms that other stockholders may desire, and may adversely affect the market price of our common stock.
We may be exposed to additional risks as a result of “going public” by means of a reverse acquisition transaction.
We may be exposed to additional risks because the business of Valeritas has become a public company through a “reverse merger” transaction. There has been increased focus by government agencies on transactions such as the 2016 Merger in recent years, and we may be subject to increased scrutiny by the SEC and other government agencies and holders of our securities as a result of the completion of the 2016 Merger. Additionally, our “going public” by means of a reverse merger transaction may make it more difficult for us to obtain coverage from securities analysts of major brokerage firms following the 2016 Merger because there may be little incentive to those brokerage firms to recommend the purchase of our common stock. Further, investment banks may be less likely to agree to underwrite secondary offerings on our behalf than they might if we became a public reporting company by means of an initial public offering because they may be less familiar with our company as a result of more limited coverage by analysts and the media, and because we became public at an early stage in our development. The failure to receive research coverage or support in the market for our shares will have an adverse effect on our ability to develop a liquid market for our common stock. The occurrence of any such event could cause our business or stock price to suffer.
We do not anticipate paying dividends on our common stock, and investors may lose the entire amount of their investment.
We have never declared or paid cash dividends on our common stock, and we do not anticipate such a declaration or payment for the foreseeable future.
We expect to use future earnings, if any, to fund business growth. Therefore, stockholders will not receive any funds absent a sale of their shares of common stock. We cannot assure stockholders of a positive return on their investment when they sell their shares, nor can we assure that stockholders will not lose the entire amount of their investment.
Provisions of our charter documents or Delaware law could delay or prevent an acquisition of the company, even if such an acquisition would be beneficial to our stockholders, which could make it more difficult for you to change management.
Provisions in our amended and restated certificate of incorporation and our amended and restated bylaws may discourage, delay or prevent a merger, acquisition or other change in control that stockholders may consider favorable, including transactions in which stockholders might otherwise receive a premium for their shares. In addition, these provisions may frustrate or prevent any attempt by our stockholders to replace or remove our current management by making it more difficult to replace or remove our board of directors. These provisions include:
| • | a classified board of directors so that not all directors are elected at one time; |
| • | a prohibition on stockholder action through written consent; |
| • | no cumulative voting in the election of directors; |
| • | the exclusive right of our board of directors to elect a director to fill a vacancy created by the expansion of the board of directors or the resignation, death or removal of a director; |
| • | a requirement that special meetings of stockholders be called only by the board of directors, the chairperson of the board of directors, the chief executive officer or, in the absence of a chief executive officer, the president; |
63
Table of Contents
| • | an advance notice requirement for stockholder proposals and nominations; |
| • | the authority of our board of directors to issue Preferred Stock with such terms as our board of directors may determine; and |
| • | a requirement of approval of not less than 66 2/3% of all outstanding shares of our capital stock entitled to vote to amend any bylaws by stockholder action, or to amend specific provisions of our amended and restated certificate of incorporation. |
Any failure to maintain effective internal control over our financial reporting could materially adversely affect us.
Section 404 of the Sarbanes-Oxley Act of 2002 requires us to include in our annual reports on Form 10-K an assessment by management of the effectiveness of our internal control over financial reporting. In addition, at such time, if any, as we are an “accelerated filer” or a “large accelerated filer,” and no longer an “emerging growth company,” our independent registered public accounting firm will have to attest to and report on management’s assessment of the effectiveness of such internal control over financial reporting. Our management assessed our internal control over financial reporting as of December 31, 2016 based on criteria established in Internal Control-Integrated Framework issued by the Committee of Sponsoring Organizations of the Treadway Commission (2013 Framework), or the 2013 Framework. Based on such assessment, we concluded that our internal control over financial reporting was ineffective as of December 31, 2016 to provide reasonable assurance regarding the reliability of financial reporting and the preparation of financial statements for external reporting purposes in accordance with U.S. generally accepted accounting principles.
We are still in the process of completing an effective evaluation due to the short period available to perform such evaluation since May 3, 2016 when we became public through a reverse merger. As of December 31, 2016, although management has commenced its assessment of both the design and operational effectiveness of our internal controls over financial reporting, this assessment has not yet been completed based on the 2013 Framework. In addition, management identified the following material weaknesses: (i) policies and procedures which were not adequately documented and (ii) lack of proper approval processes and review processes and documentation of such reviews.
A material weakness is a deficiency or combination of deficiencies in internal control over financial reporting that results in a more than reasonable possibility that a material misstatement of annual or interim financial statements will not be prevented or detected on a timely basis. Lack of effective internal control over financial reporting is indicative of a material weakness. We cannot assure that any measures that we have taken or may take to correct the material weakness will fully remediate the deficiencies or material weakness described herein. We also cannot assure you that we have identified all of our existing significant deficiencies and material weaknesses, or that we will not in the future have additional significant deficiencies or material weaknesses.
Even after we are able to remediate the material weakness described herein, our internal control over financial reporting will not prevent or detect all error and all fraud. A control system, no matter how well designed and operated, can provide only reasonable, not absolute, assurance that the control system’s objectives will be met. Because of the inherent limitations in all control systems, no evaluation of controls can provide absolute assurance that misstatements due to error or fraud will not occur or that all control issues and instances of fraud will be detected. If we are not able to comply with the requirements of Section 404 in a timely manner, or if we identify one or more material weaknesses in our internal controls, investors could lose confidence in the reliability of our financial statements, the market price of our stock could decline and we could be subject to sanctions or investigations by the SEC, or other regulatory authorities.
We could be subject to securities class action litigation.
In the past, securities class action litigation has often been brought against a company following a decline in the market price of its securities. This risk is especially relevant for us because biotechnology companies have
64
Table of Contents
experienced significant stock price volatility in recent years. If we face such litigation, it could result in substantial costs and a diversion of management’s attention and resources, which could harm our business.
Item 1B. Unresolved Staff Comments.
None.
Our corporate headquarters are located in Bridgewater, New Jersey, where we currently lease approximately 9,700 square feet of office space under a lease that expires on June 30, 2018. We also maintain a research and development facility in Shrewsbury, Massachusetts, where we currently lease approximately 73,000 square feet of space for offices, lab and pilot facilities and process and engineering under a lease that expires on October 31, 2017.
We, and our subsidiary, are currently not a party to, and our property is not the subject of, any material legal proceedings; however, we may become involved in various claims and legal actions arising in the ordinary course of business.
Item 4. Mine Safety Disclosures.
Not applicable.
65
Table of Contents
PART II
Item 5. Market for Registrant’s Common Equity, Related Stockholder Matters and Issuer Purchases of Equity Securities.
Market Information
Our common stock has been quoted on the OTCQB Marketplace under the symbol “VLRX” since April 18, 2016. Prior to this date, our common stock was quoted on the OTC Pink Marketplace since November 4, 2015.
The following table sets forth, for each of the calendar periods indicated, the quarterly high and low closing bid prices for our common stock quoted on the OTCQB Marketplace. The prices in the table represent prices between dealers and do not include adjustments for retail mark-up, markdown or commission and may not represent actual transactions. Trading in our common stock commenced during calendar year 2015, but there were only limited, sporadic quotations until April 29, 2016 around the time of the 2016 Merger.
| Year Ended December 31, 2016 |
||||||||
| High | Low | |||||||
| 2016 |
||||||||
| Second Quarter (from April 18, 2016) |
$ | 5.50 | $ | 0.10 | ||||
| Third Quarter |
$ | 6.50 | $ | 5.00 | ||||
| Fourth Quarter (through December 31, 2016) |
$ | 6.00 | $ | 2.85 | ||||
| 2017 |
||||||||
| First Quarter (through February 13, 2017) |
$ | 5.00 | $ | 3.00 | ||||
Holders
The last reported sale price for our common stock on February 13, 2017 was $4.00 per share. On the same date, there were approximately 131 registered holders of record of our shares of common stock, based upon information received from our stock transfer agent. However, this number does not include beneficial owners whose shares were held of record by nominees or broker dealers. We believe that there are a significantly larger number of beneficial owners of our common stock than the number of record holders.
Dividends
We have never declared or paid any dividends on our common stock. We currently anticipate that we will retain any future earnings for the operation and expansion of our business. Accordingly, we do not currently anticipate declaring or paying any cash dividends on our common stock for the foreseeable future. Any future determination relating to our dividend policy will be made at the discretion of our board of directors and will depend on then existing conditions, including our financial condition, results of operations, contractual restrictions (including in the agreements governing our credit facilities), capital requirements, business prospects and other factors our board of directors may deem relevant.
Our ability to pay cash dividends is restricted pursuant to the terms of the Term Loan. See “Management’s Discussion and Analysis of Financial Condition and Results of Operations—Indebtedness.”
Issuer Purchases of Equity Securities
None.
Recent Sales of Unregistered Securities
Issuance of Shares of Capital Stock
Set forth below is information regarding shares of capital stock issued by Valeritas and us since January 1, 2016 that were not registered under the Securities Act. All share and per share stock numbers in this section are after
66
Table of Contents
giving effect to the 4.0486 conversion of our common stock in connection with the Re-Domicile on April 14, 2016, and the 2016 Merger on May 3, 2016, in which each share of Valeritas’ Series AB Preferred Stock outstanding at the time of the 2016 Merger was automatically converted into shares of our common stock at the conversion ratio of 0.23856. All outstanding shares of Valeritas’ common stock, Series D Preferred Stock, Series AA Preferred Stock and associated warrants were retired and cancelled.
| 1. | On January 29, 2016, Valeritas issued 4,400,000 shares of Series AB Preferred Stock for aggregate consideration of $5.5 million to accredited investors. |
| 2. | On January 29, 2016, Valeritas issued warrants to purchase 16,000,000 shares of our Series AB Preferred Stock with an exercise price of $1.25 per share to accredited investors. |
| 3. | On February 29, 2016, Valeritas issued 255,430 shares of Series AB Preferred Stock for aggregate consideration of $319,287 to accredited investors. |
| 4. | On February 29, 2016, Valeritas issued warrants to purchase 928,838 shares of our Series AB Preferred Stock with an exercise price of $1.25 per share to accredited investors. |
| 5. | On March 30, 2016, Valeritas issued 1,320,600 shares of Series AB Preferred Stock for aggregate consideration of $1.7 million resulting from the exercise of warrants at a price of $1.25 per share to accredited investors. |
| 6. | On April 15, 2016, Valeritas issued 279,400 shares of Series AB Preferred Stock for aggregate consideration of $0.3 million resulting from the exercise of warrants at a price of $1.25 per share to accredited investors. |
| 7. | On May 3, 2016, in connection with the 2016 Merger, Valeritas issued approximately 6,600,000 restricted shares of our common stock to the holders of shares of Valeritas’ Series AB Preferred Stock. |
| 8. | On May 3, 2016, in connection with the 2016 Merger, we issued 404,800 shares of our common stock pursuant to the 2016 Plan as restricted stock awards to certain of our employees and consultants. |
| 9. | On September 29, 2016, we issued 29,250 restricted shares of our common stock to The Del Mar Consulting Group Inc., a California corporation, or Del Mar. |
| 10. | On September 29, 2016, we issued 19,500 restricted shares of our common stock to Alex Partners, LLC, a Washington limited liability corporation, or Alex Partners. |
| 11. | On January 27, 2017, we issued 9,750 restricted shares of our common stock to Del Mar. |
| 12. | On January 27, 2017, we issued 6,500 restricted shares of our common stock to Alex Partners. |
We claimed exemption from registration under the Securities Act for the sale and issuance of these securities by virtue of Section 4(a)(2) of the Securities Act and Rule 506 thereunder as transactions not involving any public offering. All of the purchasers of unregistered securities for which we relied on Section 4(a)(2) and/or Regulation D represented that they were accredited investors as defined under the Securities Act. We claimed such exemption on the basis that (a) the purchasers in each case represented that they intended to acquire the securities for investment only and not with a view to the distribution thereof and that they either received adequate information about the Registrant or had access, through employment or other relationships, to such information and (b) appropriate legends were affixed to the stock certificates issued in such transactions.
Stock Option Grants
From January 1, 2016 through May 3, 2016, Valeritas granted no options under the 2014 Plan. On the Closing Date, all outstanding options for Valeritas common stock were cancelled.
From May 3, 2016 through the date hereof, we granted options to purchase an aggregate of 2,085,800 shares of our common stock at an exercise price of approximately $5.02 per share, to certain of our employees and directors in connection with services provided to us by such persons. None of these options have been exercised.
67
Table of Contents
The issuances of stock options and the shares of common stock issuable upon the exercise of the options were issued pursuant to written compensatory plans or arrangements with our employees, directors and consultants, in reliance on the exemption provided by Rule 701 promulgated under the Securities Act, or pursuant to Section 4(a)(2) under the Securities Act, relative to transactions by an issuer not involving any public offering, to the extent an exemption from such registration was required.
All of the foregoing securities are deemed restricted securities for purposes of the Securities Act. All certificates representing the issued shares of capital stock described in this Item 5 included appropriate legends setting forth that the securities have not been registered and the applicable restrictions on transfer.
68
Table of Contents
Item 6. Selected Financial Data.
The statement of operations data for the years ended December 31, 2016 and 2015 and the balance sheet data as of December 31, 2016 and 2015 are derived from our audited financial statements included elsewhere in this Annual Report on Form 10-K.
Our historical results are not necessarily indicative of the results to be expected in the future. You should read the selected financial data below in conjunction with the section of this report entitled “Management’s Discussion and Analysis of Financial Condition and Results of Operations” and our financial statements and the related notes included elsewhere in this Annual Report on Form 10-K.
| Year Ended December 31, |
||||||||
| 2016 | 2015 | |||||||
| Revenue, net |
$ | 19,550 | $ | 18,097 | ||||
| Cost of goods sold |
12,606 | 14,237 | ||||||
|
|
|
|
|
|||||
| Gross margin |
6,944 | 3,860 | ||||||
| Operating expense: |
||||||||
| Research and development |
4,842 | 6,523 | ||||||
| Selling, general and administrative |
33,481 | 44,680 | ||||||
| Restructuring (note 11) |
2,394 | — | ||||||
|
|
|
|
|
|||||
| Total operating expense |
40,717 | 51,203 | ||||||
|
|
|
|
|
|||||
| Operating loss |
(33,773 | ) | (47,343 | ) | ||||
| Other income (expense): |
||||||||
| Interest expense, net |
(12,151 | ) | (16,317 | ) | ||||
| Change in fair value of derivative liabilities |
(549 | ) | 443 | |||||
| Other income |
106 | — | ||||||
| Offering costs (including 2014 capitalized IPO costs) |
— | (3,978 | ) | |||||
|
|
|
|
|
|||||
| Total other income (expense) |
(12,594 | ) | (19,852 | ) | ||||
|
|
|
|
|
|||||
| Net loss |
$ | (46,367 | ) | $ | (67,195 | ) | ||
|
|
|
|
|
|||||
| Net loss per common share outstanding—basic and diluted (note 16) |
$ | (4.88 | ) | $ | (278.75 | ) | ||
| Weighted average common shares outstanding—basic and diluted (note 16) |
9,496,838 | 241,055 | ||||||
| (1) | See Note 16 to our consolidated financial statements included elsewhere in this Annual Report on Form 10-K for further details on the calculation of net loss per share attributable to common shares, basic and diluted. |
| December 31, | ||||||||
| (Dollars in thousands) | 2016 | 2015 | ||||||
| Cash and cash equivalents |
$ | 9,866 | $ | 2,789 | ||||
| Total assets |
$ | 34,516 | $ | 31,176 | ||||
| Long-term debt, related parties |
$ | 58,978 | $ | — | ||||
| Total current liabilities |
$ | 11,746 | $ | 84,378 | ||||
| Accumulated deficit |
$ | (424,239 | ) | $ | (377,872 | ) | ||
| Total stockholders’ deficit |
$ | (36,500 | ) | $ | (53,345 | ) | ||
69
Table of Contents
Item 7. MANAGEMENT’S DISCUSSION AND ANALYSIS OF FINANCIAL CONDITION AND RESULTS OF OPERATIONS
The following management’s discussion and analysis should be read in conjunction with the historical financial statements and the related notes thereto contained elsewhere in this annual report. The management’s discussion and analysis contains forward-looking statements, such as statements of our plans, objectives, expectations and intentions. Any statements that are not statements of historical fact are forward-looking statements. When used, the words “believe,” “plan,” “intend,” “anticipate,” “target,” “estimate,” “expect” and the like, and/or future tense or conditional constructions (“will,” “may,” “could,” “should,” etc.), or similar expressions, identify certain of these forward-looking statements. These forward-looking statements are subject to risks and uncertainties, including those under “Risk Factors” in this annual report that could cause actual results or events to differ materially from those expressed or implied by the forward-looking statements. Our actual results and the timing of events could differ materially from those anticipated in these forward-looking statements as a result of several factors. We do not undertake any obligation to update forward-looking statements to reflect events or circumstances occurring after the date of this annual report.
Overview
We are a commercial-stage medical technology company focused on improving health and simplifying life for people with diabetes by developing and commercializing innovative technologies. We designed our first commercialized product, the V-Go Wearable Insulin Delivery Device, or V-Go, to help patients with Type 2 diabetes who require insulin to achieve and maintain their target blood glucose goals. V-Go is a small, discreet and easy-to-use disposable insulin delivery device that a patient adheres to his or her skin every 24 hours. V-Go enables patients to closely mimic the body’s normal physiologic pattern of insulin delivery throughout the day and to manage their diabetes with insulin without the need to plan a daily routine around multiple daily injections.
We currently focus on the treatment of patients with Type 2 diabetes—a pervasive and costly disease that, according to the 2014 National Diabetes Statistics Report released by the U.S. Centers for Disease Control and Prevention, or CDC, currently affects 90% to 95% of the approximately 21 million U.S. adults diagnosed with diabetes. The CDC estimates that the combined direct medical and drug costs and indirect lost productivity costs of diabetes in the United States in the 2012 were approximately $245 billion annually. We believe the majority of the 12.6 million U.S. adults treating their Type 2 diabetes with more than one daily oral anti-diabetic drug, OAD, or an injectable diabetes medicine can benefit from the innovative approach of V-Go to manage Type 2 diabetes. Our near-term market consists of approximately 5.6 million of these patients who currently take insulin, of which up to 4.5 million may not be achieving their target blood glucose goal.
We commenced commercial sales of V-Go in the United States during 2012. In the second half of 2012, we began hiring sales representatives in selected U.S. markets. At the end of 2016, our sales team covered 37 territories primarily within the East, South, Midwest and Southwest regions of the United States.
Since launching V-Go, the total number of prescriptions for, and the number of patients using, V-Go have increased each year. Based on prescription data, we estimate there were approximately 89,600 V-Go prescriptions filled during the year ended December 31, 2016. Refill prescriptions account for slightly more than two-thirds of our total prescriptions, and generally move in parallel with our patient retention rates, so can be used as a proxy to determine patient retention rates. We have not experienced any material fluctuations in the prescription refill rate.
The following discussion highlights our audited results of operations and the principal factors that have affected our financial condition as well as our liquidity and capital resources for the periods described, and provides information that management believes is relevant for an assessment and understanding of the statements of financial condition and results of operations presented herein. The following discussion and analysis are based on
70
Table of Contents
our audited financial statements contained in this annual report, which we have prepared in accordance with United States generally accepted accounting principles. You should read the discussion and analysis together with such financial statements and the related notes thereto included elsewhere in this annual report.
Corporate Information
We were incorporated as Cleaner Yoga Mat, Inc. in Florida on May 9, 2014. Pursuant to the 2016 Merger and the Split-Off (each as defined below), we discontinued our prior business of engaging in the sale of sanitizing solutions for Yoga and Pilates studios as well as conventional gyms and acquired the business of Valeritas, Inc. a Delaware corporation, referred to as Valeritas or the private company, which is a commercial-stage medical technology company focused on improving health and simplifying life for people with diabetes by developing and commercializing innovative technologies, and we now operate the existing business of Valeritas as a publicly traded company under the name Valeritas Holdings, Inc.
On May 3, 2016, our wholly owned subsidiary, Valeritas Acquisition Corp., a corporation formed in the State of Delaware on April 27, 2016, or the Acquisition Sub, merged with and into Valeritas, with such merger being referred to as the 2016 Merger. Valeritas was the surviving corporation in the 2016 Merger and became our wholly owned subsidiary. All of the outstanding stock of Valeritas was converted into shares of our common stock, as described in more detail below.
Prior to the 2016 Merger, we reincorporated in the State of Delaware, referred to as the Reincorporation. As a result of the Reincorporation, among other things:
| • | we changed our jurisdiction of incorporation from Florida to Delaware; |
| • | we changed our name from Cleaner Yoga Mat, Inc., to Valeritas Holdings, Inc.; |
| • | each share of Cleaner Yoga Mat, Inc.’s common stock outstanding at the time of the Reincorporation was automatically converted into 4.0486 issued and outstanding and fully paid and non-assessable shares of the surviving corporation’s common stock, with the result that the aggregate 10,247,000 shares of Cleaner Yoga Mat, Inc.’s common stock outstanding immediately prior to the Reincorporation were converted into an aggregate of 41,486,004 shares of our common stock, referred to as the Share Conversion; and |
| • | we increased our authorized capital stock from 100,000,000 shares of common stock, no par value per share, to 300,000,000 shares of common stock, par value $0.001 per share, or our common stock, and 10,000,000 shares of “blank check” preferred stock, par value $0.001 per share, or our Preferred Stock. |
All share and per share numbers in this annual report relating to our common stock have been adjusted to give effect to the Share Conversion, unless otherwise stated.
Also on May 3, 2016, or the Closing Date, we adopted an Amended and Restated Certificate of Incorporation and filed it with the Secretary of State of the State of Delaware and adopted Amended and Restated Bylaws.
From May 3, 2016 through June 2, 2016, in connection with the 2016 Merger, we conducted a private placement offering whereby we sold an aggregate amount of 5,079,000 shares of our common stock, at a purchase price of $5.00 per share.
Upon the closing of the 2016 Merger, under the terms of a Split-Off Agreement and a General Release Agreement, we transferred all of our pre-2016 Merger operating assets and liabilities to our wholly owned special-purpose subsidiary, CYGM Operating Corp., a Florida corporation, or the Split-Off Subsidiary, formed on April 28, 2016. Thereafter, pursuant to the Split-Off Agreement, we transferred all of our outstanding shares of capital stock of the Split-Off Subsidiary to Leisa Swanson, our pre-2016 Merger majority stockholder and former sole officer and director, referred to as the Split-Off, in consideration of and in exchange for (i) the
71
Table of Contents
surrender and cancellation of all of the shares of our common stock held by Ms. Swanson, consisting of an aggregate of 40,486,000 shares (which were cancelled and resumed the status of authorized but unissued shares of our common stock), and (ii) certain representations, covenants and indemnities. The remaining 1,000,004 shares of our common stock were held by other investors and remained issued and outstanding throughout the 2016 Merger.
At the Closing Date, each of the shares of Valeritas’ Series AB Preferred Stock issued and outstanding immediately prior to the closing of the 2016 Merger was converted into 0.23856 shares of our common stock. As a result, an aggregate of approximately 6,600,000 shares of our common stock were issued to the holders of Valeritas’ capital stock. All other outstanding capital stock of Valeritas was cancelled upon consummation of the 2016 Merger as a result of the liquidation preference provisions related to the capital stock, including all shares of common stock, Series D Preferred Stock and Series AA Preferred Stock. In addition, Valeritas’ stock options and warrants were canceled without consideration. Our pre-2016 Merger stockholders, other than our former sole officer and director, retained an aggregate of 1,000,004 shares of our common stock.
As the result of the 2016 Merger and the change in our business and operations, a discussion of our past financial results is not pertinent, and under applicable accounting principles the historical financial results of Valeritas, the accounting acquirer, prior to the 2016 Merger are considered our historical financial results.
Basis of Presentation
The audited financial statements of Valeritas for the fiscal years ended December 31, 2015 and 2016 contained herein include a summary of our significant accounting policies and should be read in conjunction with the discussion below. In the opinion of management, all material adjustments necessary to present fairly the results of operations for such periods have been included. All such adjustments are of a normal recurring nature.
The 2016 Merger was accounted for as a “reverse merger,” and Valeritas is deemed to be the accounting acquirer in the reverse merger. As such, the historical financial statements of the Valeritas Holding, Inc. (also formerly known as Cleaner Yoga Mat, Inc.) prior to the 2016 Merger have been replaced with the historical financial statements of Valeritas.
Unless otherwise disclosed, amounts for Valeritas historical (pre-merger) common stock, preferred stock, warrants, and stock options including share and per share amounts have been retroactively adjusted using their respective exchange ratio in this annual report. As such, all shares of Valeritas’ common stock, Series D Preferred Stock and Series AA Preferred Stock have been eliminated in the historical results, beginning with the earliest period presented. Any amounts funded in connection with the original issuance of Valeritas’ common stock, Series D Preferred Stock and Series AA Preferred Stock have been retrospectively adjusted and accounted for as capital contributions as those classes of Valeritas’ stock did not receive any shares of our common stock in connection with the 2016 Merger. All shares of Valeritas’ Series AB Preferred Stock have been retrospectively adjusted to shares of our common stock based upon the exchange ratio established in the 2016 Merger.
Reorganization of Valeritas Holdings, LLC
During the second quarter of 2014, Valeritas consummated a series of transactions designed to facilitate future capital raising by simplifying its capitalization, referred to as the 2014 Reorganization. As a result of the 2014 Reorganization, Valeritas became a direct, wholly owned subsidiary of Valeritas Holdings, LLC, or Holdings LLC. In March 2016, Holdings LLC was liquidated and its assets were distributed to certain of its holders. For more information on the 2014 Reorganization and its effects, please see “Notes to Consolidated Financial Statements—Note 1: Nature of Operations and Organization—Reorganization of Valeritas Holdings, LLC.”
72
Table of Contents
Results of Operations
Results of Operations for the Years Ended December 31, 2016 and 2015
The following is a comparison of revenue and expense categories for the years ended December 31, 2016 and 2015:
| Year Ended December 31, |
Change | |||||||||||||||
| (Dollars in thousands) | 2016 | 2015 | $ | % | ||||||||||||
| Revenue, net |
$ | 19,550 | $ | 18,097 | $ | 1,453 | 8 | |||||||||
| Costs of goods sold |
12,606 | 14,237 | (1,631 | ) | (11 | ) | ||||||||||
|
|
|
|
|
|
|
|
|
|||||||||
| Gross margin |
6,944 | 3,860 | 3,084 | 80 | ||||||||||||
|
|
|
|
|
|
|
|
|
|||||||||
| Operating expense: |
||||||||||||||||
| Research and development |
4,842 | 6,523 | (1,681 | ) | (26 | ) | ||||||||||
| Selling, general and administrative |
33,481 | 44,680 | (11,199 | ) | (25 | ) | ||||||||||
| Restructuring |
2,394 | — | 2,394 | 100 | ||||||||||||
|
|
|
|
|
|
|
|
|
|||||||||
| Total operating expense |
40,717 | 51,203 | (10,486 | ) | (20 | ) | ||||||||||
|
|
|
|
|
|
|
|
|
|||||||||
| Operating loss |
(33,773 | ) | (47,343 | ) | 13,570 | (29 | ) | |||||||||
| Other income (expense), net: |
||||||||||||||||
| Interest expense, net |
(12,151 | ) | (16,317 | ) | 4,166 | (26 | ) | |||||||||
| Change in fair value of derivatives |
(549 | ) | 443 | (992 | ) | (224 | ) | |||||||||
| Other income (expense) |
106 | — | 106 | 100 | ||||||||||||
| Offering costs (including 2014 capitalized IPO Costs) |
— | (3,978 | ) | (3,978 | ) | (100 | ) | |||||||||
|
|
|
|
|
|
|
|
|
|||||||||
| Total other income (expense) |
(12,594 | ) | (19,852 | ) | (7,258 | ) | (37 | ) | ||||||||
|
|
|
|
|
|
|
|
|
|||||||||
| Net loss |
$ | (46,367 | ) | $ | (67,195 | ) | $ | 20,828 | (31 | ) | ||||||
|
|
|
|
|
|
|
|
|
|||||||||
Revenue, net
We generate revenue from sales of V-Go to third-party wholesalers and medical supply distributors that take delivery and ownership of V-Go and, in turn, sell it to retail pharmacies or directly to patients with Type 2 diabetes. V-Go 30-day packages are sold to wholesalers and distributors at wholesale acquisition cost, or WAC, and we report net revenue after taking into consideration sales deductions as described in our financial statements included elsewhere in this annual report. Our revenue is generated in the United States, and we view our operations as one operating segment. Financial information is reviewed on a consolidated basis to allow management to make decisions regarding resource allocations and assess performance.
Our revenue increased by 8.0% to $19.6 million during the year ended December 31, 2016 from $18.1 million during the year ended December 31, 2015. This increase was primarily attributable to our restructuring efforts in February 2016, one result of which was a significant reduction to our field sales force. Despite this reduction, the volume of V-Go’s prescribed and sold to patients during the year ended December 31, 2016 remained relatively flat, decreasing by 2.2% as compared to the year ended December 31, 2015. This volume reduction was offset by higher, 10.4%, average net prices realized during the year ended December 31, 2016 as compared to the same period in 2015. A portion of this net price increase was the result of an 8.0% WAC price increase during the fourth quarter of 2015. This incremental net price growth was driven primarily by a lower mix of patients utilizing our co-pay card program and a corresponding increase through our contracted managed care providers, resulting in a higher average realized net price.
Cost of Goods Sold and Gross Margins
Cost of goods sold includes raw materials, labor costs, manufacturing overhead expenses and reserves for anticipated scrap and inventory obsolescence.
73
Table of Contents
Our cost of goods sold for the year ended December 31, 2016 was approximately $12.6 million on revenue of approximately $19.6 million, as compared to approximately $14.2 million in cost of goods sold on revenue of approximately $18.1 million during the year ended December 31, 2015. As a percentage of revenue, cost of goods sold decreased during the year ended December 31, 2016 to approximately 64% from approximately 79% during the year ended December 31, 2015.
We currently manufacture V-Go® and the EZ Fill accessory in cleanrooms at a contract manufacturing organization, or CMO, in Southern China. We also engage separate CMOs that perform our final inspection and packaging functions in Central China. Any single-source components and suppliers are managed through our global supply chain operation. Management reviews regularly the inventory levels and demand and will adjust production accordingly, which could give rise to under-absorbed fixed production costs. We continually work with our manufacturing CMO to refine our manufacturing processes and production lines to improve efficiencies and reduce labor cost. These improvements, combined with overhead cost reductions driven by the restructuring efforts in the first quarter of 2016, represent the primary drivers in the reduction in cost of goods sold per unit.
Our gross profit as a percentage of revenues, or gross margin, for the year ended December 31, 2016 was 35.5%, compared to 21.3% during the year ended December 31, 2015. The increase in our gross margin was due to manufacturing efficiencies, overhead cost reductions from the restructuring efforts, implementation of more cost-effective processes in our product development and the impact of our net price increase.
Research and Development Expense
Our research and development activities primarily consist of activities associated with our core technologies and processes engineering as well as research programs associated with products under development. These expenses are primarily related to employee compensation, including salary, fringe benefits, share-based compensation and contract employee expenses.
Total research and development expenses decreased by $1.7 million, or 26%, during the year ended December 31, 2016 as compared to 2015. This reduction in expenses was primarily comprised of reduced employee related expenses resulting from our February 2016 restructuring efforts, and to a lesser extent lower external service spending related to our ongoing projects and contract labor costs.
We expect our research, development and engineering expenses to increase from current levels as we initiate and advance our development projects, including the V-Go Link and V-Go Prefill.
Selling, General and Administrative Expense
Selling, general and administrative expenses consist primarily of salary, fringe benefits and share-based compensation for our executive, financial, marketing, sales, business development, regulatory affairs and administrative functions. Other significant expenses include product demonstration samples, trade show expenses, professional fees for our contracted customer support center, external legal counsel, independent auditors and other consultants, insurance, facilities and information technologies expenses. We expect our selling, general and administrative expenses to increase as our business expands.
Our selling, general and administrative expenses decreased by $11.2 million in the year ended December 31, 2016 compared to 2015. This decrease was driven primarily by the impact of our February 2016 restructuring efforts which significantly reduced our field sales force. This reduction of $7.7 million in employee related costs was partially offset by a non-cash charge of $1.6 million during 2016 for stock based compensation expenses resulting from the cancellation of our stock option plans. Additionally, our advertising expenses dropped by $4.5 million from 2015 to 2016. The remaining savings were attributed to our planned reduction in the use of external consulting services used to assist with our marketing initiatives and other professional services.
74
Table of Contents
Other Income (Expense), Net
Other income (expense), net primarily consists of interest expense and amortization of debt discount associated with our term loan agreements with Capital Royalty Group, or CRG, and WCAS Capital Partners IV, L.P., or WCAS. See “—Indebtedness” below for more information. Also included are costs in connection with our disposition of equipment in 2016 for a net gain of $0.1 million and costs related to our financing efforts in 2016 and 2015.
Interest expense decreased by 26% during the year ended December 31, 2016 as compared to the year ended December 31, 2015. The decrease was attributable to a restructuring of our Term Loan with CRG and the note payable with WCAS on May 3, 2016. The debt restructuring resulted in a lower restructured principal balance and lower interest rates in the year ended December 31, 2016 compared with the year ended December 31, 2015 and an interest expense decrease of $3.9 million. The restructured interest rate decreased from 15% per annum in 2015 to 11% on the Senior Secured Debt and 10% on the other note payable in 2016. Moreso, in 2015, interest resulting from our forbearance agreement with CRG and associated troubled debt restructuring, or TDR, which included the acceleration of all debt discounts and fees over the restructuring period, resulted in a higher interest expense during the year ended December 31, 2015.
The decrease in fair value of derivatives of $0.5 million during the year ended December 31, 2016, as compared with the increase in fair value of $0.4 million during the year ended December 31, 2015 is primarily caused by fluctuations in period end valuations of our derivative liabilities. Specifically, the decrease occurring in 2016 is primarily attributed to Valeritas’ issuance of Series AB Preferred Stock warrants accounted for as a derivative liability and the change in the fair value in accordance with the terms of the 2016 Merger. Warrants were accounted for as derivative liabilities due to containing an obligation to the issuer to transfer assets and liabilities regardless of the timing of the redemption feature or price, even though the underlying shares were classified as permanent equity.
In 2016, the Company disposed of some of its equipment and had a net gain of $0.1 million, as reflected in other income. During 2015, we expensed $4.0 million of previously capitalized deferred offering costs incurred from an Initial Public Offering (IPO) effort terminated in March 2015.
Liquidity and Capital Resources
We are subject to a number of risks similar to those of early stage commercial companies, including dependence on key individuals, the difficulties inherent in the development of a commercial market, the potential need to obtain additional capital necessary to fund the development of its products, and competition from larger companies. We expect that our sales performance and the resulting operating income or loss, as well as the status of each of our new product development programs, will significantly impact our cash requirements.
We have incurred losses each year since inception and have experienced negative cash flows from operations in each year since inception. As of December 31, 2016, we had $9.9 million in cash and cash equivalents and an accumulated deficit of $424.2 million. Our restructured Term Loan included a liquidity covenant whereby the Company must maintain a cash balance greater than $5.0 million. On February 9, 2017, we entered into an agreement with CRG to, among other things, reduce the amount required by this liquidity covenant to $2.0 million. The minimum cash balance covenant will, however, revert back to $5.0 million if we are not able to consummate an underwritten public offering with gross proceeds of at least $40.0 million prior to December 31, 2017. Our cash balance will not be sufficient to satisfy our operations for the next 12 months from the date of issuance of this report or to maintain this liquidity covenant, which raises substantial doubt about our ability to continue as a going concern. We estimate that the cash balance will be sufficient to satisfy our operations through March 2017.
We expect that our actual sales performance and the resulting operating income or loss, as well as the status of each of our new product development programs, will significantly impact our cash management. We intend to
75
Table of Contents
maintain compliance with this liquidity covenant and fund future operations by raising additional capital. There can be no assurances that financing will be available on terms acceptable to us, or at all. If we are unable to raise additional capital prior to achieving sustained profitability from operations, there could be a material adverse effect on our business, results of operations and financial condition.
Historically, our sources of cash have included private placement of equity securities, debt arrangements, and cash generated from operations, primarily from the collection of accounts receivable resulting from sales. We are pursuing additional sources of financing to fund our operations. These sources may include the issuance of our equity to new or existing investors.
The following table shows a summary of our cash flows for the years ended December 31, 2016 and 2015:
| Year Ended December 31, |
||||||||
| (Dollars in thousands) | 2016 | 2015 | ||||||
| Net cash provided by (used in): |
||||||||
| Operating activities |
$ | (29,661 | ) | $ | (40,884 | ) | ||
| Investing activities |
(39 | ) | (987 | ) | ||||
| Financing activities |
36,777 | 23,716 | ||||||
|
|
|
|
|
|||||
| Total |
$ | 7,077 | $ | (18,155 | ) | |||
|
|
|
|
|
|||||
Operating Activities
The decrease in net cash used in operating activities for the year ended December 31, 2016 as compared to the year ended December 31, 2015 was primarily associated with increased product revenue and lower cost of goods sold as a result of manufacturing efficiencies. In addition, since 2015, operating expense benefited from our February 2016 restructuring efforts as well as internal efforts and improvements in managing cash flows.
Investing Activities
Net cash used in investing activities for the year ended December 31, 2016 and 2015 was primarily related to purchases of capital equipment for our production lines. The use of cash in 2016 and 2015 was related to augmenting the already existing production lines and corresponding capacity with our CMO built during prior years. Additionally, in 2016, we sold some of our property and equipment as a result of the change our overall operational strategy and plan. We do not expect to have significant investing activity in the next 12 months.
Financing Activities
Net cash provided by financing activities for the year ended December 31, 2016 was the result of gross proceeds from our common stock financing rounds, which raised $25.4 million, exercise of Series AB warrants of $7.4 million, and issuances of Series AB Preferred Stock of $5.8 million less any offering costs. Net cash provided by financing activities for the first nine months of 2015 was primarily the result of gross proceeds from the Series D, Series AA and Series AB Financing of $2.8 million, $15.2 million and $3.0 million respectively. These proceeds were partially offset by aggregate issuance costs of $2.6 million.
From May 3, 2016 through June 2, 2016, in connection with the 2016 Merger, we conducted a private placement offering, referred to as the Private Placement, whereby we sold an aggregate amount of 5,079,000 shares of our common stock at a purchase price of $5.00 per share, for gross proceeds of approximately $25 million. Our existing investors participated in an amount of approximately $20 million in the Private Placement. In connection with the Private Placement, we incurred costs of approximately $1.0 million in fees, of which $0.3 million was from the issuance of warrants to purchase 83,120 shares of our common stock at an exercise price of $5.00 to the
76
Table of Contents
placement agents. The warrants issued to the placement agents is accounted for as a derivative liability as the warrant exercise price is subject to adjustment upon additional issuances of equity securities at a price per share lower than the exercise price of such warrants. Additionally, $0.6 million were fees paid in cash to the placement agents and the remaining $0.1 million were reimbursed expenses paid to the placement agents.
Indebtedness
Senior Secured Debt
On May 23, 2013, we entered into the Term Loan of $50.0 million with CRG structured as a senior secured loan with a six-year term. The Term Loan is secured by substantially all of our assets, including our material intellectual property. Due to certain events of default, we entered into a series of forbearance agreements with CRG. The initial forbearance agreement was entered into on May 18, 2015 and has subsequently been amended five times. The forbearance agreements, as amended, contained a number of terms and conditions in exchange for CRG’s agreement to forbear.
Concurrently with the closing of the 2016 Merger on May 3, 2016, we restructured our Term Loan and executed an agreement to have the forbearance agreement terminated and all existing defaults permanently waived. CRG converted its outstanding accrued interest and prepayment premium of $16.5 million into 8,609,824 shares of Valeritas’ private company Series AB preferred stock and 4,649,859 shares of private company common stock. The private company Series AB shares were then converted into 2,053,959 of our common stock upon the 2016 Merger and all private company common shares were canceled. The principal balance was restated as $50.0 million with interest charged at 11% per annum, which is payment-in-kind, or PIK, interest through June 30, 2018 and then both PIK and cash interest thereafter. Through December 31, 2016, we recognized $7.8 million in PIK interest. The restructured Term Loan requires quarterly interest payments during the term of the loan, which are set to commence on June 30, 2018. The repayment of principal on amounts borrowed under the Term Loan is scheduled to be completed on March 31, 2021. We may, in our discretion, repay the revised loan in whole or in part without any penalty or prepayment fees. See “Certain Relationships and Related-Party Transactions and Director Independence—Capital Royalty Group Term Loan” for more details regarding the original Term Loan and subsequent forbearance agreements.
On February 9, 2017, we entered into an agreement with CRG to, among other things, reduce the amount required by the liquidity covenant that we maintain a cash balance greater than $5.0 million to $2.0 million. The minimum cash balance covenant will, however, revert back to $5.0 million if we are not able to consummate an underwritten public offering with gross proceeds of at least $40.0 million prior to December 31, 2017. Additionally, on February 14, 2017, we entered into an agreement with CRG and WCAS whereby, upon completion of an underwritten public offering with gross proceeds of at least $40.0 million, approximately half of the outstanding debt held by each of them will convert into shares of our to be created Series A Preferred Stock, at a conversion price as set forth in the executed definitive documents.
Warrants
In 2014 and 2015, we issued warrants to CRG to purchase an aggregate of 179,149 shares of private company common stock exercisable at $0.013 per share. We recorded the loan net of original issuance discount calculated fair value of the issued warrants. In the first quarter of 2016, we issued CRG additional warrants to acquire 16,000,000 shares of private company Series AB shares at an exercise price of $1.25, which converted to 3,816,960 shares of our common stock. The fair value of the warrants at the date of issuance was determined to be $4,000,000, which we recorded as additional debt discount and a derivative liability.
All of the private company common stock and preferred stock warrants issued to CRG were cancelled or exercised during year ended December 31, 2016. The amortization of the debt discount associated with the private company common stock and Series AB preferred stock was subsequently accelerated as a result of the forbearance agreements we entered into in connection with repayment of the Term Loan. For more information, see Note 4 to our consolidated financial statements included elsewhere in this Annual Report on Form 10-K.
77
Table of Contents
Financing costs
We recorded the Term Loan net of deferred financing costs paid directly to the creditor (and therefore treated as a discount to the debt) of $0.5 million relating to the lender finance fee of 1%. The discount related to the issuance costs is being amortized over the term of the loan using the effective interest method. The forbearance agreements entered into during 2015 accelerated the timing of repayment of the Term Loan to January 22, 2016. We accelerated the amortization of the debt discount to coincide with the forbearance period. The carrying amount of the debt discount relating to the original deferred financing costs was fully amortized at June 30, 2016.
In connection with the restructuring of the Term Loan on May 3, 2016, we incurred costs of $0.2 million which were recorded as a discount to the Term Loan balance and will be amortized through the term of the loan using the effective interest rate method. At December 31, 2016, $0.2 million of the restructured debt discount remained.
Lenders Put Option
In 2015, we extinguished a derivative liability and accrued a $2.4 million prepayment penalty in connection with our default under the Term Loan and immediate repayment obligation and 4% prepayment penalty. Pursuant to the terms of the Term Loan, upon a change in control or certain asset sales, the Term Loan was to be prepaid in an amount equal to the outstanding principal balance plus accrued and unpaid interest, taking into account a prepayment premium that started at 5% of the balance and decreased over time. We initially determined that the prepayment feature qualified as an embedded derivative requiring bifurcation from the debt. The full prepayment fee was subsequently extinguished in connection with the 2016 Merger. For more information, please see Note 4.
WCAS Note
In 2011, we issued a $5.0 million senior subordinated note, or the WCAS Note, to WCAS. Amounts due under the WCAS Note originally bore interest at 10% per annum, payable semi-annually. The note was amended in 2013 to bear interest at 12% per annum, with all interest accruing as compounded PIK interest, which was added to the aggregate principal amount of the loan semi-annually. The then outstanding principal amount of the note, including accrued PIK interest, is due in full in September 2021, and may be paid off at any time without penalty. Concurrently with the closing of the 2016 Merger, we restructured the WCAS Note. For more information, see Note 4 to our consolidated financial statements included elsewhere in this Annual Report on Form 10-K.
Contractual Obligations
The following summarizes our significant contractual obligations as of December 31, 2016:
| Payment Due by Period | ||||||||||||||||||||
| (Dollars in thousands) |
Total | Less than 1 Year |
1 to 3 Years |
3 to 5 Years |
More than 5 Years |
|||||||||||||||
| Purchase commitments(1) |
$ | 3,340 | $ | 3,340 | $ | — | $ | — | $ | — | ||||||||||
| Operating lease obligations(2) |
1,141 | 1,020 | 121 | — | — | |||||||||||||||
| Senior secured debt(3) |
53,852 | — | — | 53,852 | — | |||||||||||||||
| Other Note Payable(4) |
5,340 | — | — | 5,340 | — | |||||||||||||||
| Severance payment (5) |
305 | 305 | ||||||||||||||||||
|
|
|
|
|
|
|
|
|
|
|
|||||||||||
| Total |
$ | 63,978 | $ | 4,665 | $ | 121 | $ | 59,192 | $ | — | ||||||||||
| (1) | Represents purchase commitments with suppliers for raw materials and finished goods. |
| (2) | Represents operating lease commitments for office and manufacturing space in Shrewsbury, Massachusetts and Bridgewater, New Jersey and office equipment. |
| (3) | Represents Term Loan agreement with Capital Royalty Partners for $50.0 million, including accrued interest through December 31, 2016. |
78
Table of Contents
| (4) | Represents a $5.0 million Other Note Payable to WCAS Capital Partners IV, L.P., including accrued interest through December 31, 2016. |
| (5) | Represents severance payments due to former employees as part of our restructuring, which will occur in the first nine months of 2017. |
Related Party Transactions
The Company transacted business with certain parties related to us, primarily with key stakeholders with the intent of managing working capital through additional debt or equity financing. See “Certain Relationships and Related-Party Transactions, and Director Independence.”
Recent Accounting Pronouncements
See Note 3 to the consolidated financial statements for a discussion of recent accounting pronouncements.
Critical Accounting Policies and Use of Estimates
This management’s discussion and analysis of financial condition and results of operations is based on our consolidated financial statements, which have been prepared in accordance with accounting principles generally accepted in the United States, or U.S. GAAP. The preparation of these financial statements requires us to make estimates and assumptions that affect the reported amounts of assets and liabilities and the disclosure of contingent assets and liabilities at the date of the consolidated financial statements, as well as the reported revenue and expenses during the reporting periods. These items are monitored and analyzed by us for changes in facts and circumstances, and material changes in these estimates could occur in the future. We base our estimates on historical experience and on various other factors that we believe are reasonable under the circumstances, the results of which form the basis for making judgments about the carrying value of assets and liabilities that are not readily apparent from other sources. Changes in estimates are reflected in reported results for the period in which they become known. Actual results may differ materially from these estimates under different assumptions or conditions.
While our significant accounting policies are more fully described in the notes to our consolidated financial statements included elsewhere in this annual report, we believe that the following accounting policies are critical to the process of making significant judgments and estimates in the preparation of our consolidated financial statements and understanding and evaluating our reported financial results.
Revenue Recognition
Our revenue is primarily generated from the sales in the United States of V-Go to third-party wholesalers and medical supply distributors that, in turn, sell it to retail pharmacies or directly to patients.
We recognize revenue when persuasive evidence of an arrangement exists, delivery has occurred and title passed, the price is fixed or determinable, and collectability is reasonably assured. These criteria are applied as follows:
| • | The evidence of an arrangement generally consists of contractual arrangements with our third-party wholesalers and medical supply distributors. |
| • | Transfer of title and risk and rewards of ownership are passed upon shipment of product to distributors. However, due to uncertainty of customer returns and insufficient historical data that would enable us to estimate returns, we do not consider this element to have been achieved until the prescription has been dispensed to the patient. |
| • | The selling prices are fixed and agreed upon based on the contracts with wholesalers and medical supply distributors, the customer and contracted insurance payors, if applicable. For sales to customers |
79
Table of Contents
| associated with insurance providers with whom we do not have a contract, we recognize revenue upon collection of cash at which time the price is determinable. Provisions for discounts and rebates to wholesalers, medical suppliers and payors are established as a reduction to revenue in the same period the related sales are recorded. |
| • | We consider the overall creditworthiness and payment history of the wholesalers and medical suppliers in concluding whether collectability is reasonably assured. |
We have entered into agreements with wholesalers, distributors and third-party payors throughout the United States. These agreements may include product discounts or rebates payable by us to third-party payors upon dispensing V-Go to patients. Additionally, these agreements customarily provide such wholesalers and medical supply distributors with rights to return purchased products within a specific timeframe, as well as prior to such timeframe if the product is damaged in the normal course of business. Our wholesaler and medical supply distributor customers can generally return purchased product during a period that begins six months prior to the purchased V-Go kits expiration date and ends one year after the expiration date. The expiration date is determined by adding 36 months to the date of manufacture. Returns are no longer honored after delivery to the patient. Therefore, with respect to each unit of V-Go sold, we record revenue when a patient takes possession of the product.
Revenue from product sales is recorded net of adjustments for managed care rebates, wholesale distributions fees, cash discounts, and prompt pay discounts, all of which are established at the time of sale. In order to prepare our consolidated financial statements, we are required to make estimates regarding the amounts earned or to be claimed on the related product sales, including the following:
| • | managed care rebates, which are based on the estimated end user payor mix and related contractual rebates; and |
| • | distribution fees and prompt pay discounts, which are recorded based on specified payment terms, and which vary by customer. |
We believe our estimates related to managed care rebates distribution fees and prompt pay discounts do not have a higher degree of estimation complexity or uncertainty as the related amounts are settled within a relatively short period of time.
We are currently unable to reasonably estimate future returns due to lack of sufficient historical return data for V-Go. Accordingly, we invoice our customers, record deferred revenue equal to the gross invoice sales price less estimated cash discounts and distribution fees, and record a related deferred cost of goods sold. We defer recognition of revenue and the related cost of goods sold on shipments of V-Go until a customer’s right of return no longer exists, which is once we receive evidence that the product has been distributed to patients based on our analysis of third-party information. When we believe we have sufficient historical data to develop reasonable estimates of expected returns based upon historical returns, we plan to recognize product sales upon shipment to wholesalers and medical supply distributors.
Inventories
Inventories consists of raw materials, work in process and finished goods, which are valued at the lower of cost or market. Cost is determined on a first in, first out basis and includes material costs, labor and applicable overhead. We perform a review regarding our excess or obsolete inventory and write down any inventory that has no alternative uses to its net realizable value. Economic conditions, customer demand and changes in purchasing and distribution can affect the carrying value of inventory. As circumstances warrant, we record lower of cost or market inventory adjustments. In some instances, these adjustments can have a material effect on the financial results of an annual or interim period. In order to determine such adjustments, we evaluate the age, inventory turns and estimated fair value of product inventory by stage of completion and record an adjustment if estimated market value is below cost.
80
Table of Contents
Impairment of Long-Lived Assets
We assess the impairment of long-lived assets on an ongoing basis and whenever events or changes in circumstances indicate that the carrying value may not be recoverable. Our impairment review process is based upon an estimate of future undiscounted cash flow. Factors we consider that could trigger an impairment review include the following:
| • | significant underperformance relative to expected historical or projected future operating results, |
| • | significant changes in the manner of our use of the acquired assets or the strategy for our overall business, |
| • | significant negative industry or economic trends, and |
| • | significant technological changes, which would render equipment and manufacturing processes obsolete. |
Recoverability of assets that will continue to be used in our operations is measured by comparing the carrying value to the future net undiscounted cash flows expected to be generated by the asset or asset group. Future undiscounted cash flows include estimates of future revenues, driven by market growth rates, and estimated future costs. There have been no impairment charges recorded during the years ended December 31, 2016 or 2015.
Share-Based Compensation
We measure the cost of awards of equity instruments based on the grant date fair value of the awards. That cost is recognized on a straight-line basis over the period during which the employee is required to provide service in exchange for the entire award.
The fair value of stock options on the date of grant is calculated using the Black Scholes option pricing model, based on key assumptions such as the fair value of common stock, expected volatility and expected term. Compensation cost for restricted stock awards issued to employees is measured using the grant date fair value of the award, net of estimated forfeitures, adjusted to reflect actual forfeitures. Our estimates of these important assumptions are primarily based on third-party valuations, historical data, peer company data and our judgment regarding future trends and other factors.
Off-Balance Sheet Arrangements
We did not engage in any “off-balance sheet arrangements” (as that term is defined in Item 303(a)(4)(ii) of Regulation S-K) as of December 31, 2016.
81
Table of Contents
Item 7A. Quantitative and Qualitative Disclosures about Market Risk.
Market risk represents the risk of loss that may impact our financial position due to adverse changes in financial market prices and rates. Our market risk exposure is primarily the result of fluctuations in interest rates and inflation.
Interest Rate Risk
We are exposed to financial market risks in the ordinary course of our business. Our cash and cash equivalents include cash in readily available checking and money market accounts, as well as certificates of deposit. These securities are not dependent on interest rate fluctuations that may cause the principal amount of these assets to fluctuate. Additionally, the interest rate on our outstanding indebtedness is fixed and is therefore not subject to changes in market interest rates.
Inflation Risk
Inflation generally affects us by increasing our cost of labor and pricing of contracts. We do not believe that inflation has had a material effect on our business, financial condition, or results of operations during the years ended December 31, 2016 and 2015.
82
Table of Contents
Item 8. Financial Statements and Supplementary Data
INDEX TO CONSOLIDATED FINANCIAL STATEMENTS
For Fiscal Years Ended December 31, 2016 and 2015.
83
Table of Contents
Report of Independent Registered Accounting Firm
To the Board of Directors and
Stockholders of Valeritas Holdings, Inc.
We have audited the accompanying consolidated balance sheets of Valeritas Holdings, Inc. and subsidiary (the “Company”) as of December 31, 2016 and 2015, and the related consolidated statements of operations, stockholders’ deficit, and cash flows for each of the years in the two-year period ended December 31, 2016. The Company’s management is responsible for these financial statements. Our responsibility is to express an opinion on these consolidated financial statements based on our audits.
We conducted our audits in accordance with the standards of the Public Company Accounting Oversight Board (United States). Those standards require that we plan and perform the audits to obtain reasonable assurance about whether the consolidated financial statements are free of material misstatement. The company is not required to have, nor were we engaged to perform, an audit of its internal control over financial reporting. Our audits included consideration of internal control over financial reporting as a basis for designing audit procedures that are appropriate in the circumstances, but not for the purpose of expressing an opinion on the effectiveness of the company’s internal control over financial reporting. Accordingly, we express no such opinion. An audit also includes examining, on a test basis, evidence supporting the amounts and disclosures in the financial statements, assessing the accounting principles used and significant estimates made by management, as well as evaluating the overall financial statement presentation. We believe that our audits provide a reasonable basis for our opinion.
In our opinion, the consolidated financial statements referred to above present fairly, in all material respects, the financial position of the Company as of December 31, 2016 and 2015, and the results of its operations, and its cash flows for each of the years in the two-year period ended December 31, 2016, in conformity with accounting principles generally accepted in the United States of America.
The accompanying consolidated financial statements have been prepared assuming that the Company will continue as a going concern. As discussed in Note 2 to the consolidated financial statements, the Company has recurring losses, negative cash flows from operations, and has a significant accumulated deficit. These conditions, among others, raise substantial doubt about the Company’s ability to continue as a going concern. Management’s plans in regard to these matters are also described in Note 2. The consolidated financial statements do not include any adjustments that might result from the outcome of this uncertainty. If the Company is unable to obtain financing, there could be a material adverse effect on the Company.
/s/ Friedman LLP
East Hanover, New Jersey
February 21, 2017
84
Table of Contents
VALERITAS HOLDINGS, INC. AND SUBSIDIARY
CONSOLIDATED BALANCE SHEETS
(In thousands, except share and per share data)
| December 31, | ||||||||
| 2016 | 2015 | |||||||
| Assets |
||||||||
| Current assets: |
||||||||
| Cash and cash equivalents |
$ | 9,866 | $ | 2,789 | ||||
| Accounts receivable, net |
3,462 | 3,142 | ||||||
| Other receivables |
173 | 493 | ||||||
| Inventories, net (note 5) |
9,384 | 10,784 | ||||||
| Deferred cost of goods sold |
690 | 863 | ||||||
| Prepaid expense and other current assets |
569 | 735 | ||||||
|
|
|
|
|
|||||
| Total current assets |
24,144 | 18,806 | ||||||
| Property and equipment, net (note 6) |
10,219 | 12,091 | ||||||
| Other assets |
153 | 279 | ||||||
|
|
|
|
|
|||||
| Total assets |
$ | 34,516 | $ | 31,176 | ||||
|
|
|
|
|
|||||
| Liabilities and stockholders’ deficit |
||||||||
| Current liabilities: |
||||||||
| Current portion of long-term debt, related parties (note 4) |
$ | — | $ | 69,107 | ||||
| Current portion of capital lease obligation |
— | 26 | ||||||
| Accounts payable |
4,591 | 7,419 | ||||||
| Accrued expense and other current liabilities (note 7) |
5,532 | 5,931 | ||||||
| Deferred revenue |
1,623 | 1,895 | ||||||
|
|
|
|
|
|||||
| Total current liabilities |
11,746 | 84,378 | ||||||
| Long-term debt, less current portion (note 4), related parties |
58,978 | — | ||||||
| Deferred rent liability |
70 | 143 | ||||||
| Derivative liabilities (note 10) |
222 | — | ||||||
|
|
|
|
|
|||||
| Total liabilities |
71,016 | 84,521 | ||||||
|
|
|
|
|
|||||
| Commitments and contingencies (note 15) |
||||||||
| Stockholders’ deficit (notes 1 and 9) |
||||||||
| Preferred stock, $0.001 par value; 10,000,000 authorized; 0 shares issued and outstanding at December 31, 2016 and 2015. |
— | — | ||||||
| Common stock, $0.001 par value, 300,000,000 shares authorized; 12,727,741 and 1,631,738 shares issued and outstanding at December 31, 2016 and 2015, respectively |
13 | 2 | ||||||
| Additional paid-in capital |
387,726 | 324,525 | ||||||
| Accumulated deficit |
(424,239 | ) | (377,872 | ) | ||||
|
|
|
|
|
|||||
| Total stockholders’ deficit |
(36,500 | ) | (53,345 | ) | ||||
|
|
|
|
|
|||||
| Total liabilities and stockholders’ deficit |
$ | 34,516 | $ | 31,176 | ||||
|
|
|
|
|
|||||
See accompanying notes to consolidated financial statements.
85
Table of Contents
VALERITAS HOLDINGS, INC. AND SUBSIDIARY
CONSOLIDATED STATEMENTS OF OPERATIONS
(In thousands, except share and per share data)
| Year Ended December 31, |
||||||||
| 2016 | 2015 | |||||||
| Revenue, net |
$ | 19,550 | $ | 18,097 | ||||
| Cost of goods sold |
12,606 | 14,237 | ||||||
|
|
|
|
|
|||||
| Gross margin |
6,944 | 3,860 | ||||||
| Operating expense: |
||||||||
| Research and development |
4,842 | 6,523 | ||||||
| Selling, general and administrative |
33,481 | 44,680 | ||||||
| Restructuring (note 11) |
2,394 | — | ||||||
|
|
|
|
|
|||||
| Total operating expense |
40,717 | 51,203 | ||||||
|
|
|
|
|
|||||
| Operating loss |
(33,773 | ) | (47,343 | ) | ||||
| Other income (expense): |
||||||||
| Interest expense, net |
(12,151 | ) | (16,317 | ) | ||||
| Change in fair value of derivative liabilities |
(549 | ) | 443 | |||||
| Other income |
106 | — | ||||||
| Offering costs (including 2014 capitalized IPO costs) |
— | (3,978 | ) | |||||
|
|
|
|
|
|||||
| Total other income (expense) |
(12,594 | ) | (19,852 | ) | ||||
|
|
|
|
|
|||||
| Net loss |
$ | (46,367 | ) | $ | (67,195 | ) | ||
|
|
|
|
|
|||||
| Net loss per share of common share outstanding — basic and diluted (note 16) |
$ | (4.88 | ) | $ | (278.75 | ) | ||
| Weighted average common shares outstanding — basic and diluted (note 16) |
9,496,838 | 241,055 | ||||||
See accompanying notes to consolidated financial statements.
86
Table of Contents
VALERITAS HOLDINGS, INC. AND SUBSIDIARY
CONSOLIDATED STATEMENTS OF STOCKHOLDERS’ DEFICIT
(In thousands, except share data)
| Preferred Stock | Common Stock | Additional Paid-in capital |
Accumulated Deficit |
Total stockholders’ deficit |
||||||||||||||||||||||||
| Shares | Amount | Shares | Amount | |||||||||||||||||||||||||
| Balance—December 31, 2014 |
— | $ | — | — | $ | — | $ | 292,958 | $ | (310,677 | ) | $ | (17,719 | ) | ||||||||||||||
| Share-based compensation expense |
— | — | — | — | 5,425 | — | 5,425 | |||||||||||||||||||||
| Investors capital contributions (note 1) |
— | — | — | — | 17,813 | — | 17,813 | |||||||||||||||||||||
| Warrants issued in connection with senior secured debt (note 1) |
— | — | — | — | 17 | — | 17 | |||||||||||||||||||||
| Issuance of common stock, net of expense (note 9) |
— | — | 1,631,738 | 2 | 8,312 | — | 8,314 | |||||||||||||||||||||
| Net loss |
— | — | — | — | — | (67,195 | ) | (67,195 | ) | |||||||||||||||||||
|
|
|
|
|
|
|
|
|
|
|
|
|
|
|
|||||||||||||||
| Balance—December 31, 2015 |
— | — | 1,631,738 | 2 | 324,525 | (377,872 | ) | (53,345 | ) | |||||||||||||||||||
|
|
|
|
|
|
|
|
|
|
|
|
|
|
|
|||||||||||||||
| Share-based compensation expense |
— | — | — | — | 3,499 | — | 3,499 | |||||||||||||||||||||
| Issuance of common stock as a result of the exercise of warrants by related party |
— | — | 1,407,476 | 1 | 8,932 | — | 8,933 | |||||||||||||||||||||
| Issuance of common stock, net of expense to related party (note 9) |
— | — | 1,110,613 | 1 | 5,818 | — | 5,819 | |||||||||||||||||||||
| Conversion of accrued interest to Common Stock by related parties (note 9) |
— | — | 2,450,160 | 3 | 17,931 | — | 17,934 | |||||||||||||||||||||
| Issuance of common stock in private placement offering, net of expense |
— | — | 5,079,000 | 5 | 23,693 | — | 23,698 | |||||||||||||||||||||
| Recapitalization for reverse merger (note 9) |
— | — | 1,000,004 | 1 | (1 | ) | — | — | ||||||||||||||||||||
| Shares issued for restricted stock compensation (note 9) |
— | — | 48,750 | — | 293 | — | 293 | |||||||||||||||||||||
| Cancellation of warrants previously classified as derivative liabilities (note 9) |
— | — | — | — | 3,036 | — | 3,036 | |||||||||||||||||||||
| Net loss |
— | — | — | — | — | (46,367 | ) | (46,367 | ) | |||||||||||||||||||
|
|
|
|
|
|
|
|
|
|
|
|
|
|
|
|||||||||||||||
| Balance—December 31, 2016 |
— | $ | — | 12,727,741 | $ | 13 | $ | 387,726 | $ | (424,239 | ) | $ | (36,500 | ) | ||||||||||||||
|
|
|
|
|
|
|
|
|
|
|
|
|
|
|
|||||||||||||||
See accompanying notes to consolidated financial statements.
87
Table of Contents
VALERITAS HOLDINGS, INC. AND SUBSIDIARY
CONSOLIDATED STATEMENTS OF CASH FLOWS
(In thousands)
| Year Ended December 31, |
||||||||
| 2016 | 2015 | |||||||
| Operating activities |
||||||||
| Net loss |
$ | (46,367 | ) | $ | (67,195 | ) | ||
| Adjustments to reconcile net loss to net cash used in operating activities: |
||||||||
| Depreciation and amortization of property and equipment |
2,041 | 1,680 | ||||||
| Amortization of financing costs |
4,402 | 4,632 | ||||||
| Noncash interest expense |
7,760 | 11,647 | ||||||
| Obsolete inventory reserve |
— | (883 | ) | |||||
| Share-based compensation expense |
3,792 | 5,425 | ||||||
| Offering costs (including 2014 capitalized IPO costs) |
— | 3,978 | ||||||
| Increase / (decrease) in fair value of derivatives |
549 | (443 | ) | |||||
| Bad debt expense |
154 | — | ||||||
| Impairment of PPE |
28 | — | ||||||
| Gain on sale of property and equipment |
(134 | ) | — | |||||
| Changes in: |
||||||||
| Accounts receivable |
(474 | ) | (465 | ) | ||||
| Other receivables |
320 | (184 | ) | |||||
| Inventories |
1,400 | (1,196 | ) | |||||
| Deferred cost of goods sold |
173 | (50 | ) | |||||
| Prepaid expense and other current assets |
166 | 99 | ||||||
| Other assets |
126 | 45 | ||||||
| Accounts payable |
(2,828 | ) | 3,343 | |||||
| Accrued expense |
(424 | ) | (1,525 | ) | ||||
| Deferred revenue |
(272 | ) | 263 | |||||
| Deferred rent liability |
(73 | ) | (55 | ) | ||||
|
|
|
|
|
|||||
| Net cash used in operating activities |
(29,661 | ) | (40,884 | ) | ||||
|
|
|
|
|
|||||
| Investing activities |
||||||||
| Proceeds from sales of property and equipment |
134 | — | ||||||
| Acquisition of property and equipment |
(173 | ) | (987 | ) | ||||
|
|
|
|
|
|||||
| Net cash used in investing activities |
(39 | ) | (987 | ) | ||||
|
|
|
|
|
|||||
| Financing activities |
||||||||
| Repayment of capital lease |
(26 | ) | (153 | ) | ||||
| Investor capital contributions ($3,000 and $5,000 from related parties WCAS and CRG respectively in 2015. See note 8) |
— | 17,982 | ||||||
| Proceeds from issuance of common stock ($20,000 from related party CRG in 2016. See note 8) |
25,395 | — | ||||||
| Proceeds from issuance of Series AB ($5,819 and $5,117 received from related party CRG in 2016 and 2015, respectively) |
5,819 | 8,549 | ||||||
| Proceeds from exercise of warrants by a related party |
7,375 | — | ||||||
| Common stock issuance costs |
— | (244 | ) | |||||
| Offering costs |
(1,431 | ) | (2,418 | ) | ||||
| Costs associated with debt restructuring |
(355 | ) | — | |||||
|
|
|
|
|
|||||
| Net cash provided by financing activities |
36,777 | 23,716 | ||||||
|
|
|
|
|
|||||
| Net increase (decrease) in cash and cash equivalents |
7,077 | (18,155 | ) | |||||
| Cash and cash equivalents—beginning of period |
2,789 | 20,944 | ||||||
|
|
|
|
|
|||||
| Cash and cash equivalents—end of period |
$ | 9,866 | $ | 2,789 | ||||
|
|
|
|
|
|||||
| Supplemental disclosures of cash flow information |
||||||||
| Reclassification of derivative liability upon exercise of warrants |
$ | 1,557 | $ | — | ||||
| Cancellation of derivative liability |
$ | 3,036 | $ | — | ||||
| Issuance of derivative liabilities for PPO warrants |
$ | 226 | $ | — | ||||
| Conversion of interest and fees and write off of remaining debt discounts |
$ | 17,934 | $ | — | ||||
| Write off of fully reserved inventory |
$ | 898 | $ | — | ||||
| Issuance of Series AB Preferred Stock warrants |
$ | 4,000 | $ | — | ||||
| Noncash investing and financing transactions |
||||||||
| Accrued property and equipment additions |
$ | 25 | $ | — | ||||
| Accrued offering costs |
$ | — | $ | (405 | ) | |||
| Accrued issuance costs |
$ | — | $ | 160 | ||||
See accompanying notes to consolidated financial statements.
88
Table of Contents
VALERITAS HOLDINGS, INC. AND SUBSIDIARY
NOTES TO CONSOLIDATED FINANCIAL STATEMENTS
1. NATURE OF OPERATIONS AND ORGANIZATION
Organization and Nature of Operations
Valeritas Holdings, Inc. (formerly Cleaner Yoga Mat, Inc.) was incorporated in Florida on May 9, 2014 and was previously engaged in the sale of sanitizing solutions for Yoga and Pilates studios as well of conventional gyms of all sizes. Valeritas Holdings, Inc. was then reincorporated in Delaware on May 3, 2016.
As used in these Notes, the terms “Valeritas” and the “private company” refer to the business of Valeritas, Inc. prior to the 2016 Merger, the term “Valeritas Holdings, Inc.” or the “Company” refers to the combination of Valeritas and Valeritas Holdings, Inc. after giving retrospective effect to the recapitalization under the 2016 Merger.
Valeritas was incorporated in the state of Delaware on December 27, 2007 when it was converted into a Delaware Corporation from a Delaware limited liability company, which was formed on August 2, 2006 and changed its name from Valeritas LLC. The Company is a commercial-stage medical technology company focused on developing innovative technologies to improve the health and quality of life of people with Type 2 diabetes. The Company designed its first commercialized product, the V-Go Disposable Insulin Delivery device, or V-Go, to help patients with Type 2 diabetes who require insulin to achieve and maintain their target blood glucose goals. V-Go is a small, discreet, easy-to-use wearable and completely disposable insulin delivery device that a patient adheres to his or her skin every 24 hours. V-Go enables patients to closely mimic the body’s normal physiologic pattern of insulin delivery throughout the day and to manage their diabetes with insulin without the need to plan a daily routine around multiple daily injections.
2016 Reverse Merger and Recapitalization
On May 3, 2016, pursuant to an Agreement and Plan of Merger and Reorganization (the “Merger Agreement”), by and among Valeritas Holdings, Inc., Valeritas Acquisition Corp., a Delaware corporation and a direct wholly owned subsidiary of Valeritas Holdings, Inc. (the “Acquisition Subsidiary”) and Valeritas, Inc., Acquisition Subsidiary was merged with and into Valeritas, with Valeritas being the surviving entity and as a wholly owned subsidiary of Valeritas Holdings, Inc. (the “2016 Merger”). Immediately prior to the 2016 Merger, all shares of common stock, Series D Preferred Stock, Series AA Preferred Stock, and shares underlying common stock options and shares underlying the warrants were canceled without consideration. Concurrent with the 2016 merger, the shares of Valeritas private company Series AB Preferred Stock were canceled and each share of private company Series AB Preferred Stock of Valeritas was replaced with 0.23856 shares of common stock of Valeritas Holdings, Inc.
Upon the closing of the Merger, under the terms of a split-off agreement and a general release agreement, Valeritas Holdings, Inc. transferred all of its pre-Merger operating assets and liabilities to its wholly owned special purpose subsidiary (“Split-Off Subsidiary”), and transferred all of the outstanding shares of capital stock of Split-Off Subsidiary to the pre-Merger majority stockholder of Valeritas Holdings, Inc. (the “Split-Off”), in consideration of and in exchange for (i) the surrender and cancellation of 40,486,000 shares of Valeritas Holdings, Inc. common stock held by such stockholder (which will be cancelled and will resume the status of authorized but unissued shares of Valeritas Holdings, Inc. common stock) and (ii) certain representations, covenants and indemnities.
The Merger was accounted for as a “reverse merger,” and Valeritas was deemed to be the accounting acquirer in the reverse merger. The historical financial statements prior to the 2016 Merger are the historical financial statements of Valeritas.
89
Table of Contents
Amounts for Valeritas historical (pre-merger) common stock, preferred stock, warrants, and stock options including share and per share amounts have been retroactively adjusted using their respective exchange ratio in these financial statements, unless otherwise disclosed. Any amounts funded in connection with the original issuance of the common stock, Series D Preferred Stock and Series AA Preferred Stock have been retrospectively adjusted and accounted for as capital contributions as those classes of Valeritas stock did not receive common shares of Valeritas Holdings, Inc. in connection with the 2016 Merger. All shares of Valeritas Series AB Preferred Stock have been retrospectively adjusted to common stock of Valeritas Holdings, Inc. based upon the exchange ratio noted above.
Private Placement Offering
Concurrently with the closing of the 2016 Merger, and as a condition to the Merger, Valeritas, Inc. closed a private placement offering (the “Private Placement”) of approximately 5 million shares of Valeritas Holdings, Inc. common stock at a purchase price of $5.00 per share, for gross proceeds of approximately $25 million. Existing investors of Valeritas, Inc. invested $20 million of the Private Placement.
In connection with the Private Placement, Valeritas, Inc. incurred costs of approximately $1.0 million in fees, of which $0.3 million is in the form of warrants to purchase 83,120 shares of Valeritas Holdings, Inc. common stock at an exercise price of $5.00 to the placement agents. $0.6 million are fees paid in cash to the placement agents whilst the remainder $0.1 million are reimbursed expenses (including legal fees incurred by placement agent) paid to the placement agents.
Reorganization of Valeritas Holdings, LLC
During the second quarter of 2014, Valeritas consummated a series of transactions designed to facilitate future capital raising by simplifying its capitalization (the “2014 Reorganization”). As a result of the 2014 Reorganization, Valeritas, Inc. became a direct, wholly owned subsidiary of Valeritas Holdings, LLC (“Holdings LLC”).
On March 7, 2016, the Company dissolved Valeritas Holdings, LLC. Prior to the dissolution, Valeritas Holdings, LLC distributed all its assets, including 6,923,076 shares of Valeritas, Inc. common stock, pro-ratably to Series C holders of Holdings LLC, based on the aggregate liquidation preference of the units held by each holder as set out in the Amended and Restated Limited Liability Company Agreement. Based upon the aggregate liquidation preference of the units on March 7, 2016, the common stockholders as well as the Series A and Series B preferred stockholders of Valeritas Holdings, LLC did not receive common shares of Valeritas, Inc. upon dissolution. As a result of the dissolution, the 2008 Employee Equity Compensation Plan was terminated and all options outstanding thereunder were cancelled.
2. LIQUIDITY, UNCERTAINTIES AND GOING CONCERN
The Company is subject to a number of risks similar to those of early stage companies, including dependence on key individuals, the difficulties inherent in the development of a commercial market, the potential need to obtain additional capital necessary to fund the development of its products, and competition from larger companies.
The Company has incurred losses each year since inception and has experienced negative cash flows from operations in each year since inception. As of December 31, 2016 and 2015, the Company had an accumulated deficit of $424.2 million and $377.9 million, respectively. In April 2015, the Company defaulted on its Senior Secured Debt with Capital Royal Group (“CRG”), resulting in CRG calling the outstanding loan and accrued interest of $57.6 million for immediate repayment. The Company entered into a series of forbearance agreements with CRG which deferred the repayment of the loan and accrued interest until April 30, 2016. In connection with the 2016 Merger, the debt was further restructured (see Note 4).
90
Table of Contents
As of December 31, 2016, the Company had $9.9 million in cash and cash equivalents which will not be sufficient to fund the operations of the Company or to maintain the liquidity covenant over the next twelve months from the issuance date of this report. The Company estimates that their cash position will be sufficient to satisfy cash needs, based on current operations, through March 2017. These factors raise substantial doubt regarding the Company’s ability to continue as a going concern.
The Company is actively pursuing additional sources of financing to fund its operations. As the date of this report, the Company is undergoing a round of capital fund raising as detailed within Form S-1 filed on February 6, 2017. On February 9, 2017, the Company entered into an agreement with CRG to, among other things, reduce the amount required by the liquidity covenant that the Company maintain a cash balance greater than $5.0 million to $2.0 million. The minimum cash balance covenant will, however, revert back to $5.0 million in the event the Company is not able to consummate an underwritten public offering with gross proceeds of at least $40.0 million prior to December 31, 2017. The Company can provide no assurances that additional financings will be consummated on acceptable terms, or at all. If the Company is unable to effect a sufficient financing or capital raise, there could be a material adverse effect on the Company.
These consolidated financial statements have been prepared with the assumption that the Company will continue as a going concern and will be able to realize its assets and discharge its liabilities in the normal course of business and do not include any adjustments to reflect the possible future effects on the recoverability and classification of assets or the amounts and classification of liabilities that may result from the inability of the Company to continue as a going concern.
3. SUMMARY OF SIGNIFICANT ACCOUNTING POLICIES
Principles of Consolidation
The consolidated financial statements reflect the operations of Valeritas Holdings, Inc. and its subsidiary, Valeritas, Inc. All significant intercompany balances and transactions have been eliminated in consolidation.
Use of estimates
The preparation of financial statements in conformity with U.S. GAAP generally requires management to make estimates and assumptions that affect the reported amounts of assets and liabilities and disclosure of contingent assets and liabilities at the date of the consolidated financial statements and the reported amounts of revenue and expense during the period. Actual results could differ from those estimates.
Basis of presentation
The accounting acquirer, recorded the 2016 Merger as the issuance of stock for the common stock of the Valeritas Holdings, Inc. This accounting was identical to a recapitalization. Amounts for the Company’s historical (pre-merger) common stock, preferred stock, warrants on stock and options on common stock including share and per share amounts have been retroactively adjusted using their respective exchange ratios in these financial statements, unless otherwise disclosed. All outstanding Series AA Preferred Stock, Series D Preferred Stock and Common Stock were retired and cancelled prior to the 2016 Merger. The Company has reclassified certain prior-period amounts to conform to the current-period presentation. All outstanding Series AB Preferred Stock was converted to common shares at a ratio of 0.23856 shares of common stock per share of Series AB Preferred Stock.
Deferred offering costs
Deferred offering costs, which primarily consisted of direct incremental legal and accounting fees relating to the Initial Public Offering (IPO), were capitalized at December 31, 2014. Additional IPO costs of $2.0 million were capitalized in 2015. In 2015 the offering was terminated and the previously capitalized deferred offering costs of $4.0 million were expensed.
91
Table of Contents
Segment and Geographic Information
Operating segments are defined as components of an enterprise about which separate discrete financial information is available for evaluation by the chief operating decision-maker (CODM) or decision-making group in making decisions regarding resource allocation and assessing performance. The Company generates its revenue and has employees only in the United States and views its operations as one operating segment as the CODM reviews financial information on a consolidated basis in making decisions regarding resource allocations and assessing performance. The Company owns assets in Asia that are utilized by its contract manufacturer (CMO) in the manufacture of the Company’s products.
Geographic information for property and equipment, net of accumulated depreciation at December 31, 2016 and 2015 is as follows:
| December 31, | ||||||||
| (Dollars in thousands) | 2016 | 2015 | ||||||
| United States |
$ | 920 | $ | 2,067 | ||||
| China |
9,299 | 10,024 | ||||||
|
|
|
|
|
|||||
| Total property and equipment, net |
$ | 10,219 | $ | 12,091 | ||||
|
|
|
|
|
|||||
Cash and cash equivalents
The Company considers investments and interest-bearing deposits with original maturities of three months or less to be cash equivalents. At December 31, 2016 and 2015, there was $9.6 million and $2.3 million, respectively, on deposit at banks in excess of Federal Deposit Insurance Corporation (FDIC) insured limits and de minimis amounts in both 2016 and 2015, in a U.S. Treasury money market fund and U.S. government Agency notes that are not federally insured. No losses have been experienced on such bank deposits, money market fund or notes. The Company does not believe that it is subject to any unusual credit risk beyond the normal credit risk associated with commercial banking relationships.
Restricted Cash
The Company held restricted cash of $0.1 million and $0.2 million as at December 31, 2016 and 2015, respectively as part of its lease agreements. The amounts are included within Cash and cash equivalents balance.
Revenue recognition
The Company’s revenue is generated from V-Go sales in the United States to third-party wholesalers and medical supply distributors that, in turn, sell this product to retail pharmacies or directly to patients with diabetes.
Revenue is recognized when persuasive evidence of an arrangement exists, delivery has occurred and title passed, the price is fixed or determinable, and collectability is reasonably assured. These criteria are applied as follows:
| • | The evidence of an arrangement generally consists of contractual arrangements with third-party wholesalers and medical supply distributor customers. |
| • | Transfer of title and risk and rewards of ownership are passed upon shipment of product to distributors or upon delivery to patients. |
| • | The selling prices are fixed and agreed upon based on the contracts with distributors, the customer and contracted insurance payers, if applicable. For sales to customers associated with insurance providers with whom the Company does not have a contract, the Company recognizes revenue upon collection of cash, at which time the price is determinable. Provisions for discounts and rebates to customers are established as a reduction to revenue in the same period the related sales are recorded. |
92
Table of Contents
| • | The Company considers the overall creditworthiness and payment history of the distributor, customer and the contracted payer in concluding whether collectability is reasonably assured. |
The Company has entered into agreements with wholesalers, distributors and third-party payers throughout the United States. These agreements may include provisions allowing for product discounts and rebates payable by us to third party payers upon dispensing V-Go to patients. Additionally, these agreements customarily provide such wholesalers and distributors with rights to return purchased products within a specific timeframe, as well as prior to such timeframe if the product is damaged in the normal course of business. Subject to certain restrictions, the Company’s wholesaler and distributor customers can return purchased product during a period that begins six months prior to V-Go’s expiration date and ends one year after the expiration date. The V-Go expiration date is determined by adding 36 months to the date of manufacture. Additionally, returns are no longer honored after delivery to the patient.
The Company is currently unable to reasonably estimate future returns due to lack of sufficient historical return data for V-Go. Accordingly, it invoices customers, records deferred revenue at gross invoice sales price less estimated cash discounts and distribution fees, and records a related deferred cost of goods sold. The Company defers recognition of revenue and the related cost of goods sold on shipments of V-Go until the product has been distributed to patients based on an analysis of third-party information. When the Company believes there is sufficient historical data to develop reasonable estimates of expected returns based upon historical returns, it plans to recognize product sales upon shipment to customers.
Major Customers and Concentration of Credit Risk
As discussed above, the Company ships product to third-party wholesalers and medical supply distributors that, in turn, sell this product to retail pharmacies or directly to patients with diabetes. Upon shipment, the Company records deferred revenue and a related receivable.
Estimated revenue from significant customers as a percentage of the Company’s consolidated gross revenue was as follows:
| Year Ended December 31, |
||||||||
| 2016 | 2015 | |||||||
| McKesson Corporation |
35.7 | % | 37.8 | % | ||||
| AmerisourceBergen Corporation |
31.0 | % | 26.7 | % | ||||
| Cardinal Health |
24.3 | % | 25.5 | % | ||||
The Company’s three largest customers accounted for receivables in excess of ten percent of gross accounts receivable at December 31, 2016 and 2015:
| December 31, | ||||||||
| 2016 | 2015 | |||||||
| Amerisource Bergen Corporation |
47.0 | % | 35.5 | % | ||||
| McKesson Corporation |
25.4 | % | 31.2 | % | ||||
| Cardinal Health |
17.0 | % | 21.5 | % | ||||
The Company believes that these customers are of high credit quality and that the Company is not subject to unusual risk with respect to such customers, and generally does not require collateral.
The Company maintains an allowance for doubtful accounts amounting to a de minimus value as at December 31, 2016 and 2015.
93
Table of Contents
Inventories
Inventories consists of raw materials, work in process and finished goods, which are valued at the lower of cost or market. Cost is determined on a first in, first out, or FIFO, basis and includes material costs, labor and applicable overhead. The Company reviews its inventory for excess or obsolescence and writes down inventory that has no alternative uses to its net realizable value.
Property and equipment
Property and equipment are carried at cost less accumulated depreciation. Depreciation is recorded on a straight-line basis over the estimated useful lives of the respective assets. Leasehold improvements are depreciated over the shorter of the lease term or the estimated useful life of the asset. Maintenance and repairs are expensed when incurred.
Construction-in-Progress
Assets under construction at manufacturing facilities are capitalized as construction-in-progress. The cost of construction-in-progress comprises its purchase price and any costs directly attributable to bringing it into working condition for its intended use. Construction-in-progress amounts incurred at manufacturing facilities are presented as a separate asset within PP&E. Construction-in-progress is not depreciated. Once the asset is complete and available for use, depreciation is commenced.
Impairment of Long-Lived Assets
Long-lived tangible assets with finite lives are tested for impairment whenever events or changes in circumstances indicate that the carrying amount of an asset may not be recoverable. Recoverability of long-lived tangible assets to be held and used is measured by a comparison of the carrying amount of the asset to future undiscounted net cash flows expected to be generated by the asset. If the carrying amount exceeds the undiscounted cash flows, the impairment to be recognized is measured by determining the amount by which the carrying amount exceeds the fair value of the asset. Fair value may be determined using appraisals, management estimates and discounted cash flow calculations.
Warrants
The Company accounts for warrant instruments that either conditionally or unconditionally obligate the issuer to transfer assets and liabilities regardless of the timing of the redemption feature or price, even though the underlying shares may be classified as permanent or temporary equity. These warrants are subject to revaluation at each balance sheet date, and any changes in fair value are recorded as a component of other income (expense), until the earlier of their exercise or expiration or the completion of a liquidation event, including the IPO, at which time the warrant liability was reclassified to stockholders’ equity. The warrant liability totaled $0.2 million and $0.0 million at December 31, 2016 and 2015, respectively (see Note 10).
Income taxes
The Company accounts for income taxes using the asset and liability method. Deferred tax assets and liabilities are recognized for the future tax consequences attributable to differences between carrying amounts of assets and liabilities for financial reporting purposes and the amounts used for income tax reporting purposes and for operating loss and tax credit carry forwards. Deferred tax assets and liabilities are measured using enacted tax rates expected to apply in the years in which these temporary differences are expected to be recovered or settled. A valuation allowance is established to reduce net deferred tax assets to the amount expected to be realized. The effect on deferred tax assets and liabilities of a change in tax rates is recognized in results of operations in the period that includes the enactment date. The Company recognizes the effect of income tax positions only if those
94
Table of Contents
positions are more likely than not of being sustained. Recognized income tax positions are measured at the largest amount that is greater than 50% likely of being recognized. Changes in recognition and measurement are reflected in the period in which the change in judgment occurs. Interest and penalties related to unrecognized tax benefits are included in income tax expense.
Research and development expenses
Research and development expenses are expensed as incurred and are primarily comprised of the following types of costs incurred in performing research and development activities:
| • | contract services; |
| • | testing samples and supplies; |
| • | salaries and benefits; and |
| • | overhead and occupancy costs. |
Advertising
Advertising costs, which include promotional expenses, are included in selling, general and administrative expenses in the consolidated statements of operations and are expensed as incurred. Advertising expenses were $7.7 million and $12.2 million for the years ended December 31, 2016 and 2015, respectively.
Share-based compensation
The Company measures the cost of awards of equity instruments based on the grant date fair value of the awards. That cost is recognized on a straight-line basis over the period during which the employee is required to provide service in exchange for the entire award.
The fair value of stock options on the date of grant is calculated using the Black Scholes option pricing model, based on key assumptions such as the fair value of common stock, expected volatility and expected term. Compensation cost for restricted stock awards issued to employees is measured using the grant date fair value of the award, net of estimated forfeitures, adjusted to reflect actual forfeitures. The Company’s estimates of these important assumptions are primarily based on third-party valuations, historical data, peer company data and the judgment of management regarding future trends and other factors.
Fair Value Measurements
The Company’s financial instruments consist primarily of cash and cash equivalents, accounts receivable, accounts payable and accrued liabilities, debt instruments and derivative liabilities.
Fair value is defined as the exchange price that would be received for an asset or paid to transfer a liability (an exit price) in the principal or most advantageous market for the asset transaction between market participants on the measurement date. Valuation techniques used to measure fair value must maximize the use of observable inputs and minimize the use of unobservable inputs. The fair value accounting guidance establishes a fair value hierarchy based on three levels of inputs, of which the first two are considered observable and the last unobservable, that may be used to measure fair value:
| • | Level 1—Quoted prices in active markets for identical assets or liabilities. |
| • | Level 2—Inputs other than quoted prices included within Level 1 that are observable for the asset or liability, either directly or indirectly. Level 2 inputs include quoted prices for similar assets and liabilities in active markets, quoted prices for identical or similar assets or liabilities in markets that are not active, inputs other than quoted prices that are observable for the asset or liability (i.e., interest |
95
Table of Contents
| rates, yield curves, etc.), and inputs that are derived principally from or corroborated by observable market data by correlation or other means (market corroborated inputs). |
| • | Level 3—Inputs are unobservable and reflect the Company’s assumptions as to what market participants would use in pricing the asset or liability. The Company develops these inputs based on the best information available. |
It is the Company’s policy to maximize the use of observable inputs and minimize the use of unobservable inputs when developing fair value measurements. When available, the Company uses quoted market prices to measure fair value. If market prices are not available, the fair value measurement is based on models that use primarily market based parameters including interest rate yield curves, option volatilities and currency rates. In certain cases where market rate assumptions are not available, the Company is required to make judgments about assumptions market participants would use to estimate the fair value of a financial instrument. Changes in the underlying assumptions used, including discount rates and estimates of future cash flows could significantly affect the results of current or future values. The results may not be realized in an actual sale or immediate settlement of an asset or liability.
Please refer to Note 14 Fair Value Measurements for further discussion of the fair value of financial instruments.
Recently Issued Accounting Standards
On May 28, 2014, the FASB issued ASU No. 2014-09, Revenue from Contracts with Customers, which requires an entity to recognize the amount of revenue to which it expects to be entitled for the transfer of promised goods or services to customers. The ASU will replace most existing revenue recognition guidance in U.S. GAAP when it becomes effective. In August 2015, the FASB issued ASU No. 2015-14, Revenue from Contracts with Customers (Topic 606): Deferral of the Effective Date, which delayed the effective date of the new standard from January 1, 2017 to January 1, 2018. The FASB also agreed to allow entities to choose to adopt the standard as of the original effective date. This ASU permits the use of either the retrospective or cumulative effect transition method. The Company is evaluating the effect that ASU 2014-09 will have on the Company’s consolidated financial statements and related disclosures. The Company has not yet selected a transition method nor has the Company determined the effect of the standard on the Company’s ongoing financial reporting.
In November 2015, the FASB issued ASU No. 2015-17, Income Taxes (Topic 740): Balance Sheet Classification of Deferred Tax Assets (“ASU 2015-17”). ASU 2015-17 requires deferred tax liabilities and assets to be classified as noncurrent in the consolidated balance sheet. The amendment may be applied either prospectively to all deferred tax liabilities and assets or retrospectively to all periods presented. The Company is currently evaluating the impact that the adoption of ASU 2015-17 will have on its financial statements. The Company does not anticipate a material impact as no deferred tax amounts are currently presented on the balance sheet due to the valuation allowance.
In January 2016, the FASB issued ASU 2016-01, Financial Instruments-Overall (Subtopic 825-10): Recognition and Measurement of Financial Assets and Financial Liabilities. The amendments in ASU 2016-01, among other things, requires equity investments (except those accounted for under the equity method of accounting, or those that result in consolidation of the investee) to be measured at fair value with changes in fair value recognized in net income; Requires separate presentation of financial assets and financial liabilities by measurement category and form of financial asset (i.e., securities or loans and receivables); Eliminate the requirement to disclose the fair value of financial instruments measured at amortized cost for entities that are not public business entities. The amendments in this ASU are effective for non-public companies for fiscal years beginning after December 15, 2018, and interim periods within fiscal years beginning December 15, 2019. Early adoption of the amendments in the ASU is permitted as early as the fiscal years beginning after December 15, 2017, including interim periods within those fiscal years. The adoption of this standard is not expected to have a material effect on the consolidated financial position and results of operations and statements of cash flows.
96
Table of Contents
In February 2016, the FASB issued new guidance related to how an entity should recognize lease assets and lease liabilities. The guidance specifies that an entity who is a lessee under lease agreements should recognize lease assets and lease liabilities for those leases classified as operating leases under previous FASB guidance. The guidance is effective for us beginning in the first quarter of 2019. Early adoption is permitted. In transition, lessees and lessors are required to recognize and measure leases at the beginning of the earliest period presented using a modified retrospective approach. The Company is evaluating the impact of adopting this guidance on the Company’s consolidated financial condition, results of operations and cash flows.
In March 2016, the FASB issued new guidance which involves several aspects of the accounting for share-based payment transactions including the income tax consequences, classification of awards as either equity or liabilities, and classification on the statement of cash flows. Under the new standard, income tax benefits and deficiencies are to be recognized as income tax expense or benefit in the income statement and the tax effects of exercised or vested awards should be treated as discrete items in the reporting period in which they occur. An entity should also recognize excess tax benefits regardless of whether the benefit reduces taxes payable in the current period. Excess tax benefits should be classified along with other income tax cash flows as an operating activity. In regards to forfeitures, the entity may make an entity-wide accounting policy election to either estimate the number of awards that are expected to vest or account for forfeitures when they occur. This ASU is effective for fiscal years beginning after December 15, 2016 including interim periods within that reporting period, however early adoption is permitted. The Company is currently evaluating the guidance to determine the Company’s adoption method and the effect it will have on the Company’s Consolidated Financial Statements.
In June 2016, the FASB issued ASU No. 2016-13, Financial Instruments—Credit Losses (“ASU 2016-13”) that introduces a new methodology for accounting for credit losses on financial instruments, including available-for-sale debt securities. The guidance establishes a new “expected loss model” that requires entities to estimate current expected credit losses on financial instruments by using all practical and relevant information. Any expected credit losses are to be reflected as allowances rather than reductions in the amortized cost of available-for-sale debt securities. Early adoption is permitted for annual periods beginning after December 15, 2018, and interim periods therein. The Company is currently evaluating the potential impact that ASU 2016-13 may have on its financial position and results of operations.
In August 2016, the FASB issued ASU No. 2016 -15, Statement of Cash Flows (Topic 230): Classification of Certain Cash Receipts and Cash Payments that addresses eight specific cash flow presentation and classification issues with the objective of reducing the existing diversity in practice. The issues addressed include presentation and classification of: Debt Prepayment or Debt Extinguishment Costs, Settlement of Zero-Coupon Debt Instruments or Other Debt Instruments with Coupon Interest Rates That Are Insignificant in Relation to the Effective Interest Rate of the Borrowing, Contingent Consideration Payments Made after a Business Combination, Proceeds from the Settlement of Insurance Claims, Proceeds from the Settlement of Corporate-Owned Life Insurance Policies, including Bank-Owned Life Insurance Policies, Distributions Received from Equity Method Investees, Beneficial Interests in Securitization Transactions and Separately Identifiable Cash Flows and Application of the Predominance Principle. This amendment is effective for the Company in the fiscal year beginning December 15, 2017, but early adoption is permissible. The Company is currently evaluating the potential impact that ASU 2016-15 may have on its financial position and statement of cash flows.
In November 2016, the FASB issued ASU No. 2016-18, Statement of Cash Flows (Topic 230): Restricted Cash (“ASU 2016-18”) that changes the presentation of restricted cash and cash equivalents on the statement of cash flows. Restricted cash and restricted cash equivalents will be included with cash and cash equivalents when reconciling the beginning-of-period and end-of-period total amounts shown on the statement of cash flows. This amendment is effective for the Company in the fiscal year beginning October 1, 2018, but early adoption is permissible. The Company has early adopted this ASU in this financial statement.
97
Table of Contents
4. DEBT
At December 31, 2016 and 2015, the Company had the following debt outstanding:
| December 31, | ||||||||
| (Dollars in thousands) | 2016 | 2015 | ||||||
| Senior secured debt, net |
$ | 50,000 | $ | 50,000 | ||||
| Prepayment fee |
— | 2,438 | ||||||
| Payment-in-kind (PIK) interest |
3,852 | 10,956 | ||||||
| Issuance costs |
(214 | ) | (301 | ) | ||||
|
|
|
|
|
|||||
| Total senior secured debt, net |
53,638 | 63,093 | ||||||
|
|
|
|
|
|||||
| WCAS note payable, net |
5,000 | 4,210 | ||||||
| Payment-in-kind (PIK) interest |
340 | 1,804 | ||||||
|
|
|
|
|
|||||
| Total other note payable, net |
5,340 | 6,014 | ||||||
|
|
|
|
|
|||||
| Total debt |
$ | 58,978 | $ | 69,107 | ||||
|
|
|
|
|
|||||
| Total debt, short-term |
$ | — | $ | 69,107 | ||||
| Total debt, long-term |
$ | 58,978 | $ | — | ||||
Presentation
On May 23, 2013, the Company entered into the Term Loan of $50 million with Capital Royalty Group (“CRG”), structured as a senior secured loan with a six-year term (the “Term Loan” or the “Senior Secured Debt”). In 2015, the Company did not meet the minimum revenue covenant of $50.0 million contained in the Term Loan agreement. Also, the Company did not meet the capital financing targets and was not able to maintain adequate operating cash and working capital all of which triggered the occurrence of a Material Adverse Change as stipulated within the Term Loan agreement. The Company entered into a series of forbearance agreements as described below, which extended the repayment terms through May 3, 2016. Due to the covenant failures and an associated cross-default covenant in the $5.0 million senior subordinated note payable to WCAS Capital Partners IV, L.P., or WCAS, that refers to defaults on other debt instruments held by the Company, both debt balances were being presented as short-term debt in the Company’s consolidated balance sheet at December 31, 2015.
Concurrently with the closing of the 2016 Merger on May 3, 2016, the Company restructured its Term Loan and WCAS Note, which extended the payment term of respective principal balance of $50.0 million and $5.0 million to March 31, 2021 and September 8, 2021, respectively. As such, the Company has classified the principal balances of debt as long-term at December 31, 2016. The Term Loan was further amended on February 9, 2017 (see Note 17).
During the years ended December 31, 2016 and 2015, the Company incurred non-cash interest expense of $7.8 million and $11.6 million, respectively.
Senior Secured Debt
The Term Loan is secured by substantially all of the Company’s assets, including its material intellectual property. The Term Loan bore interest at 11% per annum and compounds annually. Until the third anniversary of the Term Loan, the Company had the option to pay quarterly interest of 7.5% in cash and 3.5% paid-in-kind, or PIK, interest which is added to the aggregate principal amount of the Term Loan on the last day of each quarter. Thereafter, interest on the Term Loan was payable only in cash.
In addition, the Term Loan contained a minimum revenue covenant for 2014 of $25 million which the Company did not meet. The agreement requires the Company to repay the Term Loan principal in an amount that is equal to two times the revenue shortfall, or $23 million, by April 30, 2015 using proceeds from either newly obtained
98
Table of Contents
subordinated debt or an equity financing. In conjunction with the 2014 Reorganization (see note 1), the Company and CRG entered into an agreement amending the Term Loan to provide for conditional waivers of the agreement’s financial covenants, including the minimum revenue covenant for 2014, which would be waived and a prior breach cured as well as lowering the 2015 minimum revenue covenant to $20 million if the Company consummates either an initial public offering (“IPO”) with net proceeds to the Company of at least $40 million by March 31, 2015; private financing of $35 million plus greater of zero or $35 million less aggregate proceeds received from Series D financing with an IPO of $40 million before June 30, 2015; or strategic investment by a publicly listed company of at least $20 million before December 2014 with an IPO of $40 million before June 30, 2015.
On April 3, 2015, it was determined that the Company would not be able to meet the abovementioned capital financing targets. As a result, the waiver to the minimum revenue covenant for 2014 and the reduction in the 2015 minimum revenue covenant were overridden and the Company was in default of the Term Loan. CRG called for an immediate repayment of Term Loan with an additional 4% of default interest rate applied to December 31, 2014 outstanding principal and accrued PIK interest, compounding through to the date of repayment. A 4% prepayment premium was also charged on the aggregate outstanding balance on the date of the repayment.
On May 18, 2015, the Company and CRG entered into a forbearance agreement whereby CRG agreed not to take any actions during the Forbearance Period, which expired on September 29, 2015. During this period, an aggregate interest rate of 15% was applied to aggregate outstanding loan amount, compounded quarterly and capitalized as PIK interest. In addition, a 4% prepayment premium will be charged at the date of repayment of the Term Loan.
On September 28, 2015, the Company and CRG amended the forbearance expiration date to October 30, 2015. On November 31, 2015, both parties amended the forbearance expiration date to December 18, 2015 and on December 21, 2015, the parties deferred the forbearance expiration date again to January 22, 2016. The terms on interest rate and prepayment premium remain the same in the subsequent amendments made to the forbearance agreement. The deferral of the loan repayment dates were considered to be a concession granted by the Lenders. As such, the Company has accounted for the forbearance agreements during 2015 as a troubled debt restructuring (TDR). There was no gain associated with the TDR, however the modified effective interest rate was applied prospectively.
On January 22, 2016, the Company and CRG amended the forbearance agreement to extend the forbearance period to March 31, 2016. As part of the terms within the forbearance agreement, dated January 29, 2016, the Company issued warrants to CRG exercisable into 16,000,000 shares of private company Series AB Preferred Stock at $1.25 per share. The warrant had a term of one year. The warrant fair value at the date of issuance was determined to be $4.0 million, using Black Scholes option pricing model (see note 9). The warrant was accounted for as a debt discount and corresponding derivative liability with the debt discount being amortized through to May 3, 2016, when the Term Loan was restructured.
On March 25, 2016, the Company and CRG amended the forbearance agreement to extend the expiration of the forbearance period to April 30, 2016 and included a number of events that could trigger an earlier expiration of the forbearance agreement. This did not result in any restructuring gain or loss and the modified effective interest rate was applied prospectively.
Concurrently with the closing of the 2016 Merger on May 3, 2016, the Company restructured the Term Loan. CRG converted its outstanding accrued interest and prepayment premium of $16.5 million into 8,609,824 shares of private company Series AB preferred stock and 4,649,859 shares of private company common stock (see WCAS Note Payable for additional conversions during 2016). The private company Series AB shares were then converted into 2,053,959 of the Company’s common stock upon the 2016 Merger and all private company shares of common stock were canceled upon the 2016 Merger. The principal balance was restated as $50 million with
99
Table of Contents
interest rate charged at 11% per annum, which is PIK interest through June 30, 2018 and then both PIK and cash interest thereafter. The provisions of the restructured Term Loan require quarterly interest payments during the term of the loan, which are set to commence on June 30, 2018. The repayment of principal on amounts borrowed under the Term Loan is scheduled to be completed on March 31, 2021.
The restructured Term Loan agreement contains a financial covenant, which requires the Company to maintain a minimum cash balance of $5.0 million. Subsequent to December 31, 2016, this covenant was amended to require the Company to maintain a minimum cash balance of $2.0 million (see Note 17). The minimum cash balance covenant will, however, revert back to $5.0 million if the Company is not able to consummate an underwritten public offering with gross proceeds of at least $40.0 million prior to December 31, 2017. As of December 31, 2016, the Company was in compliance with the financial covenant in the restructured Term Loan agreement, as the Company held cash and cash equivalents of $9.9 million.
Warrant
In 2014, the Company issued warrants to CRG to purchase 177,347 shares of Valeritas common stock exercisable at $0.013 per share. On February 27, 2015, Valeritas issued warrants to purchase 1,802 shares of Valeritas common stock with the same exercise price and terms to those issued in 2014. Valeritas recorded the loan net of original issuance discount calculated fair value of the issued warrants. On January 29, 2016, Valeritas issued CRG additional warrants to acquire 16,000,000 private company Series AB shares at exercise price of $1.25, which would have converted to 3,816,960 shares of common stock in the public company. The fair value of the warrant at the date of issuance is determined to be $4.0 million, which Valeritas recorded as additional debt discount and a derivative liability.
All of the Valeritas common stock and preferred stock warrants issued to CRG were cancelled or exercised during the year ended December 31, 2016. The forbearance agreements entered into during 2015 and 2016, triggered a TDR and accelerated the timing of repayment of the Term Loan to January 22, 2016 which was extended during 2016 through May 3, 2016. The Company accelerated the amortization of the debt discount associated with the private company common stock warrants through January 22, 2016 and accelerated the amortization of the debt discount associated with Valeritas Series AB preferred stock warrants through April 30, 2016. As such, all discounts associated with warrants issued in connection with the Term Loan were fully amortized at April 30, 2016.
Financing costs
The Company recorded the Term Loan net of deferred financing costs paid directly to the creditor (and therefore treated as a discount to the debt) of $0.5 million relating to the lender finance fee of 1%. The discount related to the issuance costs is being amortized over the term of the loan using the effective interest method. The forbearance agreements entered into during 2015 triggered a TDR and accelerated the timing of repayment of the Term Loan to January 22, 2016. The Company accelerated the amortization of the debt discount to coincide with the forbearance period. The carrying amount of the debt discount relating to the original deferred financing costs was $28 as at December 31, 2015. The deferred financing costs was fully amortized at January 22, 2016.
In connection with the restructuring of the Term Loan on May 3, 2016, the Company incurred costs of $0.2 million which were recorded as a discount to the Term Loan balance and will be amortized through the term of the loan using the effective interest rate method. At December 31, 2016, $0.2 million of the restructured debt discount remained.
Lenders Put Option
Upon a change in control or certain asset sales, the Term Loan was to be prepaid in an amount equal to the outstanding principal balance plus accrued and unpaid interest, taking into account a prepayment premium that
100
Table of Contents
started at 5% of the balance and decreased to 0% over time. The Company determined that the prepayment feature qualified as an embedded derivative requiring bifurcation from the debt. On May 23, 2014, the derivative was initially valued at $0.6 million and recorded as a long term liability within “derivative liabilities” in the Company’s consolidated balance sheet with a corresponding discount on the Term Loan. Upon default of the Term Loan, the Lenders called for immediate repayment of the Term Loan including a 4% prepayment penalty. As such, the derivative liability associated with the Term Loan prepayment provision was considered to be extinguished and the prepayment penalty in the amount of $2.4 million was accrued at December 31, 2015. The full prepayment penalty accrued at December 31, 2015 as well as the additional prepayment fee accrued during 2016 prior to the restructuring was included in the interest and fees that were converted into private company common shares and Series AB preferred stock upon the restructuring. As such, the full prepayment fee was extinguished on May 3, 2016. There are no additional prepayment fees in the May 3, 2016 restructured Term Loan.
The original issue discount for the prepayment feature was being amortized over the term of the loan using the effective interest method. The forbearance agreements entered into during 2015 and 2016, triggered a TDR and accelerated the timing of repayment of the Term Loan to January 22, 2016 and the remaining original issue discount was fully amortized in the first quarter of 2016.
WCAS Note Payable
In 2011, the Company issued a $5.0 million senior subordinated note, or the WCAS Note or the Other Note Payable, to WCAS Capital Partners IV, L.P., or WCAS. Amounts due under the WCAS Note originally bore interest at 10% per annum, payable semi-annually. On May 23, 2013, the WCAS Note was amended such that the note then bore interest at 12% per annum, and all interest accrues as compounded PIK interest and is added to the aggregate principal amount of the loan semi-annually. The Company incurred financing costs of $0.5 million to facilitate this borrowing. Upon a change in control, the WCAS note must be prepaid in an amount equal to the outstanding principal balance plus accrued and unpaid interest. The prepayment feature was considered as derivative liability and initially valued at $0.7 million. The Company recorded the WCAS Note net of deferred financing costs and the derivative liability as debt discount and original issue discount for the prepayment feature respectively. Both debt discount and the original issue discount for the prepayment feature were being amortized over the term of the WCAS Note using effective interest rate method with carrying value of $0.4 million and 0.3 million respectively as at December 31, 2015.
On May 18, 2015, WCAS and CRG entered into a Subordination Agreement to subordinate in right and time of payment of WCAS Note to payment in full of the Senior Secured Debt and prohibit WCAS from obtaining any security interests in the Collateral to secure WCAS Note. The then outstanding principal amount of the note, including accrued PIK interest, is due in full in September 2021. The Company may pay off the WCAS Note at any time without penalty.
Concurrently with the closing of the 2016 Merger on May 3, 2016, the Company restructured its WCAS Note. WCAS converted its outstanding accrued interest and fees of $2.1 million to 1,660,530 shares of private company Series AB preferred stock, which were then converted into 396,201 shares of common stock of the Company upon the merger. At the time of the debt restructuring, $0.7 million of remaining in debt discounts arising from the abovementioned debt issuance costs and prepayment feature was extinguished and recorded against equity as the lender is also a shareholder of the Company, resulting in a net credit of $1.4 million to equity.
The principal balance was restated at $5.0 million with 10% per annum payable entirely as paid-in-kind interest and debt maturity date set at September 8, 2021. No interest payments are required during the term of the loan. The principal balance and any interest accrued during the term of the loan are due on the maturity date.
101
Table of Contents
5. INVENTORY
Inventory at December 31, 2016 and 2015 consists of:
| December 31, | ||||||||
| (Dollars in thousands) | 2016 | 2015 | ||||||
| Raw materials |
$ | 1,117 | $ | 1,587 | ||||
| Work in process |
1,434 | 2,659 | ||||||
| Finished goods |
6,833 | 6,538 | ||||||
|
|
|
|
|
|||||
| Total |
$ | 9,384 | $ | 10,784 | ||||
|
|
|
|
|
|||||
The inventory reserves at December 31, 2016 and 2015 were $1,443 and $2,341.
6. PROPERTY AND EQUIPMENT
Property and equipment consisted of the following at December 31, 2016 and 2015:
| December 31, | ||||||||||||
| (Dollars in thousands) | Useful lives | 2016 | 2015 | |||||||||
| Machinery and equipment |
5-10 | $ | 15,150 | $ | 10,594 | |||||||
| Computers and software |
3 | 1,343 | 1,312 | |||||||||
| Leasehold improvements |
6-10 | 212 | 212 | |||||||||
| Office equipment |
5 | 89 | 89 | |||||||||
| Furniture and fixtures |
5 | 206 | 206 | |||||||||
| Construction in process |
114 | 4,931 | ||||||||||
|
|
|
|
|
|||||||||
| Total |
17,114 | 17,344 | ||||||||||
|
|
|
|
|
|||||||||
| Accumulated depreciation |
(6,895 | ) | (5,253 | ) | ||||||||
|
|
|
|
|
|||||||||
| Property and equipment, net |
$ | 10,219 | $ | 12,091 | ||||||||
|
|
|
|
|
|||||||||
Depreciation and amortization expense for the years ended December 31, 2016 and 2015 was $2.0 million and $1.7 million respectively.
7. ACCRUED EXPENSE AND OTHER CURRENT LIABILITIES
At December 31, 2016 and 2015, the Company’s accrued expenses and other current liabilities consisted of the following:
| December 31, | ||||||||
| (Dollars in thousands) | 2016 | 2016 | ||||||
| Compensation |
$ | 2,875 | $ | 2,932 | ||||
| Marketing services |
949 | 863 | ||||||
| Distribution agreements and managed care costs |
959 | 867 | ||||||
| Professional fees |
291 | 623 | ||||||
| Franchise taxes |
52 | 263 | ||||||
| Travel expenses |
53 | 144 | ||||||
| Manufacturing expenses |
89 | 46 | ||||||
| Other accruals |
264 | 193 | ||||||
|
|
|
|
|
|||||
| Total |
$ | 5,532 | $ | 5,931 | ||||
|
|
|
|
|
|||||
102
Table of Contents
8. RELATED PARTIES
On September 8, 2011, the Company entered into a Management Services Agreement with Welsh, Carson, Anderson & Stowe XI, L.P., a Series D shareholder prior to the 2016 recapitalization. Certain affiliates of Welsh Carson, Anderson & Stowe XI, L.P. were also Series D Preferred shareholders. Under the terms of this agreement, the Company will receive strategic, managerial and operational advice in exchange for an annual fee of $0.5 million. The Company paid cash and incurred an expense of $0.1 million related to this management fee for year December 31, 2015. On May 15, 2015, both parties terminated the Management Services Agreement.
On September 8, 2011, the Company issued the WCAS Note to WCAS, a private company Series D Preferred shareholder (See discussion of “WCAS Note Payable” in note 8). In 2015, Capital Royalty Partners (“CRG”), who are the lenders of Senior Secured Debt, purchased 2,400,000 shares of Series AA Preferred Stock of Valeritas, Inc. for gross proceeds of $3.0 million. Certain affiliates of WCAS are also common stock shareholders as of December 31, 2016. Upon restructuring of the Company’s debt, WCAS converted $2.1 million of outstanding interest into 1,660,530 shares of Series AB Preferred Stock, which was converted to 396,201 shares of common stock of the Company.
In 2015, Capital Royalty Partners (“CRG”), who are the lenders of Senior Secured Debt, purchased 4,000,000 shares of Series AA Preferred Stock and 4,093,596 shares of Series AB Preferred Stock of Valeritas, Inc. for gross proceeds of $5.0 million and $5.1 million respectively. During 2016, CRG participated in additional private company Series AB financing as well as exercised its private company Series AB warrants to acquire additional 10,276,030 shares of private company Series AB Preferred Stock (2,518,089 shares of Valeritas Holdings, Inc. common stock after the 2016 Merger) of the Company for gross amount of $13.2 million. CRG converted its outstanding accrued interest and prepayment premium of approximately $16.5 million into 8,609,824 shares of private company Series AB preferred stock and 4,649,859 shares of private company common stock. The private company Series AB shares were then converted into 2,053,959 shares of the Company’s common stock upon the 2016 Merger and all shares of the private company stock were canceled upon the 2016 Merger. Upon the closing of the 2016 Merger, the aggregate CRG shares of Series AB Preferred Stock were exchanged for 5,487,766 shares of common stock in Valeritas Holdings, Inc. CRG also took part in the PPO, contributing additional $20.0 million for 4,000,000 shares common stock of Valeritas Holdings. The aggregate common shares of Valeritas Holdings, Inc. held by CRG upon closing of the 2016 Merger were 9,487,763.
9. STOCKHOLDERS’ DEFICIT
In connection with the 2016 Merger and the retrospective application of the recapitalization of the Company, the par value of common stock of Valeritas Holdings, Inc. of $0.001 and the authorized shares of 300,000,000 common shares and 10,000,000 shares of blank check preferred stock with par value of $0.001 of Valeritas Holdings, Inc. became the capital structure of the Company. No preferred stock at Valeritas Holdings, Inc. has been issued.
Concurrently with the closing of the 2016 Merger, and as a condition to the 2016 Merger, the Company closed a private placement offering (the “Private Placement”) of approximately 5 million shares of common stock of Valeritas Holdings at a purchase price of $5.00 per share, for proceeds of approximately $24.0 million, net of financing costs. Existing investors of the Company invested $20.0 million of the Private Placement. The pre-2016 Merger stockholders of the Company retained an aggregate of 1,000,004 shares of common stock.
Prior to the 2016 Merger and recapitalization, Valeritas, Inc. recognized the following preferred stock transactions in the Private Company shares:
Series D Convertible Preferred Stock
In January and February 2015, the Company sold 195,122 and 85,000 shares of Series D Preferred Stock for gross proceeds of $1.9 million and $0.8 million respectively. On May 18 and September 28, 2015, 514,321 and
103
Table of Contents
3,001,526 shares of Series D and accrued PIK dividends were converted to common stock of the Private Company for not participating in the full pro-rata amount stated within the respective stock purchase agreements in the subsequent Series AA and Series AB financing. As of December 31, 2015, there were 1,340,865 Series D shares outstanding.
All Series D shares and common shares of Valeritas, Inc. were canceled in connection with the 2016 Merger without consideration and have been retrospectively adjusted in these financial statements.
Series AA Convertible Preferred Stock
In May 2015, 16,000,000 shares of Series AA Preferred Stock were authorized and the Company raised gross proceeds of $15.2 million through the issuance of 12,145,168 shares of Series AA Preferred Stock. On September 28, 2015, 5,615,632 shares of Series AA were converted to common stock of the Private Company for not participating to the full pro-rata amount stated within respective stock purchase agreement in the subsequent Series AB financing. As of December 31, 2015, there were 6,529,536 shares of Series AA Preferred Stock outstanding.
All Series AA shares and common shares of Valeritas, Inc. were canceled in connection with the 2016 Merger without consideration and have been retrospectively adjusted in these financial statements.
Series AB Convertible Preferred Stock
In September 2015, 9,600,000 shares of Series AB Preferred Stock were authorized and the Company raised $3.3 million, $2.8 million and $2.5 million in September, November and December 2015 respectively through the issuance of 2,614,767, 2,215,462 and 2,009,631 shares of Series AB Preferred Stock (623,779, 528,522 and 479,417 common shares of Valeritas Holdings, Inc. after the recapitalization), respectively. On January 29, 2016, the Company filed an Eighth Restated Certificate of Incorporations to increase the authorized number shares of Series AB Preferred Stock to 32,000,000.
The Company issued 4,655,430 shares of private company Series AB Preferred Stock (converted into 1,110,613 shares of common stock of Valeritas Holdings, Inc. as part of the 2016 Merger) on January 29, 2016 for gross proceeds of $5.8 million. During February, March and April of 2016, CRG exercised warrants with respect to 5,900,000 shares of private company Series AB Preferred Stock of Valeritas (converted into 1,407,476 shares of common stock of Valeritas Holdings, Inc. after the 2016 Merger) for gross proceeds of $7.4 million and $1.6 million of derivative liabilities. As of December 31, 2016, all shares of private company Series AB Preferred Stock outstanding was converted to common shares of Valeritas Holdings, Inc. All remaining derivative liabilities associated with the Series AB warrants were reclassified to equity upon cancellation.
Debt Conversion
CRG converted its outstanding accrued interest and prepayment premium of approximately $16.5 million into 8,609,824 shares of private company Series AB preferred stock and 4,649,859 shares of private company common stock. The shares of private company Series AB preferred stock were then converted into 2,053,959 shares of the Company’s common stock upon the 2016 Merger and all shares of the private company common stock were canceled upon the 2016 Merger.
Concurrently with the closing of the 2016 Merger on May 3, 2016, the Company restructured the WCAS Note. WCAS converted its outstanding accrued interest and fees of $2.1 million into 1,660,530 shares of private company Series AB Preferred Stock which were then converted into 396,201 shares of common stock of the Company upon the 2016 Merger. At the time of the debt restructuring, $0.7 million of remaining in debt issuance costs was extinguished and recorded against equity as the lender is also a stockholder of the Company.
104
Table of Contents
Any amounts funded in connection with the original issuance of the common stock, Series D Preferred Stock and Series AA Preferred Stock have been retrospectively adjusted and accounted for as capital contributions as those classes of Valeritas, Inc. stock did not receive common shares of Valeritas Holdings, Inc. in connection with the 2016 Merger. All share amounts for Series AB Preferred Stock have been retrospectively adjusted to common stock of Valeritas Holdings, Inc.
Equity Compensation Plans
Total stock-based compensation expense related to stock options and restricted stock was $3.8 million and $5.4 million for the year ended December 31, 2016 and 2015, respectively, and classified in the consolidated statements of operations as follows:
| Year Ended December 31, |
||||||||
| (Dollars in thousands) | 2016 | 2015 | ||||||
| Cost of goods sold |
$ | 68 | $ | 191 | ||||
| Research and development expenses |
526 | 1,238 | ||||||
| General and administrative expenses |
3,198 | 3,996 | ||||||
|
|
|
|
|
|||||
| Total share-based compensation |
$ | 3,792 | $ | 5,425 | ||||
|
|
|
|
|
|||||
Private Company Stock Options—2008 Plan
The 2008 Plan (the “2008 Plan”) is administered by the Compensation Committee of the Board of Directors. The 2008 Plan provides for the granting of incentive stock options, nonqualified stock options, stock awards, stock appreciation rights, and other equity awards to employees, consultants, advisors, and nonemployee members of the Board of Directors. The entirety of the 2008 Plan was transferred to Holdings LLC as part of the 2014 Reorganization (see note 1). Options outstanding, vesting provisions and all terms of the 2008 Plan remained intact. The existing options were exercisable for Holdings LLC units in the same proportion within the plan as they had been just prior to the transfer. Individuals holding options in the 2008 Plan are all employees of the Private Company and as such the Private Company continues to benefit from their employment and accordingly, continues to recognize the compensation expense associated with those options in its Consolidated Statements of Operations and provide all required disclosures in the notes to the consolidated financial statements.
The final option grant under the 2008 Plan was made on May 27, 2014. No awards were issued in 2015 or 2016 under this plan. The Private Company recognized share based compensation expense related to awards issued under the 2008 Plan for the year ended December 31, 2016 and 2015 of $0.2 million and $1.9 million respectively.
Holdings LLC was dissolved on March 7, 2016 and the 2008 Plan was terminated. All outstanding options of 20,307,149 units were cancelled. As a result of the cancellation of the plans, the Private Company recognized a one-time expense of $0.9 million during 2016.
| Number of shares | Weighted average exercise price |
Weighted average remaining life |
Aggregate intrinsic value |
|||||||||||||
| Outstanding—December 31, 2014 |
21,657,682 | $ | 1.33 | 6.85 years | $ | — | ||||||||||
| Canceled/forfeited |
(1,350,532 | ) | 1.74 | — | — | |||||||||||
|
|
|
|||||||||||||||
| Outstanding—December 31, 2015 |
20,307,149 | 1.30 | 5.75 years | — | ||||||||||||
| Canceled/forfeited |
(20,307,149 | ) | 1.30 | — | — | |||||||||||
|
|
|
|||||||||||||||
| Outstanding—December 31, 2016 |
— | $ | — | — | $ | — | ||||||||||
|
|
|
|||||||||||||||
105
Table of Contents
Private Company Stock Options—2014 Plan
The Private Company has a 2014 Equity Compensation Plan (the “2014 Plan”), which is administered by the Compensation Committee of the Board of Directors. The 2014 Plan provides for the granting of incentive stock options, nonqualified stock options, stock awards, stock appreciation rights, and other equity awards to employees, consultants, advisors, and nonemployee members of the Board of Directors. The exercise price of stock options or stock appreciation rights must be equal to or greater than the fair market value at the time of the grant. Options vest as determined by the Compensation Committee and as specified in the individual grant instrument. Options granted have initial vesting periods that vary for each grantee with monthly vesting thereafter. Options expire ten years from the date of the grant.
The fair value of each option award is estimated on the date of grant using the Black Scholes option pricing model. The fair value is then amortized on a straight-line basis over the requisite service period of the awards, which is generally the vesting period. Use of a valuation model requires management to make certain assumptions with respect to selected model inputs. Expected volatility was estimated based on historical volatility of publically traded companies that are similar to the Private Company. The expected term was estimated based on managements’ knowledge and expectations, and issuances at similar public companies. The risk-free interest rate is based on U.S. Treasury zero-coupon issues with a term which approximates the expected term of the option.
The weighted average assumptions used in the Black Scholes option pricing model related to awards issued under the 2014 Plan for the year ended December 31, 2015 are as follows:
| Year Ended December 31, 2015 |
||||
| Dividend yield |
— | |||
| Expected volatility |
80 | % | ||
| Risk-free rate of return |
1.7 | % | ||
| Expected term (years) |
6.0 | |||
The Private Company recognized share based compensation expense related to awards issued under the 2014 Plan for the years ended December 31, 2015 and 2016 of $3.5 million and $0.7 million, respectively. As of December 31, 2015, there remained $1.7 million of unrecognized share-based compensation expense related to unvested stock options issued under the 2014 Plan to be recognized as expense over a weighted average period of 1.29 years.
The Private Company stock option activity under the 2014 Plan prior to the recapitalization for the year ended December 31, 2015 was as follows:
| Number of shares | Weighted average exercise price |
Weighted average remaining life |
Aggregate intrinsic value (in thousands) |
|||||||||||||
| Outstanding—December 31, 2014 |
1,161,308 | $ | 11.21 | 9.59 years | $ | 1,827 | ||||||||||
| Granted |
6,616 | 12.78 | — | — | ||||||||||||
| Exercised |
— | — | — | — | ||||||||||||
| Canceled/forfeited |
(52,089 | ) | 11.26 | — | — | |||||||||||
|
|
|
|||||||||||||||
| Outstanding—December 31, 2015 |
1,115,855 | 11.23 | 8.59 years | — | ||||||||||||
| Canceled/forfeited |
(1,115,855 | ) | — | — | — | |||||||||||
|
|
|
|||||||||||||||
| Outstanding—December 31, 2016 |
— | $ | — | — | $ | — | ||||||||||
|
|
|
|||||||||||||||
There have been no option exercises under the 2014 Plan. No options were issued during 2016 under this plan. The 2014 Plan was terminated on May 3, 2016 and all outstanding options then were cancelled. On May 3, 2016, the 2014 Plan was terminated and all options outstanding thereunder were cancelled. As a result of the cancellation of the plan, the Company recognized a one-time expense of $0.7 million during 2016.
106
Table of Contents
2016 Employee Equity Compensation Plan
The 2016 Employee Equity Compensation plan (the “2016 Plan”) was established concurrently with the 2016 Merger on May 3, 2016. The 2016 Plan permits the Company to grant cash, stock and stock-based awards to its employees, consultants and directors. The 2016 Plan includes (i) the discretionary grant program under which eligible persons may be granted options, including incentive stock options, or ISOs, and nonqualified stock options, or NSOs, or stock appreciation rights, or SARs; (ii) the stock issuance program under which eligible persons may be issued direct stock, restricted stock awards, restricted stock units, performance shares or other stock-based awards; and (iii) the incentive bonus program under which eligible persons may be issued performance unit awards, dividend equivalent rights or cash incentive awards. At December 31, 2016, an aggregate of 539,350 shares of the Company’s common stock were available for issuance under this plan. Pursuant to the 2016 Plan, the amount of shares available for issuance under the 2016 Plan automatically increased to 1,064,024 effective as of January 1, 2017.
The options generally vest over a period of three or four years, and options that lapse or are forfeited are available to be granted again. The contractual life of all options is ten years from the date the option begin to vest. The restricted stock awards vest on the first, second and third anniversaries of the original grant date. The Company recognizes compensation expense on all of these awards on a straight-line basis over the vesting period. The fair value of the award is determined based on the market value of the underlying stock price at the grant date.
The 2016 Plan stock option activity for the year ended December 31, 2016 was as follows:
| Shares | Weighted- average exercise price |
Weighted- |
Aggregate intrinsic value (dollars in thousands) |
|||||||||||
| Options outstanding at December 31, 2015 |
— | $ | — | — | — | |||||||||
| Granted |
2,085,800 | 5.02 | 10.0 years | $ | 37 | |||||||||
| Exercised |
— | — | — | — | ||||||||||
| Forfeited / Cancelled |
(63,000 | ) | 5.00 | — | — | |||||||||
| Expired |
— | — | — | — | ||||||||||
|
|
|
|
|
|||||||||||
| Options outstanding at December 31, 2016 |
2,022,800 | 5.02 | 9.41 years | 37 | ||||||||||
| Options vested and exercisable as of December 31, 2016 |
11,875 | 5.00 | 9.37 years | — | ||||||||||
| Options vested and expected to vest as of December 31, 2016 * |
1,558,096 | $ | 5.02 | 9.40 years | $ | 28 | ||||||||
| * | In addition to the vested options, the Company expects a portion of the unvested options to vest at some point in the future. Options expected to vest are calculated by applying an estimated forfeiture rate of 23.1% to the unvested options. |
Share based compensation related to options issued under 2016 Plan was $1 million for the year ended December 31, 2016. The weighted average grant date fair value of options granted under the 2016 Plan during the year ended December 31, 2016 was $3.07. The total grant date fair value of options that vested during the year ended December 31, 2016 was less than $0.1 million. There have been no option exercises under the 2016 Plan. As of December 31, 2016, there remained $3.7 million of unrecognized share-based compensation expense related to unvested stock options issued under the 2016 Plan to be recognized as expense over a weighted average period of 2.36 years.
107
Table of Contents
The fair value of the options at the date of issuance was estimated to be $6.5 million, based on the Black Scholes option pricing model. Key assumptions used to apply this model upon issuance were as follows:
| Weighted Average on Grant Date |
||||
| Dividend yield |
— | |||
| Expected volatility |
67.04 | % | ||
| Risk-free rate of return |
1.44 | % | ||
| Expected term (years) |
6.12 | |||
| Fair Value per share |
$ | 3.07 | ||
During the second and third quarters of 2016, the Company issued restricted stock awards to employees and key consultants. The majority of the grants vest on the first, second and third anniversaries of the original grant date. The Company recognizes compensation expense on all of these awards on a straight-line basis over the vesting period. The fair value of the award is determined based on the market value of the underlying stock price at the grant date.
The amount of time-based restricted stock compensation recognized during a period is based on the value of the portion of the awards that are ultimately expected to vest. Forfeitures are required to be estimated at the time of grant and revised, if necessary, in subsequent periods if actual forfeitures differ from those estimates. The Company currently expects, based on historical analysis, an annual forfeiture rate of approximately 22%. This assumption is reviewed periodically and the rate is adjusted as necessary. Ultimately, the actual expense recognized over the vesting period will only be for those awards that vest. Restricted stock award activity for the year ended December 31, 2016 is as follows:
| Time-Based Restricted Stock Awards |
||||
| Non-vested awards outstanding at December 31, 2015 |
— | |||
| Awards granted |
453,550 | |||
| Awards vested and issued |
(48,750 | ) | ||
| Awards forfeited |
(15,700 | ) | ||
|
|
|
|||
| Non-vested awards outstanding at December 31, 2016 |
389,100 | |||
|
|
|
|||
Share based compensation related to restricted stock issued under 2016 Plan was $0.6 million for the year ended December 31, 2016. The fair value of the restricted stock on the date of issuance was estimated to be $2.3 million and $1.2 million remains in unrecognized compensation related to these awards.
10. Warrants
Private Company Common Stock Warrants
Private Company Common stock warrant activity, prior to the recapitalization, for the years ended December 31, 2015 and 2016 is as follows:
| Number of shares | Weighted average exercise price |
Weighted average remaining life |
Aggregate intrinsic value (Dollars in thousands) |
|||||||||||||
| Outstanding and exercisable—December 31, 2014 |
177,347 | $ | 0.013 | 9.55 years | $ | 2 | ||||||||||
| Warrants issued |
1,802 | 0.013 | ||||||||||||||
|
|
|
|||||||||||||||
| Outstanding and exercisable—December 31, 2015 |
179,149 | 8.66 years | 1 | |||||||||||||
|
|
|
|||||||||||||||
| Warrants cancelled |
(179,149 | ) | 0.013 | |||||||||||||
|
|
|
|||||||||||||||
| Outstanding and exercisable—December 31, 2016 |
— | $ | $ | |||||||||||||
|
|
|
|||||||||||||||
108
Table of Contents
The Private Company used the Black Scholes option pricing model to calculate the fair value of its equity-classified warrants issued in 2015. Key assumptions used to apply this model upon issuance were as follows:
| 2015 | ||||
| Dividend yield |
— | |||
| Expected volatility |
80.0 | % | ||
| Risk-free rate of return |
2.00 | % | ||
| Expected term (years) |
10.0 | |||
Private Company Preferred Stock Warrants
In February 2015, the Private Company issued warrants to a Series D investor warrants to purchase 3,750 Series D shares prior to the recapitalization. The exercise price of the warrants are $10.00 per share and the remaining life of the warrants are 9.16 years. The warrants were still outstanding as of December 31, 2015. These warrants were cancelled prior to the 2016 Merger.
On January 29, 2016, Valeritas, Inc. issued CRG warrants to acquire 16,000,000 Series AB Preferred Stock of the private company at an exercise price of $1.25 with term of one year from the date of issuance. The warrants were accounted as derivative liability at fair value as the warrant for Series AB embodies a conditional obligation for the Company to repurchase its shares at a deemed liquidation event.
The fair value of the warrant at the date of issuance is $4.0 million based on the Black Scholes option pricing model. Key assumptions used to apply this model upon issuance were as follows:
| January 29, 2016 | Weighted Average Upon Exercise and Cancellation |
|||||||
| Dividend yield |
— | — | ||||||
| Expected volatility |
80.0 | % | 80.0 | % | ||||
| Risk-free rate of return |
0.47 | % | 0.61 | % | ||||
| Expected term (years) |
1.0 | 0.80 | ||||||
| Fair Value per share |
$ | 0.25 | $ | 0.30 | ||||
Through April of 2016, CRG exercised warrants to acquire 5,900,000 shares of Series AB Preferred Stock of the private company (1,407,476 common shares of Valeritas, Holdings, Inc. post recapitalization) for gross proceeds of $7.4 million. The fair value of exercised warrants of $1.6 million was reclassified from derivative liability to additional paid in capital. On May 3, 2016, the Company cancelled any outstanding warrants to acquire private company Series AB Preferred Stock. The remaining derivative liability balance of $3.0 million was reclassified from derivative liability to additional paid in capital upon cancellation of the unexercised warrants.
The activities of the private company Series AB warrants are as follows:
| Number of shares |
Weighted average exercise price |
Weighted average remaining life |
||||||||||
| Outstanding and exercisable—December 31, 2015 |
— | $ | — | — | ||||||||
| Warrants issued in conjunction with private company Series AB financing |
16,000,000 | 1.25 | ||||||||||
| Warrants cancelled |
(10,100,000 | ) | 1.25 | — | ||||||||
| Warrants exercised |
(5,900,000 | ) | 1.25 | — | ||||||||
|
|
|
|||||||||||
| Outstanding and exercisable—December 31, 2016 |
— | $ | — | — | ||||||||
|
|
|
|||||||||||
109
Table of Contents
Placement Agent Warrants
The Company also issued 83,120 warrants to acquire common stock to the placement agents in the private placement offering that was conducted as part of the 2016 Merger (“PPO”).The warrants have a term of five years and an exercise price of $5.00 per share. The warrants are accounted as a derivative liability at fair value as the warrant exercise price is subject to adjustment upon additional issuances of equity securities at a price per share lower than the exercise price of the warrants.
The fair value of the warrant at the date of issuance was $0.3 million and at December 31, 2016 was estimated to be $0.2 million, based on the Black Scholes option pricing model. Key assumptions used to apply this model were as follows:
| May 3, 2016 | December 31, 2016 | |||||||
| Dividend yield |
— | — | ||||||
| Expected volatility |
80.0 | % | 67.0 | % | ||||
| Risk-free rate of return |
1.22 | % | 1.93 | % | ||||
| Expected term (years) |
5.0 | 4.3 | ||||||
| Fair Value per share |
$ | 3.20 | $ | 2.67 | ||||
The activities of the common stock warrants are as follows:
| Number of shares |
Weighted average exercise price |
Weighted average remaining life |
||||||||||
| Outstanding and exercisable—December 31, 2015 |
— | $ | — | — | ||||||||
| Warrants issued in conjunction with public share offering |
83,120 | 5.00 | 5.0 years | |||||||||
| Warrants exercised |
— | — | ||||||||||
|
|
|
|||||||||||
| Outstanding and exercisable—December 31, 2016 |
83,120 | $ | 5.00 | 4.3 years | ||||||||
|
|
|
|||||||||||
11. RESTRUCTURING
In February 2016, as part of a restructuring plan, the Company underwent a labor force reduction. The total restructuring costs are expected to be $2.7 million and consists of $1.2 million severance expense and $1.5 million of retention bonuses. The retention bonuses were scheduled to be paid in two installments over the 12 months following the commencement of the restructuring plan. Employees entitled to the retention must remain employed with the Company in good standing for at least 6 months after each installment payment. Otherwise, employees are obligated to repay the entire bonus received for that installment.
The Company accrues the retention bonus monthly on a straight line basis through the retention period. See below for all activity during the year ended December 31, 2016:
| (Dollars in thousands) | Severance Accrual |
Retention Bonus Accrual |
Total | |||||||||
| December 31, 2015 Balance |
— | — | — | |||||||||
| Restructuring in February, 2016 |
$ | 1,217 | $ | — | 1,217 | |||||||
| Accruals for retention bonus |
— | 1,177 | 1,177 | |||||||||
| Payments |
(912 | ) | (957 | ) | (1,869 | ) | ||||||
|
|
|
|
|
|
|
|||||||
| December 31, 2016 Balance |
$ | 305 | $ | 220 | $ | 525 | ||||||
|
|
|
|
|
|
|
|||||||
110
Table of Contents
12. INCOME TAXES
Income tax expense attributable to pretax loss from continuing operations differed from the amounts computed by applying the U.S. federal income tax rate of 34% to pretax loss from continuing operations as a result of the following:
| Year ended December 31, |
||||||||
| (Dollars in thousands) | 2016 | 2015 | ||||||
| Computed “expected” tax expense |
$ | (15,765 | ) | $ | (22,845 | ) | ||
| Increase (reduction) in income taxes resulting from: |
||||||||
| Change in the valuation allowance |
9,506 | 22,501 | ||||||
| State taxes, net of federal benefit |
(141 | ) | (254 | ) | ||||
| Federal research and development credits |
(21 | ) | (35 | ) | ||||
| Cancellation of Options |
3,451 | — | ||||||
| Nondeductible Interest |
1,976 | — | ||||||
| Stock Compensation |
831 | — | ||||||
| Other, net |
163 | 633 | ||||||
|
|
|
|
|
|||||
| Total income tax expense/(benefit) |
$ | — | $ | — | ||||
|
|
|
|
|
|||||
The tax effects of temporary differences that give rise to significant portions of the deferred tax assets and deferred tax liabilities at December 31, 2016 and 2015 are presented below:
| December 31, | ||||||||
| (Dollars in thousands) | 2016 | 2015 | ||||||
| Deferred tax assets: |
||||||||
| Intangible assets |
$ | 10,062 | $ | 10,222 | ||||
| Net operating loss carryforwards |
117, 123 | 105,304 | ||||||
| Federal and state credit carryforwards |
2,208 | 2,173 | ||||||
| Plant and equipment, due to depreciation and impairment |
1,100 | 1,023 | ||||||
| Inventory reserves |
589 | 927 | ||||||
| Other deductible temporary differences |
3,623 | 5,548 | ||||||
|
|
|
|
|
|||||
| Total gross deferred tax assets |
134,705 | 125,197 | ||||||
| Less valuation allowance |
(134,705 | ) | (125,197 | ) | ||||
|
|
|
|
|
|||||
| Net deferred tax assets |
$ | — | $ | — | ||||
|
|
|
|
|
|||||
At December 31, 2016, the Company had net operating loss carryforwards for federal income tax purposes of $337.2 million which are available to offset future federal taxable income, if any. The federal net operating losses begin to expire in 2028. The Company had net operating loss carryforwards for state income tax purposes of $48.1 million which are available to offset future state taxable income, if any.
The state net operating losses begin to expire in 2027.
Utilization of the net operating loss carryforwards and research and development tax credit carryforwards may be subject to substantial annual limitation under Section 382 of the Internal Revenue Code of 1986, and corresponding provisions of state law, due to ownership changes that have occurred previously or that could occur in the future. These ownership changes may limit the amount of carryforwards that can be utilized annually to offset future taxable income. In general, an ownership change, as define by Section 382, results from transactions increasing the ownership of certain stockholders or public groups in the stock of a corporation by more than 50% over a three-year period. The Company has not conducted a study after December 31, 2014 to determine whether a change of control has occurred or whether there have been multiple changes of control since December 31, 2014 due to the significant complexity and cost associated with such a study. If the Company has
111
Table of Contents
experienced a change of control, as defined by Section 382, utilization of the net operating loss carryforwards or research and development tax credit carryforwards would be subject to an annual limitation under Section 382, which is determined by first multiplying the value of the Company’s stock at the time of the ownership change by the applicable long-term tax-exempt rate, and then could be subject to additional adjustments, as required. Any limitation may result in expiration of a portion of the net operating loss carryforwards or research and development tax credit carryforwards before utilization. Further, until a study is completed and any limitation is known, no amounts are being presented as an uncertain tax position.
The valuation allowance for deferred tax assets as of December 31, 2016 and 2015 was $134.7 million and $125.2 million, respectively. The net change in the total valuation allowance was an increase of $9.5 million in 2016 and an increase of $22.5 million in 2015. The valuation allowance is primarily related to net operating loss carryforwards that, in the judgment of management, are not more likely than not to be realized. In assessing the realizability of deferred tax assets, management considers whether it is more likely than not that some portion of all of the deferred tax assets will not be realized. The ultimate realization of deferred tax assets is dependent upon the generation of future taxable income during the periods in which those temporary differences become deductible. Based upon the level of historical taxable income and projections for future taxable income over the periods in which the deferred tax assets are deductible, management believes that a full valuation allowance is necessary at December 31, 2016.
The Company did not have any unrecognized tax benefits at December 31, 2016 and 2015.
The statute of limitations for assessment by the Internal Revenue Service, or the IRS, and state tax authorities is closed for tax years prior to December 31, 2013 for federal tax purposes and for years prior to December 31, 2013 or 2012 for state tax purposes, although carryforward attributes that were generated in years prior to 2013 may still be adjusted upon examination by the IRS or state tax authorities if they either have been or will be used in a future period. The Company files income tax returns in the U.S. federal and various state jurisdictions. There are currently no federal or state audits in progress.
In December 2015, U.S. legislation was enacted to permanently reinstate the Research & Development tax credit (R&D tax credit) which had expired on December 31, 2014. In 2016 and 2015, the Company recorded a benefit of approximately $21,000 and $35,000, respectively, for the 2016 R&D Credit.
In November 2015, the FASB issued ASU No. 2015-17, Income Taxes (Topic 740): Balance Sheet Classification of Deferred Tax Assets (“ASU 2015-17”). ASU 2015-17 requires deferred tax liabilities and assets to be classified as noncurrent in the consolidated balance sheet. The amendment may be applied either prospectively to all deferred tax liabilities and assets or retrospectively to all periods presented. The Company is currently evaluating the impact that the adoption of ASU 2015-17 will have on its financial statements. The Company does not anticipate a material impact as no deferred tax amounts are currently presented on the balance sheet due to the valuation allowance.
13. EMPLOYEE BENEFIT PLANS
The Company sponsors a defined contribution retirement plan for employees pursuant to Section 401(k) of the Internal Revenue Code under which eligible employees can defer a portion of their annual compensation. The Company provides an annual matching contribution based on a percentage of the employee’s contributions. The Company recorded an expense for the matching contributions to the plan for the years ended December 31, 2016 and 2015 of $0.2 million and $0.3 million, respectively.
14. FAIR VALUE MEASUREMENTS AND FAIR VALUE OF FINANCIAL INSTRUMENTS
Fair Value Measurements
The Company uses the market approach technique to value its financial instruments and there were no changes in valuation techniques during 2016 or 2015. The Company’s financial instruments consist primarily of cash and
112
Table of Contents
cash equivalents, accounts receivable, accounts payable and accrued liabilities, debt instruments and derivative liabilities. For accounts receivable, accounts payable and accrued liabilities, the carrying amounts of these financial instruments as of December 31, 2016 and 2015 were considered representative of their fair values due to their short term to maturity. Cash equivalents are carried at cost which approximates their fair value. The carrying values of long-term debt, including the current portion of long-term debt in short-term borrowings, approximate fair value and are principally measured using Level 2 inputs based on quoted market prices or pricing models using current market rates.
Concurrent with the closing of the 2016 Merger on May 3, 2016, the Company restructured its Term Loan and WCAS Note that extended the payment term of respective principal balance of $50 million and $5 million to March 31, 2021 and September 8, 2021. All warrants for private company common stock, Series D and private company Series AB there were outstanding on May 3, 2016 were cancelled.
No financial assets or liabilities were measured at fair value on a recurring basis at December 31, 2015. The following tables set forth the Company’s financial assets and liabilities that were measured at fair value on a recurring basis as of December 31, 2016.
| (Dollars in thousands) | Total | Quoted prices in active markets (Level 1) |
Significant other observable inputs (Level 2) |
Significant unobservable inputs (Level 3) |
||||||||||||
| Liabilities: |
||||||||||||||||
| Derivative liability—warrant |
$ | 222 | — | — | 222 | |||||||||||
|
|
|
|
|
|
|
|
|
|||||||||
| Total liabilities |
$ | 222 | — | — | 222 | |||||||||||
|
|
|
|
|
|
|
|
|
|||||||||
The Company’s derivative liabilities are classified within Level 3 because they are valued with an option pricing model, where certain inputs to the model are unobservable and reflect the Company’s assumptions as to what market participants would use.
The warrants were valued using the Black Scholes option pricing model (refer to note 9). The life of the warrant is equal to the weighted average remaining contractual life of the warrants. The volatility utilized is based upon the volatilities observed from publicly traded companies that are comparable to the Company. To date, the Company has not declared or paid dividends to any of its shareholders so the assumed dividend rate is zero. The short term risk-free rate utilized is the yield on US Treasury STRIPS corresponding to the life of the warrant.
Upon default of the Term Loan, as described in note 4, the Lenders called for immediate repayment of the Term Loan including a 4% prepayment penalty. As such, the derivative liability associated with the Term Loan prepayment provision was considered to be extinguished and the prepayment penalty has been accrued at December 31, 2015. The Company has also determined that the fair value of WCAS put option derivative to be de minimis as of December 31, 2015.
113
Table of Contents
The following table presents the Company’s liabilities measured at fair value using significant unobservable inputs (Level 3), as of December 31, 2016:
| (Dollars in Thousands) | ||||
| Balance, December 31, 2014 |
$ | 443 | ||
| Decrease for fair value adjustment of derivative liability—Capital Royalty |
(387 | ) | ||
| Decrease for fair value adjustment of derivative liability—WCAS |
(56 | ) | ||
| Balance, December 31, 2015 |
— | |||
| Issuance of private company Series AB preferred warrant |
4,000 | |||
| Increase for fair value adjustment of warrant liability |
662 | |||
| Decrease for fair value adjustment of exercised warrant |
(1,557 | ) | ||
| Cancelled warrants |
(3,036 | ) | ||
| Issuance of common stock warrant in PPO |
266 | |||
| Decrease for fair value adjustment of warrant |
(113 | ) | ||
|
|
|
|||
| Balance, December 31, 2016 |
$ | 222 | ||
|
|
|
|||
15. COMMITMENTS AND CONTINGENCIES
Operating Leases
The Company leases buildings in Shrewsbury, Massachusetts and Bridgewater, New Jersey and equipment under operating lease agreements, expiring through 2017. In addition to rental expense, the Company is obligated to pay costs of insurance, taxes, repairs and maintenance pursuant to the terms of the leases. The rental payments include the minimum rentals plus common area maintenance charges. Some of the leases include renewal options. Rental expense under operating leases amounted to $1.3 million for both the years ended December 31, 2016 and 2015.
At December 31, 2016, the Company had the following minimum lease commitments:
| (Dollars in thousands) | ||||
| Year Ended December 31: |
||||
| 2017 |
$ | 1,020 | ||
| 2018 |
121 | |||
|
|
|
|||
| Total |
$ | 1,141 | ||
|
|
|
|||
Licensing Agreement
Pursuant to a formation agreement, dated as of August 22, 2006 (the Formation Agreement), BioValve and BTI Technologies Inc. (BTI), a wholly owned subsidiary of BioValve, contributed to Valeritas, LLC all of their right, title and interest in and to all of the assets, properties and rights of BioValve and BTI to the extent related to BioValve’s drug delivery/medical device initiative, consisting of patents and equipment, hereafter referred to as the Device Assets (Device Assets).
On August 22, 2008, the Formation Agreement was amended and the Company agreed to pay BioValve an amount equal to 9% of any cash upfront license or signing fees and any cash development milestone payments received by the Company in connection with licenses or grants of third party rights to the use in development or commercialization of the Rapid Infuser Technology. In certain circumstances the Company would owe 10% of such payments received. As of December 31, 2016 and 2015, no amounts were owed under this agreement. Although the Company believes the intellectual property rights around this technology have value, the technology licensed under this agreement is not used in the V-Go or any current products under development.
114
Table of Contents
16. NET LOSS PER SHARE
Basic net loss per share excludes the effect of dilution and is computed by dividing the net loss by the weighted-average number of shares of common stock outstanding less the weighted-average number of shares subject to repurchase during the period.
Diluted net loss per share is computed by giving effect to all potential shares of common stock, including stock options and warrants to the extent dilutive. Basic net loss per share was the same as diluted net loss per share for the years ended December 31, 2016 and 2015 as the inclusion of all potential common shares outstanding would have had an anti-dilutive effect.
The following table sets forth the computation of historical basic and diluted net loss per share:
| Year Ended December 31, | ||||||||
| (Dollars in thousands, except per share amounts) | 2016 | 2015 | ||||||
| Numerator |
||||||||
| Net loss attributable to common stockholders—basic and diluted |
$ | (46,367 | ) | $ | (67,195 | ) | ||
|
|
|
|
|
|||||
| Denominator |
||||||||
| Weighted-average common shares outstanding used in computing |
9,496,838 | 241,055 | ||||||
|
|
|
|
|
|||||
| Net loss per share, basic and diluted |
$ | (4.88 | ) | $ | (278.75 | ) | ||
|
|
|
|
|
|||||
As described in notes 1 and 9, all outstanding Series AA Preferred Stock, Series D Preferred Stock, Common Stock, private company’s stock options and warrants were retired and cancelled prior to the Merger. They are therefore being excluded in the calculation of the net loss per share calculation. The weighted average common shares in 2015 reflect outstanding Series AB Preferred Stock as at December 31, 2015 converted at the conversion ratio of 0.23856.
The following awards were not included in the computation of weighted average common shares for the years ended December 31, 2016.
| Year Ended December 31, |
||||
| 2016 | ||||
| Dilutive stock options |
2,022,800 | |||
| Warrants |
83,120 | |||
| Restricted stock |
389,100 | |||
|
|
|
|||
| Total |
2,495,020 | |||
|
|
|
|||
17. SUBSEQUENT EVENTS
Amendment to Senior Secured Debt
On February 9, 2017, the Company entered into an Amendment No. 1 to Second Amended and Restated Term Loan Agreement (the “Amendment”) with CRG. CRG and the Company are parties to that certain Second Amended and Restated Term Loan Agreement, dated as of May 3, 2016 (the “Loan Agreement”), pursuant to which CRG loaned $50,000,000 of senior secured debt to the Company. The Amendment (i) extends the interest only-period of the Loan Agreement by one year to March 31, 2022 from March 31, 2021; (ii) extends the time required prior to the initial required cash interest payments by one year to June 30, 2019 from June 30, 2018; (iii) extends the deadline for full payment under the Loan Agreement to March 31, 2022 from March 2021, and
115
Table of Contents
(iv) reduces the Company’s minimum cash and cash equivalent requirements to $2,000,000 from the previous requirement of $5,000,000 under the Loan Agreement, except that if the Company does not consummate an underwritten public offering with gross proceeds of at least $40,000,000 by December 31, 2017, then the minimum cash covenant reverts back to $5,000,000.
Conversion of Senior Secured Debt and WCAS Note
On February 14, 2017, the Company, CRG and WCAS entered into a Series A Preferred Stock Purchase Agreement (the “Purchase Agreement”) pursuant to which CRG and WCAS each agreed to convert approximately half of the outstanding debt held by each of them, for a total of $27.5 million (the “Conversion Amount”), into shares of the Company’s to-be-created Series A Convertible Preferred Stock, par value $0.001 per share (the “Series A Preferred Stock”), at a conversion price as set forth in the executed definitive documents.
Registration Rights Agreement and Series A Preferred Stock
Contemporaneously with the execution of the Purchase Agreement, the Company also entered into a Registration Rights Agreement with each of CRG and WCAS (the “Registration Rights Agreement”) pursuant to which the Company has agreed, at the election of the holders of a majority of the Registrable Securities (as defined in the Registration Right Agreement) then outstanding at any time at least 90 days after the closing of the Conversion, to file a registration statement (the “Resale Registration Statement”) with the SEC within 90 days after the initial request to register 100% of the number of shares of common stock issuable upon conversion of the Series A Preferred Stock. Pursuant to the Registration Rights Agreement, the Company is required to use commercially reasonable efforts to have the Resale Registration Statement declared effective by the SEC as soon as practicable after the initial request and to use commercially reasonable efforts to keep the Resale Registration Statement effective until the date on which all securities under the Resale Registration Statement cease to be Registrable Securities, as set forth in the Registration Rights Agreement.
In connection with the execution and delivery of the Purchase Agreement and Registration Rights Agreement, the Company intends to file with the Secretary of State of Delaware prior to the Conversion a certificate of designation (the “Certificate of Designation”), setting forth the rights, preferences and privileges of the Series A Preferred Stock. The shares of Series A Preferred Stock will be convertible at the option of the holder at any time into shares of common stock at a conversion rate determined by dividing the Series A Original Issue Price by the Series A Conversion Price (both as defined in the Certificate of Designation) in effect at the time of conversion. This formula initially results in a one-to-one conversion ratio. The Series A Conversion Price is subject to adjustment for stock splits and the like subsequent to the date of issuance of the Series A Preferred Stock. On or after January 1, 2021, at the Company’s option, if the Company has achieved an average market capitalization of at least $300 million for its most recent fiscal quarter, the Company may elect to automatically convert all of the outstanding shares of Series A Preferred Stock into common stock.
The holders of shares of Series A Preferred Stock are entitled to receive annual dividends at a rate of $8 per every $100 of Series A Preferred Stock, payable either in cash or in shares of common stock, at each holder’s election. The shares of Series A Preferred Stock have no voting rights. The Company has the right to redeem all or less than all of the Series A Preferred Stock, at any time, at a price equal to the Series A Conversion Price, as adjusted, plus any accrued but unpaid dividends.
In the event of a Deemed Liquidation Event (as defined in the Certificate of Designation) the holders of Series A Preferred Stock are eligible to receive the greater of (i) the Conversion Amount plus accrued but unpaid dividends or (ii) what they would have received as a holder of common stock had they converted their shares of Series A Preferred Stock into shares of common stock immediately prior to the Deemed Liquidation Event. To the extent permitted under Delaware law, the holders of shares of Series A Preferred Stock have the right to prevent the Company from liquidating, dissolving, amending its governing documents in a manner that affects the rights of the Series A Preferred Stock, authorizing shares of capital stock on parity or senior to the Series A
116
Table of Contents
Preferred Stock, or issuing any shares of Series A Preferred Stock to any individual, entity or person other than CRG or WCAS.
Reverse Stock Split and Increase in Authorized Series A Preferred Stock
In January 2017 the Company’s Board of Directors approved a proposal for a reverse stock split in any ratio up to 1-for-10 of the Company’s common stock and an increase in the number of shares of preferred stock the Company is authorized to issue to 50,000,000. This proposal is pending stockholder approval. All share numbers reflected in this filing are on a pre-split basis and do not reflect the proposed reverse stock split.
117
Table of Contents
Item 9. Changes in and Disagreements with Accountants on Accounting and Financial Disclosure.
B F Borgers CPA PC, or B F Borgers, audited the financial results of Cleaner Yoga Mat, Inc. during the year ended December 31, 2015. In connection with the 2016 Merger, our Board of Directors approved the dismissal of B F Borgers and approved the engagement of Friedman LLP as our independent registered public accounting firm.
None of the reports of B F Borgers on our financial statements for past year or subsequent interim period contained an adverse opinion or disclaimer of opinion, or was qualified or modified as to uncertainty, audit scope or accounting principles, except that our audited financial statements contained in our Annual Report on Form 10-K for the fiscal year ended December 31, 2015, filed with the SEC on April 14, 2016, included a going concern qualification in the report of B F Borgers.
During the fiscal year ended December 31, 2015, and the subsequent interim periods preceding their dismissal, there were no disagreements with B F Borgers, whether or not resolved, on any matter of accounting principles or practices, financial statement disclosure, or auditing scope or procedure, which, if not resolved to the satisfaction of B F Borgers, would have caused them to make reference to the subject matter of the disagreement in connection with their report on the our financial statements.
Consultation on Certain Matters with Friedman LLP
During the fiscal year ended December 31, 2016, neither we, nor anyone on our behalf has previously consulted with Friedman LLP regarding either (a) the application of accounting principles to a specified transaction, either completed or proposed, or the type of audit opinion that might be rendered on our financial statements, and neither a written report was provided nor oral advice was provided to us that Friedman LLP concluded was an important factor considered by us in reaching a decision as to the accounting, auditing or financial reporting issue; or (b) any matter that was either the subject of a disagreement (as defined in paragraph 304(a)(1)(iv) of Regulation S-K and the related instructions thereto) or a reportable event (as described in paragraph 304(a)(1)(v)) of Regulation S-K).
ITEM 9A. CONTROLS AND PROCEDURES
Disclosure Controls and Procedures
We maintain disclosure controls and procedures designed to provide reasonable assurance that information required to be disclosed in reports filed under the Securities Exchange Act of 1934, as amended (the “Exchange Act”), is recorded, processed, summarized and reported within the specified time periods and accumulated and communicated to our management, including our principal executive officer and principal financial officer, as appropriate to allow timely decisions regarding disclosure.
Our Chief Executive Officer and Chief Financial Officer, evaluated the effectiveness of our disclosure controls and procedures (as defined in Rules 13a-15(e) and 15d-15(e) promulgated under the Exchange Act) as of December 31, 2016. In designing and evaluating disclosure controls and procedures, we recognize that any disclosure controls and procedures, no matter how well designed and operated, can only provide reasonable assurance of achieving the desired control objective. As of December 31, 2016, based on the evaluation of these disclosure controls and procedures, and in light of the material weaknesses found in our internal controls, management concluded that our disclosure controls and procedures were not effective.
In light of the conclusion that our internal controls over financial reporting were ineffective as of December 31, 2016, we have applied procedures and processes as necessary to ensure the reliability of our financial reporting in regards to this annual report. Accordingly, we believe, based on our knowledge, that: (i) this annual report does not contain any untrue statement of a material fact or omit to state a material fact necessary to make the statements made, in light of the circumstances under which they were made, not misleading with respect to the period covered by this report; and (ii) the financial statements, and other financial information included in this annual report, fairly present in all material respects our financial condition, results of operations and cash flows as of and for the periods presented in this annual report.
118
Table of Contents
Management’s Report on Internal Control over Financial Reporting
Our management is responsible for establishing and maintaining effective internal control over financial reporting as defined in Rule 13a-15(f) under the Exchange Act. Because of its inherent limitations, internal control over financial reporting is not intended to provide absolute assurance that a misstatement of our financial statements would be prevented or detected. Under the supervision of our CEO and CFO , we conducted an evaluation of the effectiveness of our internal control over financial reporting as of December 31, 2016 using the criteria established in Internal Control—Integrated Framework issued by the Committee of Sponsoring Organizations of the Treadway Commission (“COSO”) (2013 Framework), or the 2013 Framework. We are still in the process of completing an effective evaluation due to the short period available to perform such evaluation since May 3, 2016 when we became public through a reverse merger.
A material weakness is a deficiency, or combination of deficiencies, in internal control over financial reporting, such that there is a reasonable possibility that a material misstatement of our annual or interim financial statements will not be prevented or detected on a timely basis. As of December 31, 2016, although management has commenced an effective assessment of both the design and operational effectiveness of our internal controls over financial reporting, this assessment has not yet been completed based on the 2013 Framework. In addition, management identified the following additional material weaknesses: (i) policies and procedures which were not adequately documented and (ii) lack of proper approval processes and review processes and documentation of such reviews. Our management expects to implement effective internal controls in the future that will adequately address these material weaknesses.
As a result of the material weaknesses described above, management concluded that we did not maintain effective internal control over financial reporting as of December 31, 2016 based on criteria established in the 2013 Framework.
Changes in Internal Controls
There were no changes in our internal controls over financial reporting during the fourth quarter of fiscal 2016 that materially affected, or are reasonably likely to materially affect, our internal control over financial reporting.
Limitations on the Effectiveness of Controls
Management does not expect that our disclosure controls or our internal controls over financial reporting will prevent or detect all errors and all fraud. A control system, no matter how well designed and operated, can provide only reasonable, not absolute, assurance that the control system’s objectives will be met. The design of a control system must reflect the fact that there are resource constraints, and the benefits of controls must be considered relative to their costs. Further, because of the inherent limitations in all control systems, no evaluation of controls can provide absolute assurance that misstatements due to error or fraud will not occur or that all control issues and instances of fraud, if any, within the Company have been detected. These inherent limitations include the realities that judgments in decision-making can be faulty and that breakdowns can occur because of simple error or mistake. Controls can also be circumvented by the individual acts of some persons, by collusion of two or more people, or by management override of the controls. The design of any system of controls is based in part on certain assumptions about the likelihood of future events, and there can be no assurance that any design will succeed in achieving its stated goals under all potential future conditions. Projections of any evaluation of controls effectiveness to future periods are subject to risks. Over time, controls may become inadequate because of changes in conditions or deterioration in the degree of compliance with policies or procedures.
| Item 9B. | Other Information. |
None.
119
Table of Contents
PART III
Item 10. Directors, Executive Officers and Corporate Governance.
Directors and Executive Officers
Below are the names of and certain information regarding our executive officers and directors as of the date of this report:
| Name |
Age | Position | ||||
| John E. Timberlake |
52 | Chief Executive Officer, President and Director | ||||
| Erick J. Lucera |
49 | Chief Financial Officer | ||||
| Mark Conley |
55 | Vice President, Corporate Controller and Treasurer | ||||
| Geoffrey Jenkins |
65 | Executive Vice President, Manufacturing, Operations and Research & Development | ||||
| Matthew Nguyen |
47 | Chief Commercial Officer | ||||
| Joe Mandato, D.M. |
72 | Director | ||||
| Luke Düster |
42 | Director | ||||
| Katherine D. Crothall, Ph.D. |
67 | Director | ||||
| Rodney Altman, M.D. |
54 | Director | ||||
| Peter Devlin |
49 | Director | ||||
| Brian K. Roberts |
45 | Director | ||||
Executive officers are appointed by the Board of Directors and serve at its pleasure.
The principal occupation and business experience during at least the past five years for our executive officers and directors is as follows:
John E. Timberlake has served as our Chief Executive Officer, President and a member of our Board of Directors since February 2016, prior to which he served as President and Chief Commercial Officer since August 2008. Before becoming Chief Executive Officer and President and Chief Commercial Officer, Mr. Timberlake was a General Manager with our company from September 2006 to August 2008. Prior to joining Valeritas, Mr. Timberlake held positions of increasing responsibility from 1991 to 2006 at Sanofi-Aventis (now Sanofi), with his last role as Vice President of Diabetes Marketing, where he was responsible for the diabetes franchise, including the brands Lantus, Apidra and Amaryl. Prior to Sanofi, Mr. Timberlake was a manager with Deloitte & Touche LLP, from 1986 to 1991, and was both a Certified Management Accountant and a Certified Public Accountant. He earned a B.S. in Accounting at Northwest Missouri State University, an M.S. in Management from Purdue University and an M.B.A. from NEOMA Business School (f/k/a E.S.C. Rouen) in France. Mr. Timberlake is qualified to serve as a director because of his role with us, and his extensive operational knowledge of, and executive level management experience in, the biopharmaceutical and medical technology industries.
Erick J. Lucera has served as our Chief Financial Officer since August 2016. From April 2015 to August 2016, Mr. Lucera served as the Chief Financial Officer, Treasurer and Secretary of Viventia Bio Inc., a late-stage oncology company. From December 2012 to April 2015, he served as Vice President, Corporate Development at Aratana Therapeutics, Inc., a specialty pharmaceutical company focused on companion animals. He served as Vice President, Corporate Development at Sunshine Heart, Inc. a medical device company from March 2012 to December 2012. Mr. Lucera served as Vice President, Healthcare Analyst at Eaton Vance Management, a global asset manager, from February 2008 to November 2011. Mr. Lucera also held various positions at Intrepid Capital Partners, Independence Investment Associates, LLC and Price Waterhouse & Co. from 1990 to 2008. Mr. Lucera earned a C.P.H. from Harvard University in 2001, an M.S.F. from Boston College in 1999, an M.B.A. from Indiana University in 1995 and a Bachelor’s Degree in Accounting from The University of Delaware in 1990. Mr. Lucera currently holds a CFA designation. Mr. Lucera previously held CMA and CPA designations, both of which are expired.
120
Table of Contents
Mark Conley has served as our Vice President, Corporate Controller and Treasurer since February 2016, prior to which he served as our Director of Financial Planning & Analysis since joining Valeritas in August 2012. Mr. Conley was Global Finance Director of the radiation instrumentation business at Thermo Fisher Scientific from 2007 to 2012. In addition, he served at Iron Mountain, Inc. as Vice President, Financial Planning & Analysis from 2005 to June 2007 and Division Controller from 1998 to 2004, as Chief Financial Officer and Controller at HoltraChem Group from 1996 to 1998 and in successive financial leadership roles including Operations Controller at Haemonetics Corporation from 1991 to 1996. Mr. Conley earned a B.S. in Accounting from Oklahoma State University, an M.B.A. from Bryant College, and is a Certified Public Accountant.
Geoffrey Jenkins has served as our Executive Vice President, Manufacturing, Operations and Research & Development since he joined Valeritas in April 2009. Mr. Jenkins was Vice President of Worldwide Operations for Inverness Medical, a healthcare technology company, from 2005 to 2009. From 2000 to 2005, he was President and Founding Partner of UV-Solutions, LLC, a healthcare technology company, and from 1997 to 1999 he was Chief Operating Officer of MDI Instruments, Inc., a healthcare technology company. Mr. Jenkins was also Corporate Vice President of Operations of MediSense, Inc. from 1991 to 1997. Prior to becoming Corporate Vice President of Operations, he held various other positions in Operations and Engineering Management with MediSense from 1984 to 1991. Mr. Jenkins earned a B.A. and a B.S. from Clarkson University.
Matthew Nguyen has served as our Chief Commercial Officer since December 2016. Mr. Nguyen served as our Sr. Vice President, Commercial from February 2016 to December 2016 and as our Vice President for Integrated Healthcare Management since joining Valeritas in September 2006. Mr. Nguyen was a New Business Development Director for Janssen, LP, a division of Johnson & Johnson, from 2005 to 2006. He served as head of health economics research for metabolism, new product marketing, and head of analytics and commercial effectiveness for the CNS business unit at Sanofi from 2000 to 2005. Mr. Nguyen earned a B.S. in Pharmacy and a Doctor of Pharmacy from the Philadelphia College of Pharmacy and Science. He also completed a Fellowship in Health Economics and Outcomes Research in conjunction with Thomas Jefferson University Hospital and Janssen Pharmaceutical, Inc. and earned an M.B.A. from Rutgers University in New Jersey.
Joe Mandato, D.M. has served as a member of our board of directors since December 2016. Since March 2003, Dr. Mandato has served as a managing director of DeNovo Ventures, a venture capital firm focused on life sciences. Prior to DeNovo Ventures, Dr. Mandato held top leadership positions at Ioptex, Confer Software, Gynecare and Origin Medsystems. Dr. Mandato also served as a member of the Board of Directors of AxoGen Corporation from February 2006 until its merger with and into AxoGen, Inc. in September 2011, and then served on the Board of AxoGen, Inc. until September 2016. Dr. Mandato served as a member of the Board of Directors of Hansen Medical, Inc. from August 2006 until February 2012. Dr. Mandato received a doctorate in management from Case Western Reserve University, and now serves on its Board of Trustees. Dr. Mandato also holds the Carlo Rossi Chair in Entrepreneurship and Management at the University of San Francisco, is a Lecturer at Stanford University and has served as a Fellow in the Harvard University Advanced Leadership Initiative. Additionally, Dr. Mandato currently serves on the boards of both the Embrace Global and Save the Children organizations. Dr. Mandato is qualified to serve as a director because of his extensive work in the healthcare industry and his venture capital experience.
Luke Düster has served as a member of our board of directors since January 2016. Since 2009, Mr. Düster served as managing director at Capital Royalty Group, a healthcare-focused investment firm. Mr. Düster was at Harris Williams & Co., an investment firm, from 2004 to 2009, where he served as Vice President. Mr. Düster also held investment banking roles at the Wallach Company, a regional investment banking boutique, from 2000 to 2002, and at the Nord Companies, a healthcare advisory firm, from 1998 to 2000. Mr. Düster received his B.S. summa cum laude from the University of Colorado at Boulder and an M.B.A. with honors from the Wharton School at the University of Pennsylvania. Mr. Düster is qualified to serve as a director because of his significant experience working with companies backed by private equity investors, particularly in the healthcare industry, as well as his experience with healthcare investing.
121
Table of Contents
Katherine D. Crothall, Ph.D. has served as a member of our board of directors since October 2016. Since 2010, Dr. Crothall has served as President, CEO and Chairman of the Board of Aspire Bariatrics, a company committed to providing safe and effective treatments for obesity to patients worldwide. Dr. Crothall was a Principal at Liberty Venture Partners, a venture capital firm, from 2006 until November 2010. Dr. Crothall was Founder, President and CEO of Animas Corporation, a manufacturer of insulin infusion pumps, from its inception to its acquisition by Johnson & Johnson Corporation in 2006. Dr. Crothall was also the Founder, President and CEO of two other medical device companies, Luxar Corporation ,which was sold to ESC Medical, and Laakmann Electro-Optics, which was sold to Johnson & Johnson. Dr. Crothall continued running Laakmann Electro-Optics for five years post-acquisition. Dr. Crothall received her B.S. from the University of Pennsylvania and her Ph.D. from the University of Southern California, both in Electrical Engineering. She holds over twenty patents and is the recipient of the Ernst & Young Entrepreneur of the Year Award and the Greater Philadelphia Raymond Rafferty Entrepreneurial Excellence Award. Dr. Crothall is a director of Adhezion BioMedical and Xanitos, Inc. She also sits on the Board of Overseers of the School of Engineering and Applied Sciences at the University of Pennsylvania. Dr. Crothall is qualified to serve as a director because of her extensive clinical and business experience, specifically in the healthcare industry.
Rodney Altman, M.D. has served as a member of our board of directors since April 2016. Since June 2016, Dr. Altman has been a member of the board of directors of Milestone Pharmaceuticals and Thrasos Pharmaceuticals in his capacity as an advisor to Business Development Bank of Canada. Since 2011, he has been an Advisor and beginning in March 2016 he has been a Managing Director at Spindletop Capital, a private equity and venture capital firm. Prior to joining Spindletop Capital, he was Regional Medical Director at TeamHealth, an American hospital staffing firm. Dr. Altman was a senior partner at a venture capital firm, CMEA Capital, LLC, from 2006 to 2011, where he built and managed the firm’s medical device practice. Dr. Altman has also held investing roles at other venture funds including Aphelion Capital, LLC, Piper Jaffray Ventures, and TVM Techno Venture Management. Dr. Altman received his medical degree from McGill University and an M.B.A. with honors from the University of Chicago, Booth School of Business. Dr. Altman is qualified to serve as a director because of his extensive clinical and venture capital experience.
Peter Devlin has served as a member of our board of directors since April 2016. Since September 2014, Mr. Devlin has served as a consultant for various life sciences and investment companies. From August 2009 to September 2014, Mr. Devlin was the Chief Commercial Officer at Insulet Corporation, a tubeless insulin pump technology company. Mr. Devlin held several leadership roles at Abbott Laboratories, Inc. From February 2008 to July 2009, he served as Divisional Vice President of Abbott’s Global Strategic Marketing in the diabetes care unit, prior to which he served as General Manager, Hospital & Government in the diabetes care unit from December 2006 to February 2008, and prior to which he served as Director of Abbott’s Canadian diabetes unit from September 2003 to December 2006. Mr. Devlin received his Bachelor of Science degree from the University of Massachusetts. Mr. Devlin is qualified to serve as a director because of his extensive business experience in the field of diabetes.
Brian K. Roberts has served as a member of our board of directors since July 2016. From January 2015 to September 2016, Mr. Roberts served as the Chief Operating and Financial Officer of Avedro, a corneal cross-linking science company. From January 2009 through December 2014, he served as Chief Financial Officer for Insulet Corporation, a tubeless insulin pump technology company. From August 2007 to December 2008, Mr. Roberts served as Chief Financial Officer of Jingle Networks, a provider of advertising and technology solutions for voice and mobile business search. Mr. Roberts is currently a member of the board of directors of ViewRay, Inc. and serves as chair of its audit committee. Mr. Roberts received his Bachelor of Science in Accounting and Finance degree from Boston College. Mr. Roberts is qualified to serve as a director because of his extensive business experience and financial and accounting insight.
122
Table of Contents
Section 16(a) Beneficial Ownership Reporting Compliance
Section 16(a) of the Exchange Act will require our directors and executive officers, and persons who own more than ten percent of a registered class of our equity securities, to file with the SEC initial reports of ownership and reports of changes in ownership of common stock and other equity securities of our company. Officers, directors and greater than ten percent stockholders are required by SEC regulation to furnish us with copies of all Section 16(a) forms they file.
Our officers, directors and ten percent stockholders were not subject to the reporting requirements of Section 16(a) until during the fiscal year ended December 31, 2016 and, therefore, there were no reports required during the fiscal year ended December 31, 2016.
Board Composition
Our business and affairs are organized under the direction of our board of directors, which currently consists of 7 members. The primary responsibility of our board of directors is to provide oversight, strategic guidance, counseling, and direction to our management team. Our board of directors meets on a regular basis and additionally as required. One of our directors was elected to serve on our board of directors pursuant to the Third Amended and Restated Voting Agreement, dated as of January 29, 2016, by and among Valeritas and certain of Valeritas’ stockholders. Pursuant to the voting agreement, Mr. Düster was selected to serve on our board of directors as designated by Capital Royalty Partners II L.P. or its affiliates.
A majority of the authorized number of directors constitutes a quorum of the Board of Directors for the transaction of business. The directors must be present at the meeting to constitute a quorum. However, any action required or permitted to be taken by the Board of Directors may be taken without a meeting if all members of the Board of Directors individually or collectively consent in writing to the action.
Family Relationships
There are no family relationships among our directors or executive officers.
Role of the Board in Risk Oversight
One of the key functions of our board of directors is informed oversight of our risk management process. The board of directors does not have a standing risk management committee, but rather administers this oversight function directly through the board of directors as a whole, as well as through various standing committees of our board of directors that address risks inherent in their respective areas of oversight. In particular, our board of directors is responsible for monitoring and assessing strategic risk exposure, and our audit committee has the responsibility to consider and discuss our major financial risk exposures and the steps our management has taken to monitor and control these exposures, including guidelines and policies to govern the process by which risk assessment and management is undertaken. In December 2016, we established a nominating and corporate governance committee. Our nominating and corporate governance committee monitors the effectiveness of our corporate governance practices, including whether they are successful in preventing illegal or improper liability-creating conduct. While each committee is responsible for evaluating certain risks and overseeing the management of such risks, the entire board is regularly informed through committee reports about such risks.
123
Table of Contents
Classified Board of Directors
In accordance with our amended and restated certificate of incorporation, our board of directors is divided into three classes with staggered, three-year terms. At each annual meeting of stockholders, the successors to directors whose terms then expire will be elected to serve from the time of election and qualification until the third annual meeting following election. Our directors are divided among the three classes as follows:
| • | the Class I directors are Brian K. Roberts, Joe Mandato, D.M. and Katherine Crothall, Ph.D., and their terms will expire at our annual meeting of stockholders to be held during the year 2017; |
| • | the Class II directors are Peter Devlin and Rodney Altman, M.D., and their terms will expire at our annual meeting of stockholders to be held during the year 2018; and |
| • | the Class III directors are Luke Düster and John E. Timberlake, and their terms will expire at the annual meeting of stockholders to be held during the year 2019. |
Our amended and restated certificate of incorporation provides that the authorized number of directors may be changed only by resolution of the board of directors. Any additional directorships resulting from an increase in the number of directors will be distributed among the three classes so that, as nearly as possible, each class will consist of one-third of the directors. The division of our board of directors into three classes with staggered three-year terms may delay or prevent a change of our management or a change in control of our company. Our directors may be removed only for cause by the affirmative vote of the holders of at least two-thirds of our outstanding voting stock entitled to vote in the election of directors.
Involvement in Certain Legal Proceedings
None of our directors or executive officers has been involved in any of the following events during the past ten years:
| • | any bankruptcy petition filed by or against any business of which such person was a general partner or executive officer either at the time of the bankruptcy or within two years prior to that time; |
| • | any conviction in a criminal proceeding or being subject to a pending criminal proceeding (excluding traffic violations and other minor offences); |
| • | being subject to any order, judgment, or decree, not subsequently reversed, suspended or vacated, of any court of competent jurisdiction, permanently or temporarily enjoining, barring, suspending or otherwise limiting his or her involvement in any type of business, securities or banking activities; or |
| • | being found by a court of competent jurisdiction (in a civil action), the SEC or the Commodity Futures Trading Commission to have violated a federal or state securities or commodities law, and the judgment has not been reversed, suspended, or vacated. |
Board Committees
Audit Committee
The members of our audit committee are Brian K. Roberts, Dr. Rodney D. Altman and Peter J. Devlin and Mr. Roberts serves as the chair. Our board of directors has determined that each of the members of our audit committee satisfies Nasdaq and SEC independence requirements and that Mr. Roberts qualifies as an audit committee financial expert within the meaning of SEC regulations. In making this determination, our board has considered the formal education and nature and scope of his previous experience. Our audit committee met three times during the year ended December 31, 2016.
Among other matters, the audit committee is responsible for:
| • | appointing our independent registered public accounting firm; |
124
Table of Contents
| • | evaluating our independent registered public accounting firm’s qualifications, independence and performance; |
| • | determining the engagement of our independent registered public accounting firm; |
| • | reviewing and approving the scope of the annual audit and the audit fee; |
| • | discussing with management and our independent registered public accounting firm the results of the annual audit and the review of our quarterly financial statements; |
| • | approving the retention of our independent registered public accounting firm to perform any proposed permissible non-audit services; |
| • | monitoring the rotation of partners of our independent registered public accounting firm on our engagement team as required by law; |
| • | reviewing our financial statements and our management’s discussion and analysis of financial condition and results of operations to be included in our annual and quarterly reports to be filed with the SEC; |
| • | reviewing our critical accounting policies and estimates; and |
| • | annually reviewing the audit committee charter and the committee’s performance. |
The audit committee operates pursuant to a charter adopted by our board of directors that satisfies the applicable standards of the SEC and Nasdaq.
Compensation Committee
The members of our compensation committee are Peter Devlin and Dr. Rodney Altman and Mr. Devlin serves as the chair. Our board of directors has determined that each of the members of our compensation committee satisfies Nasdaq and SEC independence requirements. The compensation committee operates under a written charter that satisfies the applicable standards of Nasdaq. Our compensation committee met once during the year ended December 31, 2016. The compensation committee’s responsibilities include:
| • | annually reviewing and making recommendations to the board of directors with respect to corporate goals and objectives relevant to the compensation of our chief executive officer; |
| • | evaluating the performance of our chief executive officer in light of such corporate goals and objectives and making recommendations to the board of directors with respect to the compensation of our chief executive officer; |
| • | reviewing and approving the compensation of our other executive officers; |
| • | reviewing and establishing our overall management compensation, philosophy and policy; |
| • | overseeing and administering our compensation and similar plans; |
| • | reviewing and approving our policies and procedures for the grant of equity-based awards; |
| • | reviewing and making recommendations to the board of directors with respect to director compensation; |
| • | reviewing and discussing with management the compensation discussion and analysis that may be required from time to time to be included in our annual proxy statement or Annual Report on Form 10-K; and |
| • | reviewing and discussing with the board of directors corporate succession plans for the chief executive officer and other key officers. |
125
Table of Contents
Nominating and Corporate Governance Committee
In December 2016, we established a nominating and corporate governance committee that is responsible for making recommendations to our board of directors regarding candidates for directorships and the size and composition of our board of directors. In addition, the nominating and corporate governance committee is responsible for overseeing our corporate governance policies and reporting and making recommendations to our board of directors concerning governance matters. The nominating and corporate governance committee operates under a written charter adopted by the board of directors. The members of the nominating and corporate governance committee are Joe Mandato, D.M. and Katherine Crothall, Ph.D., with Dr. Mandato serving as the chair. Our board of directors has determined that each member of the committee satisfies Nasdaq and SEC independence requirements. The nominating and corporate governance committee’s responsibilities include, among other things:
| • | developing and recommending to the board of directors criteria for board and committee membership; |
| • | establishing procedures for identifying and evaluating board of director candidates, including nominees recommended by stockholders; |
| • | reviewing the size and composition of the board of directors to ensure that it is composed of members with the appropriate skills and expertise to advise us; |
| • | identifying individuals qualified to become members of the board of directors; |
| • | recommending to the board of directors the persons to be nominated for election as directors and to each of the board’s committees; |
| • | developing and recommending to the board of directors a code of business conduct and ethics and a set of corporate governance guidelines; |
| • | developing a mechanism by which violations of the code of business conduct and ethics can be reported in a confidential manner; and |
| • | overseeing the evaluation of the board of directors and management. |
Compensation Committee Interlocks and Insider Participation
None of our executive officers currently serves, or in the past year has served, as a member of the board of directors or compensation committee of any entity that has one or more executive officers on our board of directors or compensation committee.
Code of Business Conduct and Ethics
We have adopted a written code of business conduct and ethics that applies to our directors, officers and employees, including our principal executive officer, principal financial officer, principal accounting officer or controller, or persons performing similar functions. Our code of business conduct and ethics is available under the Corporate Governance section of our website at www.valeritas.com. In addition, we intend to post on our website all disclosures that are required by law or the listing standards of The Nasdaq Capital Market concerning any amendments to, or waivers from, any provision of the code. The reference to our website address does not constitute incorporation by reference of the information contained at or available through our website, and you should not consider it to be a part of this filing.
126
Table of Contents
Item 11. Executive Compensation.
The following table sets forth information concerning the compensation of the named executive officers for the years ended December 31, 2016 and 2015. All amounts reflect compensation received from Valeritas. No figures referenced in this section have been adjusted to reflect the exchange ratio after consummation of the 2016 Merger.
| Name and Principal Position |
Year | Salary ($) |
Option Awards(4) ($) |
Stock Awards(4) ($) |
Non-Equity Incentive Plan Compensation(5) ($) |
All Other Compensation(6) ($) |
Total ($) |
|||||||||||||||||||||
| John E. Timberlake(3) |
2016 | 389,268 | 1,049,823 | 441,500 | 194,634 | (8) | 5,200 | 2,080,425 | ||||||||||||||||||||
| Chief Executive Officer and President |
2015 | 385,740 | — | — | 65,357 | 5,200 | 456,297 | |||||||||||||||||||||
| Erick Lucera(7) |
2016 | 85,000 | 368,430 | — | 29,750 | (8) | 1,200 | 484,380 | ||||||||||||||||||||
| Chief Financial Officer |
||||||||||||||||||||||||||||
| Geoffrey Jenkins |
||||||||||||||||||||||||||||
| Executive Vice President, Manufacturing |
2016 | 367,937 | 546,061 | 250,000 | 128,778 | (8) | 19,046 | 1,311,822 | ||||||||||||||||||||
| Operations and R&D |
2015 | 370,620 | — | — | 62,795 | 5,200 | 438,615 | |||||||||||||||||||||
| Matthew Nguyen Chief Commercial Officer |
|
2016 2015 |
|
|
281,976 262,697 |
|
|
315,373 — |
|
|
130,000 — |
|
|
102,639 38,151 |
(8)
|
|
48,200 5,200 |
|
|
878,188 306,048 |
| |||||||
| Former Executive Officers |
||||||||||||||||||||||||||||
| Leisa Swanson(1) |
2016 | — | — | — | — | — | — | |||||||||||||||||||||
| 2015 | 60,000 | — | — | — | — | 60,000 | ||||||||||||||||||||||
| Kristine Peterson(2) |
2016 | 491,090 | — | — | — | 1,387 | 492,477 | |||||||||||||||||||||
| 2015 | 465,447 | — | — | 144,670 | 5,200 | 615,407 | ||||||||||||||||||||||
| (1) | Resigned as our sole executive officer effective as of May 3, 2016 in connection with the 2016 Merger. All salary payments earned prior to the consummation of the 2016 Merger have been waived by Ms. Swanson and we have no liability for such payments subsequent to the 2016 Merger. |
| (2) | Resigned as Chief Executive Officer on February 22, 2016. To be paid through August 2017. |
| (3) | Appointed as Chief Executive Officer on February 22, 2016. Mr. Timberlake retained his title as President and Chief Commercial Officer until December 2016 when he was replaced by Mr. Nguyen as Chief Commercial Officer. |
| (4) | Represents the aggregate grant-date fair value of stock options and restricted stock granted during the indicated year computed in accordance with ASC Topic 718, excluding the effect of estimated forfeitures. |
| (5) | Represents amounts earned for the indicated year under our annual performance bonus program. For additional information, see “Annual Performance Bonuses” below. |
| (6) | Represents company matching contributions to 401(k) plan accounts and discretionary bonus payments. |
| (7) | Appointed as Chief Financial Officer on August 29, 2016. |
| (8) | Payment of bonus amounts earned in calendar year 2016 are contingent upon the completion of an equity financing with gross proceeds of at least $40 million. |
Narrative Explanation of Certain Aspects of the Summary Compensation Table
The primary elements of compensation for the named executive officers are base salary, cash bonuses and long-term equity-based compensation awards. The named executive officers also participate in employee benefit plans and programs that are offered to other full-time employees on the same basis.
127
Table of Contents
Base Salaries
The named executive officers receive a base salary to compensate them for the satisfactory performance of services rendered to our company. The base salary payable to each named executive officer is intended to provide a fixed component of compensation reflecting the executive’s skill set, experience, role and responsibilities. Base salaries for the named executive officers have generally been set at levels deemed necessary to attract and retain individuals with superior talent and were originally established in each named executive officer’s employment agreement.
In February 2015, the compensation committee of Valeritas’ board of directors, or Valeritas’ Compensation Committee, reviewed the annual salaries of the named executive officers and approved a 3% increase for Ms. Peterson, Mr. Timberlake and Mr. Jenkins of their respective base salaries, effective March 2015. Following the increases, the new base salary for Ms. Peterson was $450,639, for Mr. Timberlake was $373,468 and for Mr. Jenkins was $358,829.
In February 2016, Valeritas’ Compensation Committee reviewed the annual salaries of the named executive officers and approved a 3% increase for Geoffrey Jenkins his base salary and a 5% increase for John E. Timberlake, effective February 24, 2016. Following the increases, the new base salary for Geoffrey Jenkins was $393,593 and for John E. Timberlake was $392,141.
The 2015 and 2016 increases in base salary were made in recognition of our named executive officers’ individual performance and contributions to company performance in those years. Additionally, in February 2017, our compensation committee approved an increase in the base salary of each of our named executive officers in recognition of contributions to the Company during 2016.
In August 2016, Mr. Lucera was hired as our Chief Financial Officer with a starting base salary of $260,000. In December 2016, Mr. Nguyen was promoted to the position of Chief Commercial Officer with a starting base salary of $287,000.
Annual Performance Bonuses
We offer our named executive officers the opportunity to earn annual cash bonuses that are intended to compensate them for achieving short-term company and individual performance goals. Valeritas’ Compensation Committee establishes the target bonuses of our named executive officers, which are evaluated from time to time.
Each named executive officer’s target annual bonus is typically expressed as a percentage of base salary. For 2015, Ms. Peterson’s target bonus was 50% of her base salary and Messrs. Timberlake’s and Jenkins’ target bonuses were 35% of their respective base salaries. For 2016, Mr. Timberlake’s target bonus was 50% of his base salary and Mr. Jenkins’ target bonus was 35% of his base salary. No bonus amounts were paid to either Mr. Lucera or Mr. Nguyen in 2016.
For 2015 and 2016, annual cash bonuses were based on achievement of a combination of individual and corporate objectives. The 2015 and 2016 corporate objectives related to revenue, manufacturing efficiency and quality, financial management and fundraising. The 2015 and 2016 individual objectives for each named executive officer related to each named executive officer’s areas of responsibility within Valeritas and the named executive officer’s ability to influence the success of those areas.
Actual payouts of Valeritas’ 2015 and 2016 cash bonuses were determined by multiplying each named executive officer’s respective target amount by their base pay earnings for the fiscal year, multiplied by an individual bonus multiplier (0-150%), which was then multiplied by the company bonus multiplier (0-150%). The bonus multipliers represent Valeritas’ Compensation Committee’s evaluation of company performance and each named executive officer’s individual performance against the established targets.
128
Table of Contents
Notwithstanding the establishment of the performance components and the formula for determining the cash bonus payment amounts as described above, Valeritas Compensation Committee may exercise positive or negative discretion in determining the levels of achievement of performance goals or elect to award a greater or lesser amount to the Named executive officers than the amount determined by the annual cash bonus formula if, in the exercise of its business judgment, Valeritas Compensation Committee determines that adjustments are warranted under the circumstances.
Equity Compensation
We offer stock options to our key employees, including our named executive officers, as the long-term incentive component of our compensation program, which we consider necessary to enable us and certain of our affiliates to obtain and retain services of these individuals, which we believe is essential to our long-term success. We typically grant stock options to key employees when they commence employment with us and may thereafter grant additional awards in the discretion of our board of directors. Our stock options generally allow key employees to purchase shares of our common stock at a price per share equal to the fair market value of our common stock on the date of grant, as determined by the board of directors, and may be intended to qualify as incentive stock options under the Internal Revenue Code.
On June 20, 2014, Valeritas adopted the Valeritas, Inc. 2014 Incentive Compensation Plan, or the 2014 Plan, to facilitate the grant of cash and equity incentives to directors, employees (including Named executive officers) and consultants of Valeritas and certain of its affiliates.
Stock options under the 2014 Plan typically vested as to 25% of the shares subject to the option on the initial vesting date and in equal monthly installments over the following 36 months, subject to the holder’s continued employment with Valeritas.
In connection with the 2016 Merger, the 2014 Plan was terminated and we adopted the 2016 Plan, and options held by the named executive officers to purchase shares of Valeritas common stock under the 2014 Plan were cancelled. For additional information about the 2016 Plan, see the section entitled “2016 Incentive Compensation Plan” below.
From time to time, our board of directors may also construct alternate vesting schedules as it determines are appropriate to motivate particular employees. Stock options granted to our key employees may be subject to accelerated vesting in certain circumstances.
No stock options were granted to our named executive officers during 2015 or 2016 under the 2014 Plan.
Retirement, Health, Welfare and Additional Benefits
The named executive officers are eligible to participate in our employee benefit plans and programs, including medical and dental benefits, flexible spending accounts and short- and long-term disability and life insurance, to the same extent as other full-time employees, subject to the terms and eligibility requirements of those plans. The Named executive officers are also eligible to participate in a tax qualified 401(k) defined contribution plan to the same extent as other full-time employees. Currently, we match contributions made by participants in the 401(k) plan up to 2% of the employee contributions, and these matching contributions fully vest on the fifth anniversary of the date on which the contribution is made.
129
Table of Contents
Outstanding Equity Awards as of December 31, 2016
The following tables summarize the outstanding equity awards held by the named executive officers as of December 31, 2016 which consists of company options and restricted stock.
| Option Awards | Stock Awards | |||||||||||||||||||
| Name |
Number of Securities Underlying Options (#) Unexercisable |
Option Exercise Price ($) |
Option Expiration Date |
Number of Shares of Stock That Have Not Vested (#) |
Market Value of Shares of Stock That Have Not Vested ($)(6) |
|||||||||||||||
| John E. Timberlake |
353,000 | (1) | 5.00 | 5/3/2026 | 88,300 | (5) | 441,500 | |||||||||||||
| Erick Lucera |
115,000 | (2) | 5.36 | 9/7/2026 | ||||||||||||||||
| Geoffrey Jenkins |
186,500 | (3) | 5.00 | 5/3/2026 | 50,000 | (5) | 250,000 | |||||||||||||
| Matt Nguyen |
102,000 | (4) | 5.00 | 5/3/2026 | 26,000 | (5) | 130,000 | |||||||||||||
| (1) | 33% of shares underlying option will vest one year after date of grant with the remaining vesting in substantially equal monthly installments over 24 months. |
| (2) | 33% of shares underlying option will vest one year after date of grant with the remaining vesting in substantially equal monthly installments over 24 months. |
| (3) | 50% of shares underlying option will vest one year after date of grant with the remaining vesting in substantially equal monthly installments over 12 months. |
| (4) | 33% of shares underlying option will vest one year after date of grant with the remaining vesting in substantially equal monthly installments over 24 months. |
| (5) | The restricted shares shall vest on the earliest of (a) the sixth month anniversary of the date on which our common stock is listed on Nasdaq, (b) the three year anniversary of the grant date, (c) the participant’s termination of service due to Involuntary Termination (as defined in the 2016 Plan), death or Permanent Disability (as defined in the 2016 Plan) and (d) a Change in Control (as defined in the 2016 Plan), subject in all cases to continued employment with us until such vesting date. |
| (6) | Calculated using the closing price of our common stock on December 31, 2016. |
Director Compensation Table
Directors who are employees of us or our principal stockholders have not historically received compensation for their services on our board of directors. During 2016, certain of our non-employee directors who were not employees of our principal stockholders received annual cash retainers of $35,000 as compensation for their services on our board as indicated in the table below. In addition, we have from time to time granted stock option awards to certain non-employee directors as compensation for their service on our board.
The table below shows information regarding compensation earned during the year ended December 31, 2016 by our non-employee directors who served on our board of directors during 2016.
| Name |
Fee Earned or Paid in Cash ($) |
Option Awards ($)(1) |
Total ($) |
|||||||||
| Nathan D. Hukill(2) |
— | — | — | |||||||||
| Luke Duster(3) |
— | — | — | |||||||||
| Cameron Hui(4) |
— | — | — | |||||||||
| Katherine D. Crothall, Ph.D.(5) |
7,972 | 68,696 | 76,668 | |||||||||
| Rodney Altman, M.D.(6) |
29,908 | 55,332 | 85,240 | |||||||||
| Peter Devlin(7) |
30,408 | 55,332 | 85,740 | |||||||||
| Brian K. Roberts(8) |
23,750 | 55,995 | 79,745 | |||||||||
| Joseph M. Mandato, D.M.(9) |
2,917 | 59,807 | 62,724 | |||||||||
130
Table of Contents
| (1) | Represents the aggregate grant-date fair value of stock options granted during 2016 and still outstanding as at December 31, 2016, computed in accordance with ASC Topic 718, excluding the effect of estimated forfeitures. |
| (2) | Resigned from the board of directors effective as of December 1, 2016. |
| (3) | Appointed as a director effective as of January 29, 2016. |
| (4) | Resigned from the board of directors effective as of October 10, 2016. |
| (5) | Appointed as a director effective as of October 10, 2016. |
| (6) | Appointed as a director effective as of April 18, 2016. |
| (7) | Appointed as a director effective as of April 25, 2016. |
| (8) | Appointed as a director effective as of July 11, 2016. |
| (9) | Appointed as a director effective as of December 1, 2016. |
The following table provides information about the options held by our non-employee directors as of December 31, 2016.
| Name |
Aggregate Option Awards Outstanding (#) |
|||
| Nathan D. Hukill |
— | |||
| Luke Duster |
— | |||
| Cameron Hui |
— | |||
| Katherine D. Crothall, Ph.D. |
19,000 | (1) | ||
| Rodney Altman, M.D. |
19,000 | (2) | ||
| Peter Devlin |
19,000 | (2) | ||
| Brian K. Roberts |
19,000 | (3) | ||
| Joseph M. Mandato, D.M. |
19,000 | (1) | ||
| (1) | As of December 31, 2016, no shares underlying this option were vested. The shares underlying this option vest in equal quarterly installments over eight quarters. |
| (2) | As of December 31, 2016, 4,750 shares underlying this option were vested and the remaining shares vest in equal quarterly installments over six quarters. |
| (3) | As of December 31, 2016, 2,375 shares underlying this option were vested and the remaining shares vest in equal quarterly installments over seven quarters. |
Item 12. Security Ownership of Certain Beneficial Owners and Management and Related Stockholder Matters.
Beneficial ownership is determined in accordance with the rules of the SEC and generally includes voting or investment power with respect to securities. In accordance with SEC rules, shares of our common stock which may be acquired upon exercise of stock options or warrants which are currently exercisable or which become exercisable within 60 days of the date of the applicable table below are deemed beneficially owned by the holders of such options and warrants and are deemed outstanding for the purpose of computing the percentage of ownership of such person, but are not treated as outstanding for the purpose of computing the percentage of ownership of any other person. Subject to community property laws, where applicable, the persons or entities named in the tables below have sole voting and investment power with respect to all shares of our common stock indicated as beneficially owned by them.
The following table sets forth information with respect to the beneficial ownership of our common stock as of February 13, 2017, or the Determination Date, by (i) each stockholder known by us to be the beneficial owner of more than 5% of our common stock (our only classes of voting securities), (ii) each of our directors and executive officers, and (iii) all of our directors and executive officers as a group. To the best of our knowledge, except as otherwise indicated, each of the persons named in the table has sole voting and investment power with
131
Table of Contents
respect to the shares of our common stock beneficially owned by such person, except to the extent such power may be shared with a spouse. To our knowledge, none of the shares listed below are held under a voting trust or similar agreement, except as noted.
Unless otherwise indicated in the following table, the address for each person named in the table is c/o Valeritas Holdings, Inc., 750 Route 202 South, Suite 600, Bridgewater, NJ 08807.
| Name and address of beneficial owner |
Number of Shares Beneficially Owned |
Percentage of Shares Beneficially Owned |
||||||
| 5% and Greater Stockholders |
||||||||
| Capital Royalty L.P.(2) 1000 Main St. Suite 2500 Houston, TX 77002 |
9,487,763 | 72.27 | % | |||||
| Mark Tompkins APP 1 Via Giudino 23 6900 Lugano-Paradiso Switzerland |
980,000 | 7.47 | ||||||
| Named Executive Officers and Directors |
||||||||
| John E. Timberlake(3) |
88,300 | * | ||||||
| Leisa Swanson |
— | — | ||||||
| Kristine Peterson |
— | — | ||||||
| Matt Nguyen(4) |
26,000 | * | ||||||
| Erick J. Lucera |
— | — | ||||||
| Geoffrey Jenkins(5) |
50,000 | * | ||||||
| Luke Düster 1000 Main St. Suite 2500 Houston, TX 77002 |
— | — | ||||||
| Rodney Altman, M.D.(6) |
7,125 | * | ||||||
| Peter Devlin(6) |
7,125 | * | ||||||
| Brian K. Roberts(7) |
7,125 | * | ||||||
| Joe Mandato, D.M.(8) |
2,375 | * | ||||||
| Katherine D. Crothall, Ph.D.(8) |
2,375 | * | ||||||
| All of our directors and executive officers as a group (12 Persons) |
190,425 | 1.45 | ||||||
| * | Less than 1% |
| (1) | Applicable percentage ownership is based on 13,127,311 shares of common stock outstanding as of the Determination Date, together with securities exercisable or convertible into shares of common stock within 60 days after the Determination Date, for each shareholder. This amount includes 389,120 shares of unvested restricted stock which are excluded on our financial statements. Beneficial ownership is determined in accordance with the rules of the SEC and generally includes voting or investment power with respect to securities. |
| (2) | Includes (a) 1,110,806 shares of common stock held by Capital Royalty Partners II L.P. (“Capital Royalty Partners II”), (b) 448,369 shares of common stock held by Capital Royalty Partners II (Cayman) L.P. (“Capital Royalty Partners Cayman”), (c) 1,238,594 shares of common stock held by Capital Royalty Partners II Parallel Fund “A” L.P. (“Capital Royalty Partners A”), (d) 4,562,069 shares of common stock held by Capital Royalty Partners II Parallel Fund “B” (Cayman) L.P. (“Capital Royalty Partners B”), and (e) 2,127,925 shares of common stock held by Parallel Investment Opportunities Partners II, L.P. (“Parallel Partners”). Capital Royalty Partners II, Capital Royalty Partners Cayman, Capital Royalty Partners A, Capital Royalty Partners B, and Parallel Partners are indirectly wholly owned by Capital Royalty L.P. |
132
Table of Contents
| (“Capital Royalty”). As the sole and managing member of Capital Royalty, Charles Tate may be deemed to beneficially own such shares of common stock held by Capital Royalty Partners II, Capital Royalty Partners Cayman, Capital Royalty Partners A, Capital Royalty Partners B, and Parallel Partners. |
| (3) | Consists of 88,300 shares of restricted stock that have been granted under our 2016 Plan to Mr. Timberlake. The shares of restricted stock held by Mr. Timberlake vest on the earliest of (a) the sixth month anniversary of the date on which our common stock is listed on the Nasdaq, (b) the three year anniversary of the grant date (which grant date shall be the date of the completion of the 2016 Merger), (c) the participant’s termination of service due to Involuntary Termination (as defined in the 2016 Plan), death or Permanent Disability (as defined in the 2016 Plan) and (d) a Change in Control (as defined in the 2016 Plan), subject in all cases to the Participant’s continued employment with us until such vesting date. |
| (4) | Consists of 26,000 shares of restricted stock that have been granted under our 2016 Plan to Mr. Nguyen. The shares of restricted stock held by Mr. Nguyen vest similarly to those of Mr. Timberlake described in footnote (3) above. |
| (5) | Consists of 50,000 shares of restricted stock that have been granted under our 2016 Plan to Mr. Jenkins. The shares of restricted stock held by Mr. Jenkins vest similarly to those of Mr. Timberlake described in footnote (3) above. |
| (6) | Represents 7,125 shares of common stock underlying options that are vested and exercisable within 60 days of the Determination Date. |
| (7) | Represents 7,125 shares of common stock underlying options that are vested and exercisable within 60 days of the Determination Date. |
| (8) | Represents 2,375 shares of common stock underlying options that are vested and exercisable within 60 days of the Determination Date. |
EQUITY COMPENSATION PLAN INFORMATION
The following table contains information about our equity compensation plans as of December 31, 2016.
| Equity Compensation Plan Information |
||||||||||||
| Number of | ||||||||||||
| securities | ||||||||||||
| remaining | ||||||||||||
| available for | ||||||||||||
| future issuance | ||||||||||||
| Number of | under equity | |||||||||||
| securities to be | Weighted-average | compensation | ||||||||||
| issued upon | exercise price of | plans (excluding | ||||||||||
| exercise of | outstanding | securities reflected | ||||||||||
| Plan Category |
outstanding options | options | in column (a)) | |||||||||
| (a) | (b) | (c) | ||||||||||
| Equity compensation plans approved by security holders |
2,022,800 | $ | 5.02 | 504,980 | ||||||||
| Equity compensation plans not approved by security holders |
— | — | ||||||||||
|
|
|
|
|
|||||||||
| Total |
2,022,800 | $ | 5.02 | 504,980 | ||||||||
|
|
|
|
|
|||||||||
Item 13. Certain Relationships and Related-Party Transactions and Director Independence
SEC rules require us to disclose any transaction since January 1, 2016 or currently proposed transaction in which we are a participant in which the amount involved exceeded or will exceed $120,000 and in which any related person has or will have a direct or indirect material interest. A related person is any executive officer, director, nominee for director, or holder of 5% or more of our common stock, or an immediate family member of any of those persons.
133
Table of Contents
Capital Royalty Group Term Loan
On May 23, 2013, we entered into the Term Loan of $50.0 million with CRG structured as a senior secured loan with a six-year term. The Term Loan is secured by substantially all of our assets, including our material intellectual property. The Term Loan bears interest at 11% per annum and compounds annually. Until the third anniversary of the Term Loan, we had the option to pay quarterly interest of 7.5% in cash and 3.5% PIK interest which is added to the aggregate principal amount of the Term Loan on the last day of each quarter. Thereafter, interest on the Term Loan was payable only in cash. The Term Loan contained a minimum revenue covenant, which was $50.0 million for 2015.
Certain events of default that occurred led us to enter into a series of forbearance agreements with CRG. The initial forbearance agreement was entered on May 18, 2015 and has subsequently been amended five times. The forbearance agreements, as amended entered in 2015, contained a number of terms and conditions in exchange for CRG’s agreement to forbear. The forbearance agreement imposed an interest rate at the default interest rate of 15% per annum and a prepayment premium of 4% on the aggregate outstanding balance on the date of the repayment. As of December 31, 2015, the parties deferred the forbearance expiration date again to January 22, 2016.
On January 22, 2016, we amended the forbearance agreement to extend the forbearance period to March 31, 2016. As part of the terms within the forbearance agreement, dated January 29, 2016, we issued warrants to CRG exercisable into 16,000,000 shares of private company Series AB Preferred Stock of the private company at $1.25 per share. On March 25, 2016, we amended forbearance agreement to extend the expiration of the forbearance period to April 30, 2016 and included a number of events that could trigger an earlier expiration of the forbearance agreement.
Concurrently with the closing of the 2016 Merger on May 3, 2016, we restructured the Term Loan and executed a forbearance termination agreement whereby the forbearance agreement was terminated. CRG converted its outstanding accrued interest and prepayment premium of $16.5 million into 8,609,824 shares of private company Series AB preferred stock and 4,649,859 shares of private company common stock. The private company Series AB shares were then converted into 2,053,959 of our common stock upon the 2016 Merger and all private company common shares were canceled upon the 2016 Merger. The principal balance was restated as $50.0 million with interest rate charged at 11% per annum, which is PIK interest through June 30, 2018 and then both PIK and cash interest thereafter. The restructured Term Loan Agreement requires quarterly interest payments during the term of the loan, which are set to commence on June 30, 2018. The repayment of principal on amounts borrowed under the Loan is scheduled to be completed on March 31, 2021.
On February 9, 2017, we entered into an agreement with CRG to, among other things, reduce the amount required by this liquidity covenant to $2.0 million. The minimum cash balance covenant will, however, revert back to $5.0 million if we are not able to consummate an underwritten public offering with gross proceeds of at least $40.0 million prior to December 31, 2017. For additional information about the Term Loan, see “Management’s Discussion and Analysis of Financial Condition and Results of Operations—Indebtedness— Senior Secured Debt.”
On February 14, 2017, we entered into an agreement with CRG and WCAS Capital Partners IV, L.P., or WCAS, whereby, upon completion of an underwritten public offering with gross proceeds of at least $40.0 million prior to December 31, 2017, approximately $27.5 million of the outstanding principal amount of our debt, including the Term Loan, would convert into shares of our to-be-created Series A Convertible Preferred Stock, at a price set forth in the executed definitive documents. Borrowings under our credit facility are secured by substantially all of our assets, including our material intellectual property.
134
Table of Contents
Management Services Agreement with Welsh, Carson, Anderson & Stowe XI, L.P.
On September 8, 2011, we entered into a Management Services Agreement with Welsh, Carson, Anderson & Stowe XI, L.P. Certain affiliates of Welsh Carson, Anderson & Stowe XI, L.P. were also Series D Preferred shareholders. Under the terms of this agreement, we received strategic, managerial and operational advice in exchange for an annual fee of $0.5 million. We paid cash and incurred an expense of $0.1 million related to this management fee for both each of the years ended December 31, 2016 and 2015. On May 15, 2015, both parties terminated the Management Services Agreement.
WCAS Capital Partners Note Payable
In 2011, concurrently with the issuance of Series C Preferred Stock, we issued a $5.0 million senior subordinated note, or the WCAS Note, to WCAS Capital Partners IV, L.P., or WCAS. Amounts due under the WCAS Note originally bore interest at 10% per annum, payable semi-annually. On May 23, 2013, the WCAS Note was amended such that the note bore interest at 12% per annum, and all interest accrues as compounded PIK interest and is added to the aggregate principal amount of the loan semi-annually. The then outstanding principal amount of the note, including accrued PIK interest, is due in full in September 2021.
Concurrently with the closing of the 2016 Merger on May 3, 2016, we restructured the WCAS Note. WCAS converted its outstanding accrued interest and fees of $2.1 million to 1,660,530 shares of private company Series AB preferred stock, which were then converted into 396,201 shares of common stock of the Company upon the 2016 Merger.
The principal balance was restated as $5.0 million with 10% per annum payable entirely as PIK interest and debt maturity date set at September 8, 2021. No interest payments are required during the term of the loan. The principal balance and any interest accrued during the term of the loan are due on the maturity date. See “Management’s Discussion and Analysis of Financial Condition and Results of Operation—Indebtedness.”
Registration Rights Agreement
We entered into an Registration Rights Agreement on February 14, 2017, with WCAS and CRG. This agreement provides for certain rights relating to the registration of the shares of common stock issuable upon the conversion of our preferred held by WCAS and CRG.
Indemnification Agreements
We have entered into indemnification agreements with each of our directors. These agreements, among other things, require us to indemnify each director (and in certain cases their related venture capital funds) to the fullest extent permitted by Delaware law, including indemnification of expenses such as attorneys’ fees, judgments, fines and settlement amounts incurred by the director in any action or proceeding, including any action or proceeding by or in right of us, arising out of the person’s services as a director. For further information, see “Description of Capital Stock—Limitations on Liability and Indemnification of Officers and Directors.”
Policies and Procedures for Related Person Transactions
Our board of directors has adopted a written related person transaction policy setting forth the policies and procedures for the review and approval or ratification of related person transactions. This policy covers, with certain exceptions set forth in Item 404 of Regulation S-K under the Securities Act, any transaction, arrangement or relationship, or any series of similar transactions, arrangements or relationships, in which we were or are to be a participant, where the amount involved exceeds $120,000 in any fiscal year and a related person had, has or will have a direct or indirect material interest, including without limitation, purchases of goods or services by or from the related person or entities in which the related person has a material interest, indebtedness, guarantees of indebtedness and employment by us of a related person. In reviewing and approving any such transactions, our audit committee is tasked to consider all relevant facts and circumstances, including, but not limited to, whether
135
Table of Contents
the transaction is on terms comparable to those that could be obtained in an arm’s length transaction and the extent of the related person’s interest in the transaction. All of the transactions described in this section occurred prior to the adoption of this policy.
Director Independence
We are not currently subject to listing requirements of any national securities exchange that has requirements that a majority of the board of directors be “independent”. However, our board of directors has determined that all of our directors, other than John E. Timberlake and Luke Düster, qualify as “independent” in accordance with listing requirements of The Nasdaq Stock Market, or Nasdaq. The Nasdaq independence definition includes a series of objective tests, such as that the director is not, and has not been for at least three years, one of our employees and that neither the director nor any of his family members has engaged in various types of business dealings with us. In addition, as required by Nasdaq rules, our board of directors has made a subjective determination as to each independent director that no relationships exist, which, in the opinion of our board of directors, would interfere with the exercise of independent judgment in carrying out the responsibilities of a director. In making these determinations, our board of directors reviewed and discussed information provided by the directors and us with regard to each director’s business and personal activities and relationships as they may relate to us and our management.
Item 14. Principal Accounting Fees and Services.
The following table sets forth the aggregate fees incurred by us for the fiscal years shown:
| 2016 | 2015 | |||||||
| Audit Fees(1) |
268,000 | 155,000 | ||||||
| Audit-Related Fees(2) |
75,000 | — | ||||||
| Tax Fees(3) |
— | — | ||||||
| Total Fees |
343,000 | 155,000 | ||||||
|
|
|
|
|
|||||
| (1) | Audit Fees consist of fees billed for professional services rendered for the audit of our consolidated annual financial statements and review of the interim consolidated financial statements included in quarterly reports and services that are normally provided by the Independent Registered Public Accounting Firm in connection with statutory and regulatory filings or engagements. |
| (2) | Audit-Related Fees consist of fees billed for assurance and related services that are reasonably related to the performance of the audit or review of our consolidated financial statements and are not reported under “Audit Fees”. |
| (3) | Tax Fees consist of fees billed for professional services rendered for tax compliance, tax advice and tax planning (domestic and international). These services include assistance regarding federal, state and international tax compliance; tax planning and compliance work in connection with acquisitions and international tax planning. |
Pre-Approval of Audit and Non-Audit Services
Consistent with requirements of the SEC and the Public Company Accounting Oversight Board regarding auditor independence, our audit committee is responsible for the appointment, compensation and oversight of the work of our independent registered public accounting firm. In recognition of this responsibility, our audit committee (or the chair if such approval is needed on a time urgent basis) generally pre-approves of all audit and permissible non-audit services provided by the independent registered public accounting firm. These services may include audit services, audit-related services, tax services and other services.
136
Table of Contents
PART IV
Item 15. Exhibits and Financial Statement Schedules
| Exhibit Number |
Description | |
| 2.1* | Agreement and Plan of Merger and Reorganization, dated as of May 3, 2016, by and among the Registrant, Acquisition Sub and Valeritas, Inc. | |
| 3.1* | Amended and Restated Certificate of Incorporation of the Registrant | |
| 3.2* | Certificate of Merger of Acquisition Sub with and into Valeritas, Inc., filed May 3, 2016 | |
| 3.3* | Amended and Restated Bylaws of the Registrant | |
| 10.1* | Split-Off Agreement, dated as of May 3, 2016, by and among the Registrant, CYGM Operating Corp. and Leisa Swanson | |
| 10.2* | General Release Agreement, dated as of May 3, 2016, by and among the Registrant, CYGM Operating Corp. and Leisa Swanson | |
| 10.3* | Form of Lock-Up and No Short Selling Agreement between the Registrant and the officers, directors and shareholders party thereto | |
| 10.4** | Form of Lock-Up and No Short Selling Agreement for 80% of shares held prior to the 2016 Merger, by and between the Registrant and certain shareholders | |
| 10.5* | Form of Subscription Agreement between the Registrant and the investors party thereto | |
| 10.6* | Form of Placement Agent Warrant for common stock of the Registrant | |
| 10.7* | Form of Registration Rights Agreement | |
| 10.8*† | The Registrant’s 2016 Equity Incentive Plan | |
| 10.9*† | Form of Stock Option Agreement under 2016 Equity Incentive Plan | |
| 10.10** | Term Loan Agreement, dated May 24, 2013, by and between Valeritas, Inc., Capital Royalty Partners II L.P., Capital Royalty Partners II—Parallel Fund “A” L.P. and Parallel Investment Opportunities Partners II L.P., as lenders, and the guarantors party thereto | |
| 10.11** | Amended and Restated Term Loan Agreement, dated August 5, 2014, among Valeritas, Inc., as borrower, Capital Royalty Partners II L.P., Capital Royalty Partners II—Parallel Fund “A” L.P. and Parallel Investment Opportunities Partners II L.P., as lenders, and the guarantors party thereto | |
| 10.12** | Second Amended and Restated Term Loan Agreement, dated as of May 3, 2016, by and between Valeritas, Inc., a borrower, Valeritas Holdings, Inc., as Guarantor, Capital Royalty Partners II L.P., Capital Royalty Partners II—Parallel Fund “A” L.P., Parallel Investment Opportunities Partners II L.P., Capital Royalty Partners II—Parallel Fund “B” (Cayman) L.P., Capital Royalty Partners II (Cayman) L.P., as lenders, and the guarantors party thereto | |
| 10.13* | Joinder Agreement to Second Amended and Restated Term Loan Agreement, dated as of May 3, 2016, in favor of Capital Royalty Partners II L.P., Capital Royalty Partners II—Parallel Fund “A” L.P., Parallel Investment Opportunities Partners II L.P., Capital Royalty Partners II (Cayman) L.P., and Capital Royalty Partners II—Parallel Fund “B” (Cayman) L.P., as the Secured Parties, and Capital Royalty Partners II L.P., as Control Agent | |
| 10.14* | Limited Forbearance Agreement, dated May 18, 2015, by and between the Valeritas, Inc., Valeritas Holdings, LLC, Valeritas Security Corporation, Capital Royalty Partners II L.P., Parallel Investment Opportunities Partners II, L.P., Capital Royalty Partners II—Parallel Fund “A” L.P., Capital Royalty Partners II (Cayman) L.P. and Capital Royalty Partners II—Parallel Fund “B” (Cayman) L.P | |
137
Table of Contents
| Exhibit Number |
Description | |
| 10.15* | Amendment No. 1 to Limited Forbearance Agreement, dated September 28, 2015, by and among Valeritas, Inc., Valeritas Holdings, LLC, Valeritas Security Corporation, Capital Royalty Partners II L.P., Parallel Investment Opportunities Partners II, L.P., Capital Royalty Partners II—Parallel Fund “A” L.P., Capital Royalty Partners II (Cayman) L.P. and Capital Royalty Partners II—Parallel Fund “B” (Cayman) L.P. | |
| 10.16* | Amendment No. 2 to Limited Forbearance Agreement, dated November 13, 2015, by and among Valeritas, Inc., Valeritas Holdings, LLC, Valeritas Security Corporation, Capital Royalty Partners II L.P., Parallel Investment Opportunities Partners II, L.P., Capital Royalty Partners II—Parallel Fund “A” L.P., Capital Royalty Partners II (Cayman) L.P. and Capital Royalty Partners II—Parallel Fund “B” (Cayman) L.P. | |
| 10.17* | Amendment No. 3 to Limited Forbearance Agreement, dated December 21, 2015, by and among Valeritas, Inc., Valeritas Holdings, LLC, Valeritas Security Corporation, Capital Royalty Partners II L.P., Parallel Investment Opportunities Partners II, L.P., Capital Royalty Partners II—Parallel Fund “A” L.P., Capital Royalty Partners II (Cayman) L.P. and Capital Royalty Partners II—Parallel Fund “B” (Cayman) L.P. | |
| 10.18* | Amendment No. 4 to Limited Forbearance Agreement, dated January 29, 2016, by and among Valeritas, Inc., Valeritas Holdings, LLC, Valeritas Security Corporation, Capital Royalty Partners II L.P., Parallel Investment Opportunities Partners II, L.P., Capital Royalty Partners II—Parallel Fund “A” L.P., Capital Royalty Partners II (Cayman) L.P. and Capital Royalty Partners II—Parallel Fund “B” (Cayman) L.P. | |
| 10.19* | Amendment No. 5 to Limited Forbearance Agreement, dated March 25, 2016, by and among Valeritas, Inc., Valeritas Security Corporation, Capital Royalty Partners II L.P., Parallel Investment Opportunities Partners II, L.P., Capital Royalty Partners II—Parallel Fund “A” L.P., Capital Royalty Partners II (Cayman) L.P. and Capital Royalty Partners II—Parallel Fund “B” (Cayman) L.P. | |
| 10.20* | Amendment No. 6 to Limited Forbearance Agreement, dated April 30, 2016, by and among Valeritas, Inc. and Valeritas Security Corporation, as Guarantor and the undersigned Lenders. | |
| 10.21* | Termination of Forbearance Agreement, dated May 3, 2016, by and among Valeritas, Inc., Valeritas Security Corporation, Capital Royalty Partners II L.P., Parallel Investment Opportunities Partners II, L.P., Capital Royalty Partners II—Parallel Fund “A” L.P., Capital Royalty Partners II (Cayman) L.P. and Capital Royalty Partners II—Parallel Fund “B” (Cayman) L.P. | |
| 10.22* | Lease, dated October 20, 2009, by and between Valeritas, Inc. and BTCT Associates, L.L.C., as amended on January 17, 2013, in respect of the building located at 750 Route 202, Bridgewater, New Jersey 08807 | |
| 10.23* | Lease, dated December 22, 2006, by and among Valeritas, LLC, The Taming of the Shrewsbury, LLC, O’Neill Partners, LLC and Chanski, LLC, as amended on April 24, 2009, in respect of the building located at 800 Boston Turnpike, Shrewsbury, Massachusetts 01545 | |
| 10.24* | Promissory Note, dated September 8, 2011, issued by Valeritas, Inc. to WCAS Capital Partners IV, L.P., in the original principal amount of $5,000,000, by Amendment No. 1 to Note, dated May 24, 2013 | |
| 10.25** | Amendment No. 1 to Note, dated May 24, 2013, by and between WCAS Capital Partners IV, LP and Valeritas, Inc. | |
| 10.26** | Amended and Restated Note, dated May 3, 2016, by and between WCAS Capital Partners IV, LP and Valeritas, Inc. | |
138
Table of Contents
| Exhibit Number |
Description | |
| 10.27**† | Employment Agreement, dated May 3, 2016, by and between Valeritas, Inc. and John E. Timberlake | |
| 10.28**† | Employment Agreement, dated December 20, 2016, by and between Valeritas, Inc. and Matthew Nguyen | |
| 10.29*† | Employment Agreement, dated March 4, 2015, by and between Valeritas, Inc. and Geoffrey Jenkins | |
| 10.30*† | Employment Agreement, dated February 19, 2016, by and between Valeritas, Inc. and Mark Conley | |
| 10.31**† | Employment Agreement, dated August 29, 2016, by and between Valeritas, Inc. and Erick J. Lucera | |
| 10.32**† | Separation and Consulting Services Agreement, dated February 21, 2016, by and between Valeritas, Inc. and Kris Peterson | |
| 10.33**† | Form of Indemnification Agreement | |
| 21.1** | Subsidiaries of the Registrant | |
| 24.1** | Power of Attorney (contained on signature page hereto) | |
| 31.1** | Rule 13a-14(a) / 15d-14(a) Certification of Chief Executive Officer | |
| 31.2** | Rule 13a-14(a) / 15d-14(a) Certification of Chief Financial Officer. | |
| 32.1** | Section 1350 Certification of Chief Executive Officer | |
| 32.2** | Section 1350 Certification of Chief Financial Officer | |
| 101.INS** | XBRL Instance Document | |
| 101.SCH** | XBRL Taxonomy Extension Schema Document | |
| 101.CAL** | XBRL Taxonomy Extension Calculation Linkbase Document | |
| 101.DEF** | XBRL Taxonomy Extension Definition Linkbase Document | |
| 101.LAB** | XBRL Taxonomy Extension Label Linkbase Document | |
| 101.PRE** | XBRL Taxonomy Extension Presentation Linkbase Document | |
| * | Previously filed as an exhibit to our Form 8-K (File Number 333-198807), filed with the SEC on May 9, 2016. |
| ** | Filed herewith. |
| † | Management contract or compensatory plan or arrangement. |
139
Table of Contents
Pursuant to the requirements of Section 13 or 15(d) of the Securities Exchange Act of 1934, as amended, the Registrant has duly caused this Report to be signed on its behalf by the undersigned, thereunto duly authorized.
| VALERITAS HOLDINGS INC. | ||||||
| Date: February 21, 2017 | By: | /s/ John E. Timberlake | ||||
| John E. Timberlake | ||||||
| Chief Executive Officer | ||||||
Pursuant to the requirements of the Securities Exchange Act of 1934, as amended, this Report has been signed below by the following persons on behalf of the Registrant in the capacities and on the dates indicated.
| Signature |
Title |
Date | ||
| /s/ John E. Timberlake John E. Timberlake |
President, Chief Executive Officer and Director (Principal Executive Officer) |
February 21, 2017 | ||
| /s/ Erick Lucera Erick Lucera |
Chief Financial Officer (Principal Financial Officer) |
February 21, 2017 | ||
| /s/ Mark Conley Mark Conley |
Vice President, Corporate Controller and Treasurer (Principal Accounting Officer) |
February 21, 2017 | ||
| /s/ Katherine Crothall, Ph.D. Katherine Crothall, Ph.D. |
Director | February 21, 2017 | ||
| /s/ Luke Düster Luke Düster |
Director | February 21, 2017 | ||
| /s/ Joe Mandato, DM Joe Mandato, DM |
Director | February 21, 2017 | ||
| /s/ Rodney Altman, MD Rodney Altman, MD |
Director | February 21, 2017 | ||
| /s/ Peter Devlin Peter Devlin |
Director | February 21, 2017 | ||
| /s/ Brian K. Roberts Brian K. Roberts |
Director | February 21, 2017 | ||
140