Attached files
| file | filename |
|---|---|
| EX-99.1 - EX-99.1 - VEECO INSTRUMENTS INC | a17-4526_1ex99d1.htm |
| 8-K - 8-K - VEECO INSTRUMENTS INC | a17-4526_18k.htm |
Exhibit 99.2
Q4 2016 Conference Call Veeco Instruments Inc. February 16, 2017

Cautionary Statements Forward-looking Statements This written communication contains forward-looking statements that involve risks and uncertainties concerning the Company’s proposed acquisition of Ultratech, Ultratech’s and the Company’s expected financial performance, as well as Ultratech’s and the Company’s strategic and operational plans. Actual events or results may differ materially from those described in this written communication due to a number of risks and uncertainties. The potential risks and uncertainties include, among others, the possibility that Ultratech may be unable to obtain required stockholder approval or that other conditions to closing the transaction may not be satisfied, such that the transaction will not close or that the closing may be delayed; the reaction of customers to the transaction; general economic conditions; the transaction may involve unexpected costs, liabilities or delays; risks that the transaction disrupts current plans and operations of the parties to the transaction; the ability to recognize the benefits of the transaction; the amount of the costs, fees, expenses and charges related to the transaction and the actual terms of any financings that will be obtained for the transaction; the outcome of any legal proceedings related to the transaction; the occurrence of any event, change or other circumstances that could give rise to the termination of the transaction agreement. In addition, please refer to the documents that the Company and Ultratech file with the SEC on Forms 10-K, 10-Q and 8-K. The filings by the Company and Ultratech identify and address other important factors that could cause its financial and operational results to differ materially from those contained in the forward-looking statements set forth in this written communication. All forward-looking statements speak only as of the date of this written communication nor, in the case of any document incorporated by reference, the date of that document. Neither the Company nor Ultratech is under any duty to update any of the forward-looking statements after the date of this written communication to conform to actual results.
Cautionary Statements Additional Information and Where to Find It In connection with the proposed acquisition of Ultratech (“Ultratech”) by Veeco (the “Company”) pursuant to the terms of an Agreement and Plan of Merger by and among Ultratech, the Company and Ultratech, the Company will file with the Securities and Exchange Commission (the “SEC”) a Registration Statement on Form S-4 (the “Form S-4”) that will contain a proxy statement of Ultratech and a prospectus of the Company, which proxy statement/prospectus will be mailed or otherwise disseminated to Ultratech’s stockholders when it becomes available. Investors are urged to read the proxy statement/prospectus (including all amendments and supplements) because they will contain important information. Investors may obtain free copies of the proxy statement/prospectus when it becomes available, as well as other filings containing information about the Company and Ultratech, without charge, at the SEC’s Internet site (http://www.sec.gov). Copies of these documents may also be obtained for free from the companies’ web sites at www.Veeco.com or www.Ultratech.com. Participants in Solicitation The Company, Ultratech and their respective officers and directors may be deemed to be participants in the solicitation of proxies from the stockholders of Ultratech in connection with the proposed transaction. Information about the Company’s executive officers and directors is set forth in its Annual Report on Form 10-K, which was filed with the SEC on February 25, 2016 and its proxy statement for its 2016 annual meeting of stockholders, which was filed with the SEC on March 22, 2016. Information about Ultratech’ executive officers and directors is set forth in its Annual Report on Form 10-K, which was filed with the SEC on February 26, 2016, Amendment No. 1 to its Annual Report on Form 10-K, which was filed with the SEC on April 22, 2016, and the proxy statements for its 2016 annual meeting of stockholders, which were filed with the SEC on June 10 and June 13, 2016. Investors may obtain more detailed information regarding the direct and indirect interests of the Company, Ultratech and their respective executive officers and directors in the acquisition by reading the preliminary and definitive proxy statement/prospectus regarding the transaction, which will be filed with the SEC.
CEO Introduction John Peeler
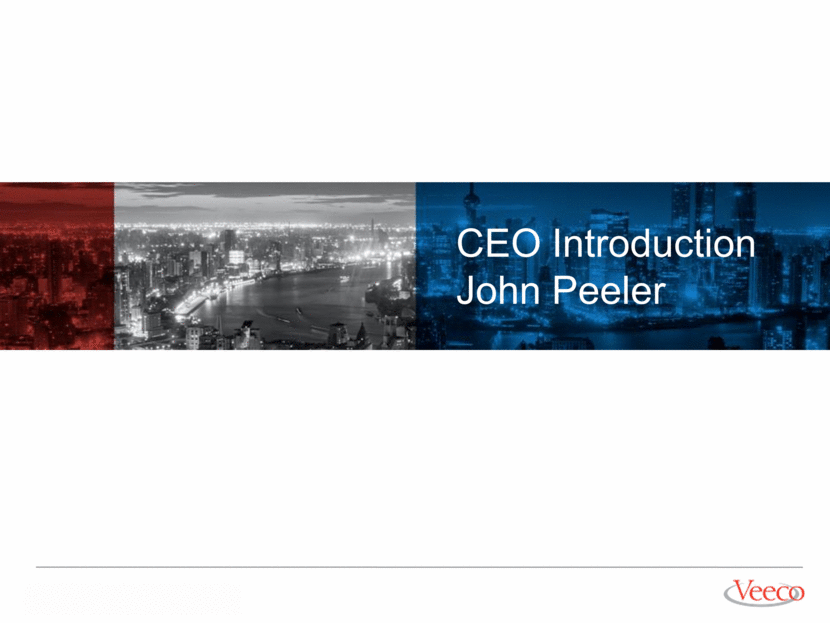
94 Revenue ($M) Bookings ($M) Adjusted EBITDA ($M) 127 6.2 (2.8) 68 Bookings $127M Revenue $94M Adjusted EBITDA $6.2M Strongest Quarterly Performance of 2016 Positive momentum entering 2017 More than doubled Q/Q Increased ~9% Q/Q In-line with revised guidance Q4 Financial Results 85 75 78 (2.1) 2.9 Note: A reconciliation of GAAP to Non-GAAP financial measures may be found in Back-up & Reconciliation Tables 62 118 Continued to grow bookings and build backlog
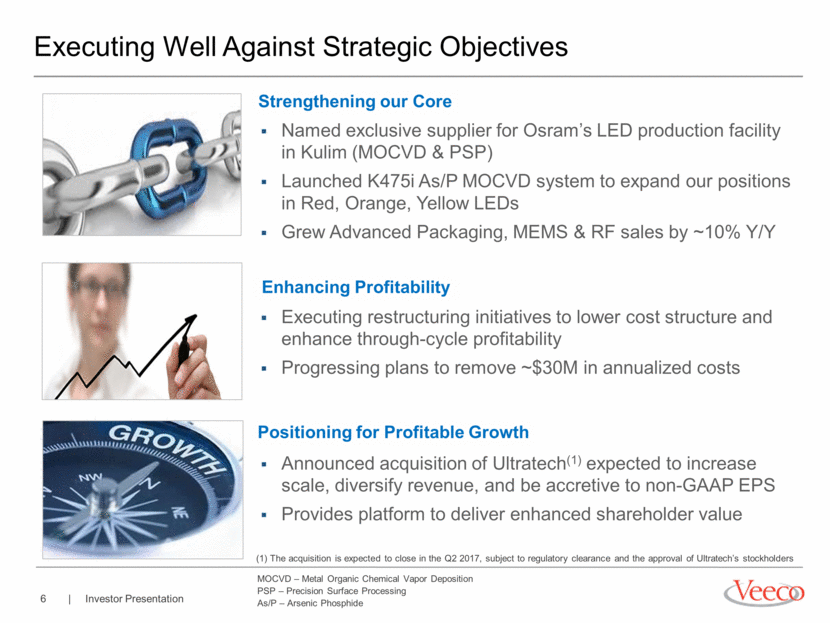
Executing Well Against Strategic Objectives Named exclusive supplier for Osram’s LED production facility in Kulim (MOCVD & PSP) Launched K475i As/P MOCVD system to expand our positions in Red, Orange, Yellow LEDs Grew Advanced Packaging, MEMS & RF sales by ~10% Y/Y Executing restructuring initiatives to lower cost structure and enhance through-cycle profitability Progressing plans to remove ~$30M in annualized costs Announced acquisition of Ultratech(1) expected to increase scale, diversify revenue, and be accretive to non-GAAP EPS Provides platform to deliver enhanced shareholder value Strengthening our Core Positioning for Profitable Growth Enhancing Profitability (1) The acquisition is expected to close in the Q2 2017, subject to regulatory clearance and the approval of Ultratech’s stockholders MOCVD – Metal Organic Chemical Vapor Deposition PSP – Precision Surface Processing As/P – Arsenic Phosphide
CFO Financial Review Sam Maheshwari
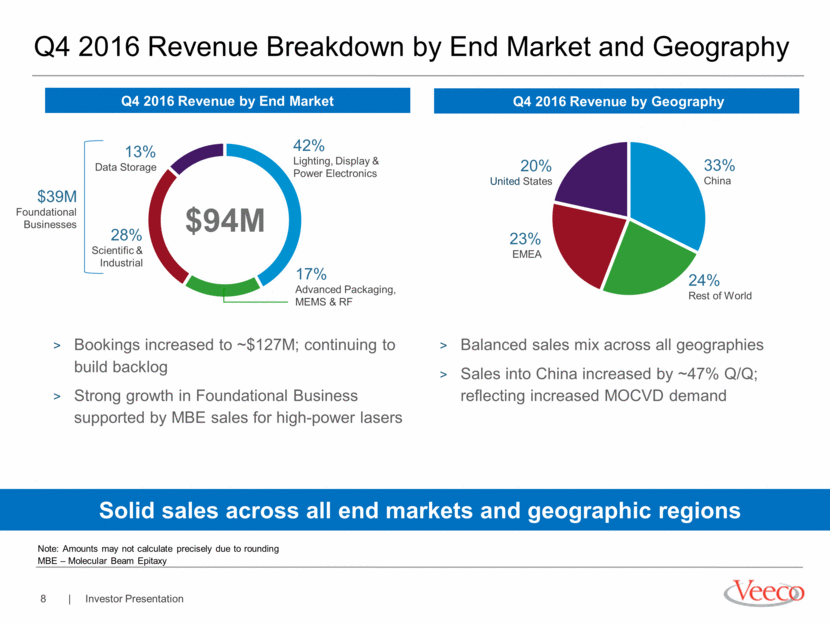
Q4 2016 Revenue Breakdown by End Market and Geography Solid sales across all end markets and geographic regions Bookings increased to ~$127M; continuing to build backlog Strong growth in Foundational Business supported by MBE sales for high-power lasers Q4 2016 Revenue by End Market Q4 2016 Revenue by Geography Note: Amounts may not calculate precisely due to rounding MBE – Molecular Beam Epitaxy 17% Advanced Packaging, MEMS & RF 13% Data Storage 42% Lighting, Display & Power Electronics $94M $39M Foundational Businesses 24% Rest of World 33% China 23% EMEA 20% United States 28% Scientific & Industrial Balanced sales mix across all geographies Sales into China increased by ~47% Q/Q; reflecting increased MOCVD demand
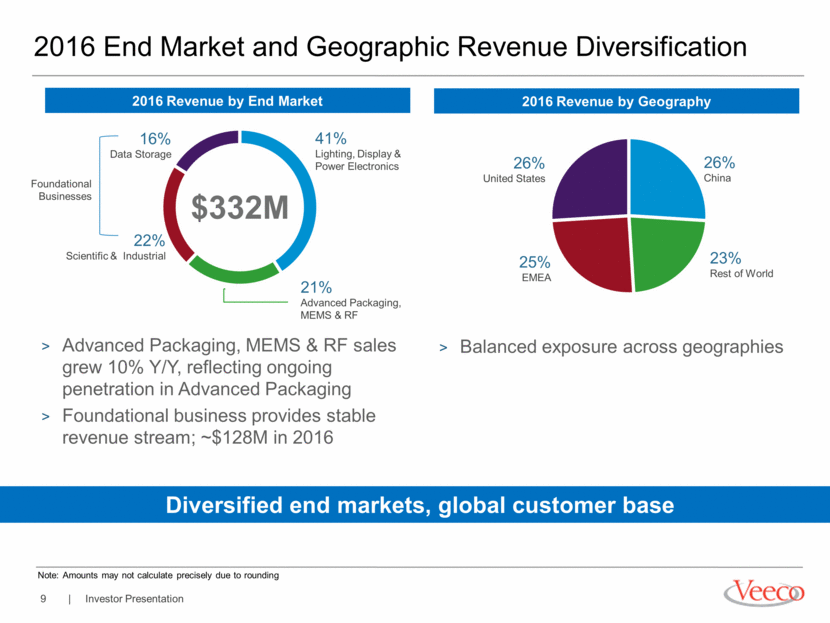
2016 End Market and Geographic Revenue Diversification 23% Rest of World 26% China 25% EMEA 26% United States 21% Advanced Packaging, MEMS & RF 16% Data Storage 22% Scientific & Industrial 41% Lighting, Display & Power Electronics $332M Foundational Businesses Balanced exposure across geographies Diversified end markets, global customer base Advanced Packaging, MEMS & RF sales grew 10% Y/Y, reflecting ongoing penetration in Advanced Packaging Foundational business provides stable revenue stream; ~$128M in 2016 2016 Revenue by End Market 2016 Revenue by Geography Note: Amounts may not calculate precisely due to rounding
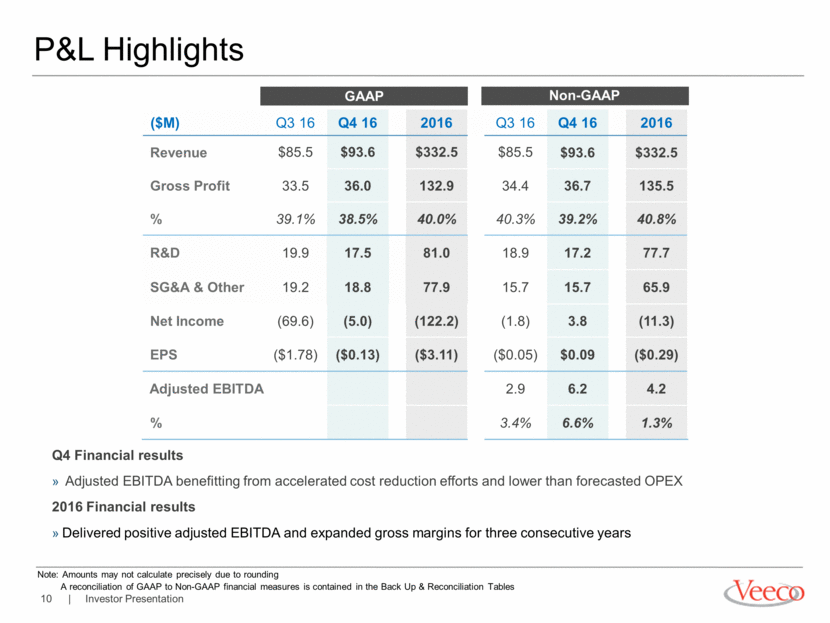
P&L Highlights ($M) Q3 16 Q4 16 2016 Q3 16 Q4 16 2016 Revenue $85.5 $93.6 $332.5 $85.5 $93.6 $332.5 Gross Profit 33.5 36.0 132.9 34.4 36.7 135.5 % 39.1% 38.5% 40.0% 40.3% 39.2% 40.8% R&D 19.9 17.5 81.0 18.9 17.2 77.7 SG&A & Other 19.2 18.8 77.9 15.7 15.7 65.9 Net Income (69.6) (5.0) (122.2) (1.8) 3.8 (11.3) EPS ($1.78) ($0.13) ($3.11) ($0.05) $0.09 ($0.29) Adjusted EBITDA 2.9 6.2 4.2 % 3.4% 6.6% 1.3% GAAP Non-GAAP Q4 Financial results Adjusted EBITDA benefitting from accelerated cost reduction efforts and lower than forecasted OPEX 2016 Financial results Delivered positive adjusted EBITDA and expanded gross margins for three consecutive years Note: Amounts may not calculate precisely due to rounding A reconciliation of GAAP to Non-GAAP financial measures is contained in the Back Up & Reconciliation Tables
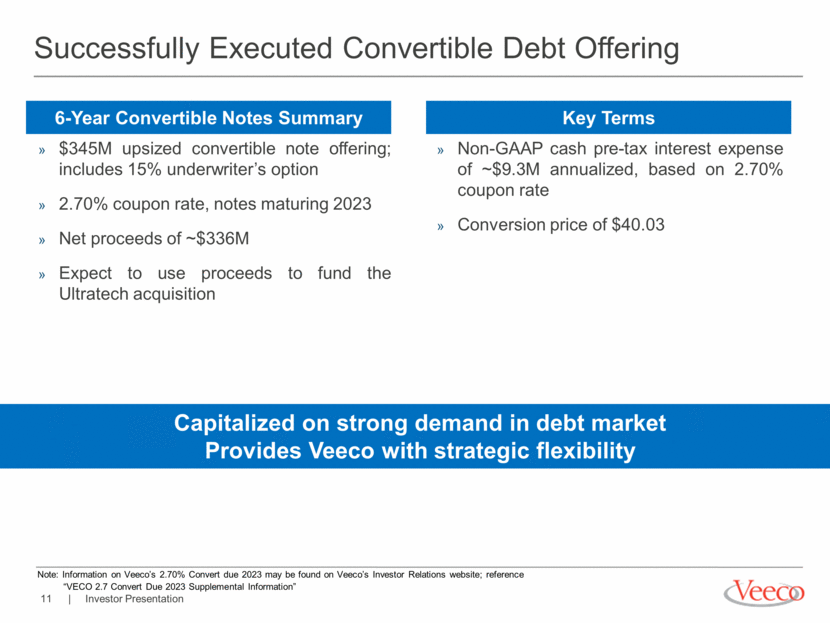
$345M upsized convertible note offering; includes 15% underwriter’s option 2.70% coupon rate, notes maturing 2023 Net proceeds of ~$336M Expect to use proceeds to fund the Ultratech acquisition Successfully Executed Convertible Debt Offering Capitalized on strong demand in debt market Provides Veeco with strategic flexibility Non-GAAP cash pre-tax interest expense of ~$9.3M annualized, based on 2.70% coupon rate Conversion price of $40.03 6-Year Convertible Notes Summary Key Terms Note: Information on Veeco’s 2.70% Convert due 2023 may be found on Veeco’s Investor Relations website; reference “VECO 2.7 Convert Due 2023 Supplemental Information”
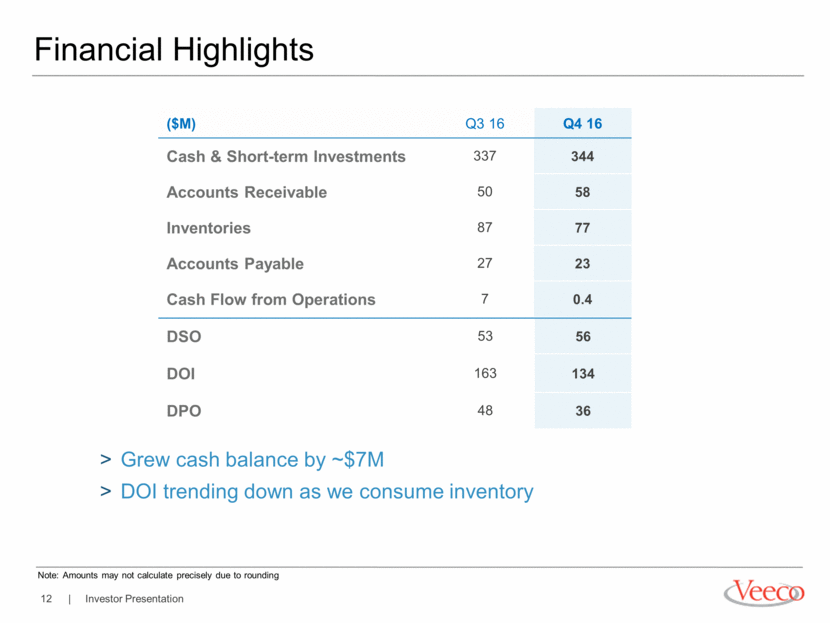
Grew cash balance by ~$7M DOI trending down as we consume inventory ($M) Q3 16 Q4 16 Cash & Short-term Investments 337 344 Accounts Receivable 50 58 Inventories 87 77 Accounts Payable 27 23 Cash Flow from Operations 7 0.4 Financial Highlights DSO 53 56 DOI 163 134 DPO 48 36 Note: Amounts may not calculate precisely due to rounding
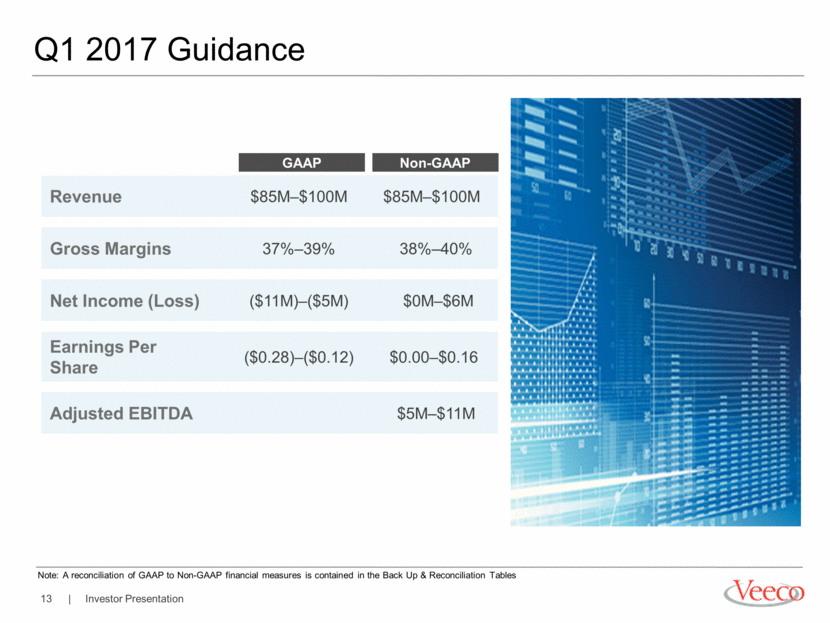
Q1 2017 Guidance Revenue $85M–$100M $85M–$100M Gross Margins 37%–39% 38%–40% Net Income (Loss) ($11M)–($5M) $0M–$6M Earnings Per Share ($0.28)–($0.12) $0.00–$0.16 Adjusted EBITDA $5M–$11M Non-GAAP GAAP Note: A reconciliation of GAAP to Non-GAAP financial measures is contained in the Back Up & Reconciliation Tables
Business Update & Outlook

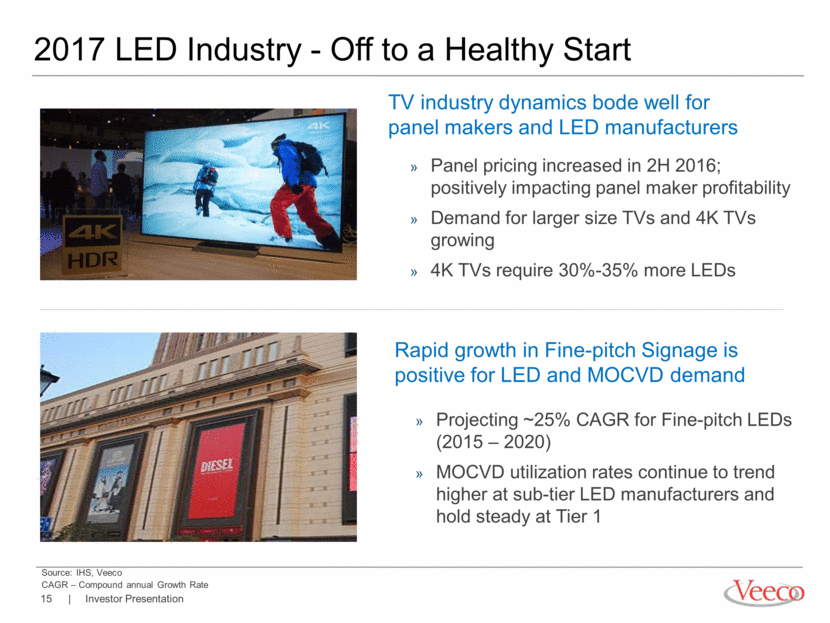
TV industry dynamics bode well for panel makers and LED manufacturers Projecting ~25% CAGR for Fine-pitch LEDs (2015 – 2020) MOCVD utilization rates continue to trend higher at sub-tier LED manufacturers and hold steady at Tier 1 2017 LED Industry - Off to a Healthy Start Panel pricing increased in 2H 2016; positively impacting panel maker profitability Demand for larger size TVs and 4K TVs growing 4K TVs require 30%-35% more LEDs Rapid growth in Fine-pitch Signage is positive for LED and MOCVD demand Source: IHS, Veeco CAGR – Compound annual Growth Rate
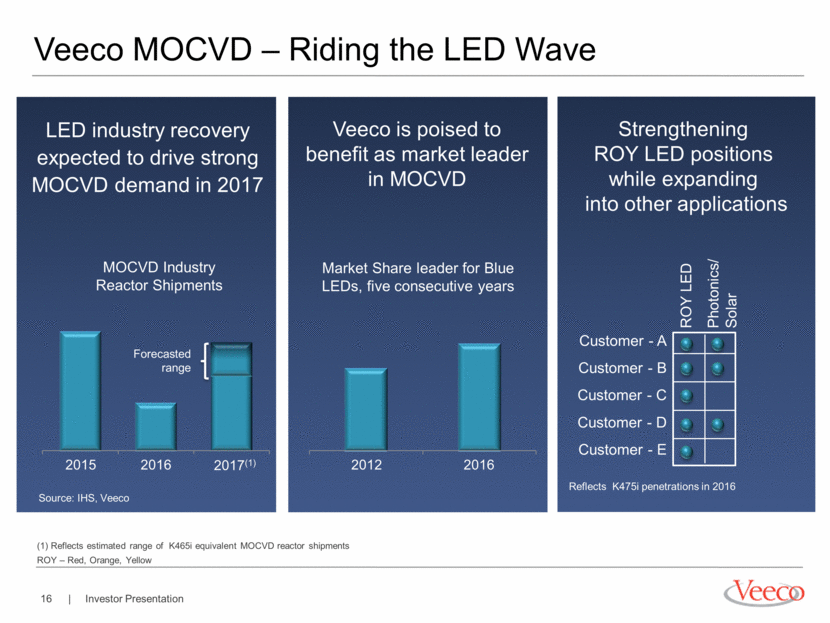
Veeco MOCVD – Riding the LED Wave (1) Reflects estimated range of K465i equivalent MOCVD reactor shipments ROY – Red, Orange, Yellow Veeco is poised to benefit as market leader in MOCVD Market Share leader for Blue LEDs, five consecutive years 2012 2016 MOCVD Industry Reactor Shipments 2015 2016 2017(1) LED industry recovery expected to drive strong MOCVD demand in 2017 Strengthening ROY LED positions while expanding into other applications Customer - A Customer - B Customer - C Customer - D Customer - E ROY LED Photonics/ Solar Reflects K475i penetrations in 2016 Source: IHS, Veeco Forecasted range
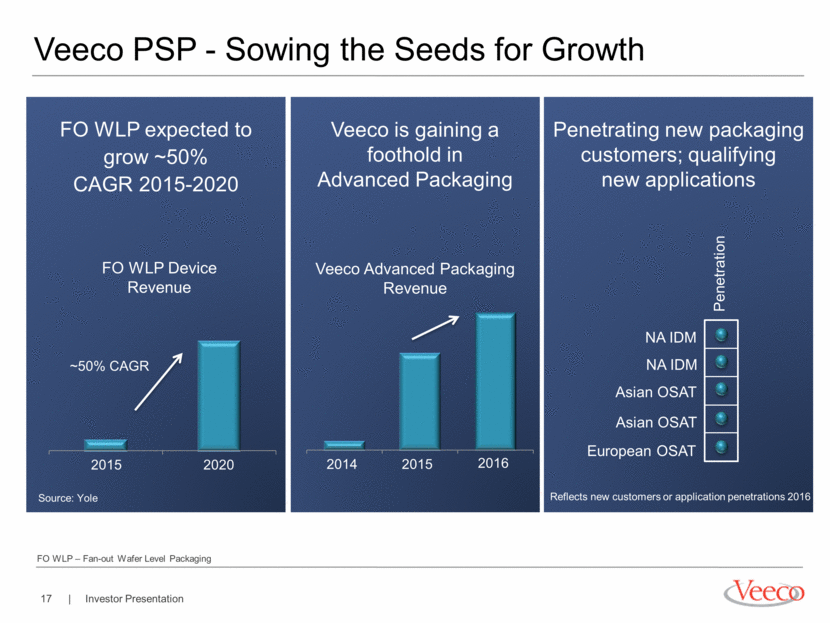
Veeco PSP - Sowing the Seeds for Growth Source: Yole Veeco is gaining a foothold in Advanced Packaging Veeco Advanced Packaging Revenue 2015 2020 ~50% CAGR FO WLP Device Revenue FO WLP expected to grow ~50% CAGR 2015-2020 2014 2015 2016 Penetrating new packaging customers; qualifying new applications Reflects new customers or application penetrations 2016 Penetration Asian OSAT NA IDM NA IDM Asian OSAT European OSAT FO WLP – Fan-out Wafer Level Packaging
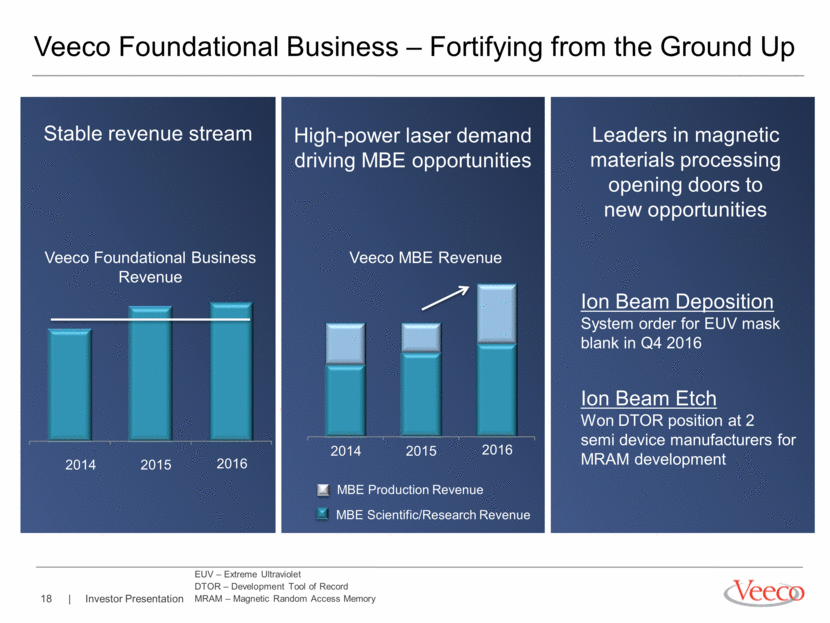
High-power laser demand driving MBE opportunities Veeco MBE Revenue 2014 2015 2016 MBE Production Revenue MBE Scientific/Research Revenue Veeco Foundational Business – Fortifying from the Ground Up Stable revenue stream Veeco Foundational Business Revenue 2014 2015 2016 Ion Beam Deposition System order for EUV mask blank in Q4 2016 Ion Beam Etch Won DTOR position at 2 semi device manufacturers for MRAM development Leaders in magnetic materials processing opening doors to new opportunities EUV – Extreme Ultraviolet DTOR – Development Tool of Record MRAM – Magnetic Random Access Memory
Starting 2017 Stronger and Well Positioned Stable business conditions Positive LED industry dynamics Healthy backlog of $209M Strong technology portfolio Strengthening leadership in MOCVD Penetrating growing Advanced Packaging markets with PSP Leveraging Ion Beam and MBE expertise to capture new opportunities Platform to deliver enhanced shareholder value Lowering costs to drive sustainable EBITDA profitability Ultratech acquisition(1) expected to increase scale and diversify revenue 19 (1) The acquisition is expected to close in Q2 2017, subject to regulatory clearance and the approval of Ultratech’s stockholders
Q&A
Back Up & Reconciliation Tables
Note On Reconciliation Tables These tables include financial measures adjusted for the impact of certain items; these financial measures are therefore not calculated in accordance with U.S. generally accepted accounting principles (“GAAP”). These Non-GAAP financial measures exclude items such as: share-based compensation expense; charges relating to restructuring initiatives; non-cash asset impairments; certain other non-operating gains and losses; and acquisition-related items such as transaction costs, non-cash amortization of acquired intangible assets, and incremental transaction-related compensation. These Non-GAAP financial measures may be different from Non-GAAP financial measures used by other companies. Non-GAAP financial measures should not be considered a substitute for, or superior to, measures of financial performance prepared in accordance with GAAP. By excluding these items, Non-GAAP financial measures are intended to facilitate meaningful comparisons to historical operating results, competitors' operating results, and estimates made by securities analysts. Management is evaluated on key performance metrics including adjusted EBITDA, which is used to determine management incentive compensation as well as to forecast future periods. These Non-GAAP financial measures may be useful to investors in allowing for greater transparency of supplemental information used by management in its financial and operational decision-making. In addition, similar Non-GAAP financial measures have historically been reported to investors; the inclusion of comparable numbers provides consistency in financial reporting. Investors are encouraged to review the reconciliation of the Non-GAAP financial measures used in this news release to their most directly comparable GAAP financial measures.
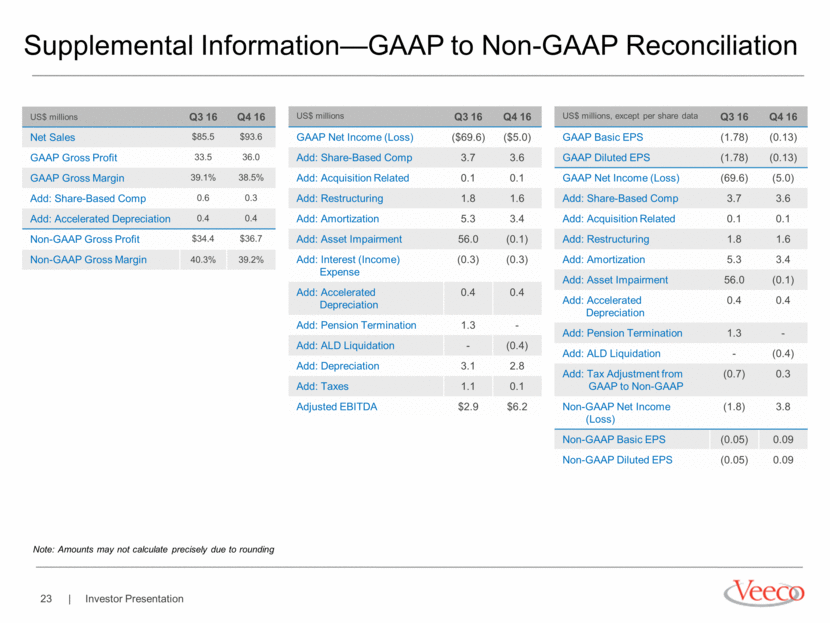
Supplemental Information—GAAP to Non-GAAP Reconciliation US$ millions Q3 16 Q4 16 Net Sales $85.5 $93.6 GAAP Gross Profit 33.5 36.0 GAAP Gross Margin 39.1% 38.5% Add: Share-Based Comp 0.6 0.3 Add: Accelerated Depreciation 0.4 0.4 Non-GAAP Gross Profit $34.4 $36.7 Non-GAAP Gross Margin 40.3% 39.2% US$ millions Q3 16 Q4 16 GAAP Net Income (Loss) ($69.6) ($5.0) Add: Share-Based Comp 3.7 3.6 Add: Acquisition Related 0.1 0.1 Add: Restructuring 1.8 1.6 Add: Amortization 5.3 3.4 Add: Asset Impairment 56.0 (0.1) Add: Interest (Income) Expense (0.3) (0.3) Add: Accelerated Depreciation 0.4 0.4 Add: Pension Termination 1.3 - Add: ALD Liquidation - (0.4) Add: Depreciation 3.1 2.8 Add: Taxes 1.1 0.1 Adjusted EBITDA $2.9 $6.2 US$ millions, except per share data Q3 16 Q4 16 GAAP Basic EPS (1.78) (0.13) GAAP Diluted EPS (1.78) (0.13) GAAP Net Income (Loss) (69.6) (5.0) Add: Share-Based Comp 3.7 3.6 Add: Acquisition Related 0.1 0.1 Add: Restructuring 1.8 1.6 Add: Amortization 5.3 3.4 Add: Asset Impairment 56.0 (0.1) Add: Accelerated Depreciation 0.4 0.4 Add: Pension Termination 1.3 - Add: ALD Liquidation - (0.4) Add: Tax Adjustment from GAAP to Non-GAAP (0.7) 0.3 Non-GAAP Net Income (Loss) (1.8) 3.8 Non-GAAP Basic EPS (0.05) 0.09 Non-GAAP Diluted EPS (0.05) 0.09 Note: Amounts may not calculate precisely due to rounding
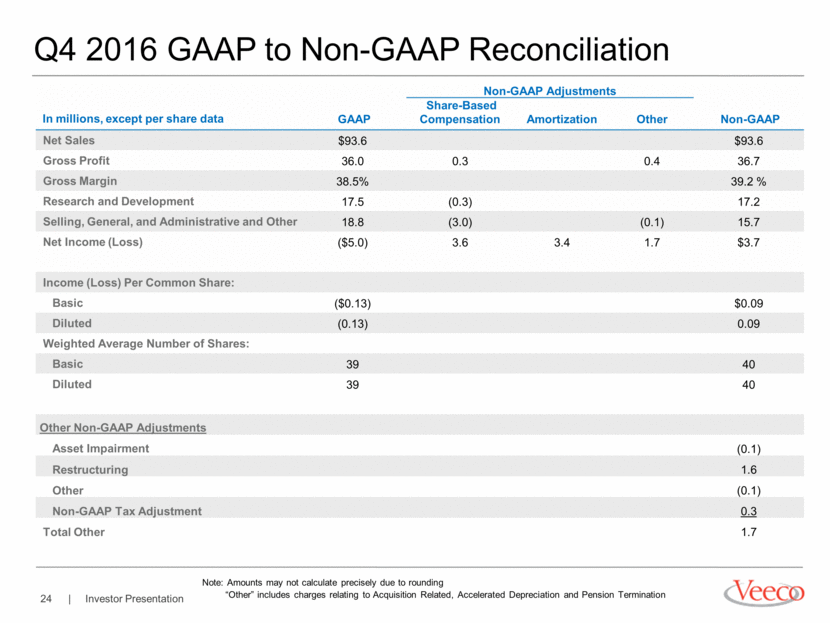
Q4 2016 GAAP to Non-GAAP Reconciliation Non-GAAP Adjustments In millions, except per share data GAAP Share-Based Compensation Amortization Other Non-GAAP Net Sales $93.6 $93.6 Gross Profit 36.0 0.3 0.4 36.7 Gross Margin 38.5% 39.2 % Research and Development 17.5 (0.3) 17.2 Selling, General, and Administrative and Other 18.8 (3.0) (0.1) 15.7 Net Income (Loss) ($5.0) 3.6 3.4 1.7 $3.7 Income (Loss) Per Common Share: Basic ($0.13) $0.09 Diluted (0.13) 0.09 Weighted Average Number of Shares: Basic 39 40 Diluted 39 40 Other Non-GAAP Adjustments Asset Impairment (0.1) Restructuring 1.6 Other (0.1) Non-GAAP Tax Adjustment 0.3 Total Other 1.7 Note: Amounts may not calculate precisely due to rounding “Other” includes charges relating to Acquisition Related, Accelerated Depreciation and Pension Termination
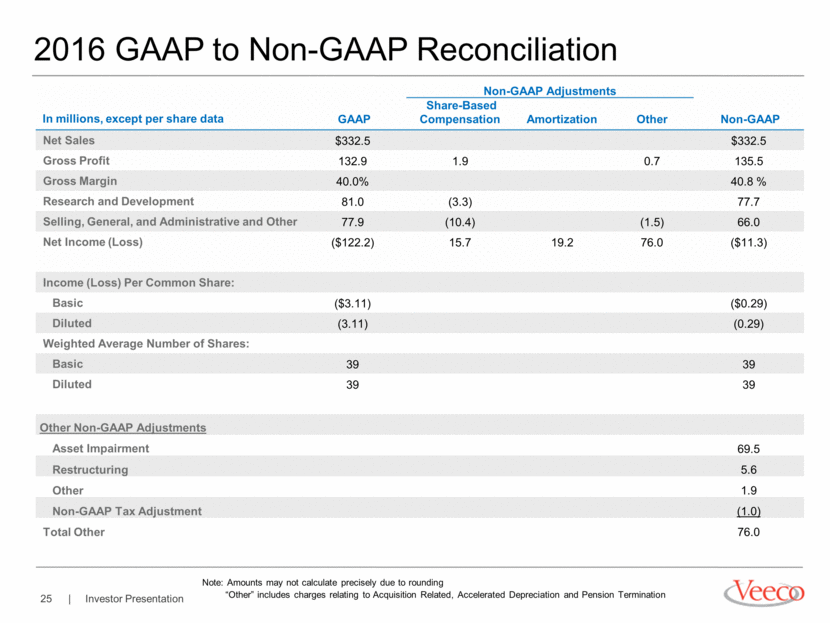
2016 GAAP to Non-GAAP Reconciliation Non-GAAP Adjustments In millions, except per share data GAAP Share-Based Compensation Amortization Other Non-GAAP Net Sales $332.5 $332.5 Gross Profit 132.9 1.9 0.7 135.5 Gross Margin 40.0% 40.8 % Research and Development 81.0 (3.3) 77.7 Selling, General, and Administrative and Other 77.9 (10.4) (1.5) 66.0 Net Income (Loss) ($122.2) 15.7 19.2 76.0 ($11.3) Income (Loss) Per Common Share: Basic ($3.11) ($0.29) Diluted (3.11) (0.29) Weighted Average Number of Shares: Basic 39 39 Diluted 39 39 Other Non-GAAP Adjustments Asset Impairment 69.5 Restructuring 5.6 Other 1.9 Non-GAAP Tax Adjustment (1.0) Total Other 76.0 Note: Amounts may not calculate precisely due to rounding “Other” includes charges relating to Acquisition Related, Accelerated Depreciation and Pension Termination
Q1 2017 Guidance GAAP to Non-GAAP Reconciliation Non-GAAP Adjustments In millions, except per share data GAAP Share-Based Compensation Amortization Other Non-GAAP Net Sales $85–$100 $85–$100 Gross Profit 32–39 1 — — 33–40 Gross Margin 37%–39% 38%–40% Net Income (Loss) ($11)–($5) 4 3 4 $0–$6 Income (Loss) per Diluted Share ($0.28)–($0.12) $0.00–$0.16 GAAP Net Income (Loss) ($11)–($5) Share-Based Compensation 4 Amortization 3 Restructuring 2 Acquisition related expense 2 Interest Income (Expense) 4 Depreciation 3 Income Tax Expense (Benefit) (2) Adjusted EBITDA $5–$11 Note: Amounts may not calculate precisely due to rounding Non-GAAP Adjustments

