Attached files
| file | filename |
|---|---|
| EX-32.1 - EXHIBIT 32.1 - CAMDEN PROPERTY TRUST | cpt12312016ex321.htm |
| EX-31.2 - EXHIBIT 31.2 - CAMDEN PROPERTY TRUST | cpt12312016ex312.htm |
| EX-31.1 - EXHIBIT 31.1 - CAMDEN PROPERTY TRUST | cpt12312016ex311.htm |
| EX-24.1 - EXHIBIT 24.1 - CAMDEN PROPERTY TRUST | cpt12312016-ex241.htm |
| EX-23.1 - EXHIBIT 23.1 - CAMDEN PROPERTY TRUST | cpt12312016-ex231.htm |
| EX-21.1 - EXHIBIT 21.1 - CAMDEN PROPERTY TRUST | cpt12312016-ex211.htm |
| EX-12.1 - EXHIBIT 12.1 - CAMDEN PROPERTY TRUST | cpt12312016-ex121.htm |
UNITED STATES
SECURITIES AND EXCHANGE COMMISSION
WASHINGTON, D.C. 20549
FORM 10-K
(Mark One)
ý | ANNUAL REPORT PURSUANT TO SECTION 13 OR 15(d) OF THE SECURITIES EXCHANGE ACT OF 1934 |
For the fiscal year ended December 31, 2016
OR
¨ | TRANSITION REPORT PURSUANT TO SECTION 13 OR 15(d) OF THE SECURITIES EXCHANGE ACT OF 1934 |
For the transition period from to
Commission file number: 1-12110
CAMDEN PROPERTY TRUST
(Exact name of registrant as specified in its charter)
Texas | 76-6088377 | |
(State or other jurisdiction of incorporation or organization) | (I.R.S. Employer Identification No.) | |
11 Greenway Plaza, Suite 2400 Houston, Texas | 77046 | |
(Address of principal executive offices) | (Zip Code) | |
Registrant’s telephone number, including area code: (713) 354-2500
Securities registered pursuant to Section 12(b) of the Act:
Title of each class | Name of each exchange on which registered | |
Common Shares of Beneficial Interest, $.01 par value | New York Stock Exchange | |
Securities registered pursuant to Section 12(g) of the Act:
None
Indicate by check mark if the registrant is a well-known seasoned issuer, as defined in Rule 405 of the Securities Act. Yes ý No ¨
Indicate by check mark if the registrant is not required to file reports pursuant to Section 13 or Section 15(d) of the Act. Yes ¨ No ý
Indicate by check mark whether registrant (1) has filed all reports required to be filed by Section 13 or 15(d) of the Securities Exchange Act of 1934 during the preceding 12 months (or for such shorter period that the registrant was required to file such reports), and (2) has been subject to such filing requirements for the past 90 days. Yes ý No ¨
Indicate by check mark whether the registrant has submitted electronically and posted on its corporate website, if any, every Interactive Data File required to be submitted and posted pursuant to Rule 405 of Regulation S-T (§232.405 of this chapter) during the preceding 12 months (or for such shorter period that the registrant was required to submit and post such files). Yes ý No ¨
Indicate by check mark if disclosure of delinquent filers pursuant to Item 405 of Regulation S-K (§229.405 of this chapter) is not contained herein, and will not be contained, to the best of registrant's knowledge, in definitive proxy or information statements incorporated by reference in Part III of this Form 10-K or any amendment to this Form 10-K. ý
Indicate by check mark whether the registrant is a large accelerated filer, an accelerated filer, a non-accelerated filer, or a smaller reporting company. See definitions of “large accelerated filer,” “accelerated filer” and “smaller reporting company” in Rule 12b-2 of the Exchange Act (check one):
Large accelerated filer | ý | Accelerated filer | ¨ | ||
Non-accelerated filer | ¨ (Do not check if a smaller reporting company) | Smaller reporting company | ¨ | ||
Indicate by check mark whether the registrant is a shell company (as defined in the Rule 12b-2 of the Act). Yes ¨ No ý
The aggregate market value of voting and non-voting common equity held by non-affiliates of the registrant was $7,646,700,508 based on a June 30, 2016 share price of $88.42.
On February 10, 2017, 87,526,221 common shares of the registrant were outstanding, net of treasury shares and shares held in our deferred compensation arrangements.
DOCUMENTS INCORPORATED BY REFERENCE
Portions of the registrant's Proxy Statement in connection with its Annual Meeting of Shareholders to be held May 12, 2017 are incorporated by reference in Part III.
1
TABLE OF CONTENTS
Page | ||
Item 1. | ||
Item 1A. | ||
Item 1B. | ||
Item 2. | ||
Item 3. | ||
Item 4. | ||
Item 5. | ||
Item 6. | ||
Item 7. | ||
Item 7A. | ||
Item 8. | ||
Item 9. | ||
Item 9A. | ||
Item 9B. | ||
Item 10. | ||
Item 11. | ||
Item 12. | ||
Item 13. | ||
Item 14. | ||
Item 15. | ||
ii
PART I
Item 1. Business
General
Formed on May 25, 1993, Camden Property Trust, a Texas real estate investment trust (“REIT”), is primarily engaged in the ownership, management, development, redevelopment, acquisition, and construction of multifamily apartment communities. Unless the context requires otherwise, “we,” “our,” “us,” and the “Company” refer to Camden Property Trust and its consolidated subsidiaries. Our multifamily apartment communities are referred to as “communities,” “multifamily communities,” “properties,” or “multifamily properties” in the following discussion.
Our corporate offices are located at 11 Greenway Plaza, Suite 2400, Houston, Texas 77046 and our telephone number is (713) 354-2500. Our website is located at www.camdenliving.com. On our website we make available free of charge our annual, quarterly, and current reports, and amendments to such reports, filed or furnished pursuant to Section 13(a) or 15(d) of the Securities Exchange Act of 1934, as amended, as soon as reasonably practicable after we electronically file such material with, or furnish it to, the U.S. Securities and Exchange Commission (the “SEC”). We also make available, free of charge on our website, our Guidelines on Governance, Code of Business Conduct and Ethics, Code of Ethical Conduct for Senior Financial Officers, and the charters of each of our Audit, Compensation, and Nominating and Corporate Governance Committees. Copies are also available, without charge, from Investor Relations, 11 Greenway Plaza, Suite 2400, Houston, Texas 77046. References to our website in this report are provided as a convenience and do not constitute, and should not be viewed as, an incorporation by reference of the information contained on, or available through our website, and therefore such information should not be considered part of this report.
Our annual, quarterly, and current reports, proxy statements, and other information are electronically filed with the SEC. You may read and copy any materials we file with the SEC at the SEC’s Public Reference Room at 100 F Street, NE, Washington, D.C. 20549. Please contact the SEC at 1-800-SEC-0330 for further information about the operation of the SEC’s Public Reference Room. The SEC also maintains a website at www.sec.gov which contains reports, proxy and information statements, and other information regarding issuers that file electronically with the SEC.
Narrative Description of Business
As of December 31, 2016, we owned interests in, operated, or were developing 159 multifamily properties comprised of 55,366 apartment homes across the United States. Of the 159 properties, seven properties were under construction and will consist of a total of 2,573 apartment homes when completed. We also own land holdings which we may develop into multifamily communities in the future.
Operating and Business Strategy
We believe producing consistent earnings growth through property operations, development and acquisitions, achieving market balance, and recycling capital are crucial factors to our success. We rely heavily on our sophisticated property management capabilities and innovative operating strategies to help us maximize the earnings potential of our communities.
Real Estate Investments and Market Balance. We believe we are well positioned in our current markets and have the expertise to take advantage of new opportunities as they arise. These capabilities, combined with what we believe is a conservative financial structure, should allow us to concentrate our growth efforts toward selective opportunities to enhance our strategy of having a geographically diverse portfolio of assets which meet the requirements of our residents.
We continue to operate in our core markets which we believe provides an advantage due to economies of scale. We believe, where possible, it is best to operate with a strong base of properties in order to benefit from the personnel allocation and the market strength associated with managing multiple properties in the same market. However, consistent with our goal of generating sustained earnings growth, we intend to selectively dispose of properties and redeploy capital for various strategic reasons, including if we determine a property cannot meet our long-term earnings growth expectations.
We try to maximize capital appreciation of our properties by investing in markets characterized by conditions favorable to multifamily property appreciation. These markets generally feature the following:
• | Strong economic growth leading to household formation and job growth, which in turn should support higher demand for our apartments; and, |
• | An attractive quality of life, which may lead to higher demand and retention for our apartments and allow us to more readily increase rents. |
1
Subject to market conditions, we intend to continue to seek opportunities to develop, redevelop and acquire existing communities. We also intend to evaluate our operating property and land development portfolio and plan to continue our practice of selective dispositions as market conditions warrant and opportunities arise.
We also intend to strengthen our capital and liquidity positions by continuing to focus on our core fundamentals which currently are generating positive cash flows from operations, maintaining appropriate debt levels and leverage ratios, and controlling overhead costs. We anticipate meeting our near-term liquidity requirements through a combination of one or more of the following: cash and cash equivalents, short-term investments, cash flows generated from operations, draws on our unsecured credit facility, proceeds from property dispositions, the use of debt and equity offerings under our automatic shelf registration statement, equity issued from our at-the-market ("ATM") share offering program, other unsecured borrowings, and secured mortgages.
Sophisticated Property Management. We believe the depth of our organization enables us to deliver quality services, promote resident satisfaction, and retain residents, thereby increasing our operating revenues and reducing our operating expenses. We manage our properties utilizing a staff of professionals and support personnel, including certified property managers, experienced apartment managers and leasing agents, and trained apartment maintenance technicians. Our on-site personnel are trained to deliver high-quality services to our residents, and we strive to motivate our on-site employees through incentive compensation arrangements based upon property operational results, rental rate increases, occupancy levels, and level of new leases and lease renewals achieved.
Operations. We believe an intense focus on operations is necessary to realize consistent, sustained earnings growth. Ensuring resident satisfaction, increasing rents as market conditions allow, maximizing rent collections, maintaining property occupancy at optimal levels, and controlling operating costs comprise our principal strategies to maximize property financial results. We believe our web-based property management and revenue management systems strengthen on-site operations and allow us to quickly adjust rental rates as local market conditions change. Lease terms are generally staggered based on vacancy exposure by apartment type so lease expirations are matched to each property's seasonal rental patterns. We generally offer leases ranging from six to eighteen months with individual property marketing plans structured to respond to local market conditions. In addition, we conduct ongoing customer service surveys to help ensure timely response to residents' changing needs and a high level of satisfaction.
Investments in Joint Ventures. We have entered into, and may continue in the future to enter into, joint ventures or partnerships, including limited liability companies, through which we own an indirect economic interest in less than 100% of the community or land owned directly by the joint venture or partnership. We currently have three discretionary investment Funds (the “Funds”), two of which are closed to future investments, and the third of which we formed in March 2015 for future multifamily investments of up to $450 million. See Note 8, “Investments in Joint Ventures,” and Note 13, “Commitments and Contingencies,” in the notes to Consolidated Financial Statements for further discussion of our investments in joint ventures.
Competition
There are numerous housing alternatives which compete with our communities in attracting residents. Our properties compete directly with other multifamily properties as well as condominiums and single-family homes which are available for rent or purchase in the markets in which our communities are located. This competitive environment could have a material adverse effect on our ability to lease apartment homes at our present properties or any newly developed or acquired property, as well as on the rents realized.
Employees
At December 31, 2016, we had approximately 1,600 employees, including executive, administrative, and community personnel.
Qualification as a Real Estate Investment Trust
As of December 31, 2016, we met the qualification of a REIT under Sections 856-860 of the Internal Revenue Code of 1986, as amended (the “Code”). As a result, we, with the exception of our taxable REIT subsidiaries, will not be subject to federal income tax to the extent we continue to meet certain requirements of the Code.
Item 1A. Risk Factors
In addition to the other information contained in this Form 10-K, the following risk factors should be considered carefully in evaluating our business. Our business, financial condition, or results of operations could be materially adversely affected by any of these risks.
2
Risks Associated with Capital Markets, Credit Markets, and Real Estate
Volatility in capital and credit markets, or other unfavorable changes in economic conditions, either nationally or regionally in one or more of the markets in which we operate, could adversely impact us.
The capital and credit markets are subject to volatility and disruption. We therefore may not be able to obtain new debt financing or refinance our existing debt on favorable terms or at all, which would adversely affect our liquidity, our ability to make distributions to shareholders, acquire assets and continue our development activities. Other weakened economic conditions, including job losses, high unemployment levels, stock market volatility, and uncertainty about the future, could adversely affect rental rates and occupancy levels. Unfavorable changes in economic conditions may have a material adverse impact on our cash flows and operating results.
Additional key economic risks which may adversely affect conditions in the markets in which we operate include the following:
• | local conditions, such as an oversupply of apartments or other housing available for rent, or a reduction in demand for apartments in the area; |
• | declines in the financial condition of our tenants, which may make it more difficult for us to collect rents from some tenants; |
• | declines in market rental rates; |
• | low mortgage interest rates and home pricing, making alternative housing more affordable; |
• | government or builder incentives which enable home buyers to put little or no money down, making alternative housing options more attractive; |
• | regional economic downturns, including, but not limited to, business layoffs, downsizing and increased unemployment, which may impact one or more of our geographical markets; and |
• | increased operating costs, if these costs cannot be passed through to residents. |
Short-term leases expose us to the effects of declining market rents.
Our apartment leases are generally for a term of eighteen months or less. As these leases typically permit the residents to leave at the end of the lease term without penalty, our rental revenues are impacted by declines in market rents more quickly than if our leases were for longer terms.
Competition could limit our ability to lease apartments or increase or maintain rental income.
There are numerous housing alternatives which compete with our properties in attracting residents. Our properties compete directly with other multifamily properties as well as condominiums and single-family homes which are available for rent or purchase in the markets in which our properties are located. This competitive environment could have a material adverse effect on our ability to lease apartment homes at our present properties or any newly developed or acquired property, as well as on the rents realized.
We face risks associated with land holdings and related activities.
We hold land for future development and may in the future acquire additional land holdings. The risks inherent in purchasing, owning, and developing land increase as demand for apartments, or rental rates, decrease. Real estate markets are highly uncertain and, as a result, the value of undeveloped land may fluctuate significantly. In addition, carrying costs can be significant and can result in losses or reduced profitability. As a result, we hold certain land, and may in the future acquire additional land, in our development pipeline at a cost we may not be able to fully recover or at a cost which may preclude our developing a profitable multifamily community. If there are subsequent changes in the fair market value of our land holdings which we determine is less than the carrying basis of our land holdings reflected in our financial statements plus estimated costs to sell, we may be required to take future impairment charges which would reduce our net income.
Potential reforms to Fannie Mae and Freddie Mac could adversely affect us.
There is significant uncertainty surrounding the futures of Fannie Mae and Freddie Mac. Through their lender originator networks, Fannie Mae and Freddie Mac are significant lenders both to us and to buyers of our properties. Fannie Mae and Freddie Mac have a mandate to support multifamily housing through their financing activities and any changes to their mandates, further reductions in their size or the scale of their activities, or loss of their key personnel could have a significant adverse impact on us and may, among other things, lead to lower values for our assets and higher interest rates on our
3
borrowings. Fannie Mae's and Freddie Mac's regulator has set overall volume limits on most of Fannie Mae's and Freddie Mac's lending activities. The regulator in the future could require Fannie Mae and Freddie Mac to focus more of their lending activities on small borrowers or properties the regulator deems affordable, which may or may not include our assets, which could also adversely impact us. In addition, the members of the current Presidential administration have announced restructuring and privatizing Fannie Mae and Freddie Mac is a priority of the current administration, and there is uncertainty regarding the impact of this action on us and buyers of our properties.
Risks Associated with Our Operations
Development, redevelopment and construction risks could impact our profitability.
We intend to continue to develop, redevelop and construct multifamily apartment communities for our portfolio. In 2017, we expect to incur costs between approximately $150 million and $170 million related to the construction of seven consolidated projects. Additionally, during 2017, we expect to incur costs between approximately $20 million and $30 million related to the start of new development activities and between approximately $24 million and $28 million related to redevelopment of existing properties. Our development, redevelopment and construction activities may be exposed to a number of risks which may increase our construction costs and decrease our profitability, including the following:
• | inability to obtain, or delays in obtaining, necessary zoning, land-use, building, occupancy, and other required permits and authorizations; |
• | increased materials and labor costs, problems with contractors or subcontractors, or other costs including those costs due to errors and omissions which occur in the design or construction process; |
• | inability to obtain financing with favorable terms; |
• | inability to complete construction and lease-up of a community on schedule; |
• | forecasted occupancy and rental rates may differ from the actual results; and |
• | the incurrence of costs related to the abandonment of development opportunities which we have pursued and subsequently deemed unfeasible. |
Our inability to successfully implement our development, redevelopment and construction strategy could adversely affect our results of operations and our ability to satisfy our financial obligations and pay distributions to shareholders.
One of our wholly-owned subsidiaries is engaged in the business of providing general contracting services under construction contracts entered into between it and third parties (which may include our nonconsolidated affiliates). The terms of those construction contracts generally require this subsidiary to estimate the time and costs to complete a project, and to assume the risk when these estimates may be greater than anticipated. As a result, profitability on those contracts is dependent on the ability to accurately predict such factors. The time and costs necessary to complete a project may be affected by a variety of factors, including, but not limited to, those listed above, many of which are beyond this subsidiary’s control. In addition, the terms of those contracts generally require this subsidiary to warrant its work for a period of time during which it may be required to repair, replace, or rebuild non-conforming work. Further, trailing liabilities, based on various legal theories such as claims of negligent construction, may result from such projects, and these trailing liabilities may go on for a number of years depending on the length of the statute of repose in the applicable jurisdictions.
Investments through joint ventures and discretionary funds involve risks not present in investments in which we are the sole investor.
We have invested and may continue to invest as a joint venture partner in joint ventures. These investments involve risks, including, but not limited to, the possibility the other joint venture partner may: have business goals which are inconsistent with ours, possess the ability to take or force action or withhold consent contrary to our requests, or become insolvent and require us to assume and fulfill the joint venture’s financial obligations. We and our joint venture partners may each have the right to initiate a buy-sell arrangement, which could cause us to sell our interest, or acquire a joint venture partner’s interest, at a time when we otherwise would not have entered into such a transaction. Each joint venture agreement is individually negotiated, and our ability to operate, finance, or dispose of a community in our sole discretion may be limited to varying degrees depending on the terms of the applicable joint venture agreement. The risks associated with our discretionary Funds, which we manage as the general partner and advisor, include, but are not limited to, the following:
• | one of our wholly-owned subsidiaries is the general partner of the Funds and has unlimited liability for the third-party debts, obligations, and liabilities of the Funds pursuant to partnership law; |
4
• | investors in the Funds (other than us), by majority vote, may remove our subsidiary as the general partner of the Funds with or without cause and the Funds’ advisory boards, by a majority vote of their members, may remove our subsidiary as the general partner of the Funds at any time for cause; |
• | while we have broad discretion to manage the Funds and make investment decisions on behalf of the Funds, the investors or the Funds' advisory boards must approve certain matters, and as a result we may be unable to make certain investments or implement certain decisions on behalf of the Funds which we consider beneficial; |
• | our ability to dispose of all or a portion of our investments in the Funds is subject to significant restrictions; and |
• | we may be liable if the Funds fail to comply with various tax or other regulatory matters. |
Competition could adversely affect our ability to acquire properties.
We expect other real estate investors, including insurance companies, pension and investment funds, private investors, and other multifamily REITs, will compete with us to acquire additional operating properties. This competition could increase prices for the type of properties we would likely pursue and adversely affect our ability to acquire these properties or achieve the expected profitability of such properties upon acquisition.
Our acquisition strategy may not produce the cash flows expected.
We may acquire additional operating properties on a selective basis. Our acquisition activities are subject to a number of risks, including, but not limited to, the following:
• | we may not be able to successfully integrate acquired properties into our existing operations; |
• | our estimates of the costs, if any, of repositioning or redeveloping the acquired property may prove inaccurate; |
• | the expected occupancy, rental rates and operating expenses may differ from the actual results; |
• | we may not be able to obtain adequate financing; and |
• | we may not be able to identify suitable candidates on terms acceptable to us and may not achieve expected returns or other benefits as a result of integration challenges, such as personnel and technology. |
Failure to qualify as a REIT could have adverse consequences.
We may not continue to qualify as a REIT in the future. Also, the Internal Revenue Service may challenge our qualification as a REIT for prior years.
For any taxable year we fail to qualify as a REIT and do not qualify under statutory relief provisions:
• | we would be subject to federal income tax on our taxable income at regular corporate rates, including any applicable alternative minimum tax; |
• | we would be disqualified from treatment as a REIT for the four taxable years following the year in which we failed to qualify, thereby reducing our net income, including any distributions to shareholders, as we would be required to pay significant income taxes for the year or years involved; and, |
• | our ability to expand our business and raise capital would be impaired, which may adversely affect the value of our common shares. |
We may face other tax liabilities in the future which may impact our cash flow. These potential tax liabilities may be calculated on our income or property values at either the corporate or individual property levels. Any additional tax expense incurred would decrease the cash available for cash distributions to our common shareholders and non-controlling interest holders. Additionally, in order for us to continue to qualify as a REIT we must meet a number of organizational and operational requirements, including a requirement to distribute annual dividends to our shareholders equal to a minimum of 90% of our adjusted taxable income.
Tax laws and related interpretations may change at any time, and any such legislative or other actions could have a negative effect on us.
Tax laws are under constant review by persons involved in the legislative process, at the Internal Revenue Service and the U.S. Department of the Treasury, and by various state and local tax authorities. Changes to tax laws, regulations, or administrative interpretations, which may be applied retroactively, could adversely affect us in a number of ways, including the following:
5
• | making it more difficult or more costly for us to qualify as a REIT; |
• | decreasing real estate values generally; and, |
• | lowering effective tax rates for non-REIT "C" corporations, which may cause investors to perceive investments in REITs to be less attractive than investments in the stock of non-REIT "C" corporations. |
We cannot predict whether, when, in what forms, or with what effective dates, the tax laws, regulations, and administrative interpretations applicable to us or our shareholders may be changed. Any such change may significantly affect our liquidity and results of operations, as well as the value of our shares.
Litigation risks could affect our business.
As a publicly-traded owner, developer and manager of multifamily properties, we may incur liability based on various conditions at our properties and the buildings thereon, and we also have become and in the future may become involved in legal proceedings, including consumer, employment, tort or commercial litigation, which if decided adversely to or settled by us, and not adequately covered by insurance, could result in liability which is material to our financial condition or results of operations.
Damage from catastrophic weather and other natural events could result in losses.
Certain of our properties are located in areas that may experience catastrophic weather and other natural events from time to time, including fires, snow or ice storms, windstorms, tornadoes or hurricanes, earthquakes, flooding or other severe weather. These adverse weather or natural events could cause substantial damages or losses to our properties which could exceed our insurance coverage. In the event of a loss in excess of insured limits, we could lose our capital invested in the affected property, as well as anticipated future revenue from that property. We could also continue to be obligated to repay any mortgage indebtedness or other obligations related to the property. Any such loss could materially and adversely affect our business and our financial condition and results of operations.
A cybersecurity incident and other technology disruptions could negatively impact our business.
We use technology in substantially all aspects of our business operations. We also use mobile devices, social networking, outside vendors and other online activities to connect with our employees, suppliers and residents. Such uses give rise to potential cybersecurity risks, including security breach, espionage, system disruption, theft and inadvertent release of information. Our business involves the storage and transmission of numerous classes of sensitive and confidential information and intellectual property, including residents' and suppliers' personal information, private information about employees, and financial and strategic information about us. Further, as we pursue our strategy to grow through acquisitions and developments and to pursue new initiatives to improve our operations, we are also expanding our information technologies, resulting in a larger technological presence and corresponding exposure to cybersecurity risk. If we fail to assess and identify cybersecurity risks associated with our operations, we may become increasingly vulnerable to such risks. Additionally, the measures we have implemented to prevent security breaches and cyber incidents may not be effective. The theft, destruction, loss, misappropriation, or release of sensitive data, confidential information or intellectual property, or interference with our information technology systems or the technology systems of third parties on which we rely, could result in business disruption, negative publicity, brand damage, violation of privacy laws, loss of residents, potential liability and competitive disadvantage, any of which could result in a material adverse effect on our financial condition or results of operations.
Our third-party service providers are primarily responsible for the security of their own information technology environments and in certain instances, we rely significantly on third-party service providers to supply and store our sensitive data in a secure manner. All of these third parties face risks relating to cybersecurity similar to ours which could disrupt their businesses and therefore adversely impact us. While we provide guidance and specific requirements in some cases, we do not directly control any of such parties' information technology security operations, or the amount of investment they place in guarding against cybersecurity threats. Accordingly, we are subject to any flaws in or breaches to their information technology systems or those which they operate for us, which could have a material adverse effect on our financial condition or results of operations.
Risks Associated with Our Indebtedness and Financing
We have significant debt, which could have adverse consequences.
As of December 31, 2016, we had outstanding debt of approximately $2.5 billion. This indebtedness could have adverse consequences, including, but not limited to:
6
• | if a property is mortgaged to secure payment of indebtedness, and if we are unable to meet our mortgage obligations, we could sustain a loss as a result of foreclosure on the mortgaged property; |
• | our vulnerability to general adverse economic and industry conditions is increased; and |
• | our flexibility in planning for, or reacting to, changes in business and industry conditions is limited. |
The mortgages on our properties subject to secured debt, our unsecured credit facilities, and the indenture under which our unsecured debt was issued, contain customary restrictions, requirements, and other limitations, as well as certain financial and operating covenants including maintenance of certain financial ratios. Maintaining compliance with these provisions could limit our financial flexibility. A default in these provisions, if uncured, could require us to repay the indebtedness before the scheduled maturity date, which could adversely affect our liquidity and increase our financing costs.
Insufficient cash flows could limit our ability to make required payments for debt obligations or pay distributions to shareholders.
Substantially all of our income is derived from rental and other income from our multifamily communities. As a result, our performance depends in large part on our ability to collect rent from residents, which could be negatively affected by a number of factors, including, but not limited to, the following:
• | delay in resident lease commencements; |
• | decline in occupancy; |
• | failure of residents to make rental payments when due; |
• | the attractiveness of our properties to residents and potential residents; |
• | our ability to adequately manage and maintain our communities; |
• | competition from other available apartments and housing alternatives; |
• | changes in market rents; and |
• | increases in operating expenses. |
Cash flow could be insufficient to meet required payments of principal and interest with respect to debt financing. In order for us to continue to qualify as a REIT we must meet a number of organizational and operational requirements, including a requirement to distribute annual dividends to our shareholders equal to a minimum of 90% of our adjusted taxable income. This requirement limits the cash available to meet required principal payments on our debt.
Issuances of additional debt may adversely impact our financial condition.
Our capital requirements depend on numerous factors, including the rental and occupancy rates of our multifamily properties, minimum dividend requirements to our equity holders, development, redevelopment and other capital expenditures, costs of operations, and potential acquisitions. If our capital requirements vary materially from our plans, we may require additional financing earlier than anticipated. If we issue more debt, we could become more leveraged, resulting in increased risk of default on our obligations and an increase in our debt service requirements, both of which could adversely affect our financial condition and ability to access debt and equity capital markets in the future.
We may be unable to renew, repay, or refinance our outstanding debt.
We are subject to the risk that indebtedness on our properties or our unsecured indebtedness will not be renewed, repaid, or refinanced when due or the terms of any renewal or refinancing will not be as favorable as the existing terms of such indebtedness. If we are unable to refinance our indebtedness on acceptable terms, or at all, we might be forced to dispose of one or more of the properties on disadvantageous terms, which might result in losses to us. Such losses could have a material adverse effect on us and our ability to make distributions to our shareholders and pay amounts due on our debt. Furthermore, if a property is mortgaged to secure payment of indebtedness and we are unable to meet mortgage payments, the mortgagee could foreclose on the property, appoint a receiver and exercise rights under an assignment of rents and leases, or pursue other remedies, all with a consequent loss of our revenues and asset value. Foreclosures could also create taxable income without accompanying cash proceeds, thereby hindering our ability to meet the REIT distribution requirements of the Code.
7
Rising interest rates could both increase our borrowing costs, thereby adversely affecting our cash flows and the amounts available for distribution to our shareholders, and decrease our share price, if investors seek higher yields through other investments.
We have mortgage debt with varying interest rates dependent upon various market indexes. In addition, we have an unsecured credit facility bearing interest at variable rates on all amounts drawn. We may incur additional variable rate debt in the future. Increases in interest rates would increase our interest expense, unless we make arrangements which hedge the risk of rising interest rates, and would increase the costs of refinancing existing debt and of issuing new debt. Accordingly, higher interest rates would adversely affect cash flow, net income, and cash available for payment of our debt obligations and distributions to shareholders.
An environment of rising interest rates could also lead holders of our securities to seek higher yields through other investments, which could adversely affect the market price of our shares. One of the factors which may influence the price of our stock in public markets is the annual distribution rate we pay as compared with the yields on alternative investments.
Failure to maintain our current credit ratings could adversely affect our cost of funds, related margins, liquidity, and access to capital markets.
Moody’s, Fitch, and Standard & Poor's, the major debt rating agencies, routinely evaluate our debt and have given us ratings of A3 with stable outlook, A- with stable outlook, and BBB+ with stable outlook, respectively, on our senior unsecured debt. These ratings are based on a number of factors, which include their assessment of our financial strength, liquidity, capital structure, asset quality, and sustainability of cash flow and earnings. Due to changes in market conditions, we may not be able to maintain our current credit ratings, which could adversely affect our cost of funds and related margins, liquidity, and access to capital markets.
Risks Associated with Our Shares
Share ownership limits and our ability to issue additional equity securities may prevent takeovers beneficial to shareholders.
For us to maintain our qualification as a REIT, we must have 100 or more shareholders during the year and not more than 50% in value of our outstanding shares may be owned, directly or indirectly, by five or fewer individuals. As defined for federal income tax purposes, the term “individuals” includes a number of specified entities. To minimize the possibility of us failing to qualify as a REIT under this test, our declaration of trust includes restrictions on transfers of our shares and ownership limits. The ownership limits, as well as our ability to issue other classes of equity securities, may delay, defer, or prevent a change in control. These provisions may also deter tender offers for our common shares which may be attractive to you or limit your opportunity to receive a premium for your shares which might otherwise exist if a third party were attempting to effect a change in control transaction.
Our share price will fluctuate.
The market price and trading volume of our common shares are subject to fluctuation due to general market conditions, the risks discussed in this report and other matters, including, but not limited to, the following:
• | operating results which vary from the expectations of securities analysts and investors; |
• | investor interest in our property portfolio; |
• | the reputation and performance of REITs; |
• | the attractiveness of REITs as compared to other investment vehicles; |
• | the results of our financial condition and operations; |
• | the perception of our growth and earnings potential; |
• | minimum dividend requirements; |
• | increases in market interest rates, which may lead purchasers of our common shares to demand a higher yield; and |
• | changes in financial markets and national and regional economic and general market conditions. |
The form, timing and amount of dividend distributions in future periods may vary and be impacted by economic and other considerations.
The form, timing and amount of dividend distributions will be declared at the discretion of our Board of Trust Managers and will depend on actual cash from operations, our financial condition, capital requirements, the annual distribution
8
requirements under the REIT provisions of the Code and other factors as the Board of Trust Managers may consider relevant. The Board of Trust Managers may modify the form, timing and amount of dividends from time to time.
Item 1B. Unresolved Staff Comments
None.
Item 2. Properties
The Properties
Our properties typically consist of mid-rise buildings or two and three story buildings in a landscaped setting and provide residents with a variety of amenities common to multifamily rental properties.
Operating Properties (including properties held through unconsolidated joint ventures)
The 152 operating properties in which we owned interests and operated at December 31, 2016 averaged 953 square feet of living area per apartment home. For the year ended December 31, 2016, no single operating property accounted for greater than 1.7% of our total revenues. Our operating properties had a weighted average occupancy rate of approximately 95% and 96% for each of the years ended December 31, 2016 and 2015, respectively, and an average monthly rental revenue per apartment home of $1,405 and $1,342 for the same periods, respectively. Resident lease terms generally range from six to eighteen months. At December 31, 2016, 137 of our operating properties had over 200 apartment homes, with the largest having 1,005 apartment homes. Our operating properties have an average age of 12 years. Our operating properties were constructed and placed in service as follows:
Year Placed in Service | Number of Operating Properties |
2012-2016 | 24 |
2007-2011 | 30 |
2002-2006 | 32 |
1997-2001 | 42 |
1992-1996 | 16 |
Prior to 1991 | 8 |
9
Property Table
The following table sets forth information with respect to our 152 operating properties at December 31, 2016:
OPERATING PROPERTIES | ||||||||||||||
Property and Location | Year Placed in Service | Average Apartment Size (Sq. Ft.) | Number of Apartments | 2016 Average Occupancy (1) | 2016 Average Monthly Rental Rate per Apartment (2) | |||||||||
ARIZONA | ||||||||||||||
Phoenix/Scottsdale | ||||||||||||||
Camden Chandler (3) | 2015 | 1,146 | 380 | 94.1 | % | $ | 1,310 | |||||||
Camden Copper Square | 2000 | 786 | 332 | 95.7 | 1,084 | |||||||||
Camden Foothills | 2014 | 1,032 | 220 | 92.7 | 1,490 | |||||||||
Camden Hayden | 2015 | 1,043 | 234 | 90.6 | 1,384 | |||||||||
Camden Legacy | 1996 | 1,067 | 428 | 95.4 | 1,144 | |||||||||
Camden Montierra | 1999 | 1,071 | 249 | 95.7 | 1,266 | |||||||||
Camden Pecos Ranch | 2001 | 924 | 272 | 95.1 | 1,002 | |||||||||
Camden San Marcos | 1995 | 984 | 320 | 95.2 | 1,144 | |||||||||
Camden San Paloma | 1993/1994 | 1,042 | 324 | 95.5 | 1,153 | |||||||||
Camden Sotelo | 2008/2012 | 1,303 | 170 | 93.2 | 1,461 | |||||||||
CALIFORNIA | ||||||||||||||
Los Angeles/Orange County | ||||||||||||||
Camden Crown Valley | 2001 | 1,009 | 380 | 95.7 | 1,916 | |||||||||
Camden Glendale (3) | 2015 | 882 | 303 | 95.0 | 2,241 | |||||||||
Camden Harbor View | 2004 | 981 | 546 | 95.6 | 2,412 | |||||||||
Camden Main and Jamboree | 2008 | 1,011 | 290 | 96.2 | 2,026 | |||||||||
Camden Martinique | 1986 | 795 | 714 | 94.8 | 1,646 | |||||||||
Camden Sea Palms | 1990 | 891 | 138 | 96.0 | 1,844 | |||||||||
The Camden (4) | 2016 | 768 | 287 | Lease-up | 3,064 | |||||||||
San Diego/Inland Empire | ||||||||||||||
Camden Landmark | 2006 | 982 | 469 | 94.6 | 1,486 | |||||||||
Camden Old Creek | 2007 | 1,037 | 350 | 95.5 | 1,916 | |||||||||
Camden Sierra at Otay Ranch | 2003 | 962 | 422 | 95.2 | 1,795 | |||||||||
Camden Tuscany | 2003 | 896 | 160 | 95.9 | 2,485 | |||||||||
Camden Vineyards | 2002 | 1,053 | 264 | 96.0 | 1,501 | |||||||||
COLORADO | ||||||||||||||
Denver | ||||||||||||||
Camden Belleview Station | 2009 | 888 | 270 | 94.2 | 1,374 | |||||||||
Camden Caley | 2000 | 925 | 218 | 96.0 | 1,328 | |||||||||
Camden Denver West | 1997 | 1,015 | 320 | 95.3 | 1,566 | |||||||||
Camden Flatirons (3) | 2015 | 960 | 424 | 95.0 | 1,460 | |||||||||
Camden Highlands Ridge | 1996 | 1,149 | 342 | 95.3 | 1,583 | |||||||||
Camden Interlocken | 1999 | 1,010 | 340 | 95.8 | 1,470 | |||||||||
Camden Lakeway | 1997 | 932 | 451 | 95.5 | 1,399 | |||||||||
WASHINGTON DC METRO | ||||||||||||||
Camden Ashburn Farm | 2000 | 1,062 | 162 | 96.0 | 1,542 | |||||||||
Camden College Park | 2008 | 942 | 508 | 93.0 | 1,524 | |||||||||
Camden Dulles Station | 2009 | 978 | 382 | 96.3 | 1,628 | |||||||||
Camden Fair Lakes | 1999 | 1,056 | 530 | 95.8 | 1,715 | |||||||||
10
OPERATING PROPERTIES | ||||||||||||||
Property and Location | Year Placed in Service | Average Apartment Size (Sq. Ft.) | Number of Apartments | 2016 Average Occupancy (1) | 2016 Average Monthly Rental Rate per Apartment (2) | |||||||||
Camden Fairfax Corner | 2006 | 934 | 489 | 95.6 | % | $ | 1,773 | |||||||
Camden Fallsgrove | 2004 | 996 | 268 | 95.5 | 1,735 | |||||||||
Camden Grand Parc | 2002 | 674 | 105 | 97.0 | 2,417 | |||||||||
Camden Lansdowne | 2002 | 1,006 | 690 | 95.8 | 1,483 | |||||||||
Camden Largo Town Center | 2000/2007 | 1,027 | 245 | 94.0 | 1,616 | |||||||||
Camden Monument Place | 2007 | 856 | 368 | 95.4 | 1,524 | |||||||||
Camden NoMa | 2014 | 770 | 321 | 95.0 | 2,185 | |||||||||
Camden Potomac Yard | 2008 | 835 | 378 | 95.5 | 1,972 | |||||||||
Camden Roosevelt | 2003 | 856 | 198 | 95.6 | 2,630 | |||||||||
Camden Russett | 2000 | 992 | 426 | 94.9 | 1,451 | |||||||||
Camden Silo Creek | 2004 | 975 | 284 | 96.1 | 1,475 | |||||||||
Camden South Capitol (5) | 2013 | 821 | 281 | 94.3 | 2,130 | |||||||||
FLORIDA | ||||||||||||||
Southeast Florida | ||||||||||||||
Camden Aventura | 1995 | 1,108 | 379 | 95.8 | 1,959 | |||||||||
Camden Boca Raton | 2014 | 843 | 261 | 95.3 | 1,945 | |||||||||
Camden Brickell | 2003 | 937 | 405 | 96.5 | 2,059 | |||||||||
Camden Doral | 1999 | 1,120 | 260 | 96.9 | 1,868 | |||||||||
Camden Doral Villas | 2000 | 1,253 | 232 | 96.4 | 1,992 | |||||||||
Camden Las Olas | 2004 | 1,043 | 420 | 96.3 | 2,031 | |||||||||
Camden Plantation | 1997 | 1,201 | 502 | 96.8 | 1,591 | |||||||||
Camden Portofino | 1995 | 1,112 | 322 | 96.4 | 1,598 | |||||||||
Orlando | ||||||||||||||
Camden Hunter’s Creek | 2000 | 1,075 | 270 | 97.0 | 1,278 | |||||||||
Camden Lago Vista | 2005 | 955 | 366 | 96.4 | 1,130 | |||||||||
Camden LaVina | 2012 | 970 | 420 | 95.3 | 1,179 | |||||||||
Camden Lee Vista | 2000 | 937 | 492 | 96.9 | 1,082 | |||||||||
Camden Orange Court | 2008 | 817 | 268 | 95.1 | 1,288 | |||||||||
Camden Town Square | 2012 | 986 | 438 | 96.2 | 1,241 | |||||||||
Camden Waterford Lakes (5) | 2013 | 971 | 300 | 94.9 | 1,311 | |||||||||
Camden World Gateway | 2000 | 979 | 408 | 96.3 | 1,177 | |||||||||
Tampa/St. Petersburg | ||||||||||||||
Camden Bay | 1997/2001 | 943 | 760 | 95.6 | 1,072 | |||||||||
Camden Montague | 2012 | 975 | 192 | 95.4 | 1,216 | |||||||||
Camden Preserve | 1996 | 942 | 276 | 95.6 | 1,298 | |||||||||
Camden Royal Palms | 2006 | 1,017 | 352 | 96.2 | 1,110 | |||||||||
Camden Visconti (5) | 2007 | 1,125 | 450 | 95.6 | 1,255 | |||||||||
Camden Westchase Park | 2012 | 992 | 348 | 95.4 | 1,347 | |||||||||
GEORGIA | ||||||||||||||
Atlanta | ||||||||||||||
Camden Brookwood | 2002 | 912 | 359 | 96.2 | 1,288 | |||||||||
Camden Creekstone | 2002 | 990 | 223 | 95.6 | 1,200 | |||||||||
Camden Deerfield | 2000 | 1,187 | 292 | 95.1 | 1,324 | |||||||||
11
OPERATING PROPERTIES | ||||||||||||||
Property and Location | Year Placed in Service | Average Apartment Size (Sq. Ft.) | Number of Apartments | 2016 Average Occupancy (1) | 2016 Average Monthly Rental Rate per Apartment (2) | |||||||||
Camden Dunwoody | 1997 | 1,007 | 324 | 97.0 | % | $ | 1,219 | |||||||
Camden Fourth Ward | 2014 | 847 | 276 | 96.2 | 1,590 | |||||||||
Camden Midtown Atlanta | 2001 | 935 | 296 | 94.3 | 1,349 | |||||||||
Camden Paces (3) | 2015 | 1,407 | 379 | 94.2 | 2,498 | |||||||||
Camden Peachtree City | 2001 | 1,027 | 399 | 95.5 | 1,198 | |||||||||
Camden Phipps (5) | 1996 | 1,018 | 234 | 94.6 | 1,467 | |||||||||
Camden Shiloh | 1999/2002 | 1,143 | 232 | 96.4 | 1,176 | |||||||||
Camden St. Clair | 1997 | 999 | 336 | 95.5 | 1,234 | |||||||||
Camden Stockbridge | 2003 | 1,009 | 304 | 94.9 | 926 | |||||||||
Camden Vantage | 2010 | 901 | 592 | 95.8 | 1,286 | |||||||||
NORTH CAROLINA | ||||||||||||||
Charlotte | ||||||||||||||
Camden Ballantyne | 1998 | 1,048 | 400 | 95.5 | 1,215 | |||||||||
Camden Cotton Mills | 2002 | 905 | 180 | 96.0 | 1,448 | |||||||||
Camden Dilworth | 2006 | 857 | 145 | 96.2 | 1,431 | |||||||||
Camden Fairview | 1983 | 1,036 | 135 | 96.6 | 1,135 | |||||||||
Camden Foxcroft | 1979 | 940 | 156 | 96.3 | 994 | |||||||||
Camden Foxcroft II (6) | 1985 | 874 | 100 | 96.5 | 1,605 | |||||||||
Camden Grandview | 2000 | 1,059 | 266 | 95.2 | 1,065 | |||||||||
Camden Sedgebrook | 1999 | 972 | 368 | 96.4 | 1,100 | |||||||||
Camden South End | 2003 | 882 | 299 | 96.4 | 1,345 | |||||||||
Camden Southline (3) (5) | 2015 | 831 | 266 | 95.7 | 1,414 | |||||||||
Camden Stonecrest | 2001 | 1,098 | 306 | 95.9 | 1,263 | |||||||||
Camden Touchstone | 1986 | 899 | 132 | 96.6 | 978 | |||||||||
Raleigh | ||||||||||||||
Camden Asbury Village (5) | 2009 | 1,009 | 350 | 95.4 | 1,118 | |||||||||
Camden Crest | 2001 | 1,013 | 438 | 93.8 | 975 | |||||||||
Camden Governor’s Village | 1999 | 1,046 | 242 | 96.1 | 1,001 | |||||||||
Camden Lake Pine | 1999 | 1,066 | 446 | 95.3 | 1,041 | |||||||||
Camden Manor Park | 2006 | 966 | 484 | 96.0 | 1,014 | |||||||||
Camden Overlook | 2001 | 1,060 | 320 | 95.8 | 1,156 | |||||||||
Camden Reunion Park | 2000/2004 | 972 | 420 | 94.1 | 918 | |||||||||
Camden Westwood | 1999 | 1,027 | 354 | 94.4 | 985 | |||||||||
TEXAS | ||||||||||||||
Austin | ||||||||||||||
Camden Amber Oaks (5) | 2009 | 862 | 348 | 95.3 | 1,043 | |||||||||
Camden Amber Oaks II (5) | 2012 | 910 | 244 | 95.6 | 1,112 | |||||||||
Camden Brushy Creek (5) | 2008 | 882 | 272 | 95.8 | 1,091 | |||||||||
Camden Cedar Hills | 2008 | 911 | 208 | 95.8 | 1,220 | |||||||||
Camden Gaines Ranch | 1997 | 955 | 390 | 96.3 | 1,348 | |||||||||
Camden Huntingdon | 1995 | 903 | 398 | 95.5 | 1,071 | |||||||||
Camden La Frontera | 2015 | 901 | 300 | 94.9 | 1,186 | |||||||||
Camden Lamar Heights | 2015 | 838 | 314 | 94.6 | 1,436 | |||||||||
12
OPERATING PROPERTIES | ||||||||||||||
Property and Location | Year Placed in Service | Average Apartment Size (Sq. Ft.) | Number of Apartments | 2016 Average Occupancy (1) | 2016 Average Monthly Rental Rate per Apartment (2) | |||||||||
Camden Shadow Brook (5) | 2009 | 909 | 496 | 95.6 | % | $ | 1,117 | |||||||
Camden Stoneleigh | 2001 | 908 | 390 | 95.8 | 1,208 | |||||||||
Corpus Christi | ||||||||||||||
Camden Breakers | 1996 | 868 | 288 | 93.5 | 1,155 | |||||||||
Camden Copper Ridge | 1986 | 775 | 344 | 92.0 | 875 | |||||||||
Camden Miramar (7) | 1994-2014 | 494 | 1,005 | 73.7 | 1,112 | |||||||||
Camden South Bay (5) | 2007 | 1,055 | 270 | 93.8 | 1,260 | |||||||||
Dallas/Fort Worth | ||||||||||||||
Camden Addison | 1996 | 942 | 456 | 96.8 | 1,125 | |||||||||
Camden Belmont | 2010/2012 | 945 | 477 | 95.8 | 1,431 | |||||||||
Camden Buckingham | 1997 | 919 | 464 | 95.9 | 1,151 | |||||||||
Camden Centreport | 1997 | 911 | 268 | 96.6 | 1,058 | |||||||||
Camden Cimarron | 1992 | 772 | 286 | 96.7 | 1,113 | |||||||||
Camden Design District (5) | 2009 | 939 | 355 | 96.4 | 1,351 | |||||||||
Camden Farmers Market | 2001/2005 | 932 | 904 | 95.5 | 1,260 | |||||||||
Camden Henderson | 2012 | 967 | 106 | 95.9 | 1,540 | |||||||||
Camden Legacy Creek | 1995 | 831 | 240 | 96.7 | 1,176 | |||||||||
Camden Legacy Park | 1996 | 871 | 276 | 97.3 | 1,177 | |||||||||
Camden Panther Creek (5) | 2009 | 946 | 295 | 95.6 | 1,160 | |||||||||
Camden Riverwalk (5) | 2008 | 982 | 600 | 94.7 | 1,352 | |||||||||
Camden Valley Park | 1986 | 743 | 516 | 96.5 | 1,029 | |||||||||
Camden Victory Park (4) | 2016 | 861 | 423 | Lease-Up | 1,696 | |||||||||
Houston | ||||||||||||||
Camden City Centre | 2007 | 932 | 379 | 93.1 | 1,592 | |||||||||
Camden City Centre II | 2013 | 868 | 268 | 94.7 | 1,652 | |||||||||
Camden Cypress Creek (5) | 2009 | 993 | 310 | 93.9 | 1,237 | |||||||||
Camden Downs at Cinco Ranch (5) | 2004 | 1,075 | 318 | 93.7 | 1,242 | |||||||||
Camden Grand Harbor (5) | 2008 | 959 | 300 | 94.0 | 1,167 | |||||||||
Camden Greenway | 1999 | 861 | 756 | 95.0 | 1,408 | |||||||||
Camden Heights (5) | 2004 | 927 | 352 | 93.8 | 1,515 | |||||||||
Camden Holly Springs | 1999 | 934 | 548 | 92.9 | 1,249 | |||||||||
Camden Midtown | 1999 | 844 | 337 | 91.9 | 1,652 | |||||||||
Camden Northpointe (5) | 2008 | 940 | 384 | 94.6 | 1,104 | |||||||||
Camden Oak Crest | 2003 | 870 | 364 | 93.7 | 1,133 | |||||||||
Camden Park | 1995 | 866 | 288 | 93.7 | 1,105 | |||||||||
Camden Plaza | 2007 | 915 | 271 | 95.1 | 1,573 | |||||||||
Camden Post Oak | 2003 | 1,200 | 356 | 91.6 | 2,537 | |||||||||
Camden Royal Oaks | 2006 | 923 | 236 | 93.0 | 1,303 | |||||||||
Camden Royal Oaks II | 2012 | 1,054 | 104 | 90.3 | 1,512 | |||||||||
Camden Spring Creek (5) | 2004 | 1,080 | 304 | 93.6 | 1,227 | |||||||||
Camden Stonebridge | 1993 | 845 | 204 | 93.8 | 1,120 | |||||||||
Camden Sugar Grove | 1997 | 921 | 380 | 93.8 | 1,156 | |||||||||
Camden Travis Street | 2010 | 819 | 253 | 93.8 | 1,552 | |||||||||
13
OPERATING PROPERTIES | ||||||||||||||
Property and Location | Year Placed in Service | Average Apartment Size (Sq. Ft.) | Number of Apartments | 2016 Average Occupancy (1) | 2016 Average Monthly Rental Rate per Apartment (2) | |||||||||
Camden Vanderbilt | 1996/1997 | 863 | 894 | 94.6 | % | $ | 1,460 | |||||||
Camden Whispering Oaks | 2008 | 934 | 274 | 93.5 | 1,238 | |||||||||
Camden Woodson Park (5) | 2008 | 916 | 248 | 94.4 | 1,173 | |||||||||
Camden Yorktown (5) | 2008 | 995 | 306 | 93.9 | 1,161 | |||||||||
(1) | Represents average physical occupancy for the year except as noted. |
(2) | The average monthly rental rate per apartment incorporates vacant units and resident concessions calculated on a straight-line basis over the life of the lease. |
(3) | Development property stabilized during 2016—average occupancy calculated from date at which occupancy exceeded 90% through December 31, 2016. |
(4) | Property under lease-up at December 31, 2016. |
(5) | Property owned through an unconsolidated joint venture in which we currently own a 31.3% interest. The remaining interest is owned by an unaffiliated third party. |
(6) | Formerly known as Camden Simsbury. |
(7) | Miramar is a student housing project for Texas A&M University - Corpus Christi. Average occupancy includes summer months which are normally subject to high vacancies. |
Item 3. Legal Proceedings
None.
Item 4. Mine Safety Disclosures
None.
14
PART II
Item 5. Market for Registrant’s Common Equity, Related Shareholder Matters and Issuer Purchases of Equity Securities
The high and low closing prices per share of our common shares, as reported on the New York Stock Exchange composite tape under the symbol “CPT,” and distributions per share declared for the quarters indicated are as follows:
High | Low | Distributions | |||||||||
2016 Quarters: | |||||||||||
First | $ | 84.09 | $ | 70.55 | $ | 0.75 | |||||
Second | 88.42 | 80.08 | 0.75 | ||||||||
Third | 90.67 | 83.69 | 5.00 | ||||||||
Fourth | 84.07 | 76.00 | 0.75 | ||||||||
2015 Quarters: | |||||||||||
First | $ | 80.92 | $ | 72.37 | $ | 0.70 | |||||
Second | 79.11 | 73.03 | 0.70 | ||||||||
Third | 81.28 | 69.45 | 0.70 | ||||||||
Fourth | 79.04 | 73.56 | 0.70 | ||||||||
In September 2016, our Board of Trust Managers declared a special dividend of $4.25 per common share to our common shareholders of record as of September 23, 2016, consisting of gains on dispositions of assets completed in 2016. The special dividend was in addition to our quarterly dividend of $0.75 per common share. We also paid equivalent amounts per unit to holders of the common operating partnership units.
In the first quarter of 2017, the Company's Board of Trust Managers maintained the $0.75 quarterly dividend rate per common share. Future dividend payments are paid at the discretion of the Board of Trust Managers and depend on cash flows generated from operations, the Company's financial condition and capital requirements, distribution requirements under the REIT provisions of the Internal Revenue Code of 1986, as amended, and other factors which may be deemed relevant by our Board of Trust Managers. Assuming similar dividend distributions for the remainder of 2017, our annualized dividend rate for 2017 would be $3.00.
15
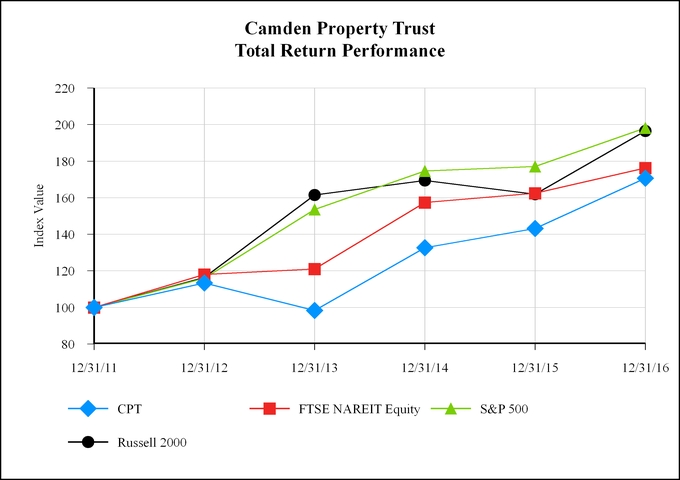
This graph assumes the investment of $100 on December 31, 2011 and quarterly reinvestment of dividends, including the special dividend paid in September 2016. (Source: SNL Financial LC)
Index | 2012 | 2013 | 2014 | 2015 | 2016 | ||||||||||||||
Camden Property Trust | $ | 113.41 | $ | 98.35 | $ | 132.62 | $ | 143.12 | $ | 170.65 | |||||||||
FTSE NAREIT Equity | 118.06 | 120.97 | 157.43 | 162.46 | 176.30 | ||||||||||||||
S&P 500 | 116.00 | 153.57 | 174.60 | 177.01 | 198.18 | ||||||||||||||
Russell 2000 | 116.35 | 161.52 | 169.43 | 161.95 | 196.45 | ||||||||||||||
As of February 7, 2017, there were approximately 413 shareholders of record and approximately 37,781 beneficial owners of our common shares.
In November 2014, we created an at-the-market share offering program (the "ATM program") through which we can, but have no obligation to, sell common shares having an aggregate offering price of up to $331.3 million, in amounts and at times as we determine, into the existing trading market at current market prices as well as through negotiated transactions. Actual sales from time to time may depend on a variety of factors including, among others, market conditions, the trading price of our common shares, and determinations by management of the appropriate sources of funding for us. We intend to use the net proceeds from any future sales under the ATM program for general corporate purposes, which may include reducing future borrowings under our unsecured credit facility, the repayment of other indebtedness, the redemption or other repurchase of outstanding debt or equity securities, funding for development, redevelopment and investment projects and financing for acquisitions. As of the date of this filing, we had common shares having an aggregate offering price of up to $315.3 million remaining available for sale under the ATM program. No shares were sold subsequent to December 31, 2016 through the date of this filing under the ATM program.
16
See Part III, Item 12, for a description of securities authorized for issuance under equity compensation plans.
In January 2008, our Board of Trust Managers approved a plan to allow for the repurchase of up to $500 million of our common equity securities through open market purchases, block purchases, and privately negotiated transactions. Under this program, we repurchased 4.3 million shares for a total of approximately $230.2 million from April 2007 through December 31, 2008 and there have not been any shares repurchased subsequent to that date. As of the date of this filing, the remaining dollar value of our common equity securities authorized to be repurchased under the program was approximately $269.8 million.
17
Item 6. Selected Financial Data
The following table provides selected financial data relating to our historical financial condition and results of operations as of and for each of the years ended December 31, 2012 through 2016. This data should be read in conjunction with Item 7, “Management’s Discussion and Analysis of Financial Condition and Results of Operations” and the consolidated financial statements and related notes. Prior year amounts have been reclassified for discontinued operations.
COMPARATIVE SUMMARY OF SELECTED FINANCIAL AND PROPERTY DATA
Year Ended December 31, | |||||||||||||||||||
(in thousands, except per share amounts and property data) | 2016 | 2015 | 2014 | 2013 | 2012 | ||||||||||||||
Operating Data (a) | |||||||||||||||||||
Total property revenues | $ | 876,447 | $ | 835,618 | $ | 790,263 | $ | 737,033 | $ | 648,041 | |||||||||
Total property expenses | 311,355 | 301,000 | 285,700 | 266,572 | 237,715 | ||||||||||||||
Total non-property income | 14,577 | 7,332 | 14,611 | 21,197 | 16,407 | ||||||||||||||
Total other expenses | 425,190 | 412,022 | 399,314 | 377,026 | 355,672 | ||||||||||||||
Income from continuing operations attributable to common shareholders | 436,981 | 229,565 | 273,892 | 134,347 | 140,136 | ||||||||||||||
Net income attributable to common shareholders | 819,823 | 249,315 | 292,089 | 336,364 | 283,390 | ||||||||||||||
Earnings per common share from continuing operations: | |||||||||||||||||||
Basic | $ | 4.81 | $ | 2.55 | $ | 3.08 | $ | 1.50 | $ | 1.64 | |||||||||
Diluted | 4.79 | 2.54 | 3.06 | 1.50 | 1.63 | ||||||||||||||
Total earnings per common share: | |||||||||||||||||||
Basic | $ | 9.08 | $ | 2.77 | $ | 3.29 | $ | 3.82 | $ | 3.35 | |||||||||
Diluted | 9.05 | 2.76 | 3.27 | 3.78 | 3.32 | ||||||||||||||
Distributions declared per common share | $ | 3.00 | $ | 2.80 | $ | 2.64 | $ | 2.52 | $ | 2.24 | |||||||||
Special dividend per common share (b) | $ | 4.25 | $ | — | $ | — | $ | — | $ | — | |||||||||
Balance Sheet Data (at end of year) | |||||||||||||||||||
Total real estate assets, at cost (c) | $ | 7,376,690 | $ | 7,387,597 | $ | 7,025,376 | $ | 6,655,139 | $ | 6,262,645 | |||||||||
Total assets | 6,028,152 | 6,037,612 | 6,043,981 | 5,619,354 | 5,372,666 | ||||||||||||||
Notes payable | 2,480,588 | 2,724,687 | 2,730,613 | 2,517,979 | 2,497,962 | ||||||||||||||
Non-qualified deferred compensation share awards | 77,037 | 79,364 | 68,134 | 47,180 | — | ||||||||||||||
Equity | 3,095,553 | 2,892,896 | 2,888,409 | 2,760,181 | 2,626,708 | ||||||||||||||
Other Data | |||||||||||||||||||
Cash flows provided by (used in): | |||||||||||||||||||
Operating activities | $ | 443,063 | $ | 423,238 | $ | 418,528 | $ | 404,291 | $ | 324,267 | |||||||||
Investing activities (d) | 690,412 | (293,235 | ) | (326,587 | ) | (258,377 | ) | (526,770 | ) | ||||||||||
Financing activities | (904,237 | ) | (273,231 | ) | 43,482 | (154,181 | ) | 174,928 | |||||||||||
Funds from operations – diluted (e) | 425,464 | 414,497 | 378,043 | 368,321 | 313,337 | ||||||||||||||
Adjusted funds from operations – diluted (e) | 366,380 | 350,328 | 318,189 | 301,291 | 250,292 | ||||||||||||||
Property Data | |||||||||||||||||||
Number of operating properties (at the end of year) (f) | 152 | 172 | 168 | 170 | 193 | ||||||||||||||
Number of operating apartment homes (at end of year) (f) | 52,793 | 59,792 | 58,948 | 59,899 | 65,775 | ||||||||||||||
Number of operating apartment homes (weighted average) (f) (g) | 46,934 | 47,088 | 47,915 | 46,841 | 43,337 | ||||||||||||||
Weighted average monthly total property revenue per apartment home (a) | $ | 1,556 | $ | 1,479 | $ | 1,374 | $ | 1,311 | $ | 1,246 | |||||||||
Properties under development (at end of period) | 7 | 8 | 13 | 14 | 9 | ||||||||||||||
(a) | Excludes discontinued operations. See Note 2, "Summary of Significant Accounting Policies and Recent Accounting Pronouncements," and Note 7, "Acquisitions, Dispositions, Impairment, and Discontinued Operations," in the notes to Consolidated Financial Statements for further discussion of discontinued operations. |
(b) | A special dividend was paid on September 30, 2016. Refer to Note 4 "Common Shares" in the Notes to the Consolidated Financial Statements for further discussion of the special dividend. |
18
(c) | Includes operating properties held for sale at net book value and excludes discontinued operating properties and joint ventures for all periods presented. |
(d) | All periods presented have been changed to reflect our adoption of Accounting Standards Update 2016-18 ("ASU 2016-18"),"Statement of Cash Flows: Restricted Cash (A Consensus of the Emerging Issues Task Force)", which required retrospective application. See Note 2, "Summary of Significant Accounting Policies and Recent Accounting Pronouncements" for further discussion. |
(e) | Management considers Funds from Operations (“FFO”) and adjusted FFO ("AFFO") to be appropriate measures of the financial performance of an equity REIT. The National Association of Real Estate Investment Trusts (“NAREIT”) currently defines FFO as net income (computed in accordance with accounting principles generally accepted in the United States of America (“GAAP”)), excluding gains (or losses) associated with previously depreciated operating properties, real estate depreciation and amortization, impairments of depreciable assets, and adjustments for unconsolidated joint ventures. Our calculation of diluted FFO also assumes conversion of all potentially dilutive securities, including certain non-controlling interests, which are convertible into common shares. We consider FFO to be an appropriate supplemental measure of operating performance because, by excluding gains or losses on dispositions of operating properties, and depreciation, FFO can assist in the comparison of the operating performance of a company’s real estate investments between periods or to different companies. AFFO is calculated utilizing FFO less recurring capitalized expenditures which are necessary to help preserve the value of and maintain the functionality at our communities. We also consider AFFO to be a useful supplemental measure because it is frequently used by analysts and investors to evaluate a REIT's operating performance between periods or different companies. Our definition of recurring capital expenditures may differ from other REITs, and there can be no assurance our basis for computing this measure is comparable to other REITs. To facilitate a clear understanding of our consolidated historical operating results, we believe FFO and AFFO should be examined in conjunction with net income attributable to common shareholders as presented in the consolidated statements of income and comprehensive income and data included elsewhere in this report. FFO and AFFO are not defined by GAAP and should not be considered alternatives to net income attributable to common shareholders as an indication of our operating performance. Additionally, FFO and AFFO as disclosed by other REITs may not be comparable to our calculation. See "Funds from Operations and Adjusted FFO" in Item 7 "Management's Discussion and Analysis of Financial Condition and Results of Operations" for reconciliations of net income attributable to common shareholders to FFO and AFFO. |
(f) | Includes operating properties held for sale and discontinued operating properties held for sale for all periods presented. |
(g) | Excludes apartment homes owned in joint ventures. |
19
Item 7. Management’s Discussion and Analysis of Financial Condition and Results of Operations
The following discussion should be read in conjunction with the consolidated financial statements and notes appearing elsewhere in this report. Historical results and trends which might appear in the consolidated financial statements should not be interpreted as being indicative of future operations.
We consider portions of this report to be “forward-looking” within the meaning of Section 27A of the Securities Act of 1933 and Section 21E of the Securities Exchange Act of 1934, both as amended, with respect to our expectations for future periods. Forward-looking statements do not discuss historical fact, but instead include statements related to expectations, projections, intentions, or other items relating to the future; forward-looking statements are not guarantees of future performance, results, or events. Although we believe the expectations reflected in our forward-looking statements are based upon reasonable assumptions, we can give no assurance our expectations will be achieved. Any statements contained herein which are not statements of historical fact should be deemed forward-looking statements. Reliance should not be placed on these forward-looking statements as these statements are subject to known and unknown risks, uncertainties, and other factors beyond our control and could differ materially from our actual results and performance.
Factors which may cause our actual results or performance to differ materially from those contemplated by forward-looking statements include, but are not limited to, the following:
• | Volatility in capital and credit markets, or other unfavorable changes in economic conditions, either nationally or regionally in one or more of the markets in which we operate, could adversely impact us; |
• | Short-term leases expose us to the effects of declining market rents; |
• | Competition could limit our ability to lease apartments or increase or maintain rental income; |
• | We face risks associated with land holdings and related activities; |
• | Potential reforms to Fannie Mae and Freddie Mac could adversely affect us; |
• | Development, redevelopment and construction risks could impact our profitability; |
• | Investments through joint ventures and discretionary funds involve risks not present in investments in which we are the sole investor; |
• | Competition could adversely affect our ability to acquire properties; |
• | Our acquisition strategy may not produce the cash flows expected; |
• | Failure to qualify as a REIT could have adverse consequences; |
• | Tax laws and related interpretations may change at any time, and any such legislative or other actions could have a negative effect on us; |
• | Litigation risks could affect our business; |
• | Damage from catastrophic weather and other natural events could result in losses; |
• | A cybersecurity incident and other technology disruptions could negatively impact our business; |
• | We have significant debt, which could have adverse consequences; |
• | Insufficient cash flows could limit our ability to make required payments for debt obligations or pay distributions to shareholders; |
• | Issuances of additional debt may adversely impact our financial condition; |
• | We may be unable to renew, repay, or refinance our outstanding debt; |
• | Rising interest rates could both increase our borrowing costs, thereby adversely affecting our cash flows and the amounts available for distribution to our shareholders, and decrease our share price, if investors seek higher yields through other investments; |
• | Failure to maintain our current credit ratings could adversely affect our cost of funds, related margins, liquidity, and access to capital markets; |
• | Share ownership limits and our ability to issue additional equity securities may prevent takeovers beneficial to shareholders; |
• | Our share price will fluctuate; and |
20
• | The form, timing and amount of dividend distributions in future periods may vary and be impacted by economic and other considerations. |
These forward-looking statements represent our estimates and assumptions as of the date of this report, and we assume no obligation to update or supplement forward-looking statements because of subsequent events.
Executive Summary
We are primarily engaged in the ownership, management, development, redevelopment, acquisition, and construction of multifamily apartment communities. Overall, we focus on investing in markets characterized by high-growth economic conditions, strong employment, and attractive quality of life which we believe leads to higher demand and retention of our apartments. As of December 31, 2016, we owned interests in, operated, or were developing 159 multifamily properties comprised of 55,366 apartment homes across the United States as detailed in the following Property Portfolio table. In addition, we own other land holdings which we may develop into multifamily apartment communities in the future.
Property Operations
Our results for the year ended December 31, 2016 reflect an increase in same store revenues of 3.9% as compared to 2015. This increase was due to higher average rental rates and increased other property income, which we believe were due to, among other matters, the continuation of improving economic conditions, including job growth, favorable demographics, a manageable supply of new multifamily housing, and in part to more individuals choosing to rent versus buy as evidenced by the moderating level of homeownership rates, all of which have resulted in higher rental rates. We believe U.S. economic and employment growth is likely to continue during 2017 and the supply of new multifamily homes, although increasing, will likely remain at manageable levels. If economic conditions were to worsen, our operating results could be adversely affected.
Construction Activity
At December 31, 2016, we had seven projects under construction to be comprised of 2,573 apartment homes, with stabilization expected to be completed within the next 42 months. As of December 31, 2016, we estimate the additional cost to complete the construction of the seven projects to be approximately $240.6 million.
Acquisitions
During the year ended December 31, 2016, we acquired an aggregate of approximately of 4.6 acres of land located in Denver, Colorado and Charlotte, North Carolina for approximately $19.9 million. All of the land parcels acquired in 2016 are currently in development as of December 31, 2016.
Dispositions
Operating properties: During the year ended December 31, 2016, we sold one dual-phased property and six other operating properties comprised of an aggregate of 3,184 apartment homes with an average age of 24 years, located in Landover and Frederick, Maryland; Fullerton, California; and Tampa, Altamonte Springs, and St. Petersburg, Florida for an aggregate of approximately $523.4 million, and recognized a gain of approximately $294.9 million.
Land: During 2016, we also sold approximately 6.3 acres of land adjacent to an operating property in Tampa, Florida for approximately $2.2 million and recognized a gain of approximately $0.4 million.
Discontinued operations: In April 2016, we sold 15 operating properties, comprised of an aggregate of 4,918 apartment homes with an average age of 23 years, a retail center and approximately 19.6 acres of land, all located in Las Vegas, Nevada, to an unaffiliated third party for an aggregate of approximately $630.0 million and recognized a gain of approximately $375.2 million.
Future Outlook
Subject to market conditions, we intend to continue to seek opportunities to develop, redevelop and acquire existing communities. We also intend to evaluate our operating property and land development portfolio and plan to continue our practice of selective dispositions as market conditions warrant and opportunities arise. We further intend to strengthen our capital and liquidity positions by continuing to focus on our core fundamentals which currently are generating positive cash flows from operations, maintaining appropriate debt levels and leverage ratios, and controlling overhead costs. We anticipate meeting our near-term liquidity requirements through a combination of one or more of the following: cash and cash equivalents, short-term investments, cash flows generated from operations, draws on our unsecured credit facility, proceeds from property dispositions, the use of debt and equity offerings under our automatic shelf registration statement, equity issued from our ATM program, other unsecured borrowings, and secured mortgages.
21
As of December 31, 2016, we had approximately $237.4 million in cash and cash equivalents, $100.0 million in short-term investments, and no balance outstanding on our $600 million unsecured credit facility. As of the date of this filing, we had common shares having an aggregate offering price of up to $315.3 million remaining available for sale under our ATM program. We believe payments of debt in 2017 are manageable at approximately $276.0 million which represents approximately 11.1% of our total outstanding debt, and includes scheduled principal amortization of approximately $1.2 million. We believe we are well-positioned with a strong balance sheet and sufficient liquidity to cover near-term debt maturities and new development, redevelopment, and other capital funding requirements. We will, however, continue to assess and take further actions we believe are prudent to meet our objectives and capital requirements.
Property Portfolio
Our multifamily property portfolio is summarized as follows:
December 31, 2016 | December 31, 2015 | ||||||||||
Apartment Homes | Properties | Apartment Homes | Properties | ||||||||
Operating Properties | |||||||||||
Houston, Texas | 8,434 | 24 | 8,434 | 24 | |||||||
Dallas, Texas | 5,666 | 14 | 5,243 | 13 | |||||||
Washington, D.C. Metro (1) | 5,635 | 16 | 6,405 | 19 | |||||||
Atlanta, Georgia | 4,246 | 13 | 4,246 | 13 | |||||||
Austin, Texas | 3,360 | 10 | 3,360 | 10 | |||||||
Raleigh, North Carolina | 3,054 | 8 | 3,054 | 8 | |||||||
Orlando, Florida | 2,962 | 8 | 3,540 | 9 | |||||||
Phoenix, Arizona | 2,929 | 10 | 2,549 | 9 | |||||||
Southeast Florida | 2,781 | 8 | 2,781 | 8 | |||||||
Charlotte, North Carolina | 2,753 | 12 | 2,753 | 12 | |||||||
Los Angeles/Orange County, California | 2,658 | 7 | 2,784 | 7 | |||||||
Tampa, Florida | 2,378 | 6 | 3,788 | 9 | |||||||
Denver, Colorado | 2,365 | 7 | 2,365 | 7 | |||||||
Corpus Christi, Texas | 1,907 | 4 | 1,907 | 4 | |||||||
San Diego/Inland Empire, California | 1,665 | 5 | 1,665 | 5 | |||||||
Las Vegas, Nevada (2) | — | — | 4,918 | 15 | |||||||
Total Operating Properties | 52,793 | 152 | 59,792 | 172 | |||||||
Properties Under Construction | |||||||||||
Washington, D.C. Metro | 1,227 | 3 | 862 | 2 | |||||||
Phoenix, Arizona | 441 | 1 | 380 | 1 | |||||||
Charlotte, North Carolina | 323 | 1 | 323 | 1 | |||||||
Houston, Texas | 315 | 1 | 315 | 1 | |||||||
Denver, Colorado | 267 | 1 | 267 | 1 | |||||||
Dallas, Texas | — | — | 423 | 1 | |||||||
Los Angeles/Orange County, California | — | — | 287 | 1 | |||||||
Total Properties Under Construction | 2,573 | 7 | 2,857 | 8 | |||||||
Total Properties | 55,366 | 159 | 62,649 | 180 | |||||||
22
December 31, 2016 | December 31, 2015 | ||||||||||
Apartment Homes | Properties | Apartment Homes | Properties | ||||||||
Less: Unconsolidated Joint Venture Properties (3) | |||||||||||
Houston, Texas | 2,522 | 8 | 2,522 | 8 | |||||||
Austin, Texas | 1,360 | 4 | 1,360 | 4 | |||||||
Dallas, Texas | 1,250 | 3 | 1,250 | 3 | |||||||
Tampa, Florida | 450 | 1 | 450 | 1 | |||||||
Raleigh, North Carolina | 350 | 1 | 350 | 1 | |||||||
Orlando, Florida | 300 | 1 | 300 | 1 | |||||||
Washington, D.C. Metro (1) | 281 | 1 | 276 | 1 | |||||||
Corpus Christi, Texas | 270 | 1 | 270 | 1 | |||||||
Charlotte, North Carolina | 266 | 1 | 266 | 1 | |||||||
Atlanta, Georgia | 234 | 1 | 234 | 1 | |||||||
Total Unconsolidated Joint Venture Properties | 7,283 | 22 | 7,278 | 22 | |||||||
Total Properties Fully Consolidated | 48,083 | 137 | 55,371 | 158 | |||||||
(1) | In August 2016, one of the Funds completed the conversion of retail space to five apartment homes at one of its operating properties. |
(2) | These 15 operating properties were sold to an unaffiliated third party on April 26, 2016. |
(3) | Refer to Note 8, "Investments in Joint Ventures," in the notes to Consolidated Financial Statements for further discussion of our joint venture investments. |
Dispositions
Disposition of Consolidated Operating Properties
During the year ended December 31, 2016, we sold one dual-phased property and six operating properties, with an average age of 24 years, as follows:
Dispositions of Consolidated Operating Properties | Location | Number of Apartment Homes | Date of Disposition | ||||
Camden Westshore | Tampa, FL | 278 | 6/28/2016 | ||||
Camden Clearbrook | Frederick, MD | 297 | 7/11/2016 | ||||
Camden Summerfield | Landover, MD | 291 | 7/11/2016 | ||||
Camden Summerfield II | Landover, MD | 187 | 7/11/2016 | ||||
Camden Woods | Tampa, FL | 444 | 8/9/2016 | ||||
Camden Renaissance | Altamonte Springs, FL | 578 | 8/22/2016 | ||||
Camden Parkside | Fullerton, CA | 421 | 8/31/2016 | ||||
Camden Lakes | St. Petersburg, FL | 688 | 9/27/2016 | ||||
Consolidated total | 3,184 | ||||||
Discontinued Operations
On April 26, 2016, we sold 15 operating properties, comprised of an aggregate of 4,918 apartment homes, with an average age of 23 years, a retail center and approximately 19.6 acres of land, all located in Las Vegas, Nevada.
Stabilized Communities
We generally consider a property stabilized once it reaches 90% occupancy. During the year ended December 31, 2016, stabilization was achieved at four consolidated operating properties and one unconsolidated operating property as follows:
23
Stabilized Property and Location | Number of Apartment Homes | Date of Construction Completion | Date of Stabilization | |||
Consolidated Operating Properties | ||||||
Camden Flatirons | ||||||
Denver, CO | 424 | 3Q15 | 1Q16 | |||
Camden Paces | ||||||
Atlanta, GA | 379 | 4Q15 | 2Q16 | |||
Camden Glendale | ||||||
Glendale, CA | 303 | 3Q15 | 3Q16 | |||
Camden Chandler | ||||||
Chandler, AZ | 380 | 1Q16 | 4Q16 | |||
Consolidated total | 1,486 | |||||
Unconsolidated Operating Property | ||||||
Camden Southline | ||||||
Charlotte, NC | 266 | 4Q15 | 1Q16 | |||
Completed Construction in Lease-Up
At December 31, 2016, we had two consolidated completed operating properties in lease-up as follows:
($ in millions) Property and Location | Number of Apartment Homes | Cost Incurred (1) | % Leased at 2/4/2017 | Date of Construction Completion | Estimated Date of Stabilization | ||||||||
Consolidated Operating Properties | |||||||||||||
The Camden | |||||||||||||
Hollywood, CA | 287 | $ | 133.7 | 88 | % | 4Q16 | 2Q17 | ||||||
Camden Victory Park | |||||||||||||
Dallas, TX | 423 | 84.6 | 80 | % | 3Q16 | 4Q17 | |||||||
Consolidated total | 710 | $ | 218.3 | ||||||||||
(1) Excludes leasing costs, which are expensed as incurred.
Properties Under Development and Land
Our consolidated balance sheet at December 31, 2016 included approximately $442.3 million related to properties under development and land. Of this amount, approximately $316.3 million related to our projects currently under construction. In addition, we had approximately $126.0 million primarily invested in land held for future development and land holdings, which included approximately $114.9 million related to projects we expect to begin constructing during the next two years, and approximately $11.1 million invested in land which we may develop in the future.
24
Communities Under Construction. At December 31, 2016, we had seven consolidated properties in various stages of construction as follows:
($ in millions) Property and Location | Number of Apartment Homes | Estimated Cost | Cost Incurred | Included in Properties Under Development | Estimated Date of Construction Completion | Estimated Date of Stabilization | ||||||||||||
Consolidated Communities Under Construction | ||||||||||||||||||
Camden Gallery Charlotte, NC (1) | 323 | $ | 60.0 | $ | 58.4 | $ | 1.3 | 1Q17 | 2Q17 | |||||||||
Camden Lincoln Station Denver, CO (2) | 267 | 56.0 | 50.5 | 32.5 | 2Q17 | 1Q18 | ||||||||||||
Camden NoMa II Washington, DC | 405 | 115.0 | 99.3 | 99.3 | 4Q17 | 4Q19 | ||||||||||||
Camden Shady Grove Rockville, MD | 457 | 116.0 | 90.3 | 90.3 | 1Q18 | 4Q19 | ||||||||||||
Camden McGowen Station Houston, TX | 315 | 90.0 | 35.6 | 35.6 | 2Q18 | 3Q19 | ||||||||||||
Camden Washingtonian Gaithersburg, MD | 365 | 90.0 | 31.8 | 31.8 | 4Q18 | 4Q19 | ||||||||||||
Camden North End I Phoenix, AZ | 441 | 105.0 | 25.5 | 25.5 | 2Q19 | 2Q20 | ||||||||||||
Consolidated total | 2,573 | $ | 632.0 | $ | 391.4 | $ | 316.3 | |||||||||||
(1) Property in lease-up and was 85% leased at February 4, 2017.
(2) Property in lease-up and was 33% leased at February 4, 2017.
Development Pipeline Communities. At December 31, 2016, we had the following consolidated communities undergoing development activities:
($ in millions) Property and Location | Projected Homes | Total Estimated Cost (1) | Cost to Date | ||||||||
Camden Grandview II | 28 | $ | 21.0 | $ | 6.1 | ||||||
Charlotte, NC | |||||||||||
Camden Buckhead | 375 | 104.0 | 14.8 | ||||||||
Atlanta, GA | |||||||||||
Camden RiNo | 230 | 70.0 | 17.0 | ||||||||
Denver, CO | |||||||||||
Camden Gallery II | 5 | 3.0 | 1.0 | ||||||||
Charlotte, NC | |||||||||||
Camden Arts District | 354 | 150.0 | 16.8 | ||||||||
Los Angeles, CA | |||||||||||
Camden Conte (2) | 519 | 170.0 | 22.4 | ||||||||
Houston, TX | |||||||||||
Camden North End II | 326 | 73.0 | 11.5 | ||||||||
Phoenix, AZ | |||||||||||
Camden Atlantic | 286 | 62.0 | 14.2 | ||||||||
Plantation, FL | |||||||||||
Camden Paces III | 350 | 100.0 | 11.1 | ||||||||
Atlanta, GA | |||||||||||
Total | 2,473 | $ | 753.0 | $ | 114.9 | ||||||
(1) | Represents our estimate of total costs we expect to incur on these projects. However, forward-looking statements are not guarantees of future performance, results, or events. Although we believe these expectations are based upon reasonable assumptions, future events rarely develop exactly as forecasted, and estimates routinely require adjustment. |
(2) | Anticipated to be developed in two phases. The estimated units, estimated cost, and cost to date represent both phases. |
25
Land Holdings. At December 31, 2016, we had the following investment in land:
($ in millions) Location | Acres | Cost to Date | ||||
Phoenix, AZ (c) | 14.0 | $ | 11.1 | |||
Geographic Diversification
At December 31, 2016 and 2015, our real estate assets by various markets, excluding depreciation, investments in joint ventures and properties held for sale, were as follows:
($ in thousands) | 2016 | 2015 | |||||||||||
Washington, D.C. Metro | $ | 1,417,255 | 19.2 | % | $ | 1,433,339 | 19.4 | % | |||||
Houston, Texas | 766,801 | 10.4 | 730,576 | 9.9 | |||||||||
Los Angeles/Orange County, California | 709,210 | 9.6 | 740,976 | 10.0 | |||||||||
Atlanta, Georgia | 626,483 | 8.5 | 615,972 | 8.3 | |||||||||
Southeast Florida | 565,369 | 7.7 | 558,521 | 7.5 | |||||||||
Dallas, Texas | 493,477 | 6.7 | 470,629 | 6.4 | |||||||||
Phoenix, Arizona | 492,251 | 6.7 | 478,373 | 6.5 | |||||||||
Denver, Colorado | 440,296 | 6.0 | 383,280 | 5.2 | |||||||||
Charlotte, North Carolina | 371,009 | 5.0 | 351,661 | 4.8 | |||||||||
Orlando, Florida | 341,727 | 4.6 | 387,547 | 5.2 | |||||||||
San Diego/Inland Empire, California | 330,961 | 4.5 | 328,381 | 4.4 | |||||||||
Raleigh, North Carolina | 268,230 | 3.6 | 263,185 | 3.6 | |||||||||
Austin, Texas | 230,351 | 3.1 | 229,306 | 3.1 | |||||||||
Tampa, Florida | 221,428 | 3.0 | 315,643 | 4.3 | |||||||||
Corpus Christi, Texas | 101,842 | 1.4 | 100,208 | 1.4 | |||||||||
Total | $ | 7,376,690 | 100.0 | % | $ | 7,387,597 | 100.0 | % | |||||
Results of Operations
Changes in revenues and expenses related to our operating properties from period to period are due primarily to the performance of stabilized properties in the portfolio, the lease-up of newly constructed properties, acquisitions, and dispositions. Where appropriate, comparisons of income and expense for communities included in continuing operations are made on a dollars-per-weighted average apartment home basis in order to adjust for such changes in the number of apartment homes owned during each period. Selected weighted averages for the years ended December 31 are as follows:
2016 | 2015 | 2014 | |||||||||
Average monthly property revenue per apartment home | $ | 1,556 | $ | 1,479 | $ | 1,374 | |||||
Annualized total property expenses per apartment home | $ | 6,634 | $ | 6,392 | $ | 5,963 | |||||
Weighted average number of operating apartment homes owned 100% | 46,934 | 47,088 | 47,915 | ||||||||
Weighted average occupancy of operating apartment homes owned 100% * | 95.3 | % | 95.7 | % | 95.8 | % | |||||
* Our one student housing community is excluded from this calculation. | |||||||||||
Management considers property net operating income ("NOI") to be an appropriate supplemental measure of operating performance to net income because it reflects the operating performance of our communities without an allocation of corporate level property management overhead or general and administrative costs. We define NOI as total property income less property operating and maintenance expenses less real estate taxes. NOI is further detailed in the Property-Level NOI table as seen below. NOI is not defined by accounting principles generally accepted in the United States of America ("GAAP") and should not be considered an alternative to net income as an indication of our operating performance, should not be considered an alternative to net cash from operating activities as a measure of liquidity, or an indication of cash available to fund cash needs. Additionally, NOI as disclosed by other REITs may not be comparable to our calculation.
26
Reconciliations of net income to NOI for the year ended December 31, 2016, 2015, and 2014 are as follows:
(in thousands) | 2016 | 2015 | 2014 | |||||||||
Net income | $838,226 | $258,262 | $ | 301,314 | ||||||||
Less: Fee and asset management income | (6,864 | ) | (6,999 | ) | (9,832 | ) | ||||||
Less: Interest and other income | (2,202 | ) | (597 | ) | (842 | ) | ||||||
Less: Income/(loss) on deferred compensation plans | (5,511 | ) | 264 | (3,937 | ) | |||||||
Plus: Property management expense | 25,125 | 23,055 | 22,070 | |||||||||
Plus: Fee and asset management expense | 3,848 | 4,742 | 5,341 | |||||||||
Plus: General and administrative expense | 47,415 | 46,233 | 51,005 | |||||||||
Plus: Interest expense | 93,145 | 97,312 | 94,906 | |||||||||
Plus: Depreciation and amortization expense | 250,146 | 240,944 | 222,055 | |||||||||
Plus: Expense/(benefit) on deferred compensation plans | 5,511 | (264 | ) | 3,937 | ||||||||
Less: Gain on sale of operating properties, including land | (295,397 | ) | (104,288 | ) | (159,289 | ) | ||||||
Plus: Impairment associated with land holdings | — | — | 1,152 | |||||||||
Less: Equity in income of joint ventures | (7,125 | ) | (6,168 | ) | (7,023 | ) | ||||||
Plus: Income tax expense | 1,617 | 1,872 | 1,903 | |||||||||
Less: Income from discontinued operations | (7,605 | ) | (19,750 | ) | (18,197 | ) | ||||||
Less: Gain on sale of discontinued operations, net of tax | (375,237 | ) | — | — | ||||||||
Net operating income | $ | 565,092 | $ | 534,618 | $ | 504,563 | ||||||
Property-Level NOI (1)
Property NOI, as reconciled above, is detailed further into the following categories for the year ended December 31, 2016 as compared to 2015 and for the year ended December 31, 2015 as compared to 2014:
Apartment Homes at | Year Ended December 31, | Change | |||||||||||||||
($ in thousands) | 12/31/2016 | 2016 | 2015 | $ | % | ||||||||||||
Property revenues: | |||||||||||||||||
Same store communities | 40,221 | $ | 746,101 | $ | 718,234 | $ | 27,867 | 3.9 | % | ||||||||
Non-same store communities | 4,579 | 84,510 | 60,596 | 23,914 | 39.5 | ||||||||||||
Development and lease-up communities | 3,283 | 9,399 | 1 | 9,398 | * | ||||||||||||
Dispositions/other | — | 36,437 | 56,787 | (20,350 | ) | (35.8 | ) | ||||||||||
Total property revenues | 48,083 | $ | 876,447 | $ | 835,618 | $ | 40,829 | 4.9 | % | ||||||||
Property expenses: | |||||||||||||||||
Same store communities | 40,221 | $ | 263,768 | $ | 257,988 | $ | 5,780 | 2.2 | % | ||||||||
Non-same store communities | 4,579 | 30,907 | 23,169 | 7,738 | 33.4 | ||||||||||||
Development and lease-up communities | 3,283 | 4,363 | 8 | 4,355 | * | ||||||||||||
Dispositions/other | — | 12,317 | 19,835 | (7,518 | ) | (37.9 | ) | ||||||||||
Total property expenses | 48,083 | $ | 311,355 | $ | 301,000 | $ | 10,355 | 3.4 | % | ||||||||
Property NOI: | |||||||||||||||||
Same store communities | 40,221 | $ | 482,333 | $ | 460,246 | $ | 22,087 | 4.8 | % | ||||||||
Non-same store communities | 4,579 | 53,603 | 37,427 | 16,176 | 43.2 | ||||||||||||
Development and lease-up communities | 3,283 | 5,036 | (7 | ) | 5,043 | * | |||||||||||
Dispositions/other | — | 24,120 | 36,952 | (12,832 | ) | (34.7 | ) | ||||||||||
Total property NOI | 48,083 | $ | 565,092 | $ | 534,618 | $ | 30,474 | 5.7 | % | ||||||||
* Not a meaningful percentage.
27
(1) | Same store communities are communities we owned and were stabilized as of January 1, 2015, excluding assets held for sale. Non-same store communities are stabilized communities not owned or stabilized as of January 1, 2015, excluding assets held for sale. Management believes same store information is useful as it allows both management and investors to determine financial results over a particular period for the same set of communities. Development and lease-up communities are non-stabilized communities we have acquired or developed since January 1, 2015, excluding assets held for sale. Dispositions/other includes those communities disposed of or held for sale which are not classified as discontinued operations. Other includes non-multifamily rental properties, below market lease amortization related to acquired communities, and expenses related to land holdings not under active development. |
Apartment Homes at | Year Ended December 31, | Change | |||||||||||||||
($ in thousands) | 12/31/2015 | 2015 | 2014 | $ | % | ||||||||||||
Property revenues: | |||||||||||||||||
Same store communities | 42,700 | $ | 752,983 | $ | 716,613 | $ | 36,370 | 5.1 | % | ||||||||
Non-same store communities | 3,790 | 59,413 | 30,397 | 29,016 | 95.5 | ||||||||||||
Development and lease-up communities | 3,963 | 14,548 | 1,295 | 13,253 | * | ||||||||||||
Dispositions/other | — | 8,674 | 41,958 | (33,284 | ) | (79.3 | ) | ||||||||||
Total property revenues | 50,453 | $ | 835,618 | $ | 790,263 | $ | 45,355 | 5.7 | % | ||||||||
Property expenses: | |||||||||||||||||
Same store communities | 42,700 | $ | 269,445 | $ | 256,395 | $ | 13,050 | 5.1 | % | ||||||||
Non-same store communities | 3,790 | 22,038 | 11,117 | 10,921 | 98.2 | ||||||||||||
Development and lease-up communities | 3,963 | 6,069 | 301 | 5,768 | * | ||||||||||||
Dispositions/other | — | 3,448 | 17,887 | (14,439 | ) | (80.7 | ) | ||||||||||
Total property expenses | 50,453 | $ | 301,000 | $ | 285,700 | $ | 15,300 | 5.4 | % | ||||||||
Property NOI: | |||||||||||||||||
Same store communities | 42,700 | $ | 483,538 | $ | 460,218 | $ | 23,320 | 5.1 | % | ||||||||
Non-same store communities | 3,790 | $ | 37,375 | $ | 19,280 | $ | 18,095 | 93.9 | % | ||||||||
Development and lease-up communities | 3,963 | $ | 8,479 | $ | 994 | $ | 7,485 | * | |||||||||
Dispositions/other | — | $ | 5,226 | $ | 24,071 | $ | (18,845 | ) | (78.3 | )% | |||||||
Total property NOI | 50,453 | $ | 534,618 | $ | 504,563 | $ | 30,055 | 6.0 | % | ||||||||
* Not a meaningful percentage.
(1) | Same store communities are communities we owned and were stabilized as of January 1, 2014, excluding assets held for sale. Non-same store communities are stabilized communities not owned or stabilized as of January 1, 2014, excluding assets held for sale. Management believes same store information is useful as it allows both management and investors to determine financial results over a particular period for the same set of communities. Development and lease-up communities are non-stabilized communities we have acquired or developed since January 1, 2014, excluding assets held for sale. Dispositions/other includes those communities disposed of or held for sale which are not classified as discontinued operations. Other includes non-multifamily rental properties, below market lease amortization related to acquired communities, and expenses related to land holdings not under active development. |
Same Store Analysis
Same store property NOI increased approximately $22.1 million for the year ended December 31, 2016 as compared to the same period in 2015. This increase was due to an increase of approximately $27.9 million in same store property revenues for the year ended December 31, 2016, partially offset by an increase of approximately $5.8 million in same store property expenses for the year ended December 31, 2016, as compared to the same period in 2015.
The $27.9 million increase in same store property revenue for the year ended December 31, 2016 as compared to the same period in 2015, was due in part to an increase in same store rental revenues of approximately $17.4 million for the year ended December 31, 2016, which was primarily due to a 3.2% increase in average rental rates for our same store portfolio for the year ended December 31, 2016, as compared to the same period in 2015. The increase in same store property revenue was also due to an increase of approximately $10.5 million in other property revenue for the year ended December 31, 2016 as compared to the same period in 2015, primarily due to increases in income from our bulk internet rebilling program and miscellaneous fee income.
28
The $5.8 million increase in same store property expense for the year ended December 31, 2016 as compared to the same period in 2015, was primarily due to increased costs associated with our bulk internet rebilling program and a $2.5 million, or 2.8%, increase in real estate taxes as a result of higher property valuations at a number of our communities. These increases were partially offset by decreased property insurance expenses during the year ended December 31, 2016 as compared to the same period in 2015.
Same store property NOI increased approximately $23.3 million for the year ended December 31, 2015 as compared to the same period in 2014. This increase was due to an increase of approximately $36.4 million in same store property revenues for the year ended December 31, 2015, partially offset by an increase of approximately $13.1 million in same store property expenses for the year ended December 31, 2015, as compared to the same period in 2014.
The $36.4 million increase in same store property revenue during the year ended December 31, 2015 as compared to the same period in 2014, was due in part to an increase in same store rental revenues of approximately $26.5 million during the year ended December 31, 2015, which was primarily due to a 4.1% increase in average rental rates for our same store portfolio during the year ended December 31, 2015 as compared to the same period in 2014. The increase in same store property revenue was also due to an increase of approximately $9.9 million in other property revenue during the year ended December 31, 2015 as compared to the same period in 2014, primarily due to increases in income from our bulk internet rebilling program and miscellaneous fee income.
The $13.1 million increase in same store property expense during the year ended December 31, 2015 as compared to the same period in 2014, was primarily due to a $5.8 million, or 6.6%, increase in real estate taxes as a result of higher property valuations at a number of our communities as well as increased costs associated with our bulk internet rebilling program.
Non-same Store and Development and Lease-up Analysis
Property NOI from non-same store and development and lease-up communities increased approximately $21.2 million for the year ended December 31, 2016 as compared to the same period in 2015. The increase was due to an increase of approximately $33.3 million in revenues for the year ended December 31, 2016, partially offset by an increase of approximately $12.1 million in expenses for the year ended December 31, 2016, as compared to the same period in 2015. The increases in property revenues and expenses from our non-same store communities were primarily due to the stabilization of five operating properties in 2015 and four operating properties in 2016. The increases in property revenues and expenses from our development and lease-up communities were primarily due to the completion and partial lease up of three properties during 2015 and two properties during 2016, and the partial lease-up of two properties which were under construction at December 31, 2016.
Property NOI from non-same store and development and lease-up communities increased approximately $25.6 million for the year ended December 31, 2015 as compared to the same period in 2014. The increase was due to an increase of approximately $42.3 million in revenues for the year ended December 31, 2015, partially offset by an increase of approximately $16.7 million in expenses for the year ended December 31, 2015, as compared to the same period in 2014. The increases in property revenues and expenses from our non-same store communities were primarily due to the stabilization of one operating property in 2014 and five operating properties in 2015, and the acquisition of one operating property in 2014. The increases in property revenues and expenses from our development and lease-up communities were primarily due to the completion and partial lease up of three properties in 2015 and the partial lease-up of one property which was under construction at December 31, 2015.
Dispositions/Other Property Analysis
Dispositions/other property NOI decreased approximately $12.8 million for the year ended December 31, 2016 as compared to the same period in 2015. The decrease was primarily due to the disposition of three operating properties in 2015, and the disposition of one dual-phase operating property and six other operating properties in 2016.
Dispositions/other property NOI decreased approximately $18.8 million for the year ended December 31, 2015 as compared to the same period in 2014. The decrease was primarily due to the disposition of five operating properties in 2014 and three operating properties in 2015.
29
Non-Property Income
Year Ended December 31, | Change | Year Ended December 31, | Change | ||||||||||||||||||||||||||
($ in thousands) | 2016 | 2015 | $ | % | 2015 | 2014 | $ | % | |||||||||||||||||||||
Fee and asset management | $ | 6,864 | $ | 6,999 | $ | (135 | ) | (1.9 | )% | $ | 6,999 | $ | 9,832 | $ | (2,833 | ) | (28.8 | )% | |||||||||||
Interest and other income | 2,202 | 597 | 1,605 | 268.8 | 597 | 842 | (245 | ) | (29.1 | ) | |||||||||||||||||||
Income (loss) on deferred compensation plans | 5,511 | (264 | ) | 5,775 | * | (264 | ) | 3,937 | (4,201 | ) | (106.7 | ) | |||||||||||||||||
Total non-property income | $ | 14,577 | $ | 7,332 | $ | 7,245 | 98.8 | % | $ | 7,332 | $ | 14,611 | $ | (7,279 | ) | (49.8 | )% | ||||||||||||
Fee and asset management income, which represents income related to property management of our joint ventures and fees from third-party construction projects, decreased approximately $0.1 million for the year ended December 31, 2016 as compared to 2015 and decreased approximately $2.8 million for the year ended December 31, 2015 as compared to 2014. The slight decrease for 2016 as compared to 2015 was primarily due to a decrease in development and construction fees earned due to the timing of the commencement and completion of the development of one community by one of our Funds in 2015, partially offset by higher third-party construction activity. The decrease for 2015 as compared to 2014 was primarily due to lower development and construction fees earned due to the timing of development communities started and completed by our Funds during 2014 and 2015, and our increase in ownership interest in two of the Funds from 20% to 31.3% effective December 23, 2014. We eliminate fee income provided by our Funds to the extent of our ownership.
Interest and other income increased approximately $1.6 million for the year ended December 31, 2016, as compared to 2015, and was relatively flat for the year ended December 31, 2015 as compared to 2014. The increase for 2016 was due to higher interest income earned on investments in cash and short-term investments due to an increase in average cash balances and an increase in interest income earned due to higher average note receivable balances outstanding on our real estate secured loans to unaffiliated third parties in 2016, as compared to the same period in 2015.
Our deferred compensation plans recognized income of approximately $5.5 million in 2016, a loss of approximately $0.3 million in 2015 and income of approximately $3.9 million in 2014. These changes were related to the performance of the investments held in deferred compensation plans for participants and were directly offset by the expense (benefit) related to these plans, as discussed below.
Other Expenses
Year Ended December 31, | Change | Year Ended December 31, | Change | ||||||||||||||||||||||||||
($ in thousands) | 2016 | 2015 | $ | % | 2015 | 2014 | $ | % | |||||||||||||||||||||
Property management | $ | 25,125 | $ | 23,055 | $ | 2,070 | 9.0 | % | $ | 23,055 | $ | 22,070 | $ | 985 | 4.5 | % | |||||||||||||
Fee and asset management | 3,848 | 4,742 | (894 | ) | (18.9 | ) | 4,742 | 5,341 | (599 | ) | (11.2 | ) | |||||||||||||||||
General and administrative | 47,415 | 46,233 | 1,182 | 2.6 | 46,233 | 51,005 | (4,772 | ) | (9.4 | ) | |||||||||||||||||||
Interest | 93,145 | 97,312 | (4,167 | ) | (4.3 | ) | 97,312 | 94,906 | 2,406 | 2.5 | |||||||||||||||||||
Depreciation and amortization | 250,146 | 240,944 | 9,202 | 3.8 | 240,944 | 222,055 | 18,889 | 8.5 | |||||||||||||||||||||
Expense (benefit) on deferred compensation plans | 5,511 | (264 | ) | 5,775 | * | (264 | ) | 3,937 | (4,201 | ) | (106.7 | ) | |||||||||||||||||
Total other expenses | $ | 425,190 | $ | 412,022 | $ | 13,168 | 3.2 | % | $ | 412,022 | $ | 399,314 | $ | 12,708 | 3.2 | % | |||||||||||||
Property management expense, which primarily represents regional supervision and accounting costs related to property operations, increased approximately $2.1 million for the year ended December 31, 2016 as compared to 2015 and increased approximately $1.0 million for the year ended December 31, 2015 as compared to 2014. These increases were primarily due to increases in salaries, benefits, and incentive compensation expenses. Property management expenses were 2.9% of total property revenues for the year ended December 31, 2016 and were 2.8% of total property revenues for each of the years ended December 31, 2015 and 2014.
Fee and asset management expense, which represents expenses related to property management of our joint ventures and fees from third-party construction projects, decreased approximately $0.9 million for the year ended December 31, 2016 as compared to 2015 and decreased approximately $0.6 million for the year ended December 31, 2015 as compared to 2014. The decrease for 2016 as compared to 2015 was primarily due to lower professional fees incurred in managing our joint ventures
30
and lower expenses incurred as a result of decreases in development and construction activity relating to the timing of one development community started and completed by one of the Funds in 2015. The decrease was partially offset by higher expenses relating to an increase in third-party construction activity in 2016 as compared to 2015. The decrease for 2015 as compared to 2014 was primarily due to lower expenses directly related to lower net revenues resulting from our change in ownership interest in two of the Funds effective December 23, 2014.
General and administrative expenses increased approximately $1.2 million during the year ended December 31, 2016 as compared to 2015 and decreased approximately $4.8 million during the year ended December 31, 2015 as compared to 2014. General and administrative expenses were 5.4%, 5.5% and 6.4% of total revenues, excluding income (loss) on deferred compensation plans, for the years ended December 31, 2016, 2015 and 2014, respectively. The increase for the year ended December 31, 2016 as compared to 2015 was primarily due to increases in salaries, benefits, and incentive compensation expenses due to higher deferred compensation amortization costs resulting from the accelerated vesting relating to certain trust managers and executive officers meeting the retirement eligibility and service requirements as defined in the 2011 Share Incentive Plan of Camden Property Trust, and an increase in the value of awards granted in 2016 as compared to the value of awards which vested during the same period in 2015.
The decrease in general and administrative expenses for the year ended December 31, 2015 as compared to 2014 was primarily due to approximately $10.0 million in one-time bonuses paid to employees in 2014 relating to the restructuring of the Funds in December 2014. Excluding the $10.0 million one-time bonus paid in 2014, general and administrative expenses increased by approximately $5.2 million in 2015 as compared to 2014, which was primarily related to an increase in salaries, benefits and incentive compensation expenses, partially offset by a slight decrease in professional fees.
Interest expense decreased approximately $4.2 million for the year ended December 31, 2016 as compared to 2015 and increased approximately $2.4 million for the year ended December 31, 2015 as compared to 2014. The decrease in interest expense in 2016 as compared to 2015 was primarily due to the repayment of a $250.0 million, 5.08% senior unsecured note payable in June 2015. The decrease was partially offset by lower capitalized interest during the year ended December 31, 2016, resulting from lower average balances in our development pipeline, and higher interest expense recognized on our variable rate debt due to higher weighted average interest rates in 2016 as compared to the same period in 2015.
The increase in interest expense in 2015 as compared to 2014 was primarily due to increased interest expense from the issuance of a $250.0 million, 3.68% senior unsecured note payable in September 2014, and lower capitalized interest of approximately $2.9 million during the year ended December 31, 2015, resulting from lower average balances in our development pipeline. The increase in 2015 was also due to an increase in interest expense relating to borrowings on our unsecured credit facility and unsecured short-term borrowing facility as compared to the same period in 2014. The increase in 2015 was partially offset by the repayment of a $250.0 million, 5.08% senior unsecured note payable in June 2015 and the repayment of two secured notes payable in April and September of 2014.
Depreciation and amortization expense increased approximately $9.2 million for the year ended December 31, 2016 as compared to 2015 and increased approximately $18.9 million for the year ended December 31, 2015 as compared to 2014. The increase in 2016 as compared to 2015 was primarily due to the completion of units in our development pipeline, the completion of repositions, and increases in capital improvements placed in service during 2016 and 2015. The increase was partially offset by a decrease in depreciation expense related to the disposition of one operating property during the fourth quarter of 2015, and the dispositions of one dual-phased operating property and six other operating properties in 2016.
The increase in depreciation and amortization expense in 2015 as compared to 2014 was primarily due to the completion of units in our development pipeline, the completion of repositions, increases in capital improvements placed in service during 2014 and 2015, and the acquisition of one operating property in October 2014. The increase was partially offset by a decrease in depreciation expense related to the dispositions of five operating properties in 2014 and three operating properties in 2015.
Our deferred compensation plans incurred an expense of approximately $5.5 million in 2016, a benefit of approximately $0.3 million in 2015 and an expense of $3.9 million in 2014. These changes were related to the performance of the investments held in deferred compensation plans for participants and were directly offset by the income (loss) related to these plans, as discussed in the non-property income section above.
31
Other
Year Ended December 31, | Change | Year Ended December 31, | Change | ||||||||||||||||||||
(in thousands) | 2016 | 2015 | $ | 2015 | 2014 | $ | |||||||||||||||||
Gain on sale of operating properties, including land | $ | 295,397 | $ | 104,288 | $ | 191,109 | $ | 104,288 | $ | 159,289 | $ | (55,001 | ) | ||||||||||
Impairment associated with land holdings | — | — | — | — | (1,152 | ) | 1,152 | ||||||||||||||||
Equity in income of joint ventures | 7,125 | 6,168 | 957 | 6,168 | 7,023 | (855 | ) | ||||||||||||||||
Income tax expense | (1,617 | ) | (1,872 | ) | 255 | (1,872 | ) | (1,903 | ) | 31 | |||||||||||||
During the year ended December 31, 2016 we recognized an approximate $294.9 million gain related to the sale of one dual-phased property and six other operating properties. During the year ended December 31, 2015, we recognized an approximate $104.0 million gain related to the sale of three operating properties. For the year ended 2016, we also sold 6.3 acres of land adjacent to an operating property in Tampa, Florida for a gain of approximately $0.4 million and for the year ended 2015, we sold two land holdings adjacent to operating properties in Dallas and Houston, Texas for a gain of approximately $0.3 million.
During the year ended December 31, 2014, we recognized an approximate $155.7 million gain related to the sales of five operating properties and the sale of approximately 29.3 acres located adjacent to current operating and development communities for a gain on the sale of land of approximately $3.6 million. The $1.2 million impairment associated with land holdings in 2014 reflects the difference between the land holding's carrying value and the sales price.
Equity in income of joint ventures increased approximately $1.0 million for the year ended December 31, 2016 as compared to 2015, and decreased approximately $0.9 million for the year ended December 31, 2015 as compared to 2014. The increase in 2016 was primarily due to an increase in earnings resulting from higher rental and other property revenues from the operating properties owned by the Funds and the stabilization of one operating property owned by one of the Funds during the first quarter of 2016. The increase was partially offset by higher real estate taxes as a result of increased property valuations at a number of the communities owned by the Funds. The increase was further offset by an increase in interest expense incurred during the year ended December 31, 2016 resulting from interest capitalized during the year ended December 31, 2015 while a property was under construction.
The decrease in equity in income of joint ventures in 2015 as compared to 2014 was primarily due to the recognition of a $3.6 million proportionate share of the gain relating to the sale of two operating properties by the Funds in 2014. The decrease was partially offset by an increase in earnings resulting from our increase in ownership interest in two of the Funds from 20% to 31.3% effective December 23, 2014. The decrease was further offset by an increase in earnings resulting from higher rental income from the stabilized operating properties owned by the Funds and two operating properties owned by the Funds reaching stabilization during the third quarter of 2014.
Funds from Operations (“FFO”) and Adjusted FFO ("AFFO")
Management considers FFO and AFFO to be appropriate measures of the financial performance of an equity REIT. The National Association of Real Estate Investment Trusts (“NAREIT”) currently defines FFO as net income (computed in accordance with GAAP), excluding gains (or losses) associated with the sale of previously depreciated operating properties, real estate depreciation and amortization, impairments of depreciable assets, and adjustments for unconsolidated joint ventures to reflect FFO on the same basis. Our calculation of diluted FFO also assumes conversion of all potentially dilutive securities, including certain non-controlling interests, which are convertible into common shares. We consider FFO to be an appropriate supplemental measure of operating performance because, by excluding gains or losses on dispositions of operating properties and depreciation, FFO can assist in the comparison of the operating performance of a company’s real estate investments between periods or to different companies.
AFFO is calculated utilizing FFO less recurring capitalized expenditures which are necessary to help preserve the value of and maintain the functionality at our communities. We also consider AFFO to be a useful supplemental measure because it is frequently used by analysts and investors to evaluate a REIT's operating performance between periods or different companies. Our definition of recurring capital expenditures may differ from other REITs, and there can be no assurance our basis for computing this measure is comparable to other REITs.
To facilitate a clear understanding of our consolidated historical operating results, we believe FFO and AFFO should be examined in conjunction with net income attributable to common shareholders as presented in the consolidated statements of income and comprehensive income and data included elsewhere in this report. FFO and AFFO are not defined by GAAP and should not be considered alternatives to net income attributable to common shareholders as an indication of our operating performance. Additionally, FFO and AFFO as disclosed by other REITs may not be comparable to our calculation.
32
Reconciliations of net income attributable to common shareholders to FFO and AFFO for the years ended December 31 are as follows:
($ in thousands) | 2016 | 2015 | 2014 | ||||||||
Funds from operations | |||||||||||
Net income attributable to common shareholders | $ | 819,823 | $ | 249,315 | $ | 292,089 | |||||
Real estate depreciation and amortization, including discontinued operations | 248,235 | 251,104 | 230,638 | ||||||||
Adjustments for unconsolidated joint ventures | 9,194 | 9,146 | 5,337 | ||||||||
Gain on sale of unconsolidated joint venture properties (1) | — | — | (3,566 | ) | |||||||
Gain on sale of operating properties, net of tax | (294,954 | ) | (104,015 | ) | (155,680 | ) | |||||
Gain on sale of discontinued operations, net of tax | (375,237 | ) | — | — | |||||||
Income allocated to non-controlling interests | 18,403 | 8,947 | 9,225 | ||||||||
Funds from operations | $ | 425,464 | $ | 414,497 | $ | 378,043 | |||||
Less: recurring capitalized expenditures | (59,084 | ) | (64,169 | ) | (59,854 | ) | |||||
Adjusted funds from operations | $ | 366,380 | $ | 350,328 | $ | 318,189 | |||||
Weighted average shares – basic | 89,580 | 89,120 | 88,084 | ||||||||
Incremental shares issuable from assumed conversion of: | |||||||||||
Common share options and awards granted | 323 | 370 | 384 | ||||||||
Common units | 1,891 | 1,896 | 1,898 | ||||||||
Weighted average shares – diluted | 91,794 | 91,386 | 90,366 | ||||||||
(1) The gain in 2014 represents our proportionate share of the gain on sale of two operating properties sold by the Funds in 2014.
Liquidity and Capital Resources
Financial Condition and Sources of Liquidity
We intend to maintain a strong balance sheet and preserve our financial flexibility, which we believe should enhance our ability to identify and capitalize on investment opportunities as they become available. We intend to maintain what management believes is a conservative capital structure by:
• | extending and sequencing the maturity dates of our debt where practicable; |
• | managing interest rate exposure using what management believes to be prudent levels of fixed and floating rate debt; |
• | maintaining what management believes to be conservative coverage ratios; and, |
• | using what management believes to be a prudent combination of debt and equity. |
Our interest expense coverage ratio, net of capitalized interest, was approximately 5.5, 5.2, and 5.0 times for the years ended December 31, 2016, 2015, and 2014, respectively. This ratio is a method for calculating the amount of operating cash flows available to cover interest expense and is calculated by dividing interest expense for the period into the sum of property revenues and expenses, non-property income, other expenses and income from discontinued operations after adding back depreciation, amortization, and interest expense from both continuing and discontinued operations. Approximately 78.3%, 79.9%, and 79.5% of our properties were unencumbered at December 31, 2016, 2015, and 2014, respectively. Our weighted average maturity of debt was approximately 4.9 years at December 31, 2016.
We also intend to strengthen our capital and liquidity positions by continuing to focus on our core fundamentals, which currently are generating positive cash flows from operations, maintaining appropriate debt levels and leverage ratios, and controlling overhead costs.
Our primary sources of liquidity are cash and cash equivalents on hand, short-term investments, and cash flow generated from operations. Other sources may include one or more of the following: availability under our unsecured credit facility,
33
proceeds from property dispositions, the use of debt and equity offerings under our automatic shelf registration statement, equity issued from our ATM program, and other unsecured borrowings and secured mortgages. We believe our liquidity and financial condition are sufficient to meet all of our reasonably anticipated cash needs during 2017 including:
• | normal recurring operating expenses; |
• | current debt service requirements, including debt maturities; |
• | recurring capital expenditures; |
• | reposition expenditures; |
• | funding of property developments, redevelopments, acquisitions, and joint venture investments; and, |
• | the minimum dividend payments required to maintain our REIT qualification under the Code. |
Factors which could increase or decrease our future liquidity include but are not limited to volatility in capital and credit markets, and interest rates, changes in sources of financing, the satisfaction of REIT dividend requirements, our ability to complete asset purchases, sales, or developments, the effect our debt level and changes in credit ratings could have on our cost of funds, and our ability to access capital markets.
Cash Flows
The following is a discussion of our cash flows for the years ended December 31, 2016 and 2015.
Net cash from operating activities was approximately $443.1 million during the year ended December 31, 2016 as compared to approximately $423.2 million during the year ended December 31, 2015. The increase was primarily due to higher net property-level NOI, primarily due to the growth in revenues attributable to increased rental rates from our same store communities and growth in the number of non-same store properties resulting from the stabilization of nine operating properties in 2015 and 2016, the completion and partial lease-up of two operating properties in 2016, and the partial lease-up of two properties under construction at December 31, 2016. The increase was also due to an approximate $10.0 million bonus paid to employees in 2015 relating to the restructuring of the Funds in December 2014. The increase was partially offset by a decrease related to the disposition of 15 operating properties, a retail center, and approximately 19.6 acres of land classified as discontinued operations in 2016, as well as the disposition of three other operating properties, in 2015 and the disposition of one dual-phased operating property and six other operating properties in 2016. See further discussions of our 2016 operations as compared to 2015 in "Results of Operations."
Net cash from investing activities during the year ended December 31, 2016 totaled approximately $690.4 million as compared to net cash used in investing activities of approximately $293.2 million during the year ended December 31, 2015. During 2016, we received approximately $623.0 million, net of expenses, from the sale of 15 operating properties, a retail center, and approximately 19.6 acres of land classified as discontinued operations, as well as approximately $515.8 million, net of expenses, from the sale of one dual-phased operating property and six other properties and one land holding. These cash inflows were partially offset by cash outflows for property development and capital improvements of approximately $343.0 million during 2016 as compared to approximately $411.8 million in 2015, primarily due to the completion of nine operating properties in 2015 and 2016, and the completion of repositions at several of our operating properties. The expenditures related to property development and capital improvements during the years ended December 31, 2016 and 2015 included the following:
December 31, | ||||||||
(in millions) | 2016 | 2015 | ||||||
Expenditures for new development, including land | $ | 220.4 | $ | 285.8 | ||||
Capitalized interest, real estate taxes, and other capitalized indirect costs | 29.8 | 30.9 | ||||||
Reposition expenditures | 23.1 | 31.2 | ||||||
Capital expenditures | 69.7 | 63.9 | ||||||
Total | $ | 343.0 | $ | 411.8 | ||||
During the year ended December 31, 2016, cash outflows also included the purchase of a short-term investment for $100 million. During the year ended December 31, 2015, cash outflows also included $13.8 million relating to capital improvements and reposition expenditures from our discontinued operations. These cash outflows were offset by proceeds of approximately $145.0 million from the sale of three operating properties and two land holdings.
Net cash used in financing activities totaled approximately $904.2 million during the year ended December 31, 2016 as compared to approximately $273.2 million during the year ended December 31, 2015. During 2016, we had net payments of
34
$244.0 million on our unsecured credit facility and other short-term borrowings. We also used approximately $663.4 million to pay distributions to common shareholders and non-controlling interest holders which included the $4.25 per common share special dividend payment made on September 30, 2016. During 2015, we used $250.0 million to repay maturing unsecured notes payable and approximately $3.0 million to pay principal amortization payments. We also used approximately $253.1 million to pay distributions to common shareholders and non-controlling interest holders, and approximately $9.5 million to acquire the remaining non-controlling interests in two consolidated joint ventures. The cash flows for 2015 were partially offset by net proceeds from our unsecured line of credit and other short-term borrowings of $244.0 million.
The following is a discussion of our cash flows for the years ended December 31, 2015 and 2014.
Net cash from operating activities was approximately $423.2 million during the year ended December 31, 2015 as compared to approximately $418.5 million during the year ended December 31, 2014. The increase was primarily due to higher net property-level net operating income, primarily due to the growth in revenues directly attributable to increased rental rates from our same store communities and growth in non-same store properties primarily relating to the acquisition of one operating property in 2014, the stabilization of one operating property in 2014 and five operating properties in 2015, the completion and partial lease-up of three operating properties during the third and fourth quarters of 2015, and the partial lease-up of one property under construction at December 31, 2015. These increases in net cash from operating activities were partially offset by the disposition of five operating properties in 2014 and three operating properties in 2015. These decreases were also due to an approximate $10.0 million bonus paid to employees in 2015 relating to the restructuring of the Funds in December 2014, as well as the timing of the first interest payment relating to the $250 million, 3.68% unsecured notes issued in September 2014, which was made in the first quarter of 2015. See further discussions of our 2015 operations as compared to 2014 in "Results of Operations."
Net cash used in investing activities during the year ended December 31, 2015 totaled approximately $293.2 million as compared to approximately $326.6 million during the year ended December 31, 2014. Cash outflows for property development and capital improvements from continuing operations were approximately $411.8 million during 2015 as compared to approximately $497.1 million during 2014, primarily due to the completion of nine operating properties in 2014 and 2015, and the completion of repositions at several of our operating properties. The expenditures related to property development and capital improvements during the years ended December 31, 2015 and 2014 included the following:
December 31, | ||||||||
(in millions) | 2015 | 2014 | ||||||
Expenditures for new development, including land | $ | 285.8 | $ | 342.1 | ||||
Capitalized interest, real estate taxes, and other capitalized indirect costs | 30.9 | 34.1 | ||||||
Reposition expenditures | 31.2 | 64.4 | ||||||
Capital expenditures | 63.9 | 56.5 | ||||||
Total | $ | 411.8 | $ | 497.1 | ||||
During the year ended December 31, 2015, cash outflows also included approximately $13.8 million relating to capital improvements and reposition expenditures from our discontinued operations. These cash outflows were offset by proceeds, net of expenses, of approximately $145.0 million from the sale of three operating properties and two land holdings. Additional cash outflows for the year ended December 31, 2014 related to the acquisition of one operating property for approximately $62.3 million and capital improvements from our discontinued operations of approximately $6.2 million. Net cash used in investing activities during the year ended December 31, 2014 was partially offset by cash inflows of approximately $237.6 million, net of expenses, from the sale of five operating properties and four land holdings in 2014, and the distributions received from our joint ventures of approximately $6.4 million relating to the sale of two operating properties in February 2014.
Net cash used in financing activities totaled approximately $273.2 million during the year ended December 31, 2015 as compared to net cash provided by financing activities of $43.5 million during the year ended December 31, 2014. During 2015, we used $250.0 million to repay maturing unsecured notes payable and approximately $3.0 million to pay principal amortization payments. We also used approximately $253.1 million to pay distributions to common shareholders and non-controlling interest holders, and approximately $9.5 million to acquire the remaining non-controlling interests in two fully consolidated joint ventures. The cash flows for the year ended December 31, 2015 were partially offset by net proceeds from our unsecured line of credit and other short-term borrowings of approximately $244.0 million. During 2014, we received net proceeds of approximately $248.1 million from the issuance in September 2014 of $250.0 million unsecured notes payable and net proceeds of approximately $66.2 million from the issuance of approximately 0.9 million common shares from our ATM program. The cash inflows during 2014 were partially offset by approximately $236.5 million used for distributions paid to common shareholders and non-controlling interest holders, approximately $32.3 million used to repay maturing secured mortgage notes payable, and approximately $4.0 million used for principal amortization payments.
35
Financial Flexibility
We have a $600.0 million unsecured credit facility which matures in August 2019, with two six-month options to extend the maturity date at our election to August 2020. Additionally, we have the option to further increase our credit facility to $900.0 million by either adding additional banks to the facility or obtaining the agreement of the existing banks to increase their commitments. The interest rate on this credit facility is based upon the London Interbank Offered Rate ("LIBOR") plus a margin which is subject to change as our credit ratings change. Advances under this credit facility may be priced at the scheduled rates, or we may enter into bid rate loans with participating banks at rates below the scheduled rates. These bid rate loans have terms of 180 days or less and may not exceed the lesser of $300.0 million or the remaining amount available under the credit facility. Our credit facility is subject to customary financial covenants and limitations. We believe we are in compliance with all such financial covenants and limitations on the date of this filing.
Our credit facility provides us with the ability to issue up to $50.0 million in letters of credit. While our issuance of letters of credit does not increase our borrowings outstanding under our credit facility, it does reduce the amount available. At December 31, 2016, we had no balances outstanding on our $600.0 million credit facility and we had outstanding letters of credit totaling approximately $12.7 million, leaving approximately $587.3 million available under our credit facility.
We currently have an automatic shelf registration statement which allows us to offer, from time to time, common shares, preferred shares, debt securities, or warrants. Our Amended and Restated Declaration of Trust provides we may issue up to 185 million shares of beneficial interest, consisting of 175 million common shares and 10 million preferred shares. At December 31, 2016 we had approximately 87.5 million common shares outstanding, net of treasury shares and shares held in our deferred compensation arrangements, and no preferred shares outstanding.
In November 2014, we created an at-the-market share offering program (the "ATM program") through which we can, but have no obligation to, sell common shares having an aggregate offering price of up to $331.3 million in amounts and at times as we determine, into the existing trading market at current market prices as well as through negotiated transactions. Actual sales from time to time may depend on a variety of factors including, among others, market conditions, the trading price of our common shares, and determinations by management of the appropriate sources of funding for us. We intend to use the net proceeds from any future sales under the ATM program for general corporate purposes, which may include reducing future borrowings under our unsecured credit facility, the repayment of other indebtedness, the redemption or other repurchase of outstanding debt or equity securities, funding for development, redevelopment and investment projects and financing for acquisitions. As of the date of this filing, we had common shares having an aggregate offering price of up to $315.3 million remaining available for sale under the ATM program.
We believe our ability to access capital markets is enhanced by our senior unsecured debt ratings by Moody’s, Fitch, and Standard and Poor's, which are currently A3 with stable outlook, A- with stable outlook, and BBB+ with stable outlook, respectively. We believe our ability to access capital markets is also enhanced by our ability to borrow on a secured basis from various institutions including banks, Fannie Mae, Freddie Mac, or life insurance companies. However, we may not be able to maintain our current credit ratings and may not be able to borrow on a secured or unsecured basis in the future.
Future Cash Requirements and Contractual Obligations
One of our principal long-term liquidity requirements includes the repayment of maturing debt, including any future borrowings under our unsecured credit facility. We believe payments of debt in 2017 are manageable at approximately $276.0 million which represents approximately 11.1% of our total outstanding debt, and includes scheduled principal amortization of approximately $1.2 million. See Note 9, “Notes Payable,” in the notes to Consolidated Financial Statements for further discussion of scheduled maturities.
We estimate the additional cost to complete the construction of the seven consolidated projects to be approximately $240.6 million. Of this amount, we expect to incur costs between approximately $150 million and $170 million during 2017 and to incur the remaining costs during 2018 and 2019. Additionally, we expect to incur costs between approximately $20 million and $30 million related to the start of new development activities, between approximately $24 million and $28 million of additional redevelopment expenditures and between approximately $60 million and $64 million of additional recurring capital expenditures during 2017.
We anticipate meeting our near-term liquidity requirements through a combination of one or more of the following: cash and cash equivalents, short-term investments, cash flows generated from operations, draws on our unsecured credit facility, proceeds from property dispositions, the use of debt and equity offerings under our automatic shelf registration statement, equity issued from our ATM program, other unsecured borrowings, and secured mortgages. We continue to evaluate our operating properties and land development portfolio and plan to continue our practice of selective dispositions as market conditions warrant and opportunities arise.
36
As a REIT, we are subject to a number of organizational and operational requirements, including a requirement to distribute current dividends to our shareholders equal to a minimum of 90% of our annual taxable income. In order to minimize paying income taxes, our general policy is to distribute at least 100% of our taxable income. In September 2016, our Board of Trust Managers also declared a special dividend of $4.25 per common share to our common shareholders of record as of September 23, 2016, which was paid on September 30, 2016. The special dividend consisted of gains on dispositions of assets completed in 2016 and enabled us to distribute 100% of our taxable income; we also paid equivalent amounts per unit to holders of the common operating partnership units. In December 2016, we announced our Board of Trust Managers had declared a quarterly dividend of $0.75 per common share to our common shareholders of record as of December 16, 2016. This dividend was subsequently paid on January 17, 2017 and we paid equivalent amounts per unit to holders of common operating partnership units. Excluding the special dividend and aggregated with previous 2016 dividends, this distribution to common shareholders and holders of the common operating partnership units equates to an annual dividend rate of $3.00 per share or unit for the year ended December 31, 2016.
In the first quarter of 2017, the Company's Board of Trust Managers maintained the $0.75 quarterly dividend rate per common share. Future dividend payments are paid at the discretion of the Board of Trust Managers and depend on cash flows generated from operations, the Company's financial condition and capital requirements, distribution requirements under the REIT provisions of the Internal Revenue Code of 1986, as amended, and other factors which may be deemed relevant by our Board of Trust Managers. Assuming similar dividend distributions for the remainder of 2017, our annualized dividend rate for 2017 would be $3.00.
The following table summarizes our known contractual cash obligations as of December 31, 2016:
(in millions) | Total | 2017 | 2018 | 2019 | 2020 | 2021 | Thereafter | ||||||||||||||||||||
Debt maturities (1)(2) | $ | 2,480.6 | $ | 276.0 | $ | 173.8 | $ | 643.2 | $ | (1.1 | ) | $ | 249.1 | $ | 1,139.6 | ||||||||||||
Interest payments (2)(3) | 454.1 | 98.3 | 89.1 | 63.2 | 55.4 | 49.1 | 99.0 | ||||||||||||||||||||
Non-cancelable lease payments | 21.7 | 2.9 | 2.7 | 2.5 | 2.5 | 2.5 | 8.6 | ||||||||||||||||||||
Unfunded commitments under notes receivable | 0.8 | 0.8 | — | — | — | — | — | ||||||||||||||||||||
$ | 2,957.2 | $ | 378.0 | $ | 265.6 | $ | 708.9 | $ | 56.8 | $ | 300.7 | $ | 1,247.2 | ||||||||||||||
(1) | Includes scheduled principal payments and amortization of debt discounts and debt issuance costs. |
(2) | Subsequent to December 31, 2016, we gave notice of advance repayment on our tax-exempt secured note payable of approximately $30.7 million in February 2017, which was initially due to mature in 2028. This table reflects this repayment in 2017. |
(3) | Includes contractual interest payments for our senior unsecured notes and secured notes. The interest payments on certain secured notes with floating interest rates were calculated based on the interest rates in effect as of December 31, 2016. |
Off-Balance Sheet Arrangements
The joint ventures in which we have an interest have been funded in part with secured, third-party debt. At December 31, 2016, our unconsolidated joint ventures had outstanding debt of approximately $518.7 million, of which our proportionate share was approximately $162.4 million. As of December 31, 2016, we had no outstanding guarantees related to the loans of our unconsolidated joint ventures.
Inflation
Substantially all of our apartment leases are for a term generally ranging from six to eighteen months. In an inflationary environment, we may realize increased rents at the commencement of new leases or upon the renewal of existing leases. We believe the short-term nature of our leases generally minimizes our risk from the adverse effects of inflation.
Critical Accounting Policies
The preparation of our financial statements in conformity with GAAP requires management to make certain estimates and assumptions. These estimates and assumptions affect the reported amounts of assets and liabilities, the disclosures of contingent assets and liabilities at the balance sheet date, and the amounts of revenues and expenses recognized during the reporting period. These estimates are based on historical experience and other assumptions believed to be reasonable under the circumstances. The following is a discussion of our critical accounting policies. For a discussion of all of our significant accounting policies, see Note 2 to the accompanying consolidated financial statements.
Principles of Consolidation. We may enter into various joint venture agreements with unrelated third parties to hold or develop real estate assets. We must determine for each of these joint ventures whether to consolidate the entity or account for our investment under the equity or cost basis of accounting. Investments acquired or created are evaluated based on the
37
accounting guidance relating to variable interest entities (“VIEs”), which requires the consolidation of VIEs in which we are considered to be the primary beneficiary. If the investment is determined not to be a VIE, then the investment is evaluated for consolidation primarily using a voting interest model. In determining if we have a controlling financial interest, we consider factors such as ownership interests, authority to make decisions, kick-out rights and participating rights. We evaluate our accounting for investments on a quarterly basis or when a reconsideration event (as defined by GAAP) with respect to our investments occurs. The analysis required to identify VIEs and primary beneficiaries is complex and requires substantial management judgment.
Asset Impairment. Long-lived assets are reviewed for impairment annually or whenever events or changes in circumstances indicate the carrying amount of an asset may not be recoverable. Impairment may exist if estimated future undiscounted cash flows associated with long-lived assets are not sufficient to recover the carrying value of such assets. We consider projected future undiscounted cash flows, trends, strategic decisions regarding future development plans, and other factors in our assessment of whether impairment conditions exist. While we believe our estimates of future cash flows are reasonable, different assumptions regarding a number of factors, including market rents, economic conditions, and occupancies, could significantly affect these estimates. In estimating fair value, management uses appraisals, management estimates, and discounted cash flow calculations which utilize inputs from a marketplace participant’s perspective. When impairment exists, the long-lived asset is adjusted to its fair value. In addition, we evaluate our equity investments in joint ventures and if we believe there is an other than temporary decline in market value of our investment below our carrying value, we will record an impairment charge.
The value of our properties under development depends on market conditions, including estimates of the project start date as well as estimates of demand for multifamily communities. We have reviewed market trends and other marketplace information and have incorporated this information as well as our current outlook into the assumptions we use in our impairment analyses. Due to the judgment and assumptions applied in the impairment analyses, it is possible actual results could differ substantially from those estimated.
We believe the carrying value of our operating real estate assets, properties under development, and land is currently recoverable. However, if market conditions deteriorate or if changes in our development strategy significantly affect any key assumptions used in our fair value estimates, we may need to take material charges in future periods for impairments related to existing assets. Any such material non-cash charges could have an adverse effect on our consolidated financial position and results of operations.
Cost Capitalization. Real estate assets are carried at cost plus capitalized carrying charges. Carrying charges are primarily interest and real estate taxes which are capitalized as part of properties under development. Capitalized interest is generally based on the weighted average interest rate of our unsecured debt. Expenditures directly related to the development and improvement of real estate assets are capitalized at cost as land and buildings and improvements. Indirect development costs, including salaries and benefits and other related costs directly attributable to the development of properties, are also capitalized. We begin capitalizing development, construction, and carrying costs when the development of the future real estate asset is probable and activities necessary to prepare the underlying real estate for its intended use have been initiated. All construction and carrying costs are capitalized and reported in the balance sheet as properties under development until the apartment homes are substantially completed. Upon substantial completion of the apartment homes, the total capitalized development cost for the apartment homes and the associated land is transferred to buildings and improvements and land, respectively. Included in capitalized costs are indirect costs associated with our development and redevelopment activities. The estimates used by management require judgment, and accordingly we believe cost capitalization to be a critical accounting estimate.
Recent Accounting Pronouncements
See Note 2, "Summary of Significant Accounting Policies and Recent Accounting Pronouncements" in the notes to Consolidated Financial Statements for further discussion of recent accounting pronouncements issued during the year ended December 31, 2016.
Item 7A. Quantitative and Qualitative Disclosures About Market Risk
We are exposed to certain market risks inherent in our operations. These risks generally arise from transactions entered into in the normal course of business. We believe our primary market risk exposure relates to interest rate risk. Derivatives are not entered into for speculative purposes.
38
The table below provides information about our liabilities sensitive to changes in interest rates as of December 31, 2016 and 2015.
December 31, 2016 | December 31, 2015 | ||||||||||||||||||||||||
Amount (in millions) | Weighted Average Maturity (in years) | Weighted Average Interest Rate | % Of Total | Amount (in millions) | Weighted Average Maturity (in years) | Weighted Average Interest Rate | % Of Total | ||||||||||||||||||
Fixed rate debt | $ | 2,274.9 | 5.0 | 4.7 | % | 91.7 | % | $ | 2,273.3 | 6.0 | 4.7 | % | 83.4 | % | |||||||||||
Variable rate debt | 205.7 | 3.2 | 1.4 | 8.3 | 451.4 | 3.8 | 1.2 | % | 16.6 | % | |||||||||||||||
We have historically used variable rate indebtedness available under our unsecured credit facility and other short-term borrowings to initially fund acquisitions and our development pipeline. To the extent we utilize our unsecured credit facility and increase our variable rate indebtedness, our exposure to increases in interest rates will also increase.
For fixed rate debt, interest rate changes affect the fair market value but do not impact net income attributable to common shareholders or cash flows. Conversely, for floating rate debt, interest rate changes generally do not affect the fair market value but do impact net income attributable to common shareholders and cash flows, assuming other factors are held constant. Holding other variables constant, a one percentage point variance in interest rates would change the unrealized fair market value of the fixed rate debt by approximately $99.2 million. The net income attributable to common shareholders and cash flows impact on the next year resulting from a one percentage point variance in interest rates on floating rate debt would be approximately $2.1 million, holding all other variables constant.
39
Item 8. Financial Statements and Supplementary Data
Our response to this item is included in a separate section at the end of this report beginning on page F-1.
Item 9. Changes in and Disagreements with Accountants on Accounting and Financial Disclosure
None.
Item 9A. Controls and Procedures
Evaluation of Disclosure Controls and Procedures. We carried out an evaluation, under the supervision and with the participation of our management, including the Chief Executive Officer and Chief Financial Officer, of the effectiveness of our disclosure controls and procedures as of the end of the period covered by this report pursuant to Securities Exchange Act ("Exchange Act") Rules 13a-15(e) and 15d-15(e). Based on the evaluation, the Chief Executive Officer and Chief Financial Officer concluded the disclosure controls and procedures as of the end of the period covered by this report are effective to ensure information required to be disclosed by us in our Exchange Act filings is accurately recorded, processed, summarized, and reported within the periods specified in the Securities and Exchange Commission's rules and forms and is accumulated and communicated to our management, including our Chief Executive Officer and Chief Financial Officer, as appropriate to allow timely decisions regarding required disclosure.
Changes in Internal Controls. There were no changes in our internal control over financial reporting (identified in connection with the evaluation required by paragraph (d) in Rules 13a-15 and 15d-15 under the Exchange Act) during our most recent fiscal quarter which have materially affected, or are reasonably likely to materially affect, our internal control over financial reporting.
40
Management’s Report on Internal Control over Financial Reporting
Our management is responsible for establishing and maintaining adequate internal control over financial reporting. Internal control over financial reporting is defined in Rule 13a-15(f) and 15d-15(f) promulgated under the Securities Exchange Act of 1934 as follows:
A process designed by, or under the supervision of, the Company’s principal executive and principal financial officers, or persons performing similar functions, and effected by the Company's board of trust managers, management, and other personnel, to provide reasonable assurance regarding the reliability of financial reporting and the preparation of financial statements for external purposes in accordance with generally accepted accounting principles and includes those policies and procedures that:
• | Pertain to the maintenance of records that, in reasonable detail, accurately and fairly reflect the transactions and dispositions of the assets of the Company; |
• | Provide reasonable assurance that transactions are recorded as necessary to permit preparation of financial statements in accordance with generally accepted accounting principles, and receipts and expenditures of the Company are being made only in accordance with authorizations of management and Board of Trust Managers of the Company; and |
• | Provide reasonable assurance regarding prevention or timely detection of unauthorized acquisition, use, or disposition of the Company’s assets that could have a material effect on the financial statements. |
Management assessed the effectiveness of our internal control over financial reporting as of December 31, 2016. In making this assessment, management used the criteria established in Internal Control — Integrated Framework (2013) issued by the Committee of Sponsoring Organizations of the Treadway Commission.
Based on our assessment, management concluded our internal control over financial reporting is effective as of December 31, 2016.
Deloitte & Touche LLP, an independent registered public accounting firm, has issued an attestation report regarding the effectiveness of our internal control over financial reporting, which is included herein.
February 13, 2017
41
REPORT OF INDEPENDENT REGISTERED PUBLIC ACCOUNTING FIRM
To the Board of Trust Managers and Shareholders of
Camden Property Trust
Houston, Texas
We have audited the internal control over financial reporting of Camden Property Trust and subsidiaries (the “Company”) as of December 31, 2016, based on criteria established in Internal Control — Integrated Framework (2013) issued by the Committee of Sponsoring Organizations of the Treadway Commission. The Company’s management is responsible for maintaining effective internal control over financial reporting and for its assessment of the effectiveness of internal control over financial reporting, included in the accompanying Management’s Report on Internal Control over Financial Reporting. Our responsibility is to express an opinion on the Company's internal control over financial reporting based on our audit.
We conducted our audit in accordance with the standards of the Public Company Accounting Oversight Board (United States). Those standards require that we plan and perform the audit to obtain reasonable assurance about whether effective internal control over financial reporting was maintained in all material respects. Our audit included obtaining an understanding of internal control over financial reporting, assessing the risk that a material weakness exists, testing and evaluating the design and operating effectiveness of internal control based on the assessed risk, and performing such other procedures as we considered necessary in the circumstances. We believe that our audit provides a reasonable basis for our opinion.
A company's internal control over financial reporting is a process designed by, or under the supervision of, the company’s principal executive and principal financial officers, or persons performing similar functions, and effected by the company’s board of trust managers, management, and other personnel to provide reasonable assurance regarding the reliability of financial reporting and the preparation of financial statements for external purposes in accordance with generally accepted accounting principles. A company’s internal control over financial reporting includes those policies and procedures that (1) pertain to the maintenance of records that, in reasonable detail, accurately and fairly reflect the transactions and dispositions of the assets of the company; (2) provide reasonable assurance that transactions are recorded as necessary to permit preparation of financial statements in accordance with generally accepted accounting principles, and that receipts and expenditures of the company are being made only in accordance with authorizations of management and the board of trust managers of the company; and (3) provide reasonable assurance regarding prevention or timely detection of unauthorized acquisition, use, or disposition of the company's assets that could have a material effect on the financial statements.
Because of the inherent limitations of internal control over financial reporting, including the possibility of collusion or improper management override of controls, material misstatements due to error or fraud may not be prevented or detected on a timely basis. Also, projections of any evaluation of the effectiveness of the internal control over financial reporting to future periods are subject to the risk that the controls may become inadequate because of changes in conditions, or that the degree of compliance with the policies or procedures may deteriorate.
In our opinion, the Company maintained, in all material respects, effective internal control over financial reporting as of December 31, 2016, based on the criteria established in Internal Control — Integrated Framework (2013) issued by the Committee of Sponsoring Organizations of the Treadway Commission.
We have also audited, in accordance with the standards of the Public Company Accounting Oversight Board (United States), the consolidated financial statements and financial statement schedules as of and for the year ended December 31, 2016 of the Company and our report dated February 13, 2017 expressed an unqualified opinion on those financial statements and financial statement schedules.
/s/ DELOITTE & TOUCHE LLP
Houston, Texas
February 13, 2017
42
Item 9B. Other Information
None.
PART III
Item 10. Directors, Executive Officers, and Corporate Governance
Information with respect to this Item 10 is incorporated by reference from our Proxy Statement, which we expect to file on or about March 24, 2017 in connection with the Annual Meeting of Shareholders to be held on or about May 12, 2017.
Item 11. Executive Compensation
Information with respect to this Item 11 is incorporated by reference from our Proxy Statement, which we expect to file on or about March 24, 2017 in connection with the Annual Meeting of Shareholders to be held on or about May 12, 2017.
Item 12. Security Ownership of Certain Beneficial Owners and Management and Related Shareholder Matters
Information with respect to this Item 12 is incorporated by reference from our Proxy Statement, which we expect to file on or about March 24, 2017 in connection with the Annual Meeting of Shareholders to be held on or about May 12, 2017 to the extent not set forth below.
The following table gives information about the equity compensation plans as of December 31, 2016.
Equity Compensation Plan Information
Plan Category | Number of securities to be issued upon exercise of outstanding options, warrants and rights (a) | Weighted-average exercise price of outstanding options, warrants and rights (b) | Number of securities remaining available for future issuance under equity compensation plans (excluding securities reflected in column (a))(c) | ||||||
Equity compensation plans approved by security holders | 105,066 | $ | 48.27 | 1,057,960 | |||||
Equity compensation plans not approved by security holders | — | — | — | ||||||
Total | 105,066 | $ | 48.27 | 1,057,960 | |||||
Incentive Compensation. During the second quarter of 2011, our Board of Trust Managers adopted, and our shareholders approved, the 2011 Share Incentive Plan of Camden Property Trust (as amended, the “2011 Share Plan”). Under the 2011 Share Plan, we may issue up to a total of approximately 9.1 million fungible units (the “Fungible Pool Limit”), which is comprised of approximately 5.8 million new fungible units plus approximately 3.3 million fungible units previously available for issuance under our 2002 share incentive plan based on a 3.45 to 1.0 fungible unit to full value award conversion ratio. Fungible units represent the baseline for the number of shares available for issuance under the 2011 Share Plan. Different types of awards are counted differently against the Fungible Pool Limit, as follows:
• | Each share issued or to be issued in connection with an award, other than an option, right or other award which does not deliver the full value at grant of the underlying shares, will be counted against the Fungible Pool Limit as 3.45 fungible pool units; |
• | Options and other awards which do not deliver the full value at grant of the underlying shares and which expire more than five years from date of grant will be counted against the Fungible Pool Limit as one fungible pool unit; and |
• | Options, rights and other awards which do not deliver the full value at grant and expire five years or less from the date of grant will be counted against the Fungible Pool Limit as 0.83 of a fungible pool unit. |
At December 31, 2016, approximately 3.6 million fungible units were available under the 2011 Share Plan, which results in approximately 1.1 million common shares which may be granted pursuant to full value awards based on the 3.45 to 1.0 fungible unit to full value award conversion ratio.
Item 13. Certain Relationships and Related Transactions, and Director Independence
Information with respect to this Item 13 is incorporated herein by reference from our Proxy Statement, which we expect to file on or about March 24, 2017 in connection with the Annual Meeting of Shareholders to be held on or about May 12, 2017.
43
Item 14. Principal Accounting Fees and Services
Information with respect to this Item 14 is incorporated herein by reference from our Proxy Statement, which we expect to file on or about March 24, 2017 in connection with the Annual Meeting of Shareholders to be held on or about May 12, 2017.
PART IV
Item 15. Exhibits and Financial Statement Schedules
The following documents are filed as part of this report:
(1) Financial Statements: | |
(2) Financial Statement Schedules: | |
All other schedules have been omitted since the required information is presented in the financial statements and the related notes or is not applicable.
(3) Index to Exhibits:
The following exhibits are filed as part of or incorporated by reference into this report:
Exhibit No. | Description | Filed Herewith or Incorporated Herein by Reference (1) | ||
3.1 | Amended and Restated Declaration of Trust of Camden Property Trust | Exhibit 3.1 to Form 10-K for the year ended December 31, 1993 | ||
3.2 | Amendment to the Amended and Restated Declaration of Trust of Camden Property Trust | Exhibit 3.1 to Form 10-Q for the quarter ended June 30, 1997 | ||
3.3 | Amendment to the Amended and Restated Declaration of Trust of Camden Property Trust | Exhibit 3.1 to Form 8-K filed on May 14, 2012 | ||
3.4 | Third Amended and Restated Bylaws of Camden Property Trust | Exhibit 99.1 to Form 8-K filed on March 11, 2013 | ||
4.1 | Specimen certificate for Common Shares of Beneficial Interest | Form S-11 filed on September 15, 1993 (Registration No. 33-68736) | ||
4.2 | Indenture for Senior Debt Securities dated as of February 11, 2003 between Camden Property Trust and U. S. Bank National Association, as successor to SunTrust Bank, as Trustee | Exhibit 4.1 to Form S-3 filed on February 12, 2003 (Registration No. 333-103119) | ||
4.3 | First Supplemental Indenture dated as of May 4, 2007 between the Company and U.S. Bank National Association, as successor to SunTrust Bank, as Trustee | Exhibit 4.2 to Form 8-K filed on May 7, 2007 | ||
44
Exhibit No. | Description | Filed Herewith or Incorporated Herein by Reference (1) | ||
4.4 | Second Supplemental Indenture dated as of June 3, 2011 between the Company and U.S. Bank National Association, as successor to SunTrust Bank, as Trustee | Exhibit 4.3 to Form 8-K filed on June 3, 2011 | ||
4.5 | Registration Rights Agreement dated as of February 28, 2005 between Camden Property Trust and the holders named therein | Form S-4 filed on November 24, 2004 (Registration No. 333-120733) | ||
4.6 | Form of Camden Property Trust 5.700% Note due 2017 | Exhibit 4.3 to Form 8-K filed on May 7, 2007 | ||
4.7 | Form of Camden Property Trust 4.625% Note due 2021 | Exhibit 4.4 to Form 8-K filed on May 31, 2011 | ||
4.8 | Form of Camden Property Trust 2.95% Note due 2022 | Exhibit 4.4 to Form 8-K filed on December 7, 2012 | ||
4.9 | Form of Camden Property Trust 4.875% Note due 2023 | Exhibit 4.5 to Form 8-K filed on May 31, 2011 | ||
4.10 | Form of Camden Property Trust 4.250% Notes due 2024 | Exhibit 4.1 to Form 8-K filed on December 2, 2013 | ||
4.11 | Form of Camden Property Trust 3.50% Notes due 2024 | Exhibit 4.1 to Form 8-K filed on September 12, 2014 | ||
10.1 | Form of Indemnification Agreement between Camden Property Trust and certain of its trust managers and executive officers | Form S-11 filed on July 9, 1993 (Registration No. 33-63588) | ||
10.2 | Second Amended and Restated Employment Agreement dated July 11, 2003 between Camden Property Trust and Richard J. Campo | Exhibit 10.1 to Form 10-Q for the quarter ended June 30, 2003 | ||
10.3 | Second Amended and Restated Employment Agreement dated July 11, 2003 between Camden Property Trust and D. Keith Oden | Exhibit 10.2 to Form 10-Q for the quarter ended June 30, 2003 | ||
10.4 | Form of First Amendment to Second Amended and Restated Employment Agreements, effective as of January 1, 2008, between Camden Property Trust and each of Richard J. Campo and D. Keith Oden | Exhibit 99.1 to Form 8-K filed on November 30, 2007 | ||
10.5 | Second Amendment to Second Amended and Restated Employment Agreement, dated as of March 14, 2008, between Camden Property Trust and D. Keith Oden | Exhibit 99.1 to Form 8-K filed on March 18, 2008 | ||
10.6 | Form of Employment Agreement by and between Camden Property Trust and certain senior executive officers | Exhibit 10.13 to Form 10-K for the year ended December 31, 1996 | ||
10.7 | Second Amended and Restated Employment Agreement, dated November 3, 2008, between Camden Property Trust and H. Malcolm Stewart | Exhibit 99.1 to Form 8-K filed on November 4, 2008 | ||
10.8 | Second Amended and Restated Camden Property Trust Key Employee Share Option Plan (KEYSOP™), effective as of January 1, 2008 | Exhibit 99.5 to Form 8-K filed on November 30, 2007 | ||
10.9 | Amendment No. 1 to Second Amended and Restated Camden Property Trust Key Employee Share Option Plan, effective as of January 1, 2008 | Exhibit 99.1 to Form 8-K filed on December 8, 2008 | ||
10.10 | Form of Amended and Restated Master Exchange Agreement between Camden Property Trust and certain key employees | Exhibit 10.7 to Form 10-K for the year ended December 31, 2003 | ||
10.11 | Form of Amended and Restated Master Exchange Agreement between Camden Property Trust and certain trust managers | Exhibit 10.8 to Form 10-K for the year ended December 31, 2003 | ||
45
Exhibit No. | Description | Filed Herewith or Incorporated Herein by Reference (1) | ||
10.12 | Form of Amended and Restated Master Exchange Agreement between Camden Property Trust and certain key employees | Exhibit 10.9 to Form 10-K for the year ended December 31, 2003 | ||
10.13 | Form of Master Exchange Agreement between Camden Property Trust and certain trust managers | Exhibit 10.10 to Form 10-K for the year ended December 31, 2003 | ||
10.14 | Form of Amendment No. 1 to Amended and Restated Master Exchange Agreement (Trust Managers) effective November 27, 2007 | Exhibit 10.1 to Form 10-Q filed on July 30, 2010 | ||
10.15 | Form of Amendment No. 1 to Amended and Restated Master Exchange Agreement (Key Employees) effective November 27, 2007 | Exhibit 10.2 to Form 10-Q filed on July 30, 2010 | ||
10.16 | Form of Third Amended and Restated Agreement of Limited Partnership of Camden Operating, L.P. | Exhibit 10.1 to Form S-4 filed on February 26, 1997 (Registration No. 333-22411) | ||
10.17 | First Amendment to Third Amended and Restated Agreement of Limited Partnership of Camden Operating, L.P., dated as of February 23, 1999 | Exhibit 99.2 to Form 8-K filed on March 10, 1999 | ||
10.18 | Form of Second Amendment to Third Amended and Restated Agreement of Limited Partnership of Camden Operating, L.P., dated as of August 13, 1999 | Exhibit 10.15 to Form 10-K for the year ended December 31, 1999 | ||
10.19 | Form of Third Amendment to Third Amended and Restated Agreement of Limited Partnership of Camden Operating, L.P., dated as of September 7, 1999 | Exhibit 10.16 to Form 10-K for the year ended December 31, 1999 | ||
10.20 | Form of Fourth Amendment to Third Amended and Restated Agreement of Limited Partnership of Camden Operating, L.P., dated as of January 7, 2000 | Exhibit 10.17 to Form 10-K for the year ended December 31, 1999 | ||
10.21 | Form of Amendment to Third Amended and Restated Agreement of Limited Partnership of Camden Operating, L.P., dated as of December 1, 2003 | Exhibit 10.19 to Form 10-K for the year ended December 31, 2003 | ||
10.22 | Amended and Restated 1993 Share Incentive Plan of Camden Property Trust | Exhibit 10.18 to Form 10-K for the year ended December 31, 1999 | ||
10.23 | Amended and Restated Camden Property Trust 1999 Employee Share Purchase Plan | Exhibit 10.1 to Form 10-Q for the quarter ended June 30, 2014 | ||
10.24 | Amended and Restated 2002 Share Incentive Plan of Camden Property Trust | Exhibit 10.1 to Form 10-Q for the quarter ended March 31, 2002 | ||
10.25 | Amendment to Amended and Restated 2002 Share Incentive Plan of Camden Property Trust | Exhibit 99.1 to Form 8-K filed on May 4, 2006 | ||
10.26 | Amendment to Amended and Restated 2002 Share Incentive Plan of Camden Property Trust, effective as of January 1, 2008 | Exhibit 99.1 to Form 8-K filed on July 29, 2008 | ||
10.27 | Camden Property Trust 2011 Share Incentive Plan, effective as of May 11, 2011 | Exhibit 99.1 to Form 8-K filed on May 12, 2011 | ||
10.28 | Amendment No. 1 to 2011 Share Incentive Plan of Camden Property Trust, dated as of July 31, 2012 | Exhibit 99.1 to Form 8-K filed on August 6, 2012 | ||
10.29 | Amendment No. 2 to the 2011 Share Incentive Plan of Camden Property Trust, dated as of July 30, 2013 | Exhibit 99.1 to Form 8-K filed on August 5, 2013 | ||
10.30 | Amendment No. 3 to the 2011 Share Incentive Plan of Camden Property Trust, dated as of October 28, 2015 | Exhibit 99.1 to Form 8-K filed on October 29, 2015 | ||
46
Exhibit No. | Description | Filed Herewith or Incorporated Herein by Reference (1) | ||
10.31 | Camden Property Trust Short Term Incentive Plan | Exhibit 10.2 to Form 10-Q for the quarter ended March 31, 2002 | ||
10.32 | Second Amended and Restated Camden Property Trust Non-Qualified Deferred Compensation Plan | Exhibit 99.1 to Form 8-K filed on February 21, 2014 | ||
10.33 | Form of Second Amended and Restated Agreement of Limited Partnership of Camden Summit Partnership, L.P. among Camden Summit, Inc., as general partner, and the persons whose names are set forth on Exhibit A thereto | Exhibit 10.4 to Form S-4 filed on November 24, 2004 (Registration No. 333-120733) | ||
10.34 | Form of Tax, Asset and Income Support Agreement among Camden Property Trust, Camden Summit, Inc., Camden Summit Partnership, L.P. and each of the limited partners who has executed a signature page thereto | Exhibit 10.5 to Form S-4 filed on November 24, 2004 (Registration No. 333-120733) | ||
10.35 | Employment Agreement dated February 15, 1999, by and among William B. McGuire, Jr., Summit Properties Inc. and Summit Management Company, as restated on August 24, 2001 | Exhibit 10.1 to Summit Properties Inc.’s Form 10-Q for the quarter ended September 30, 2001 (File No. 000-12792) | ||
10.36 | Amendment Agreement, dated as of June 19, 2004, among William B. McGuire, Jr., Summit Properties Inc. and Summit Management Company | Exhibit 10.8.2 to Summit Properties Inc.’s Form 10-Q for the quarter ended June 30, 2004 (File No. 001-12792) | ||
10.37 | Employment Agreement dated February 15, 1999, by and among William F. Paulsen, Summit Properties Inc. and Summit Management Company, as restated on April 3, 2001 | Exhibit 10.1 to Summit Properties Inc.’s Form 10-Q for the quarter ended June 30, 2001 (File No. 000-12792) | ||
10.38 | Amendment Agreement, dated as of June 19, 2004, among William F. Paulsen, Summit Properties Inc. and Summit Management Company | Exhibit 10.8.2 to Summit Properties Inc.’s Form 10-Q for the quarter ended June 30, 2004 (File No. 001-12792) | ||
10.39 | Separation Agreement, dated as of February 28, 2005, between Camden Property Trust and William B. McGuire, Jr. | Exhibit 99.1 to Form 8-K filed on April 28, 2005 | ||
10.40 | Separation Agreement, dated as of February 28, 2005, between Camden Property Trust and William F. Paulsen | Exhibit 99.2 to Form 8-K filed on April 28, 2005 | ||
10.41 | Master Credit Agreement, dated as of September 24, 2008, among CSP Community Owner, LLC, CPT Community Owner, LLC, and Red Mortgage Capital, Inc. (2) | Exhibit 10.4 to Form 10-Q filed on July 30, 2010 | ||
10.42 | Form of Master Credit Facility Agreement, dated as of April 17, 2009, among Summit Russett, LLC, 2009 CPT Community Owner, LLC, 2009 CUSA Community Owner, LLC, 2009 CSP Community Owner LLC, and 2009 COLP Community Owner, LLC, as borrowers, Camden Property Trust, as guarantor, and Red Mortgage Capital, Inc., as lender (2) | Exhibit 10.5 to Form 10-Q filed on July 30, 2010 | ||
10.43 | Distribution Agency Agreement, dated November 3, 2014, between Camden Property Trust and Jefferies LLC | Exhibit 1.1 to Form 8-K filed on November 5, 2014 | ||
10.44 | Distribution Agency Agreement, dated November 3, 2014, between Camden Property Trust and J.P. Morgan Securities LLC | Exhibit 1.2 to Form 8-K filed on November 5, 2014 | ||
47
Exhibit No. | Description | Filed Herewith or Incorporated Herein by Reference (1) | ||
10.45 | Distribution Agency Agreement, dated November 3, 2014, between Camden Property Trust and Merrill Lynch, Pierce, Fenner & Smith Incorporated | Exhibit 1.3 to Form 8-K filed on November 5, 2014 | ||
10.46 | Distribution Agency Agreement, dated November 3, 2014, between Camden Property Trust and SunTrust Robinson Humphrey, Inc. | Exhibit 1.4 to Form 8-K filed on November 5, 2014 | ||
10.47 | Distribution Agency Agreement, dated November 3, 2014, between Camden Property Trust and Wells Fargo Securities, LLC | Exhibit 1.5 to Form 8-K filed on November 5, 2014 | ||
10.48 | Second Amended and Restated Credit Agreement dated as of August 7, 2015 among Camden Property Trust, Bank of America, N.A., as Administrative Agent, JPMorgan Chase Bank, N.A., as Syndication Agent, Deutsche Bank Securities Inc., PNC Bank National Association, Regions Bank, SunTrust Bank, The Bank of Nova Scotia, U.S. Bank National Association, and Wells Fargo Bank, National Association, as Documentation Agents, Branch Banking and Trust Company, Credit Suisse AG, Cayman Islands Branch, and The Bank of Tokyo-Mitsubishi UFJ, LTD., as Managing Agents, and the other lenders party thereto, and Merrill Lynch, Pierce, Fenner & Smith Incorporated, and J.P. Morgan Securities LLC, as Joint Lead Arrangers and Joint Bookrunners | Exhibit 99.1 to Form 8-K filed on August 11, 2015 | ||
12.1 | Statement Regarding Computation of Ratios | Filed Herewith | ||
21.1 | List of Significant Subsidiaries | Filed Herewith | ||
23.1 | Consent of Deloitte & Touche LLP | Filed Herewith | ||
24.1 | Powers of Attorney for Heather J. Brunner, Scott S. Ingraham, Renu Khator, Lewis A. Levey, William B. McGuire, Jr., F. Gardner Parker, William F. Paulsen, Frances Aldrich Sevilla-Sacasa, Steven A. Webster, and Kelvin R. Westbrook | Filed Herewith | ||
31.1 | Certification of Chief Executive Officer pursuant to Rule 13a-14(a) of the Securities Exchange Act | Filed Herewith | ||
31.2 | Certification of Chief Financial Officer pursuant to Rule 13a-14(a) of the Securities Exchange Act | Filed Herewith | ||
32.1 | Certification pursuant to 18 U.S.C. Section 1350, as adopted pursuant to Section 906 of the Sarbanes-Oxley Act of 2002 | Filed Herewith | ||
101.INS | XBRL Instance Document | Filed Herewith | ||
101.SCH | XBRL Taxonomy Extension Schema Document | Filed Herewith | ||
101.CAL | XBRL Taxonomy Extension Calculation Linkbase Document | Filed Herewith | ||
101.DEF | XBRL Taxonomy Extension Definition Linkbase Document | Filed Herewith | ||
101.LAB | XBRL Taxonomy Extension Label Linkbase Document | Filed Herewith | ||
101.PRE | XBRL Taxonomy Extension Presentation Linkbase Document | Filed Herewith | ||
(1) | Unless otherwise indicated, all references to reports or registration statements are to reports or registration statements filed by Camden Property Trust (File No. 1-12110). |
(2) | Portions of the exhibit have been omitted pursuant to a request for confidential treatment. |
48
SIGNATURES
Pursuant to the requirements of Section 13 or 15(d) of the Securities Exchange Act of 1934, Camden Property Trust has duly caused this Report to be signed on its behalf by the undersigned thereunto duly authorized.
February 13, 2017 | CAMDEN PROPERTY TRUST | |||||
By: | /s/ Michael P. Gallagher | |||||
Michael P. Gallagher | ||||||
Senior Vice President — Chief Accounting Officer | ||||||
49
Pursuant to the requirements of the Securities Exchange Act of 1934, this Report has been signed below by the following persons on behalf of Camden Property Trust and in the capacities and on the dates indicated.
Name | Title | Date | ||
/s/ Richard J. Campo | Chairman of the Board of Trust | February 13, 2017 | ||
Richard J. Campo | Managers and Chief Executive Officer (Principal Executive Officer) | |||
/s/ D. Keith Oden | President and Trust Manager | February 13, 2017 | ||
D. Keith Oden | ||||
/s/ Alexander J. Jessett | Executive Vice President - Finance, | February 13, 2017 | ||
Alexander J. Jessett | Chief Financial Officer and Treasurer (Principal Financial Officer) | |||
/s/ Michael P. Gallagher | Senior Vice President - Chief Accounting | February 13, 2017 | ||
Michael P. Gallagher | Officer (Principal Accounting Officer) | |||
* | ||||
Heather J. Brunner | Trust Manager | February 13, 2017 | ||
* | ||||
Scott S. Ingraham | Trust Manager | February 13, 2017 | ||
* | ||||
Renu Khator | Trust Manager | February 13, 2017 | ||
* | ||||
Lewis A. Levey | Trust Manager | February 13, 2017 | ||
* | ||||
William B. McGuire, Jr. | Trust Manager | February 13, 2017 | ||
* | ||||
F. Gardner Parker | Trust Manager | February 13, 2017 | ||
* | ||||
William F. Paulsen | Trust Manager | February 13, 2017 | ||
* | ||||
Frances Aldrich Sevilla-Sacasa | Trust Manager | February 13, 2017 | ||
* | ||||
Steven A. Webster | Trust Manager | February 13, 2017 | ||
* | ||||
Kelvin R. Westbrook | Trust Manager | February 13, 2017 | ||
*By: /s/ Alexander J. Jessett | ||||
Alexander J. Jessett Attorney-in-fact | ||||
50
REPORT OF INDEPENDENT REGISTERED PUBLIC ACCOUNTING FIRM
To the Board of Trust Managers and Shareholders of
Camden Property Trust
Houston, Texas
We have audited the accompanying consolidated balance sheets of Camden Property Trust and subsidiaries (the “Company”) as of December 31, 2016 and 2015, and the related consolidated statements of income and comprehensive income, equity, and cash flows for each of the three years in the period ended December 31, 2016. Our audits also included the financial statement schedules listed in the Index at Item 15. These financial statements and financial statement schedules are the responsibility of the Company's management. Our responsibility is to express an opinion on the financial statements and financial statement schedules based on our audits.
We conducted our audits in accordance with the standards of the Public Company Accounting Oversight Board (United States). Those standards require that we plan and perform the audit to obtain reasonable assurance about whether the financial statements are free of material misstatement. An audit includes examining, on a test basis, evidence supporting the amounts and disclosures in the financial statements. An audit also includes assessing the accounting principles used and significant estimates made by management, as well as evaluating the overall financial statement presentation. We believe that our audits provide a reasonable basis for our opinion.
In our opinion, such consolidated financial statements present fairly, in all material respects, the financial position of Camden Property Trust and subsidiaries as of December 31, 2016 and 2015, and the results of their operations and their cash flows for each of the three years in the period ended December 31, 2016, in conformity with accounting principles generally accepted in the United States of America. Also, in our opinion, such financial statement schedules, when considered in relation to the basic consolidated financial statements taken as a whole, present fairly, in all material respects, the information set forth therein.
We have also audited, in accordance with the standards of the Public Company Accounting Oversight Board (United States), the Company's internal control over financial reporting as of December 31, 2016, based on the criteria established in Internal Control—Integrated Framework (2013) issued by the Committee of Sponsoring Organizations of the Treadway Commission and our report dated February 13, 2017 expressed an unqualified opinion on the Company's internal control over financial reporting.
/s/ DELOITTE & TOUCHE LLP |
Houston, Texas |
February 13, 2017 |
F-1
CAMDEN PROPERTY TRUST
CONSOLIDATED BALANCE SHEETS
December 31, | |||||||
(in thousands, except per share amounts) | 2016 | 2015 | |||||
Assets | |||||||
Real estate assets, at cost | |||||||
Land | $ | 967,375 | $ | 989,247 | |||
Buildings and improvements | 5,967,023 | 5,911,432 | |||||
$ | 6,934,398 | $ | 6,900,679 | ||||
Accumulated depreciation | (1,890,656 | ) | (1,780,694 | ) | |||
Net operating real estate assets | $ | 5,043,742 | $ | 5,119,985 | |||
Properties under development, including land | 442,292 | 486,918 | |||||
Investments in joint ventures | 30,254 | 33,698 | |||||
Discontinued operations held for sale, including land | — | 239,063 | |||||
Total real estate assets | $ | 5,516,288 | $ | 5,879,664 | |||
Accounts receivable – affiliates | 24,028 | 25,100 | |||||
Other assets, net | 142,010 | 116,260 | |||||
Short-term investments | 100,000 | — | |||||
Cash and cash equivalents | 237,364 | 10,617 | |||||
Restricted cash | 8,462 | 5,971 | |||||
Total assets | $ | 6,028,152 | $ | 6,037,612 | |||
Liabilities and equity | |||||||
Liabilities | |||||||
Notes payable | |||||||
Unsecured | $ | 1,583,236 | $ | 1,824,930 | |||
Secured | 897,352 | 899,757 | |||||
Accounts payable and accrued expenses | 137,813 | 133,353 | |||||
Accrued real estate taxes | 49,041 | 45,223 | |||||
Distributions payable | 69,161 | 64,275 | |||||
Other liabilities | 118,959 | 97,814 | |||||
Total liabilities | $ | 2,855,562 | $ | 3,065,352 | |||
Commitments and contingencies (Note 13) | |||||||
Non-qualified deferred compensation share awards | 77,037 | 79,364 | |||||
Equity | |||||||
Common shares of beneficial interest; $0.01 par value per share; 175,000 shares authorized; 100,694 and 100,636 issued; 97,818 and 97,571 outstanding at December 31, 2016 and 2015, respectively | 978 | 976 | |||||
Additional paid-in capital | 3,678,277 | 3,662,864 | |||||
Distributions in excess of net income attributable to common shareholders | (289,180 | ) | (458,577 | ) | |||
Treasury shares, at cost (10,330 and 10,703 common shares, at December 31, 2016 and 2015, respectively) | (373,339 | ) | (386,793 | ) | |||
Accumulated other comprehensive loss | (1,863 | ) | (1,913 | ) | |||
Total common equity | $ | 3,014,873 | $ | 2,816,557 | |||
Non-controlling interests | 80,680 | 76,339 | |||||
Total equity | $ | 3,095,553 | $ | 2,892,896 | |||
Total liabilities and equity | $ | 6,028,152 | $ | 6,037,612 | |||
See Notes to Consolidated Financial Statements.
F-2
CAMDEN PROPERTY TRUST
CONSOLIDATED STATEMENTS OF INCOME AND COMPREHENSIVE INCOME
Year Ended December 31, | |||||||||||
(in thousands, except per share amounts) | 2016 | 2015 | 2014 | ||||||||
Property revenues | |||||||||||
Rental revenues | $ | 750,597 | $ | 721,816 | $ | 686,642 | |||||
Other property revenues | 125,850 | 113,802 | 103,621 | ||||||||
Total property revenues | $ | 876,447 | $ | 835,618 | $ | 790,263 | |||||
Property expenses | |||||||||||
Property operating and maintenance | $ | 206,780 | $ | 202,105 | $ | 194,574 | |||||
Real estate taxes | 104,575 | 98,895 | 91,126 | ||||||||
Total property expenses | $ | 311,355 | $ | 301,000 | $ | 285,700 | |||||
Non-property income | |||||||||||
Fee and asset management | $ | 6,864 | $ | 6,999 | $ | 9,832 | |||||
Interest and other income | 2,202 | 597 | 842 | ||||||||
Income (loss) on deferred compensation plans | 5,511 | (264 | ) | 3,937 | |||||||
Total non-property income | $ | 14,577 | $ | 7,332 | $ | 14,611 | |||||
Other expenses | |||||||||||
Property management | $ | 25,125 | $ | 23,055 | $ | 22,070 | |||||
Fee and asset management | 3,848 | 4,742 | 5,341 | ||||||||
General and administrative | 47,415 | 46,233 | 51,005 | ||||||||
Interest | 93,145 | 97,312 | 94,906 | ||||||||
Depreciation and amortization | 250,146 | 240,944 | 222,055 | ||||||||
Expense (benefit) on deferred compensation plans | 5,511 | (264 | ) | 3,937 | |||||||
Total other expenses | $ | 425,190 | $ | 412,022 | $ | 399,314 | |||||
Gain on sale of operating properties, including land | 295,397 | 104,288 | 159,289 | ||||||||
Impairment associated with land holdings | — | — | (1,152 | ) | |||||||
Equity in income of joint ventures | 7,125 | 6,168 | 7,023 | ||||||||
Income from continuing operations before income taxes | $ | 457,001 | $ | 240,384 | $ | 285,020 | |||||
Income tax expense | (1,617 | ) | (1,872 | ) | (1,903 | ) | |||||
Income from continuing operations | $ | 455,384 | $ | 238,512 | $ | 283,117 | |||||
Income from discontinued operations | 7,605 | 19,750 | 18,197 | ||||||||
Gain on sale of discontinued operations, net of tax | 375,237 | — | — | ||||||||
Net income | $ | 838,226 | $ | 258,262 | $ | 301,314 | |||||
Less income allocated to non-controlling interests from continuing operations | (18,403 | ) | (8,947 | ) | (9,225 | ) | |||||
Net income attributable to common shareholders | $ | 819,823 | $ | 249,315 | $ | 292,089 | |||||
See Notes to Consolidated Financial Statements.
F-3
CAMDEN PROPERTY TRUST
CONSOLIDATED STATEMENTS OF INCOME AND COMPREHENSIVE INCOME (Continued)
Year Ended December 31, | |||||||||||
(In thousands, except per share amounts) | 2016 | 2015 | 2014 | ||||||||
Earnings per share – basic | |||||||||||
Earnings per common share from continuing operations | $ | 4.81 | $ | 2.55 | $ | 3.08 | |||||
Earnings per common share from discontinued operations | 4.27 | 0.22 | 0.21 | ||||||||
Total earnings per common share – basic | $ | 9.08 | $ | 2.77 | $ | 3.29 | |||||
Earnings per share – diluted | |||||||||||
Earnings per common share from continuing operations | $ | 4.79 | $ | 2.54 | $ | 3.06 | |||||
Earnings per common share from discontinued operations | 4.26 | 0.22 | 0.21 | ||||||||
Total earnings per common share – diluted | $ | 9.05 | $ | 2.76 | $ | 3.27 | |||||
Weighted average number of common shares outstanding – basic | 89,580 | 89,120 | 88,084 | ||||||||
Weighted average number of common shares outstanding – diluted | 89,903 | 89,490 | 88,468 | ||||||||
Net income attributable to common shareholders | |||||||||||
Income from continuing operations | $ | 455,384 | $ | 238,512 | $ | 283,117 | |||||
Less income allocated to non-controlling interests from continuing operations | (18,403 | ) | (8,947 | ) | (9,225 | ) | |||||
Income from continuing operations attributable to common shareholders | $ | 436,981 | $ | 229,565 | $ | 273,892 | |||||
Income from discontinued operations, including gain on sale | $ | 382,842 | $ | 19,750 | $ | 18,197 | |||||
Net income attributable to common shareholders | $ | 819,823 | $ | 249,315 | $ | 292,089 | |||||
Consolidated Statements of Comprehensive Income | |||||||||||
Net income | $ | 838,226 | $ | 258,262 | $ | 301,314 | |||||
Other comprehensive income | |||||||||||
Unrealized loss on cash flow hedging activities | — | — | (417 | ) | |||||||
Unrealized gain (loss) and unamortized prior service cost on post retirement obligation | (80 | ) | 357 | (970 | ) | ||||||
Reclassification of net loss on cash flow hedging activities, prior service cost and net loss on post retirement obligation | 130 | 149 | 74 | ||||||||
Comprehensive income | $ | 838,276 | $ | 258,768 | $ | 300,001 | |||||
Less income allocated to non-controlling interests from continuing operations | (18,403 | ) | (8,947 | ) | (9,225 | ) | |||||
Comprehensive income attributable to common shareholders | $ | 819,873 | $ | 249,821 | $ | 290,776 | |||||
See Notes to Consolidated Financial Statements.
F-4
CAMDEN PROPERTY TRUST
CONSOLIDATED STATEMENTS OF EQUITY
Common Shareholders | |||||||||||||||||||||||||||
(in thousands, except per share amounts) | Common shares of beneficial interest | Additional paid-in capital | Distributions in excess of net income | Treasury shares, at cost | Accumulated other comprehensive loss | Non-controlling interests | Total equity | ||||||||||||||||||||
Equity, December 31, 2013 | $ | 967 | $ | 3,596,069 | $ | (494,167 | ) | $ | (410,227 | ) | $ | (1,106 | ) | $ | 68,645 | $ | 2,760,181 | ||||||||||
Net income | 292,089 | 9,225 | 301,314 | ||||||||||||||||||||||||
Other comprehensive loss | (1,313 | ) | (1,313 | ) | |||||||||||||||||||||||
Common shares issued (898 shares) | 9 | 66,216 | 66,225 | ||||||||||||||||||||||||
Net share awards | 8,010 | 11,358 | 19,368 | ||||||||||||||||||||||||
Employee share purchase plan | 1,012 | 1,259 | 2,271 | ||||||||||||||||||||||||
Common share options exercised (55 shares) | 1 | 517 | 984 | 1,502 | |||||||||||||||||||||||
Change in classification of deferred compensation plan | (7,702 | ) | (7,702 | ) | |||||||||||||||||||||||
Change in redemption value of non-qualified share awards | (17,921 | ) | (17,921 | ) | |||||||||||||||||||||||
Diversification of share awards within deferred compensation plan | 3,273 | 1,396 | 4,669 | ||||||||||||||||||||||||
Conversions of operating partnership units (1 share) | 52 | (52 | ) | — | |||||||||||||||||||||||
Cash distributions declared to equity holders ($2.64 per share) | (235,174 | ) | (5,011 | ) | (240,185 | ) | |||||||||||||||||||||
Other | (1 | ) | 1 | — | |||||||||||||||||||||||
Equity, December 31, 2014 | $ | 976 | $ | 3,667,448 | $ | (453,777 | ) | $ | (396,626 | ) | $ | (2,419 | ) | $ | 72,807 | $ | 2,888,409 | ||||||||||
Net income | 249,315 | 8,947 | 258,262 | ||||||||||||||||||||||||
Other comprehensive income | 506 | 506 | |||||||||||||||||||||||||
Net share awards | 13,020 | 9,305 | 22,325 | ||||||||||||||||||||||||
Employee share purchase plan | 583 | 528 | 1,111 | ||||||||||||||||||||||||
Common share options exercised | 176 | 176 | |||||||||||||||||||||||||
Change in classification of deferred compensation plan | (10,999 | ) | (10,999 | ) | |||||||||||||||||||||||
Change in redemption value of non-qualified share awards | (3,788 | ) | (3,788 | ) | |||||||||||||||||||||||
Diversification of share awards within deferred compensation plan | 2,134 | 1,423 | 3,557 | ||||||||||||||||||||||||
Conversions of operating partnership units (2 shares) | 86 | (86 | ) | — | |||||||||||||||||||||||
Cash distributions declared to equity holders ($2.80 per share) | (251,750 | ) | (5,309 | ) | (257,059 | ) | |||||||||||||||||||||
Purchase of non-controlling interests | (9,480 | ) | (20 | ) | (9,500 | ) | |||||||||||||||||||||
Other | (104 | ) | (104 | ) | |||||||||||||||||||||||
Equity, December 31, 2015 | $ | 976 | $ | 3,662,864 | $ | (458,577 | ) | $ | (386,793 | ) | $ | (1,913 | ) | $ | 76,339 | $ | 2,892,896 | ||||||||||
See Notes to Consolidated Financial Statements.
F-5
CAMDEN PROPERTY TRUST
CONSOLIDATED STATEMENTS OF EQUITY (Continued)
Common Shareholders | |||||||||||||||||||||||||||
(in thousands, except per share amounts) | Common shares of beneficial interest | Additional paid-in capital | Distributions in excess of net income | Treasury shares, at cost | Accumulated other comprehensive loss | Non-controlling interests | Total equity | ||||||||||||||||||||
Equity, December 31, 2015 | $ | 976 | $ | 3,662,864 | $ | (458,577 | ) | $ | (386,793 | ) | $ | (1,913 | ) | $ | 76,339 | $ | 2,892,896 | ||||||||||
Net income | 819,823 | 18,403 | 838,226 | ||||||||||||||||||||||||
Other comprehensive income | 50 | 50 | |||||||||||||||||||||||||
Net share awards | 15,213 | 9,783 | 24,996 | ||||||||||||||||||||||||
Employee share purchase plan | 944 | 753 | 1,697 | ||||||||||||||||||||||||
Common share options exercised (45 shares) | 1,003 | 2,918 | 3,921 | ||||||||||||||||||||||||
Change in classification of deferred compensation plan | (13,956 | ) | (13,956 | ) | |||||||||||||||||||||||
Change in redemption value of non-qualified share awards | (9,145 | ) | (9,145 | ) | |||||||||||||||||||||||
Diversification of share awards within deferred compensation plan | 11,931 | 13,497 | 25,428 | ||||||||||||||||||||||||
Conversions and redemptions of operating partnership units (8 shares) | 290 | (370 | ) | (80 | ) | ||||||||||||||||||||||
Cash distributions declared to equity holders ($7.25 per share) | (654,778 | ) | (13,692 | ) | (668,470 | ) | |||||||||||||||||||||
Other | 2 | (12 | ) | (10 | ) | ||||||||||||||||||||||
Equity, December 31, 2016 | $ | 978 | $ | 3,678,277 | $ | (289,180 | ) | $ | (373,339 | ) | $ | (1,863 | ) | $ | 80,680 | $ | 3,095,553 | ||||||||||
See Notes to Consolidated Financial Statements.
F-6
CAMDEN PROPERTY TRUST
CONSOLIDATED STATEMENTS OF CASH FLOWS
Year Ended December 31, | |||||||||||
(in thousands) | 2016 | 2015 | 2014 | ||||||||
Cash flows from operating activities | |||||||||||
Net income | $ | 838,226 | $ | 258,262 | $ | 301,314 | |||||
Net income from discontinued operations, including gain on sale | (382,842 | ) | (19,750 | ) | (18,197 | ) | |||||
Adjustments to reconcile net income to net cash from operating activities: | |||||||||||
Depreciation and amortization | 250,146 | 240,944 | 222,055 | ||||||||
Gain on sale of operating properties, including land | (295,397 | ) | (104,288 | ) | (159,289 | ) | |||||
Impairment associated with land holdings | — | — | 1,152 | ||||||||
Distributions of income from joint ventures | 7,057 | 6,387 | 7,399 | ||||||||
Equity in income of joint ventures | (7,125 | ) | (6,168 | ) | (7,023 | ) | |||||
Share-based compensation | 20,123 | 17,674 | 15,552 | ||||||||
Net change in operating accounts and other | 281 | (5,761 | ) | 22,298 | |||||||
Net cash from continuing operating activities | $ | 430,469 | $ | 387,300 | $ | 385,261 | |||||
Net cash from discontinued operating activities | 12,594 | 35,938 | 33,267 | ||||||||
Net cash from operating activities | $ | 443,063 | $ | 423,238 | $ | 418,528 | |||||
Cash flows from investing activities | |||||||||||
Development and capital improvements | $ | (342,952 | ) | $ | (411,799 | ) | $ | (497,124 | ) | ||
Acquisition of operating properties | — | — | (62,260 | ) | |||||||
Proceeds from sales of operating properties, including land | 515,754 | 145,044 | 237,625 | ||||||||
Purchase of short-term investments | (100,000 | ) | — | — | |||||||
Distributions from investments in joint ventures | 3,512 | 2,512 | 6,350 | ||||||||
Other | (6,994 | ) | (15,217 | ) | (4,945 | ) | |||||
Net cash from continuing investing activities | $ | 69,320 | $ | (279,460 | ) | $ | (320,354 | ) | |||
Proceeds from discontinued operations | 622,982 | — | — | ||||||||
Net cash from discontinued investing activities | (1,890 | ) | (13,775 | ) | (6,233 | ) | |||||
Net cash from investing activities | $ | 690,412 | $ | (293,235 | ) | $ | (326,587 | ) | |||
See Notes to Consolidated Financial Statements.
F-7
CAMDEN PROPERTY TRUST
CONSOLIDATED STATEMENTS OF CASH FLOWS (Continued)
Year Ended December 31, | |||||||||||
(in thousands) | 2016 | 2015 | 2014 | ||||||||
Cash flows from financing activities | |||||||||||
Borrowings on unsecured credit facility and other short-term borrowings | $ | 1,305,000 | $ | 1,466,000 | $ | 2,246,000 | |||||
Repayments on unsecured credit facility and other short-term borrowings | (1,549,000 | ) | (1,222,000 | ) | (2,246,000 | ) | |||||
Proceeds from notes payable | — | — | 248,078 | ||||||||
Repayment of notes payable | (3,077 | ) | (253,043 | ) | (36,340 | ) | |||||
Distributions to common shareholders and non-controlling interests | (663,363 | ) | (253,129 | ) | (236,514 | ) | |||||
Purchase of non-controlling interests | — | (9,500 | ) | — | |||||||
Proceeds from issuance of common shares | — | — | 66,225 | ||||||||
Other | 6,203 | (1,559 | ) | 2,033 | |||||||
Net cash from financing activities | $ | (904,237 | ) | $ | (273,231 | ) | $ | 43,482 | |||
Net increase (decrease) in cash, cash equivalents, and restricted cash | 229,238 | (143,228 | ) | 135,423 | |||||||
Cash, cash equivalents, and restricted cash, beginning of year | 16,588 | 159,816 | 24,393 | ||||||||
Cash, cash equivalents, and restricted cash, end of year | $ | 245,826 | $ | 16,588 | $ | 159,816 | |||||
Reconciliation of cash, cash equivalents, and restricted cash to the Consolidated Balance Sheet | |||||||||||
Cash and cash equivalents | $ | 237,364 | $ | 10,617 | $ | 153,918 | |||||
Restricted cash | 8,462 | 5,971 | 5,898 | ||||||||
Total cash, cash equivalents, and restricted cash, end of year | 245,826 | 16,588 | 159,816 | ||||||||
Supplemental information | |||||||||||
Cash paid for interest, net of interest capitalized | $ | 93,302 | $ | 96,179 | $ | 86,711 | |||||
Cash paid for income taxes | 2,424 | 1,889 | 1,658 | ||||||||
Supplemental schedule of noncash investing and financing activities | |||||||||||
Distributions declared but not paid | $ | 69,161 | $ | 64,275 | $ | 60,386 | |||||
Value of shares issued under benefit plans, net of cancellations | 19,006 | 18,336 | 19,310 | ||||||||
Accrual associated with construction and capital expenditures | 22,762 | 24,175 | 22,456 | ||||||||
See Notes to Consolidated Financial Statements.
F-8
NOTES TO CONSOLIDATED FINANCIAL STATEMENTS
1. Description of Business
Business. Formed on May 25, 1993, Camden Property Trust, a Texas real estate investment trust (“REIT”), is primarily engaged in the ownership, management, development, redevelopment, acquisition, and construction of multifamily apartment communities. Our multifamily apartment communities are referred to as “communities,” “multifamily communities,” “properties,” or “multifamily properties” in the following discussion. As of December 31, 2016, we owned interests in, operated, or were developing 159 multifamily properties comprised of 55,366 apartment homes across the United States. Of the 159 properties, seven properties were under construction, and will consist of a total of 2,573 apartment homes when completed. We also own land holdings which we may develop into multifamily communities in the future.
2. Summary of Significant Accounting Policies and Recent Accounting Pronouncements
Principles of Consolidation. Our consolidated financial statements include our accounts and the accounts of other subsidiaries and joint ventures (including partnerships and limited liability companies) over which we have control. All intercompany transactions, balances, and profits have been eliminated in consolidation. Investments acquired or created are evaluated based on the accounting guidance relating to variable interest entities (“VIEs”), which requires the consolidation of VIEs in which we are considered to be the primary beneficiary. If the investment is determined not to be a VIE, then the investment is evaluated for consolidation primarily using a voting interest model. In determining if we have a controlling financial interest, we consider factors such as ownership interests, authority to make decisions, kick-out rights and participating rights. At December 31, 2016, two of our consolidated operating partnerships are VIEs, of which we held between 92% and 94% of the outstanding common limited partnership units and the sole 1% general partnership interest of each consolidated operating partnership. As we are considered the primary beneficiary, we continue to consolidate these operating partnerships.
Acquisitions of Real Estate. Upon acquisition of real estate, we determine the fair value of tangible and intangible assets, which includes land, buildings (as-if-vacant), furniture and fixtures, the value of in-place leases, including above and below market leases, and acquired liabilities. In estimating these values, we apply methods similar to those used by independent appraisers of income-producing property. Upon the acquisition of a controlling interest of an investment in an unconsolidated joint venture, such joint venture is consolidated and our initial equity investment is remeasured to fair value at the date the controlling interest is acquired; any difference between the carrying value of the previously held equity investment and the fair value is recognized in earnings at the time of obtaining control. Upon our adoption of Accounting Standard Update 2017-01 ("ASU 2017-01") on January 1, 2017, as discussed below in Recent Accounting Pronouncements, we believe most future transaction costs relating to acquisition of operating assets will be capitalized. Prior to our adoption of ASU 2017-01 transaction costs associated with the acquisition of operating assets were expensed as incurred. Estimates of fair value of acquired debt are based upon interest rates available for the issuance of debt with similar terms and remaining maturities. Depreciation is computed on a straight-line basis over the remaining useful lives of the related tangible assets. The value of in-place leases and above or below market leases is amortized over the estimated average remaining life of leases in place at the time of acquisition. The net carrying value of below market leases is included in other liabilities in our consolidated balance sheets and the net carrying value of in-place leases is included in other assets, net in our consolidated balance sheets.
Revenues recognized related to below market leases and amortization expense related to in-place leases for the years ended December 31, 2016, 2015 and 2014 are as follows:
December 31, | ||||||||||||
(in millions) | 2016 | 2015 | 2014 | |||||||||
Revenues related to below market leases | $ | — | $ | 0.1 | $ | 0.2 | ||||||
Amortization of in-place leases | $ | — | $ | 0.5 | $ | 1.4 | ||||||
The weighted average amortization period of below market leases and in-place leases was approximately eight months and seven months for the years ended and December 31, 2015 and 2014, respectively. There were no below market leases or in-place leases during the year ended December 31, 2016.
Asset Impairment. Long-lived assets are reviewed for impairment annually or whenever events or changes in circumstances indicate the carrying amount of an asset may not be recoverable. Impairment may exist if estimated future undiscounted cash flows associated with long-lived assets are not sufficient to recover the carrying value of such assets. We consider projected future undiscounted cash flows, trends, strategic decisions regarding future development plans, and other factors in our assessment of whether impairment conditions exist. While we believe our estimates of future cash flows are reasonable, different assumptions regarding a number of factors, including market rents, economic conditions, and occupancies, could significantly affect these estimates. In estimating fair value, management uses appraisals, management estimates, and discounted cash flow calculations which utilize inputs from a marketplace participant’s perspective. When impairment exists,
F-9
the long-lived asset is adjusted to its fair value. In addition, we evaluate our equity investments in joint ventures and if we believe there is an other than temporary decline in market value of our investment below our carrying value, we will record an impairment charge. We did not record any impairment charges for the years ended December 31, 2016 or 2015. See Note 7, "Acquisitions, Dispositions, Impairment, and Discontinued Operations," for discussion of impairment during the year ended December 31, 2014.
The value of our properties under development depends on market conditions, including estimates of the project start date as well as estimates of demand for multifamily communities. We have reviewed market trends and other marketplace information and have incorporated this information as well as our current outlook into the assumptions we use in our impairment analyses. Due to the judgment and assumptions applied in the impairment analyses, it is possible actual results could differ substantially from those estimated.
We believe the carrying value of our operating real estate assets, properties under development, and land is currently recoverable. However, if market conditions deteriorate or if changes in our development strategy significantly affect any key assumptions used in our fair value estimates, we may need to take material charges in future periods for impairments related to existing assets. Any such material non-cash charges could have an adverse effect on our consolidated financial position and results of operations.
Short-term Investments. At December 31, 2016, our short-term investments consists of certificates of deposit which have original maturities of more than three months but less than one year. The carrying value of our short-term investments approximate their fair values due to the short-term nature of these investments.
Cash and Cash Equivalents. All cash and investments in money market accounts and other highly liquid securities with a maturity of three months or less at the date of purchase are considered to be cash and cash equivalents. We maintain the majority of our cash and cash equivalents at major financial institutions in the United States and deposits with these financial institutions may exceed the amount of insurance provided on such deposits; however, we regularly monitor the financial stability of these financial institutions and believe we are not currently exposed to any significant default risk with respect to these deposits.
Cost Capitalization. Real estate assets are carried at cost plus capitalized carrying charges. Carrying charges are primarily interest and real estate taxes which are capitalized as part of properties under development. Capitalized interest is generally based on the weighted average interest rate of our unsecured debt. Expenditures directly related to the development and improvement of real estate assets are capitalized at cost as land and buildings and improvements. Indirect development costs, including salaries and benefits and other related costs directly attributable to the development of properties, are also capitalized. We begin capitalizing development, construction, and carrying costs when the development of the future real estate asset is probable and activities necessary to prepare the underlying real estate for its intended use have been initiated. All construction and carrying costs are capitalized and reported in the balance sheet as properties under development until the apartment homes are substantially completed. As apartment homes within development properties are completed, the total capitalized development cost of each apartment home is transferred from properties under development including land to buildings and improvements.
As discussed above, carrying charges are principally interest and real estate taxes capitalized as part of properties under development. Capitalized interest was approximately $18.2 million, $19.3 million, and $22.2 million for the years ended December 31, 2016, 2015, and 2014, respectively. Capitalized real estate taxes were approximately $4.5 million, $3.6 million, and $4.4 million for the years ended December 31, 2016, 2015, and 2014, respectively.
Where possible, we stage our construction to allow leasing and occupancy during the construction period, which we believe minimizes the duration of the lease-up period following completion of construction. Our accounting policy related to properties in the development and leasing phase is to expense all operating expenses associated with completed apartment homes. We capitalize renovation and improvement costs we believe extend the economic lives of depreciable property. Capital expenditures subsequent to initial construction are capitalized and depreciated over their estimated useful lives.
We also incur expenditures related to renovation and construction of office space we lease and we capitalize these leasehold improvements as furniture, fixtures, equipment and other. We depreciate these costs using the straight-line method over the shorter of the lease term or the useful life of the improvement.
Depreciation and amortization is computed over the expected useful lives of depreciable property on a straight-line basis with lives generally as follows:
F-10
Estimated Useful Life | |
Buildings and improvements | 5-35 years |
Furniture, fixtures, equipment and other | 3-20 years |
Intangible assets/liabilities (in-place leases and below market leases) | underlying lease term |
Discontinued Operations. A property is classified as a discontinued operation when the disposal represents a strategic shift, such as disposal of a major line of business, a major geographical area or a major equity investment. The results of operations for properties sold during the period or classified as held for sale at the end of the period, and meeting the above criteria of discontinued operations, are classified as discontinued operations for all periods presented. The property-specific components of earnings classified as discontinued operations include separately identifiable property-specific revenues, expenses, depreciation, and interest expense, if any. The gain or loss resulting from the eventual disposal of the held for sale properties meeting the criteria of discontinued operations is also classified within discontinued operations. Real estate assets held for sale are measured at the lower of carrying amount or fair value less costs to sell and are presented separately in the accompanying consolidated balance sheets. Subsequent to classification of a property as held for sale, no further depreciation is recorded. Consolidated operating properties sold or classified as held for sale, which do not meet the above criteria of discontinued operations are not included in discontinued operations and the related gains and losses are included in continuing operations. Properties sold by our unconsolidated entities which do not meet the above criteria of discontinued operations are not included in discontinued operations and related gains or losses are reported as a component of equity in income of joint ventures.
Gains on sale of real estate are recognized using the full accrual or partial sale methods, as applicable, in accordance with accounting principles generally accepted in the United States of America ("GAAP"), provided various criteria relating to the terms of sale and any subsequent involvement with the real estate sold are satisfied.
See Note 7, "Acquisitions, Dispositions, Impairment, and Discontinued Operations," for discussion of discontinued operations for the year ended December 31, 2016, 2015 and 2014.
Fair Value. For financial assets and liabilities recorded at fair value on a recurring or non-recurring basis, fair value is the price we would receive to sell an asset, or pay to transfer a liability, in an orderly transaction with a market participant at the measurement date. In the absence of such data, fair value is estimated using internal information consistent with what market participants would use in a hypothetical transaction.
In determining fair value, observable inputs reflect market data obtained from independent sources, while unobservable inputs reflect our market assumptions; preference is given to observable inputs. These two types of inputs create the following fair value hierarchy:
• | Level 1: Quoted prices for identical instruments in active markets. |
• | Level 2: Quoted prices for similar instruments in active markets; quoted prices for identical or similar instruments in markets that are not active; and model-derived valuations whose inputs are observable or whose significant value drivers are observable. |
• | Level 3: Significant inputs to the valuation model are unobservable. |
Recurring Fair Value Measurements. The valuation methodology we use to measure our deferred compensation plan investments is based on quoted market prices utilizing public information for the same transactions. Our deferred compensation plan investments are recorded at fair value on a recurring basis and included in other assets in our consolidated balance sheets.
Non-recurring Fair Value Measurements. Certain assets are measured at fair value on a non-recurring basis. These assets are not measured at fair value on an ongoing basis, but are subject to fair value adjustments in certain circumstances. These assets primarily include long-lived assets which are recorded at fair value if they are impaired using the fair value methodologies used to measure long-lived assets described above at "Asset Impairment." Non-recurring fair value disclosures are not provided for impairments on assets disposed during the period because they are no longer owned by us. The inputs associated with the valuation of long-lived assets are generally included in Level 3 of the fair value hierarchy, unless a quoted price for a similar long-lived asset in an active market exists, at which time they are included in Level 2 of the fair value hierarchy.
Financial Instrument Fair Value Disclosures. As of December 31, 2016 and 2015, the carrying values of cash and cash equivalents, short-term investments, accounts receivable, accounts payable, accrued expenses and distributions payable represent fair value because of the short-term nature of these instruments. The carrying value of restricted cash approximates its fair value based on the nature of our assessment of the ability to recover these amounts. The carrying value of our notes
F-11
receivable, which are included in other assets, net in our consolidated balance sheets, approximates their fair value. The estimated fair values are based on certain factors, such as market interest rates, terms of the note and credit worthiness of the borrower. These financial instruments utilize Level 3 inputs. In calculating the fair value of our notes payable, interest rate and spread assumptions reflect current credit worthiness and market conditions available for the issuance of notes payable with similar terms and remaining maturities. These financial instruments utilize Level 2 inputs.
Income Recognition. Our rental and other property revenue is recorded when due from residents and is recognized monthly as it is earned. Other property revenue consists primarily of utility rebillings and administrative, application, and other transactional fees charged to our residents. Our apartment homes are rented to residents on lease terms generally ranging from six to eighteen months, with monthly payments due in advance. All other sources of income, including interest and fee and asset management income, are recognized as earned. Operations of multifamily properties acquired are recorded from the date of acquisition in accordance with the acquisition method of accounting. In management’s opinion, due to the number of residents, the types and diversity of submarkets in which our properties operate, and the collection terms, there is no significant concentration of credit risk.
Reclassifications. Certain reclassifications have been made to amounts in prior period financial statements to conform to the current period presentation. We reclassified certain insignificant amounts in the consolidated statements of cash flows for the years ended December 31, 2015 and 2014. These reclassifications had no impact on our consolidated cash flows from operating, investing or financing activities. Additionally, we adopted Accounting Standards Update 2016-18 ("ASU 2016-18"), "Statement of Cash Flows: Restricted Cash (a consensus of the Emerging Issues Task Force)." as of December 31, 2016. ASU 2016-18 requires the change in restricted cash to be reported with cash and cash equivalents when reconciling between beginning and ending amounts shown on our consolidated statement of cash flows, and is to be applied retrospectively for all periods presented. See Recent Accounting Pronouncements below for the impact of the reclassifications made in prior periods as a result of our adoption of ASU 2016-18.
Insurance. Our primary lines of insurance coverage are property, general liability, health, and workers’ compensation. We believe our insurance coverage adequately insures our properties against the risk of loss attributable to fire, earthquake, hurricane, tornado, flood, and other perils and adequately insures us against other risks. Losses are accrued based upon our estimates of the aggregate liability for claims incurred using certain actuarial assumptions followed in the insurance industry and based on our experience.
Other Assets, Net. Other assets in our consolidated financial statements include investments under deferred compensation plans, deferred financing costs, non-real estate leasehold improvements and equipment, notes receivable, prepaid expenses, the value of in-place leases net of related accumulated amortization, and other miscellaneous receivables. Investments under deferred compensation plans are classified as trading securities and are adjusted to fair market value at period end. For a further discussion of our investments under deferred compensation plans, see Note 10, “Share-based Compensation and Benefit Plans.” Deferred financing costs are related to our unsecured credit facility and unsecured short-term borrowing facility, and are amortized no longer than the terms of the related facilities on the straight-line method, which approximates the effective interest method. Corporate leasehold improvements and equipment are depreciated using the straight-line method over the shorter of the expected useful lives or the lease terms which generally range from three to ten years.
Our notes receivable relate to real estate secured loans to unaffiliated third parties. At December 31, 2016, we had one outstanding notes receivable balance of approximately $17.2 million and at December 31, 2015, we had two outstanding notes receivable balances of an aggregate of approximately $13.2 million. The weighted average interest rates were approximately 4.1% for each of the years ended December 31, 2016 and 2015, respectively, related to such notes. At December 31, 2016, we were also committed to funding an additional $0.8 million under the note. Interest is recognized over the lives of the notes and is included in interest and other income in our consolidated statements of income and comprehensive income. We consider a note receivable to be impaired if it is probable we will not collect all contractually due principal and interest. We do not accrue interest when a note is considered impaired and an allowance is recorded for any principal and previously accrued interest which is not believed to be collectible. All cash receipts on impaired notes are applied to reduce the principal amount of such notes until the principal has been recovered and, thereafter, are recognized as interest income. There were no impairments as of December 31, 2016 or 2015.
Reportable Segments. We operate in a single reportable segment which includes the ownership, management, development, redevelopment, acquisition, and construction of multifamily apartment communities. Each of our operating properties is considered a separate operating segment as each property earns revenues and incurs expenses, individual operating results are reviewed and discrete financial information is available. We do not distinguish or group our consolidated operations based on geography, size or type. Our multifamily apartment communities have similar long-term economic characteristics and provide similar products and services to our residents. Further, all material operations are within the United States and no multifamily apartment community comprises more than 10% of consolidated revenues. As a result, our operating properties are aggregated into a single reportable segment. Our multifamily communities generate rental revenue and other income through
F-12
the leasing of apartment homes, which comprised approximately 99% of our total property revenues and total non-property income, excluding income on deferred compensation plans, for each of the years ended December 31, 2016, 2015, and 2014.
Restricted Cash. Restricted cash consists of escrow deposits held by lenders for property taxes, insurance and replacement reserves, cash required to be segregated for the repayment of residents’ security deposits, and escrowed amounts related to our development and acquisition activities. Substantially all restricted cash is invested in demand and short-term instruments.
Share-based Compensation. Compensation expense associated with share-based awards is recognized in our consolidated statements of income and comprehensive income using the grant-date fair values. Compensation cost for all share-based awards, including options, requires measurement at estimated fair value on the grant date and recognition of compensation expense over the requisite service period for awards expected to vest. The fair value of stock option grants is estimated using the Black-Scholes valuation model. Valuation models require the input of assumptions, including judgments to estimate the expected stock price volatility, expected life, and forfeiture rate. The compensation cost for share-based awards is based on the market value of the shares on the date of grant.
Use of Estimates. In the application of GAAP, management is required to make estimates and assumptions which affect the reported amounts of assets and liabilities at the date of the financial statements, results of operations during the reporting periods, and related disclosures. Our more significant estimates include estimates supporting our impairment analysis related to the carrying values of our real estate assets. These estimates are based on historical experience and other assumptions believed to be reasonable under the circumstances. Future events rarely develop exactly as forecasted, and the best estimates routinely require adjustment.
Recent Accounting Pronouncements. In the second quarter of 2014, the FASB issued Accounting Standards Update ("ASU") 2014-09 (“ASU 2014-09”), "Revenue from Contracts with Customers." ASU 2014-09 prescribes a single, common revenue standard to replace most existing revenue recognition guidance in GAAP, including most industry-specific requirements. The standard outlines a five-step model whereby revenue is recognized as performance obligations within a contract are satisfied. Several ASUs have been issued since the issuance of ASU 2014-09 which modify certain sections of the new revenue recognition standard, and are intended to promote a more consistent interpretation and application of the principles outlined in the standard. We will adopt ASU 2014-09 effective January 1, 2018 using the modified retrospective with cumulative-effect transition method. We have identified our revenue streams and are in the process of evaluating the impact on our consolidated financial statements and internal accounting processes; however, as the majority of our revenue is derived from real estate lease contracts we do not expect the adoption of ASU 2014-09 or related amendments and modifications by the FASB will have a material impact on our consolidated financial statements.
In February 2016, the FASB issued ASU 2016-02, "Leases" ("ASU 2016-02"). ASU 2016-02 supersedes the current accounting for leases and while retaining two distinct types of leases, finance and operating, (i) requires lessees to record a right of use asset and a related liability for the rights and obligations associated with a lease, regardless of lease classification, and recognize lease expense in a manner similar to current accounting, (ii) eliminates most real estate specific lease provisions, and, (iii) aligns many of the underlying lessor model principles with those in the new revenue standard. ASU 2016-02 is effective for fiscal years beginning after December 15, 2018, and interim periods within. Entities are required to use a modified retrospective approach when transitioning to ASU 2016-02 for leases that exist as of or are entered into after the beginning of the earliest comparative period presented in the financial statements. Early adoption is permitted and we plan to early adopt ASU 2016-02 as of January 1, 2018 in conjunction with the adoption of ASU 2014-09 discussed above. Based on a preliminary assessment, we expect most of our operating lease commitments will be subject to the new guidance and recognized as operating lease liabilities and right-of-use assets upon adoption, resulting in an immaterial increase in the assets and liabilities on our consolidated balance sheets. We are continuing our evaluation, which may identify additional impacts this standard will have on our consolidated financial statements and related disclosures.
In March 2016, the FASB issued ASU 2016-09, "Improvements to Employee Share-Based Payment Accounting." ASU 2016-09 amends several aspects of the accounting for share-based payment transactions, including the income tax consequences, accrual of compensation cost, classification of awards as either equity or liabilities, and classification on the statement of cash flows. ASU 2016-09 is effective for interim and annual periods beginning after December 15, 2016, and early adoption is permitted. The amendments in this standard must be applied prospectively, retrospectively, or as of the beginning of the earliest comparative period presented in the year of adoption, depending on the type of amendment. We adopted ASU 2016-09 as of January 1, 2017, and it will not have a material impact on our consolidated financial statements.
In August 2016, the FASB issued ASU 2016-15, "Classification of Certain Cash Receipts and Cash Payments (a consensus of the Emerging Issues Task Force)." ASU 2016-15 clarifies how several specific cash receipts and cash payments are to be presented and classified on the statement of cash flows, including debt prepayment or debt extinguishment costs,
F-13
settlement of zero-coupon debt instruments, contingent consideration made after a business combination, distributions received from equity method investees, beneficial interests in securitization transactions, and separately identifiable cash flows and application of predominance principle. ASU 2016-15 is effective for interim and annual periods beginning after December 15, 2017, and early adoption is permitted. Each amendment in this standard must be applied prospectively, retrospectively, or as of the beginning of the earliest comparative period presented in the year of adoption, depending on the type of amendment. We expect to adopt ASU 2016-15 as of January 1, 2018, and we are currently evaluating the impact this standard may have on our consolidated financial statements upon adoption.
In November 2016, the FASB issued ASU 2016-18, which requires restricted cash to be presented with cash and cash equivalents when reconciling the beginning and ending amounts in the statements of cash flows. ASU 2016-18 is effective for interim and annual periods beginning after December 15, 2017, and early adoption is permitted. The update should be applied retrospectively to each period presented. We adopted ASU 2016-18 as of December 31, 2016. Prior to our adoption of ASU 2016-18, we reported the change in restricted cash within the investing activities in our consolidated statement of cash flows. As a result of our adoption of ASU 2016-18, cash and cash equivalents in our consolidated statements of cash flows increased by approximately $6.0 million and $5.9 million in 2015 and 2014, respectively, to reflect the restricted cash balances. Additionally, net cash used in investing activities decreased by approximately $0.1 million in 2015 and increased by approximately $0.7 million in 2014.
In January 2017, the FASB issued ASU 2017-01, "Clarifying the Definition of a Business (Topic 805)." ASU 2017-01 clarifies the definition of a business and provides further guidance for evaluating whether a transaction will be accounted for as an acquisition of an asset or a business. ASU 2017-01 is effective for interim and annual periods beginning after December 15, 2017, and early adoption is permitted. The update should be applied prospectively. We adopted ASU 2017-01 as of January 1, 2017 and the adoption did not require any additional disclosures. We believe most of our future acquisitions of operating properties will qualify as asset acquisitions and most future transaction costs associated with these acquisitions will be capitalized.
F-14
3. Per Share Data
Basic earnings per share are computed using net income attributable to common shareholders and the weighted average number of common shares outstanding. Diluted earnings per share reflect common shares issuable from the assumed conversion of common share options and share awards granted and units convertible into common shares. Only those items having a dilutive impact on our basic earnings per share are included in diluted earnings per share. Our unvested share-based awards are considered participating securities and are reflected in the calculation of basic and diluted earnings per share using the two-class method. The number of common share equivalent securities excluded from the diluted earnings per share calculation was approximately 2.4 million, 2.6 million, and 2.8 million for the years ended December 31, 2016, 2015, and 2014, respectively. These securities, which include common share options and share awards granted and units convertible into common shares, were excluded from the diluted earnings per share calculation as they are anti-dilutive.
The following table presents information necessary to calculate basic and diluted earnings per share for the periods indicated:
Year Ended December 31, | ||||||||||||
(in thousands, except per share amounts) | 2016 | 2015 | 2014 | |||||||||
Earnings per common share calculation – basic | ||||||||||||
Income from continuing operations attributable to common shareholders | $ | 436,981 | $ | 229,565 | $ | 273,892 | ||||||
Amount allocated to participating securities | (6,304 | ) | (2,052 | ) | (2,687 | ) | ||||||
Income from continuing operations attributable to common shareholders, net of amount allocated to participating securities | $ | 430,677 | $ | 227,513 | $ | 271,205 | ||||||
Discontinued operations, including gain on sale, attributable to common shareholders | 382,842 | 19,750 | 18,197 | |||||||||
Net income attributable to common shareholders – basic | $ | 813,519 | $ | 247,263 | $ | 289,402 | ||||||
Earnings per common share from continuing operations | $ | 4.81 | $ | 2.55 | $ | 3.08 | ||||||
Earnings per common share from discontinued operations | 4.27 | 0.22 | 0.21 | |||||||||
Total earnings per common share – basic | $ | 9.08 | $ | 2.77 | $ | 3.29 | ||||||
Weighted average number of common shares outstanding – basic | 89,580 | 89,120 | 88,084 | |||||||||
Earnings per common share calculation – diluted | ||||||||||||
Income from continuing operations attributable to common shareholders, net of amount allocated to participating securities | $ | 430,677 | $ | 227,513 | $ | 271,205 | ||||||
Discontinued operations, including gain on sale, attributable to common shareholders | 382,842 | 19,750 | 18,197 | |||||||||
Net income attributable to common shareholders – diluted | $ | 813,519 | $ | 247,263 | $ | 289,402 | ||||||
Earnings per common share from continuing operations | $ | 4.79 | $ | 2.54 | $ | 3.06 | ||||||
Earnings per common share from discontinued operations | 4.26 | 0.22 | 0.21 | |||||||||
Total earnings per common share – diluted | $ | 9.05 | $ | 2.76 | $ | 3.27 | ||||||
Weighted average number of common shares outstanding – basic | 89,580 | 89,120 | 88,084 | |||||||||
Incremental shares issuable from assumed conversion of: | ||||||||||||
Common share options and share awards granted | 323 | 370 | 384 | |||||||||
Weighted average number of common shares outstanding – diluted | 89,903 | 89,490 | 88,468 | |||||||||
F-15
4. Common Shares
In November 2014, we created an at-the-market share offering program (the "ATM program") through which we can, but have no obligation to, sell common shares having an aggregate offering price of up to $331.3 million, in amounts and at times as we determine, into the existing trading market at current market prices as well as through negotiated transactions. Actual sales from time to time may depend on a variety of factors including, among others, market conditions, the trading price of our common shares, and determinations by management of the appropriate sources of funding for us. We intend to use the net proceeds from any future sales under the ATM program for general corporate purposes, which may include reducing future borrowings under our unsecured credit facility, the repayment of other indebtedness, the redemption or other repurchase of outstanding debt or equity securities, funding for development, redevelopment and investment projects and financing for acquisitions. As of the date of this filing, we had common shares having an aggregate offering price of up to $315.3 million remaining available for sale under the ATM program. There were no shares sold during the years ended December 31, 2016 and 2015, and no shares have been sold through the date of this filing under the ATM program.
The following table presents activity under our ATM program for the year ended December 31, 2014:
(in thousands, except per share amounts) | Year Ended December 31, 2014 | ||
Total net consideration | $ | 15,690.2 | |
Common shares sold | 209.7 | ||
Average price per share | $ | 76.28 | |
In January 2008, our Board of Trust Managers approved a plan to allow for the repurchase of up to $500.0 million of our common equity securities through open market purchases, block purchases, and privately negotiated transactions. Under this program, we repurchased 4.3 million shares for a total of approximately $230.2 million from April 2007 through December 31, 2008 and there have not been any shares repurchased subsequent to that date. As of the date of this filing, the remaining dollar value of our common equity securities authorized to be repurchased under the program was approximately $269.8 million.
We currently have an automatic shelf registration statement which allows us to offer, from time to time, common shares, preferred shares, debt securities, or warrants. Our Amended and Restated Declaration of Trust provides we may issue up to 185 million shares of beneficial interest, consisting of 175 million common shares and 10 million preferred shares. At December 31, 2016, we had approximately 87.5 million common shares outstanding, net of treasury shares and shares held in our deferred compensation arrangements, and no preferred shares outstanding.
In addition to our quarterly dividends, our Board of Trust Managers declared a special dividend of $4.25 per common share to our common shareholders of record as of September 23, 2016, consisting of gains on dispositions of assets completed in 2016, which was paid on September 30, 2016. We also paid equivalent amounts per unit to holders of the common operating partnership units.
5. Operating Partnerships
At December 31, 2016, approximately 4% of our consolidated multifamily apartment homes were held in Camden Operating, L.P. (“Camden Operating” or the “operating partnership”). Camden Operating has 11.9 million outstanding common limited partnership units and as of December 31, 2016, we held 92% of the outstanding common limited partnership units and the sole 1% general partnership interest of the operating partnership. The remaining common limited partnership units, comprising approximately 0.8 million units, are primarily held by former officers, directors, and investors of Paragon Group, Inc., which we acquired in 1997. Each common limited partnership unit is redeemable for one common share of Camden or cash at our election. Holders of common limited partnership units are not entitled to rights as shareholders prior to redemption of their common limited partnership units. No member of our management owns Camden Operating common limited partnership units, and one of our 12 trust managers owns Camden Operating common limited partnership units.
At December 31, 2016, approximately 34% of our consolidated multifamily apartment homes were held in Camden Summit Partnership, L.P. (the “Camden Summit Partnership”). The Camden Summit Partnership has 22.8 million outstanding common limited partnership units and as of December 31, 2016, we held 94% of the outstanding common limited partnership units and the sole 1% general partnership interest of the Camden Summit Partnership. The remaining common limited partnership units, comprising approximately 1.1 million units, are primarily held by former officers, directors, and investors of Summit Properties Inc., which we acquired in 2005. Each common limited partnership unit is redeemable for one common share of Camden or cash at our election. Holders of common limited partnership units are not entitled to rights as shareholders prior to redemption of their common limited partnership units. No member of our management owns Camden Summit Partnership common limited partnership units, and two of our 12 trust managers own Camden Summit Partnership common limited partnership units.
F-16
6. Income Taxes
We have maintained and intend to maintain our election as a REIT under the Internal Revenue Code of 1986, as amended. In order for us to continue to qualify as a REIT we must meet a number of organizational and operational requirements, including a requirement to distribute annual dividends to our shareholders equal to a minimum of 90% of our adjusted taxable income. As a REIT, we generally will not be subject to federal income tax on our taxable income at the corporate level to the extent such income is distributed to our shareholders annually. If our taxable income exceeds our dividends in a tax year, REIT tax rules allow us to designate dividends from the subsequent tax year in order to avoid current taxation on undistributed income. If we fail to qualify as a REIT in any taxable year, we will be subject to federal and state income taxes at regular corporate rates, including any applicable alternative minimum tax. In addition, we may not be able to requalify as a REIT for the four subsequent taxable years. Historically, we have incurred only state and local income, franchise, and excise taxes. Taxable income from non-REIT activities managed through taxable REIT subsidiaries is subject to applicable federal, state, and local income taxes. Our operating partnerships are flow-through entities and are not subject to federal income taxes at the entity level.
We have recorded income, franchise, and excise taxes in the consolidated statements of income and comprehensive income for the years ended December 31, 2016, 2015 and 2014 as income tax expense. Income taxes for the years ended December 31, 2016, 2015 and 2014, primarily related to state income tax and federal taxes on certain of our taxable REIT subsidiaries. We have no significant temporary or permanent differences or tax credits associated with our taxable REIT subsidiaries.
For income tax purposes, distributions to common shareholders are characterized as ordinary income, capital gains or as a return of a shareholder's invested capital. A summary of the income tax characterization of our distributions paid per common share for the years ended December 31, 2016, 2015 and 2014 is set forth in the following table:
Year Ended December 31, | ||||||||||||
2016 | 2015 | 2014 | ||||||||||
Common Share Distributions | ||||||||||||
Ordinary income | $ | — | $ | 1.88 | $ | 1.23 | ||||||
Long-term capital gain | 5.02 | 0.70 | 1.02 | |||||||||
Unrecaptured Sec. 1250 gain | 2.23 | 0.22 | 0.39 | |||||||||
Total | $ | 7.25 | $ | 2.80 | $ | 2.64 | ||||||
Percentage of distributions representing tax preference items | 0.34 | % | 3.73 | % | 4.17 | % | ||||||
We have taxable REIT subsidiaries which are subject to federal and state income taxes. At December 31, 2016, our taxable REIT subsidiaries had net operating loss carryforwards (“NOL’s”) of approximately $0.1 million which expire in years 2034 to 2036. Because NOL’s are subject to certain change of ownership, continuity of business, and separate return year limitations, and because we believe it is unlikely the available NOL’s will be utilized or if utilized, any amounts will be immaterial, no benefits related to these NOL’s have been recognized in our consolidated financial statements.
The carrying value of net assets reported in our consolidated financial statements at December 31, 2016 exceeded the tax basis by approximately $1.5 billion.
Income Tax Expense. For the tax year ended December 31, 2016 , we had income tax expense of approximately $1.6 million, and for each of the tax years ended December 31, 2015 and 2014, we had income tax expense of approximately $1.9 million. Income tax for the years ended December 31, 2016, 2015, and 2014 was comprised mainly of state income tax and federal income tax related to one of our taxable REIT subsidiaries.
Income Tax Expense – Deferred. For the years ended December 31, 2016, 2015, and 2014, our deferred tax expense was not significant.
Camden Property Trust's and our subsidiaries’ income tax returns are subject to examination by federal, state and local tax jurisdictions for years 2013 through 2015. NOL's and other tax attributes generated in years prior to 2013 are also subject to challenge in any examination of those tax years. We believe we have no uncertain tax positions or unrecognized tax benefits requiring disclosure as of and for the periods presented.
F-17
7. Acquisitions, Dispositions, Impairment, and Discontinued Operations
Acquisitions of Land. During the year ended December 31, 2016, we acquired an aggregate of approximately 4.6 acres of land located in Denver, Colorado and Charlotte, North Carolina for approximately $19.9 million. The acquisition of 2.4 acres in Denver, Colorado in September 2016 was funded with cash on hand and from the use of $13.0 million which we had placed with a qualified intermediary in connection with a like-kind exchange related to the sale of one of the Las Vegas properties discussed below. All of the land parcels acquired in 2016 are currently in development as of December 31, 2016. During the year ended December 31, 2015, we acquired approximately 58.1 acres of land located in Phoenix, Arizona, Los Angeles, California, and Gaithersburg, Maryland for approximately $59.1 million.
Acquisition of Non-controlling Ownership Interest. We did not acquire any additional non-controlling ownership interest in 2016. In March 2015, we purchased the remaining 0.01% non-controlling interest in two fully consolidated joint ventures, which own an aggregate of 798 apartment homes located in College Park, Maryland and Irvine, California, for approximately $9.5 million. The acquisitions of the remaining ownership interests were recorded as equity transactions and, as a result, the carrying balances of the non-controlling interest were eliminated and the remaining difference between the purchase price and carrying balance was recorded as a reduction in additional paid-in capital. See Note 14, "Non-controlling Interests," for the effect of changes in ownership interests of these former joint ventures on the equity attributable to common shareholders.
Land Holding Dispositions and Impairment. During the year ended December 31, 2016, we sold approximately 6.3 acres of land adjacent to an operating property in Tampa, Florida for approximately $2.2 million and recognized a gain of approximately $0.4 million. During the year ended December 31, 2015, we sold two land holdings adjacent to operating properties in Dallas and Houston, Texas for approximately $1.1 million and recognized a gain of approximately $0.3 million. In 2014, we sold approximately 2.4 acres of land adjacent to an operating property in Dallas, Texas for approximately $0.8 million. We recognized a $1.2 million impairment charge related to this land parcel, which represented the difference between the land holding’s carrying value and the sales price. During the year ended December 31, 2014, we also sold approximately 26.9 acres of land adjacent to current development and operating communities located in Atlanta, Georgia and Houston and Dallas, Texas for approximately $22.9 million and recognized a gain of approximately $3.6 million related to these land sales.
Sale of Operating Properties. During the year ended December 31, 2016, we sold one dual-phased property and six other operating properties comprised of an aggregate of 3,184 apartment homes with an average age of 24 years, located in Landover and Frederick, Maryland; Fullerton, California; and Tampa, Altamonte Springs, and St. Petersburg, Florida for an aggregate of approximately $523.4 million, and recognized a gain of approximately $294.9 million.
In 2015, we sold three operating properties, comprised of an aggregate of 1,376 apartment homes located in Brandon and Tampa, Florida and Austin, Texas for an aggregate of approximately $147.4 million and we recognized a gain of approximately $104.0 million relating to these property sales. During the year ended December 31, 2014, we sold five operating properties comprised of 1,847 apartment homes located in Atlanta, Georgia, Dallas, Texas, Orlando and Tampa, Florida and Charlotte, North Carolina for approximately $218.3 million and we recognized a gain of approximately $155.7 million relating to these property sales.
Discontinued Operations and Assets Held for Sale. In April 2016, we sold 15 operating properties, comprised of an aggregate of 4,918 apartment homes, with an average age of 23 years, a retail center and approximately 19.6 acres of land, all located in Las Vegas, Nevada, to an unaffiliated third party for an aggregate of approximately $630.0 million and recognized a gain of approximately $375.2 million, net of closing costs. We placed $13.0 million of the proceeds from this disposition with a qualified intermediary for use in a like-kind exchange and, in September 2016, the exchange was successfully completed with the Denver, Colorado land purchase described above. There were no additional discontinued operations during the years ended December 31, 2015 or 2014.
F-18
The operating properties, retail center, and land discussed above were classified as held for sale in the condensed consolidated balance sheet at December 31, 2015, and were made up of the following:
(in thousands) | December 31, 2015 | |||
Land | $ | 59,438 | ||
Buildings and improvements | 373,419 | |||
$ | 432,857 | |||
Accumulated depreciation | (197,996 | ) | ||
Net operating real estate assets | $ | 234,861 | ||
Properties under development, including land | 4,202 | |||
Discontinued operations held for sale, including land | $ | 239,063 | ||
Other assets related to properties held for sale | 1,191 | |||
Total assets held for sale | $ | 240,254 | ||
Liabilities related to assets held for sale | $ | 1,654 | ||
The following is a summary of income from discontinued operations for the years ended December 31, 2016, 2015, and 2014 relating to the 15 operating properties and the retail center sold in April 2016:
Years Ended December 31, | ||||||||||||
(in thousands) | 2016 | 2015 | 2014 | |||||||||
Property revenues | $ | 19,184 | $ | 57,310 | $ | 53,715 | ||||||
Property expenses | (6,898 | ) | (20,716 | ) | (19,608 | ) | ||||||
$ | 12,286 | $ | 36,594 | $ | 34,107 | |||||||
Property management expense | (242 | ) | (706 | ) | (619 | ) | ||||||
Depreciation and amortization | (4,327 | ) | (16,138 | ) | (15,291 | ) | ||||||
Income tax expense | (112) | — | — | |||||||||
Income from discontinued operations | $ | 7,605 | $ | 19,750 | $ | 18,197 | ||||||
Gain on sale of discontinued operations, net of tax | $ | 375,237 | $ | — | $ | — | ||||||
8. Investments in Joint Ventures
Our equity investments in unconsolidated joint ventures, which we account for utilizing the equity method of accounting, consisted of three discretionary investment funds (collectively, "the Funds") at December 31, 2016 and 2015, and two Funds at December 31, 2014, with our ownership interest ranging from 20.0% to 31.3%. In March 2015, we completed the formation of a third fund with an unaffiliated third party for additional multifamily investments of up to $450.0 million. We have a 20.0% ownership interest in this third fund, and it did not own any properties in 2016 or 2015. We provide property and asset management and other services to the Funds which own operating properties and we may also provide construction and development services to the Funds which own properties under development. The following table summarizes the combined balance sheet and statement of income data for the Funds as of and for the periods presented:
(in millions) | 2016 | 2015 | |||||
Total assets | $ | 726.9 | $ | 748.0 | |||
Total third-party debt | 518.7 | 527.0 | |||||
Total equity | 184.0 | 195.3 | |||||
F-19
2016 | 2015 | 2014 | |||||||||
Total revenues | $ | 119.8 | $ | 114.5 | $ | 105.6 | |||||
Gain on sale of operating properties, net of tax | — | — | 18.5 | ||||||||
Net income | 14.8 | 12.0 | 26.9 | ||||||||
Equity in income (1) | 7.1 | 6.2 | 7.0 | ||||||||
(1) | Equity in income excludes our ownership interest of fee income from various services provided by us to the Funds. |
In December 2014, the partnership agreements for two of the Funds were amended, resulting in the extension of the term of each Fund to December 31, 2026 and our ownership interests in the Funds were increased from 20.0% to 31.3% effective December 23, 2014.
The Funds in which we have a partial interest have been funded in part with secured third-party debt. As of December 31, 2016, we had no outstanding guarantees related to loans of the Funds.
We may earn fees for property and asset management, construction, development, and other services related to joint ventures in which we own an equity interest and may earn a promoted equity interest if certain thresholds are met. We eliminate fee income for services provided to these joint ventures to the extent of our ownership. Fees earned for these services, net of eliminations, were approximately $5.3 million, $5.8 million, and $8.8 million for the years ended December 31, 2016, 2015, and 2014, respectively.
In February 2014, two of the Funds each sold an operating property, comprised of 558 apartment homes, for approximately $65.6 million. Our proportionate share of the gains on these transactions was approximately $3.6 million and was reported as a component of equity in income of joint ventures in the consolidated statements of income and comprehensive income.
F-20
9. Notes Payable
The following is a summary of our indebtedness:
December 31, | ||||||||
(in millions) | 2016 | 2015 | ||||||
Commercial banks | ||||||||
Unsecured credit facility | $ | — | $ | 225.0 | ||||
Unsecured short-term borrowings | — | 19.0 | ||||||
$ | — | $ | 244.0 | |||||
Senior unsecured notes (1) | ||||||||
5.83% Notes, due 2017 | $ | 246.6 | $ | 246.3 | ||||
4.78% Notes, due 2021 | 248.4 | 248.0 | ||||||
3.15% Notes, due 2022 | 346.0 | 345.4 | ||||||
5.07% Notes, due 2023 | 247.2 | 246.8 | ||||||
4.36% Notes, due 2024 | 248.2 | 248.0 | ||||||
3.68% Notes, due 2024 | 246.8 | 246.4 | ||||||
$ | 1,583.2 | $ | 1,580.9 | |||||
Total unsecured notes payable | 1,583.2 | 1,824.9 | ||||||
Secured notes (1) | ||||||||
1.25% – 5.77% Conventional Mortgage Notes, due 2018 – 2045 | 866.7 | 867.4 | ||||||
Tax-exempt Mortgage Note, originally due 2028 (2.18% floating rate) | 30.7 | 32.4 | ||||||
897.4 | 899.8 | |||||||
Total notes payable | $ | 2,480.6 | $ | 2,724.7 | ||||
Other floating rate debt included in secured notes (1.25%) | $ | 175.0 | $ | 175.0 | ||||
Value of real estate assets, at cost, subject to secured notes | $ | 1,598.9 | $ | 1,568.9 | ||||
(1) | Unamortized debt discounts and debt issuance costs of $15.7 million and $18.6 million are included in senior unsecured and secured notes payable as of December 31, 2016 and 2015, respectively. |
In August 2015, we amended and restated our $500 million unsecured credit facility, which extended the maturity date from September 2015 to August 2019, with two six-month options to extend the maturity date at our election to August 2020, and increased the availability to $600 million, with the option to further increase it to $900 million by either adding additional banks to the facility or obtaining the agreement of the existing banks to increase their commitments. The interest rate on this credit facility is based upon the London Interbank Offered Rate ("LIBOR") plus a margin which is subject to change as our credit ratings change. Advances under this credit facility may be priced at the scheduled rates, or we may enter into bid rate loans with participating banks at rates below the scheduled rates. These bid rate loans have terms of 180 days or less and may not exceed the lesser of $300 million or the remaining amount available under the credit facility. This credit facility is subject to customary financial covenants and limitations. We believe we are in compliance with all such financial covenants and limitations on the date of this filing.
Our credit facility provides us with the ability to issue up to $50 million in letters of credit. While our issuance of letters of credit does not increase our borrowings outstanding under our credit facility, it does reduce the amount available. At December 31, 2016, we had no balances outstanding on our $600 million credit facility and we had outstanding letters of credit totaling approximately $12.7 million, leaving approximately $587.3 million available under our credit facility.
At December 31, 2016 and 2015, we had outstanding floating rate debt of approximately $205.7 million and $451.4 million, respectively, which included our unsecured credit facility and unsecured short-term borrowings, and the weighted average interest rate on this debt was approximately 1.4% and 1.2% for the years ended December 31, 2016 and 2015, respectively.
Our indebtedness, which includes our unsecured credit facility, had a weighted average maturity of 4.9 years at December 31, 2016. The table below is a summary of the maturity dates of our outstanding debt and principal amortizations, and the weighted average interest rates on such debt, at December 31, 2016:
F-21
(in millions) | Amount | Weighted Average Interest Rate | |||||
2017 (1) | $ | 276.0 | 5.4 | % | |||
2018 | 173.8 | 1.2 | |||||
2019 | 643.2 | 5.4 | |||||
2020 (2) | (1.1 | ) | — | ||||
2021 | 249.1 | 4.8 | |||||
Thereafter (1) | 1,139.6 | 4.0 | |||||
Total | $ | 2,480.6 | 4.4 | % | |||
(1) | Subsequent to December 31, 2016, we gave notice of advance repayment on our tax-exempt secured note payable of approximately $30.7 million in February 2017, which was initially due to mature in 2028. This table reflects this repayment in 2017. |
(2) | Includes amortization of debt discounts and debt issuance costs, net of scheduled principal payments. |
10. Share-based Compensation and Benefit Plans
Incentive Compensation. During the second quarter of 2011, our Board of Trust Managers adopted, and our shareholders approved, the 2011 Share Incentive Plan of Camden Property Trust (as amended, the “2011 Share Plan”). Under the 2011 Share Plan, we may issue up to a total of approximately 9.1 million fungible units (the “Fungible Pool Limit”), which is comprised of approximately 5.8 million new fungible units plus approximately 3.3 million fungible units previously available for issuance under our 2002 share incentive plan based on a 3.45 to 1.0 fungible unit to full value award conversion ratio. Fungible units represent the baseline for the number of shares available for issuance under the 2011 Share Plan. Different types of awards are counted differently against the Fungible Pool Limit, as follows:
• | Each share issued or to be issued in connection with an award, other than an option, right or other award which does not deliver the full value at grant of the underlying shares, will be counted against the Fungible Pool Limit as 3.45 fungible pool units; |
• | Options and other awards which do not deliver the full value at grant of the underlying shares and which expire more than five years from date of grant will be counted against the Fungible Pool Limit as one fungible pool unit; and |
• | Options, rights and other awards which do not deliver the full value at grant and expire five years or less from the date of grant will be counted against the Fungible Pool Limit as 0.83 of a fungible pool unit. |
At December 31, 2016, approximately 3.6 million fungible units were available under the 2011 Share Plan, which results in approximately 1.1 million common shares which may be granted pursuant to full value awards based on the 3.45 to 1.0 fungible unit to full value award conversion ratio.
Awards which may be granted under the 2011 Share Plan include incentive share options, non-qualified share options (which may be granted separately or in connection with an option), share awards, dividends and dividend equivalents and other equity based awards. Persons eligible to receive awards under the 2011 Share Plan are trust managers, directors of our affiliates, executive and other officers, key employees and consultants, as determined by the Compensation Committee of our Board of Trust Managers. The 2011 Share Plan will expire on May 11, 2021.
Options. New options are exercisable, subject to the terms and conditions of the plan, in increments ranging from 20% to 33.33% per year on each of the anniversaries of the date of grant. The plan provides that the exercise price of an option will be determined by the Compensation Committee of the Board of Trust Managers on the day of grant, and to date all options have been granted at an exercise price that equals the fair market value on the date of grant. Approximately 0.2 million, 0.1 million and 0.4 million options were exercised during the years ended December 31, 2016, 2015, and 2014, respectively. The total intrinsic value of options exercised was approximately $8.9 million, $2.0 million, and $7.4 million during the years ended December 31, 2016, 2015 and 2014, respectively. At December 31, 2016, there was no unrecognized compensation cost related to unvested options. At December 31, 2016, all options outstanding were exercisable and had a weighted average remaining life of approximately 2.0 years.
F-22
The following table summarizes outstanding share options, all of which were exercisable, at December 31, 2016:
Options Outstanding and Exercisable (1) | |||||||
Exercise Prices | Number | Weighted Average Price | |||||
$30.06 | 65,460 | $ | 30.06 | ||||
$75.17 | 26,752 | 75.17 | |||||
$85.05 | 12,854 | 85.05 | |||||
Total options | 105,066 | $ | 48.27 | ||||
(1) | The aggregate intrinsic value of options outstanding and exercisable at December 31, 2016 was approximately $3.8 million. The aggregate intrinsic value was calculated as the excess, if any, between our closing share price of $84.07 per share on December 31, 2016 and the strike price of the underlying award. |
Options Granted and Valuation Assumptions. During the years ended December 31, 2016, 2015, and 2014, we granted approximately 12.9 thousand, 26.8 thousand and 84.5 thousand reload options, respectively. Reload options are granted for the number of shares tendered as payment for the exercise price upon the exercise of an option with a reload provision. The reload options granted have an exercise price equal to the fair market value of a common share on the date of grant and expire on the same date as the original options which were exercised. The reload options granted during the years ended December 31, 2016, 2015 and 2014 vested immediately. Approximately $0.1 million, $0.2 million and $0.3 million was expensed in 2016 and 2015, and 2014 respectively, on the reload date. We estimate the fair values of each option award including reloads on the date of grant using the Black-Scholes option pricing model. The following assumptions were used for the reload options granted during the years ended December 31, 2016, 2015 and 2014:
Year Ended December 31, 2016 | Year Ended December 31, 2015 | Year Ended December 31, 2014 | ||||
Weighted average fair value of options granted | $6.71 | $5.52 - $7.38 | $3.55 - $8.17 | |||
Expected volatility | 18.0% | 16.5% - 18.8% | 22.6% - 23.2% | |||
Risk-free interest rate | 0.9% | 1.0% - 1.3% | 0.1% - 1.1% | |||
Expected dividend yield | 3.8% | 3.5% - 3.7% | 3.5% | |||
Expected life | 3 years | 3 years - 4 years | 6 months - 4 years | |||
Our computations of expected volatility for 2016, 2015, and 2014 are based on the historical volatility of our common shares over a time period equal to the expected life of the option and ending on the grant date, and the interest rate for periods within the contractual life of the award is based on the U.S. Treasury yield curve in effect at the time of grant. The expected dividend yield on our common shares is based on the historical dividend yield over the expected term of the options granted. Our computation of expected life is based upon historical experience of similar awards, giving consideration to the contractual terms of the share-based awards.
Share Awards and Vesting. Share awards for employees generally have a vesting period of three to five years. The compensation cost for share awards is generally based on the market value of the shares on the date of grant and is amortized over the vesting period. In the event the holder of the share awards will reach both the retirement eligibility age of 65 years and the service requirements as defined in the 2011 Share Plan before the term in which the awards are scheduled to vest, the value of the share awards is amortized from the date of grant to the individual's retirement eligibility date. To estimate forfeitures, we use actual forfeiture history. At December 31, 2016, the unamortized value of previously issued unvested share awards was approximately $25.7 million which is expected to be amortized over the next two years. The total fair value of shares vested during the years ended December 31, 2016, 2015 and 2014 was approximately $27.2 million, $19.2 million, and $17.1 million, respectively.
Total compensation cost for option and share awards charged against income was approximately $21.3 million, $18.6 million, and $16.0 million for 2016, 2015 and 2014, respectively. Total capitalized compensation cost for option and share awards was approximately $3.8 million, $3.5 million, and $2.7 million for 2016, 2015 and 2014, respectively.
F-23
The following table summarizes activity under our share incentive plans for the three years ended December 31:
Options Outstanding | Weighted Average Exercise / Grant Price | Nonvested Share Awards Outstanding | Weighted Average Exercise / Grant Price | ||||||||||
Options and nonvested share awards outstanding at December 31, 2013 | 634,361 | $ | 41.59 | 831,298 | $ | 59.77 | |||||||
Granted | 84,452 | 64.75 | 314,614 | 65.78 | |||||||||
Exercised/Vested | (375,316 | ) | 47.85 | (305,372 | ) | 55.97 | |||||||
Forfeited | (21,686 | ) | 62.32 | (21,597 | ) | 64.14 | |||||||
Balance at December 31, 2014 | 321,811 | $ | 38.97 | 818,943 | $ | 63.39 | |||||||
Granted | 26,752 | 75.17 | 257,749 | 74.53 | |||||||||
Exercised/Vested | (53,358 | ) | 37.69 | (313,628 | ) | 61.10 | |||||||
Forfeited | — | — | (12,818 | ) | 67.96 | ||||||||
Balance at December 31, 2015 | 295,205 | $ | 42.49 | 750,246 | $ | 68.09 | |||||||
Granted | 12,854 | 85.05 | 270,978 | 74.92 | |||||||||
Exercised/Vested | (202,993 | ) | 42.19 | (398,492 | ) | 68.16 | |||||||
Forfeited | — | — | (18,245 | ) | 70.63 | ||||||||
Total options and nonvested share awards outstanding at December 31, 2016 | 105,066 | $ | 48.27 | 604,487 | $ | 71.03 | |||||||
Employee Share Purchase Plan (“ESPP”). We have established an ESPP for all active employees and officers who have completed one year of continuous service. Participants may elect to purchase our common shares through payroll deductions and/or through semi-annual contributions. At the end of each six-month offering period, each participant’s account balance is applied to acquire common shares at 85% of the market value, as defined, on the first or last day of the offering period, whichever price is lower. We currently use treasury shares to satisfy ESPP share requirements. Each participant must hold the shares purchased for nine months in order to receive the discount, and a participant may not purchase more than $25,000 in value of shares during any plan year, as defined. The following table presents information related to our ESPP:
2016 | 2015 | 2014 | |||||||||
Shares purchased | 20,797 | 14,655 | 25,728 | ||||||||
Weighted average fair value of shares purchased | $ | 82.33 | $ | 74.66 | $ | 71.19 | |||||
Expense recorded (in millions) | $ | 0.4 | $ | 0.2 | $ | 0.5 | |||||
Rabbi Trust. We established a rabbi trust for a select group of participants in which share awards granted under the share incentive plan and salary and other cash amounts earned may be deposited. The rabbi trust is only in use for deferrals made prior to 2005, including bonuses related to service in 2004 but paid in 2005. The rabbi trust is an irrevocable trust and no portion of the trust fund may be used for any purpose other than the delivery of those assets to the participants. The assets held in the rabbi trust are subject to the claims of our general creditors in the event of bankruptcy or insolvency.
The value of the assets of the rabbi trust is consolidated into our financial statements. Granted share awards held by the rabbi trust are classified in equity in a manner similar to the manner in which treasury stock is accounted. Subsequent changes in the fair value of the shares are not recognized. The deferred compensation obligation is classified as an equity instrument and changes in the fair value of the amount owed to the participant are not recognized. At December 31, 2016 and 2015, approximately 1.8 million share awards were held in the rabbi trust. Additionally, as of December 31, 2016 and 2015, the rabbi trust held trading securities totaling approximately $34.5 million and $37.1 million, respectively, which represents cash deferrals made by plan participants. Market value fluctuations on these trading securities are recognized in income in accordance with GAAP and the liability due to participants is adjusted accordingly.
At December 31, 2016 and 2015, approximately $22.7 million and $23.6 million, respectively, was required to be paid to us by plan participants upon the withdrawal of any assets from the rabbi trust, and is included in “Accounts receivable-affiliates” in our consolidated financial statements.
Non-Qualified Deferred Compensation Share Awards. In 2004, we established a Non-Qualified Deferred Compensation Plan which is an unfunded arrangement established and maintained primarily for the benefit of a select group of participants. Eligible participants commence participation in this plan on the date the deferral election first becomes effective.
F-24
We credit to the participant's account an amount equal to the amount designated as the participant's deferral for the plan year as indicated in the participant's deferral election(s). Any modification to or termination of the plan will not reduce a participant's right to any vested amounts already credited to his or her account. Approximately 1.1 million and 1.3 million share awards were held in the plan at December 31, 2016 and 2015, respectively. Additionally, as of December 31, 2016 and 2015, the plan held trading securities totaling approximately $59.5 million and $30.8 million, respectively, which represents cash deferrals made by plan participants. Market value fluctuations on these trading securities are recognized in income in accordance with GAAP and the liability due to participants is adjusted accordingly. The assets held in the Non-Qualified Deferred Compensation Plan are subject to the claims of our general creditors in the event of bankruptcy or insolvency.
In July 2013, we amended and restated the plan to permit diversification of fully vested share awards into other equity securities subject to a six month holding period. In February 2014, we adopted the Second Amendment and Restated Camden Property Trust Non-Qualified Deferred Compensation Plan to clarify certain terms in the existing plan relating to the deferral of performance based compensation. Balances within temporary equity in our consolidated balance sheets relate to fully vested awards and the proportionate share of nonvested awards of participants within our Non-Qualified Deferred Compensation Plan who are permitted to diversify their shares into other equity securities.
The following table summarizes the eligible share award activity for the twelve months ended December 31:
(in thousands) | 2016 | 2015 | ||||||
Temporary equity: | ||||||||
Balance at inception/beginning of period | $ | 79,364 | $ | 68,134 | ||||
Change in classification | 13,956 | 10,999 | ||||||
Change in redemption value | 9,145 | 3,788 | ||||||
Diversification of share awards | (25,428 | ) | (3,557 | ) | ||||
Balance at December 31 | $ | 77,037 | $ | 79,364 | ||||
401(k) Savings Plan. We have a 401(k) savings plan, which is a voluntary defined contribution plan. Under the savings plan, every employee is eligible to participate, beginning on the date the employee has completed six months of continuous service with us. Each participant may make contributions to the savings plan by means of a pre-tax salary deferral, which may not be less than 1% or more than 60% of the participant’s compensation, subject to limitations. The federal tax code limits the annual amount of salary deferrals which may be made by any participant. We may make matching contributions on the participant’s behalf up to a predetermined limit. The matching contribution made for each of the years ended December 31, 2016, 2015 and 2014 was approximately $2.7 million, $2.6 million and $2.2 million, respectively. A participant’s salary deferral contribution is 100% vested and nonforfeitable. A participant will become vested in our matching contributions 33% after one year of service, 67% after two years of service and 100% after three years of service. Administrative expenses under the savings plan were paid by us and were not significant for all periods presented.
11. Fair Value Measurements
Recurring Fair Value Disclosures. The following table presents information about our financial instruments measured at fair value on a recurring basis as of December 31, 2016 and 2015 using the inputs and fair value hierarchy discussed in Note 2, “Summary of Significant Accounting Policies and Recent Accounting Pronouncements”:
Financial Instruments Measured at Fair Value on a Recurring Basis
December 31, 2016 | December 31, 2015 | ||||||||||||||||||||||||||||||
(in millions) | Quoted Prices in Active Markets for Identical Assets (Level 1) | Significant Other Observable Inputs (Level 2) | Significant Unobservable Inputs (Level 3) | Total | Quoted Prices in Active Markets for Identical Assets (Level 1) | Significant Other Observable Inputs (Level 2) | Significant Unobservable Inputs (Level 3) | Total | |||||||||||||||||||||||
Assets | |||||||||||||||||||||||||||||||
Deferred compensation plan investments (1) | $ | 80.6 | $ | — | $ | — | $ | 80.6 | $ | 53.6 | $ | — | $ | — | $ | 53.6 | |||||||||||||||
(1) | Approximately $8.3 million and $8.4 million of participant cash was withdrawn from our deferred compensation plan investments during the years ended December 31, 2016 and 2015, respectively. Approximately $25.4 million and $3.6 million of shares in the compensation plan were diversified into the deferred compensation plan investments during the nine months ended December 31, 2016 and the year ended December 31, 2015, respectively. |
F-25
Nonrecurring Fair Value Disclosures. The nonrecurring fair value disclosures inputs under the fair value hierarchy are discussed in Note 2, “Summary of Significant Accounting Policies and Recent Accounting Pronouncements.” There were no non-recurring fair value adjustments during the years ended December 31, 2016 or 2015.
Financial Instrument Fair Value Disclosures. The following table presents the carrying and estimated fair values of our notes payable at December 31, 2016 and 2015, in accordance with the policies discussed in Note 2, "Summary of Significant Accounting Policies and Recent Accounting Pronouncements."
December 31, 2016 | December 31, 2015 | ||||||||||||||
(in millions) | Carrying Value | Estimated Fair Value | Carrying Value (1) | Estimated Fair Value | |||||||||||
Fixed rate notes payable | $ | 2,274.9 | $ | 2,347.0 | $ | 2,273.3 | $ | 2,358.8 | |||||||
Floating rate notes payable (1) | 205.7 | 200.5 | 451.4 | 441.3 | |||||||||||
(1) | Includes balances outstanding under our unsecured credit facility and unsecured short-term borrowings at December 31, 2015. |
12. Net Change in Operating Accounts
The effect of changes in the operating accounts and other on cash flows from operating activities is as follows:
Year Ended December 31, | |||||||||||
(in thousands) | 2016 | 2015 | 2014 | ||||||||
Change in assets: | |||||||||||
Other assets, net | $ | (3,551 | ) | $ | (1,687 | ) | $ | (1,951 | ) | ||
Change in liabilities: | |||||||||||
Accounts payable and accrued expenses | (2,309 | ) | (15,478 | ) | 19,342 | ||||||
Accrued real estate taxes | 5,526 | 6,386 | 4,025 | ||||||||
Other liabilities | (2,361 | ) | 2,245 | (1,701 | ) | ||||||
Other | 2,976 | 2,773 | 2,583 | ||||||||
Change in operating accounts and other | $ | 281 | $ | (5,761 | ) | $ | 22,298 | ||||
13. Commitments and Contingencies
Construction Contracts. As of December 31, 2016, we estimate the additional cost to complete the seven consolidated projects currently under construction to be approximately $240.6 million. We intend to fund this amount through a combination of one or more of the following: cash and cash equivalents, short-term investments, cash flows generated from operations, draws on our unsecured credit facility, proceeds from property dispositions, the use of debt and equity offerings under our automatic shelf registration statement, equity issued from our ATM program, other unsecured borrowings, and secured mortgages.
Litigation. We are also subject to various legal proceedings and claims which arise in the ordinary course of business. Matters which arise out of allegations of bodily injury, property damage, and employment practices are generally covered by insurance. While the resolution of these legal proceedings and claims cannot be predicted with certainty, management believes the final outcome of such matters will not have a material adverse effect on our consolidated financial statements.
Other Commitments and Contingencies. In the ordinary course of our business, we issue letters of intent indicating a willingness to negotiate for acquisitions, dispositions, or joint ventures and also enter into arrangements contemplating various transactions. Such letters of intent and other arrangements are non-binding as to either party unless and until a definitive contract is entered into by the parties. Even if definitive contracts relating to the purchase or sale of real property are entered into, these contracts generally provide the purchaser with time to evaluate the property and conduct due diligence, during which periods the purchaser will have the ability to terminate the contracts without penalty or forfeiture of any deposit or earnest money. There can be no assurance definitive contracts will be entered into with respect to any matter covered by letters of intent or we will consummate any transaction contemplated by any definitive contract. Furthermore, due diligence periods for real property are frequently extended as needed. An acquisition or sale of real property becomes probable at the time the due diligence period expires and the definitive contract has not been terminated. We are then at risk under a real property acquisition contract, but generally only to the extent of any earnest money deposits associated with the contract, and are
F-26
obligated to sell under a real property sales contract. At December 31, 2016, we had $0.6 million in refundable earnest money deposits for potential acquisitions of land which are included in other assets, net in our consolidated balance sheets.
Lease Commitments. At December 31, 2016, we had long-term leases covering certain land, office facilities and equipment. Rental expense totaled approximately $4.1 million, $3.4 million, and $3.0 million for the years ended December 31, 2016, 2015 and 2014, respectively. Minimum annual rental commitments for the years ending December 31, 2017 through 2021 are approximately $2.9 million, $2.7 million, $2.5 million, $2.5 million and $2.5 million, respectively, and approximately $8.6 million in the aggregate thereafter.
Investments in Joint Ventures. We have entered into, and may continue in the future to enter into, joint ventures or partnerships (including limited liability companies) through which we own an indirect economic interest in less than 100% of the community or land owned directly by the joint venture or partnership. Our decision whether to hold the entire interest in an apartment community or land ourselves, or to have an indirect interest in the community or land through a joint venture or partnership, is based on a variety of factors and considerations, including: (i) our projection, in some circumstances, that we will achieve higher returns on our invested capital or reduce our risk if a joint venture or partnership vehicle is used; (ii) our desire to diversify our portfolio of investments by market; (iii) our desire at times to preserve our capital resources to maintain liquidity or balance sheet strength; and (iv) the economic and tax terms required by a seller of land or of a community, who may prefer or who may require less payment if the land or community is contributed to a joint venture or partnership. Investments in joint ventures or partnerships are not limited to a specified percentage of our assets. Each joint venture or partnership agreement is individually negotiated, and our ability to operate or dispose of land or of a community in our sole discretion may be limited to varying degrees in our existing joint venture agreements and may be limited to varying degrees depending on the terms of future joint venture agreements.
Employment Agreements. At December 31, 2016, we had employment agreements with 13 of our senior officers, the terms of which expire at various times through August 20, 2017. Such agreements provide for minimum salary levels as well as various incentive compensation arrangements, which are payable based on the attainment of specific goals. The agreements also provide for severance payments plus a gross-up payment if certain situations occur, such as termination without cause or a change of control. In the case of 10 of the agreements, the severance payment equals one times the respective current annual base salary in the case of termination without cause and 2.99 times the respective average annual base salary over the previous three fiscal years in the case of a change of control and a termination of employment or a material adverse change in the scope of their duties. In the case of one agreement, the severance payment equals one times the respective current annual base salary for termination without cause and 2.99 times the greater of current gross income or average gross income over the previous three fiscal years in the case of a change of control. In the case of the other two agreements, the severance payment generally equals 2.99 times the respective average annual compensation over the previous three fiscal years in connection with, among other things, a termination without cause or a change of control, and the officer would be entitled to receive continuation and vesting of certain benefits in the case of such termination.
14. Non-controlling Interests
The following table summarizes the effect of changes in our ownership interest in subsidiaries on the equity attributable to common shareholders for each of the years ended December 31:
(in thousands) | 2016 | 2015 | 2014 | ||||||||
Net income attributable to common shareholders | $ | 819,823 | $ | 249,315 | $ | 292,089 | |||||
Transfers from non-controlling interests: | |||||||||||
Increase in equity for conversion of operating partnership units | 290 | 86 | 52 | ||||||||
Decrease in additional paid-in-capital for purchase of remaining non-controlling ownership interests in two consolidated joint ventures (1) | — | (9,480 | ) | — | |||||||
Change in common equity and net transfers from non-controlling interests | $ | 820,113 | $ | 239,921 | $ | 292,141 | |||||
(1) | Refer to Note 7, "Acquisitions, Dispositions, Impairment, and Discontinued Operations," for further discussion of acquisitions. |
F-27
15. Quarterly Financial Data (unaudited)
Summarized quarterly financial data, which has been adjusted for discontinued operations as discussed in Note 7, "Acquisitions, Dispositions, Impairment, and Discontinued Operations" for the years ended December 31, 2016 and 2015, is as follows:
(in thousands, except per share amounts) | First | Second | Third | Fourth | Total (a) | ||||||||||||||
2016: | |||||||||||||||||||
Revenues | $ | 217,595 | $ | 221,478 | $ | 220,235 | $ | 217,139 | $ | 876,447 | |||||||||
Net income attributable to common shareholders | 41,730 | 446,302 | 290,898 | 40,893 | 819,823 | ||||||||||||||
Net income attributable to common shareholders per share – basic | 0.46 | 4.94 | (b) | 3.23 | (c) | 0.45 | 9.08 | ||||||||||||
Net income attributable to common shareholders per share – diluted | 0.46 | 4.92 | (b) | 3.21 | (c) | 0.45 | 9.05 | ||||||||||||
2015: | |||||||||||||||||||
Revenues | $ | 201,608 | $ | 206,432 | $ | 212,593 | $ | 214,985 | $ | 835,618 | |||||||||
Net income attributable to common shareholders | 115,599 | 36,079 | 37,044 | 60,593 | 249,315 | ||||||||||||||
Net income attributable to common shareholders per share – basic | 1.29 | (d) | 0.40 | 0.41 | 0.67 | (e) | 2.77 | ||||||||||||
Net income attributable to common shareholders per share – diluted | 1.27 | (d) | 0.40 | 0.41 | 0.67 | (e) | 2.76 | ||||||||||||
(a) | Net income per share is computed independently for each of the quarters presented. Therefore, the sum of quarterly net income per share amounts may not equal the total computed for the year. |
(b) | Includes a $32,235, or $0.36 basic and diluted per share, impact related to a gain on sale of one operating property. |
(c) | Includes a $262,719, or $2.93 basic and $2.92 diluted per share, impact related to a gain on sale of one dual-phased operating property and five other operating properties. |
(d) | Includes an $85,192, or $0.96 basic and $0.94 diluted per share, impact related to a gain on sale of two operating properties and land. |
(e) | Includes an $18,870, or $0.21 basic and diluted per share, impact related to a gain on sale of one operating property. |
F-28
Camden Property Trust Real Estate and Accumulated Depreciation As of December 31, 2016 (in thousands) | Schedule III | ||||||||||||||||||||||||||||||||||||
Initial Cost | Total Cost | ||||||||||||||||||||||||||||||||||||
Land | Building/ Construction in Progress & Improvements | Cost Subsequent to Acquisition/ Construction | Land | Building/ Construction in Progress & Improvements | Total | Accumulated Depreciation | Total Cost, Net of Accumulated Depreciation | Encumbrances | Year of Completion/ Acquisition | ||||||||||||||||||||||||||||
Current communities: | |||||||||||||||||||||||||||||||||||||
ARIZONA | |||||||||||||||||||||||||||||||||||||
Phoenix/Scottsdale | |||||||||||||||||||||||||||||||||||||
Camden Chandler | $ | 5,511 | $ | 62,435 | $ | 11 | $ | 5,511 | $ | 62,446 | $ | 67,957 | $ | 4,247 | $ | 63,710 | 2016 | ||||||||||||||||||||
Camden Copper Square | 4,825 | 23,672 | 7,033 | 4,825 | 30,705 | 35,530 | 16,530 | 19,000 | 2000 | ||||||||||||||||||||||||||||
Camden Foothills | 11,006 | 33,712 | 1 | 11,006 | 33,713 | 44,719 | 3,381 | 41,338 | 2014 | ||||||||||||||||||||||||||||
Camden Hayden | 9,248 | 35,255 | 18 | 9,248 | 35,273 | 44,521 | 2,948 | 41,573 | 2015 | ||||||||||||||||||||||||||||
Camden Legacy | 4,068 | 26,612 | 12,341 | 4,068 | 38,953 | 43,021 | 23,323 | 19,698 | 1998 | ||||||||||||||||||||||||||||
Camden Montierra | 13,687 | 31,727 | 5,020 | 13,687 | 36,747 | 50,434 | 6,095 | 44,339 | 2012 | ||||||||||||||||||||||||||||
Camden Pecos Ranch | 3,362 | 24,492 | 4,836 | 3,362 | 29,328 | 32,690 | 6,611 | 26,079 | 2012 | ||||||||||||||||||||||||||||
Camden San Marcos | 11,520 | 35,166 | 5,445 | 11,520 | 40,611 | 52,131 | 6,921 | 45,210 | 2012 | ||||||||||||||||||||||||||||
Camden San Paloma | 6,480 | 23,045 | 8,925 | 6,480 | 31,970 | 38,450 | 15,154 | 23,296 | 2002 | ||||||||||||||||||||||||||||
Camden Sotelo | 3,376 | 30,576 | 802 | 3,376 | 31,378 | 34,754 | 3,965 | 30,789 | 2013 | ||||||||||||||||||||||||||||
CALIFORNIA | |||||||||||||||||||||||||||||||||||||
Los Angeles/Orange County | |||||||||||||||||||||||||||||||||||||
Camden Crown Valley | 9,381 | 54,210 | 9,377 | 9,381 | 63,587 | 72,968 | 29,769 | 43,199 | 2001 | ||||||||||||||||||||||||||||
Camden Glendale | 21,492 | 93,554 | 20 | 21,492 | 93,574 | 115,066 | 6,270 | 108,796 | 2015 | ||||||||||||||||||||||||||||
Camden Harbor View | 16,079 | 127,459 | 15,608 | 16,079 | 143,067 | 159,146 | 55,185 | 103,961 | $ | 92,562 | 2003 | ||||||||||||||||||||||||||
Camden Main and Jamboree | 17,363 | 75,387 | 1,394 | 17,363 | 76,781 | 94,144 | 16,182 | 77,962 | 47,573 | 2008 | |||||||||||||||||||||||||||
Camden Martinique | 28,401 | 51,861 | 18,959 | 28,401 | 70,820 | 99,221 | 39,941 | 59,280 | 30,691 | 1998 | |||||||||||||||||||||||||||
Camden Sea Palms | 4,336 | 9,930 | 3,961 | 4,336 | 13,891 | 18,227 | 8,110 | 10,117 | 1998 | ||||||||||||||||||||||||||||
The Camden | 18,286 | 115,376 | 3 | 18,286 | 115,379 | 133,665 | 3,189 | 130,476 | 2016 | ||||||||||||||||||||||||||||
San Diego/Inland Empire | |||||||||||||||||||||||||||||||||||||
Camden Landmark | 17,339 | 71,315 | 1,798 | 17,339 | 73,113 | 90,452 | 11,721 | 78,731 | 2012 | ||||||||||||||||||||||||||||
Camden Old Creek | 20,360 | 71,777 | 2,506 | 20,360 | 74,283 | 94,643 | 23,303 | 71,340 | 2007 | ||||||||||||||||||||||||||||
Camden Sierra at Otay Ranch | 10,585 | 49,781 | 5,091 | 10,585 | 54,872 | 65,457 | 23,362 | 42,095 | 2003 | ||||||||||||||||||||||||||||
Camden Tuscany | 3,330 | 36,466 | 4,423 | 3,330 | 40,889 | 44,219 | 16,895 | 27,324 | 2003 | ||||||||||||||||||||||||||||
Camden Vineyards | 4,367 | 28,494 | 3,137 | 4,367 | 31,631 | 35,998 | 14,234 | 21,764 | 2002 | ||||||||||||||||||||||||||||
COLORADO | |||||||||||||||||||||||||||||||||||||
Denver | |||||||||||||||||||||||||||||||||||||
Camden Belleview Station | 8,091 | 44,003 | 1,579 | 8,091 | 45,582 | 53,673 | 6,840 | 46,833 | 2012 | ||||||||||||||||||||||||||||
Camden Caley | 2,047 | 17,445 | 6,064 | 2,047 | 23,509 | 25,556 | 11,661 | 13,895 | 15,326 | 2000 | |||||||||||||||||||||||||||
Camden Denver West | 6,396 | 51,552 | 7,835 | 6,396 | 59,387 | 65,783 | 8,016 | 57,767 | 2012 | ||||||||||||||||||||||||||||
Camden Flatirons | $ | 6,849 | $ | 72,493 | $ | 20 | $ | 6,849 | $ | 72,513 | $ | 79,362 | $ | 6,833 | $ | 72,529 | 2015 | ||||||||||||||||||||
Camden Highlands Ridge | 2,612 | 34,726 | 12,041 | 2,612 | 46,767 | 49,379 | 23,600 | 25,779 | 1996 | ||||||||||||||||||||||||||||
Camden Interlocken | 5,293 | 31,612 | 10,057 | 5,293 | 41,669 | 46,962 | 21,790 | 25,172 | $ | 27,386 | 1999 | ||||||||||||||||||||||||||
Camden Lakeway | 3,915 | 34,129 | 14,000 | 3,915 | 48,129 | 52,044 | 25,949 | 26,095 | 29,219 | 1997 | |||||||||||||||||||||||||||
WASHINGTON DC METRO | |||||||||||||||||||||||||||||||||||||
Camden Ashburn Farm | 4,835 | 22,604 | 2,573 | 4,835 | 25,177 | 30,012 | 9,042 | 20,970 | 2005 | ||||||||||||||||||||||||||||
Camden College Park | 16,409 | 91,503 | 7,398 | 16,409 | 98,901 | 115,310 | 19,027 | 96,283 | 2008 | ||||||||||||||||||||||||||||
Camden Dulles Station | 10,807 | 61,548 | 3,376 | 10,807 | 64,924 | 75,731 | 18,163 | 57,568 | 2008 | ||||||||||||||||||||||||||||
Camden Fair Lakes | 15,515 | 104,223 | 10,403 | 15,515 | 114,626 | 130,141 | 40,501 | 89,640 | 2005 | ||||||||||||||||||||||||||||
Camden Fairfax Corner | 8,484 | 72,953 | 8,130 | 8,484 | 81,083 | 89,567 | 26,850 | 62,717 | 2006 | ||||||||||||||||||||||||||||
Camden Fallsgrove | 9,408 | 43,647 | 4,788 | 9,408 | 48,435 | 57,843 | 17,834 | 40,009 | 2005 | ||||||||||||||||||||||||||||
Camden Grand Parc | 7,688 | 35,900 | 2,401 | 7,688 | 38,301 | 45,989 | 13,396 | 32,593 | 2005 | ||||||||||||||||||||||||||||
Camden Lansdowne | 15,502 | 102,267 | 8,473 | 15,502 | 110,740 | 126,242 | 39,777 | 86,465 | 2005 | ||||||||||||||||||||||||||||
Camden Largo Town Center | 8,411 | 44,163 | 3,549 | 8,411 | 47,712 | 56,123 | 16,852 | 39,271 | 2005 | ||||||||||||||||||||||||||||
Camden Monument Place | 9,030 | 54,089 | 1,464 | 9,030 | 55,553 | 64,583 | 17,281 | 47,302 | 2007 | ||||||||||||||||||||||||||||
Camden NoMa | 19,442 | 82,302 | 51 | 19,442 | 82,353 | 101,795 | 10,455 | 91,340 | 2014 | ||||||||||||||||||||||||||||
Camden Potomac Yard | 16,498 | 88,317 | 1,478 | 16,498 | 89,795 | 106,293 | 26,233 | 80,060 | 2008 | ||||||||||||||||||||||||||||
Camden Roosevelt | 11,470 | 45,785 | 1,267 | 11,470 | 47,052 | 58,522 | 16,956 | 41,566 | 2005 | ||||||||||||||||||||||||||||
Camden Russett | 13,460 | 61,837 | 5,203 | 13,460 | 67,040 | 80,500 | 24,330 | 56,170 | 45,003 | 2005 | |||||||||||||||||||||||||||
Camden Silo Creek | 9,707 | 45,301 | 2,245 | 9,707 | 47,546 | 57,253 | 17,040 | 40,213 | 2005 | ||||||||||||||||||||||||||||
FLORIDA | |||||||||||||||||||||||||||||||||||||
Southeast Florida | |||||||||||||||||||||||||||||||||||||
Camden Aventura | 12,185 | 47,616 | 11,393 | 12,185 | 59,009 | 71,194 | 22,702 | 48,492 | 2005 | ||||||||||||||||||||||||||||
Camden Boca Raton | 2,201 | 50,062 | 62 | 2,201 | 50,124 | 52,325 | 4,723 | 47,602 | 2014 | ||||||||||||||||||||||||||||
Camden Brickell | 14,621 | 57,031 | 11,728 | 14,621 | 68,759 | 83,380 | 25,949 | 57,431 | 2005 | ||||||||||||||||||||||||||||
Camden Doral | 10,260 | 40,416 | 6,527 | 10,260 | 46,943 | 57,203 | 16,683 | 40,520 | 2005 | ||||||||||||||||||||||||||||
Camden Doral Villas | 6,476 | 25,543 | 6,659 | 6,476 | 32,202 | 38,678 | 11,988 | 26,690 | 2005 | ||||||||||||||||||||||||||||
Camden Las Olas | 12,395 | 79,518 | 9,380 | 12,395 | 88,898 | 101,293 | 32,491 | 68,802 | 2005 | ||||||||||||||||||||||||||||
Camden Plantation | 6,299 | 77,964 | 8,533 | 6,299 | 86,497 | 92,796 | 31,702 | 61,094 | 2005 | ||||||||||||||||||||||||||||
Camden Portofino | 9,867 | 38,702 | 5,706 | 9,867 | 44,408 | 54,275 | 16,319 | 37,956 | 2005 | ||||||||||||||||||||||||||||
Orlando | |||||||||||||||||||||||||||||||||||||
Camden Hunter's Creek | 4,156 | 20,925 | 5,145 | 4,156 | 26,070 | 30,226 | 9,747 | 20,479 | 2005 | ||||||||||||||||||||||||||||
Camden Lago Vista | $ | 3,497 | $ | 29,623 | $ | 4,481 | $ | 3,497 | $ | 34,104 | $ | 37,601 | $ | 12,642 | $ | 24,959 | 2005 | ||||||||||||||||||||
Camden LaVina | 12,907 | 42,617 | 209 | 12,907 | 42,826 | 55,733 | 9,653 | 46,080 | 2012 | ||||||||||||||||||||||||||||
Camden Lee Vista | 4,350 | 34,643 | 6,117 | 4,350 | 40,760 | 45,110 | 21,084 | 24,026 | 2000 | ||||||||||||||||||||||||||||
Camden Orange Court | 5,319 | 40,733 | 2,636 | 5,319 | 43,369 | 48,688 | 12,631 | 36,057 | 2008 | ||||||||||||||||||||||||||||
Camden Town Square | 13,127 | 45,997 | 175 | 13,127 | 46,172 | 59,299 | 8,758 | 50,541 | 2012 | ||||||||||||||||||||||||||||
Camden World Gateway | 5,785 | 51,821 | 7,464 | 5,785 | 59,285 | 65,070 | 20,801 | 44,269 | 2005 | ||||||||||||||||||||||||||||
Tampa/St. Petersburg | |||||||||||||||||||||||||||||||||||||
Camden Bay | 7,450 | 63,283 | 12,145 | 7,450 | 75,428 | 82,878 | 37,207 | 45,671 | 1998/2002 | ||||||||||||||||||||||||||||
Camden Montague | 3,576 | 16,534 | 184 | 3,576 | 16,718 | 20,294 | 3,821 | 16,473 | 2012 | ||||||||||||||||||||||||||||
Camden Preserve | 1,206 | 17,982 | 7,447 | 1,206 | 25,429 | 26,635 | 14,567 | 12,068 | 1997 | ||||||||||||||||||||||||||||
Camden Royal Palms | 2,147 | 38,339 | 2,758 | 2,147 | 41,097 | 43,244 | 12,789 | 30,455 | 2007 | ||||||||||||||||||||||||||||
Camden Westchase Park | 11,955 | 36,254 | 169 | 11,955 | 36,423 | 48,378 | 7,287 | 41,091 | 2012 | ||||||||||||||||||||||||||||
GEORGIA | |||||||||||||||||||||||||||||||||||||
Atlanta | |||||||||||||||||||||||||||||||||||||
Camden Brookwood | 7,174 | 31,984 | 7,438 | 7,174 | 39,422 | 46,596 | 15,322 | 31,274 | $ | 22,590 | 2005 | ||||||||||||||||||||||||||
Camden Creekstone | 5,017 | 19,912 | 2,067 | 5,017 | 21,979 | 26,996 | 3,532 | 23,464 | 2012 | ||||||||||||||||||||||||||||
Camden Deerfield | 4,895 | 21,922 | 6,955 | 4,895 | 28,877 | 33,772 | 11,072 | 22,700 | 19,191 | 2005 | |||||||||||||||||||||||||||
Camden Dunwoody | 5,290 | 23,642 | 8,056 | 5,290 | 31,698 | 36,988 | 12,410 | 24,578 | 21,136 | 2005 | |||||||||||||||||||||||||||
Camden Fourth Ward | 10,477 | 51,258 | 462 | 10,477 | 51,720 | 62,197 | 4,810 | 57,387 | 2014 | ||||||||||||||||||||||||||||
Camden Midtown Atlanta | 6,196 | 33,828 | 9,290 | 6,196 | 43,118 | 49,314 | 15,596 | 33,718 | 20,534 | 2005 | |||||||||||||||||||||||||||
Camden Paces | 15,262 | 102,377 | 124 | 15,262 | 102,501 | 117,763 | 8,789 | 108,974 | 2015 | ||||||||||||||||||||||||||||
Camden Peachtree City | 6,536 | 29,063 | 6,459 | 6,536 | 35,522 | 42,058 | 13,187 | 28,871 | 2005 | ||||||||||||||||||||||||||||
Camden Shiloh | 4,181 | 18,798 | 5,130 | 4,181 | 23,928 | 28,109 | 9,352 | 18,757 | 10,483 | 2005 | |||||||||||||||||||||||||||
Camden St. Clair | 7,526 | 27,486 | 7,278 | 7,526 | 34,764 | 42,290 | 13,860 | 28,430 | 21,614 | 2005 | |||||||||||||||||||||||||||
Camden Stockbridge | 5,071 | 22,693 | 3,837 | 5,071 | 26,530 | 31,601 | 10,234 | 21,367 | 14,311 | 2005 | |||||||||||||||||||||||||||
Camden Vantage | 11,787 | 68,822 | 2,226 | 11,787 | 71,048 | 82,835 | 9,245 | 73,590 | 2013 | ||||||||||||||||||||||||||||
NORTH CAROLINA | |||||||||||||||||||||||||||||||||||||
Charlotte | |||||||||||||||||||||||||||||||||||||
Camden Ballantyne | $ | 4,503 | $ | 30,250 | $ | 7,866 | $ | 4,503 | $ | 38,116 | $ | 42,619 | $ | 15,357 | $ | 27,262 | $ | 25,986 | 2005 | ||||||||||||||||||
Camden Cotton Mills | 4,246 | 19,147 | 5,918 | 4,246 | 25,065 | 29,311 | 10,341 | 18,970 | 2005 | ||||||||||||||||||||||||||||
Camden Dilworth | 516 | 16,633 | 2,195 | 516 | 18,828 | 19,344 | 6,611 | 12,733 | 13,053 | 2006 | |||||||||||||||||||||||||||
Camden Fairview | 1,283 | 7,223 | 3,939 | 1,283 | 11,162 | 12,445 | 5,098 | 7,347 | 2005 | ||||||||||||||||||||||||||||
Camden Foxcroft | 1,408 | 7,919 | 4,099 | 1,408 | 12,018 | 13,426 | 5,483 | 7,943 | 2005 | ||||||||||||||||||||||||||||
Camden Foxcroft II | 1,152 | 6,499 | 2,489 | 1,152 | 8,988 | 10,140 | 3,723 | 6,417 | 2005 | ||||||||||||||||||||||||||||
Camden Grandview | 7,570 | 33,859 | 8,128 | 7,570 | 41,987 | 49,557 | 16,267 | 33,290 | 2005 | ||||||||||||||||||||||||||||
Camden Sedgebrook | 5,266 | 29,211 | 7,003 | 5,266 | 36,214 | 41,480 | 14,502 | 26,978 | 21,274 | 2005 | |||||||||||||||||||||||||||
Camden South End Square | 6,625 | 29,175 | 8,732 | 6,625 | 37,907 | 44,532 | 13,976 | 30,556 | 2005 | ||||||||||||||||||||||||||||
Camden Stonecrest | 3,941 | 22,021 | 5,776 | 3,941 | 27,797 | 31,738 | 11,479 | 20,259 | 2005 | ||||||||||||||||||||||||||||
Camden Touchstone | 1,203 | 6,772 | 2,925 | 1,203 | 9,697 | 10,900 | 4,581 | 6,319 | 2005 | ||||||||||||||||||||||||||||
Raleigh | |||||||||||||||||||||||||||||||||||||
Camden Crest | 4,412 | 31,108 | 5,551 | 4,412 | 36,659 | 41,071 | 13,417 | 27,654 | 2005 | ||||||||||||||||||||||||||||
Camden Governor's Village | 3,669 | 20,508 | 3,566 | 3,669 | 24,074 | 27,743 | 9,404 | 18,339 | 12,984 | 2005 | |||||||||||||||||||||||||||
Camden Lake Pine | 5,746 | 31,714 | 8,333 | 5,746 | 40,047 | 45,793 | 15,924 | 29,869 | 26,172 | 2005 | |||||||||||||||||||||||||||
Camden Manor Park | 2,535 | 47,159 | 2,448 | 2,535 | 49,607 | 52,142 | 17,650 | 34,492 | 29,631 | 2006 | |||||||||||||||||||||||||||
Camden Overlook | 4,591 | 25,563 | 8,409 | 4,591 | 33,972 | 38,563 | 13,724 | 24,839 | 2005 | ||||||||||||||||||||||||||||
Camden Reunion Park | 3,302 | 18,457 | 6,037 | 3,302 | 24,494 | 27,796 | 9,797 | 17,999 | 19,931 | 2005 | |||||||||||||||||||||||||||
Camden Westwood | 4,567 | 25,519 | 5,037 | 4,567 | 30,556 | 35,123 | 11,839 | 23,284 | 19,878 | 2005 | |||||||||||||||||||||||||||
TEXAS | |||||||||||||||||||||||||||||||||||||
Austin | |||||||||||||||||||||||||||||||||||||
Camden Cedar Hills | 2,684 | 20,931 | 696 | 2,684 | 21,627 | 24,311 | 6,893 | 17,418 | 2008 | ||||||||||||||||||||||||||||
Camden Gaines Ranch | 5,094 | 37,100 | 9,595 | 5,094 | 46,695 | 51,789 | 17,738 | 34,051 | 2005 | ||||||||||||||||||||||||||||
Camden Huntingdon | 2,289 | 17,393 | 9,781 | 2,289 | 27,174 | 29,463 | 16,392 | 13,071 | 1995 | ||||||||||||||||||||||||||||
Camden La Frontera | 3,250 | 32,376 | 7 | 3,250 | 32,383 | 35,633 | 3,377 | 32,256 | 2015 | ||||||||||||||||||||||||||||
Camden Lamar Heights | 3,988 | 42,773 | 34 | 3,988 | 42,807 | 46,795 | 4,359 | 42,436 | 2015 | ||||||||||||||||||||||||||||
Camden Stoneleigh | 3,498 | 31,285 | 7,578 | 3,498 | 38,863 | 42,361 | 14,188 | 28,173 | 2006 | ||||||||||||||||||||||||||||
Corpus Christi | |||||||||||||||||||||||||||||||||||||
Camden Breakers | 1,055 | 13,024 | 9,004 | 1,055 | 22,028 | 23,083 | 13,403 | 9,680 | 1996 | ||||||||||||||||||||||||||||
Camden Copper Ridge | 1,204 | 9,180 | 8,508 | 1,204 | 17,688 | 18,892 | 13,757 | 5,135 | 1993 | ||||||||||||||||||||||||||||
Camden Miramar | — | 38,784 | 21,083 | — | 59,867 | 59,867 | 25,274 | 34,593 | 1994-2014 | ||||||||||||||||||||||||||||
Dallas/Fort Worth | |||||||||||||||||||||||||||||||||||||
Camden Addison | $ | 11,516 | $ | 29,332 | $ | 7,250 | $ | 11,516 | $ | 36,582 | $ | 48,098 | $ | 8,298 | $ | 39,800 | 2012 | ||||||||||||||||||||
Camden Belmont | 12,521 | 61,522 | 2,227 | 12,521 | 63,749 | 76,270 | 10,514 | 65,756 | 2012 | ||||||||||||||||||||||||||||
Camden Buckingham | 2,704 | 21,251 | 9,438 | 2,704 | 30,689 | 33,393 | 17,237 | 16,156 | 1997 | ||||||||||||||||||||||||||||
Camden Centreport | 1,613 | 12,644 | 6,240 | 1,613 | 18,884 | 20,497 | 10,497 | 10,000 | 1997 | ||||||||||||||||||||||||||||
Camden Cimarron | 2,231 | 14,092 | 7,115 | 2,231 | 21,207 | 23,438 | 13,663 | 9,775 | 1997 | ||||||||||||||||||||||||||||
Camden Farmers Market | 17,341 | 74,193 | 18,121 | 17,341 | 92,314 | 109,655 | 41,654 | 68,001 | $ | 50,643 | 2001/2005 | ||||||||||||||||||||||||||
Camden Henderson | 3,842 | 15,256 | 335 | 3,842 | 15,591 | 19,433 | 2,969 | 16,464 | 2012 | ||||||||||||||||||||||||||||
Camden Legacy Creek | 2,052 | 12,896 | 6,212 | 2,052 | 19,108 | 21,160 | 11,448 | 9,712 | 1997 | ||||||||||||||||||||||||||||
Camden Legacy Park | 2,560 | 15,449 | 7,279 | 2,560 | 22,728 | 25,288 | 13,368 | 11,920 | 13,843 | 1997 | |||||||||||||||||||||||||||
Camden Valley Park | 3,096 | 14,667 | 13,924 | 3,096 | 28,591 | 31,687 | 26,535 | 5,152 | 1994 | ||||||||||||||||||||||||||||
Camden Victory Park | 13,445 | 71,113 | 2 | 13,445 | 71,115 | 84,560 | 2,432 | 82,128 | 2016 | ||||||||||||||||||||||||||||
Houston | |||||||||||||||||||||||||||||||||||||
Camden City Centre | 4,976 | 44,735 | 2,318 | 4,976 | 47,053 | 52,029 | 14,801 | 37,228 | 33,749 | 2007 | |||||||||||||||||||||||||||
Camden City Centre II | 5,101 | 28,131 | 52 | 5,101 | 28,183 | 33,284 | 5,304 | 27,980 | 2013 | ||||||||||||||||||||||||||||
Camden Greenway | 16,916 | 43,933 | 18,563 | 16,916 | 62,496 | 79,412 | 33,584 | 45,828 | 52,320 | 1999 | |||||||||||||||||||||||||||
Camden Holly Springs | 11,108 | 42,852 | 10,939 | 11,108 | 53,791 | 64,899 | 11,147 | 53,752 | 2012 | ||||||||||||||||||||||||||||
Camden Midtown | 4,583 | 18,026 | 9,292 | 4,583 | 27,318 | 31,901 | 15,458 | 16,443 | 28,020 | 1999 | |||||||||||||||||||||||||||
Camden Oak Crest | 2,078 | 20,941 | 5,256 | 2,078 | 26,197 | 28,275 | 11,560 | 16,715 | 17,295 | 2003 | |||||||||||||||||||||||||||
Camden Park | 4,922 | 16,453 | 4,906 | 4,922 | 21,359 | 26,281 | 4,359 | 21,922 | 2012 | ||||||||||||||||||||||||||||
Camden Plaza | 7,204 | 31,044 | 1,774 | 7,204 | 32,818 | 40,022 | 6,912 | 33,110 | 20,288 | 2007 | |||||||||||||||||||||||||||
Camden Post Oak | 14,056 | 92,515 | 11,936 | 14,056 | 104,451 | 118,507 | 13,277 | 105,230 | 2013 | ||||||||||||||||||||||||||||
Camden Royal Oaks | 1,055 | 20,046 | 1,369 | 1,055 | 21,415 | 22,470 | 7,796 | 14,674 | 2006 | ||||||||||||||||||||||||||||
Camden Royal Oaks II | 587 | 12,743 | 16 | 587 | 12,759 | 13,346 | 2,760 | 10,586 | 2012 | ||||||||||||||||||||||||||||
Camden Stonebridge | 1,016 | 7,137 | 5,162 | 1,016 | 12,299 | 13,315 | 7,942 | 5,373 | 1993 | ||||||||||||||||||||||||||||
Camden Sugar Grove | 7,614 | 27,594 | 2,728 | 7,614 | 30,322 | 37,936 | 5,784 | 32,152 | 2012 | ||||||||||||||||||||||||||||
Camden Travis Street | 1,780 | 29,104 | 784 | 1,780 | 29,888 | 31,668 | 8,306 | 23,362 | 21,598 | 2010 | |||||||||||||||||||||||||||
Camden Vanderbilt | 16,076 | 44,918 | 21,333 | 16,076 | 66,251 | 82,327 | 41,401 | 40,926 | 73,068 | 1994/1997 | |||||||||||||||||||||||||||
Camden Whispering Oaks | 1,188 | 26,242 | 1,149 | 1,188 | 27,391 | 28,579 | 8,608 | 19,971 | 2008 | ||||||||||||||||||||||||||||
Total current communities: | $ | 958,240 | $ | 5,162,501 | $ | 733,801 | $ | 958,240 | $ | 5,896,302 | $ | 6,854,542 | $ | 1,888,883 | $ | 4,965,659 | $ | 897,352 | |||||||||||||||||||
Communities under construction: | |||||||||||||||||||||||||||||||||||||
Name / location | |||||||||||||||||||||||||||||||||||||
Camden Gallery (1) Charlotte, NC | $ | 58,444 | $ | 58,444 | $ | 58,444 | $ | 1,527 | $ | 56,917 | N/A | ||||||||||||||||||||||||||
Camden Lincoln Station (1) Denver, CO | 50,521 | 50,521 | 50,521 | 239 | 50,282 | N/A | |||||||||||||||||||||||||||||||
Camden NoMa II Washington, DC | 99,254 | 99,254 | 99,254 | — | 99,254 | N/A | |||||||||||||||||||||||||||||||
Camden Shady Grove Rockville, MD | 90,345 | 90,345 | 90,345 | 7 | 90,338 | N/A | |||||||||||||||||||||||||||||||
Camden McGowen Station Houston, TX | 35,646 | 35,646 | 35,646 | — | 35,646 | N/A | |||||||||||||||||||||||||||||||
Camden Washingtonian Gaithersburg, MD | 31,753 | 31,753 | 31,753 | — | 31,753 | N/A | |||||||||||||||||||||||||||||||
Camden North End I Phoenix, AZ | 25,530 | 25,530 | 25,530 | — | 25,530 | N/A | |||||||||||||||||||||||||||||||
Total communities under construction: | $ | — | $ | 391,493 | $ | — | $ | — | $ | 391,493 | $ | 391,493 | $ | 1,773 | $ | 389,720 | $ | — | |||||||||||||||||||
Development pipeline communities: | |||||||||||||||||||||||||||||||||||||
Name/location | |||||||||||||||||||||||||||||||||||||
Camden Grandview II Charlotte, NC | $ | 6,073 | $ | 6,073 | $ | 6,073 | $ | 6,073 | N/A | ||||||||||||||||||||||||||||
Camden Buckhead Atlanta, GA | 14,836 | 14,836 | 14,836 | 14,836 | N/A | ||||||||||||||||||||||||||||||||
Camden RiNo Denver, CO | 17,014 | 17,014 | 17,014 | 17,014 | N/A | ||||||||||||||||||||||||||||||||
Camden Gallery II Charlotte, NC | 998 | 998 | 998 | 998 | N/A | ||||||||||||||||||||||||||||||||
Camden Arts District Los Angeles, CA | 16,770 | 16,770 | 16,770 | 16,770 | N/A | ||||||||||||||||||||||||||||||||
Camden Conte Houston, TX | 22,422 | 22,422 | 22,422 | 22,422 | N/A | ||||||||||||||||||||||||||||||||
Camden North End II Phoenix, AZ | 11,457 | 11,457 | 11,457 | 11,457 | N/A | ||||||||||||||||||||||||||||||||
Camden Atlantic Plantation, FL | 14,224 | 14,224 | 14,224 | 14,224 | N/A | ||||||||||||||||||||||||||||||||
Camden Paces III Atlanta, GA | 11,127 | 11,127 | 11,127 | 11,127 | N/A | ||||||||||||||||||||||||||||||||
Total development pipeline communities: | $ | — | $ | 114,921 | $ | — | $ | — | $ | 114,921 | $ | 114,921 | $ | — | $ | 114,921 | $ | — | |||||||||||||||||||
Land Holdings | $ | — | $ | 11,058 | $ | — | $ | 11,058 | $ | 11,058 | $ | 11,058 | N/A | ||||||||||||||||||||||||
Corporate | — | 4,676 | — | 4,676 | 4,676 | 4,676 | N/A | ||||||||||||||||||||||||||||||
$ | — | $ | 15,734 | $ | — | $ | — | $ | 15,734 | $ | 15,734 | $ | — | $ | 15,734 | $ | — | ||||||||||||||||||||
TOTAL | $ | 958,240 | $ | 5,684,649 | $ | 733,801 | $ | 958,240 | $ | 6,418,450 | $ | 7,376,690 | $ | 1,890,656 | $ | 5,486,034 | $ | 897,352 | |||||||||||||||||||
(1) | Property is in lease-up at December 31, 2016. Balances presented here includes costs which are included in buildings and improvements and land on the consolidated balance sheet at December 31, 2016. These costs related to completed unit turns for these properties. |
S-1
Camden Property Trust Real Estate and Accumulated Depreciation As of December 31, 2016 (in thousands) | Schedule III |
The changes in total real estate assets as adjusted for discontinued operations for the years ended December 31:
2016 | 2015 | 2014 | |||||||||
Balance, beginning of period | $ | 7,387,597 | $ | 6,998,233 | $ | 6,655,139 | |||||
Additions during period: | |||||||||||
Acquisition of operating properties and unconsolidated joint ventures | — | — | 61,736 | ||||||||
Development and repositions | 278,447 | 347,429 | 469,040 | ||||||||
Improvements | 65,892 | 66,640 | 52,000 | ||||||||
Deductions during period: | |||||||||||
Cost of real estate sold – other | (355,246 | ) | (24,705 | ) | (172,475 | ) | |||||
Classification to held for sale | — | — | (67,207 | ) | |||||||
Balance, end of period | $ | 7,376,690 | $ | 7,387,597 | $ | 6,998,233 | |||||
The changes in accumulated depreciation for the years ended December 31: | |||||||||||
2016 | 2015 | 2014 | |||||||||
Balance, beginning of period | $ | 1,780,694 | $ | 1,557,004 | $ | 1,477,147 | |||||
Depreciation of real estate assets | 243,403 | 233,955 | 213,964 | ||||||||
Dispositions | (133,441 | ) | (10,265 | ) | (94,043 | ) | |||||
Transfers to held for sale | — | — | (40,064 | ) | |||||||
Balance, end of period | $ | 1,890,656 | $ | 1,780,694 | $ | 1,557,004 | |||||
The aggregate cost for federal income tax purposes at December 31, 2016 was $6.2 billion.
S-2
Camden Property Trust Mortgage Loans on Real Estate As of December 31, 2016 | Schedule IV | |||||||||||||
($ in thousands) Description | Interest Rate | Final Maturity Date | Periodic payment terms | Face amount of mortgages | Carry amount of mortgages (a) | |||||||||
Parking Garage Developer advances Houston, TX | (b) | (c) | (d) | $ | 18,000 | $ | 17,224 | |||||||
(a) | The aggregate cost at December 31, 2016 for federal income tax purposes was approximately $17,224. |
(b) | This loan currently bears interest at 4% and will increase to 7% on any unpaid principal balance on the later of January 1, 2018 or January 1 of the year following completion of our planned apartment project at an adjacent location. |
(c) | This loan matures on October 1 in the 13th year following the year of completion of the parking garage. |
(d) | Periodic payments are currently interest only, and will consist of interest and principal payments following the year of completion of the parking garage through maturity. |
Changes in mortgage loans for the years ended December 31 are summarized below:
2016 | 2015 | 2014 | |||||||||
Balance, beginning of period | $ | 13,161 | $ | 3,395 | $ | 3,395 | |||||
Additions: | |||||||||||
Advances under real estate loans | 7,458 | 9,766 | — | ||||||||
Deductions: | |||||||||||
Collections of principal and loan payoff | (3,395 | ) | — | — | |||||||
Balance, end of period | $ | 17,224 | $ | 13,161 | $ | 3,395 | |||||
S-3