Attached files
| file | filename |
|---|---|
| 8-K - 8-K - HEXION INC. | d265290d8k.htm |
| Exhibit 99.1
|
Hexion Inc.
High Yield Investor Presentation
$460,000,000 First-Priority Senior Secured Notes due 2022
CONFIDENTIAL
|
|
Forward-Looking Statements Hexion Inc.
Certain statements in this presentation are forward-looking statements within the meaning of and made pursuant to the safe harbor provisions of Section 27A of the Securities Act of 1933, as amended, and Section 21E of the Securities Exchange Act of 1934, as amended. In addition, our management may from time to time make oral forward-looking statements. All statements, other than statements of historical facts, are forward-looking statements. Forward-looking statements may be identified by the words “believe,” “expect,” “anticipate,” “project,” “might,” “plan,” “estimate,” “may,” “will,” “could,” “should,” “seek,” “intend” or similar expressions. Forward-looking statements reflect our current expectations and assumptions regarding our business, the economy and other future events and conditions and are based on currently available financial, economic and competitive data and our current business plans. Actual results could vary materially depending on risks and uncertainties that may affect our operations, markets, services, prices and other factors as discussed in the Risk Factors section of the offering circular and our filings with the Securities and Exchange Commission (the “SEC”) incorporated by reference in the offering circular. While we believe our assumptions are reasonable, we caution you against relying on any forward-looking statements as it is very difficult to predict the impact of known factors, and it is impossible for us to anticipate all factors that could affect our actual results. Important factors that could cause actual results to differ materially from those in the forward-looking statements include, but are not limited to, a weakening of global economic and financial conditions, interruptions in the supply of or increased cost of raw materials, the loss of, or difficulties with the further realization of, cost savings in connection with our strategic initiatives, including transactions with our affiliate, Momentive Performance Materials Inc., the impact of our substantial indebtedness, our failure to comply with financial covenants under our credit facilities or other debt, pricing actions by our competitors that could affect our operating margins, changes in governmental regulations and related compliance and litigation costs and the other factors listed in the Risk Factors section of the offering circular and our SEC filings incorporated by reference in the offering circular. For a more detailed discussion of these and other risk factors, see the Risk Factors section in the offering circular related to this offering, our most recent Annual Report on Form 10-K and our other filings made with the SEC and incorporated by reference into the offering circular. All forward-looking statements are expressly qualified in their entirety by this cautionary notice. The forward-looking statements made by us speak only as of the date on which they are made. Factors or events that could cause our actual results to differ may emerge from time to time. We undertake no obligation to publicly update or revise any forward-looking statement as a result of new information, future events or otherwise, except as otherwise required by law.
This presentation contains non-GAAP financial information. Reconciliation to GAAP is included at the end of the presentation.
2
|
|
Hexion Inc.
Business Overview and Credit Highlights
CONFIDENTIAL
|
|
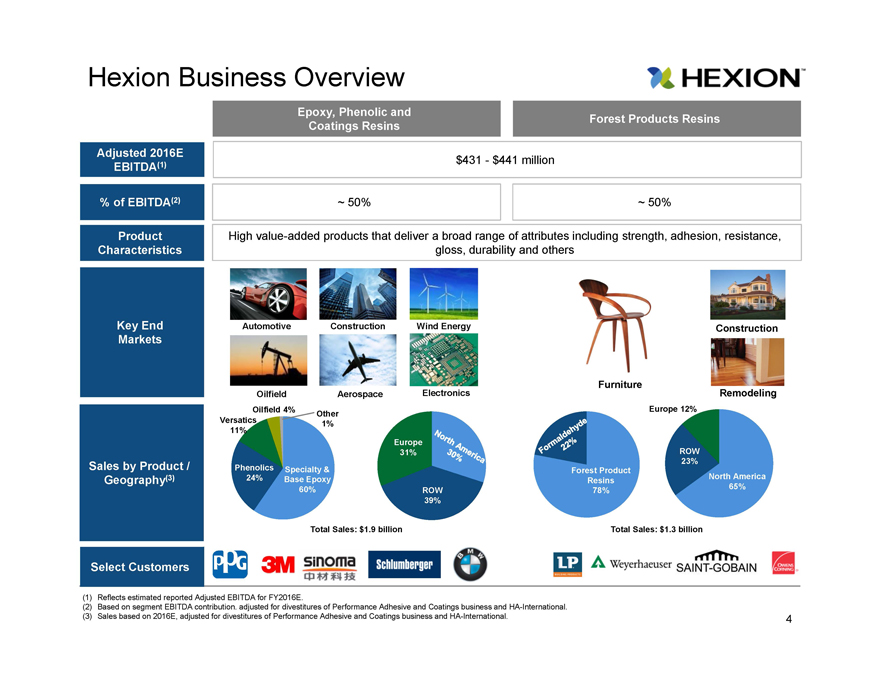
Hexion Business Overview
Epoxy, Phenolic and Forest Products Resins
Coatings Resins
Adjusted 2016E
EBITDA(1) $431—$441 million
% of EBITDA(2) ~ 50%~ 50%
Product High value-added products that deliver a broad range of attributes including strength, adhesion, resistance,
Characteristics gloss, durability and others
Key End Automotive Construction Wind Energy Construction
Markets
Furniture
Oilfield Aerospace Electronics Remodeling
Oilfield 4%Europe 12%
Other
Versatics1%
11%
Europe
31%ROW
Sales by Product / Phenolics Specialty & Forest Product 23%
Geography(3) 24%Base Epoxy Resins North America
60%ROW78%65%
39%
Total Sales: $1.9 billionTotal Sales: $1.3 billion
Select Customers
(1) Reflects estimated reported Adjusted EBITDA for FY2016E.
(2) Based on segment EBITDA contribution. adjusted for divestitures of Performance Adhesive and Coatings business and HA-International.
(3) Sales based on 2016E, adjusted for divestitures of Performance Adhesive and Coatings business and HA-International. 4
|
|
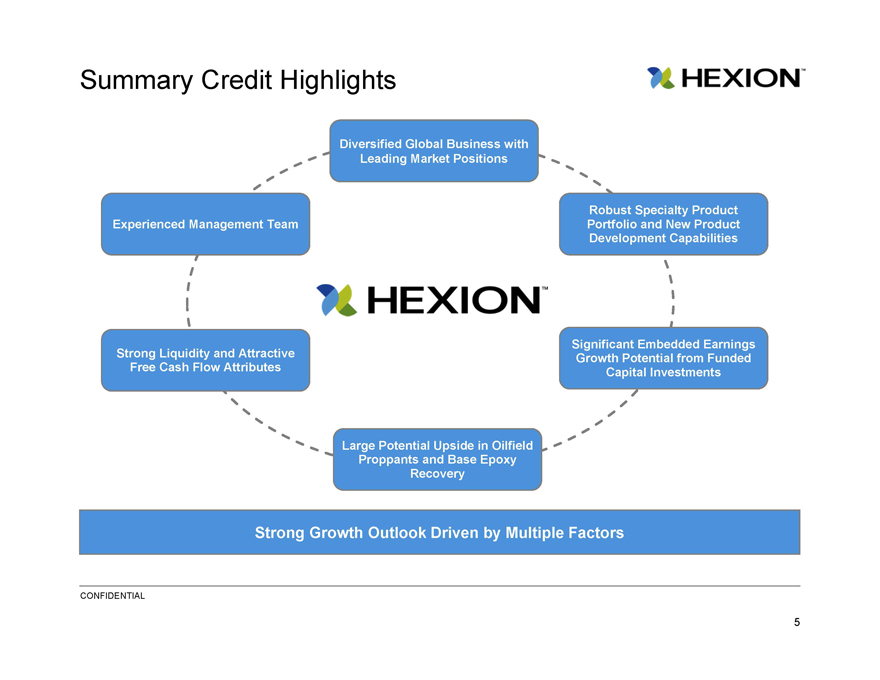
Summary Credit Highlights
Diversified Global Business with
Leading Market Positions
Robust Specialty Product
Experienced Management Team Portfolio and New Product
Development Capabilities
Significant Embedded Earnings
Strong Liquidity and Attractive Growth Potential from Funded
Free Cash Flow Attributes Capital Investments
Large Potential Upside in Oilfield
Proppants and Base Epoxy
Recovery
Strong Growth Outlook Driven by Multiple Factors
CONFIDENTIAL
5
|
|
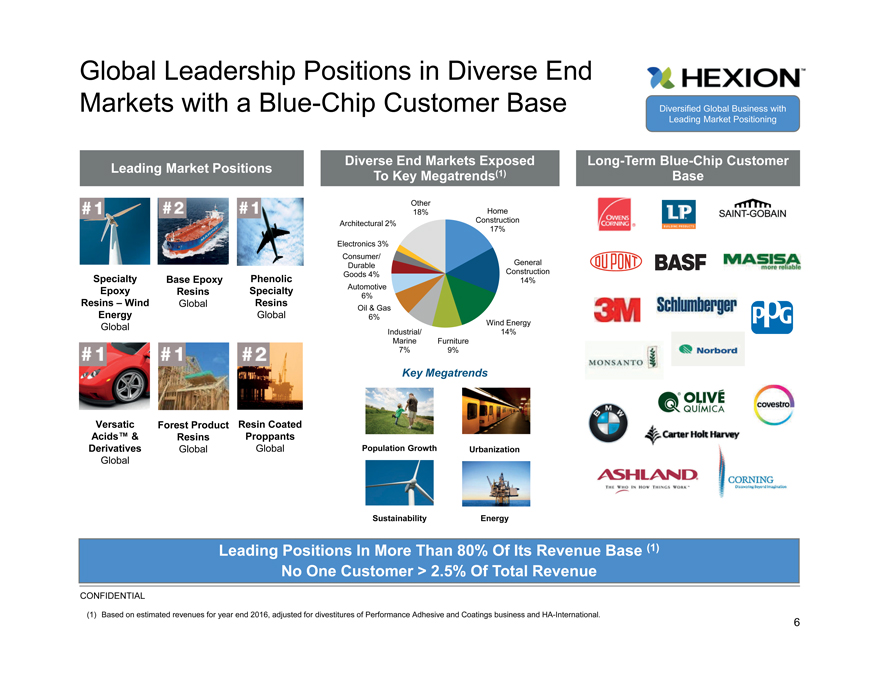
Global Leadership Positions in Diverse End
Markets with a Blue-Chip Customer Base Diversified Global Business with
Leading Market Positioning
Leading Market Positions Diverse End Markets Exposed Long-Term Blue-Chip Customer
To Key Megatrends(1)Base
Other
18%Home
Architectural 2%Construction
17%
Electronics 3%
Consumer/
DurableGeneral
Goods 4%Construction
Specialty Base Epoxy Phenolic14%
Epoxy Resins Specialty Automotive
6%
Resins – Wind Global ResinsOil & Gas
Energy Global6%
Global Wind Energy
Industrial/14%
MarineFurniture
7%9%
Key Megatrends
Versatic Forest Product Resin Coated
Acids™ & Resins Proppants
Derivatives Global Global Population Growth Urbanization
Global
Sustainability Energy
Leading Positions In More Than 80% Of Its Revenue Base (1)
No One Customer > 2.5% Of Total Revenue
CONFIDENTIAL
(1) Based on estimated revenues for year end 2016, adjusted for divestitures of Performance Adhesive and Coatings business and HA-International.
6
|
|
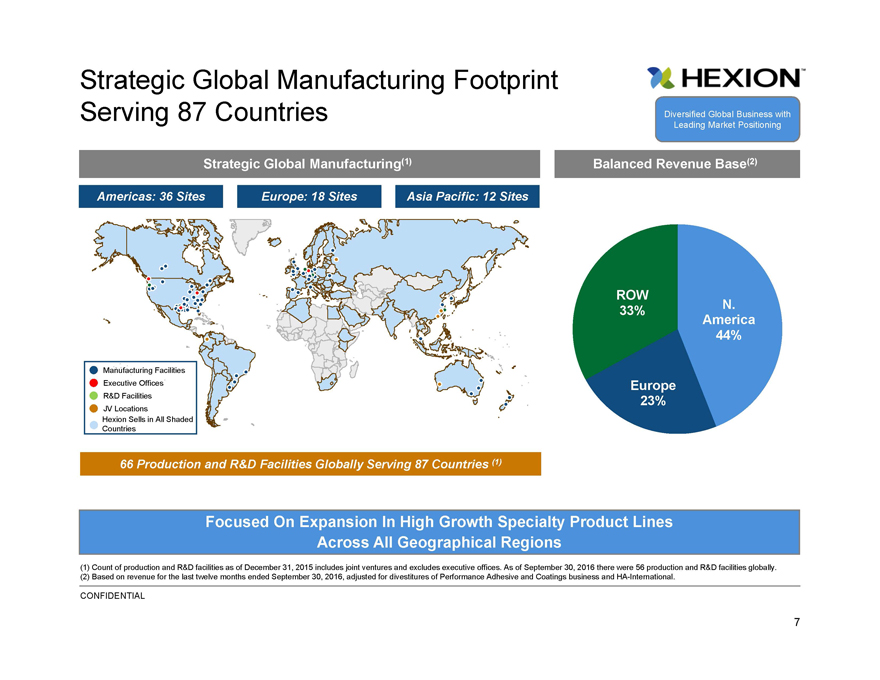
Strategic Global Manufacturing Footprint
Serving 87 Countries Diversified Global Business with
Leading Market Positioning
Strategic Global Manufacturing(1) Balanced Revenue Base(2)
Americas: 36 Sites Europe: 18 Sites Asia Pacific: 12 Sites
ROW
33%N.
America
44%
Manufacturing Facilities
Executive Offices Europe
R&D Facilities 23%
JV Locations
Hexion Sells in All Shaded
Countries
66 Production and R&D Facilities Globally Serving 87 Countries (1)
Focused On Expansion In High Growth Specialty Product Lines
Across All Geographical Regions
(1) Count of production and R&D facilities as of December 31, 2015 includes joint ventures and excludes executive offices. As of September 30, 2016 there were 56 production and R&D facilities globally.
(2) Based on revenue for the last twelve months ended September 30, 2016, adjusted for divestitures of Performance Adhesive and Coatings business and HA-International.
CONFIDENTIAL
7
|
|
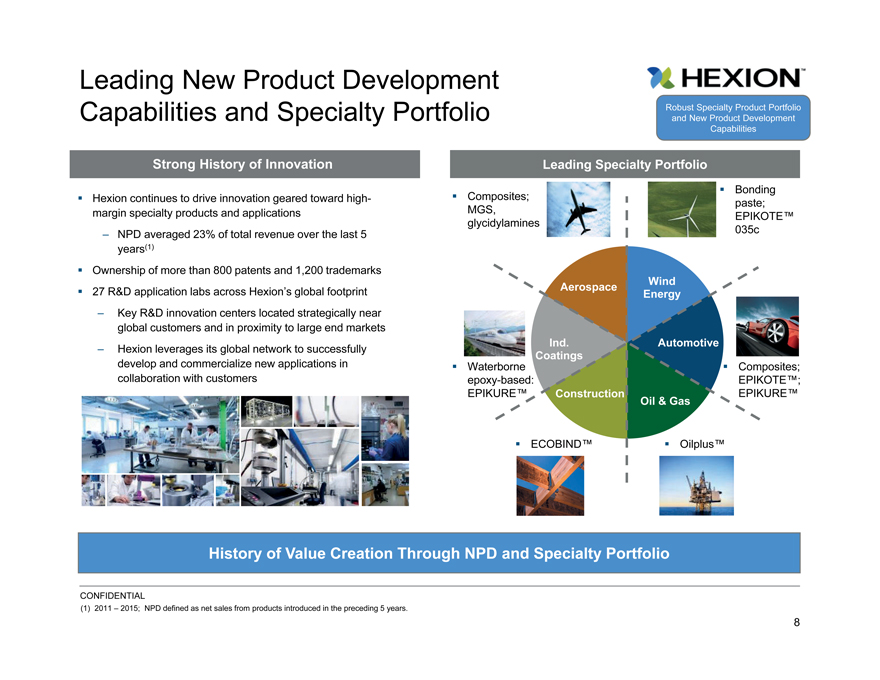
Leading New Product Development
Capabilities and Specialty Portfolio Robust Specialty Product Portfolio
and New Product Development
Capabilities
Strong History of InnovationLeading Specialty Portfolio
Bonding
Hexion continues to drive innovation geared toward high- Composites;paste;
margin specialty products and applications MGS,EPIKOTE™
glycidylamines
– NPD averaged 23% of total revenue over the last 5035c
years(1)
Ownership of more than 800 patents and 1,200 trademarks
AerospaceWind
27 R&D application labs across Hexion’s global footprint Energy
– Key R&D innovation centers located strategically near
global customers and in proximity to large end markets
– Hexion leverages its global network to successfullyInd.Automotive
Coatings
develop and commercialize new applications in Waterborne Composites;
collaboration with customersepoxy-based:EPIKOTE™;
EPIKURE™ConstructionEPIKURE™
Oil & Gas
ECOBIND™ Oilplus™
History of Value Creation Through NPD and Specialty Portfolio
CONFIDENTIAL
(1) 2011 – 2015; NPD defined as net sales from products introduced in the preceding 5 years.
8
|
|
Leading Provider of Specialty Epoxies
Serving the Wind Energy Market Robust Specialty Product Portfolio
and New Product Development
Capabilities
Specialty Epoxy: Well Positioned in Wind Energy Hexion Global Wind Energy Volume
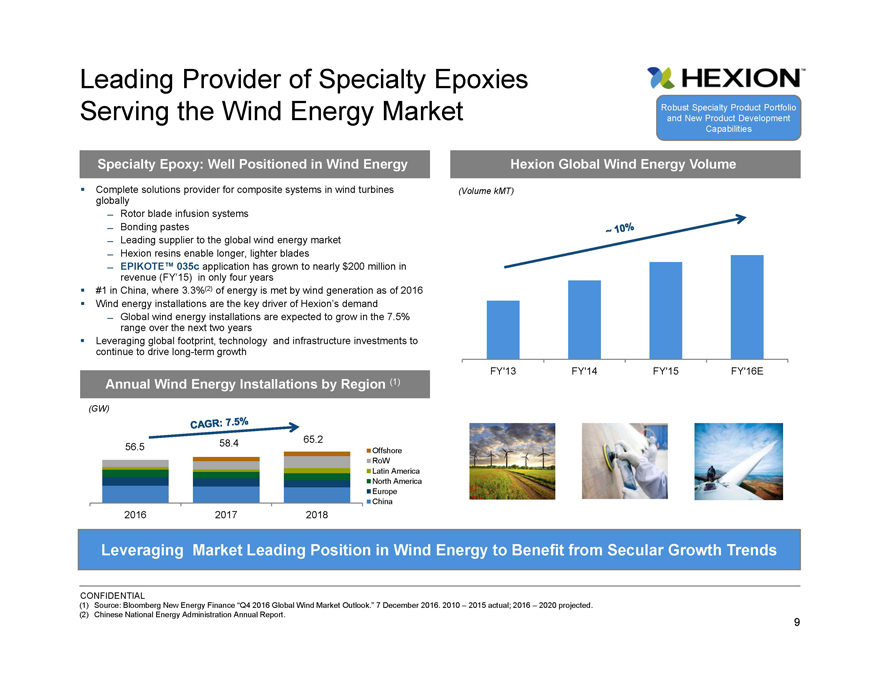
Complete solutions provider for composite systems in wind turbines (Volume kMT)
globally
Rotor blade infusion systems
Bonding pastes
Leading supplier to the global wind energy market
Hexion resins enable longer, lighter blades
EPIKOTE™ 035c application has grown to nearly $200 million in
revenue (FY’15) in only four years
#1 in China, where 3.3%(2) of energy is met by wind generation as of 2016
Wind energy installations are the key driver of Hexion’s demand
Global wind energy installations are expected to grow in the 7.5%
range over the next two years
Leveraging global footprint, technology and infrastructure investments to
continue to drive long-term growth
FY’13FY’14FY’15FY’16E
Annual Wind Energy Installations by Region (1)
(GW)
58.465.2
56.5 Offshore
RoW
Latin America
North America
Europe
China
2016 20172018
Leveraging Market Leading Position in Wind Energy to Benefit from Secular Growth Trends
CONFIDENTIAL
(1) Source: Bloomberg New Energy Finance “Q4 2016 Global Wind Market Outlook.” 7 December 2016. 2010 – 2015 actual; 2016 – 2020 projected.
(2) Chinese National Energy Administration Annual Report.
9
|
|
Forest Products Positioned to Benefit From Ongoing
Housing Recovery and Demand for Sustainable Robust Specialty Product Portfolio
and New Product Development
Products Capabilities
Summary1990 – 2016 North American Housing Starts (1)
Total Housing StartsMulti-Family Housing Starts
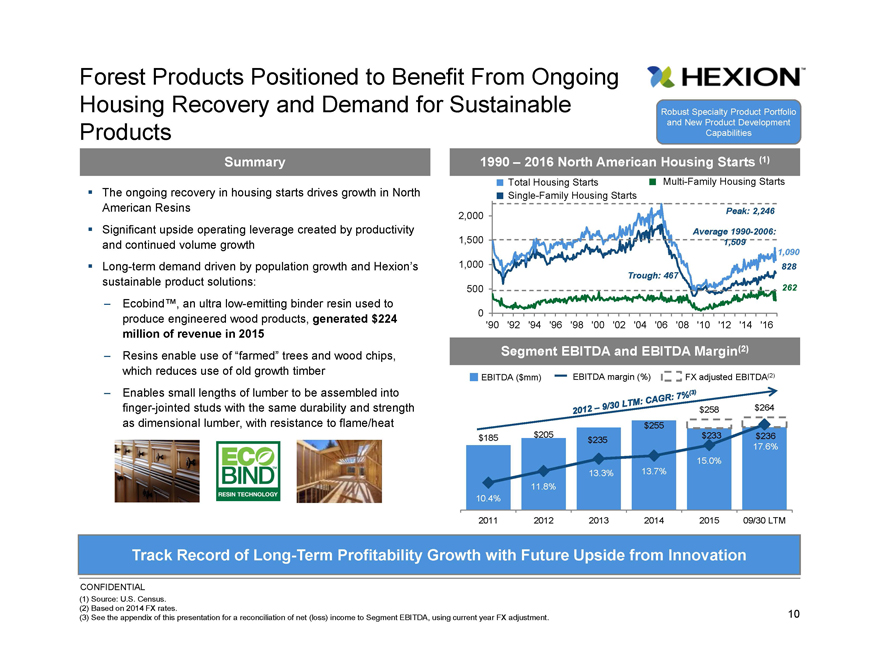
The ongoing recovery in housing starts drives growth in North Single-Family Housing Starts
American Resins Peak: 2,246
2,000
Significant upside operating leverage created by productivity Average 1990-2006:
and continued volume growth 1,5001,509
1,090
Long-term demand driven by population growth and Hexion’s 1,000828
sustainable product solutions: Trough: 467
500262
– Ecobind™, an ultra low-emitting binder resin used to
produce engineered wood products, generated $2240
‘90’92 ‘94 ‘96’98 ‘00 ‘02’04 ‘06’08 ‘10 ‘12’14 ‘16
million of revenue in 2015
– Resins enable use of “farmed” trees and wood chips,Segment EBITDA and EBITDA Margin(2)
which reduces use of old growth timberEBITDA ($mm)EBITDA margin (%)FX adjusted EBITDA(2)
– Enables small lengths of lumber to be assembled into
finger-jointed studs with the same durability and strength$258$264
as dimensional lumber, with resistance to flame/heat$255
$185$205$235$233$236
17.6%
15.0%
13.3%13.7%
11.8%
10.4%
2011201220132014201509/30 LTM
Track Record of Long-Term Profitability Growth with Future Upside from Innovation
CONFIDENTIAL
(1) Source: U.S. Census.
(2) Based on 2014 FX rates.
(3) See the appendix of this presentation for a reconciliation of net (loss) income to Segment EBITDA, using current year FX adjustment. 10
|
|
Significant New Product Development Initiatives in
Composites Market and Automotive Applications Robust Specialty Product Portfolio
and New Product Development
Capabilities
CommentaryCase Studies in Auto Innovation
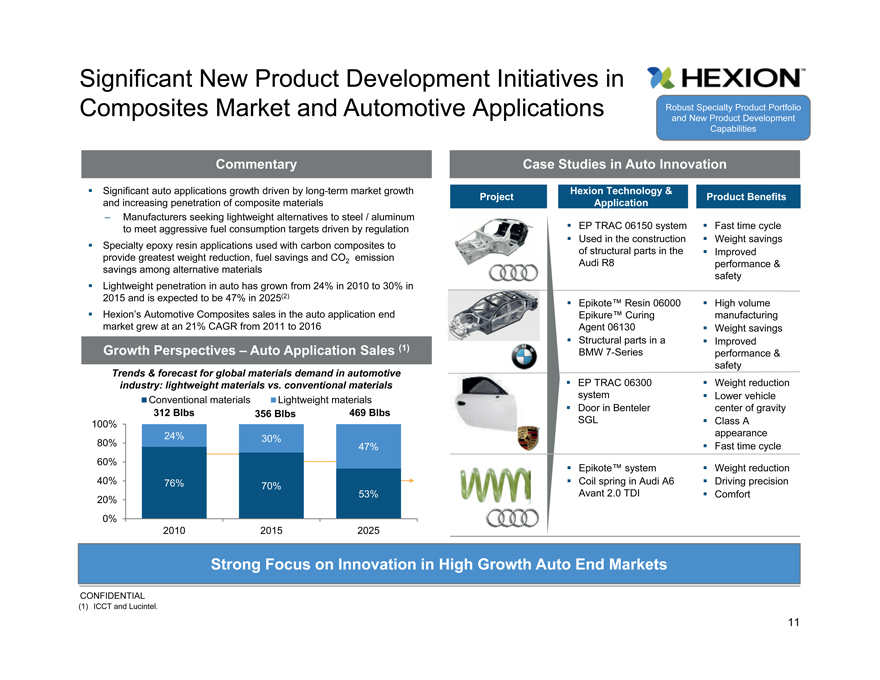
Significant auto applications growth driven by long-term market growth Hexion Technology &
ProjectProduct Benefits
and increasing penetration of composite materials Application
– Manufacturers seeking lightweight alternatives to steel / aluminum
to meet aggressive fuel consumption targets driven by regulation EP TRAC 06150 system Fast time cycle
Used in the construction Weight savings
Specialty epoxy resin applications used with carbon composites to of structural parts in the Improved
provide greatest weight reduction, fuel savings and CO emission
savings among alternative materials 2Audi R8performance &
safety
Lightweight penetration in auto has grown from 24% in 2010 to 30% in
2015 and is expected to be 47% in 2025(2) Epikote™ Resin 06000 High volume
Hexion’s Automotive Composites sales in the auto application end Epikure™ Curingmanufacturing
market grew at an 21% CAGR from 2011 to 2016 Agent 06130 Weight savings
Structural parts in a Improved
Growth Perspectives – Auto Application Sales (1) BMW 7-Seriesperformance &
safety
Trends & forecast for global materials demand in automotive
industry: lightweight materials vs. conventional materials EP TRAC 06300 Weight reduction
Conventional materialsLightweight materialssystem Lower vehicle
312 Blbs356 Blbs469 Blbs Door in Bentelercenter of gravity
100% SGL Class A
24%30%appearance
80% 47% Fast time cycle
60% Epikote™ system Weight reduction
40% 76%70% Coil spring in Audi A6 Driving precision
20% 53%Avant 2.0 TDI Comfort
0%
201020152025
Strong Focus on Innovation in High Growth Auto End Markets
CONFIDENTIAL
(1) ICCT and Lucintel.
11
|
|
Successfully Executing Against Strategic
Significant Embedded Earnings
Growth Capital PlanGrowth Potential from Funded
Capital Investments
Strategic Formaldehyde Investments High-growth Investments Case Study: NextGen Epoxy™
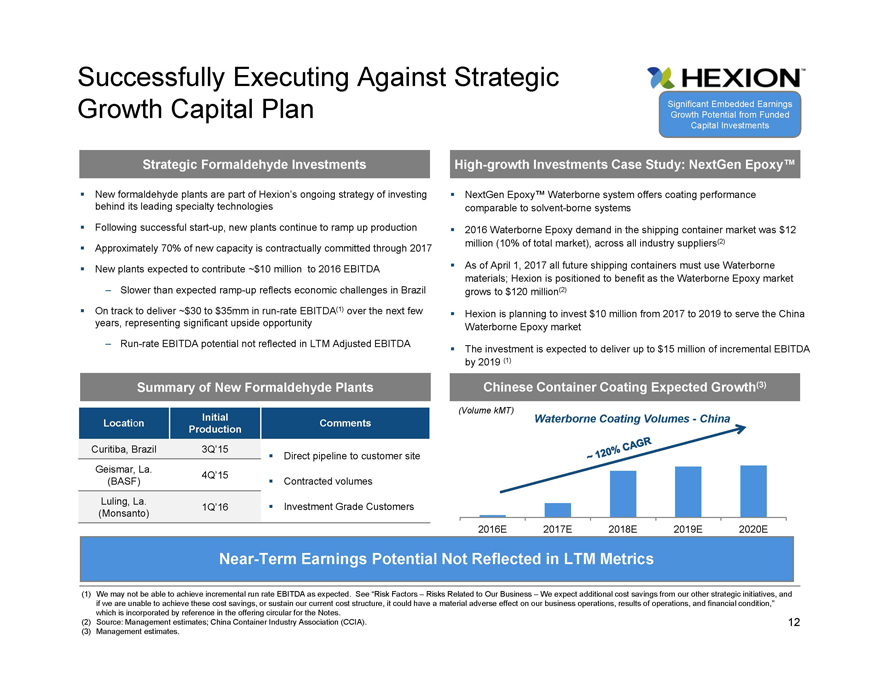
New formaldehyde plants are part of Hexion’s ongoing strategy of investing NextGen Epoxy™ Waterborne system offers coating performance
behind its leading specialty technologies comparable to solvent-borne systems
Following successful start-up, new plants continue to ramp up production 2016 Waterborne Epoxy demand in the shipping container market was $12
Approximately 70% of new capacity is contractually committed through 2017 million (10% of total market), across all industry suppliers(2)
New plants expected to contribute ~$10 million to 2016 EBITDA As of April 1, 2017 all future shipping containers must use Waterborne
materials; Hexion is positioned to benefit as the Waterborne Epoxy market
Slower than expected ramp-up reflects economic challenges in Brazil grows to $120 million(2)
On track to deliver ~$30 to $35mm in run-rate EBITDA(1) over the next few Hexion is planning to invest $10 million from 2017 to 2019 to serve the China
years, representing significant upside opportunity Waterborne Epoxy market
Run-rate EBITDA potential not reflected in LTM Adjusted EBITDA The investment is expected to deliver up to $15 million of incremental EBITDA
by 2019 (1)
(3)
Summary of New Formaldehyde Plants Chinese Container Coating Expected Growth(3)
(Volume kMT)
Location InitialCommentsWaterborne Coating Volumes—China
Production
Curitiba, Brazil 3Q’15 Direct pipeline to customer site
Geismar, La. 4Q’15
(BASF) Contracted volumes
Luling, La. 1Q’16 Investment Grade Customers
(Monsanto)
2016E2017E2018E2019E2020E
Near-Term Earnings Potential Not Reflected in LTM Metrics
(1) We may not be able to achieve incremental run rate EBITDA as expected. See “Risk Factors – Risks Related to Our Business – We expect additional cost savings from our other strategic initiatives, and
if we are unable to achieve these cost savings, or sustain our current cost structure, it could have a material adverse effect on our business operations, results of operations, and financial condition,”
which is incorporated by reference in the offering circular for the Notes.
(2) Source: Management estimates; China Container Industry Association (CCIA). 12
(3) Management estimates.
|
|
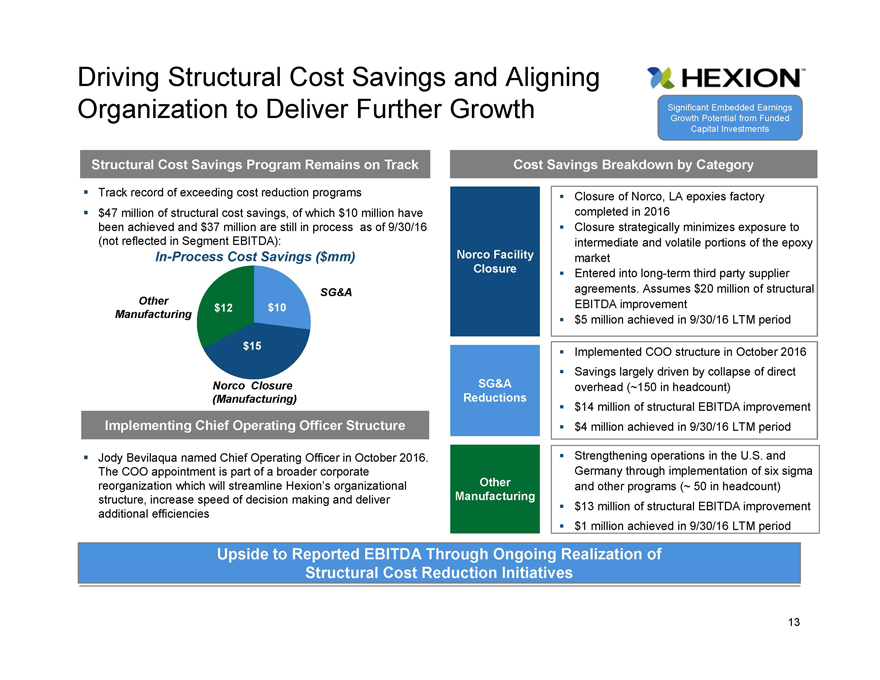
Driving Structural Cost Savings and Aligning
Organization to Deliver Further Growth Significant Embedded Earnings
Growth Potential from Funded
Capital Investments
Structural Cost Savings Program Remains on Track Cost Savings Breakdown by Category
Track record of exceeding cost reduction programs Closure of Norco, LA epoxies factory
$47 million of structural cost savings, of which $10 million have completed in 2016
been achieved and $37 million are still in process as of 9/30/16 Closure strategically minimizes exposure to
(not reflected in Segment EBITDA): intermediate and volatile portions of the epoxy
In-Process Cost Savings ($mm) Norco Facilitymarket
Closure Entered into long-term third party supplier
SG&Aagreements. Assumes $20 million of structural
Other $12$10EBITDA improvement
Manufacturing $5 million achieved in 9/30/16 LTM period
$15 Implemented COO structure in October 2016
Savings largely driven by collapse of direct
Norco ClosureSG&Aoverhead (~150 in headcount)
(Manufacturing)Reductions
$14 million of structural EBITDA improvement
Implementing Chief Operating Officer Structure $4 million achieved in 9/30/16 LTM period
Jody Bevilaqua named Chief Operating Officer in October 2016. Strengthening operations in the U.S. and
The COO appointment is part of a broader corporate Germany through implementation of six sigma
reorganization which will streamline Hexion’s organizational Otherand other programs (~ 50 in headcount)
structure, increase speed of decision making and deliver Manufacturing $13 million of structural EBITDA improvement
additional efficiencies
$1 million achieved in 9/30/16 LTM period
Upside to Reported EBITDA Through Ongoing Realization of
Structural Cost Reduction Initiatives
13
|
|
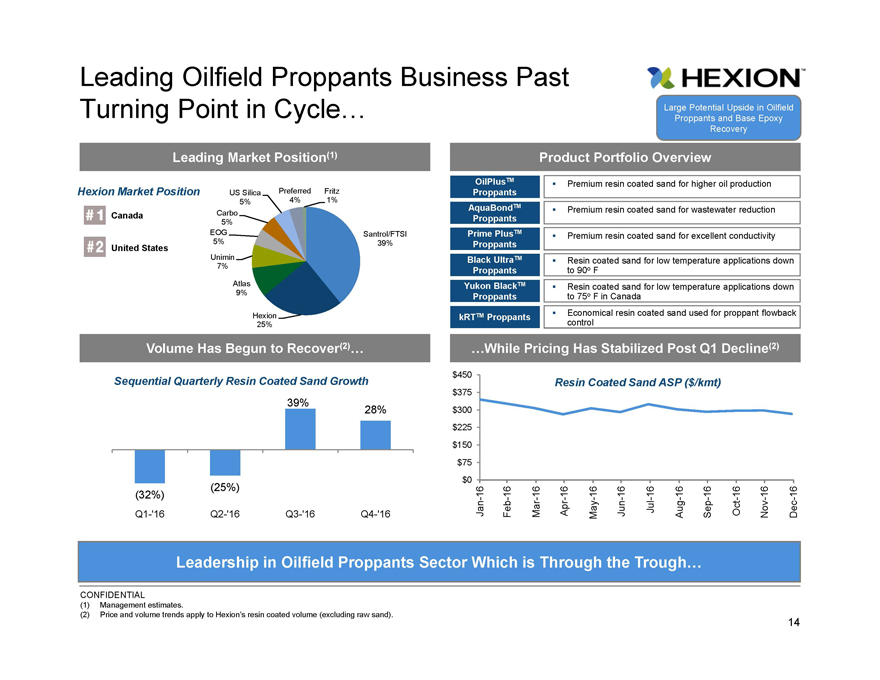
Leading Oilfield Proppants Business Past
Turning Point in Cycle…Large Potential Upside in Oilfield
Proppants and Base Epoxy
Recovery
Leading Market Position(1)Product Portfolio Overview
OilPlusTM Premium resin coated sand for higher oil production
Hexion Market Position US Silica Preferred FritzProppants
5%4%1%
AquaBondTM Premium resin coated sand for wastewater reduction
Canada Carbo 5%Proppants
EOGSantrol/FTSIPrime PlusTM Premium resin coated sand for excellent conductivity
United States 5%39%Proppants
UniminBlack UltraTM Resin coated sand for low temperature applications down
7%Proppantsto 90o F
AtlasYukon BlackTM Resin coated sand for low temperature applications down
9%Proppantsto 75o F in Canada
HexionkRTTM Proppants Economical resin coated sand used for proppant flowback
25%control
Volume Has Begun to Recover(2)… …While Pricing Has Stabilized Post Q1 Decline(2)
$450
Sequential Quarterly Resin Coated Sand Growth Resin Coated Sand ASP ($/kmt)
$375
39%28%$300
$225
$150
$75
$0
(25%)
(32%) - 16 -16- 1616—16—16- 16- 16- 1616- 16- 16
Apr-Oct-
Q1-‘16 Q2-‘16Q3-‘16Q4-‘16
Jan
Feb Mar May Jun Jul Aug Sep Nov Dec
Leadership in Oilfield Proppants Sector Which is Through the Trough…
CONFIDENTIAL
(1) Management estimates.
(2) Price and volume trends apply to Hexion’s resin coated volume (excluding raw sand).
14
|
|
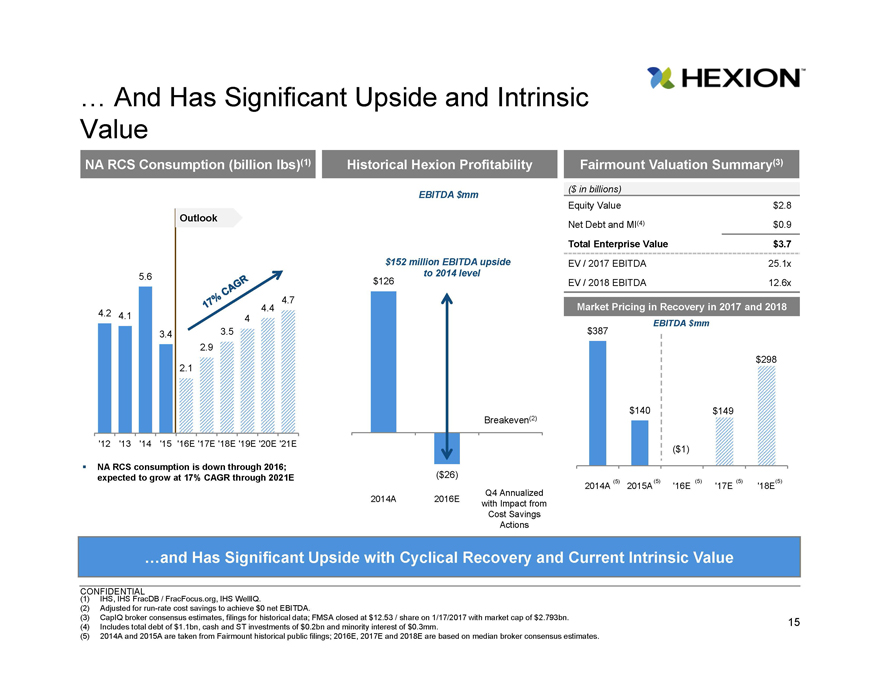
… And Has Significant Upside and Intrinsic
Value
NA RCS Consumption (billion lbs)(1) Historical Hexion Profitability Fairmount Valuation Summary(3)
EBITDA $mm($ in billions)
Equity Value$2.8
OutlookNet Debt and MI(4)$0.9
Total Enterprise Value$3.7
$152 million EBITDA upsideEV / 2017 EBITDA25.1x
5.6to 2014 level
$126EV / 2018 EBITDA12.6x
4.4 4.7Market Pricing in Recovery in 2017 and 2018
4.2 4.14EBITDA $mm
3.43.5$387
2.9
$298
2.1
$140$149
Breakeven(2)
‘12 ’13 ‘14’15 ‘16E ‘17E ‘18E ‘19E ‘20E ‘21E($1)
NA RCS consumption is down through 2016;
expected to grow at 17% CAGR through 2021E ($26)(5)(5)(5)(5)(5)
2014A 2015A’16E’17E’18E
Q4 Annualized
2014A2016Ewith Impact from
Cost Savings
Actions
…and Has Significant Upside with Cyclical Recovery and Current Intrinsic Value
CONFIDENTIAL
(1) IHS, IHS FracDB / FracFocus.org, IHS WellIQ.
(2) Adjusted for run-rate cost savings to achieve $0 net EBITDA.
(3) CapIQ broker consensus estimates, filings for historical data; FMSA closed at $12.53 / share on 1/17/2017 with market cap of $2.793bn. 15
(4) Includes total debt of $1.1bn, cash and ST investments of $0.2bn and minority interest of $0.3mm.
(5) 2014A and 2015A are taken from Fairmount historical public filings; 2016E, 2017E and 2018E are based on median broker consensus estimates.
|
|
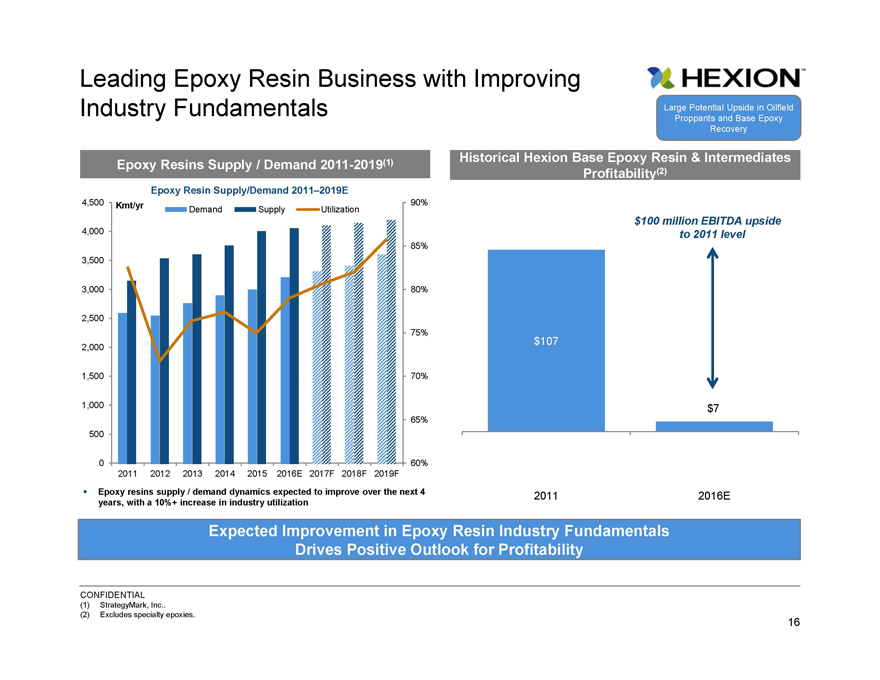
Leading Epoxy Resin Business with Improving
Industry Fundamentals Large Potential Upside in Oilfield
Proppants and Base Epoxy
Recovery
Epoxy Resins Supply / Demand 2011-2019(1) Historical Hexion Base Epoxy Resin & Intermediates
Profitability(2)
Epoxy Resin Supply/Demand 2011–2019E
4,500 Kmt/yr 90%
Demand SupplyUtilization
$100 million EBITDA upside
4,000 to 2011 level
85%
3,500
3,000 80%
2,500
75%
2,000 $107
1,500 70%
1,000 $7
65%
500
0 60%
2011 2012 2013 2014 2015 2016E 2017F 2018F 2019F
Epoxy resins supply / demand dynamics expected to improve over the next 4 20112016E
years, with a 10%+ increase in industry utilization
Expected Improvement in Epoxy Resin Industry Fundamentals
Drives Positive Outlook for Profitability
CONFIDENTIAL
(1) StrategyMark, Inc
(2) Excludes specialty epoxies.
16
|
|
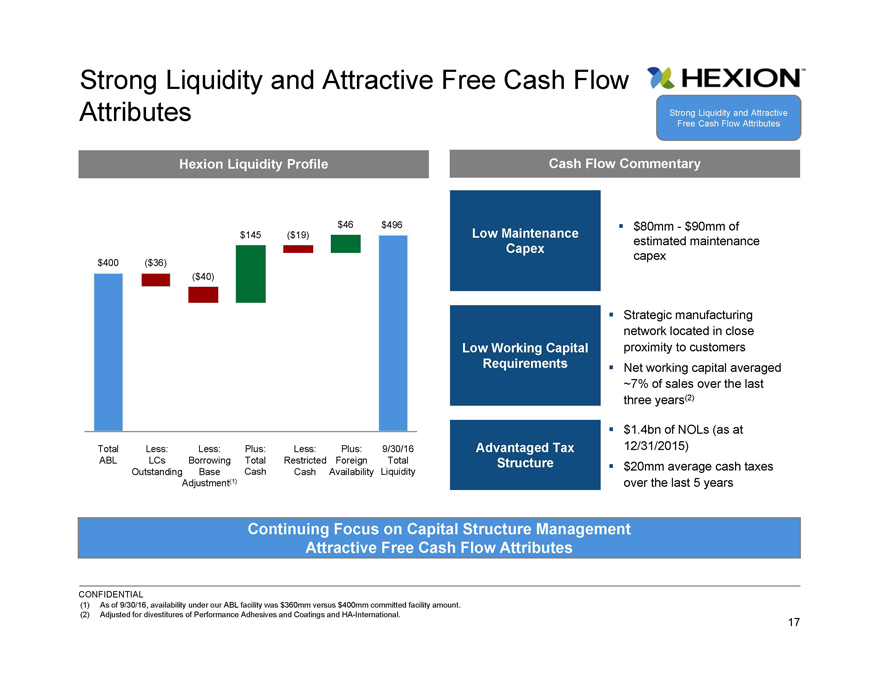
Strong Liquidity and Attractive Free Cash Flow
Attributes Strong Liquidity and Attractive
Free Cash Flow Attributes
Hexion Liquidity ProfileCash Flow Commentary
$46$496 $80mm—$90mm of
$145($19)Low Maintenanceestimated maintenance
Capexcapex
$400 ($36)
($40)
Strategic manufacturing
network located in close
Low Working Capitalproximity to customers
Requirements Net working capital averaged
~7% of sales over the last
three years(2)
$1.4bn of NOLs (as at
Total Less:Less:Plus:Less: Plus:9/30/16Advantaged Tax12/31/2015)
ABL LCsBorrowingTotalRestricted ForeignTotalStructure $20mm average cash taxes
OutstandingBaseCashCash Availability Liquidity
Adjustment(1)over the last 5 years
Continuing Focus on Capital Structure Management
Attractive Free Cash Flow Attributes
CONFIDENTIAL
(1) As of 9/30/16, availability under our ABL facility was $360mm versus $400mm committed facility amount.
(2) Adjusted for divestitures of Performance Adhesives and Coatings and HA-International.
17
|
|
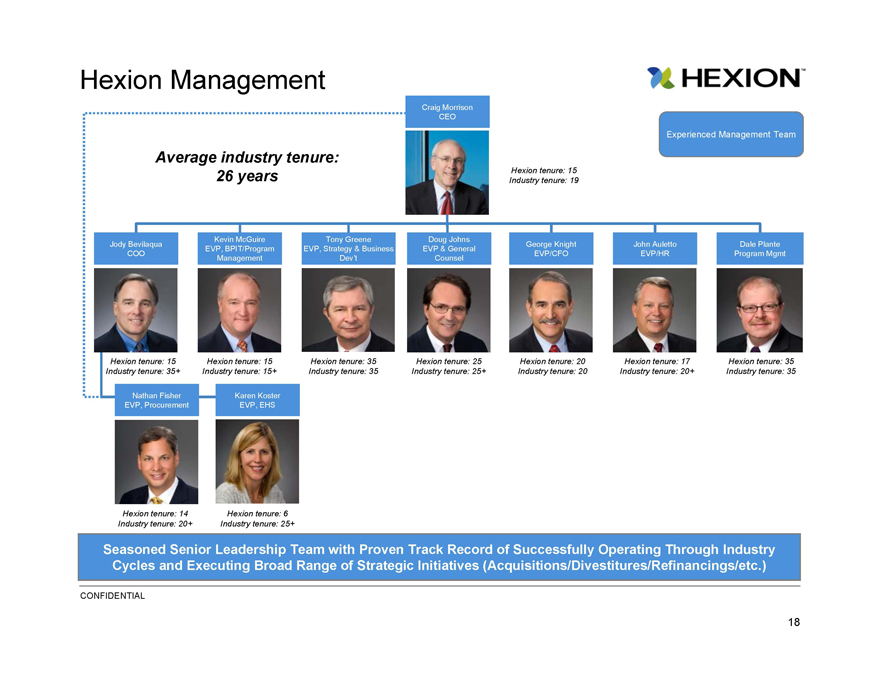
Hexion Management
Craig Morrison
CEO
Experienced Management Team
Average industry tenure:
26 years
Hexion tenure: 15
Industry tenure: 19
Kevin McGuire
Tony Greene
Doug Johns
Jody Bevilaqua
George Knight
John Auletto
Dale Plante
EVP, BPIT/Program
EVP, Strategy & Business
EVP & General
COO
EVP/CFO
EVP/HR
Program Mgmt
Management
Dev’t
Counsel
Hexion tenure: 15
Hexion tenure: 15
Hexion tenure: 35
Hexion tenure: 25
Hexion tenure: 20
Hexion tenure: 17
Hexion tenure: 35
Industry tenure: 35+
Industry tenure: 15+
Industry tenure: 35
Industry tenure: 25+
Industry tenure: 20
Industry tenure: 20+
Industry tenure: 35
Nathan Fisher
Karen Koster
EVP, Procurement
EVP, EHS
Hexion tenure: 14
Hexion tenure: 6
Industry tenure: 20+
Industry tenure: 25+
Seasoned Senior Leadership Team with Proven Track Record of Successfully Operating Through Industry
Cycles and Executing Broad Range of Strategic Initiatives (Acquisitions/Divestitures/Refinancings/etc.)
CONFIDENTIAL
18
|
|
Hexion Inc.
Appendices
CONFIDENTIAL
|
|
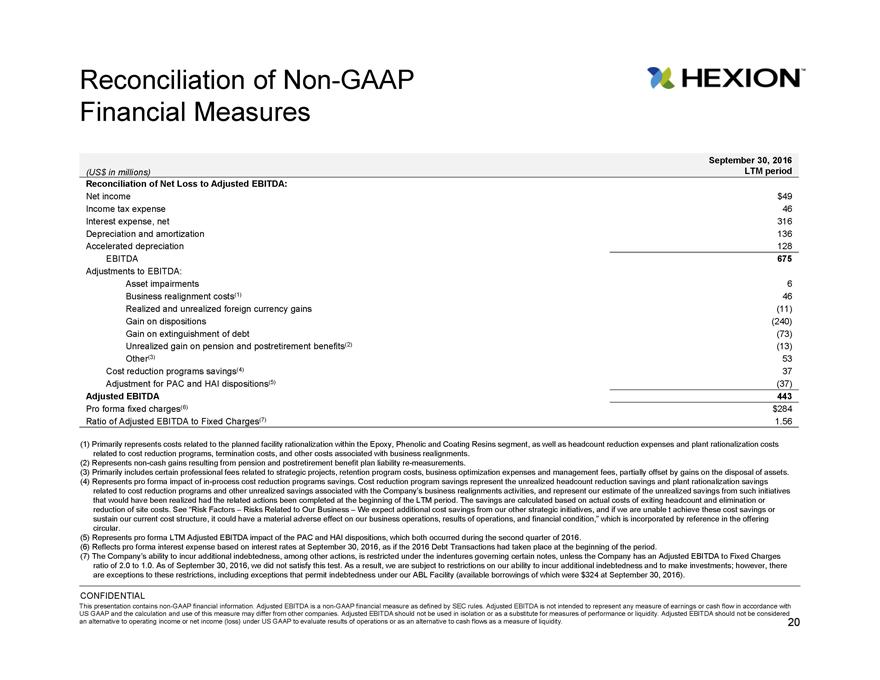
Reconciliation of Non-GAAP
Financial Measures
September 30, 2016
(US$in millions) LTM period
Reconciliation of Net Loss to Adjusted EBITDA:
Net income $49
Income tax expense 46
Interest expense, net 316
Depreciation and amortization 136
Accelerated depreciation 128
EBITDA 675
Adjustments to EBITDA:
Asset impairments 6
Business realignment costs(1) 46
Realized and unrealized foreign currency gains (11)
Gain on dispositions (240)
Gain on extinguishment of debt (73)
Unrealized gain on pension and postretirement benefits(2) (13)
Other(3) 53
Cost reduction programs savings(4) 37
Adjustment for PAC and HAI dispositions(5) (37)
Adjusted EBITDA 443
Pro forma fixed charges(6) $284
Ratio of Adjusted EBITDA to Fixed Charges(7) 1.56
(1) Primarily represents costs related to the planned facility rationalization within the Epoxy, Phenolic and Coating Resins segment, as well as headcount reduction expenses and plant rationalization costs
related to cost reduction programs, termination costs, and other costs associated with business realignments.
(2) Represents non-cash gains resulting from pension and postretirement benefit plan liability re-measurements.
(3) Primarily includes certain professional fees related to strategic projects, retention program costs, business optimization expenses and management fees, partially offset by gains on the disposal of assets.
(4) Represents pro forma impact of in-process cost reduction programs savings. Cost reduction program savings represent the unrealized headcount reduction savings and plant rationalization savings
related to cost reduction programs and other unrealized savings associated with the Company’s business realignments activities, and represent our estimate of the unrealized savings from such initiatives
that would have been realized had the related actions been completed at the beginning of the LTM period. The savings are calculated based on actual costs of exiting headcount and elimination or
reduction of site costs. See “Risk Factors – Risks Related to Our Business – We expect additional cost savings from our other strategic initiatives, and if we are unable t achieve these cost savings or
sustain our current cost structure, it could have a material adverse effect on our business operations, results of operations, and financial condition,” which is incorporated by reference in the offering
circular.
(5) Represents pro forma LTM Adjusted EBITDA impact of the PAC and HAI dispositions, which both occurred during the second quarter of 2016.
(6) Reflects pro forma interest expense based on interest rates at September 30, 2016, as if the 2016 Debt Transactions had taken place at the beginning of the period.
(7) The Company’s ability to incur additional indebtedness, among other actions, is restricted under the indentures governing certain notes, unless the Company has an Adjusted EBITDA to Fixed Charges
ratio of 2.0 to 1.0. As of September 30, 2016, we did not satisfy this test. As a result, we are subject to restrictions on our ability to incur additional indebtedness and to make investments; however, there
are exceptions to these restrictions, including exceptions that permit indebtedness under our ABL Facility (available borrowings of which were $324 at September 30, 2016).
CONFIDENTIAL
This presentation contains non-GAAP financial information. Adjusted EBITDA is a non-GAAP financial measure as defined by SEC rules. Adjusted EBITDA is not intended to represent any measure of earnings or cash flow in accordance with
US GAAP and the calculation and use of this measure may differ from other companies. Adjusted EBITDA should not be used in isolation or as a substitute for measures of performance or liquidity. Adjusted EBITDA should not be considered
an alternative to operating income or net income (loss) under US GAAP to evaluate results of operations or as an alternative to cash flows as a measure of liquidity. 20
|
|
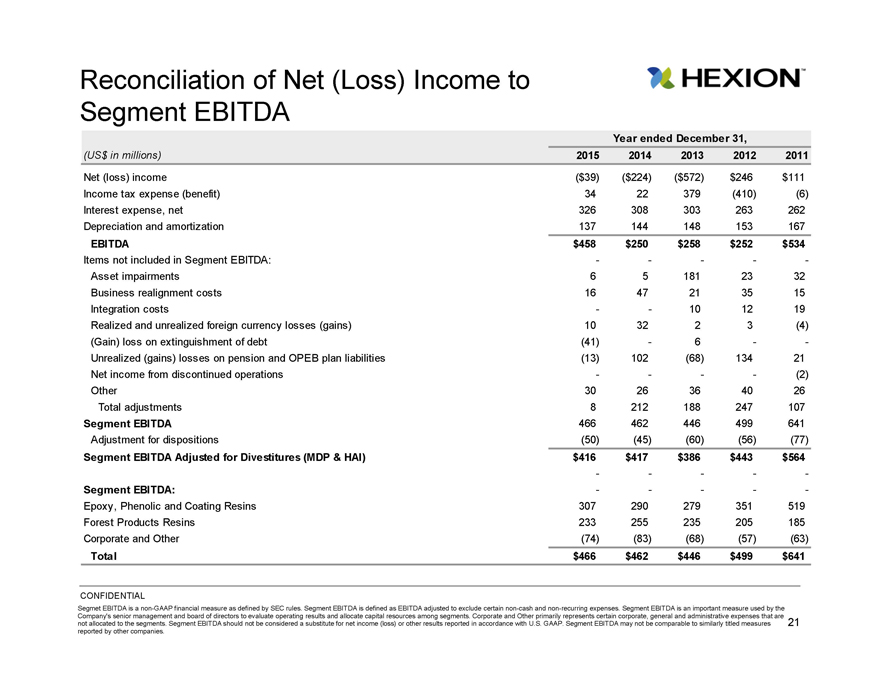
Reconciliation of Net (Loss) Income to
Segment EBITDA
Year ended December 31,
(US$in millions) 2015 2014201320122011
Net (loss) income ($39) ($224)($572)$246$111
Income tax expense (benefit) 34 22379(410)(6)
Interest expense, net 326 308303263262
Depreciation and amortization 137 144148153167
EBITDA $458 $250$258$252$534
Items not included in Segment EBITDA: -----
Asset impairments 6 51812332
Business realignment costs 16 47213515
Integration costs - -101219
Realized and unrealized foreign currency losses (gains) 10 3223(4)
(Gain) loss on extinguishment of debt (41) -6--
Unrealized (gains) losses on pension and OPEB plan liabilities (13) 102(68)13421
Net income from discontinued operations - ---(2)
Other 30 26364026
Total adjustments 8 212188247107
Segment EBITDA 466 462446499641
Adjustment for dispositions (50) (45)(60)(56)(77)
Segment EBITDA Adjusted for Divestitures (MDP & HAI) $416 $417$386$443$564
- -?- - -
Segment EBITDA: - ----
Epoxy, Phenolic and Coating Resins 307 290279351519
Forest Products Resins 233 255235205185
Corporate and Other (74) (83)(68)(57)(63)
Total $466 $462$446$499$641
CONFIDENTIAL
Segmet EBITDA is a non-GAAP financial measure as defined by SEC rules. Segment EBITDA is defined as EBITDA adjusted to exclude certain non-cash and non-recurring expenses. Segment EBITDA is an important measure used by the
Company’s senior management and board of directors to evaluate operating results and allocate capital resources among segments. Corporate and Other primarily represents certain corporate, general and administrative expenses that are
not allocated to the segments. Segment EBITDA should not be considered a substitute for net income (loss) or other results reported in accordance with U.S. GAAP. Segment EBITDA may not be comparable to similarly titled measures 21
reported by other companies.
|
|
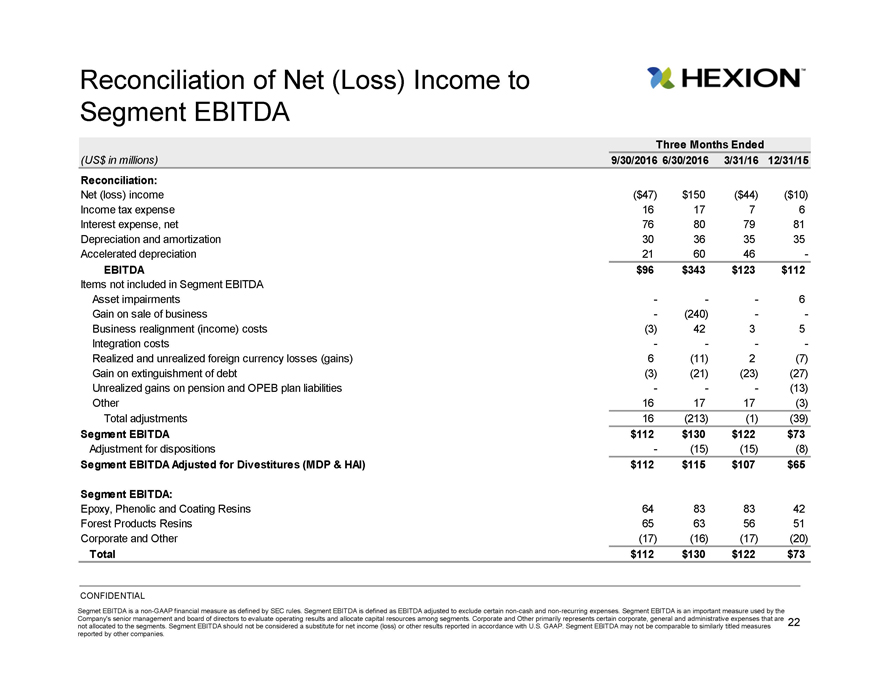
Reconciliation of Net (Loss) Income to
Segment EBITDA
Three Months Ended
(US$in millions)
9/30/2016 6/30/2016
3/31/16
12/31/15
Reconciliation:
Net (loss) income
($47)
$150
($44)
($10)
Income tax expense
16
17
7
6
Interest expense, net
76
80
79
81
Depreciation and amortization
30
36
35
35
Accelerated depreciation
21
60
46
-
EBITDA
$96
$343
$123
$112
Items not included in Segment EBITDA
Asset impairments
-
-
-
6
Gain on sale of business
-
(240)
-
-
Business realignment (income) costs
(3)
42
3
5
Integration costs
-
-
-
-
Realized and unrealized foreign currency losses (gains)
6
(11)
2
(7)
Gain on extinguishment of debt
(3)
(21)
(23)
(27)
Unrealized gains on pension and OPEB plan liabilities
-
-
-
(13)
Other
16
17
17
(3)
Total adjustments
16
(213)
(1)
(39)
Segment EBITDA
$112
$130
$122
$73
Adjustment for dispositions
-
(15)
(15)
(8)
Segment EBITDA Adjusted for Divestitures (MDP & HAI)
$112
$115
$107
$65
Segment EBITDA:
Epoxy, Phenolic and Coating Resins
64
83
83
42
Forest Products Resins
65
63
56
51
Corporate and Other
(17)
(16)
(17)
(20)
Total
$112
$130
$122
$73
CONFIDENTIAL
Segmet EBITDA is a non-GAAP financial measure as defined by SEC rules. Segment EBITDA is defined as EBITDA adjusted to exclude certain non-cash and non-recurring expenses. Segment EBITDA is an important measure used by the
not Company’s allocated senior to the management segments. Segment and board EBITDA of directors should to not evaluate be considered operating a results substitute and for allocate net income capital (loss) resources or other among results segments. reported in Corporate accordance and with Other U.S. primarily GAAP. represents Segment EBITDA certain corporate, may not be general comparable and administrative to similarly titled expenses measures that are 22
reported by other companies.
|
|
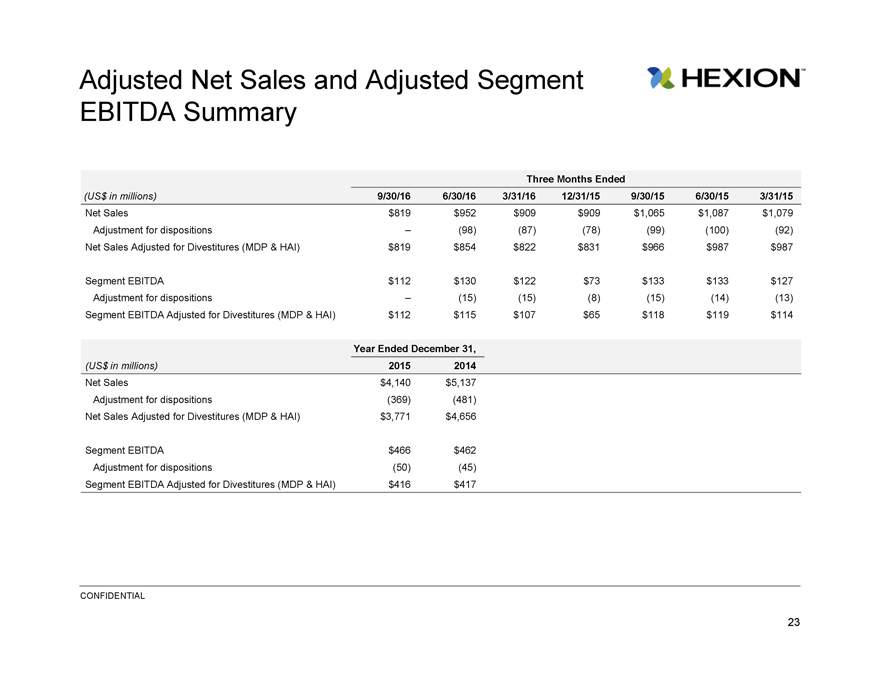
Adjusted Net Sales and Adjusted Segment
EBITDA Summary
Three Months Ended
(US$ in millions) 9/30/16 6/30/163/31/1612/31/159/30/156/30/153/31/15
Net Sales $819 $952$909$909$1,065$1,087$1,079
Adjustment for dispositions – (98)(87)(78)(99)(100)(92)
Net Sales Adjusted for Divestitures (MDP & HAI) $819 $854$822$831$966$987$987
Segment EBITDA $112 $130$122$73$133$133$127
Adjustment for dispositions – (15)(15)(8)(15)(14)(13)
Segment EBITDA Adjusted for Divestitures (MDP & HAI) $112 $115$107$65$118$119$114
Year Ended December 31,
(US$ in millions) 2015 2014
Net Sales $4,140 $5,137
Adjustment for dispositions (369) (481)
Net Sales Adjusted for Divestitures (MDP & HAI) $3,771 $4,656
Segment EBITDA $466 $462
Adjustment for dispositions (50) (45)
Segment EBITDA Adjusted for Divestitures (MDP & HAI) $416 $417
CONFIDENTIAL
23