Attached files
| file | filename |
|---|---|
| 8-K - 8-K - SOUTHWEST BANCORP INC | oksb-20170124x8k.htm |
| EX-99.1 - EX-99.1 - SOUTHWEST BANCORP INC | oksb-20170124xex99_1.htm |
2016 Fourth Quarter Earnings Presentation January 25, 2017 NASDAQ: OKSB  Forward Looking Statements We make forward-looking statements in this presentation that are subject to risks and uncertainties. We intend these statements to be covered by the safe harbor provision for forward-looking statements contained in the Private Securities Litigation Reform Act of 1995. These forward-looking statements include: •Statements of Southwest's goals, intentions, and expectations; •Estimates of risks and of future costs and benefits; •Expectations regarding our future financial performance and the financial performance of our operating segments; •Expectations regarding regulatory actions; •Expectations regarding our ability to utilize tax loss benefits; •Expectations regarding our stock repurchase program; •Expectations regarding dividends; •Expectations regarding acquisitions and divestitures; •Assessments of loan quality, probable loan losses, and the amount and timing of loan payoffs; •Estimates of the value of assets held for sale or available for sale; and •Statements of our ability to achieve financial and other goals. These forward-looking statements are subject to significant uncertainties because they are based upon: the amount and timing of future changes in interest rates, market behavior, and other economic conditions; future laws, regulations, and accounting principles; changes in regulatory standards and examination policies, and a variety of other matters. These other matters include, among other things, the direct and indirect effects of economic conditions on interest rates, credit quality, loan demand, liquidity, and monetary and supervisory policies of banking regulators. Because of these uncertainties, the actual future results may be materially different from the results indicated by these forward-looking statements. In addition, Southwest's past growth and performance do not necessarily indicate our future results. For other factors, risks, and uncertainties that could cause actual results to differ materially from estimates and projections contained in forward-looking statements, please read the “Risk Factors” contained in Southwest’s reports to the Securities and Exchange Commission. We do not intend, or undertake no obligation, to update or revise any forward-looking statements contained in this presentation, whether as a result of differences in actual results, changes in assumptions, or changes in other factors affecting said statements, except as required by law.
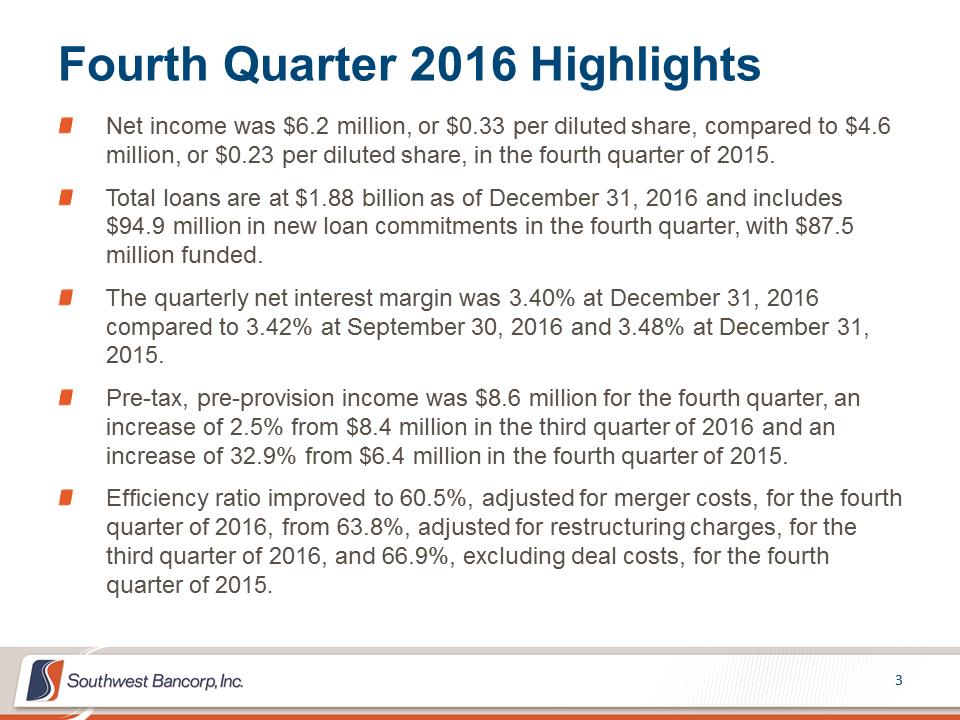 Fourth Quarter 2016 Highlights Net income was $6.2 million, or $0.33 per diluted share, compared to $4.6 million, or $0.23 per diluted share, in the fourth quarter of 2015. Total loans are at $1.88 billion as of December 31, 2016 and includes $94.9 million in new loan commitments in the fourth quarter, with $87.5 million funded. The quarterly net interest margin was 3.40% at December 31, 2016 compared to 3.42% at September 30, 2016 and 3.48% at December 31, 2015. Pre-tax, pre-provision income was $8.6 million for the fourth quarter, an increase of 2.5% from $8.4 million in the third quarter of 2016 and an increase of 32.9% from $6.4 million in the fourth quarter of 2015. Efficiency ratio improved to 60.5%, adjusted for merger costs, for the fourth quarter of 2016, from 63.8%, adjusted for restructuring charges, for the third quarter of 2016, and 66.9%, excluding deal costs, for the fourth quarter of 2015.
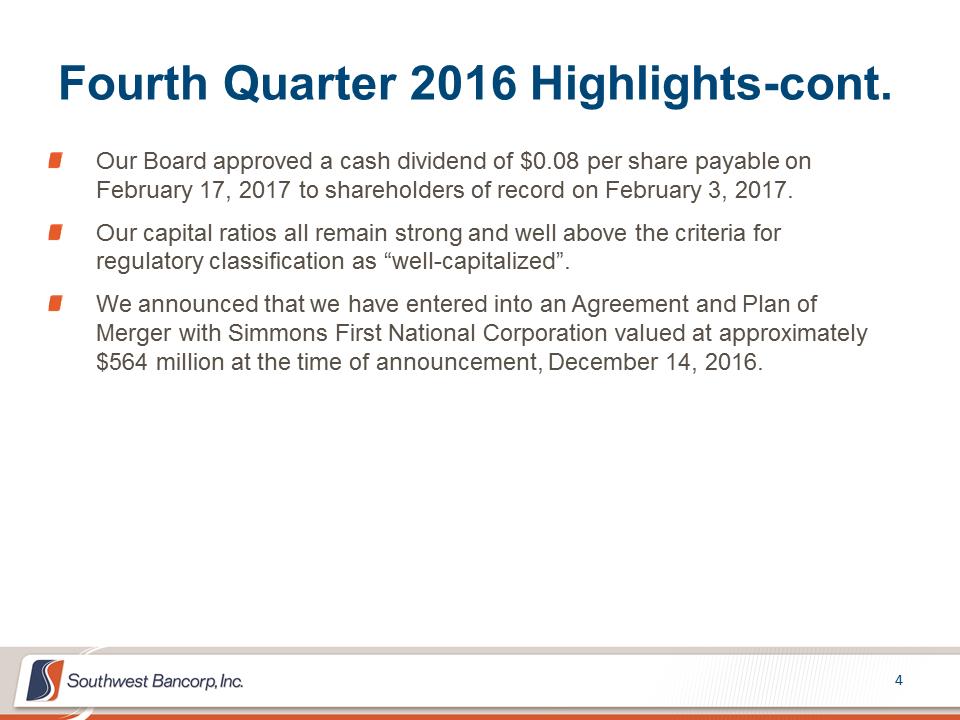 Fourth Quarter 2016 Highlights-cont. Our Board approved a cash dividend of $0.08 per share payable on February 17, 2017 to shareholders of record on February 3, 2017. Our capital ratios all remain strong and well above the criteria for regulatory classification as “well-capitalized”. We announced that we have entered into an Agreement and Plan of Merger with Simmons First National Corporation valued at approximately $564 million at the time of announcement, December 14, 2016.
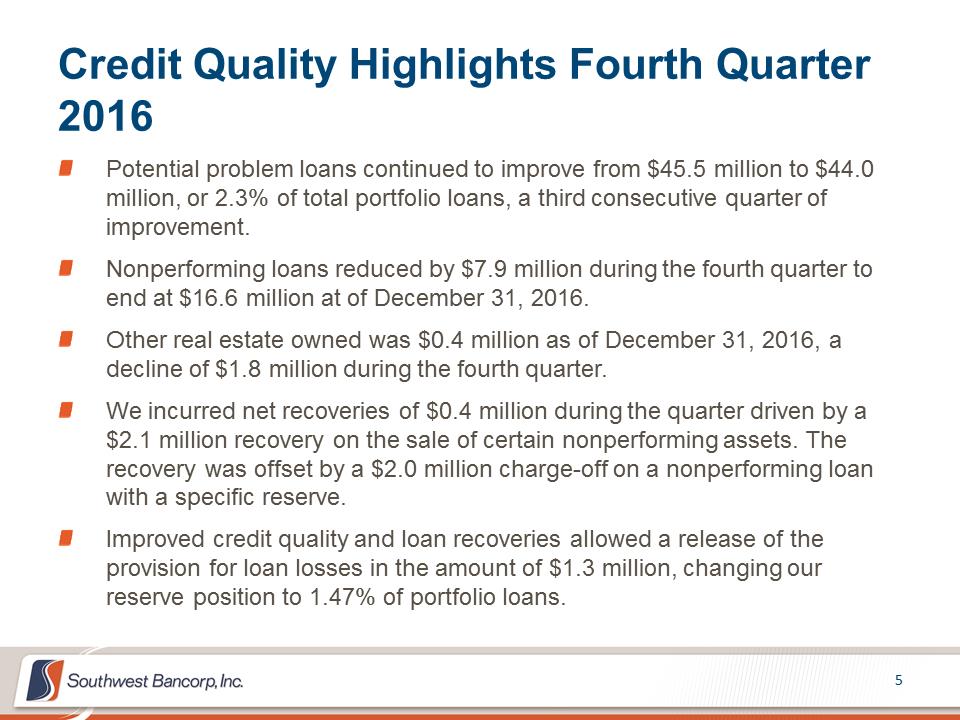 Credit Quality Highlights Fourth Quarter 2016 Potential problem loans continued to improve from $45.5 million to $44.0 million, or 2.3% of total portfolio loans, a third consecutive quarter of improvement. Nonperforming loans reduced by $7.9 million during the fourth quarter to end at $16.6 million at of December 31, 2016. Other real estate owned was $0.4 million as of December 31, 2016, a decline of $1.8 million during the fourth quarter. We incurred net recoveries of $0.4 million during the quarter driven by a $2.1 million recovery on the sale of certain nonperforming assets. The recovery was offset by a $2.0 million charge-off on a nonperforming loan with a specific reserve. Improved credit quality and loan recoveries allowed a release of the provision for loan losses in the amount of $1.3 million, changing our reserve position to 1.47% of portfolio loans.
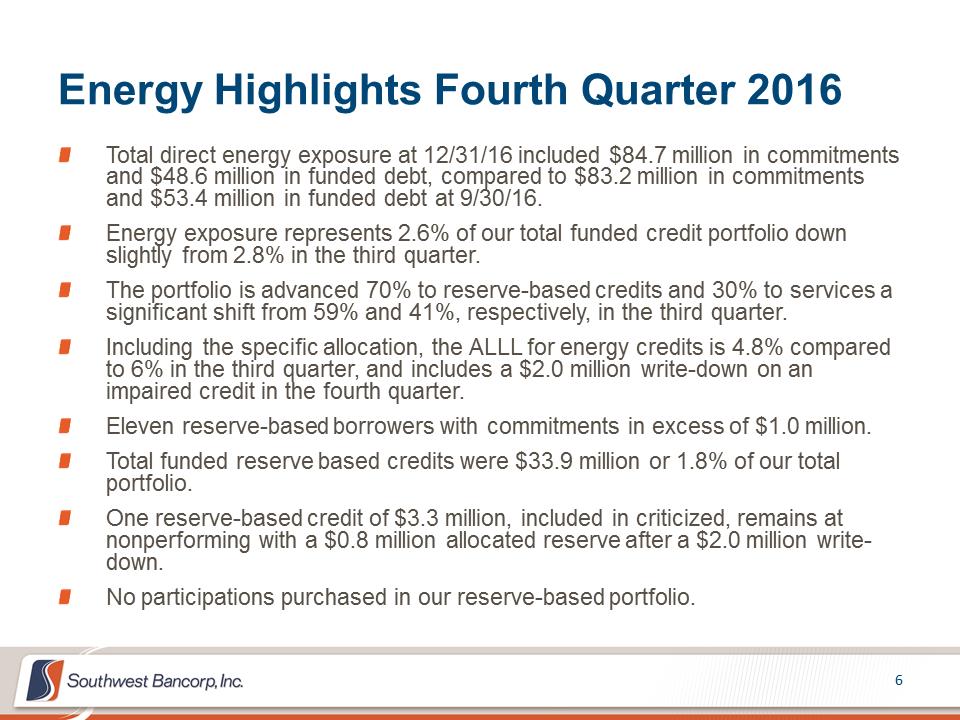 Energy Highlights Fourth Quarter 2016 Total direct energy exposure at 12/31/16 included $84.7 million in commitments and $48.6 million in funded debt, compared to $83.2 million in commitments and $53.4 million in funded debt at 9/30/16. Energy exposure represents 2.6% of our total funded credit portfolio down slightly from 2.8% in the third quarter. The portfolio is advanced 70% to reserve-based credits and 30% to services a significant shift from 59% and 41%, respectively, in the third quarter. Including the specific allocation, the ALLL for energy credits is 4.8% compared to 6% in the third quarter, and includes a $2.0 million write-down on an impaired credit in the fourth quarter. Eleven reserve-based borrowers with commitments in excess of $1.0 million. Total funded reserve based credits were $33.9 million or 1.8% of our total portfolio. One reserve-based credit of $3.3 million, included in criticized, remains at nonperforming with a $0.8 million allocated reserve after a $2.0 million write-down. No participations purchased in our reserve-based portfolio.
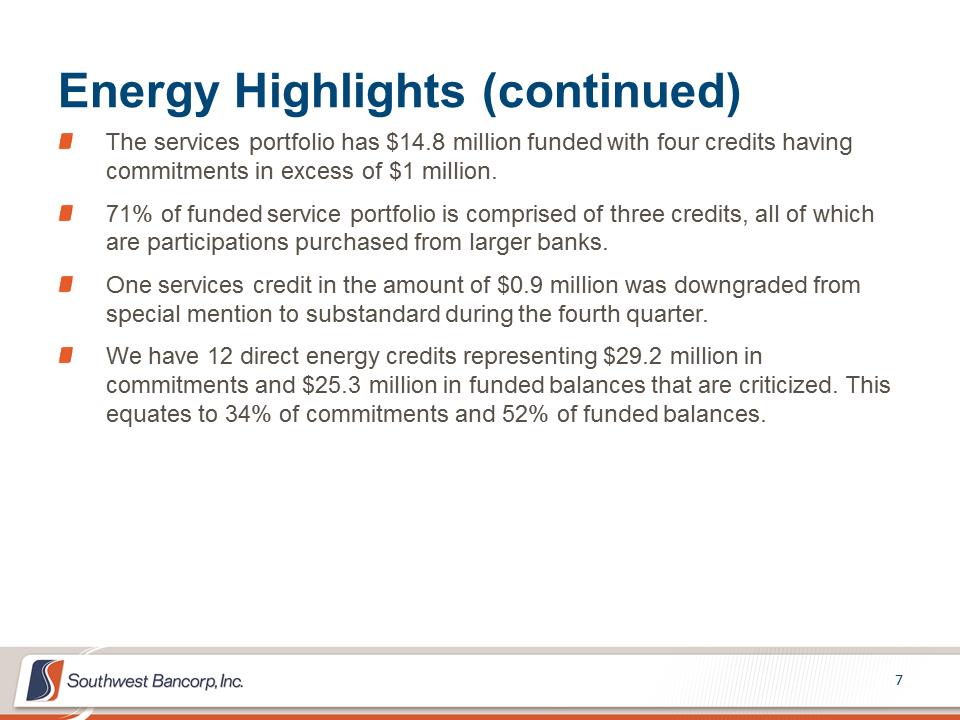 Energy Highlights (continued) The services portfolio has $14.8 million funded with four credits having commitments in excess of $1 million. 71% of funded service portfolio is comprised of three credits, all of which are participations purchased from larger banks. One services credit in the amount of $0.9 million was downgraded from special mention to substandard during the fourth quarter. We have 12 direct energy credits representing $29.2 million in commitments and $25.3 million in funded balances that are criticized. This equates to 34% of commitments and 52% of funded balances.
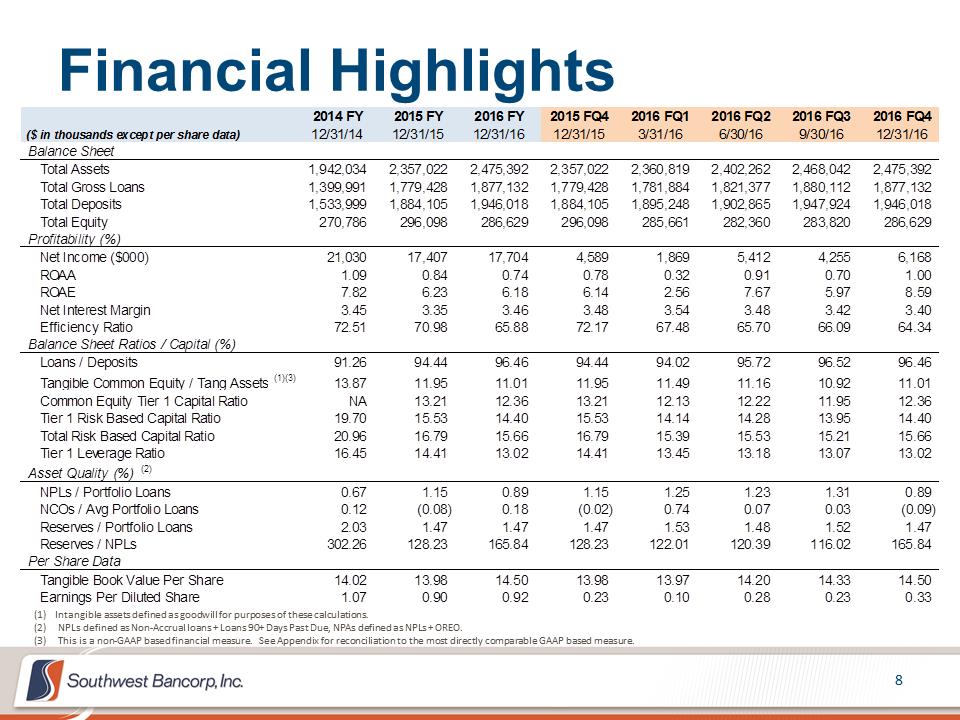 Financial Highlights (1) Intangible assets defined as goodwill for purposes of these calculations. (2)NPLs defined as Non-Accrual loans + Loans 90+ Days Past Due, NPAs defined as NPLs + OREO. (3)This is a non-GAAP based financial measure. See Appendix for reconciliation to the most directly comparable GAAP based measure. 2014 FY2015 FY2016 FY2015 FQ42016 FQ12016 FQ22016 FQ32016 FQ4($ in thousands except per share data)12/31/1412/31/1512/31/1612/31/153/31/166/30/169/30/1612/31/16Balance SheetTotal Assets1,942,034 2,357,022 2,475,392 2,357,022 2,360,819 2,402,262 2,468,042 2,475,392 Total Gross Loans1,399,991 1,779,428 1,877,132 1,779,428 1,781,884 1,821,377 1,880,112 1,877,132 Total Deposits1,533,999 1,884,105 1,946,018 1,884,105 1,895,248 1,902,865 1,947,924 1,946,018 Total Equity270,786 296,098 286,629 296,098 285,661 282,360 283,820 286,629 Profitability (%)Net Income ($000)21,030 17,407 17,704 4,589 1,869 5,412 4,255 6,168 ROAA1.09 0.84 0.74 0.78 0.32 0.91 0.70 1.00 ROAE7.82 6.23 6.18 6.14 2.56 7.67 5.97 8.59 Net Interest Margin3.45 3.35 3.46 3.48 3.54 3.48 3.42 3.40 Efficiency Ratio72.51 70.98 65.88 72.17 67.48 65.70 66.09 64.34 Balance Sheet Ratios / Capital (%)Loans / Deposits91.26 94.44 96.46 94.44 94.02 95.72 96.52 96.46 Tangible Common Equity / Tang Assets(1)(3)13.87 11.95 11.01 11.95 11.49 11.16 10.92 11.01 Common Equity Tier 1 Capital RatioNA13.21 12.36 13.21 12.13 12.22 11.95 12.36 Tier 1 Risk Based Capital Ratio19.70 15.53 14.40 15.53 14.14 14.28 13.95 14.40 Total Risk Based Capital Ratio20.96 16.79 15.66 16.79 15.39 15.53 15.21 15.66 Tier 1 Leverage Ratio16.45 14.41 13.02 14.41 13.45 13.18 13.07 13.02 Asset Quality (%)(2)NPLs / Portfolio Loans0.67 1.15 0.89 1.15 1.25 1.23 1.31 0.89 NCOs / Avg Portfolio Loans0.12 (0.08) 0.18 (0.02) 0.74 0.07 0.03 (0.09) Reserves / Portfolio Loans2.03 1.47 1.47 1.47 1.53 1.48 1.52 1.47 Reserves / NPLs302.26 128.23 165.84 128.23 122.01 120.39 116.02 165.84 Per Share DataTangible Book Value Per Share14.02 13.98 14.50 13.98 13.97 14.20 14.33 14.50 Earnings Per Diluted Share1.07 0.90 0.92 0.23 0.10 0.28 0.23 0.33
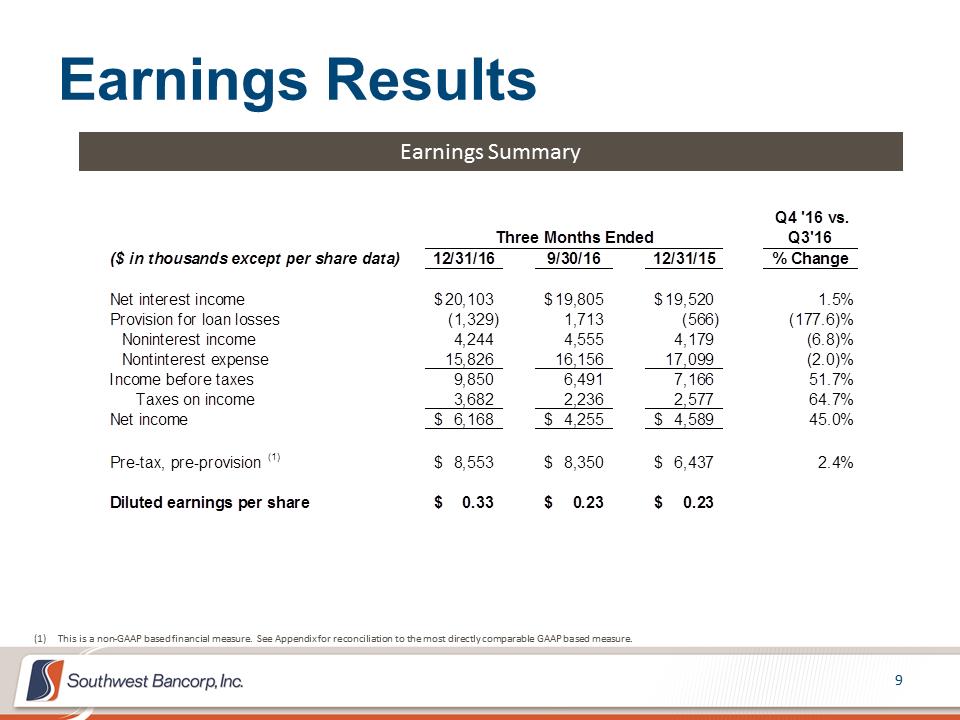 Earnings Results Earnings Summary (1)This is a non-GAAP based financial measure. See Appendix for reconciliation to the most directly comparable GAAP based measure. Q4 '16 vs. Q3'16 ($ in thousands except per share data)12/31/169/30/1612/31/15% ChangeNet interest income20,103$ 19,805$ 19,520$ 1.5%Provision for loan losses(1,329) 1,713 (566) (177.6)% Noninterest income4,244 4,555 4,179 (6.8)% Nontinterest expense15,826 16,156 17,099 (2.0)% Income before taxes9,850 6,491 7,166 51.7%Taxes on income3,682 2,236 2,577 64.7%Net income6,168$ 4,255$ 4,589$ 45.0%Pre-tax, pre-provision (1)8,553$ 8,350$ 6,437$ 2.4%Diluted earnings per share0.33$ 0.23$ 0.23$ Three Months Ended
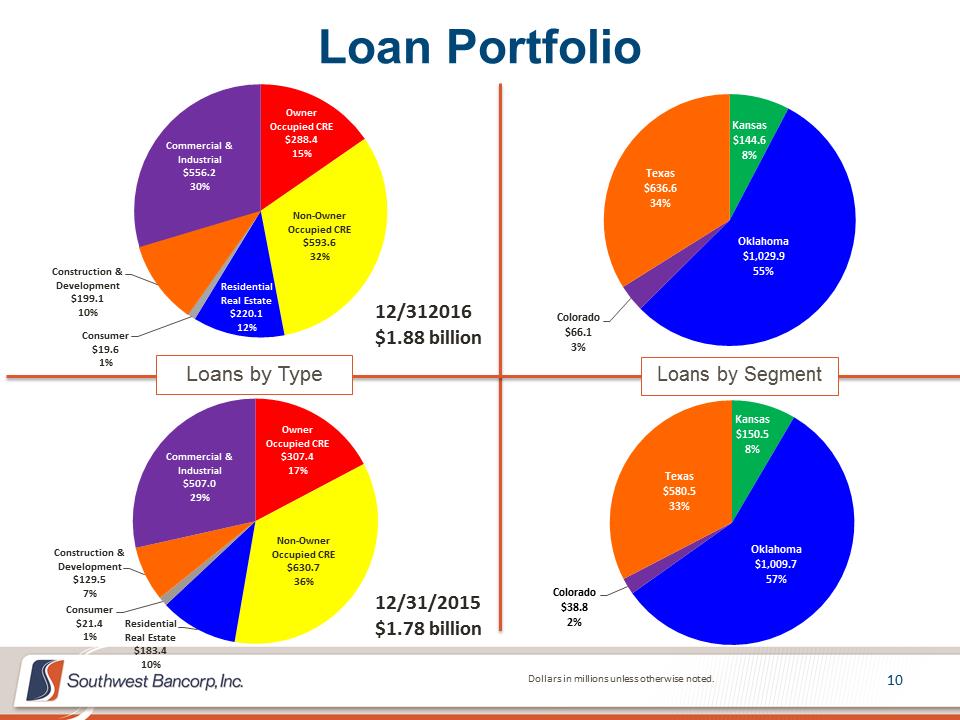 Loan Portfolio Owner Occupied CRE $288.4 15% Non-Owner Occupied CRE $593.6 32% Residential Real Estate $220.1 12% Consumer $19.6 1% Construction & Development $199.1 10% Commercial & Industrial $556.2 30% Dollars in millions unless otherwise noted. Loans by Type Loans by Segment Owner Occupied CRE $307.4 17% Non-Owner Occupied CRE $630.7 36% Residential Real Estate $183.4 10% Consumer $21.4 1% Construction & Development $129.5 7% Commercial & Industrial $507.0 29% 12/312016 $1.88 billion 12/31/2015 $1.78 billion Kansas $144.6 8% Oklahoma $1,029.9 55% Colorado $66.1 3% Texas $636.6 34% Kansas $150.5 8% Oklahoma $1,009.7 57% Colorado $38.8 2% Texas $580.5 33%
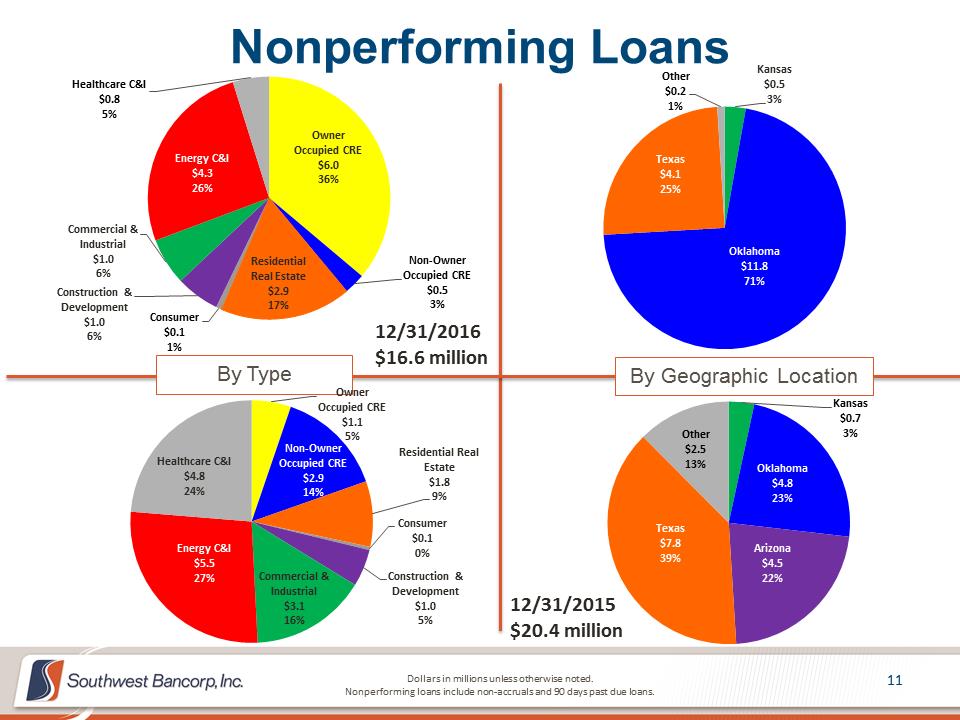 Nonperforming Loans Owner Occupied CRE $6.0 36% Non-Owner Occupied CRE $0.5 3% Residential Real Estate $2.9 17% Consumer $0.1 1% Construction & Development $1.0 6% Commercial & Industrial $1.0 6% Energy C&I $4.3 26% Healthcare C&I $0.8 5% Dollars in millions unless otherwise noted. Nonperforming loans include non-accruals and 90 days past due loans. By Type By Geographic Location Owner Occupied CRE $1.1 5% Non-Owner Occupied CRE $2.9 14% Residential Real Estate $1.8 9% Consumer $0.1 0% Construction & Development $1.0 5% Commercial & Industrial $3.1 16% Energy C&I $5.5 27% Healthcare C&I $4.8 24% 12/31/2016 $16.6 million 12/31/2015 $20.4 million Kansas $0.5 3% Oklahoma $11.8 71% Texas $4.1 25% Other $0.2 1% Kansas $0.7 3% Oklahoma $4.8 23% Arizona $4.5 22% Texas $7.8 39% Other $2.5 13%
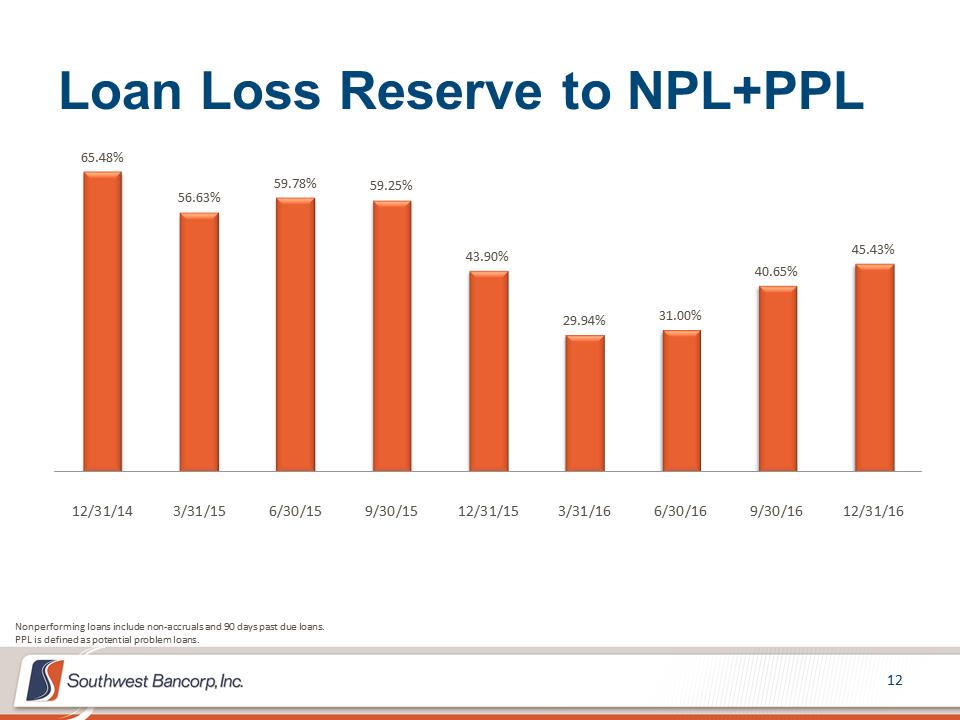 Loan Loss Reserve to NPL+PPL 65.48% 56.63% 59.78% 59.25% 43.90% 29.94% 31.00% 40.65% 45.43% 12/31/143/31/156/30/159/30/1512/31/153/31/166/30/169/30/1612/31/16Nonperforming loans include non-accruals and 90 days past due loans. PPL is defined as potential problem loans.
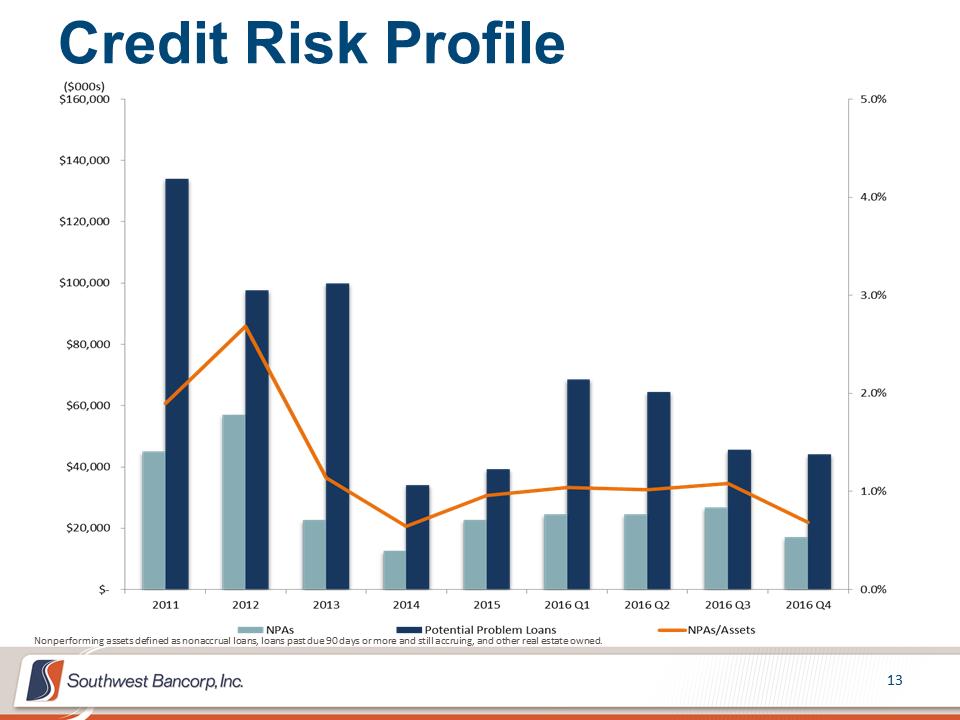 Credit Risk Profile Nonperforming assets defined as nonaccrual loans, loans past due 90 days or more and still accruing, and other real estate owned.
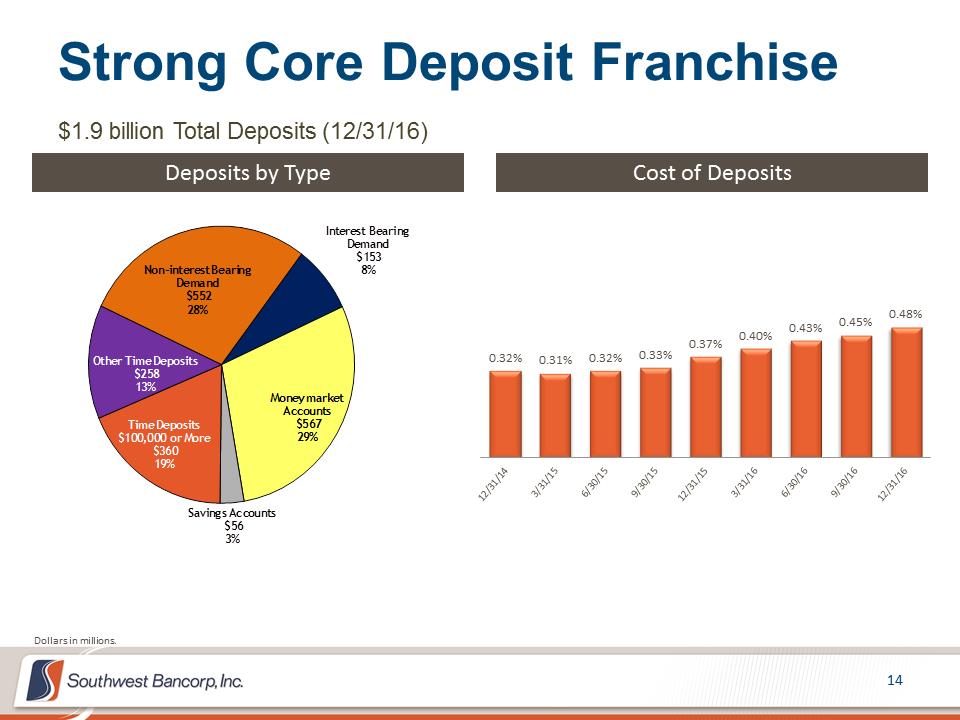 Strong Core Deposit Franchise $1.9 billion Total Deposits (12/31/16) Deposits by Type Cost of Deposits 0.32% 0.31% 0.32% 0.33% 0.37% 0.40% 0.43% 0.45% 0.48% Non-interest Bearing Demand$552 28%Interest Bearing Demand$153 8%Money market Accounts$567 29%Savings Accounts$56 3%Time Deposits $100,000 or More$360 19%Other Time Deposits$258 13%Dollars in millions. NIM/Cost of Funds 0.32% 0.31% 0.32% 0.33% 0.37% 0.40% 0.43% 0.45% 0.48% 3.52% 3.25% 3.31% 3.34% 3.48% 3.54% 3.48% 3.42% 3.40% 0.0%0.5%1.0%1.5%2.0%2.5%3.0%3.5%4.0%4.5%5.0% $- $5,000 $10,000 $15,000 $20,000 $25,000Q4 '14Q1 '15Q2 '15Q3 '15Q4 '15Q1 '16Q2 '16Q3 '16Q4 '16($000s) Net Interest IncomeCost of DepositsNet Interest Margin
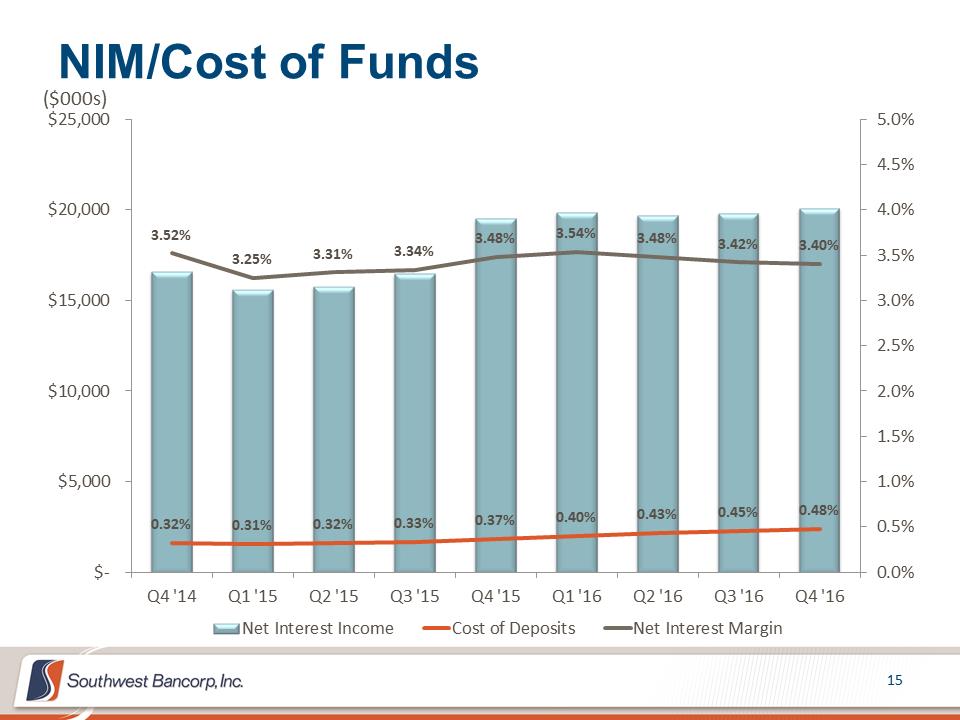 NIM/Cost of Funds 0.32% 0.31% 0.32% 0.33% 0.37% 0.40% 0.43% 0.45% 0.48% 3.52% 3.25% 3.31% 3.34% 3.48% 3.54% 3.48% 3.42% 3.40% 0.0%0.5%1.0%1.5%2.0%2.5%3.0%3.5%4.0%4.5%5.0% $- $5,000 $10,000 $15,000 $20,000 $25,000Q4 '14Q1 '15Q2 '15Q3 '15Q4 '15Q1 '16Q2 '16Q3 '16Q4 '16($000s) Net Interest IncomeCost of DepositsNet Interest Margin
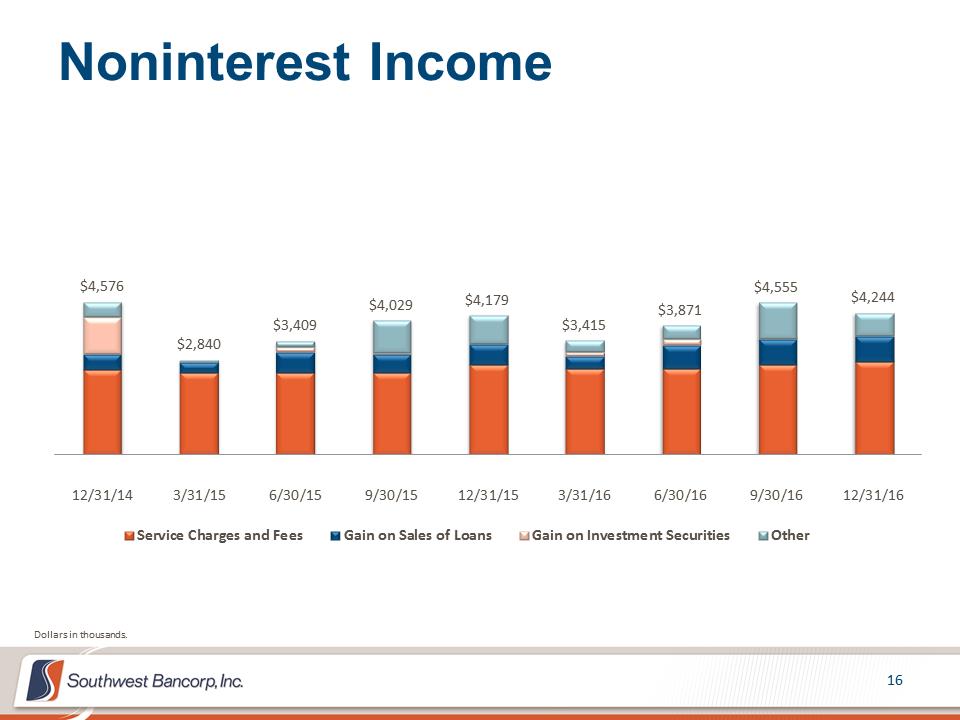 Noninterest Income $4,576 $2,840 $3,409 $4,029 $4,179 $3,415 $3,871 $4,555 $4,244 12/31/143/31/156/30/159/30/1512/31/153/31/166/30/169/30/1612/31/16Service Charges and FeesGain on Sales of LoansGain on Investment SecuritiesOtherDollars in thousands.
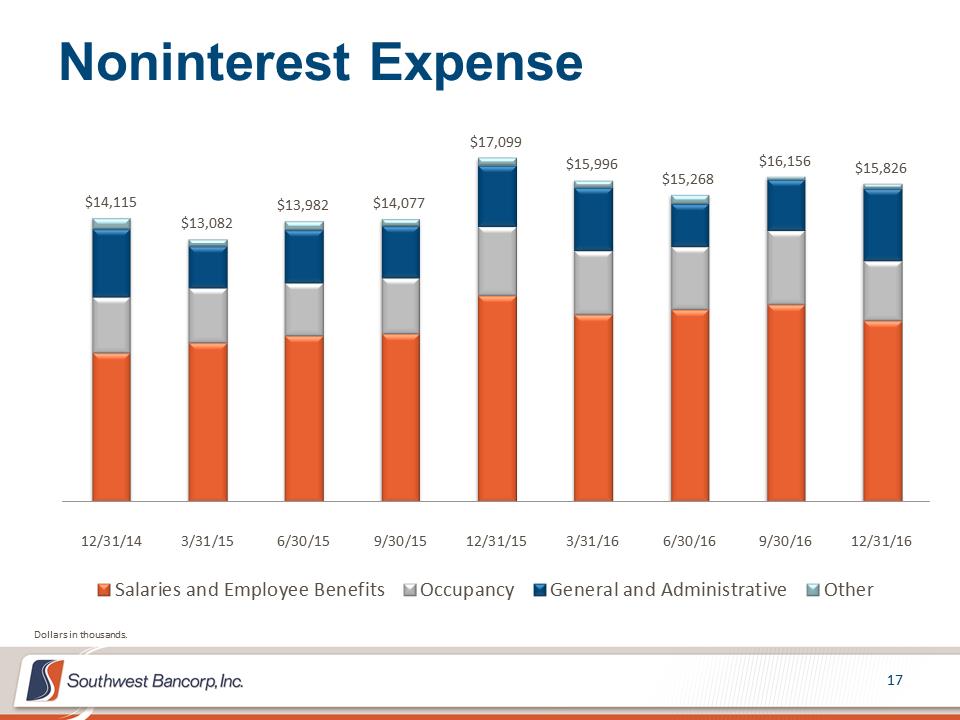 Noninterest Expense $14,115 $13,082 $13,982 $14,077 $17,099 $15,996 $15,268 $16,156 $15,826 12/31/143/31/156/30/159/30/1512/31/153/31/166/30/169/30/1612/31/16Salaries and Employee BenefitsOccupancyGeneral and AdministrativeOtherDollars in thousands.
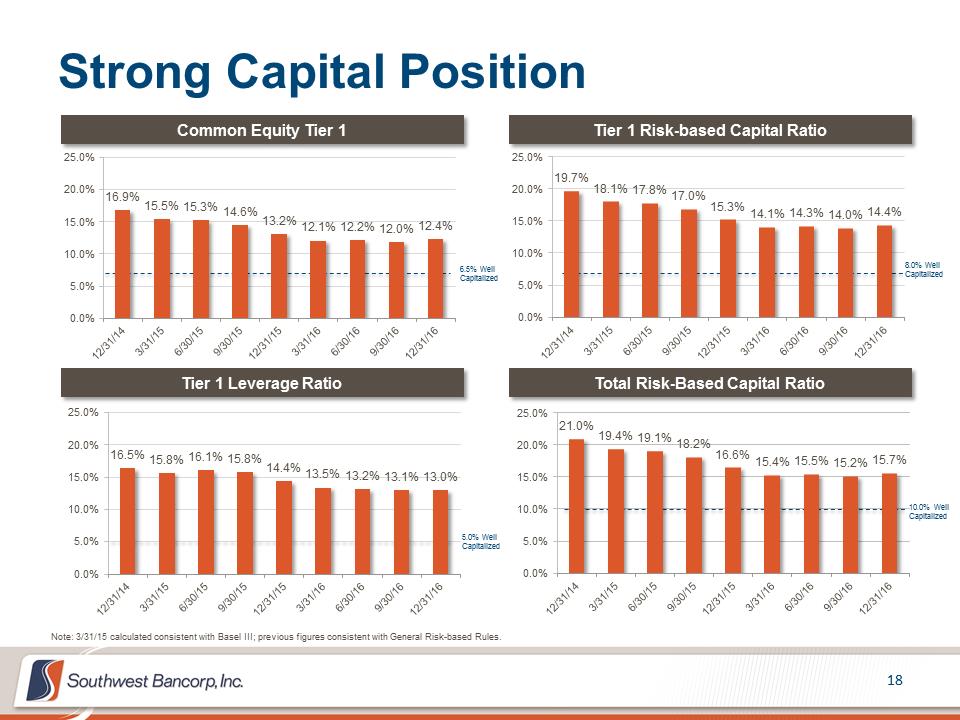 Strong Capital Position Tier 1 Leverage Ratio Common Equity Tier 1 Note: 3/31/15 calculated consistent with Basel III; previous figures consistent with General Risk-based Rules. Tier 1 Risk-based Capital Ratio Total Risk-Based Capital Ratio 6.5% Well Capitalized 8.0% Well Capitalized 10.0% Well Capitalized 5.0% Well Capitalized 16.5% 15.8% 16.1% 15.8% 14.4% 13.5% 13.2% 13.1% 13.0% 0.0%5.0%10.0%15.0%20.0%25.0%16.9% 15.5% 15.3% 14.6% 13.2% 12.1% 12.2% 12.0% 12.4% 0.0%5.0%10.0%15.0%20.0%25.0%19.7% 18.1% 17.8% 17.0% 15.3% 14.1% 14.3% 14.0% 14.4% 0.0%5.0%10.0%15.0%20.0%25.0%21.0% 19.4% 19.1% 18.2% 16.6% 15.4% 15.5% 15.2% 15.7% 0.0%5.0%10.0%15.0%20.0%25.0%
 2017 Priorities Successfully complete the proposed merger and consolidation with Simmons First National Corporation. Maintain strong credit quality along with conservative balance sheet and risk management. Continue appropriate growth in the commercial banking sector. Grow deposit base commensurate with loan growth. Focus on fee based income growth in mortgage, consumer and treasury. Assess, manage and add talent where available and appropriate throughout the organization. Drive growth in the healthcare banking segment.
 ADDITIONAL FINANCIAL INFORMATION
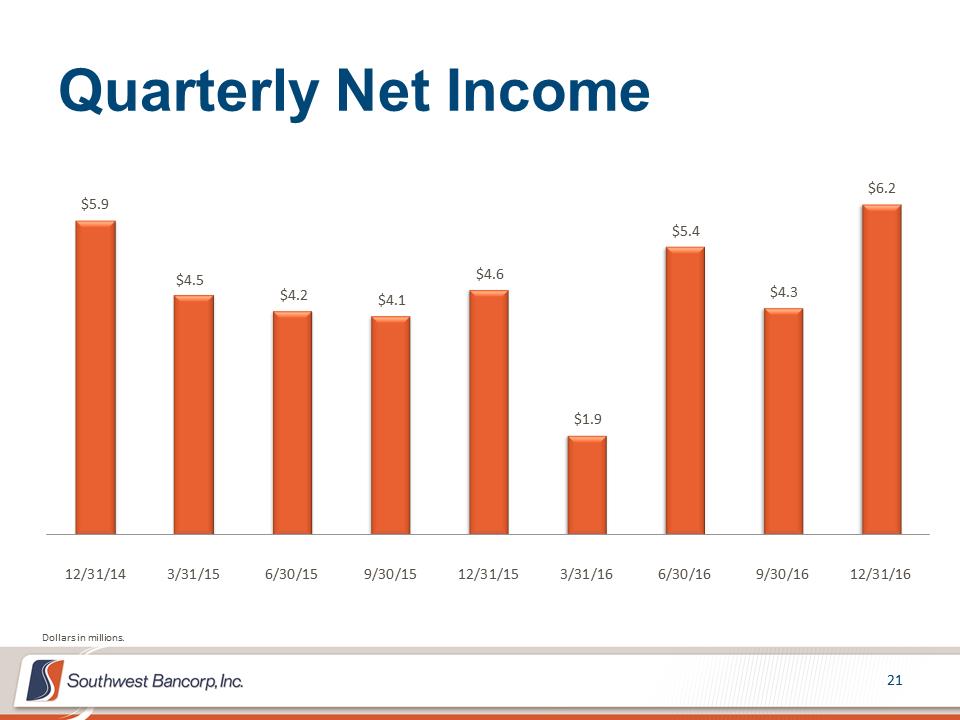 Quarterly Net Income $5.9 $4.5 $4.2 $4.1 $4.6 $1.9 $5.4 $4.3 $6.2 12/31/143/31/156/30/159/30/1512/31/153/31/166/30/169/30/1612/31/16Dollars in millions.
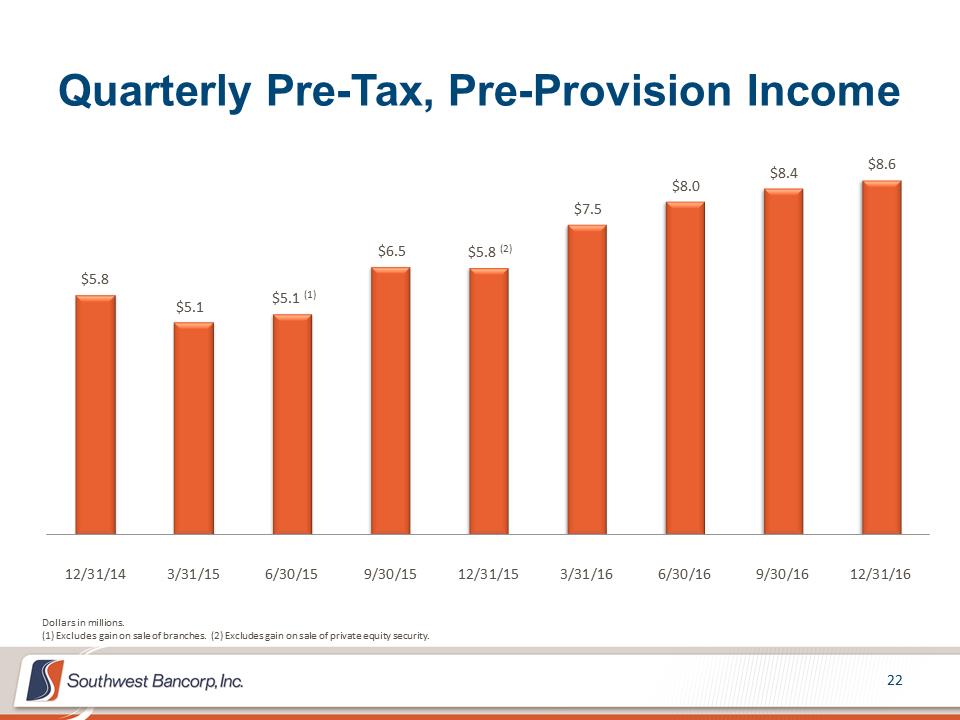 Quarterly Pre-Tax, Pre-Provision Income $5.8 $5.1 $5.1 (1) $6.5 $5.8 (2) $7.5 $8.0 $8.4 $8.6 12/31/143/31/156/30/159/30/1512/31/153/31/166/30/169/30/1612/31/16Dollars in millions. (1) Excludes gain on sale of branches. (2) Excludes gain on sale of private equity security.
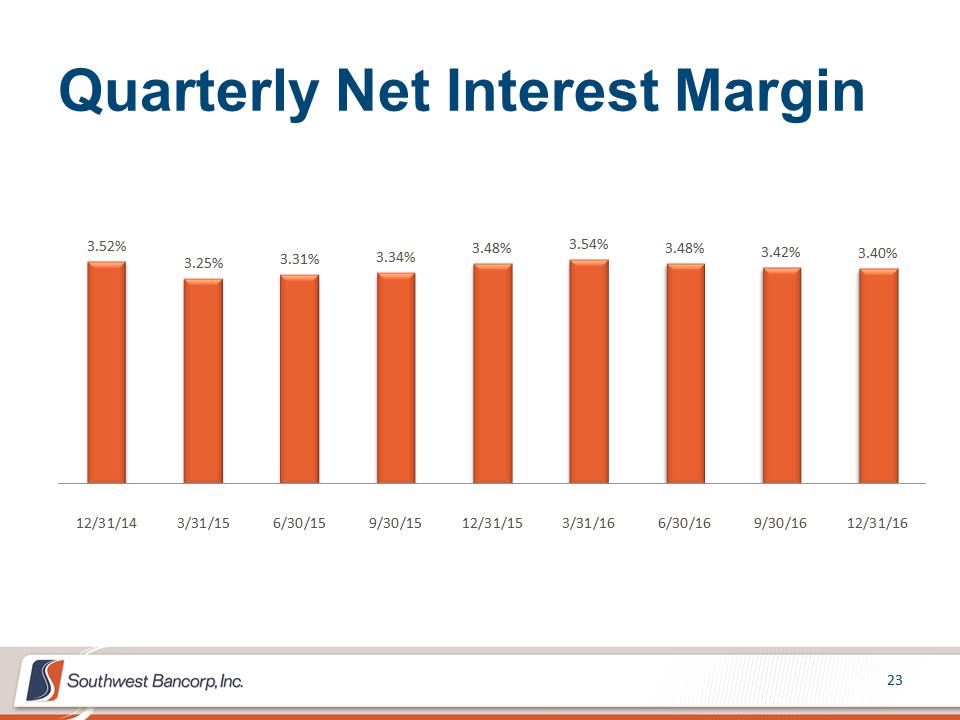 Quarterly Net Interest Margin 3.52% 3.25% 3.31% 3.34% 3.48% 3.54% 3.48% 3.42% 3.40% 12/31/143/31/156/30/159/30/1512/31/153/31/166/30/169/30/1612/31/16
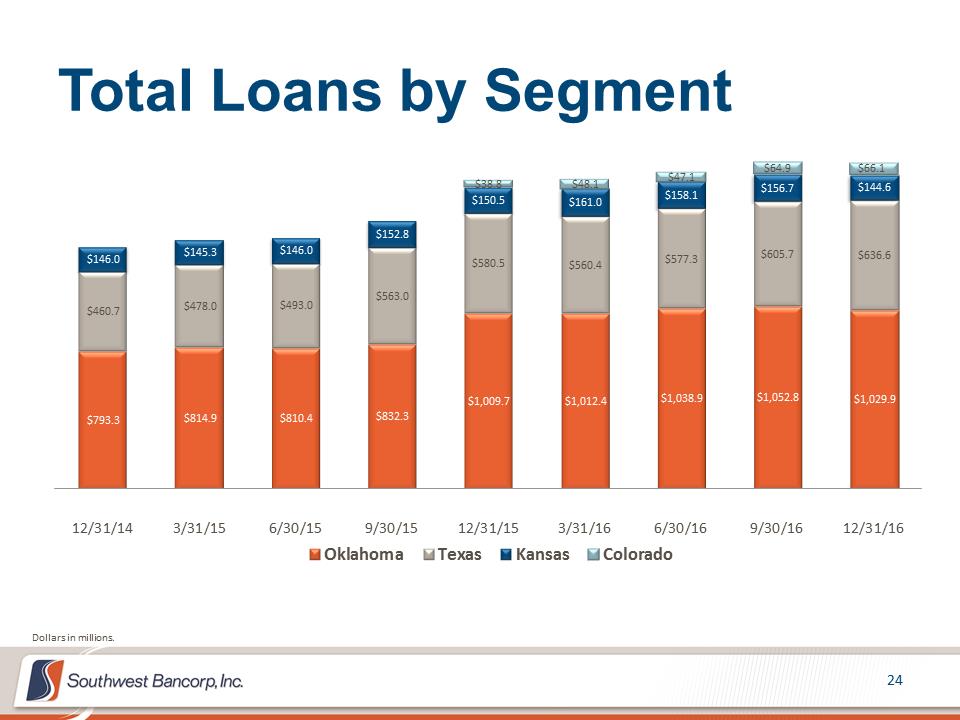 Total Loans by Segment $793.3 $814.9 $810.4 $832.3 $1,009.7 $1,012.4 $1,038.9 $1,052.8 $1,029.9 $460.7 $478.0 $493.0 $563.0 $580.5 $560.4 $577.3 $605.7 $636.6 $146.0 $145.3 $146.0 $152.8 $150.5 $161.0 $158.1 $156.7 $144.6 $38.8 $48.1 $47.1 $64.9 $66.1 12/31/143/31/156/30/159/30/1512/31/153/31/166/30/169/30/1612/31/16OklahomaTexasKansasColoradoDollars in millions.
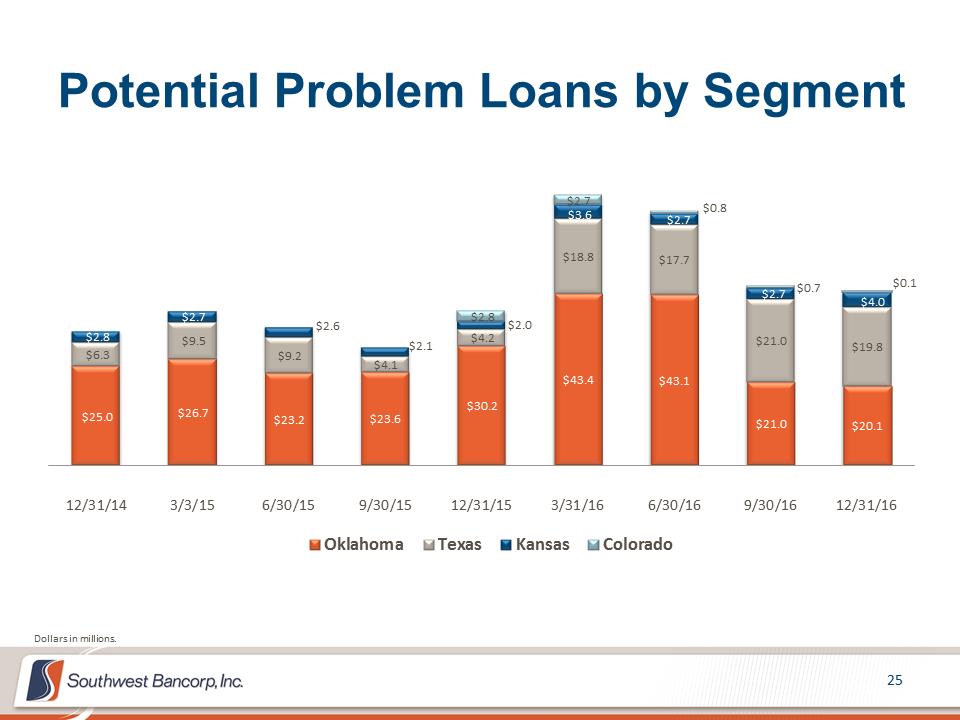 Potential Problem Loans by Segment $25.0 $26.7 $23.2 $23.6 $30.2 $43.4 $43.1 $21.0 $20.1 $6.3 $9.5 $9.2 $4.1 $4.2 $18.8 $17.7 $21.0 $19.8 $2.8 $2.7 $2.6 $2.1 $2.0 $3.6 $2.7 $2.7 $4.0 $2.8 $2.7 $0.8 $0.7 $0.1 12/31/143/3/156/30/159/30/1512/31/153/31/166/30/169/30/1612/31/16OklahomaTexasKansasColoradoDollars in millions.
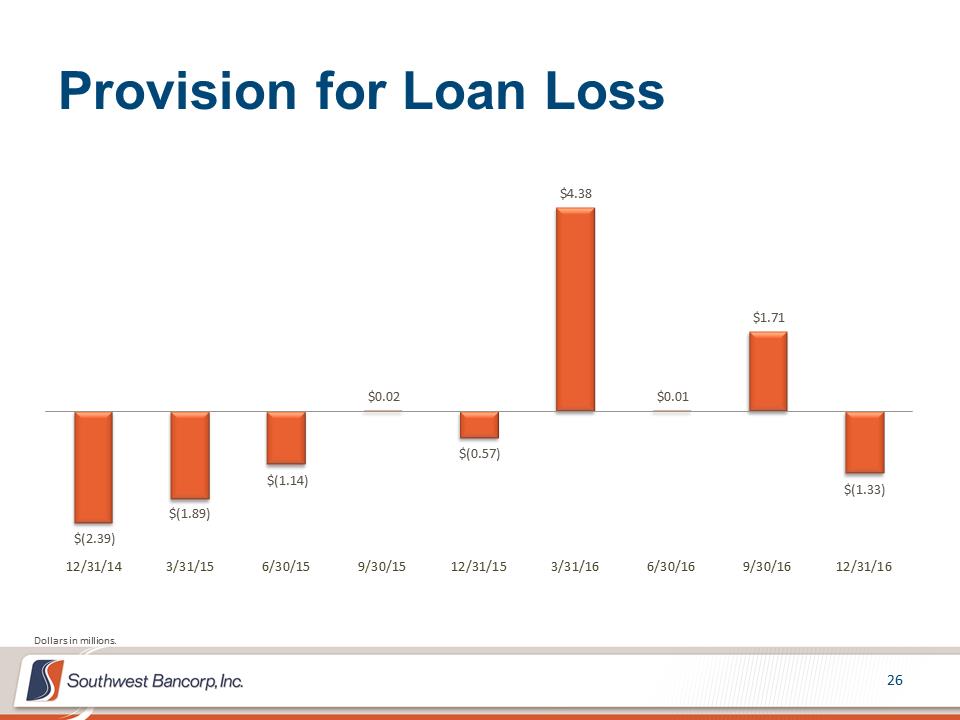 Provision for Loan Loss $(2.39) $(1.89) $(1.14) $0.02 $(0.57) $4.38 $0.01 $1.71 $(1.33) 12/31/143/31/156/30/159/30/1512/31/153/31/166/30/169/30/1612/31/16Dollars in millions.
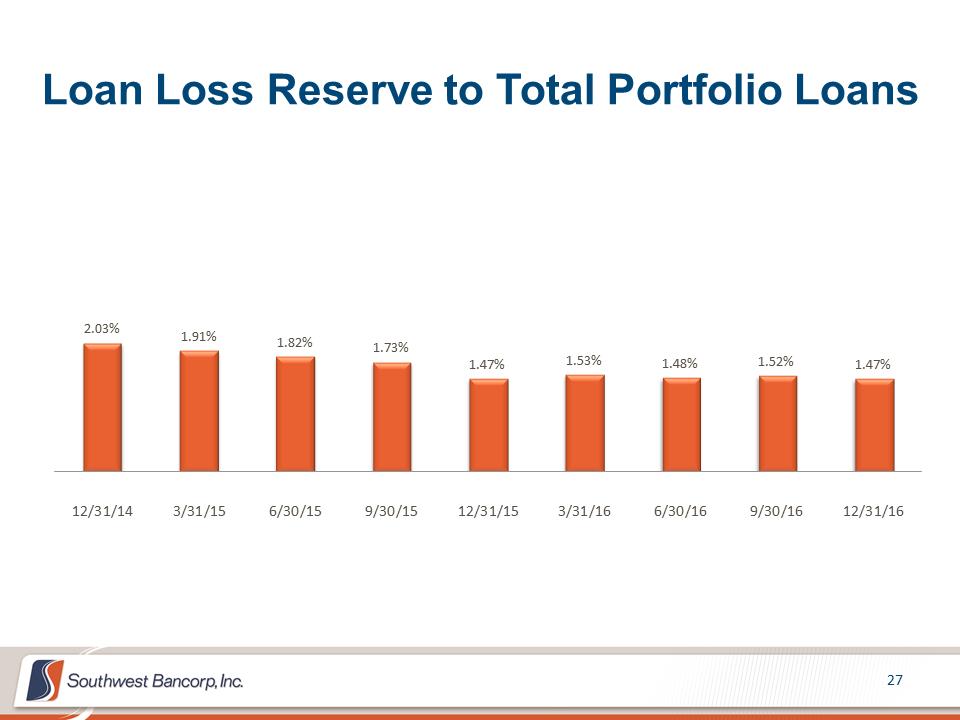 Loan Loss Reserve to Total Portfolio Loans 2.03% 1.91% 1.82% 1.73% 1.47% 1.53% 1.48% 1.52% 1.47% 12/31/143/31/156/30/159/30/1512/31/153/31/166/30/169/30/1612/31/16
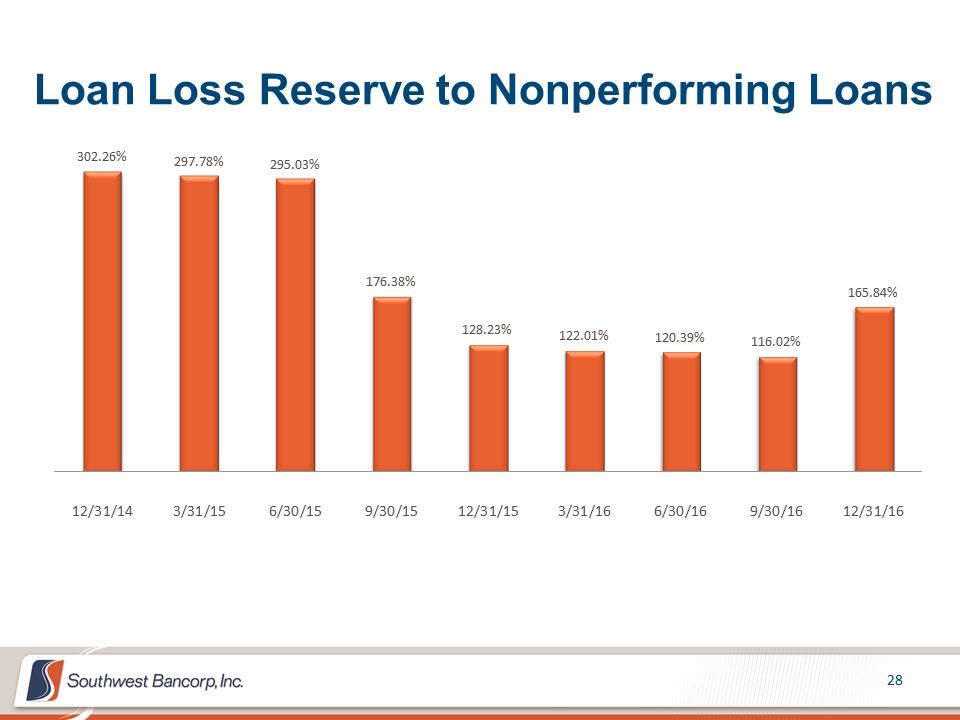 Loan Loss Reserve to Nonperforming Loans 302.26% 297.78% 295.03% 176.38% 128.23% 122.01% 120.39% 116.02% 165.84% 12/31/143/31/156/30/159/30/1512/31/153/31/166/30/169/30/1612/31/16
 APPENDIX
 The subsequent tables present non-GAAP reconciliations of the following calculations: –Tangible Common Equity (TCE) to Tangible Assets (TA) ratio –Tangible Book Value per Share –Pre-tax, Pre-provision Income
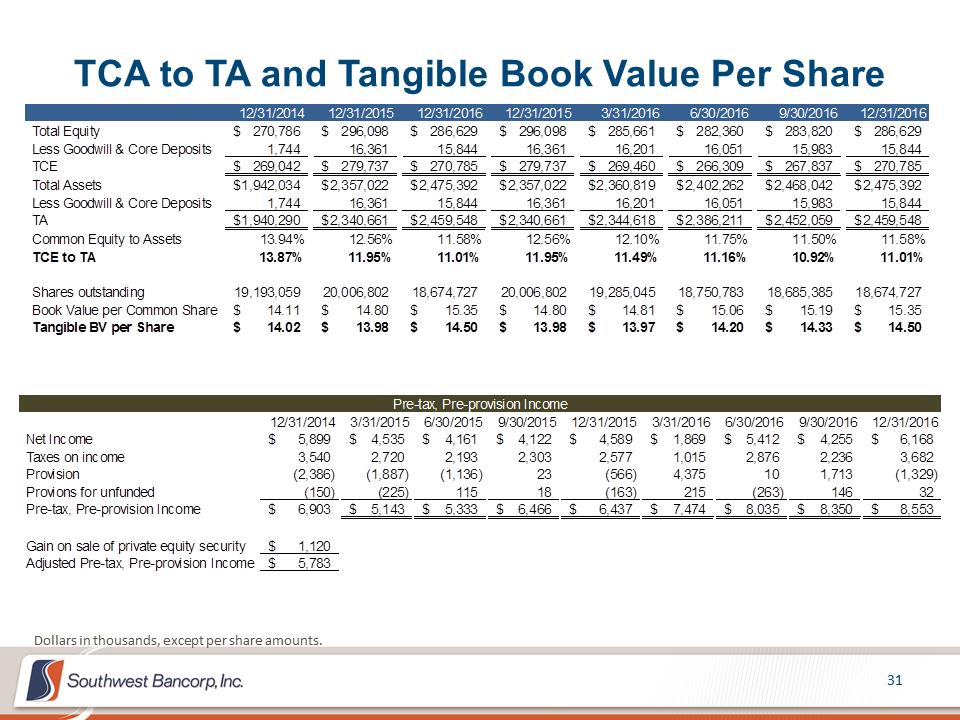 TCA to TA and Tangible Book Value Per Share Dollars in thousands, except per share amounts. 12/31/201412/31/201512/31/201612/31/20153/31/20166/30/20169/30/201612/31/2016Total Equity270,786$ 296,098$ 286,629$ 296,098$ 285,661$ 282,360$ 283,820$ 286,629$ Less Goodwill & Core Deposits1,744 16,361 15,844 16,361 16,201 16,051 15,983 15,844 TCE269,042$ 279,737$ 270,785$ 279,737$ 269,460$ 266,309$ 267,837$ 270,785$ Total Assets1,942,034$ 2,357,022$ 2,475,392$ 2,357,022$ 2,360,819$ 2,402,262$ 2,468,042$ 2,475,392$ Less Goodwill & Core Deposits1,744 16,361 15,844 16,361 16,201 16,051 15,983 15,844 TA1,940,290$ 2,340,661$ 2,459,548$ 2,340,661$ 2,344,618$ 2,386,211$ 2,452,059$ 2,459,548$ Common Equity to Assets13.94%12.56%11.58%12.56%12.10%11.75%11.50%11.58%TCE to TA13.87%11.95%11.01%11.95%11.49%11.16%10.92%11.01%Shares outstanding19,193,059 20,006,802 18,674,727 20,006,802 19,285,045 18,750,783 18,685,385 18,674,727 Book Value per Common Share14.11$ 14.80$ 15.35$ 14.80$ 14.81$ 15.06$ 15.19$ 15.35$ Tangible BV per Share14.02$ 13.98$ 14.50$ 13.98$ 13.97$ 14.20$ 14.33$ 14.50$ 12/31/20143/31/20156/30/20159/30/201512/31/20153/31/20166/30/20169/30/201612/31/2016Net Income5,899$ 4,535$ 4,161$ 4,122$ 4,589$ 1,869$ 5,412$ 4,255$ 6,168$ Taxes on income3,540 2,720 2,193 2,303 2,577 1,015 2,876 2,236 3,682 Provision(2,386)(1,887)(1,136)23(566)4,375101,713(1,329)Provions for unfunded(150)(225)11518(163)215(263)14632Pre-tax, Pre-provision Income6,903$ 5,143$ 5,333$ 6,466$ 6,437$ 7,474$ 8,035$ 8,350$ 8,553$ Gain on sale of private equity security1,120$ Adjusted Pre-tax, Pre-provision Income5,783$ Pre-tax, Pre-provision Income
 2016 Fourth Quarter Earnings Presentation January 25, 2017 NASDAQ: OKSB