Attached files
| file | filename |
|---|---|
| 8-K - 8-K - PINNACLE FOODS INC. | d335566d8k.htm |
 Lender Presentation
January 23, 2017
Pinnacle Foods
AMPLIFYING THE PLAYBOOK Exhibit 99.1 |
 Forward-Looking Statements
& Non-GAAP Financial Measures
2 This presentation contains “forward-looking statements” within the meaning of U.S. federal securities laws. Forward-looking statements are not historical facts, and are based upon management’s current expectations, beliefs, projections and targets, many of which, by their nature, are inherently uncertain. Such expectations, beliefs, projections and targets are expressed in good faith. However, there can be no assurance that management’s expectations, beliefs, projections and targets will be achieved and actual results may differ materially from what is expressed in or indicated by the forward- looking statements. Forward-looking statements are subject to significant business, economic, regulatory and competitive risks and uncertainties that could cause actual performance or results to differ materially from those expressed in the forward-looking statements, including risks detailed in Pinnacle Foods Inc.’s (“Pinnacle Foods,” “Pinnacle” or the “Company”) filings with the U.S. Securities and Exchange Commission (the “SEC”). Nothing in this presentation should be regarded as a representation by any person that these forward-looking statements will be achieved. Forward-looking statements speak only as of the date the statements are made. The Company assumes no obligation to update forward-looking statements to reflect actual results, subsequent events or circumstances or other changes affecting forward-looking information except to the extent required by applicable securities laws. This presentation includes certain non-GAAP financial measures, which differ from results using U.S. Generally Accepted Accounting Principles (GAAP). These non-GAAP financial measures should be considered as supplements to the GAAP reported measures, should not be considered replacements for, or superior to, the GAAP measures and may not be comparable to similarly named measures used by other companies. Non-GAAP financial measures typically exclude certain charges, which are not expected to occur routinely in future periods. The Company uses non-GAAP financial measures internally to focus management on performance excluding these special charges to gauge our business operating performance. Management believes this information is helpful to investors because it increases transparency, and assists investors in understanding the underlying performance of the Company and in the analysis of ongoing operating trends. Additionally, management believes that non-GAAP financial measures are frequently used by analysts and investors in their evaluation of companies, and its continued inclusion provides consistency in financial reporting and enables analysts and investors to perform meaningful comparisons of past, present and future operating results. The most directly comparable GAAP financial measures and reconciliations to non-GAAP financial measures are set forth in the appendix to this presentation and included in the Company’s filings with the SEC. |
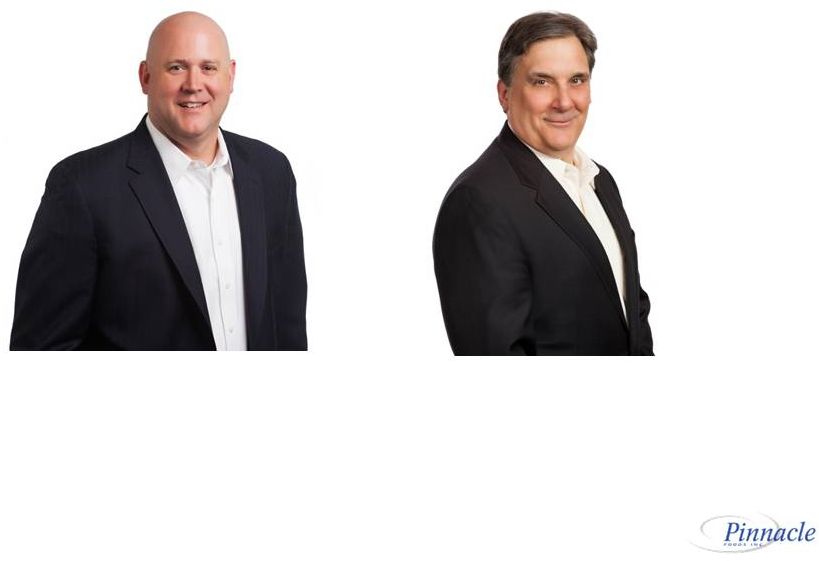 Pinnacle Management Team Presenters
3 Mark Clouse CEO Craig Steeneck EVP & CFO |
 • Transaction Overview • Pinnacle Overview • Pinnacle Business Update • Financial Update Agenda 4 |
 • Pinnacle Foods (“Pinnacle”, “PF” or the “Company”) is a leading producer, marketer and distributor of
high-quality branded food products, which have been trusted
household names for decades. •
The Company intends to refinance its existing $150 million Revolving Credit
Facility, $1,410 million Term Loan G, $508 million Term Loan H and
$545 million Term Loan I with the following: Approximately $220 million of cash from the balance sheet New $200 million Revolving Credit Facility due 2022 New $2,262 million Term Loan due 2024 • Pinnacle expects 2016 FY Net Sales of $3,125-$3,130 million (~18% vs. PY) and Free Cash Flow of
$380- $385 million (+$115-$120 million vs. PY).
Year-end cash position is estimated at $350-$355 million.
For the LTM period ended 9/25/16:
Net sales of $3,148 million
Adjusted EBITDA of $670 million
• Pinnacle expects 2016 FY Net Total Debt ratio to be below 4.25x. For the LTM period ended 9/25/16: Net Secured Debt ratio was 3.5x and Net Total Debt ratio was 4.5x Transaction Overview Note: All 2016 data is unaudited. (1) Debt balances represent borrowings as of 1/13/17. (2) Free cash flow is the sum of cash flow from operating activities less capital expenditures. See reconciliation to GAAP financial measures
in Appendix. (3)
Adj. EBITDA represents Covenant Compliance EBITDA. See reconciliation to GAAP
financial measures in Appendix. (4)
Based on fiscal year end 12/25/16 estimated cash and cash equivalent balance of
~$350mm. 5
(1) (3) (4) (2) |
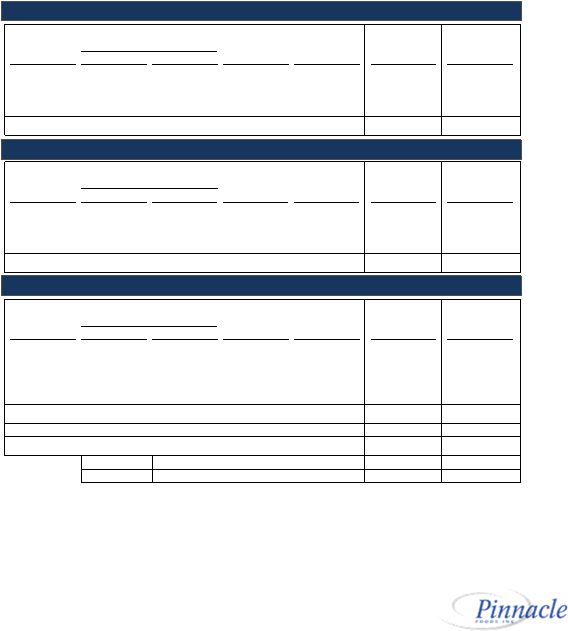
 Sources & Uses and Pro Forma Capitalization
($ in millions) Sources Amount New Term Loan $2,262 Cash from Balance Sheet 220 Total Sources $2,482 Uses Amount Repay Term Loan G $1,410 Repay Term Loan H 508 Repay Term Loan I 545 Estimated Fees & Expenses 19 Total Uses $2,482 Note: All 2016 data is unaudited. (1) Represents on fiscal year end 12/25/16 estimated cash and cash equivalent balance.
(2) Represents borrowings as of 1/13/17. 6 ($ in millions) Pre Post Debt Capitalization Maturity Transaction Adj. Transaction Cash and Cash Equivalents $350 ($220) $130 New Revolver ($200 million) 2022 -- -- -- Term Loan G 4/29/20 1,410 (1,410) -- Term Loan H 4/29/20 508 (508) -- Term Loan I 1/13/23 545 (545) -- New Term Loan 2024 -- 2,262 2,262 Capital Lease Obligations -- 36 -- 36 Total Senior Secured Debt $2,498 ($200) $2,298 4.875% Senior Notes due 2021 5/1/21 350 -- 350 5.875% Senior Notes due 2024 1/15/24 350 -- 350 Notes Payable 6/30/18 7 -- 7 Total Debt $3,205 ($200) $3,005 Total Net Debt $2,855 $19 $2,874 Credit Statistics Senior Secured Net Debt / Adj. EBITDA 3.2x 3.2x Total Net Debt / Adj. EBITDA 4.3x 4.3x (1) (2) (2) (2) |
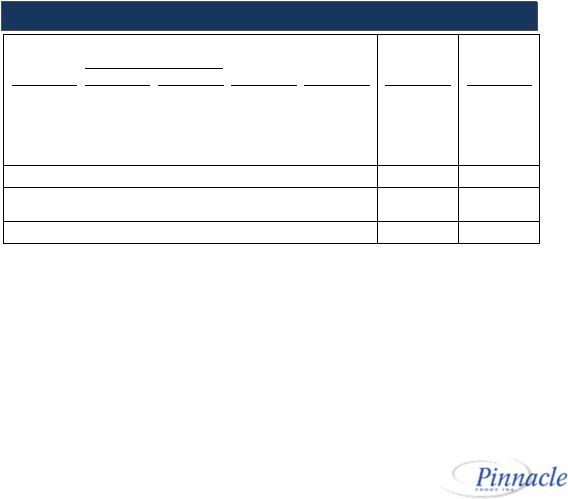
 Borrower: Pinnacle Foods Finance LLC (the “Borrower”) Facility: New Term Loan Facility Size: $2,262 million Guarantors: Guarantees from certain existing and future parent and immediate parent entities and certain existing
and future domestic subsidiaries (same as
existing Senior Credit Facilities) Security:
Collateral to include 100% of the capital stock of the Borrower and certain
wholly owned domestic subsidiaries, 65% of capital stock of
certain wholly owned first-tier foreign subsidiaries, and
substantially all other assets owned by the Borrower and each Guarantor (same as existing Senior Credit
Facilities) Maturity: 7 Years (2024) Amortization: 1% per annum Optional Prepayment: 101 soft call for 6 months Financial Covenant: Net First Lien Leverage Ratio < 5.75x (same as existing Senior Credit Facilities)
Negative Covenants:
Usual and customary for transactions of this type
Summary of Terms: New Term Loan B
7 |
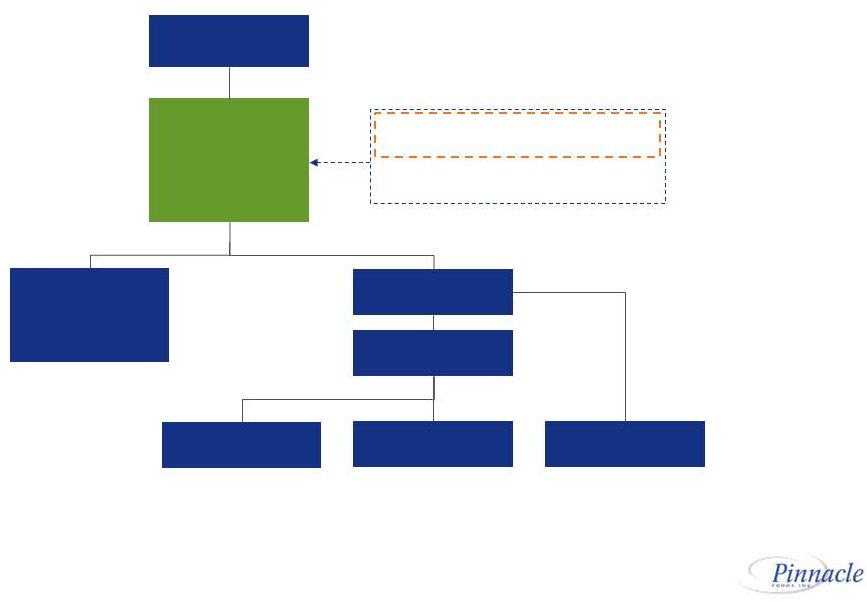 Pinnacle Organizational Structure
8 Pinnacle Foods Inc. Pinnacle Foods Finance LLC Pinnacle Foods Finance Corp. Pinnacle Foods International Corp. Pinnacle Foods Group LLC Birds Eye Foods, Inc. Other Subsidiary Guarantors Boulder Brands, Inc. New $200 million Revolving Credit Facility New $2,262 million Term Loan Existing $350 million 4.875% Senior Notes Existing $350 million 5.875% Senior Notes |
 Syndication Timeline
Date: Description of Events 1/23 Lender Call 1/27 Lender Consents & Commitments Due 2/3 Closing and Effectiveness January 2017 February 2017 Sun Mon Tue Wed Thu Fri Sat Sun Mon Tue Wed Thu Fri Sat 1 2 3 4 5 6 7 1 2 3 4 8 9 10 11 12 13 14 5 6 7 8 9 10 11 15 16 17 18 19 20 21 12 13 14 15 16 17 18 22 23 24 25 26 27 28 19 20 21 22 23 24 25 29 30 31 26 27 28 Bank Holiday Key Syndication Date 9 |
 • Transaction Overview • Pinnacle Overview • Pinnacle Business Update • Financial Update Agenda 10 |
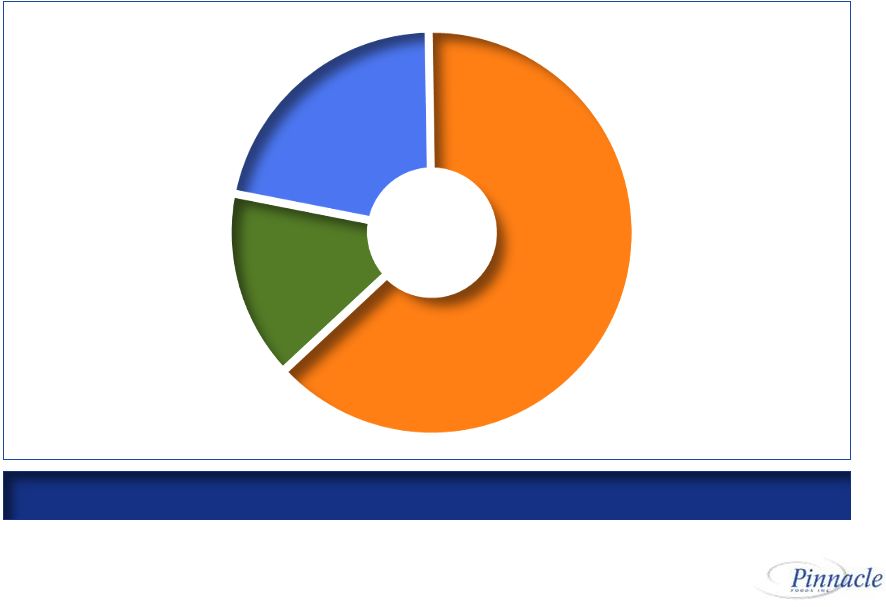
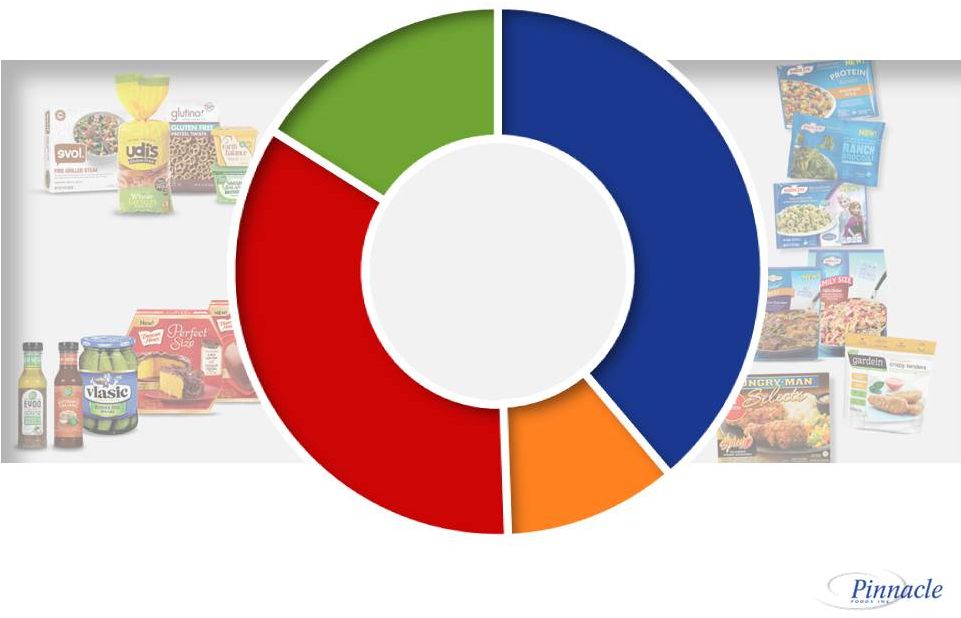 Note: Pro forma for Boulder Brands acquired on January 15, 2016.
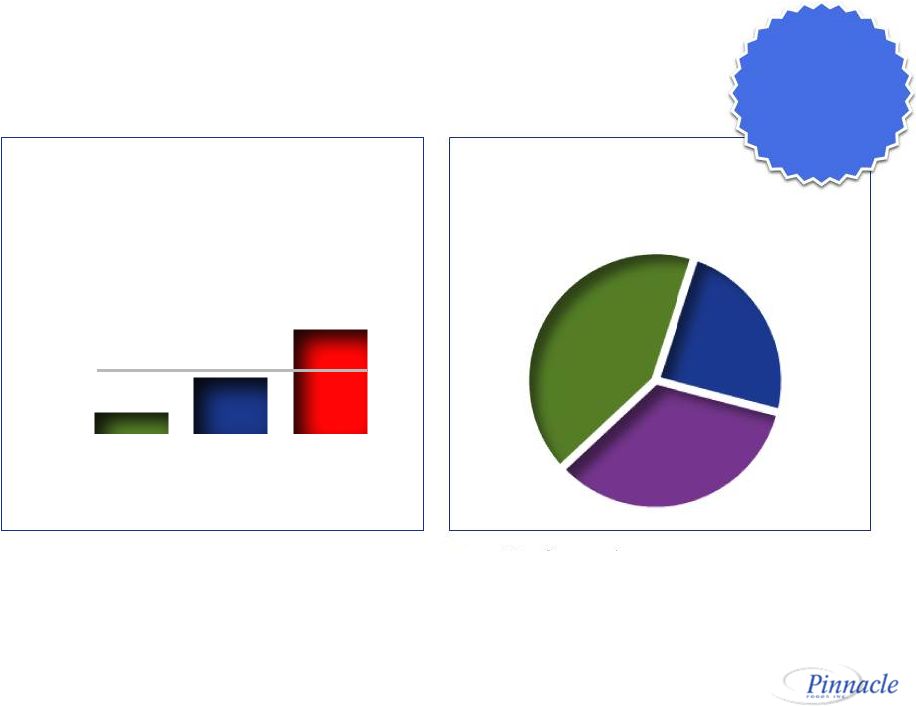
Birds Eye Frozen Specialty Duncan Hines Grocery Boulder Brands 2015 Net Sales $3.2 billion Diversified Portfolio 11 16% 39% 11% 34% |
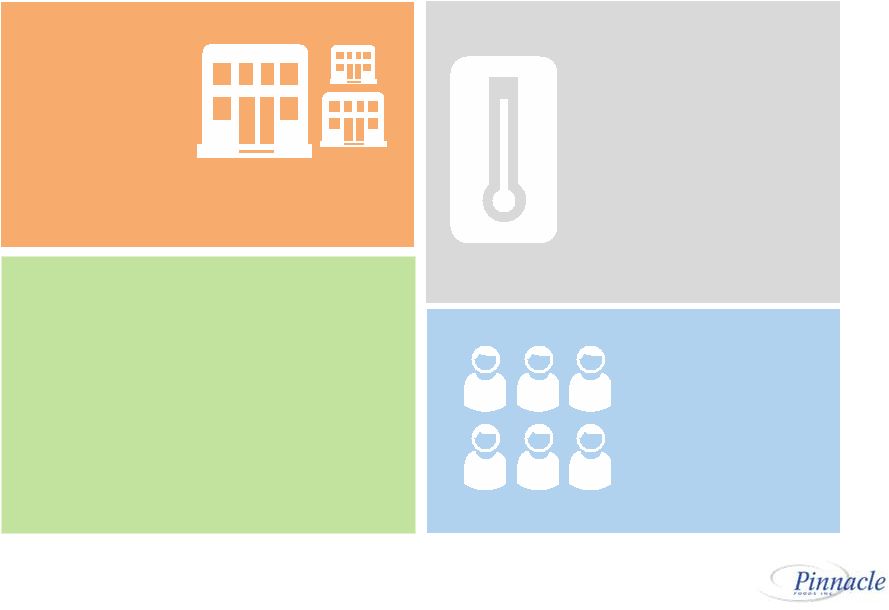 Retail Distribution
Channels • Grocery / Mass • Natural & Organic • Club & Dollar • E-Commerce Manufacturing Facilities 16 Employees 5.1k Broad Scale and Capabilities 12 Temperature Classes • Frozen • Grocery • Refrigerated |
 Attractive Value Creation Since IPO
Accretive Acquisitions Accelerate Growth Beyond Algorithm
Note: Operating Income and EPS presented above are on a Non-GAAP basis. See
reconciliation to GAAP financial measures in Appendix. Total
Shareholder Return (TSR) reflects stock price as of 12/30/16 versus IPO price of $20, plus actual dividend yield over the period. Net Sales Operating Income EPS Dividend Yield 13% 14% 3% Outpaced Categories 17% 2013 13% Outpaced Categories 10% 39% 3% Outpaced Categories 42% 2014 2015 5% 10% ~2-3% LT Organic Growth Target 4 - 5% 7 - 8% 3 - 4% In Line with Categories 10 - 12% Adjusted Basis 13 TSR >190% since IPO TSR >190% since IPO |
 • Transaction Overview • Pinnacle Overview • Pinnacle Business Update • Financial Update Agenda 14 |
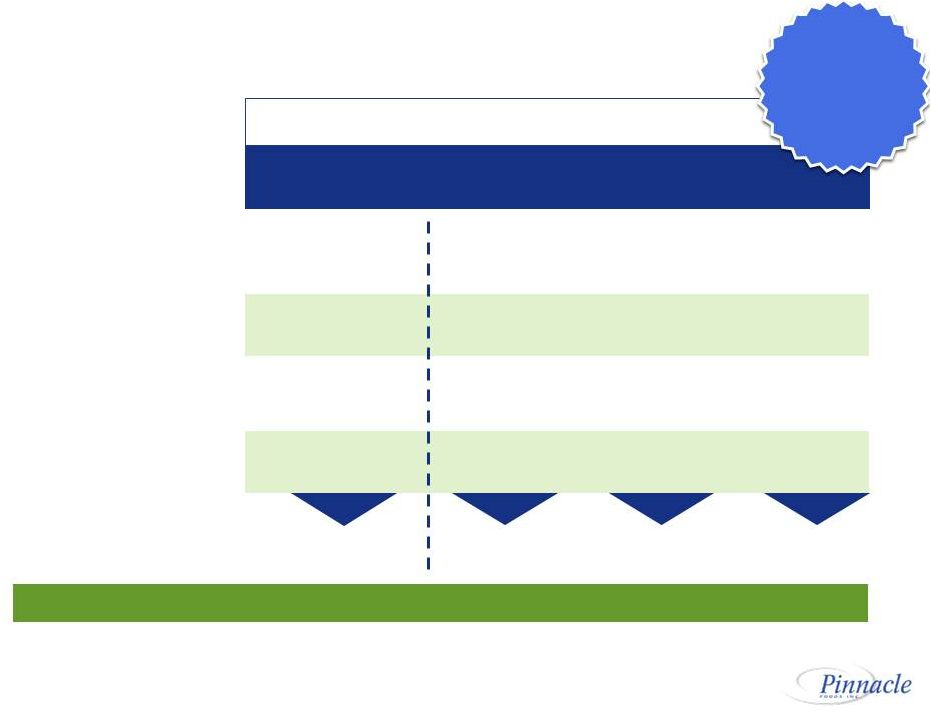
 Increase M&A Potential Strengthen Capabilities; Maintain Costs Accelerate Profitable Top-Line Growth Expand Margins & Cash Flow Amplifying the Playbook 15 |
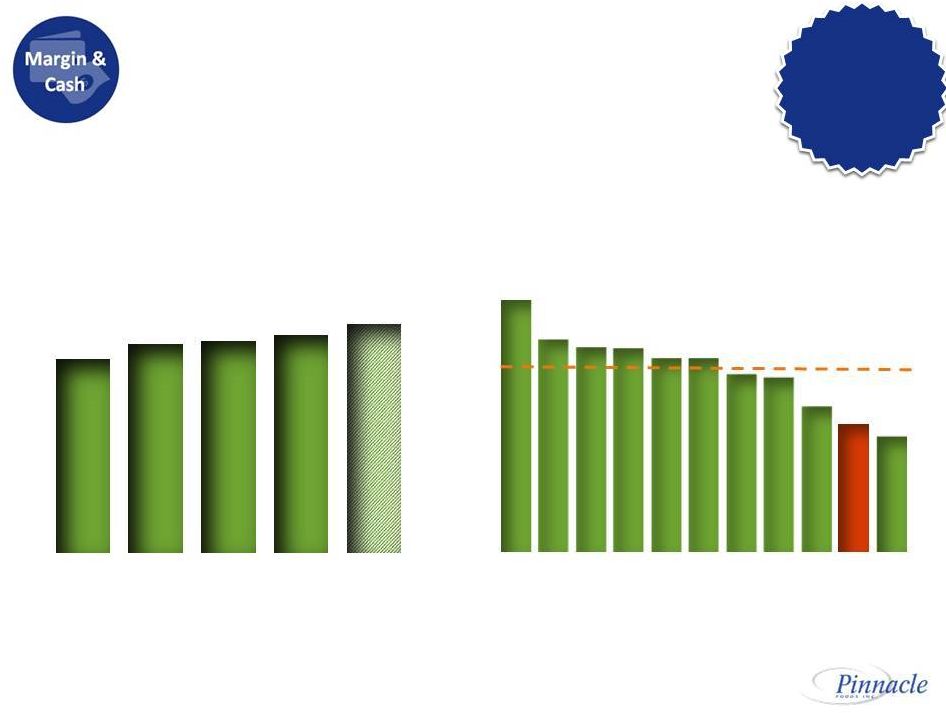 Expand Margins Note:. Adj. Gross Profit % of Net Sales is a Non-GAAP measure and represents latest fiscal year. See reconciliation to GAAP
financial measures in Appendix for PF. Source: Peer Company
reporting; Pinnacle analysis. 2012
2013 2016E 2015 Adj. Gross Profit 25.1% 27.0% 27.4% 28.2% < 30% 2014 % of Net Sales PF 26.5% Peer Average = 36.0% 46.0% 2015 Adj. Gross Profit Peer Company Comparison % of Net Sales +450 bps since IPO +450 bps since IPO 16 |
 Gross Margin Amplifiers
Impact Mix & Net Realized Price Target 300-400 bps Expansion 2019 vs. 2016 Boulder Productivity (MVP) 17 Note: MVP is Pinnacle’s Maximizing Value through Productivity Program. |
 Note: COGS pro forma for Boulder Brands acquired on 1/15/16.
Maximizing Value through Productivity (MVP)
18 Conversion Logistics Ingredients and Packaging COGS $2.3bn • Holistic company-wide cost reduction program • Strong on-going governance • End-to-end cross-functional process • Rigorous planning and tracking 3.9% of COGS Annual Savings since IPO |
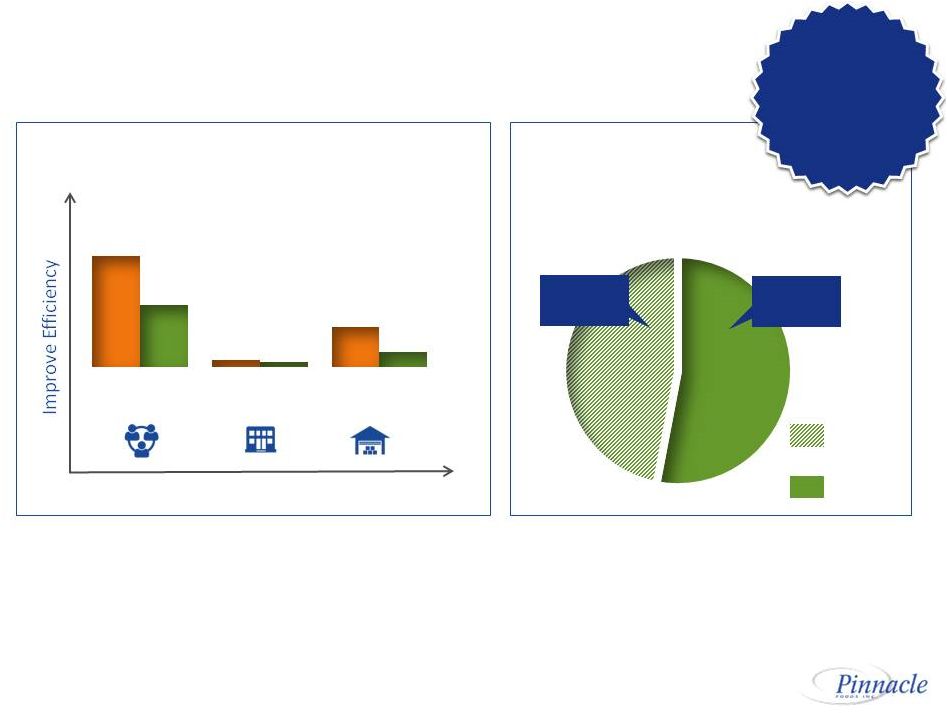
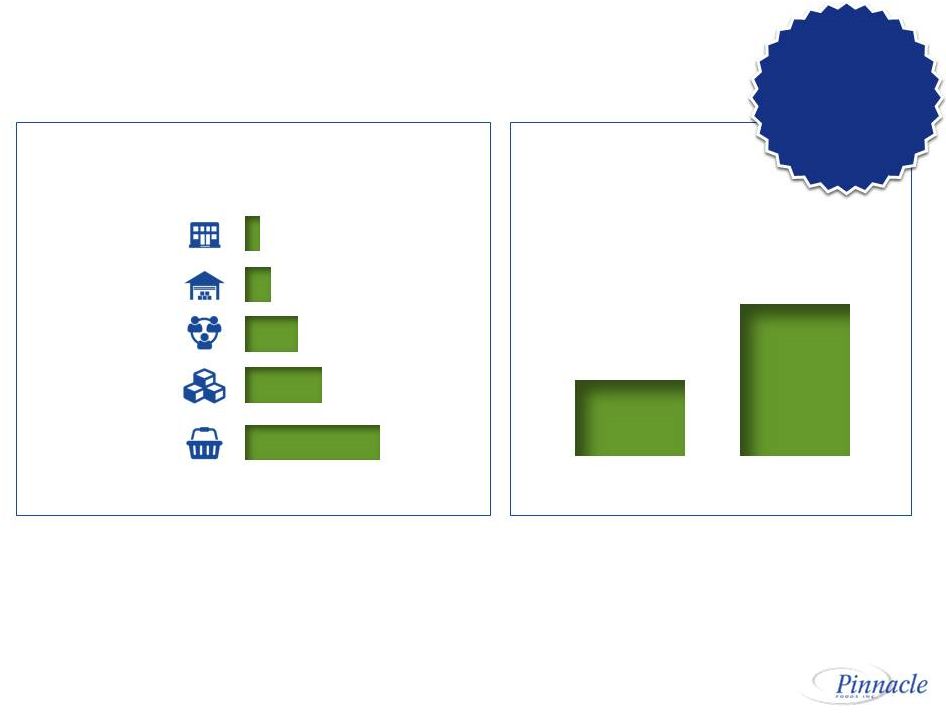 MVP Amplifiers 19 10% 20% Today 2019 • Continuous improvement • Planning • Route to market Improve Operational Efficiency Direct Plant Shipment 16 18 ~700 ~3,500 ~7,000 Plants Warehouses Suppliers SKUs Ingredients • Simplification • Optimization • Rationalization Drive Scale Focus: Sustain MVP at 3.5% - 4.0% of COGS |
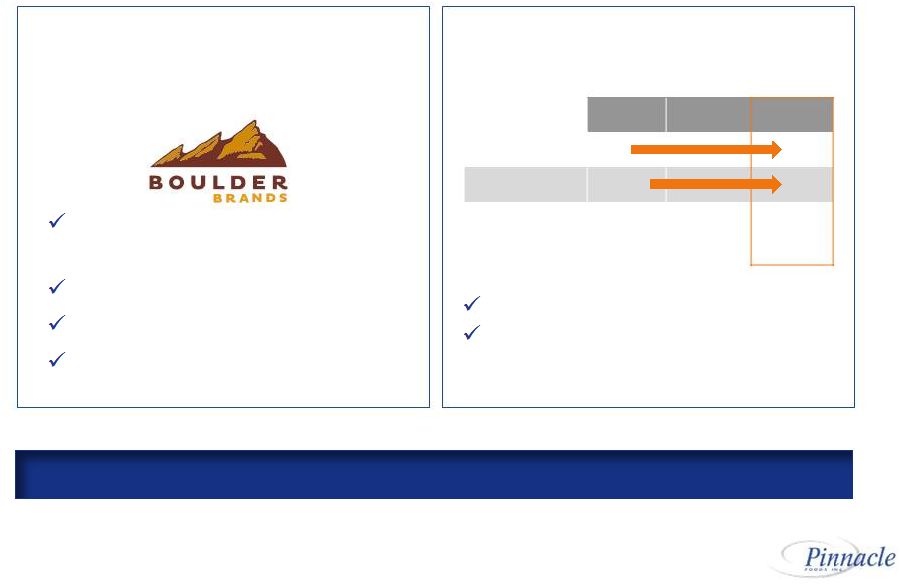 Boulder 20 2016 2017 2018 SG&A COGS Total Synergies $15m $15m $4-6m $30m 2016-2017 on track Incremental $4-6m expected in ‘18 Synergy Target Increased Acquisition Integration Completed Highly-experienced Boulder President on board One order, one invoice SKU rationalization program Systems integration ~$0.10 EPS Contribution in 2016 |
 Boulder Amplifiers
21 Focus: Implement MVP 45 3 16 25 2 6 Co-packers Plants Warehouses Drive Scale • Scale benefit • Operating efficiency • Capability • Efficiency/mix benefit with fewer SKUs • UK exit • Margin accretive innovation Optimize the Portfolio 53% 47% Boulder SKUs 91% NS 9% NS SKUs Eliminated SKUs Ongoing 2015-2017 Adj EBITDA Growth Increased to ~80% |
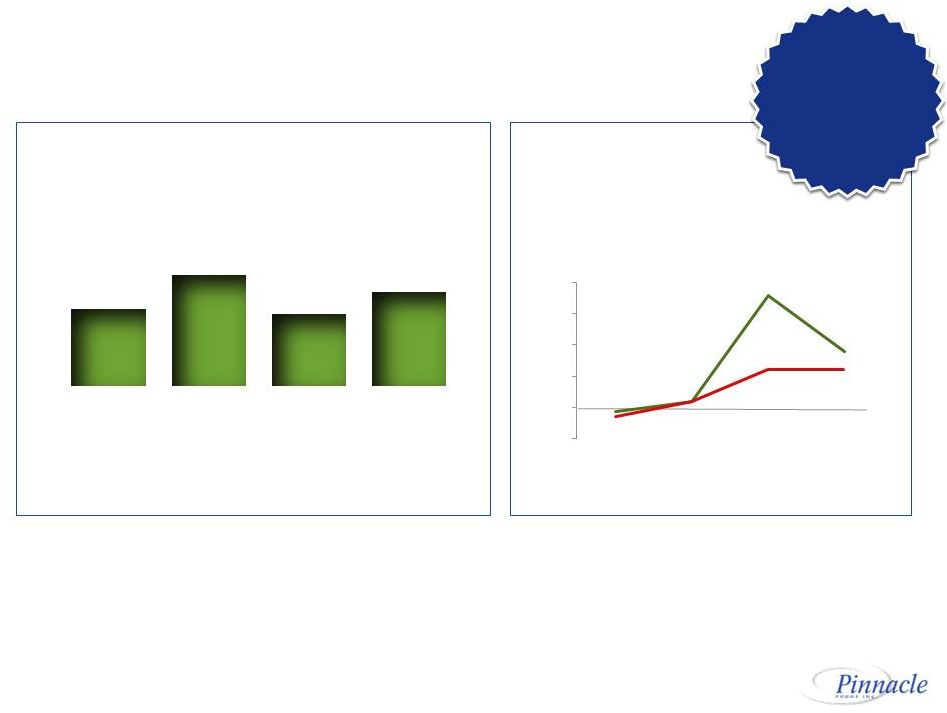 Mix and Net Realized Price Amplifiers
22 Source: Average Retail Price based on IRI US Multi-Outlet data, using IRI’s Pinnacle custom definitions, 2016 period as of
12/25/16, excluding the Boulder acquisition. Category reflects
composite categories weighted based on Pinnacle’s consumption.
Achieve NRP Average Retail Price Change vs YAG Pinnacle Categories • Select pricing • Trade optimization • Price/Size architecture Improve the Mix $22m $31m $20m $26m 2013 2014 2015 Mix Impact on Gross Profit 2016 9 Mos. Focus: • Leadership vs. Foundation • Premium tiering • Margin accretive innovation ~$100m Incremental Gross Profit since IPO Continued Benefit From Mix & Price -1.0% 0.0% 1.0% 2.0% 3.0% 4.0% 2013 2014 2015 2016 |
 Amplifying the Playbook
Acquisition &
Integration Expertise Expand Margins & Cash Flow Lean & Experienced Organization 23 Accelerate Profitable Top-Line Growth |
 Accelerate Profitable Top-Line Growth
24 -1.8 pts -1.2 pts -1.3 pts Annual Category $ Consumption vs. PY Source: IRI US Multi-Outlet data, based on IRI’s Pinnacle custom definitions, 2016 period as of 12/25/16. Category
consumption reflects composite categories weighted based on Pinnacle’s
consumption. 2013
2014 2015 2016 +1.7 pts +1.0 pts +0.5 pts +0.2 pts Cumulative Market Share Growth since IPO NA Retail Composite $ Share (ex. Boulder) -1.1 pts Boulder Improves PF Category Trend by 0.5 – 1.0 pts |
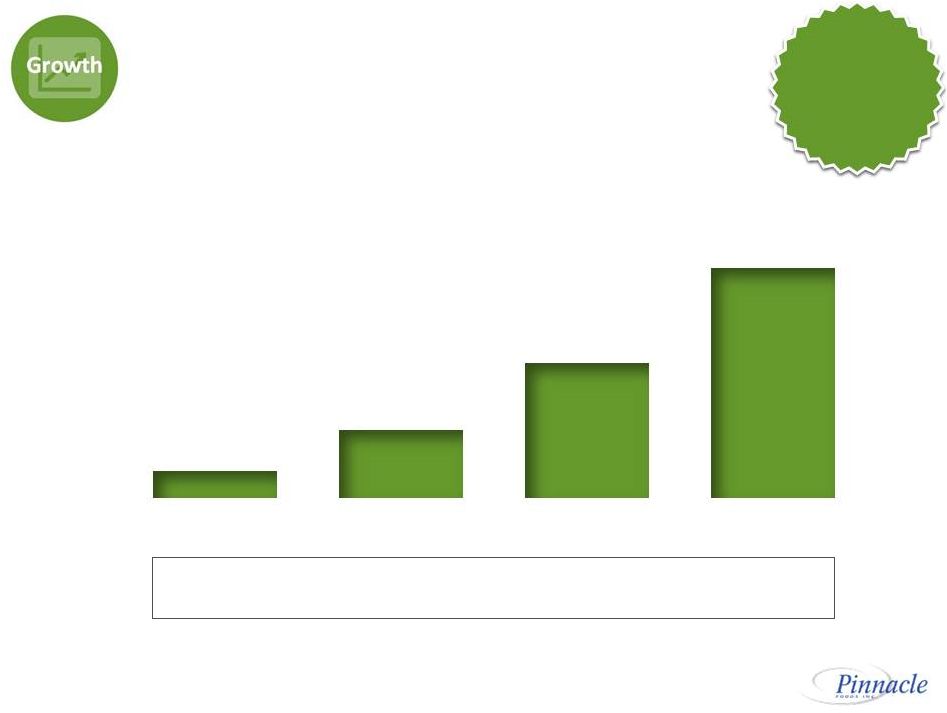
 Growth Amplifiers
25 Strengthened Fundamentals Expanded Health & Wellness Presence Enhanced Channel Coverage Impact Drive Sales Growth at or above Categories Drive Sales Growth at or above Categories |
 Foundation Brands
Private Label Food Service 33% of Net Sales Leadership Brands 67% of Net Sales Portfolio Roles Well Defined 26 Leadership ~75% of Brand Profit Leadership ~75% of Brand Profit |
 Portfolio Roles Well Defined
Leadership Brands
• Lead category growth • Support at higher levels • Prioritize innovation and capital investment • Maintain margin advantage Accelerate • Hold or grow market share • Provide competitive support levels • Introduce focused innovation • Sustain focus on margins Core Foundation Brands Private Label Food Service • Stabilize performance • Optimize margins; maximize profit • Minimize capital • Create lean support model • Invest in only high ROI innovation 27 |
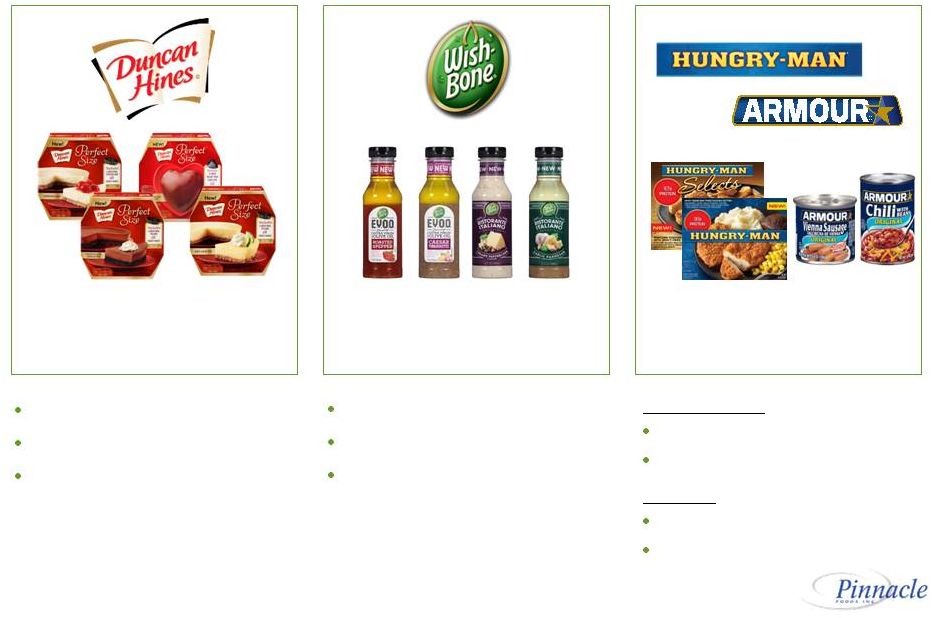 Strengthened Fundamentals
28 • Premium tier working • Q4 tough, but improving • Big 2017 planned Trends Improving, Strong 2017 Hungry-Man • Selects now 28% of brand • Margins up +500bps Armour • Smart scale • Margins up +330bps Foundation Brand Role Models • 5 of Top 12 new items • New, younger consumers • 2017 innovation expanding healthy oils Successful Innovation Continues |
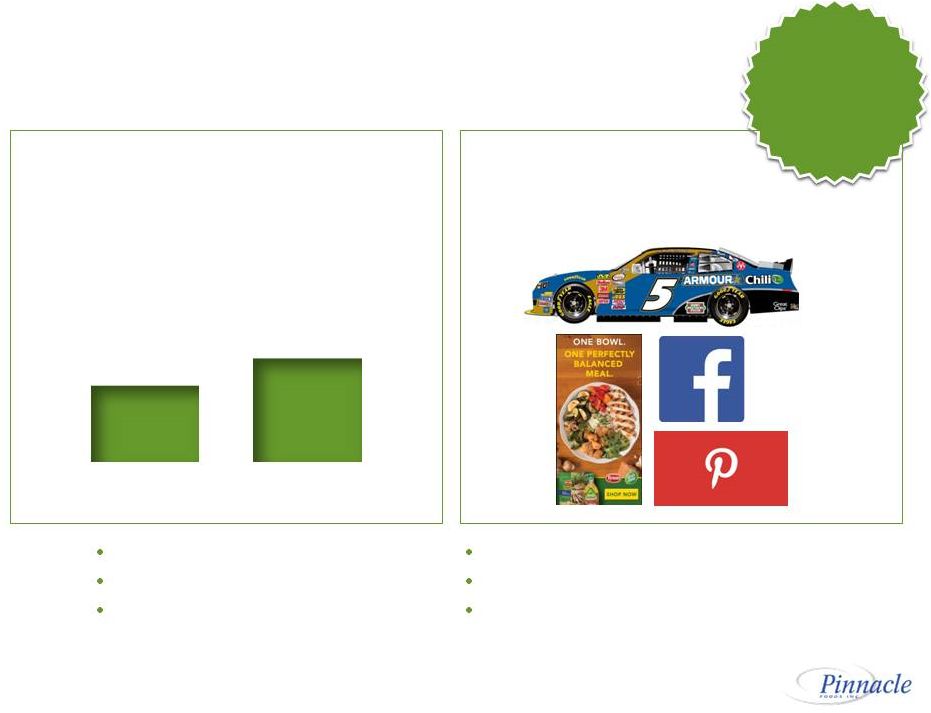 Strengthened Fundamentals Amplifier
29 FY2016 composite $ share +0.7pts. FY2016 composite $ share +0.7pts. Expand Efficient Brand Support Model • Low cost, high impact • In-store and digital • Scale programs increasing Optimize Leadership Brand Investment Pinnacle Total Peer Avg. DTC % of Net Sales ~3% ~4% • High ROI focused spending • Rigorous tracking and analytics • Pay as you go model Focus: Source: IRI US Multi-Outlet data, based on IRI’s Pinnacle custom definitions, period ending 12/25/16; Pinnacle
analysis. |
 Better Center of Store
Expanded H&W Presence Amplifier
30 Vegetable Ubiquity Lifestyle Leadership Plant Based Clean Convenience Gluten Free 55% of Portfolio in H&W |
 Lifestyle Leadership
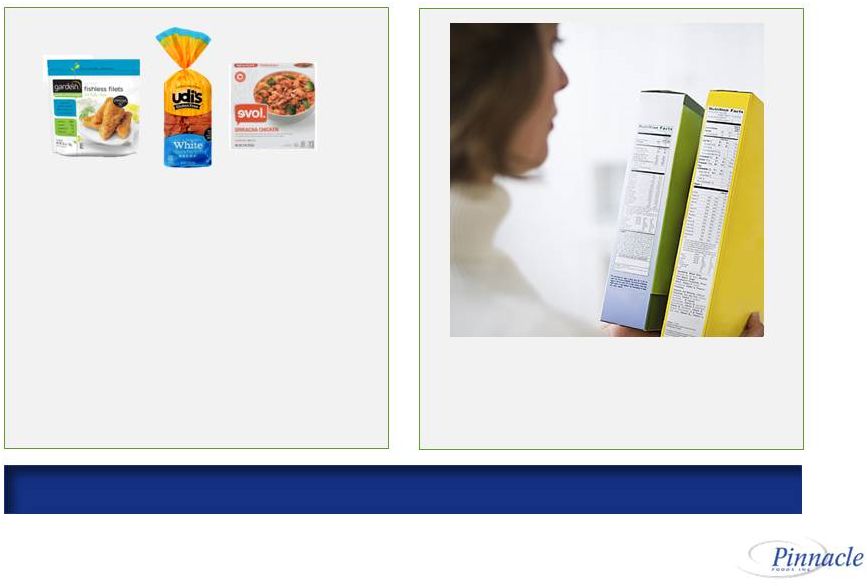
31 30% of consumers participated in some kind of specialized approach to eating in the past 12 months. Top 3 Lifestyle Approaches • Plant Based / Vegetarian • Lactose-Free • Gluten-Free Clean ingredients
are #1 H&W purchase intent driver Sources: FMI, US Grocery Shopping Trends, 2015; Innova Market Insights; IRI Multi-Outlet, Pinnacle analysis.
Lifestyle Driven Food Decisions Reshaping Landscape
|
 Lifestyle Leadership Amplifier
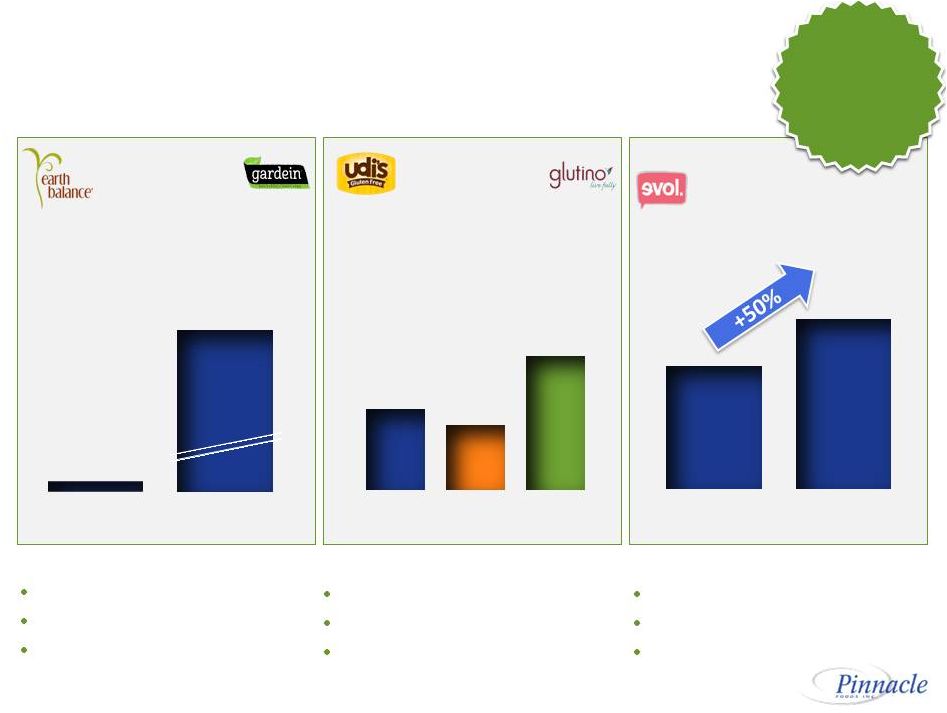
32 • No compromise on taste • Lever brand leadership • Quality upgrades Optimize Gluten-Free Distribution - % ACV 60% 48% 99% Udi’s Pinnacle Glutino • Shelving distribution • Margin improvement • Innovation in meals Expand Clean Convenience Evol Velocities by Channel Natural Mainstream • New capacity • Distribution/marketing • Add new occasions Accelerate Plant-Based HH Penetration Focus: 2.1% 88.5% Gardein Pinnacle Sources: Nielsen, XAOC latest 52 week period ending | Nielsen 12/17/16 | Nielsen, Panel data latest 52 week period ending
12/25/16 | SPINS, latest 52 week period ending 12/25/16
Lifestyle Categories growing 10X Food & Bev Lifestyle Categories growing 10X Food & Bev |
 Vegetable Ubiquity
33 Demand Consumers actively seeking to increase consumption 44% 48% 49% 63% 65% Protein Fiber Whole Grains Fruit Vegetables Nutrition Deficit 9 of 10 Americans are
not eating enough vegetables
Sources: CDC; NPD Eating Trends 2016.
Improving deficit to 8 of 10 Americans is worth ~$300 million
in frozen vegetable consumption |
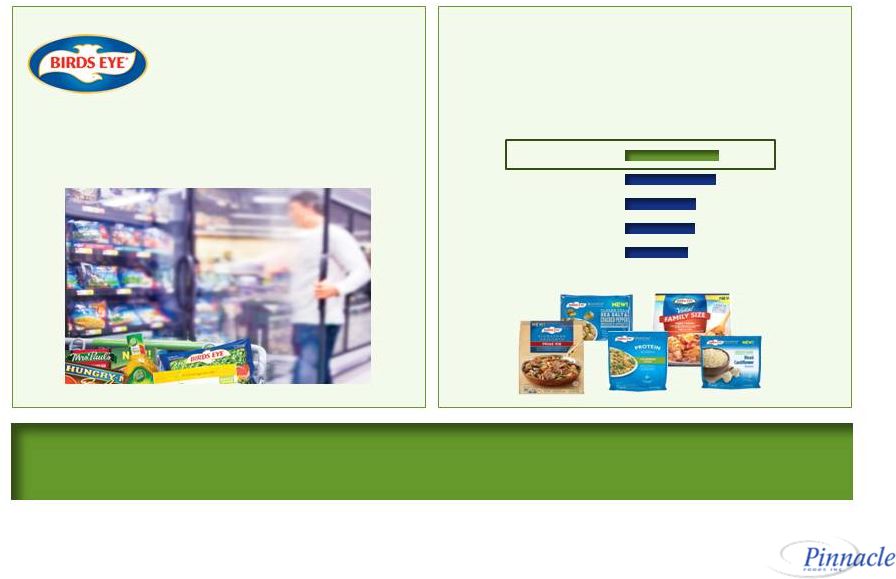
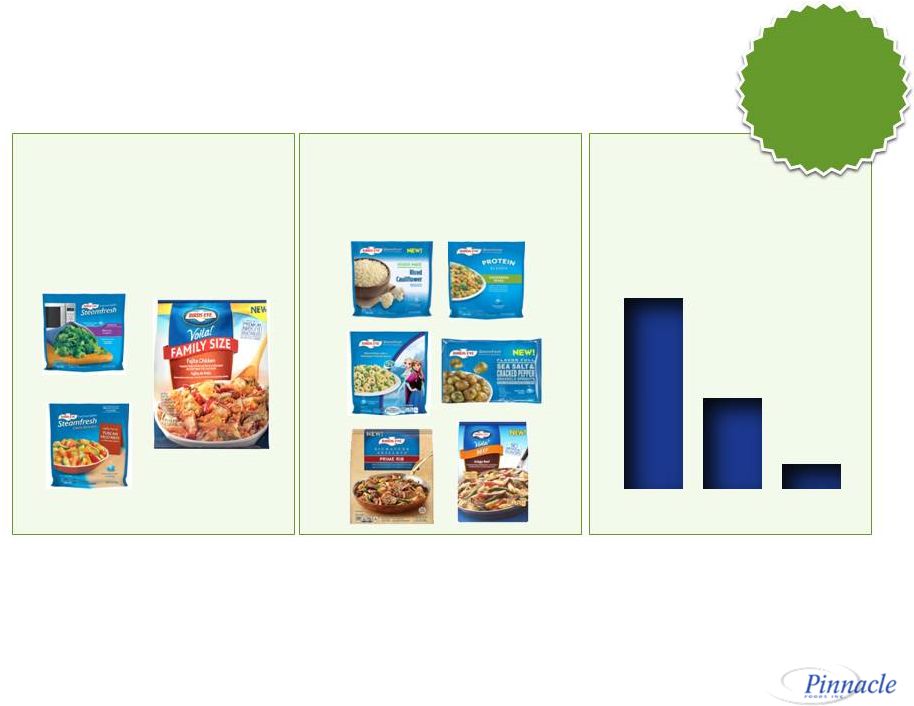 Vegetable Ubiquity Amplifiers
34 • 6 new platforms in 2 yrs. • ~75% ACV on existing platforms • 3 new platforms in 2017 Expand Formats and Occasions • Stand-up packaging • Channel expansion • Affordability/Family Size Broaden Accessibility Focus: • High ROI media • Category leadership • Social/digital Increase Marketing 99% 47% 13% Total Veg BE Veg BE Voila! HH Penetration Source: IRI US Multi-Outlet data, based on IRI’s Pinnacle custom definitions, 2016 period ending 12/25/16.
Veg Market Share +4.7 pts since IPO |
 Better Center of Store
35 1% PF Center of Store Growth is worth ~$15 million in Net Sales 43% of consumers planning on eating less processed foods this year 61% of households are 1-2 persons, driving need for smaller servings size options Sources: Mintel Oxygen American Lifestyles 2014: Looking Forward; US Census Bureau. |
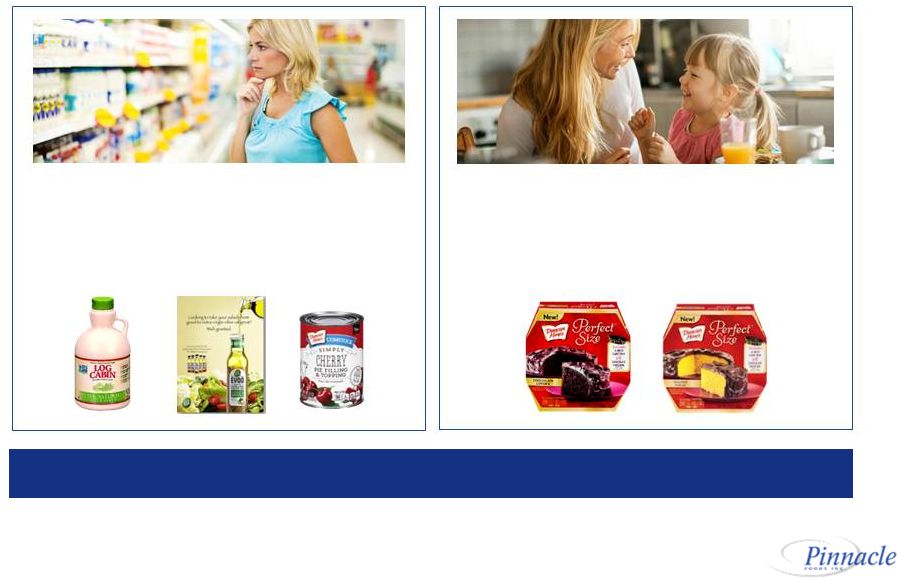
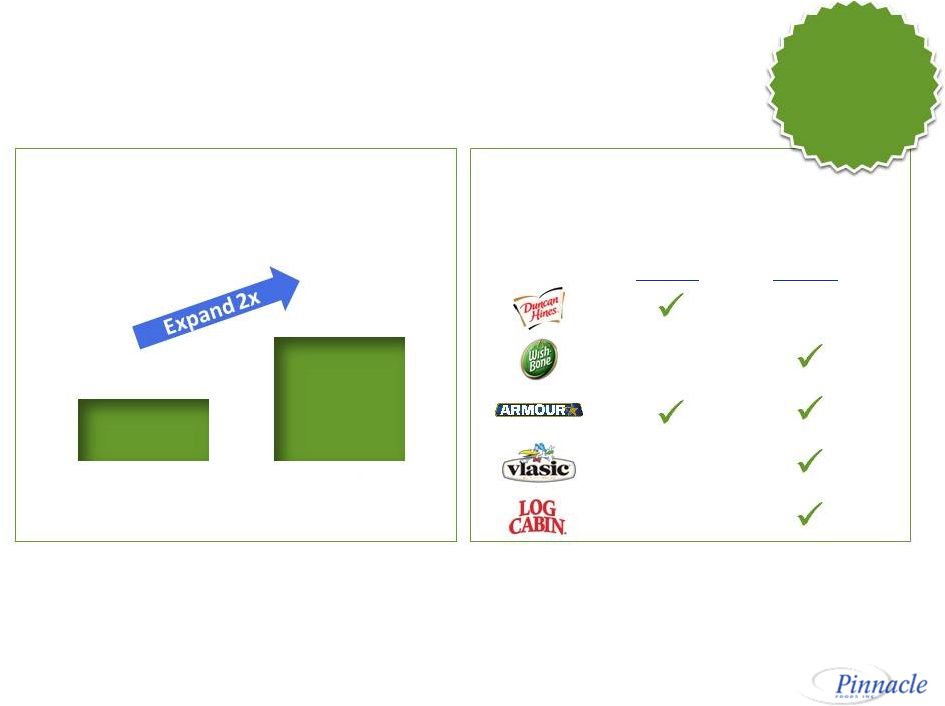 Better Center of Store Amplifier
Expand Clean Ingredients
• Reduction of negatives • Presence of positives • “Kitchen Logic” Focus: 2015 Target % of Sales from Clean Label ~15% ~30% Enhanced Consumer Experience • Small households • Single-serve and on-the-go • Higher quality ingredients Portion Control Better For You Add Relevance in Challenged Categories 36 |
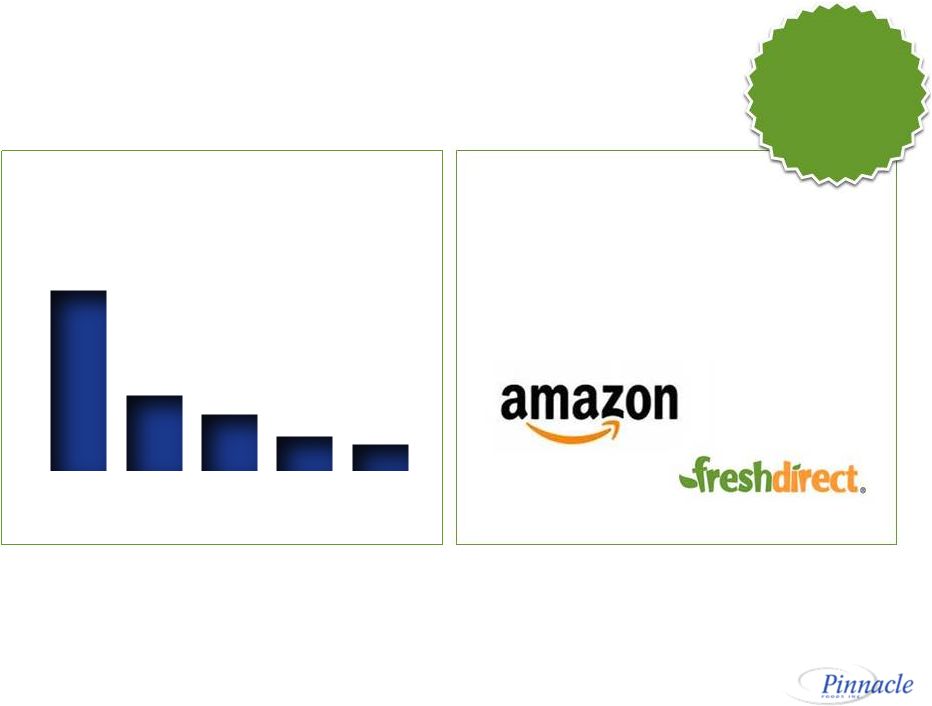 Enhanced Channel Coverage Amplifier
Drive Channel Growth
• Dedicated cross functional teams • Channel-specific SKUs • Improved margins Focus: 15.2% 6.3% 4.7% 2.9% 2.2% Online Club C-store Groc/ Mass/Drug Value Channel Growth 2012-2016 CAGR Expand Online Share • Team and portfolio build-out • Integrated supply chain plan • Frozen Vegetables growing ~20% Online share of the U.S.
grocery market is expected to double in
the next five years
Source: Kantar IQ; Package Facts: Brick Meets Clicks, A.T. Kearney
analysis. Channels
Growing Well Above Company Averages 37 |
 Amplifying the Playbook
Acquisition &
Integration Expertise Expand Margins & Cash Flow Accelerate Profitable Top-Line Growth 38 Strengthen Capabilities; Maintain Costs |
 Capabilities / Maintain Cost Amplifier
39 Optimize SG&A Peer Avg. Pinnacle ~12% 9% (% of Net Sales) SG&A Overhead • Deployment prioritized • Simplification and scale • Indirect cost reduction • Boulder synergy capture Strengthen Operational Capabilities • Enhanced planning • Supply chain focus • Best of both in PF and Boulder • Functional focus on marketing and sales Focus: Maintain SG&A Overhead at 9% |
 Amplifying the Playbook
Expand Margins & Cash Flow Accelerate Profitable Top-Line Growth Strengthen Capabilities; Maintain Costs 40 Increase M&A Potential |
 Increased M&A Potential Amplifiers
41 Playbook Validated North America focus Existing/adjacent categories Strong #1 or #2 Synergy-rich transaction Speed of integration >$750MM sales since IPO Integration Complete Boulder integration Leverage reduction Dedicated Corporate Development resource Prepared for Next M&A • Existing/related categories • Non-core with current owner • H&W credentials in consumer focus areas • Scale benefits in Boulder Health & Wellness Iconic Brands Expand Optionality Executing Transformative M&A Remains a Priority |
 • Transaction Overview • Pinnacle Overview • Pinnacle Business Update • Financial Update Agenda 42 |
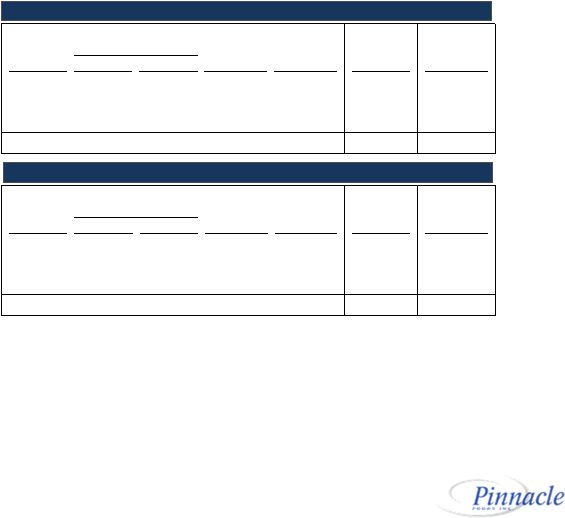
 Actual Vs. PY Estimate Vs. PY Net Sales $2,269 +17.4% $3,125 - $3,130 ~18% Adj. Diluted EPS (1) $1.36 +12.4% $2.14 - $2.15 ~12% Free Cash Flow (2) $163 +$37 $380 - $385 +$115 - $120 Strong 2016 Results $m, except EPS 43 9 Months Ended 9/25/16 Full-Year Ended 12/25/16 Note: All 2016 data is unaudited. (1) Adjusted Diluted EPS presented above is on a Non-GAAP basis. See reconciliation to GAAP financial measures in
Appendix. (2)
Free cash flow is the sum of cash flow from operating activities less capital
expenditures. See reconciliation to GAAP financial measures in Appendix. |
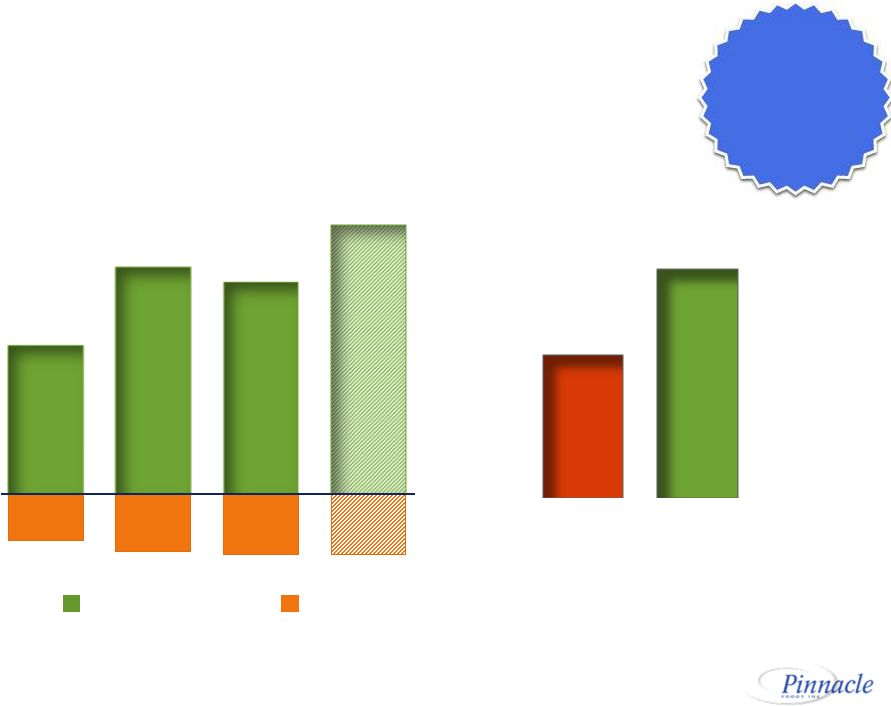
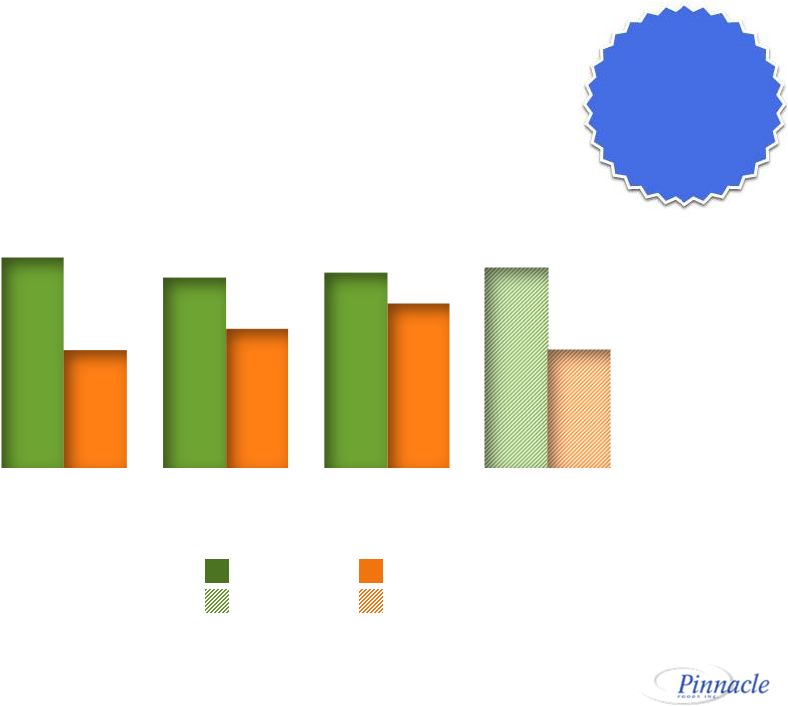 Note: 2016 includes Boulder Brands. Sustained Productivity Outpacing Inflation 44 Inflation Productivity 4.1% 3.7% 3.8% ~4.0% 2.3% 2.7% 3.2% ~2.3% 2013 2014 2015 2016E 2016E 2015 2014 2013 % of Cost of Goods Sold Productivity Averaged ~125 bps above Inflation since IPO |
 2013 2014 2015 2016E $84m $108m ~$100m - $102m $103m Disciplined Capital Expenditures Base Acquisition-related % of Net Sales 3.4% 4.0% 4.1% ~4%* * Includes capital leases. Note: 2016 base CAPEX includes Boulder. 45 Deferred ~$20m with Capital Leases |
 Continued Strong Cash Flow Generation
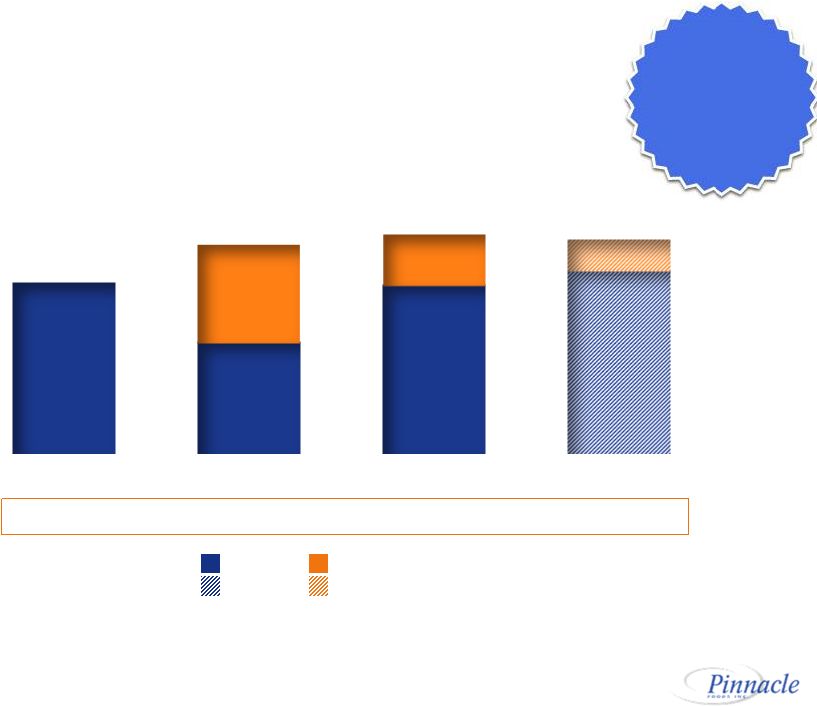
Peer Average Pinnacle FCF Yield ~4% ~6% Free Cash Flow (1) 2013 2014 2016E 2015 $178m $298m* $264m Operating Cash Flow CAPEX $380m – $385m Delivered >$1.1bn FCF since IPO * Excludes the benefit of $150 million Hillshire net termination fee. Note: FCF Yield based on industry analysts’ valuation analyses using prices as of 1/16/17 and Pinnacle analysis.
(1) Free cash flow is the sum of cash flow from operating activities less capital expenditures. See reconciliation to GAAP financial measures
in Appendix. 46 |
 Cash Amplifier Capital Expenditures Strategic Sustaining Value Generating Decomposition of CAPEX • ~4% of net sales • Birds Eye and Gardein focus • Leadership Brand distortion • Select IT investments Cash Conversion Cycle Low PF High Avg. Peer Days Benchmark Focus: • Integrated Business Planning • Vendor terms management • Inventory optimization ~$30m Additional Cash from 5-Day Cycle Reduction 47 |
 Note: Leverage ratio defined as Total Net Debt / Covenant Compliance EBITDA, as
per PF debt agreements and public filings. 7.6X
6.2X 4.5X 4.9X 3.8X 4.8X <4.25XX 3.7X Apr ‘07 Blackstone LBO Dec ‘09 Birds Eye Acquisition Mar ‘13 IPO Oct ‘13 Wish-Bone Acquisition Dec ‘15 Dec ‘15 Pro Forma for BDBD Acquisition Dec ‘17 Estimate IPO proceeds used to reduce debt Approximate 2-year path to 3.8X Target deleveraging post acquisition History of Deleveraging Post Acquisition Leverage Ratio Dec ‘16 Estimate 48 2016 Leverage Ratio < 4.25x Threshold! |
 Note: Operating Income and EPS presented above are on a Non-GAAP basis.
Accretive Acquisitions Accelerate Growth Beyond
Algorithm Adjusted Basis
Net Sales Operating Income EPS Dividend Yield LT Organic Growth Target 4 - 6% 7 - 9% ~2.5% In Line with or Above Categories 10 - 12% Long-Term Algorithm 49 2017 $2.43 - $2.48* Excludes 2017 adoption of new Accounting Standard for Stock-based Compensation, which will benefit ETR by ~125bps and EPS by ~$0.05. This impact will vary from year to year * Excludes fees and expenses related to the proposed refinancing |
 Amplifying the Playbook
50 Expand Margins & Cash Flow Accelerate Profitable Top-Line Growth Strengthen Capabilities; Maintain Costs Increase M&A Potential |
 Appendix Pinnacle Foods |
 ($ in millions) 9 Months Ending LTM Pinnacle Foods 2013 2014 2015 9/27/2015 9/25/2016 9/25/2016 GAAP Net Income $89.3 $248.4 $212.5 $133.3 $123.0 $202.2 Interest Expense, Net 132.2 96.1 88.3 66.0 103.5 125.8 Income Tax 71.5 167.8 123.9 76.8 79.9 127.0 Depreciation & Amortization 78.2 80.6 89.7 67.4 78.7 101.0 GAAP EBITDA $371.3 $592.9 $514.4 $343.5 $385.1 $555.9 Unrealized (Gains) Losses Resulting from Hedging Activities (0.7) 12.5 (2.0) (0.2) (9.2) (11.0) Adjustments Related to Application of Purchase Accounting 6.3 0.6 -- -- 10.4 10.4 Tradename Impairment Charges -- -- -- -- 11.2 11.2 Non-Cash Compensation Charges -- 27.2 1.6 1.6 -- -- Unrealized Foreign Exchange Losses -- 0.7 4.7 3.7 (1.0) 0.0 Acquisition or Other Non-Recurring Merger Costs 9.5 (144.5) 2.7 1.1 6.8 8.4 Restructuring, Integration, and Business Optimization Expenses 8.0 11.0 9.5 6.9 31.7 34.3 Employee Severance 4.7 3.5 0.7 0.2 -- 0.5 Management, Monitoring, Consulting and Advisory Fees 19.2 -- -- -- -- -- Other 34.2 0.2 -- -- -- -- Adjusted EBITDA $452.4 $504.0 $531.6 $356.8 $434.9 $582.2 Wish-Bone, Gardein Protein, and Boulder acquisition adjustments 54.7 25.3 60.5 37.9 24.1 46.8 Non-Cash Equity-Based Compensation 7.9 8.8 13.6 9.9 9.4 13.0 Covenant Compliance EBITDA per Credit Agreement Definition $515.0 $538.1 $605.7 $404.5 $468.4 $669.5 Non-cash (gains) / losses resulting from mark-to-market adjustments of obligations under derivative contracts Additional COPS to write-up to fair market value of inventories acquired through acquisitions Non-cash employee incentives and retention charges from termination of Hillshire merger agreement and equity-based compensation charges from liquidity event with associated with the reduction in December 2014 of Blackstone’s ownership to 16.5% Foreign exchange losses resulting from intra-entity loans anticipated to be settled in the foreseeable future Expenses related to secondary offerings of common stock and receipt of Hillshire merger termination fee. For the three- months ended March 27, 2016, represents integration costs of Boulder acquisition Integration costs of Gardein, Wish-Bone, and Boulder and gain from sales of Millsboro and Tacoma Facilities Severance costs paid or accrued to terminated employees 1 2 1 4 5 7 8 2 3 4 5 6 Management/advisory fees paid to an affiliate of Blackstone, including fees relating to the termination of the advisory agreement in connection with the IPO 9 Premium and fees paid for redemptions of notes and costs for the recall of Aunt Jemima product of $2.1 million 10 7 8 6 9 11 Pro Forma Net Cost Savings projected to be realized from the Gardein, Wish-Bone, and Boulder acquisitions 11 10 Represents tradename impairment on Celeste ($7.3 million), Aunt Jemima ($3.0 million), and Synder of Berlin ($0.9 million) 3 Reconciliation from GAAP to Adjusted Financial Measures 52 |
 Operating Diluted In millions, except per share Income Diluted Earnings Net Sales $ % Margin (EBIT) Net Earnings Shares Per Share Reported $2,656 $741 27.9% $425 $212 117.3 $1.81 Acquisition, merger and other restructuring charges (1) 10 0.3% 14 10 0.08 Other non-cash items (2) (1) 0.0% 4 3 0.03 Adjusted 2,656 750 28.2% 443 225 117.3 $1.92 Operating Diluted In millions, except per share Income Diluted Earnings Net Sales $ % Margin (EBIT) Net Earnings Shares Per Share Reported $2,591 $681 26.3% $512 $248 116.9 $2.13 Acquisition, merger and other restructuring charges (3) 12 0.4% (130) (79) (0.68) Other non-cash items (4) 18 0.7% 41 34 0.29 Adjusted 2,591 711 27.4% 423 203 116.9 $1.74 Operating Diluted In millions, except per share Income Diluted Earnings Net Sales $ % Margin (EBIT) Net Earnings Shares Per Share Reported $2,464 $654 26.5% $293 $89 108.6 $0.82 Acquisition, merger and other restructuring charges (5) 4 0.2% 22 14 0.13 Other non-cash items (4) 6 0.3% 6 3 0.03 Other adjustments (6) 53 55 0.51 Adjusted 2,464 664 27.0% 374 161 108.6 $1.49 IPO and Refinancing (7) 16 8.0 0.03 Pro Forma $2,464 $664 27.0% $374 $177 116.6 $1.52 Stock-based Compensation 1 1 8 6 0.05 Pro Forma Excluding Stock-based Compensation $665 $665 $382 $183 116.6 $1.57 Gross Profit Gross Profit Gross Profit Reconciliation from GAAP to Adjusted Financial Measures (1) Primarily includes: Plant integration and restructuring charges and expenses related to the Boulder acquisition.
(2) Primarily includes: Foreign exchange losses resulting from intra-entity loans, equity-based compensation exp. related to the
Hillshire agreement termination and mark-to-market losses.
(3) Primarily includes: Hillshire agreement termination fee (net of costs), restructuring charges including integration costs, employee
severance and non-recurring merger costs. (4)
Primarily includes: Equity-based compensation expense resulting from
liquidity event, fair value write-up of acquired inventories and mark-to-market gains/losses. (5) Primarily includes: Restructuring charges from plant consolidations, integration costs, non-recurring merger costs and employee
severance. (6)
Primarily includes: Bond redemption costs and management fee paid to
sponsor. (7)
Pro forma data reflects Adjusted Statement of Operations amounts assuming IPO
and 2013 Refinancing occurred on the first day of Fiscal 2013. Year
(52 Weeks) Ended December 29, 2013 Year (52 Weeks) Ended December
27, 2015 Year (52 Weeks) Ended December 28, 2014
53 |
 Operating Diluted In millions, except per share Income Diluted Earnings Net Sales $ % Margin (EBIT) Net Earnings Shares Per Share Reported $2,479 $585 23.6% $284 $53 86.5 $0.61 Acquisition, merger and other restructuring charges (1) 38 1.5% 45 28 0.32 Other non-cash items (2) (1) 0.0% Other adjustments (3) 1 0.0% 21 23 0.27 Adjusted 2,479 623 25.1% 350 104 86.5 $1.20 IPO (4) 30 30.9 (0.08) Public company costs (4) (3) (2) Pro Forma $2,479 $623 25.1% $347 $132 117.4 $1.12 Gross Profit (1) Primarily includes: Accelerated depreciation from plant consolidations, restructuring charges including integration costs and employee
severance. (2)
Primarily mark to market gains.
(3) Primarily includes: Bond redemption costs. (4) Pro forma data reflects Adjusted Statement of Operations amounts assuming IPO occurred on the first day of Fiscal 2012.
Year (53 Weeks) Ended December 30, 2012
Reconciliation from GAAP to Adjusted Financial Measures
54 |
 First Nine Months (39 Weeks) Ended September 25, 2016
(1) Primarily includes: Restructuring charges, acquisition integration costs and acquisition-related expenses.
(2) Represents expenses related to the write-up to fair value of inventories acquired as a result of the Boulder acquisition,
mark-to-market gains, and unrealized foreign exchange
losses resulting from intra-entity loans. (3)
Represents mark-to-market gains, unrealized foreign exchange losses
resulting from intra-entity loans and employee stock compensation expense related to the terminated Hillshire merger agreement. First Nine Months (39 Weeks) Ended September 27, 2015 Reconciliation from GAAP to Adjusted Financial Measures 55 Operating Diluted In millions, except per share Income Diluted Earnings Net Sales $ % Margin (EBIT) Net Earnings Shares Per Share Reported $2,269 $648 28.6% $306 $123 117.9 $1.04 Acquisition, merger and other restructuring charges (1) 4 0.2% 39 29 0.25 Other non-cash items (2) 1 0.0% 11 8 0.07 Adjusted $2,269 $653 28.8% $356 $160 117.9 $1.36 Operating Diluted In millions, except per share Income Diluted Earnings Net Sales $ % Margin (EBIT) Net Earnings Shares Per Share Reported $1,933 $518 26.8% $276 $133 117.3 $1.13 Acquisition, merger and other restructuring charges (1) 7 0.4% 9 6 0.05 Other non-cash items (3) 1 0.1% 5 3 0.03 Adjusted $1,933 $526 27.2% $290 $142 117.3 $1.21 Gross Profit Gross Profit |
 Reconciliation from GAAP to Adjusted Financial Measures
56 ($ in millions) 9 Months Ending LTM Expected Pinnacle Foods 2013 2014 2015 9/27/2015 9/25/2016 9/25/2016 2016E Net Cash Provided by Operating Activities $262.2 $550.7 $372.9 $210.8 $239.9 $402.0 ~$480 - $485 Capital Expenditures (84.1) (103.0) (108.5) (84.7) (76.6) (100.4) ~(100) - (102) Free Cash Flow $178.2 $447.7 $264.4 $126.1 $163.3 $301.7 ~$380 - 385 |