Attached files
| file | filename |
|---|---|
| 8-K - FORM 8-K - SUPERIOR INDUSTRIES INTERNATIONAL INC | d321525d8k.htm |
Superior Industries 2017 Global Auto Industry Conference January 11, 2017 Exhibit 99.1
Forward-Looking Statements This webcast and presentation contain statements that are forward-looking statements within the meaning of the Private Securities Litigation Reform Act of 1995. Forward-looking statements include all statements that do not relate solely to historical or current facts and can generally be identified by the use of future dates or words such as "may," "should," "could," “will,” "expects," "seeks to," "anticipates," "plans," "believes," "estimates," "intends," "predicts," "projects," "potential" or "continue" or the negative of such terms and other comparable terminology. These statements also include, but are not limited to, the 2016 and 2017 outlook included herein, and the Company’s strategic and operational initiatives, including the resolution of operating inefficiencies, product mix and overall cost improvement and are based on current expectations, estimates, and projections about the Company's business based, in part, on assumptions made by management. These statements are not guarantees of future performance and involve risks, uncertainties and assumptions that are difficult to predict. Therefore, actual outcomes and results may differ materially from what is expressed or forecasted in such forward-looking statements due to numerous factors, risks, and uncertainties discussed in the Company's Securities and Exchange Commission filings and reports, including the Company's Annual Report on Form 10-K for the year-ended December 27, 2015, Quarterly Reports on Form 10-Q and other reports from time to time filed with the Securities and Exchange Commission. You are cautioned not to unduly rely on such forward looking statements when evaluating the information presented in this press release. Such forward-looking statements speak only as of the date on which they are made and the Company does not undertake any obligation to update any forward-looking statement to reflect events or circumstances after the date of this webcast and presentation. Use of Non-GAAP Financial Measures In addition to the results reported in accordance with GAAP included throughout this presentation, this presentation refers to “Adjusted EBITDA,” which we have defined as earnings before interest, taxes, depreciation, amortization, restructuring charges and impairments of long-lived assets and investments and “Value-Added Sales,” which we define as net sales less pass-through charges primarily for the value of aluminum. Adjusted EBITDA as a percentage of value-added sales is a key measure that is not calculated according to GAAP. Adjusted EBITDA as a percentage of value-added sales is defined as adjusted EBITDA divided by value-added sales. Management believes the non-GAAP financial measures used in this presentation are useful to both management and investors in their analysis of the Company’s financial position and results of operations. Further, management uses these non-GAAP financial measures for planning and forecasting future periods. This non-GAAP financial information is provided as additional information for investors and is not in accordance with or an alternative to GAAP. These non-GAAP measures may be different from similar measures used by other companies. For reconciliations of these non-GAAP financial measures to the most directly comparable financial measures calculated and presented in accordance with GAAP, see the appendix of this presentation. In reliance on the safe harbor provided under section 10(e) or Regulation S-K, we have not quantitatively reconciled differences between adjusted EBITDA presented in our 2016 and 2017 Outlook to net income, the most comparable GAAP measure, as Superior is unable to quantify certain amounts that would be required to be included in net income without unreasonable efforts and due to the inherent uncertainty regarding such variables. Superior also believes that such a reconciliation would imply a degree of precision that could potentially be confusing or misleading to investors. However, the magnitude of these amounts may be significant. Non-GAAP Financial Measures and Forward-Looking Statements
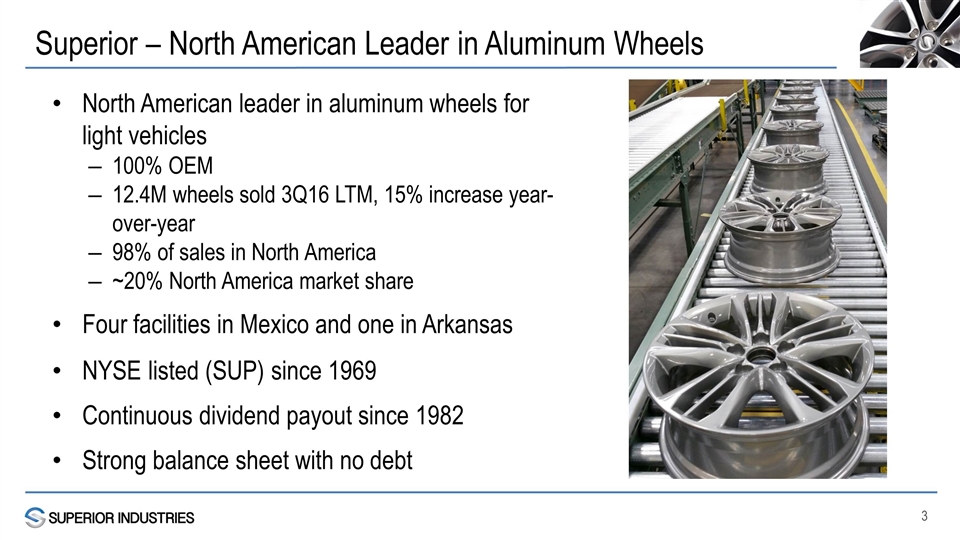
Superior – North American Leader in Aluminum Wheels North American leader in aluminum wheels for light vehicles 100% OEM 12.4M wheels sold 3Q16 LTM, 15% increase year-over-year 98% of sales in North America ~20% North America market share Four facilities in Mexico and one in Arkansas NYSE listed (SUP) since 1969 Continuous dividend payout since 1982 Strong balance sheet with no debt
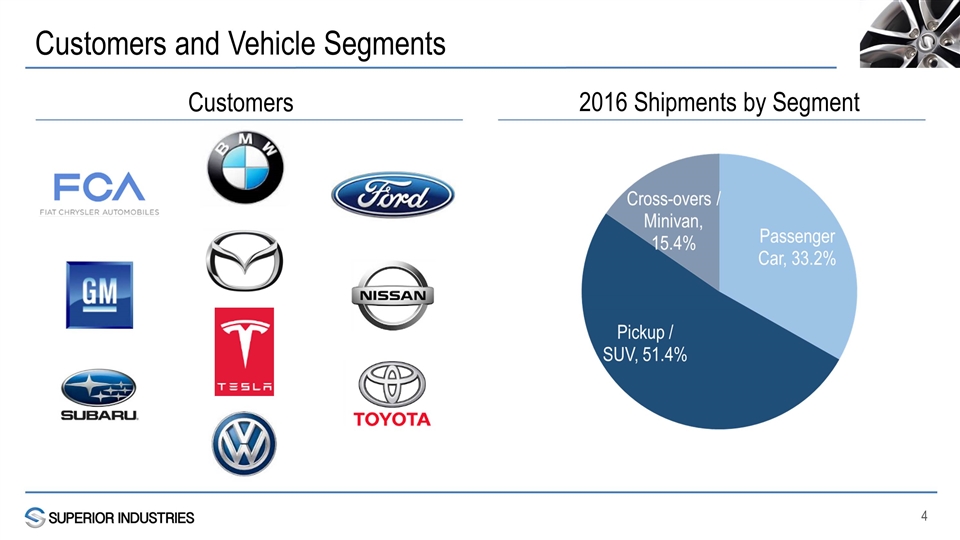
Customers and Vehicle Segments Customers 2016 Shipments by Segment
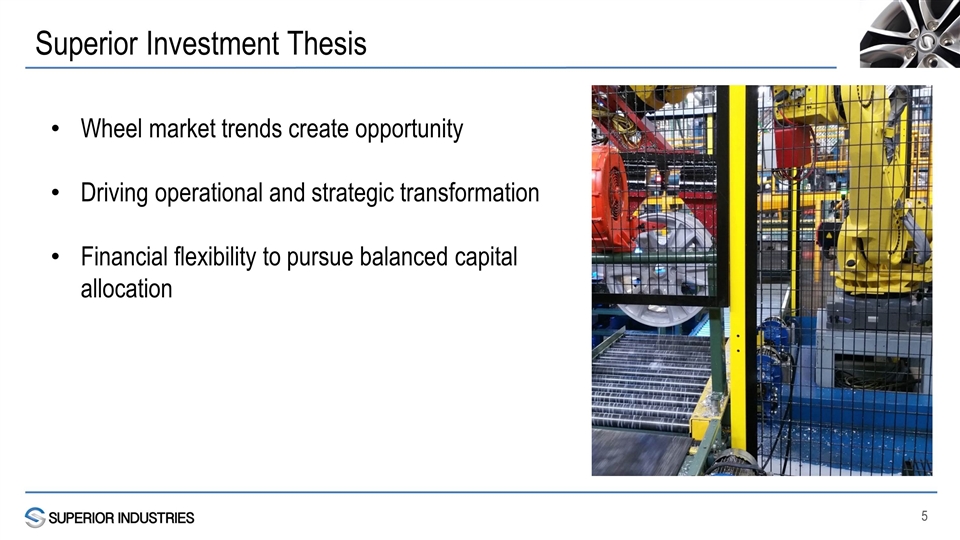
Superior Investment Thesis Wheel market trends create opportunity Driving operational and strategic transformation Financial flexibility to pursue balanced capital allocation
Wheel Market Trends – Wheels Provide Differentiation Consumers increasingly seeking customization, wheels offer key aesthetic differentiator Aftermarket-like styling relevant to OEMs at OEM production levels and standards Wheel options per platform increasing, allowing customers to segment market Lightweighting relevant to achieve fuel efficiency requirements Wheel design can provide improved vehicle handling and comfort
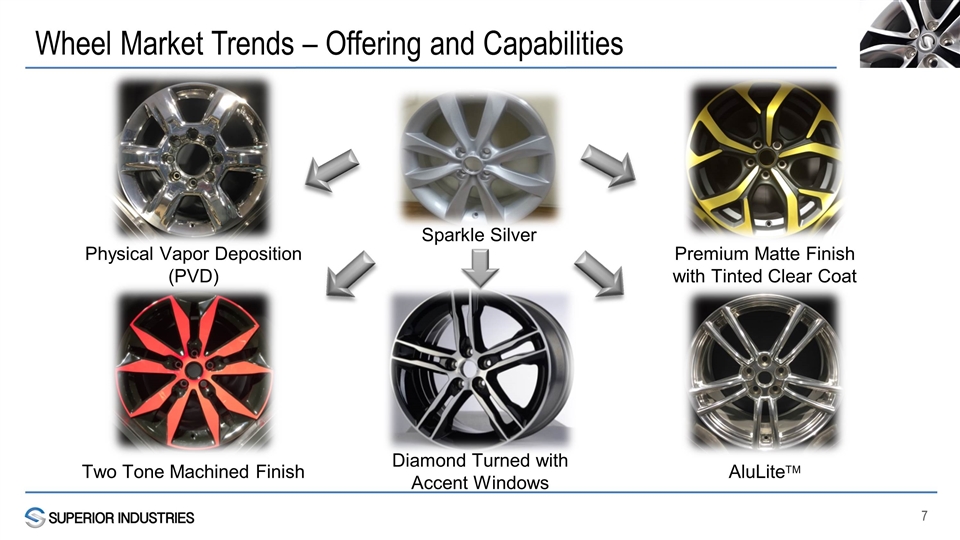
Wheel Market Trends – Offering and Capabilities Sparkle Silver Physical Vapor Deposition (PVD) Premium Matte Finish with Tinted Clear Coat Two Tone Machined Finish AluLiteTM Diamond Turned with Accent Windows
Operational and Strategic Transformation Six of nine board members joined Board since December 2013 New executive management team with 130 years combined auto experience Opened new manufacturing facility in Mexico in 2015 Relocated headquarters to Michigan Opened shared services facility in Mexico Completed tax restructuring Broadening product portfolio to provide next generation and premium products Investing in finishing capabilities Implementing initiatives to improve efficiency Continuing to strengthen team Completed Ongoing
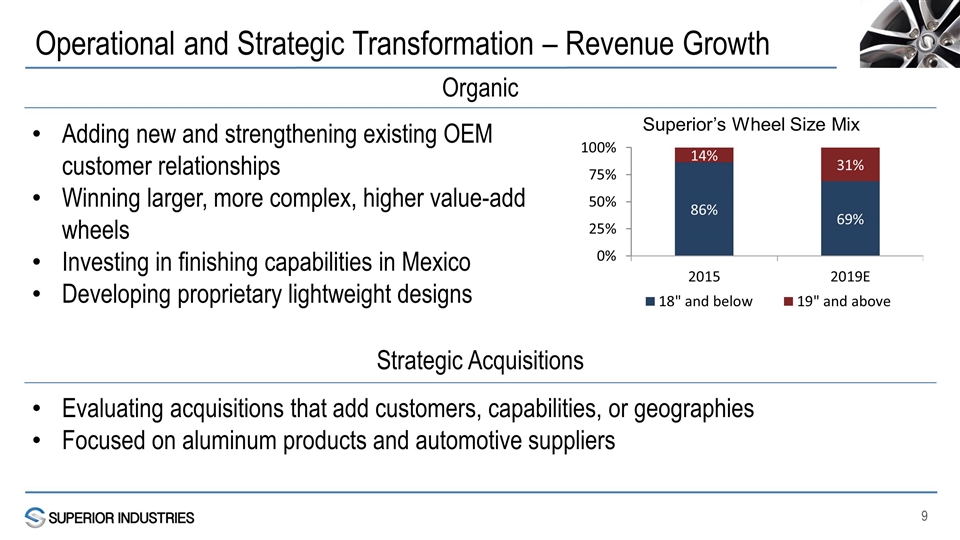
Operational and Strategic Transformation – Revenue Growth Adding new and strengthening existing OEM customer relationships Winning larger, more complex, higher value-add wheels Investing in finishing capabilities in Mexico Developing proprietary lightweight designs Evaluating acquisitions that add customers, capabilities, or geographies Focused on aluminum products and automotive suppliers Organic Strategic Acquisitions
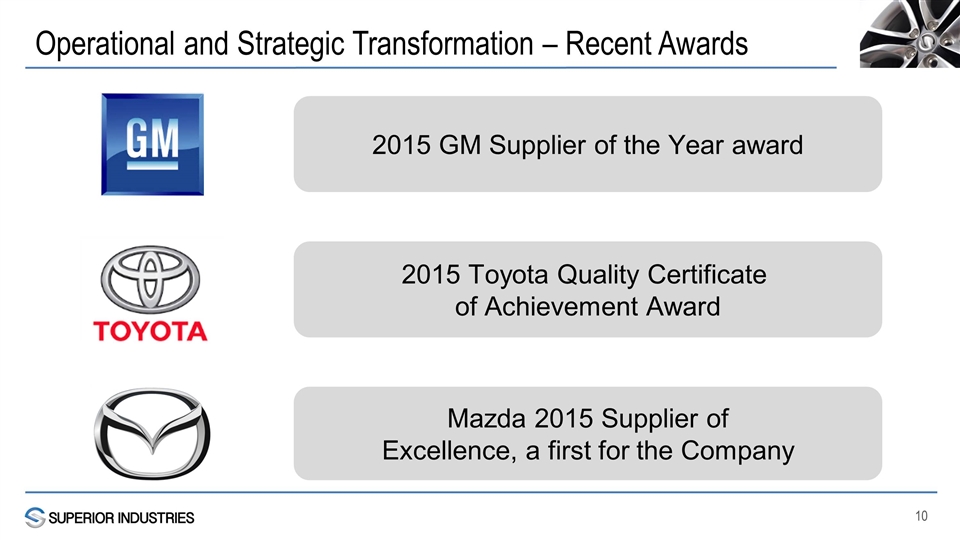
Operational and Strategic Transformation – Recent Awards 2015 GM Supplier of the Year award 2015 Toyota Quality Certificate of Achievement Award Mazda 2015 Supplier of Excellence, a first for the Company
Clean balance sheet with no debt Strong track record of both dividends and share repurchase Returned more than $155M to shareholders over the last 5 years Cash dividend since 1982 – currently approximately $18M annually $50M stock repurchase program approved in January 2016; $46.7M remaining (as of Q3 2016) Financial capacity to strategically pursue M&A prospects, JVs, and business alliances Financial Stability and Balanced Approach to Capital Allocation
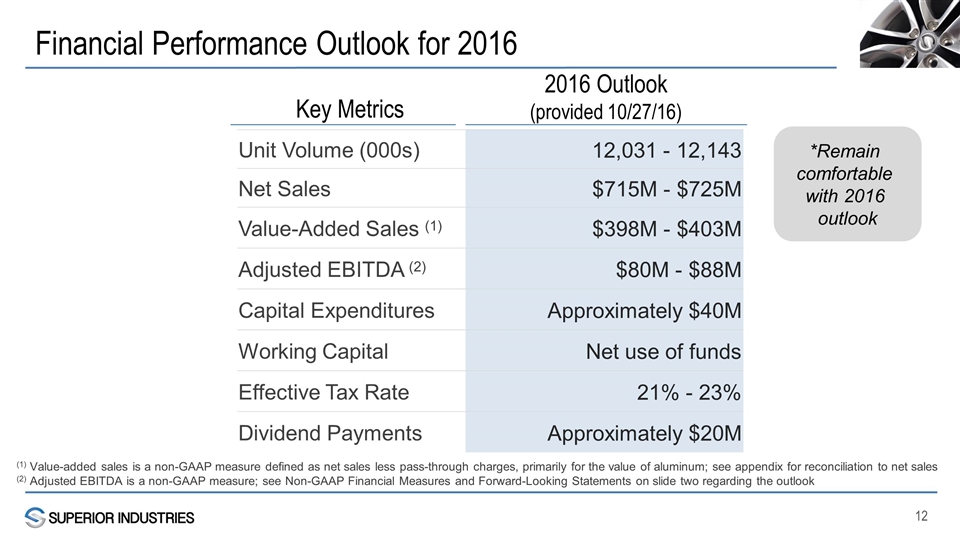
Financial Performance Outlook for 2016 Unit Volume (000s) 12,031 - 12,143 Net Sales $715M - $725M Value-Added Sales (1) $398M - $403M Adjusted EBITDA (2) $80M - $88M Capital Expenditures Approximately $40M Working Capital Net use of funds Effective Tax Rate 21% - 23% Dividend Payments Approximately $20M 2016 Outlook (provided 10/27/16) *Remain comfortable with 2016 outlook (1) Value-added sales is a non-GAAP measure defined as net sales less pass-through charges, primarily for the value of aluminum; see appendix for reconciliation to net sales (2) Adjusted EBITDA is a non-GAAP measure; see Non-GAAP Financial Measures and Forward-Looking Statements on slide two regarding the outlook Key Metrics
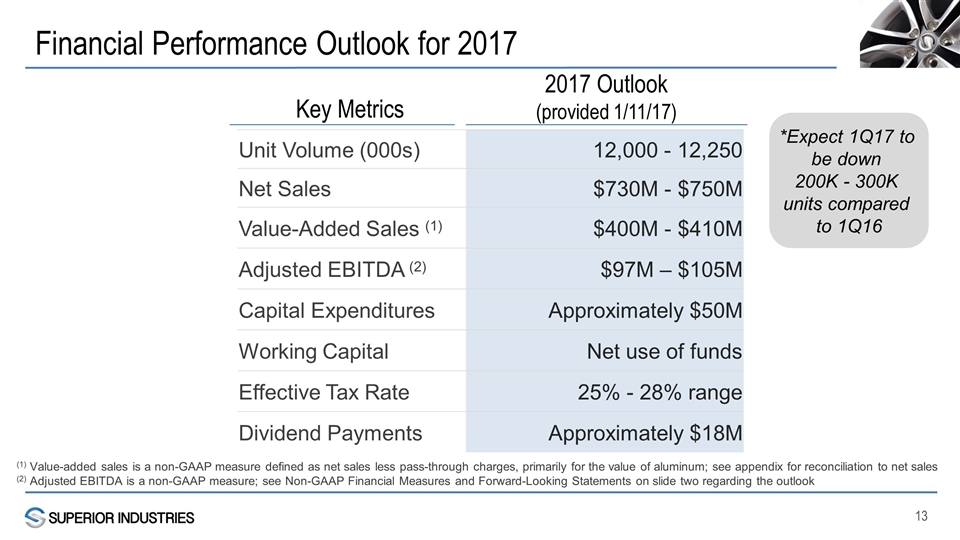
Financial Performance Outlook for 2017 Unit Volume (000s) 12,000 - 12,250 Net Sales $730M - $750M Value-Added Sales (1) $400M - $410M Adjusted EBITDA (2) $97M – $105M Capital Expenditures Approximately $50M Working Capital Net use of funds Effective Tax Rate 25% - 28% range Dividend Payments Approximately $18M Key Metrics 2017 Outlook (provided 1/11/17) *Expect 1Q17 to be down 200K - 300K units compared to 1Q16 (1) Value-added sales is a non-GAAP measure defined as net sales less pass-through charges, primarily for the value of aluminum; see appendix for reconciliation to net sales (2) Adjusted EBITDA is a non-GAAP measure; see Non-GAAP Financial Measures and Forward-Looking Statements on slide two regarding the outlook
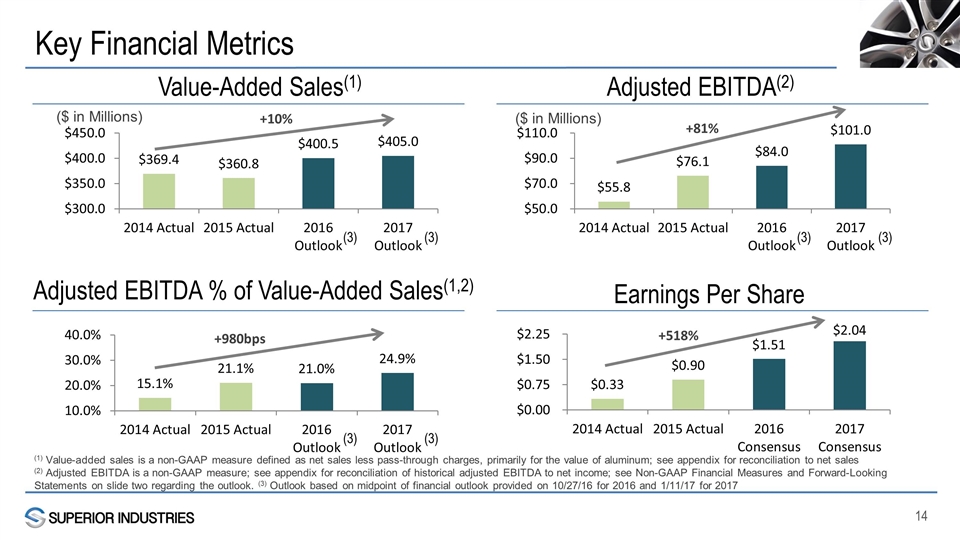
Key Financial Metrics Earnings Per Share ($ in Millions) +81% +518% Value-Added Sales(1) ($ in Millions) +10% +980bps Adjusted EBITDA % of Value-Added Sales(1,2) Adjusted EBITDA(2) (1) Value-added sales is a non-GAAP measure defined as net sales less pass-through charges, primarily for the value of aluminum; see appendix for reconciliation to net sales (2) Adjusted EBITDA is a non-GAAP measure; see appendix for reconciliation of historical adjusted EBITDA to net income; see Non-GAAP Financial Measures and Forward-Looking Statements on slide two regarding the outlook. (3) Outlook based on midpoint of financial outlook provided on 10/27/16 for 2016 and 1/11/17 for 2017 (3) (3) (3) (3) (3) (3)
Appendix
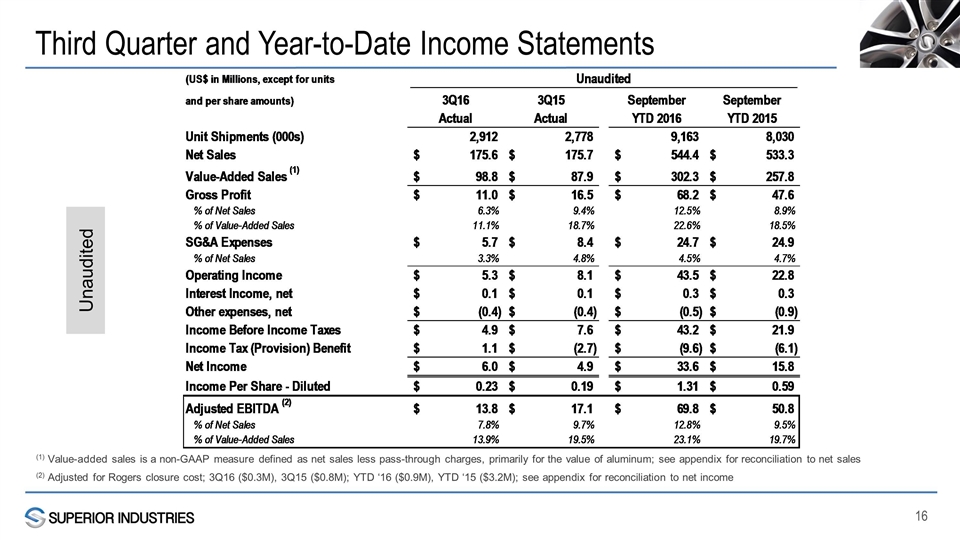
Third Quarter and Year-to-Date Income Statements (1) Value-added sales is a non-GAAP measure defined as net sales less pass-through charges, primarily for the value of aluminum; see appendix for reconciliation to net sales (2) Adjusted for Rogers closure cost; 3Q16 ($0.3M), 3Q15 ($0.8M); YTD ‘16 ($0.9M), YTD ‘15 ($3.2M); see appendix for reconciliation to net income Unaudited
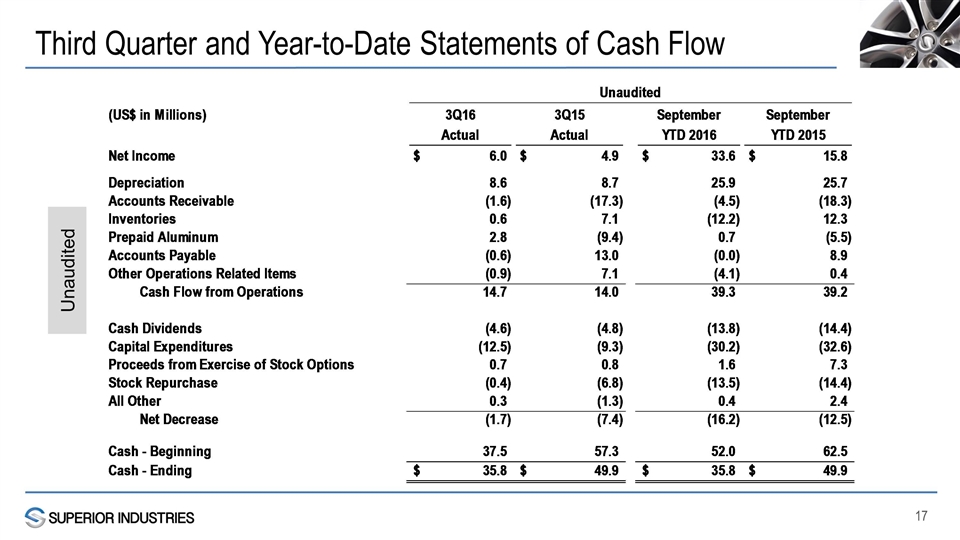
Third Quarter and Year-to-Date Statements of Cash Flow Unaudited
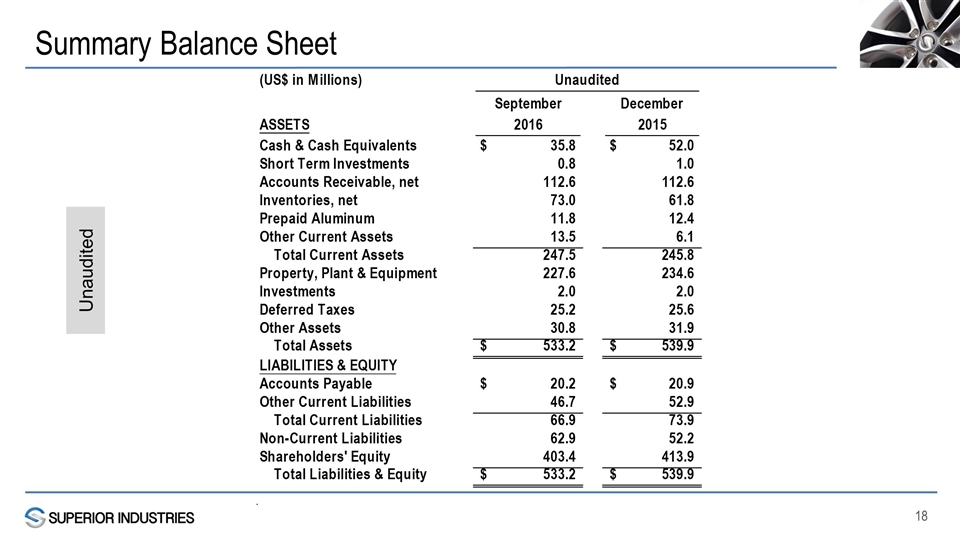
Summary Balance Sheet Unaudited
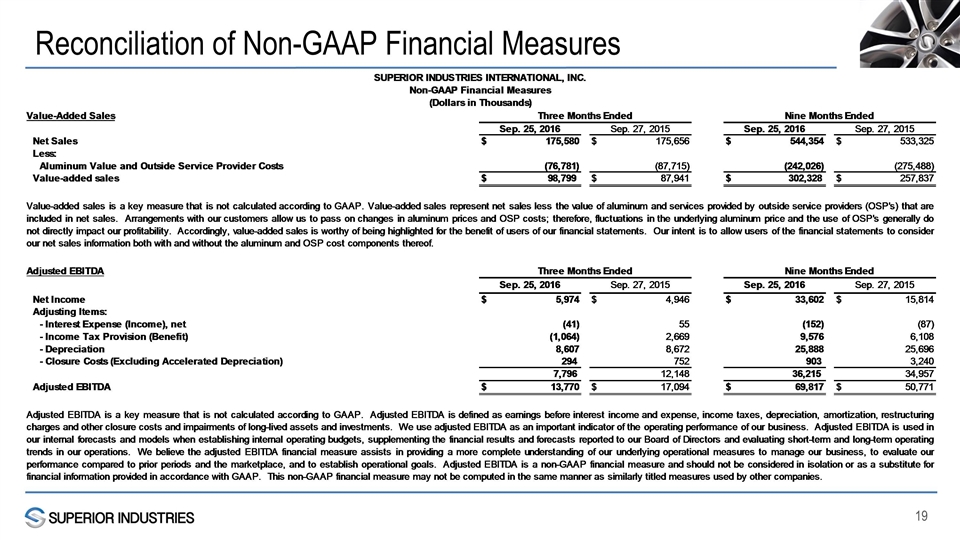
Reconciliation of Non-GAAP Financial Measures
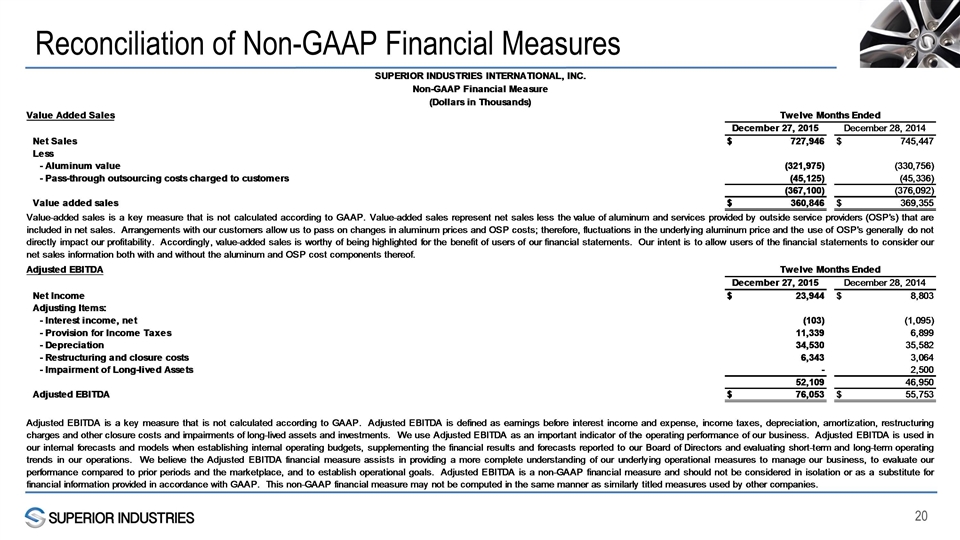
Reconciliation of Non-GAAP Financial Measures
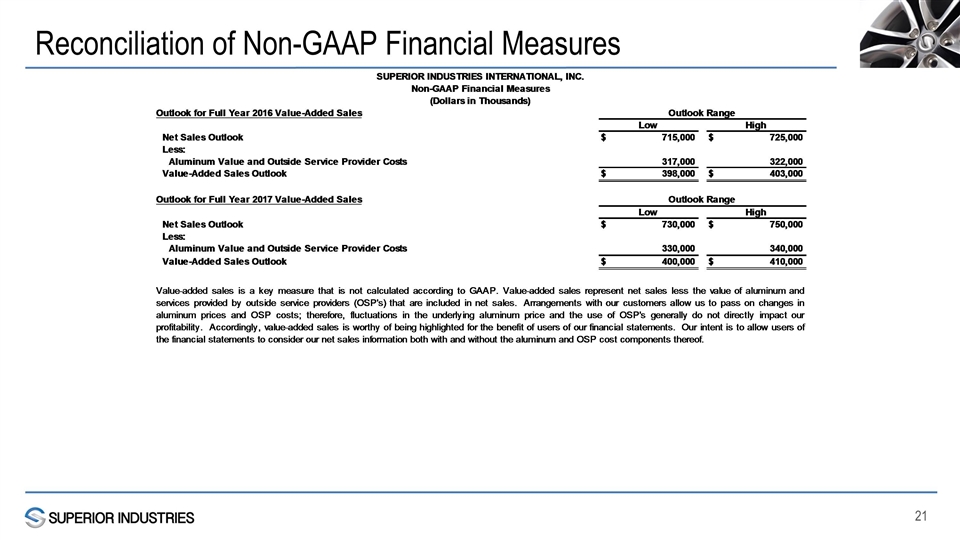
Reconciliation of Non-GAAP Financial Measures
