Attached files
| file | filename |
|---|---|
| EX-32.1 - EXHIBIT 32.1 - SUPERIOR INDUSTRIES INTERNATIONAL INC | ex3213262017.htm |
| EX-31.2 - EXHIBIT 31.2 - SUPERIOR INDUSTRIES INTERNATIONAL INC | ex3123262017.htm |
| EX-31.1 - EXHIBIT 31.1 - SUPERIOR INDUSTRIES INTERNATIONAL INC | ex3113262017.htm |
UNITED STATES SECURITIES AND EXCHANGE COMMISSION
WASHINGTON, D.C. 20549
FORM 10-Q
þ | QUARTERLY REPORT PURSUANT TO SECTION 13 OR 15(d) OF THE SECURITIES EXCHANGE ACT OF 1934 |
For the quarterly period ended March 26, 2017
o | TRANSITION REPORT PURSUANT TO SECTION 13 OR 15(d) OF THE SECURITIES EXCHANGE ACT OF 1934 |
For the transition period from ____________ to ____________.
Commission file number: 1-6615
SUPERIOR INDUSTRIES INTERNATIONAL, INC.
(Exact Name of Registrant as Specified in Its Charter)
Delaware | 95-2594729 | |
(State or Other Jurisdiction of Incorporation or Organization) | (I.R.S. Employer Identification No.) | |
26600 Telegraph Road, Suite 400 | ||
Southfield, Michigan | 48033 | |
(Address of Principal Executive Offices) | (Zip Code) | |
Registrant’s Telephone Number, Including Area Code: (248) 352-7300
Indicate by check mark whether the registrant: (1) has filed all reports required to be filed by Section 13 or 15(d) of the Securities Exchange Act of 1934 during the preceding 12 months (or for such shorter period that the registrant was required to file such reports), and (2) has been subject to such filing requirements for the past 90 days.
Yes þ No o
Indicate by check mark whether the registrant has submitted electronically and posted on its corporate Web site, if any, every Interactive Data File required to be submitted and posted pursuant to Rule 405 of Regulation S-T (§232.405 of this chapter) during the preceding 12 months (or for such shorter period that the registrant was required to submit and post such files).
Yes þ No o
Indicate by check mark whether the registrant is a large accelerated filer, an accelerated filer, a non-accelerated filer, a smaller reporting company, or an emerging growth company. See the definitions of “large accelerated filer,” “accelerated filer,” “smaller reporting company” and "emerging growth company" in Rule 12b-2 of the Exchange Act.
Large Accelerated Filer o Accelerated Filer þ Non-Accelerated Filer o Smaller Reporting Company o
Emerging Growth Company o
If an emerging growth company, indicate by check mark if the registrant has elected not to use the extended transition period for complying with any new or revised financial accounting standards provided pursuant to Section 13(a) of the Exchange Act. o
Indicate by check mark whether the registrant is a shell company (as defined in Rule 12b-2 of the Exchange Act).
Yes o No þ
Number of shares of common stock outstanding as of April 26, 2017: 24,907,016
TABLE OF CONTENTS | ||||||
Page | ||||||
PART I | - | FINANCIAL INFORMATION | ||||
Item 1 | - | |||||
Condensed Consolidated Statements of Operations | ||||||
Item 2 | - | |||||
Item 3 | - | |||||
Item 4 | - | |||||
PART II | - | OTHER INFORMATION | ||||
Item 1 | - | |||||
Item 1A | - | |||||
Item 2 | - | |||||
Item 6 | - | |||||
PART I
FINANCIAL INFORMATION
Item 1. Financial Statements
Superior Industries International, Inc.
Condensed Consolidated Statements of Operations
(Dollars in thousands, except per share data)
(Unaudited)
Thirteen Weeks Ended | ||||||||
March 26, 2017 | March 27, 2016 | |||||||
NET SALES | $ | 174,220 | $ | 186,065 | ||||
Cost of sales: | ||||||||
Cost of sales | 154,808 | 158,320 | ||||||
Restructuring costs (Note 3) | 208 | 30 | ||||||
155,016 | 158,350 | |||||||
GROSS PROFIT | 19,204 | 27,715 | ||||||
Selling, general and administrative expenses | 15,260 | 8,993 | ||||||
INCOME FROM OPERATIONS | 3,944 | 18,722 | ||||||
Interest (expense) income, net | (296 | ) | 32 | |||||
Other (expense) income, net | (348 | ) | 268 | |||||
INCOME BEFORE INCOME TAXES | 3,300 | 19,022 | ||||||
Income tax provision | (198 | ) | (4,558 | ) | ||||
NET INCOME | $ | 3,102 | $ | 14,464 | ||||
EARNINGS PER SHARE - BASIC | $ | 0.12 | $ | 0.56 | ||||
EARNINGS PER SHARE - DILUTED | $ | 0.12 | $ | 0.56 | ||||
DIVIDENDS DECLARED PER SHARE | $ | 0.18 | $ | 0.18 | ||||
The accompanying unaudited notes are an integral part of these condensed consolidated financial statements.
1
Superior Industries International, Inc.
Condensed Consolidated Statements of Comprehensive Income
(Dollars in thousands)
(Unaudited)
Thirteen Weeks Ended | |||||||
March 26, 2017 | March 27, 2016 | ||||||
Net income | $ | 3,102 | $ | 14,464 | |||
Other comprehensive income (loss), net of tax: | |||||||
Foreign currency translation gain (loss), net of tax | 9,050 | (1,845 | ) | ||||
Change in unrecognized losses on derivative instruments: | |||||||
Change in fair value of derivatives | 17,394 | 1,318 | |||||
Tax provision | (335 | ) | (266 | ) | |||
Change in unrecognized losses on derivative instruments, net of tax | 17,059 | 1,052 | |||||
Defined benefit pension plan: | |||||||
Actuarial gains on pension obligation, net of curtailments and amortization | 92 | 84 | |||||
Tax provision | (24 | ) | (33 | ) | |||
Pension changes, net of tax | 68 | 51 | |||||
Other comprehensive income (loss), net of tax | 26,177 | (742 | ) | ||||
Comprehensive income | $ | 29,279 | $ | 13,722 | |||
The accompanying unaudited notes are an integral part of these condensed consolidated financial statements.
2
Superior Industries International, Inc.
Condensed Consolidated Balance Sheets
(Dollars in thousands)
(Unaudited)
March 26, 2017 | December 31, 2016 | ||||||
ASSETS | |||||||
Current assets: | |||||||
Cash and cash equivalents | $ | 28,828 | $ | 57,786 | |||
Short-term investments | 750 | 750 | |||||
Accounts receivable, net | 108,530 | 99,331 | |||||
Inventories | 101,428 | 82,837 | |||||
Income taxes receivable | 2,918 | 3,682 | |||||
Other current assets | 12,718 | 9,695 | |||||
Total current assets | 255,172 | 254,081 | |||||
Property, plant and equipment, net | 243,079 | 227,403 | |||||
Investment in unconsolidated affiliate | 2,000 | 2,000 | |||||
Non-current deferred income tax assets, net | 30,875 | 28,838 | |||||
Other non-current assets | 32,230 | 30,434 | |||||
Total assets | $ | 563,356 | $ | 542,756 | |||
LIABILITIES AND SHAREHOLDERS' EQUITY | |||||||
Current liabilities: | |||||||
Accounts payable | $ | 42,851 | $ | 37,856 | |||
Accrued expenses | 52,885 | 46,315 | |||||
Income taxes payable | 280 | 1,793 | |||||
Total current liabilities | 96,016 | 85,964 | |||||
Non-current income tax liabilities | 5,816 | 5,301 | |||||
Non-current deferred income tax liabilities, net | 3,976 | 3,628 | |||||
Other non-current liabilities | 39,149 | 49,637 | |||||
Commitments and contingencies (Note 15) | — | — | |||||
Shareholders' equity: | |||||||
Preferred stock, $0.01 par value | |||||||
Authorized - 1,000,000 shares | |||||||
Issued - none | — | — | |||||
Common stock, $0.01 par value | |||||||
Authorized - 100,000,000 shares | |||||||
Issued and outstanding - 24,908,471 shares | |||||||
(25,143,950 shares at December 25, 2016) | 89,469 | 89,916 | |||||
Accumulated other comprehensive loss | (98,748 | ) | (124,925 | ) | |||
Retained earnings | 427,678 | 433,235 | |||||
Total shareholders' equity | 418,399 | 398,226 | |||||
Total liabilities and shareholders' equity | $ | 563,356 | $ | 542,756 | |||
The accompanying unaudited notes are an integral part of these condensed consolidated financial statements.
3
Superior Industries International, Inc.
Condensed Consolidated Statements of Cash Flows
(Dollars in thousands)
(Unaudited)
Thirteen Weeks Ended | |||||||
March 26, 2017 | March 27, 2016 | ||||||
NET CASH (USED IN) PROVIDED BY OPERATING ACTIVITIES | $ | (1,577 | ) | $ | 16,041 | ||
CASH FLOWS FROM INVESTING ACTIVITIES: | |||||||
Additions to property, plant and equipment | (16,823 | ) | (6,110 | ) | |||
Proceeds from sales and maturities of investments | — | 200 | |||||
Proceeds from sale of property, plant and equipment | 2 | 1 | |||||
NET CASH USED IN INVESTING ACTIVITIES | (16,821 | ) | (5,909 | ) | |||
CASH FLOWS FROM FINANCING ACTIVITIES: | |||||||
Cash dividends paid | (4,511 | ) | (4,676 | ) | |||
Cash paid for common stock repurchase | (5,014 | ) | (11,928 | ) | |||
Payments related to tax withholdings for stock-based compensation | (955 | ) | — | ||||
Proceeds from exercise of stock options | — | 179 | |||||
NET CASH USED IN FINANCING ACTIVITIES | (10,480 | ) | (16,425 | ) | |||
Effect of exchange rate changes on cash | (80 | ) | (219 | ) | |||
Net decrease in cash and cash equivalents | (28,958 | ) | (6,512 | ) | |||
Cash and cash equivalents at the beginning of the period | 57,786 | 52,036 | |||||
Cash and cash equivalents at the end of the period | $ | 28,828 | $ | 45,524 | |||
The accompanying unaudited notes are an integral part of these condensed consolidated financial statements.
4
Superior Industries International, Inc.
Condensed Consolidated Statement of Shareholders’ Equity
(Dollars in thousands, except share and per share data)
(Unaudited)
Common Stock | Accumulated Other Comprehensive (Loss) Income | |||||||||||||||||||||||||
Number of Shares | Amount | Unrecognized Gains (Losses) on Derivative Instruments | Pension Obligations | Cumulative Translation Adjustment | Retained Earnings | Total | ||||||||||||||||||||
Balance at December 31, 2016 | 25,143,950 | $ | 89,916 | $ | (16,101 | ) | $ | (3,636 | ) | $ | (105,188 | ) | $ | 433,235 | $ | 398,226 | ||||||||||
Net income | 3,102 | 3,102 | ||||||||||||||||||||||||
Change in unrecognized gains (losses) on derivative instruments, net of tax | 17,059 | — | — | — | 17,059 | |||||||||||||||||||||
Change in employee benefit plans, net of taxes | 68 | — | — | 68 | ||||||||||||||||||||||
Net foreign currency translation adjustment | — | 9,050 | — | 9,050 | ||||||||||||||||||||||
Stock options exercised | — | — | — | — | — | — | ||||||||||||||||||||
Restricted stock awards granted, net of forfeitures | 13,063 | — | — | — | — | — | ||||||||||||||||||||
Stock-based compensation expense | (32,701 | ) | 330 | — | — | — | 330 | |||||||||||||||||||
Common stock repurchased | (215,841 | ) | (777 | ) | — | — | (4,237 | ) | (5,014 | ) | ||||||||||||||||
Cash dividends declared ($0.18 per share) | — | — | — | — | (4,422 | ) | (4,422 | ) | ||||||||||||||||||
Balance at March 26, 2017 | 24,908,471 | $ | 89,469 | $ | 958 | $ | (3,568 | ) | $ | (96,138 | ) | $ | 427,678 | $ | 418,399 | |||||||||||
The accompanying unaudited notes are an integral part of these condensed consolidated financial statements.
5
Superior Industries International, Inc.
Notes to Condensed Consolidated Financial Statements
March 26, 2017
(Unaudited)
Note 1 – Nature of Operations
Headquartered in Southfield, Michigan, the principal business of Superior Industries International, Inc. (referred to herein as the “company” or “we,” “us” and “our”) is the design and manufacture of aluminum wheels for sale to original equipment manufacturers ("OEMs"). We are one of the largest suppliers of cast aluminum wheels to the world’s leading automobile and light truck manufacturers, with manufacturing operations in the United States and Mexico. Customers in North America represent the principal market for our products. As described in Note 6, "Business Segments," the company operates as a single integrated business and, as such, has only one operating segment - automotive wheels.
Ford Motor Company ("Ford"), General Motors Company ("GM") and Toyota Motor Company ("Toyota") were our customers individually accounting for more than 10 percent of our consolidated sales in the first quarter of 2017 and together represented approximately 79 percent of our trade sales during the first quarter of 2017. Additionally, Nissan Motor Co., Ltd. ("Nissan") and Fiat Chrysler Automotive N.V. ("FCA") individually accounted for 8 percent and 6 percent, respectively of our consolidated sales during the first quarter of 2017 and together with Ford, GM and Toyota represented approximately 93 percent of our trade sales during the first quarter of 2017. We also manufacture aluminum wheels for BMW, Mazda, Subaru, Tesla and Volkswagen. The loss of all or a substantial portion of our sales to Ford, GM or Toyota would have a significant adverse impact on our operating results and financial condition. This risk is partially mitigated by our long-term relationships with these OEM customers and our supply arrangements, which are generally for multi-year periods.
Demand for automobiles and light trucks (including SUVs and crossover vehicles) in the North American market is subject to many unpredictable factors such as changes in the general economy, gasoline prices, consumer credit availability and interest rates. Demand for aluminum wheels can be further affected by other factors, including pricing and performance compared to competitive materials such as steel. Additionally, the demand for our products is influenced by shifts of market share between vehicle manufacturers and the specific market penetration of individual vehicle platforms being sold by our customers.
While we historically have had long-term relationships with our customers and our supply arrangements generally are for multi-year periods, maintaining such long-term arrangements on terms acceptable to us remains difficult. Global competitive pricing pressures continue to affect our business negatively as our customers maintain and/or further develop alternative supplier options. Increasingly, global procurement practices and competition, and the pressure for price reductions, may make it more difficult to maintain long-term supply arrangements with our customers. As a result, there can be no guarantees that we will be able to negotiate supply arrangements with our customers on terms acceptable to us in the future.
We are engaged in ongoing programs to reduce our own costs through improved operational and procurement practices in an attempt to mitigate the impact of these pricing pressures. However, these improvement programs may not be sufficient to offset the adverse impact of ongoing pricing pressures and potential reductions in customer demand in future periods. Additional factors such as inconsistent customer ordering patterns, capacity constraints, higher freight costs, higher energy costs, exchange rates, increasing product complexity and heightened quality standards also are making it increasingly difficult to reduce our costs. It is also possible that as we incur costs to implement improvement strategies, the initial impact of these strategies on our financial position, results of operations and cash flow may be negative.
The raw materials used in producing our products are readily available and are obtained through suppliers with whom we have, in many cases, relatively long-standing trade relations.
Note 2 – Presentation of Condensed Consolidated Financial Statements
During interim periods, we follow the accounting policies set forth in our Annual Report on Form 10-K for the fiscal year ended December 25, 2016 (the "2016 Annual Report on Form 10-K") and apply appropriate interim financial reporting standards for a fair statement of our operating results and financial position in conformity with accounting principles generally accepted in the United States of America, as codified by the Financial Accounting Standards Board ("FASB") in the Accounting Standards Codification ("ASC") (referred to herein as "U.S. GAAP"), as indicated below. For convenience of presentation, the 2016 fiscal year is referred to as December 31, but actually reflects our financial position and results of operations for the period described above. Users of financial information produced for interim periods in 2017 are encouraged to read this Quarterly Report on Form
6
10-Q in conjunction with our consolidated financial statements and notes thereto filed with the Securities and Exchange Commission ("SEC") in our 2016 Annual Report on Form 10-K.
Interim financial reporting standards require us to make estimates that are based on assumptions regarding the outcome of future events and circumstances not known at that time, including the use of estimated effective tax rates. Inevitably, some assumptions will not materialize, unanticipated events or circumstances may occur which vary from those estimates and such variations may significantly affect our future results. Additionally, interim results may not be indicative of our results for future interim periods or our annual results.
We use a 4-4-5 convention for our fiscal quarters, which are thirteen week periods generally ending on the last Sunday of each calendar quarter. We refer to these thirteen week fiscal periods as “quarters” throughout this report. The accompanying unaudited condensed consolidated financial statements have been prepared in accordance with the SEC’s requirements for quarterly reports on Form 10-Q and U.S. GAAP and, in our opinion, contain all adjustments, of a normal and recurring nature, which are necessary for a fair statement of (i) the condensed consolidated statements of operations for the thirteen week period ended March 26, 2017, (ii) the condensed consolidated statements of comprehensive income for the thirteen week period ended March 26, 2017, (iii) the condensed consolidated balance sheets at March 26, 2017 and December 31, 2016, (iv) the condensed consolidated statements of cash flows for the thirteen week period ended March 26, 2017, and (v) the condensed consolidated statement of shareholders’ equity for the thirteen week period ended March 26, 2017. However, the accompanying unaudited condensed consolidated financial statements do not include all information and notes required by U.S. GAAP. The condensed consolidated balance sheet as of December 31, 2016, included in this report, was derived from our 2016 audited financial statements, but does not include all disclosures required by U.S. GAAP.
New Accounting Pronouncements
In May 2014, the FASB issued Accounting Standards Update ("ASU") “Revenue from Contracts with Customers.” This update outlines a single, comprehensive model for accounting for revenue from contracts with customers. We plan to adopt this update on January 1, 2018. The guidance permits two methods of adoption: retrospectively to each prior reporting period presented (full retrospective method), or retrospectively with the cumulative effect of initially applying the guidance recognized at the date of initial application (modified retrospective method). We anticipate adopting the standard using the modified retrospective method. There may be differences in timing of revenue recognition under the new standard compared to recognition under ASC 605 - Revenue Recognition.
In July 2015, the FASB issued an ASU entitled “Simplifying the Measurement of Inventory.” The ASU replaces the current lower of cost or market test with a lower of cost or net realizable value test when cost is determined on a first-in, first-out or average cost basis. The standard is effective for public entities for annual reporting periods beginning after December 15, 2016 and interim periods therein. It was applied prospectively in the first quarter of 2017 and the adoption of this ASU had no impact on our financial position and statement of operations.
In February of 2016, the FASB issued ASU 2016-02, Leases (Topic 842) ("ASU 2016-02"). ASU 2016-02 requires an entity to recognize right-of-use assets and lease liabilities on its balance sheet and disclose key information about leasing arrangements. ASU 2016-02 offers specific accounting guidance for a lessee, a lessor and sale and leaseback transactions. Lessees and lessors are required to disclose qualitative and quantitative information about leasing arrangements to enable a user of the financial statements to assess the amount, timing and uncertainty of cash flows arising from leases. For public companies, ASU 2016-02 is effective for annual reporting periods beginning after December 15, 2018, including interim periods within that reporting period, and requires a modified retrospective adoption, with early adoption permitted. We are evaluating the impact this guidance will have on our financial position and statement of operations.
In March 2016, the FASB issued an ASU entitled "Stock Compensation (Topic 718): Improvements to Employee Share-Based Payment Accounting." The objective of the ASU is to simplify several aspects of the accounting for employee share-based payment transactions, including the income tax consequences, classification of awards as either equity or liabilities and classification on the statement of cash flows. This ASU is effective for fiscal years beginning after December 15, 2016, including interim periods within those fiscal years. The adoption of this ASU in the first quarter of 2017 had no significant impact on our financial position and statement of operations. Also, certain disclosures in the statement of cash flows were modified in accordance with this ASU.
In August 2016, the FASB issued an ASU entitled "Statement of Cash Flows (Topic 740): Classification of Certain Cash Receipts and Cash Payments." The objective of the ASU is to address the diversity in practice in the presentation of certain cash receipts and cash payments in the statement of cash flows. This ASU is effective for fiscal years beginning after December 15, 2017, including interim periods within those fiscal years. Early adoption is permitted. We are evaluating the impact this guidance will have on our statement of cash flows.
7
In October 2016, the FASB issued an ASU entitled "Income Taxes (Topic 230): Intra-Entity Transfers of Assets Other than Inventory." The objective of the ASU is to improve the accounting for the income tax consequences of intra-entity transfers of assets other than inventory. This ASU is effective for fiscal years beginning after December 15, 2017, including interim periods within those fiscal years. Early adoption is permitted. We are evaluating the impact this guidance will have on our financial position and statement of operations.
In November 2016, the FASB issued an ASU entitled "Statement of Cash Flows (Topic 230): Restricted Cash." The objective of the ASU is to address the diversity in practice that exists in the classification and presentation of changes in restricted cash on the statement of cash flows. This ASU is effective for fiscal years beginning after December 15, 2017, including interim periods within those fiscal years. Early adoption is permitted. We are evaluating the impact this guidance will have on our statement of cash flows.
In January 2017, the FASB issued an ASU entitled "Intangibles - Goodwill and Other (Topic 350): Simplifying the Test for Goodwill Impairment." The objective of the ASU is to simplify how an entity is required to test goodwill for impairment by eliminating Step 2 from the goodwill impairment test. Step 2 measures a goodwill impairment loss by comparing the implied fair value of a reporting unit’s goodwill with the carrying amount of that goodwill. This ASU is effective for fiscal years beginning after December 15, 2019, including interim periods within those fiscal years. Early adoption is permitted. We are evaluating the impact this guidance will have on our financial position and statement of operations.
In January 2017, the FASB issued an ASU entitled "Business Combinations (Topic 805): Clarifying the Definition of a Business." The objective of the ASU is to add guidance to assist entities with evaluating whether transactions should be accounted for as acquisitions (or disposals) of assets or businesses. This ASU is effective for fiscal years beginning after December 15, 2017, including interim periods within those fiscal years. Early adoption is permitted. We are evaluating the impact this guidance will have on our financial position and statement of operations.
In March 2017, the FASB issued an ASU entitled "Compensation-Retirement Benefits (Topic 715): Improving the Presentation of Net Periodic Pension Cost and Net Periodic Postretirement Benefit Cost." The objective of the ASU is to improve the reporting of net benefit cost in the financial statements. This ASU is effective for fiscal years beginning after December 15, 2017, including interim periods within those fiscal years. Early adoption is permitted. We are evaluating the impact this guidance will have on our financial position and statement of operations.
Note 3 – Restructuring
During 2014, we completed a review of initiatives to reduce costs and enhance our competitive position. Based on this review, we committed to a plan to close operations at our Rogers, Arkansas facility, which was completed during the fourth quarter of 2014. The action was undertaken in order to reduce costs and enhance our global competitive position. During 2016, we sold the Rogers facility for total proceeds of $4.3 million, resulting in a $1.4 million gain on sale, which is recorded as a reduction to selling, general and administrative expense in the consolidated income statements.
The total cost incurred as a result of the Rogers facility closure was $16.1 million, of which $0.2 million and $0.1 million was recognized as of March 26, 2017 and March 27, 2016, respectively. The following table summarizes the Rogers, Arkansas plant closure costs and classification in the consolidated income statement for the period ended March 26, 2017:
8
(Dollars in thousands) | Costs Incurred Through December 31, 2016 | Costs Incurred During the Thirteen Week Period Ended March 26, 2017 | Total Costs | Classification | |||||||||
Accelerated and other depreciation of assets idled | $ | 7,254 | $ | 13 | $ | 7,267 | Cost of sales, Restructuring costs | ||||||
Severance costs | 2,011 | — | 2,011 | Cost of sales, Restructuring costs | |||||||||
Equipment removal and impairment, inventory written-down, lease termination and other costs | 6,634 | 195 | 6,829 | Cost of sales, Restructuring costs | |||||||||
15,899 | 208 | 16,107 | |||||||||||
Gain on sale of the facility | (1,436 | ) | — | (1,436 | ) | ||||||||
$ | 14,463 | $ | 208 | $ | 14,671 | ||||||||
Note 4 - Fair Value Measurements
The company applies fair value accounting for all financial assets and liabilities and non-financial assets and liabilities that are recognized or disclosed at fair value in the financial statements on a recurring basis, while other assets and liabilities are measured at fair value on a nonrecurring basis, such as when we have an asset impairment. Fair value is estimated by applying the following hierarchy, which prioritizes the inputs used to measure fair value into three levels and bases the categorization within the hierarchy upon the lowest level of input that is available and significant to the fair value measurement:
Level 1 – Quoted prices in active markets for identical assets or liabilities.
Level 2 – Observable inputs other than quoted prices in active markets for identical assets and liabilities, quoted prices for identical or similar assets or liabilities in inactive markets, or other inputs that are observable or can be corroborated by observable market data for substantially the full term of the assets or liabilities.
Level 3 – Inputs that are generally unobservable and typically reflect management’s estimate of assumptions that market participants would use in pricing the asset or liability.
The carrying amounts for cash and cash equivalents, investments in certificates of deposit, accounts receivable, accounts payable and accrued expenses approximate their fair values due to the short period of time until maturity.
Cash and Cash Equivalents
Included in cash and cash equivalents are highly liquid investments that are readily convertible to known amounts of cash, and which are subject to an insignificant risk of change in value due to interest rate, quoted price or penalty on withdrawal. A debt security is classified as a cash equivalent if it meets these criteria and if it has a remaining time to maturity of three months or less from the date of acquisition. Amounts on deposit and available upon demand, or negotiated to provide for daily liquidity without penalty, are classified as cash and cash equivalents. Time deposits, certificates of deposit and money market accounts that meet the above criteria are reported at par value on our balance sheet and are excluded from the table below.
Derivative Financial Instruments
Our derivatives are over-the-counter customized derivative transactions and are not exchange traded. We estimate the fair value of these instruments using industry-standard valuation models such as a discounted cash flow. These models project future cash flows and discount the future amounts to a present value using market-based expectations for interest rates, foreign exchange rates, commodity prices and the contractual terms of the derivative instruments. The discount rate used is the relevant interbank deposit rate (e.g., LIBOR) plus an adjustment for non-performance risk. In certain cases, market data may not be available, and we may use broker quotes and models (e.g., Black-Scholes) to determine fair value. This includes situations where there is lack of liquidity for a particular currency or commodity or when the instrument is longer dated.
9
Cash Surrender Value
The cash surrender value of the life insurance policies is the sum of money the insurance company will pay to the company in the event the policy is voluntarily terminated before its maturity or the insured event occurs. Over the term of the life insurance contracts, the cash surrender value changes as a result of premium payments and investment income offset by investment losses, charges and miscellaneous fees. The amount of the asset recorded for the investment in the life insurance contracts is equal to the cash surrender value which is the amount that will be realized under the contract as of the balance sheet date if the insured event occurs.
The following table categorizes items measured at fair value at March 26, 2017:
Fair Value Measurement at Reporting Date Using | |||||||||||||||
Quoted Prices | Significant Other | Significant | |||||||||||||
in Active Markets | Observable | Unobservable | |||||||||||||
for Identical Assets | Inputs | Inputs | |||||||||||||
March 26, 2017 | Total | (Level 1) | (Level 2) | (Level 3) | |||||||||||
(Dollars in thousands) | |||||||||||||||
Assets | |||||||||||||||
Certificates of deposit | $ | 750 | $ | — | $ | 750 | $ | — | |||||||
Cash surrender value | 7,573 | — | 7,573 | — | |||||||||||
Derivative contracts | 9,037 | — | 9,037 | — | |||||||||||
Total | $ | 17,360 | $ | — | $ | 17,360 | $ | — | |||||||
Liabilities | |||||||||||||||
Derivative contracts | $ | 10,201 | $ | — | $ | 10,201 | $ | — | |||||||
Total | $ | 10,201 | $ | — | $ | 10,201 | $ | — | |||||||
The following table categorizes items measured at fair value at December 31, 2016:
Fair Value Measurement at Reporting Date Using | |||||||||||||||
Quoted Prices | Significant Other | Significant | |||||||||||||
in Active Markets | Observable | Unobservable | |||||||||||||
for Identical Assets | Inputs | Inputs | |||||||||||||
December 31, 2016 | Total | (Level 1) | (Level 2) | (Level 3) | |||||||||||
(Dollars in thousands) | |||||||||||||||
Assets | |||||||||||||||
Certificates of deposit | $ | 750 | $ | — | $ | 750 | $ | — | |||||||
Cash surrender value | 7,480 | — | 7,480 | — | |||||||||||
Derivative contracts | 13 | — | 13 | — | |||||||||||
Total | $ | 8,243 | $ | — | $ | 8,243 | $ | — | |||||||
Liabilities | |||||||||||||||
Derivative contracts | $ | 24,773 | $ | — | $ | 24,773 | $ | — | |||||||
Total | $ | 24,773 | $ | — | $ | 24,773 | $ | — | |||||||
10
Note 5 - Derivative Financial Instruments
We use derivatives to partially offset our business exposure to foreign currency risk. We may enter into forward contracts, option contracts, swaps, collars or other derivative instruments to offset some of the risk on expected future cash flows and on certain existing assets and liabilities. However, we may choose not to hedge certain exposures for a variety of reasons including, but not limited to, accounting considerations and the prohibitive economic cost of hedging particular exposures. There can be no assurance the hedges will offset more than a portion of the financial impact resulting from movements in foreign currency exchange rates.
To help protect gross margins from fluctuations in foreign currency exchange rates, certain of our subsidiaries whose functional currency is the U.S. dollar hedge a portion of forecasted foreign currency costs. Generally, we may hedge portions of our forecasted foreign currency exposure associated with costs, typically for up to 33 months.
We record all derivatives in the condensed consolidated balance sheets at fair value. Our accounting treatment for these instruments is based on the hedge designation. The effective portions of cash flow hedges are recorded in Accumulated Other Comprehensive Income ("AOCI") until the hedged item is recognized in earnings. The ineffective portions of cash flow hedges are recorded in cost of sales. Derivatives that are not designated as hedging instruments are adjusted to fair value through earnings in the financial statement line item to which the derivative relates. All derivatives were designated as hedging instruments at December 31, 2016. At March 26, 2017, the company held derivatives that were designated as hedging instruments as well as derivatives that did not qualify for designation as hedging instruments as discussed below.
Deferred gains and losses associated with cash flow hedges of foreign currency costs are recognized as a component of cost of sales in the same period as the related cost is recognized. Our foreign currency transactions hedged with cash flow hedges as of March 26, 2017, are expected to occur within 1 month to 33 months. The derivatives that did not qualify for designation as hedging instruments will expire in June 2017.
Derivative instruments designated as cash flow hedges must be de-designated as hedges when it is probable the forecasted hedged transaction will not occur in the initially identified time period or within a subsequent two-month time period. Deferred gains and losses in AOCI associated with such derivative instruments are reclassified immediately into other expense. Any subsequent changes in fair value of such derivative instruments are reflected in other expense unless they are re-designated as hedges of other transactions.
Currency option derivative contracts not designated as hedging instruments consist principally of option contracts to purchase Polish Zloty and the Euro related to the announced acquisition of UNIWHEELS AG. See Note 15 - Commitments and Contingencies - "Acquisition."
We had no gains or losses recognized in other expense for foreign currency forward and option contracts not designated as hedging instruments during the thirteen week periods ended March 26, 2017 and March 27, 2016.
The following tables display the fair value of derivatives by balance sheet line item at March 26, 2017 and December 31, 2016:
March 26, 2017 | |||||||||||||||
Other Current Assets | Other Non-current Assets | Accrued Liabilities | Other Non-current Liabilities | ||||||||||||
(Dollars in thousands) | |||||||||||||||
Foreign exchange forward contracts and collars designated as hedging instruments | $ | 654 | $ | 1,108 | $ | 5,495 | $ | 4,706 | |||||||
Currency options not designated as hedging instruments | 7,275 | — | — | — | |||||||||||
Total derivative financial instruments | $ | 7,929 | $ | 1,108 | $ | 5,495 | $ | 4,706 | |||||||
11
December 31, 2016 | |||||||||||||||
Other Current Assets | Other Non-current Assets | Accrued Liabilities | Other Non-current Liabilities | ||||||||||||
(Dollars in thousands) | |||||||||||||||
Foreign exchange forward contracts and collars designated as hedging instruments | $ | 13 | $ | — | $ | 10,076 | $ | 14,697 | |||||||
Total derivative financial instruments | $ | 13 | $ | — | $ | 10,076 | $ | 14,697 | |||||||
The following table summarizes the notional amount and estimated fair value of our derivative financial instruments:
March 26, 2017 | December 31, 2016 | |||||||||||||||
Notional U.S. Dollar Amount | Fair Value | Notional U.S. Dollar Amount | Fair Value | |||||||||||||
(Dollars in thousands) | ||||||||||||||||
Foreign currency forward contracts and collars designated as hedging instruments | $ | (147,449 | ) | $ | (8,439 | ) | $ | (160,461 | ) | $ | (24,760 | ) | ||||
Currency options not designated as hedging instruments | 439,253 | 7,275 | — | — | ||||||||||||
Total derivative financial instruments | $ | 291,804 | $ | (1,164 | ) | $ | (160,461 | ) | $ | (24,760 | ) | |||||
Notional amounts are presented on a gross basis. The notional amounts of the derivative financial instruments do not represent amounts exchanged by the parties and, therefore, are not a direct measure of our exposure to the financial risks described above. The amounts exchanged are calculated by reference to the notional amounts and by other terms of the derivatives, such as interest rates, foreign currency exchange rates or commodity volumes and prices.
The following table provides the impact of derivative instruments designated as cash flow hedges on our consolidated income statement:
Thirteen Week Period Ended March 26, 2017 | Amount of Gain or (Loss) Recognized in AOCI on Derivatives (Effective Portion) | Amount of Pre-tax Gain or (Loss) Reclassified from AOCI into Income (Effective Portion) | Amount of Pre-tax Gain or (Loss) Recognized in Income on Derivatives (Ineffective Portion and Amount Excluded from Effectiveness Testing) | |||||||||
(Dollars in thousands) | ||||||||||||
Foreign currency forward contracts and collars | $ | 17,059 | $ | (2,491 | ) | $ | 168 | |||||
Total | $ | 17,059 | $ | (2,491 | ) | $ | 168 | |||||
Note 6 – Business Segments
The company's Chief Executive Officer is the chief operating decision maker ("CODM") because he has final authority over performance assessment and resource allocation decisions. The CODM evaluates both consolidated and disaggregated financial information for each of the company's business units in deciding how to allocate resources and assess performance. Each manufacturing facility manufactures the same products, ships products to the same group of customers, utilizes the same cast manufacturing process and, as a result, production can generally be transferred among our facilities. Accordingly, we operate as a single integrated business and, as such, have only one operating segment - automotive wheels.
12
Geographic Information
Net sales by geographic location are as follows:
Thirteen Weeks Ended | |||||||
March 26, 2017 | March 27, 2016 | ||||||
(Dollars in thousands) | |||||||
Net sales: | |||||||
U.S. | $ | 33,731 | $ | 37,396 | |||
Mexico | 140,489 | 148,669 | |||||
Consolidated net sales | $ | 174,220 | $ | 186,065 | |||
Long-Lived Assets | |||||||||||
Long-lived assets includes property, plant and equipment, net, by geographic location as follows: | |||||||||||
March 26, 2017 | December 31, 2016 | ||||||||||
(Dollars in thousands) | |||||||||||
Property, plant and equipment, net: | |||||||||||
U.S. | $ | 34,860 | $ | 37,795 | |||||||
Mexico | 208,219 | 189,608 | |||||||||
Consolidated property, plant and equipment, net | $ | 243,079 | $ | 227,403 | |||||||
Note 7 – Short-Term Investments
The company's short-term investments include certificates of deposit and fixed deposits with original maturities of three months or less. Certificates of deposit and fixed deposits whose original maturity is greater than three months and is one year or less are classified as short-term investments and certificates of deposit and fixed deposits whose maturity is greater than one year at the balance sheet date are classified as non-current assets in our condensed consolidated balance sheets. The purchase of any certificates of deposit or fixed deposits that are classified as short-term investments or non-current assets appear in the investing section of our condensed consolidated statements of cash flows.
Restricted Deposits
We purchase certificates of deposit that mature within twelve months and are used to secure or collateralize letters of credit securing our workers’ compensation obligations. At March 26, 2017 and December 31, 2016, certificates of deposit totaling $0.8 million were restricted in use and were classified as short-term investments on our condensed consolidated balance sheets.
Note 8 – Inventories
March 26, 2017 | December 31, 2016 | ||||||
(Dollars in thousands) | |||||||
Raw materials | $ | 43,103 | $ | 40,255 | |||
Work in process | 29,896 | 21,447 | |||||
Finished goods | 28,429 | 21,135 | |||||
Inventories | $ | 101,428 | $ | 82,837 | |||
13
Service wheel and supplies inventory included in other non-current assets in the condensed consolidated balance sheets totaled $6.9 million and $6.5 million at March 26, 2017 and December 31, 2016, respectively. Included in raw materials were operating supplies and spare parts totaling $13.0 million and $10.3 million on March 26, 2017 and December 31, 2016, respectively.
Note 9 – Property, Plant and Equipment
March 26, 2017 | December 31, 2016 | ||||||
(Dollars in thousands) | |||||||
Land and buildings | $ | 72,691 | $ | 67,915 | |||
Machinery and equipment | 486,408 | 485,185 | |||||
Leasehold improvements and others | 4,868 | 4,868 | |||||
Construction in progress | 32,692 | 26,301 | |||||
596,659 | 584,269 | ||||||
Accumulated depreciation | (353,580 | ) | (356,866 | ) | |||
Property, plant and equipment, net | $ | 243,079 | $ | 227,403 | |||
Depreciation expense was $8.4 million and $8.6 million for the thirteen weeks ended March 26, 2017 and March 27, 2016, respectively.
Note 10 – Preproduction Costs Related to Long-Term Supply Arrangements
We incur preproduction engineering and tooling costs related to the products produced for our customers under long-term supply agreements. We expense all preproduction engineering costs for which reimbursement is not contractually guaranteed by the customer or which are in excess of the contractually guaranteed reimbursement amount. We amortize the cost of the customer-owned tooling over the expected life of the wheel program on a straight-line basis. Also, we defer any reimbursements made to us by our customers and recognize the tooling reimbursement revenue over the same period in which the tooling is in use. Changes in the facts and circumstances of individual wheel programs may accelerate the amortization of both the cost of customer-owned tooling and the deferred tooling reimbursement revenues. Recognized tooling reimbursement revenues, which totaled $1.7 million and $1.4 million for the thirteen weeks ended March 26, 2017 and March 27, 2016, respectively, are included in net sales in the condensed consolidated statements of operations. The following tables summarize the unamortized customer-owned tooling costs included in our non-current assets, and the deferred tooling revenues included in accrued expenses and other non-current liabilities:
March 26, 2017 | December 31, 2016 | |||||||
(Dollars in Thousands) | ||||||||
Customer-Owned Tooling Costs | ||||||||
Preproduction costs | $ | 80,095 | $ | 78,299 | ||||
Accumulated amortization | (66,681 | ) | (65,100 | ) | ||||
Net preproduction costs | $ | 13,414 | $ | 13,199 | ||||
Deferred Tooling Revenues | ||||||||
Accrued expenses | $ | 4,917 | $ | 5,419 | ||||
Other non-current liabilities | 2,250 | 2,593 | ||||||
Total deferred tooling revenues | $ | 7,167 | $ | 8,012 | ||||
Note 11 – Earnings Per Share
In accordance with U.S. GAAP, basic earnings per share is computed by dividing net income for the period by the weighted average number of common shares outstanding for the period. For purposes of calculating diluted earnings per share, net income is divided by the total of the weighted average shares outstanding plus the dilutive effect of our outstanding stock options and time and
14
performance based restricted stock units under the treasury stock method, which includes consideration of stock-based compensation required by U.S. GAAP.
(Dollars in thousands, except per share amounts) | Thirteen Weeks Ended | ||||||
March 26, 2017 | March 27, 2016 | ||||||
Basic Income Per Share: | |||||||
Reported net income | $ | 3,102 | $ | 14,464 | |||
Basic income per share | $ | 0.12 | $ | 0.56 | |||
Weighted average shares outstanding - Basic | 25,030 | 25,603 | |||||
Diluted Income Per Share: | |||||||
Reported net income | $ | 3,102 | $ | 14,464 | |||
Diluted income per share | $ | 0.12 | $ | 0.56 | |||
Weighted average shares outstanding - Basic | 25,030 | 25,603 | |||||
Weighted average dilutive stock options and restricted stock units | 105 | 41 | |||||
Weighted average shares outstanding - Diluted | 25,135 | 25,644 | |||||
For the first quarter of 2017 and 2016, no options were excluded from the diluted earnings per share calculation as being anti-dilutive. In addition, the performance shares discussed in Note 16, "Stock-Based Compensation" are not included in the diluted earnings per share because the performance metrics had not been met as of the period ended March 26, 2017.
Note 12 – Income Taxes
The estimated annual effective tax rate is forecasted quarterly using actual historical information and forward-looking estimates and applied to year-to-date ordinary income. The tax effects of unusual or infrequently occurring items, including changes in judgment about valuation allowances, settlements with taxing authorities and effects of changes in tax laws or rates, are reported in the interim period in which they occur.
The income tax expense for the thirteen weeks ended March 26, 2017 was $0.2 million, representing an effective income tax rate of 6.0 percent. The effective tax rate for the thirteen weeks ended March 26, 2017 was lower than the statutory rate due to earnings in countries that are taxed below the U.S. statutory rate and a discrete tax benefit due to a recognition of transaction costs incurred during the first quarter of 2017 related to the tender offer for UNIWHEELS AG.
The income tax provision for the thirteen weeks ended March 27, 2016 was $4.6 million, which resulted in an effective income tax rate of 24.0 percent. The effective tax rate for the thirteen weeks ended March 27, 2016 was lower than the statutory rate due to the change in the mix of income before taxes for entities included in our effective tax rate calculation and the effect of the business restructuring to realign our operations, which was implemented in the fourth quarter of 2015.
Note 13 – Retirement Plans
We have an unfunded salary continuation plan covering certain directors, officers and other key members of management. We purchase life insurance policies on certain participants to provide, in part, for future liabilities. Cash surrender value of these policies, totaling $7.6 million and $7.5 million at March 26, 2017 and December 31, 2016, respectively, are included in other non-current assets in the company's condensed consolidated balance sheets. Subject to certain vesting requirements, the plan provides for a benefit based on final average compensation, which becomes payable on the employee's death or upon attaining age 65, if retired. The plan was closed to new participants effective February 3, 2011. We have measured the plan assets and obligations of our salary continuation plan for all periods presented.
For the thirteen weeks ended March 26, 2017, payments to retirees or their beneficiaries totaled approximately $0.4 million. We presently anticipate benefit payments in 2017 to total approximately $1.5 million. The following table summarizes the components of net periodic pension cost for the first quarter of 2017 and 2016.
15
Thirteen Weeks Ended | |||||||
March 26, 2017 | March 27, 2016 | ||||||
(Dollars in thousands) | |||||||
Service cost | $ | — | $ | — | |||
Interest cost | 298 | 304 | |||||
Net amortization | 67 | 84 | |||||
Net periodic pension cost | $ | 365 | $ | 388 | |||
Note 14 - Line of Credit
On December 19, 2014, we entered into a senior secured credit agreement (the "Credit Agreement") with J.P. Morgan Securities LLC, JP Morgan Chase Bank, N.A. (“JPMCB”) and Wells Fargo Bank, National Association (together with JPMCB, the “Lenders”).
The Credit Agreement consists of a senior secured revolving credit facility in an initial aggregate principal amount of $100.0 million (the “Facility”). In addition, the company is entitled to request, subject to certain terms and conditions and the agreement of the Lenders, an increase in the aggregate revolving commitments under the Facility or to obtain incremental term loans in an aggregate amount not to exceed $50.0 million, which currently is uncommitted to by any lenders. As of March 26, 2017, the company had $97.2 million of availability under the Facility after giving effect to $2.8 million in outstanding letters of credit.
The Credit Agreement expires on December 19, 2019 and borrowings under the Facility accrue interest at (i) a London interbank offered rate plus a margin of between 0.75 percent and 1.25 percent based on the total leverage ratio of Superior and its subsidiaries on a consolidated basis, (ii) a rate based on JPMCB’s prime rate plus a margin of between 0.00 percent and 0.25 percent based on the total leverage ratio of the company and its subsidiaries on a consolidated basis or (iii) a combination thereof. Commitment fees are 0.2 percent on the unused portion of the facility. The commitment fees are included in our condensed consolidated financial statements line, interest (expense) income, net.
Generally, all amounts under the Facility are guaranteed by certain of the U.S. subsidiaries of the company and are secured by a first priority security interest in and lien on the personal property of the company and the U.S. guarantors (as defined in the Credit Agreement) and a pledge of and first perfected security interest in the equity interests of the company’s existing and future U.S. subsidiaries and 65 percent of the equity interests in certain non-U.S. direct material subsidiaries of the company and the U.S. guarantors under the Facility.
The Credit Agreement contains certain customary restrictive covenants, including, among others, financial covenants requiring the maintenance of a maximum total leverage ratio and a minimum fixed charge coverage ratio, and also includes, without limitation, covenants, in each case with certain exceptions and allowances, limiting the ability of the company and its subsidiaries to incur indebtedness, grant liens, make investments, dispose of assets, make certain restrictive payments, make optional payments and modifications of subordinated debt instruments, enter into certain transactions with affiliates, enter into swap agreements, make capital expenditures or make changes to its lines of business. At March 26, 2017, we were in compliance with all covenants contained in the Credit Agreement. At March 26, 2017, we had no borrowings under this facility other than the outstanding letters of credit referred to above.
The Credit Agreement contains customary default provisions, representations and warranties and restrictive covenants. The Credit Agreement also contains a provision permitting the lenders to accelerate the repayment of all loans outstanding under the Facility during an event of default.
16
Note 15 – Commitments and Contingencies
Acquisition
On March 23, 2017, the Company commenced a tender offer to acquire UNIWHEELS AG, one of the leading European aluminum wheel suppliers to the OEMs and after-markets. UNIWHEELS AG is headquartered in Germany with sales and operations concentrated in Germany and Poland. Assuming the acquisition of 100% of outstanding shares, the equity purchase price is valued at approximately $715 million and will be financed with approximately $660 million in debt and $150 million in preferred equity. The closing of the transaction requires a minimum of 75 percent of the shares to be tendered and is expected to occur in the second quarter of 2017 and is subject to customary closing conditions.
Derivatives and Purchase Commitments
In order to hedge exposure related to fluctuations in foreign currency rates and the cost of certain commodities used in the manufacture of our products, we periodically may purchase derivative financial instruments such as forward contracts, options or collars to offset or mitigate the impact of such fluctuations. Programs to hedge currency rate exposure may address ongoing transactions including foreign-currency-denominated receivables and payables, as well as specific transactions related to purchase obligations. Programs to hedge exposure to commodity cost fluctuations would be based on underlying physical consumption of such commodities.
In accordance with our corporate risk management policies, we may enter into foreign currency forward and option contracts with financial institutions to protect against foreign exchange risks associated with certain existing assets and liabilities, certain firmly committed transactions and forecasted future cash flows. We have implemented a program to hedge a portion of our material foreign exchange exposures for up to approximately 33 months. For additional information on our derivatives, see Note 5, "Derivative Financial Instruments".
When market conditions warrant, we may also enter into purchase commitments to secure the supply of certain commodities used in the manufacture of our products, such as aluminum, natural gas and other raw materials. At March 26, 2017, we did not have any purchase commitments in place for the delivery of aluminum, natural gas or other raw materials in 2017.
Other
We are party to various legal and environmental proceedings incidental to our business. Certain claims, suits and complaints arising in the ordinary course of business have been filed or are pending against us. Based on facts now known, we believe all such matters are adequately provided for, covered by insurance, are without merit and/or involve such amounts that would not materially adversely affect our consolidated results of operations, cash flows or financial position.
Note 16 – Stock-Based Compensation
2008 Equity Incentive Plan
Our 2008 Equity Incentive Plan, as amended (the "Plan"), authorizes us to issue up to 3.5 million shares of common stock, along with non-qualified stock options, stock appreciation rights, restricted stock and performance units to our officers, key employees, non-employee directors and consultants. At March 26, 2017, there were 1.6 million shares available for future grants under this Plan. No more than 600,000 shares may be used under the Plan as “full value” awards, which include restricted stock and performance stock units. It is our policy to issue shares from authorized but not issued shares upon the exercise of stock options.
During the first quarter of 2015, the company implemented a long term incentive program for the benefit of certain members of company management. The program was designed to strengthen employee retention and to provide a more structured incentive program to stimulate improvement in future company results. Per the terms of the program, participants were granted, in 2015 to 2017, time value restricted stock units (“RSUs”), vesting ratably over a three year time period, and performance restricted stock units (“PSUs”), with a three year cliff vesting. Upon vesting, each restricted stock award is exchangeable for one share of the company’s common stock, with accrued dividends. The PSUs are categorized further into three individual categories whose vesting is contingent upon the achievement of certain targets as follows:
• | 40% of the PSUs vest upon certain Return on Invested Capital targets for 2015 to 2017 units |
17
• | 40% of the PSUs vest upon certain Cumulative EPS targets for 2016 to 2017 units |
• | 40% of the PSUs vest upon certain EBITDA margin targets for 2015 units |
• | 20% of the PSUs vest upon certain market based Shareholder Return targets for 2015 to 2017 units. |
Options
Options are granted at not less than fair market value on the date of grant and expire no later than ten years after the date of grant. Options and restricted shares granted under this Plan generally require no less than a three year ratable vesting period. Stock option activity in the first quarter of 2017 are summarized in the following table:
Outstanding | Weighted Average Exercise Price | Remaining Contractual Life in Years | Aggregate Intrinsic Value | |||||||||
Balance at December 31, 2016 | 231,625 | $ | 18.88 | 3.1 | $ | 1,845,263 | ||||||
Granted | — | $ | — | |||||||||
Exercised | — | $ | — | |||||||||
Canceled | (3,000 | ) | $ | 19.62 | ||||||||
Expired | — | $ | — | |||||||||
Balance at March 26, 2017 | 228,625 | $ | 18.87 | |||||||||
Options vested or expected to vest at March 26, 2017 | 228,625 | $ | 18.87 | 2.8 | $ | 1,572,075 | ||||||
Exercisable at March 26, 2017 | 228,625 | $ | 18.87 | 2.8 | $ | 1,572,075 | ||||||
Restricted Stock Awards
Restricted stock awards, or “full value” awards, generally vest ratably over no less than a three year period. Shares of restricted stock granted under the Plan are considered issued and outstanding at the date of grant, have the same dividend and voting rights as other outstanding common stock, are subject to forfeiture if employment terminates prior to vesting and are expensed ratably over the vesting period. Dividends paid on the restricted shares granted under the Plan are non-forfeitable if the restricted shares do not ultimately vest. Restricted stock activity in the first quarter of 2017 are summarized in the following table:
Number of Awards | Weighted Average Grant Date Fair Value | Weighted Average Remaining Amortization Period (in Years) | ||||||
Balance at December 31, 2016 | 144,295 | $ | 19.43 | 0.5 | ||||
Granted | — | $ | — | |||||
Vested | (82,455 | ) | $ | 19.44 | ||||
Canceled | (417 | ) | $ | 19.16 | ||||
Balance at March 26, 2017 | 61,423 | $ | 19.41 | 0.3 | ||||
18
Restricted Stock Units
Restricted stock unit activity in the first quarter of 2017 are summarized in the following table:
Number of Awards | Weighted Average Grant Date Fair Value | Weighted Average Remaining Amortization Period (in Years) | ||||||
Balance at December 31, 2016 | 127,567 | $ | 22.03 | 1.7 | ||||
Granted | 59,078 | $ | 23.90 | |||||
Vested | (17,031 | ) | $ | 21.56 | ||||
Canceled | (1,815 | ) | $ | 22.82 | ||||
Balance at March 26, 2017 | 167,799 | $ | 22.73 | 2.3 | ||||
Restricted Performance Stock Units
Number of Awards | Weighted Average Grant Date Fair Value | Weighted Average Remaining Amortization Period (in Years) | ||||||
Balance at December 31, 2016 | 227,193 | $ | 21.72 | 1.6 | ||||
Granted | 118,157 | $ | 23.90 | |||||
Vested | — | $ | — | |||||
Canceled | (5,259 | ) | $ | 22.38 | ||||
Balance at March 26, 2017 | 340,091 | $ | 22.47 | 2.1 | ||||
Stock-Based Compensation
Stock-based compensation expense related to our equity incentive plans in accordance with U.S. GAAP was allocated as follows:
Thirteen Weeks Ended | |||||||
March 26, 2017 | March 27, 2016 | ||||||
(Dollars in thousands) | |||||||
Cost of sales | $ | 187 | $ | 76 | |||
Selling, general and administrative expenses | 1,092 | 480 | |||||
Stock-based compensation expense before income taxes | 1,279 | 556 | |||||
Income tax benefit | (472 | ) | (133 | ) | |||
Total stock-based compensation expense after income taxes | $ | 807 | $ | 423 | |||
As of March 26, 2017, a total of $6.8 million of unrecognized compensation cost related to non-vested awards is expected to be recognized over a weighted average period of approximately 2.2 years. There were no significant capitalized stock-based compensation costs at March 26, 2017 and December 31, 2016.
19
Note 17 - Common Stock Repurchase Programs
In October 2014, our Board of Directors approved a stock repurchase program (the "2014 Repurchase Program") which authorized the repurchase of up to $30.0 million of our common stock. Under the 2014 Repurchase Program, we repurchased common stock from time to time on the open market or in private transactions. Shares repurchased under the 2014 Repurchase Program totaled 1,056,954 shares at a cost of $19.6 million. The 2014 Repurchase Program was completed in the beginning of 2016, with purchases of 585,970 shares for a cost of $10.3 million. The repurchased shares described above were either canceled and retired or added to treasury stock after the reincorporation in Delaware in 2015.
In January of 2016, our Board of Directors approved another stock repurchase program (the “2016 Repurchase Program”), authorizing the repurchase of up to $50.0 million of common stock. Under the 2016 Repurchase Program, we may repurchase common stock from time to time on the open market or in private transactions. The timing and extent of the repurchases under the 2016 Repurchase Program will depend upon market conditions and other corporate considerations in our sole discretion. Shares repurchased under the 2016 Repurchase Program totaled 86,513 shares of company stock at a cost of $1.6 million in the first quarter of 2016. Shares repurchased under the 2016 Repurchase Program totaled 215,841 shares of company stock at a cost of $5.0 million in the first quarter of 2017.
20
Item 2. Management’s Discussion and Analysis of Financial Condition and Results of Operations
Forward-Looking Statements
The Private Securities Litigation Reform Act of 1995 provides a safe harbor for forward-looking statements made by us or on our behalf. We have included or incorporated by reference in this Quarterly Report on Form 10-Q (including in the sections entitled "Risk Factors" and “Management's Discussion and Analysis of Financial Condition and Results of Operations”) and from time to time our management may make statements that may constitute “forward-looking statements” within the meaning of Section 27A of the Securities Exchange Act of 1933 and Section 21E of the Securities Act of 1934. These forward-looking statements are based upon management's current expectations, estimates, assumptions and beliefs concerning future events and conditions and may discuss, among other things, anticipated future performance (including sales and earnings), expected growth, future business plans and costs and potential liability for environmental-related matters. Any statement that is not historical in nature is a forward-looking statement and may be identified by the use of words and phrases such as “expects,” “anticipates,” “believes,” “will,” “will likely result,” “will continue,” “plans to” and similar expressions. These statements include our belief regarding general automotive industry and market conditions and growth rates, as well as general domestic and international economic conditions.
Readers are cautioned not to place undue reliance on forward-looking statements. Forward-looking statements are necessarily subject to risks, uncertainties and other factors, many of which are outside the control of the company, which could cause actual results to differ materially from such statements and from the company's historical results and experience. These risks, uncertainties and other factors include, but are not limited to, those described in Part I - Item 1A - "Risk Factors" and Part II - Item 7 - “Management's Discussion and Analysis of Financial Condition and Results of Operations” of our Annual Report on Form 10-K for the year ended December 31, 2016 and Part II - Item 1A - "Risk Factors" and Part I - Item 2 - “Management's Discussion and Analysis of Financial Condition and Results of Operations” of this Quarterly Report on Form 10-Q and elsewhere in the Quarterly Report and those described from time to time in our other reports filed with the Securities and Exchange Commission.
Readers are cautioned that it is not possible to predict or identify all of the risks, uncertainties and other factors that may affect future results and that the risks described herein should not be considered to be a complete list. Any forward-looking statement speaks only as of the date on which such statement is made, and the company undertakes no obligation to update or revise any forward-looking statement, whether as a result of new information, future events or otherwise.
Management’s Discussion and Analysis of Financial Condition and Results of Operations should be read in conjunction with the accompanying unaudited Condensed Consolidated Financial Statements and notes thereto and with the audited Consolidated Financial Statements and notes thereto and Management’s Discussion and Analysis of Financial Condition and Results of Operations included in our 2016 Annual Report on Form 10-K.
Executive Overview
Strategic Direction
Our strategic mission is to become the global industry leader and innovator of premium wheels and finishes. Historically, our business focus primarily was on providing wheels for relatively high-volume programs with lower degrees of competitive differentiation. In order to improve our strategic position, we have augmented our product portfolio with wheels containing higher technical content and greater differentiation. We believe this direction is consistent with the trend of the market and needs of our customers. During the first quarter of 2017, we found a highly complementary acquisition opportunity in UNIWHEELS AG (“UNIWHEELS”) (UNW-PL) to further our strategic mission to become the global innovative leader in the aluminum wheel industry.
Acquisition
We announced on March 23, 2017 that we commenced a tender offer for 100% of the outstanding shares of UNIWHEELS. This tender offer commenced with an agreement with the owner of 61% of the outstanding UNIWHEELS shares, UNIWHEELS Holdings (Malta) Ltd. (“UNIWHEELS Malta”), which has irrevocably agreed to tender its shares. The tender offer is not conditioned on receipt of any antitrust approvals. The aggregate equity purchase price, assuming all outstanding shares are tendered, is anticipated currently to be approximately $715 million. The transaction is conditioned on us acquiring at least 75% of the total outstanding shares of UNIWHEELS through the tender offer.
21
UNIWHEELS is one of the leading manufacturers of aluminum wheels for passenger cars and light-duty vehicles in Europe and is one of the few technological leaders in the worldwide aluminum wheel industry. UNIWHEELS is the third largest supplier of OEM wheels to the European automotive industry as well as the market-leading manufacturer of alloy wheels for the automotive aftermarket in Europe. The aftermarket wheels include the well-known brands ATS, RIAL, ALUTEC and ANZIO. UNIWHEELS has four production facilities, three of which are located in Poland and one is in Germany.
The combination of Superior and UNIWHEELS will create what we estimate will be the world’s second largest producer of aluminum wheels for the automotive market. With almost no current overlap of customers, the combined company will have a much broader customer mix, as well as significant participation in two of the largest automotive markets in the world represented by North America and Europe. We expect to leverage manufacturing processes, product design and engineering capabilities of both companies to accelerate achievement of operational excellence to serve the market and enhance profitability. A basic profile comparing Superior and UNIWHEELS is shown below.
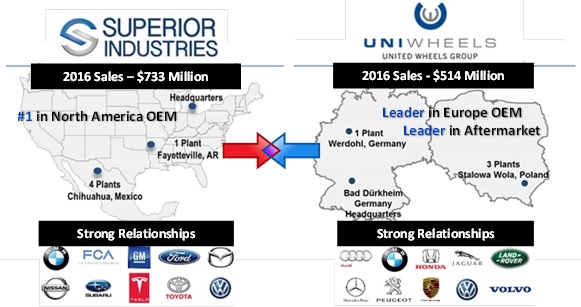
Note: Uniwheels annual report sales are 464 Euros which translates to approximately $514 million U.S. dollars.
First Quarter Overview
As reported by Ward's Automotive Group, North American automotive vehicle production increased 1.5 percent in the first quarter of 2017 in comparison to the 5.0 percent increase in the prior year. Our sales and profitability for the first quarter were lower than in the same period of 2016 but exceeded 2015 results. During the first quarter of 2017, we experienced a 10.6 percent decline in unit volume compared to the first quarter of 2016, partially reflective of the overall industry trend and also timing of activity at the wheel program level. Our overall volume decline was in contrast to the industry trends due to the timing of demand for wheels for newer vehicle programs like the Chevrolet Malibu, while certain programs like the Town and Country ended. New customer programs in the current quarter that we did not have in the prior year's quarter included the Nissan Kicks/Extrem and Subaru Impreza. These programs have helped to partially offset the decreasing volume of the programs from the comparable period last year.
A trend of improving profitability through the first half of 2016 was reversed in the second half of 2016 due to production inefficiencies and expedited freight charges incurred primarily at one of our plants. During the first quarter of 2017, these production issues were resolved to the extent that expedited freight costs during the quarter were almost eliminated. However, the year-over-year comparison of first quarter cost performance at our plants still was weaker overall. The company also incurred $7.3 million of costs associated with the acquisition of UNIWHEELS. Reflective of these cost factors and lower sales volume, income from operations for the first quarter of 2017 declined $14.8 million and net income was $11.4 million lower. Excluding the acquisition related cost the Adjusted EBITDA was $9.0 million lower than the prior year. Adjusted EBITDA is a key measure that is not calculated in accordance with GAAP. See "Non-GAAP Financial Measures."
22
We continue to invest in new manufacturing processes targeting the more sophisticated finishes and larger diameter products which typically have more value. As part of our strategy to provide our customers with premium finishes, we continue to move forward with the construction of our physical vapor deposition ("PVD") finishing facility that is located next to one of our already existing facilities. PVD is a finishing method that creates bright chrome-like finishes that are produced with an environmentally safe process. The addition of PVD wheel coating capability and capacity will be completed during 2017 and will be operational in 2018. The total anticipated expenditure on the PVD expansion is $30.0 million. Because the majority of our customer programs are planned two or three years in advance, the upgrade of our product portfolio will occur over time.
Listed in the table below are several key indicators we use to monitor our financial condition and operating performance.
Results of Operations
Thirteen Weeks Ended | ||||||||||||
Selected data | March 26, 2017 | March 27, 2016 | Change | |||||||||
(Dollars in thousands, except per share amounts) | ||||||||||||
Net sales | $ | 174,220 | $ | 186,065 | $ | (11,845 | ) | |||||
Value added sales (1) | $ | 95,461 | $ | 102,339 | $ | (6,878 | ) | |||||
Gross profit | $ | 19,204 | $ | 27,715 | $ | (8,511 | ) | |||||
Percentage of net sales | 11.0 | % | 14.9 | % | (3.9 | )% | ||||||
Income from operations | $ | 3,944 | $ | 18,722 | $ | (14,778 | ) | |||||
Percentage of net sales | 2.3 | % | 10.1 | % | (7.8 | )% | ||||||
Adjusted EBITDA (2) | $ | 19,123 | $ | 28,102 | $ | (8,979 | ) | |||||
Percentage of net sales (2) (3) | 11.0 | % | 15.1 | % | (4.1 | )% | ||||||
Percentage of value added sales (1) (2) (4) | 20.0 | % | 27.5 | % | (7.5 | )% | ||||||
Net income | $ | 3,102 | $ | 14,464 | $ | (11,362 | ) | |||||
Percentage of net sales | 1.8 | % | 7.8 | % | (6.0 | )% | ||||||
Diluted income per share | $ | 0.12 | $ | 0.56 | $ | (0.44 | ) | |||||
Unit shipments in thousands | 2,843 | 3,180 | (337 | ) | ||||||||
(1) Value added sales is a key measure that is not calculated according to GAAP. In the discussion of operating results, we provide information regarding value added sales. Value added sales represents net sales less the value of aluminum and services provided by outside service providers that are included in net sales. As discussed further below, arrangements with our customers allow us to pass on changes in aluminum prices and outside service provider costs; therefore, fluctuations in underlying aluminum prices and the use of outside service providers generally do not directly impact our profitability. Accordingly, value added sales is worthy of being highlighted for the benefit of users of our financial statements. Our intent is to allow users of the financial statements to consider our net sales information both with and without the aluminum and outside service provider cost components thereof. Management utilizes value added sales as a key metric to determine growth of the company because it eliminates the volatility of aluminum prices. See the Non-GAAP Financial Measures section of this quarterly report for a reconciliation of value added sales to net sales.
(2) Adjusted EBITDA is a key measure that is not calculated according to GAAP. Adjusted EBITDA is defined as earnings before interest income and expense, income taxes, depreciation, amortization, acquisition costs, restructuring and other closure costs and impairments of long-lived assets and investments. We use Adjusted EBITDA as an important indicator of the operating performance of our business. We use Adjusted EBITDA in internal financial forecasts and models when establishing internal operating budgets, supplementing the financial results and forecasts reported to our Board of Directors and evaluating short-term and long-term operating trends in our operations. We believe the Adjusted EBITDA financial measure assists in providing a more complete understanding of our underlying operational measures to manage our business, to evaluate our performance compared to prior periods and the marketplace and to establish operational goals. We believe that these non-GAAP financial measures are useful to investors because they allow investors to evaluate the effectiveness of the methodology and information used by management in our financial and operational decision-making. Adjusted EBITDA is a non-GAAP financial measure and should not be considered
23
in isolation or as a substitute for financial information provided in accordance with GAAP. This non-GAAP financial measure may not be computed in the same manner as similarly titled measures used by other companies. See the Non-GAAP Financial Measures section of this quarterly report for a reconciliation of our Adjusted EBITDA to net income.
(3) Adjusted EBITDA: Percentage of net sales is a key measure that is not calculated according to GAAP. Adjusted EBITDA as a percentage of net sales is defined as Adjusted EBITDA divided by net sales. See the Non-GAAP Financial Measures section of this quarterly report for a reconciliation of Adjusted EBITDA.
(4) Adjusted EBITDA: Percentage of value added sales is a key measure that is not calculated according to GAAP. Adjusted EBITDA as a percentage of value added sales is defined as Adjusted EBITDA divided by value added sales. See the Non-GAAP Financial Measures section of this quarterly report for a reconciliation of Adjusted EBITDA and value added sales.
Net Sales
The following table summarizes the impact that volume, aluminum and sales mix and other had on the change in sales from 2016 to 2017:
(Dollars in thousands) | Thirteen Weeks Ended | |||
Period ending March 27, 2016 | $ | 186,065 | ||
Volume | (19,644 | ) | ||
Aluminum prices | 6,251 | |||
Sales mix and other | 1,548 | |||
Period ending March 26, 2017 | $ | 174,220 | ||
Net sales for the first quarter of 2017 decreased by $11.8 million from the comparable period a year ago. The decrease in net sales primarily reflected a significant decline in unit shipments offset partially by an increase in the value of aluminum. The largest unit shipment decreases were for Ford, FCA and GM with offsetting increases for Toyota and certain other international customers. Value added sales declined $6.9 million to $95.5 million in the first quarter of 2017 due to the decrease in unit shipments. The average selling price on value added sales of our wheels increased 4.4 percent, reflective of stronger product mix primarily due to an increase in average diameter of wheels sold.
Geographic Sales | ||||||||||||
Thirteen Weeks Ended | ||||||||||||
March 26, 2017 | March 27, 2016 | Change | ||||||||||
(Dollars in thousands) | ||||||||||||
Selected data | ||||||||||||
U.S. Operational sales | $ | 33,731 | $ | 37,396 | $ | (3,665 | ) | |||||
Mexico Operational sales | 140,489 | 148,669 | (8,180 | ) | ||||||||
Net sales | $ | 174,220 | $ | 186,065 | $ | (11,845 | ) | |||||
U.S. Operations
In the first quarter of 2017, net sales of our U.S. plant decreased due to a 14.3 percent unit decline in comparison to the first quarter of 2016. The decline in unit sales reflects the overall reduction in unit shipments for the company as well as a shift of production from our U.S. plant to our plants in Mexico. A higher aluminum value increased revenues by approximately $1.3 million in 2017 when compared to 2016.
Mexico Operations
Sales decreased due to lower unit shipments in the current year period, offset partially by an increase in the value of aluminum. Unit shipments declined 9.8 percent in the first quarter of 2017, contributing $14.5 million to the revenue decrease. Higher
24
aluminum value increased sales by approximately $5.0 million in the first quarter of 2017 when compared to the first quarter of 2016.
Customer Comparisons
As reported by Ward's Automotive Group, North American production of passenger cars, light trucks and cross-over vehicles in the first quarter of 2017 increased approximately 1.5 percent compared to the same quarter in the previous year, while our unit wheel shipments decreased 10.6 percent for the comparable period. The overall increase in North American light vehicle production included a 5.1 percent increase in the light-duty truck, an 8.9 percent increase in the cross-over category and a 7.0 percent decrease for passenger cars. Comparing the same time periods for Superior, our shipments of passenger car wheels decreased 16.2 percent and light-duty truck wheels decreased 7.9 percent.
OEM unit shipment composition by customer was as follows:
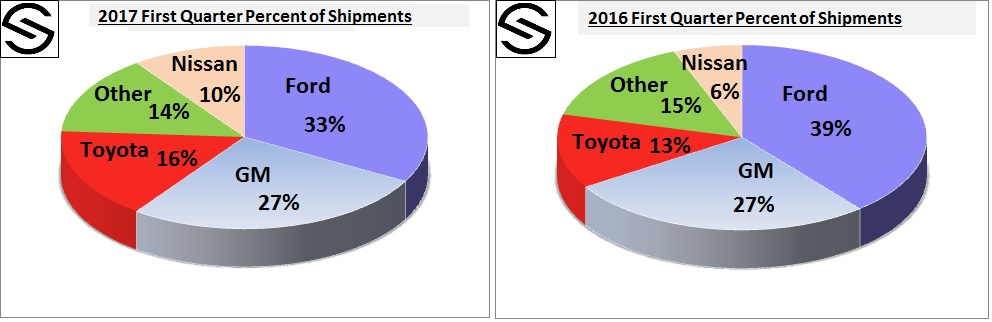
At the customer level, unit shipments to Ford in the first quarter of 2017 were 24.6 percent lower when compared to the first quarter last year, as decreases occurred in both light-duty truck and passenger car wheel shipments. At the program level, the major unit shipment decreases were for the F-Series, Fusion, Escape, Fiesta and Focus and were partially offset by higher shipments for the Lincoln Continental, MKZ, and MKC.
Shipments to GM in the first quarter of 2017 declined 9.9 percent compared to the first quarter of 2016, as lower shipments for passenger car programs were partially offset by an increase in light-duty truck wheel shipments. The largest shipment decreases were for the Chevy Malibu and the Cadillac SRX. The decreases were partially offset by unit shipment increases for the K2XX vehicle platform, which includes certain pick-up trucks and full-size sport utility vehicles, as well as for the Chevy Traverse.
Shipments to Toyota in the first quarter of 2017 increased 7.5 percent compared to the first quarter last year, as higher shipments of light-duty truck wheels were offset partially by a decline in shipments of passenger car wheels. The major unit shipment increases were for the Highlander, Tacoma and Sienna. The increases were partially offset by lower unit shipments for the Avalon and Camry.
Shipments to Nissan and other customers in the first quarter of 2017 increased 28.6 percent compared to the first quarter of 2016, due to higher shipments for both passenger car and light-duty truck programs. At the program level, the largest unit shipment increases were for the Nissan Kicks/Extrem, Subaru Impreza and Nissan Altima, offset partially by unit shipment decreases for the Chrysler Town & Country, Subaru Legacy/Outback and Volkswagen Jetta.
Cost of Sales
Aluminum, natural gas and other direct material costs are a significant component of our cost to manufacture wheels. These costs are substantially the same for all of our plants since many common suppliers service both our U.S. and Mexico operations. Consolidated cost of sales includes costs for both our U.S. and international operations, which are principally our wheel manufacturing operations in Mexico, and certain costs that are not allocated to a specific operation. These unallocated expenses include corporate services that are primarily incurred in the U.S. but are not charged directly to our worldwide operations, such as engineering services for wheel program development and manufacturing support, as well as environmental and other governmental compliance services.
25
Consolidated cost of sales decreased $3.3 million compared to cost of sales in the first quarter of 2016. Cost of sales in 2017 mainly reflects lower unit shipments, partially offset by an increase in aluminum prices, higher costs related to energy and higher costs for repairs and supplies. The increase in aluminum cost is driven by higher market prices and is mainly passed through to the customer. Higher costs for repairs and maintenance and supplies and small tools reflect our continued focus on improving equipment reliability.
U.S. Operations
Cost of sales for our U.S. operations decreased by $5.7 million, or 13 percent, in the first quarter of 2017 as compared to the first quarter of 2016 primarily due to the impact of reduced unit shipments, offset partially by rising aluminum prices. The decline in cost of sales reflects the overall decline in unit shipments as well as a shift in production to our facilities in Mexico.
Mexico Operations
Cost of sales for our Mexico operations in the first quarter of 2017 increased by $2.4 million, or 2.1 percent, when compared to the first quarter of 2016, due to higher aluminum prices, energy costs, repairs and maintenance and supplies and small tools which were partially offset by a decrease in unit shipments. Higher aluminum prices in 2017 resulted in a $4.7 million rise in comparison to the first quarter of 2016. Energy costs increased following the electricity tariffs instituted by the Federal Electricity Commission in Mexico commencing in January 2017 for industrial and commercial consumption.
Gross Profit
Thirteen Weeks Ended | |||||||||||
March 26, 2017 | March 27, 2016 | Change | |||||||||
(Dollars in thousands) | |||||||||||
Selected data | |||||||||||
Net sales | $ | 174,220 | $ | 186,065 | $ | (11,845 | ) | ||||
Cost of sales | 155,016 | 158,350 | (3,334 | ) | |||||||
Gross profit | $ | 19,204 | $ | 27,715 | $ | (8,511 | ) | ||||
Percentage of net sales | 11.0 | % | 14.9 | % | |||||||
Consolidated gross profit decreased $8.5 million for the first quarter of 2017 compared to the same period last year. The decrease in gross profit was due mainly to the decrease in unit shipments, combined with increases in energy, repair and maintenance, supplies and small tools.
The cost of aluminum is a component of our selling prices to OEM customers and a significant component of the overall cost of a wheel. The price for aluminum we purchase is adjusted monthly based primarily on changes in certain published market indices. Our selling prices are adjusted periodically based upon aluminum market price changes, but the timing of such adjustments is based on specific customer agreements and can vary from monthly to quarterly. Even if aluminum selling price adjustments were to perfectly match changes in aluminum purchase prices, an increasing aluminum price will result in a declining gross margin percentage - i.e., the same gross profit dollars divided by increased sales dollars equals a lower gross profit percentage. The opposite is true in periods during which the price of aluminum decreases. In addition, although our sales are continuously adjusted for aluminum price changes, these adjustments rarely will match exactly the changes in our aluminum purchase prices and cost of sales. As estimated by the company, the favorable impact on gross profit related to such differences in timing of aluminum adjustments was approximately $1.0 million in the first quarter of 2017, as compared to a favorable impact of $1.4 million in the same period in 2016.
Selling, General and Administrative Expenses
Selling, general and administrative expenses for the first quarter of 2017 increased to $15.3 million, or 8.8 percent of net sales, from $9.0 million, or 4.8 percent of net sales, for the comparable period in 2016. The increase primarily reflects a $7.0 million increase in professional fees reflective of the acquisition support costs.
Income from Operations
As described in the discussion of cost of sales above, aluminum, natural gas and other direct material costs are substantially the same for all our plants since many common suppliers service both our U.S. and Mexico operations. In addition, our operations in the U.S. and Mexico sell to the same customers, utilize the same marketing and engineering resources, have interchangeable
26
manufacturing processes and provide the same basic end product. Consolidated income from operations includes results for both our U.S. and international operations, which are principally our wheel manufacturing operations in Mexico, and certain costs that are not allocated to a specific operation. These unallocated expenses include corporate services that are primarily incurred in the U.S. but are not charged directly to our worldwide operations, such as selling, general and administrative expenses, engineering services for wheel program development and manufacturing support, environmental and other governmental compliance services.
Consolidated income from operations was $3.9 million, or 2.3 percent of net sales, in the first quarter of 2017, a decrease of $14.8 million from operating income of $18.7 million, or 10.1 percent of net sales, in the comparable period in 2016. The decrease was due mainly to the lower gross margin and the $7.0 million of acquisition costs as previously described.
Included below are the major items that impacted income from operations for our U.S. and Mexico operations during the first quarter of 2017.
U.S. Operations
Income from our U.S. operations in the first quarter of 2017 declined $6.6 million when compared to the first quarter of last year. Gross profit improved $1.5 million over the comparable period in 2016 and was more than offset by the acquisition costs.
Mexico Operations
Income from our Mexico operations decreased $8.2 million in the first quarter of 2017 as compared to the first quarter of 2016 reflective of the $8.2 million gross profit decline.
U.S. versus Mexico Shipments
During the first quarter of 2017, wheels shipped by our Mexico and U.S. operations accounted for 83 percent and 17 percent, respectively, of our total shipments. For the first quarter of 2016, wheels shipped by our Mexico and U.S. operations accounted for 82 percent and 18 percent, respectively, of our total shipments. The shift of shipments to the Company’s Mexico facilities is largely attributable to the change in the overall production capacity footprint and resulting realignment of production to our Mexico facilities.
Interest Income, net and Other Income (Expense), net
Net interest income for the first quarter of 2017 was an expense of $0.3 million and for the first quarter of 2016, net interest income was income of less than $0.1 million. Interest expense increased in the first quarter of 2017 due to acquisition-related activities.
Net other income (expense) was an expense of $0.3 million in the first quarter of 2017 and income of $0.3 million in the first quarter of 2016. Foreign exchange gains and (losses) included in net other income (expense) were exchange losses of $0.4 million in the first quarter of 2017 and exchange gains of $0.2 million in the first quarter of 2016.
Income Taxes
The income tax expense for the first quarter ended March 26, 2017 was $0.2 million, representing an effective income tax expense of 6.0 percent. The effective tax rate for the thirteen weeks ended March 26, 2017 was lower than the statutory rate due to earnings in countries that are taxed below the U.S. statutory rate and a discrete tax benefit due to a recognition of transaction costs incurred during the first quarter of 2017 related to the tender offer for UNIWHEELS AG.
The income tax provision for the first quarter ended March 27, 2016 was $4.6 million, representing an effective income tax rate of 24.0 percent. The effective tax rate for the thirteen weeks ended March 27, 2016 was lower than the statutory rate due to the change in the mix of income before taxes for entities included in our effective tax rate calculation and the effect of the business restructuring to realign our operations, which was implemented in the fourth quarter of 2015.
Net Income
Net income in the first quarter of 2017 was $3.1 million, or $0.12 per diluted share, compared to net income in the first quarter of 2016 of $14.5 million, or $0.56 per diluted share.
27
Financial Condition, Liquidity and Capital Resources
Our sources of liquidity primarily include cash, cash equivalents and short-term investments and net cash provided by operating activities and, from time to time, other external sources of funds. Working capital (current assets minus current liabilities) and our current ratio (current assets divided by current liabilities) were $159.2 million and 2.7:1, respectively, at March 26, 2017, versus $168.1 million and 3.0:1 at December 31, 2016. As of March 26, 2017, our cash, cash equivalents and short-term investments totaled $29.6 million compared to $58.5 million at December 31, 2016.
Our working capital requirements, investing activities and cash dividend payments have historically been funded from internally generated funds, proceeds from the exercise of stock options or existing cash, cash equivalents and short-term investments, and we believe these sources will continue to meet our capital requirements in the foreseeable future.
As part of our commitment to enhancing shareholder value, we have been repurchasing our common stock. Beginning in 2013 through the end of our fiscal year 2016, we have repurchased 3,608,401 shares for a cost of $70.3 million. Thus far in 2017, we have repurchased 215,841 shares for a cost of $5.0 million.
The following table presents a summary of the net decrease in cash and cash equivalents in the periods presented:
(Dollars in thousands) | Thirteen Weeks Ended | |||||||||||
March 26, 2017 | March 27, 2016 | Change | ||||||||||
Net cash (used in) provided by operating activities | $ | (1,577 | ) | $ | 16,041 | $ | (17,618 | ) | ||||
Net cash used in investing activities | (16,821 | ) | (5,909 | ) | (10,912 | ) | ||||||
Net cash used in financing activities | (10,480 | ) | (16,425 | ) | 5,945 | |||||||
Effect of exchange rate changes on cash | (80 | ) | (219 | ) | 139 | |||||||
Net decrease in cash and cash equivalents | $ | (28,958 | ) | $ | (6,512 | ) | $ | (22,446 | ) | |||
Operating Activities
Net cash used by operating activities was $1.6 million for the thirteen week period ended March 26, 2017, compared to net cash provided by operating activities of $16.0 million for the comparable period a year ago. The decrease in cash flow provided by operating activities was mainly due to an $11.4 million lower net income and a higher use of cash for inventories of $17.7 million in the first three months of 2017 compared to a $2.1 million use in the comparable period a year ago. Offsetting the major decreases was a source of cash for other asset and liabilities of $7.5 million in the first three months of 2017 compared to a $5.4 million use of cash in the comparable period a year ago.
Investing Activities
Net cash used in investing activities was $16.8 million for the first three months of 2017 compared to $5.9 million in the comparable period last year. Net cash used in investing activities was higher in 2017 due to increased capital investments.
Financing Activities
Financing activities during the first three months of 2017 consisted of the payment of cash dividends on our common stock totaling $4.5 million and the repurchase of our common stock for cash totaling $5.0 million. Net cash used in financing activities was a higher use of cash in 2016 due to $11.9 million in common stock repurchases.
Non-GAAP Financial Measures
In this quarterly report, we discuss two important measures that are not calculated according to U.S. GAAP, value added sales and Adjusted EBITDA.
Value added sales is a key measure that is not calculated according to U.S. GAAP. In the discussion of operating results, we provide information regarding value added sales. Value added sales represent net sales less the value of aluminum and services provided by outside service providers that are included in net sales. As discussed further below, arrangements with our customers allow us to pass on changes in aluminum prices and outside service provider costs; therefore, fluctuations in underlying aluminum
28
price and the use of outside service providers generally does not directly impact our profitability. Accordingly, value added sales is worthy of being highlighted for the benefit of users of our financial statements. Our intent is to allow users of the financial statements to consider our net sales information both with and without the aluminum and outside service provider cost components thereof. Management utilizes value added sales as a key metric to determine growth of the company because it eliminates the volatility of aluminum prices.
Thirteen Weeks Ended | |||||||
March 26, 2017 | March 27, 2016 | ||||||
(Dollars in thousands) | |||||||
Net Sales | $ | 174,220 | $ | 186,065 | |||
Less, aluminum value and outside service provider costs | (78,759 | ) | (83,726 | ) | |||
Value added sales | $ | 95,461 | $ | 102,339 | |||
Adjusted EBITDA is a key measure that is not calculated according to U.S. GAAP. Adjusted EBITDA is defined as earnings before interest income and expense, income taxes, depreciation, amortization, acquisition costs, restructuring charges, and other closure costs and impairments of long-lived assets and investments. We use Adjusted EBITDA as an important indicator of the operating performance of our business. Adjusted EBITDA is used in our internal forecasts and models when establishing internal operating budgets, supplementing the financial results and forecasts reported to our Board of Directors and evaluating short-term and long-term operating trends in our operations. We believe the Adjusted EBITDA financial measure assists in providing a more complete understanding of our underlying operational measures to manage our business, to evaluate our performance compared to prior periods and the marketplace, and to establish operational goals. Adjusted EBITDA is a non-GAAP financial measure and should not be considered in isolation or as a substitute for financial information provided in accordance with U.S. GAAP. This non-GAAP financial measure may not be computed in the same manner as similarly titled measures used by other companies.
Adjusted EBITDA as a percentage of net sales is a key measure that is not calculated according to U.S. GAAP. Adjusted EBITDA as a percentage of net sales is defined as Adjusted EBITDA divided by net sales.
Adjusted EBITDA as a percentage of value added sales is a key measure that is not calculated according to U.S. GAAP. Adjusted EBITDA as a percentage of value added sales is defined as Adjusted EBITDA divided by value added sales.
The following table reconciles our net income, the most directly comparable GAAP financial measure, to our Adjusted EBITDA:
Thirteen Weeks Ended | |||||||
March 26, 2017 | March 27, 2016 | ||||||
(Dollars in thousands) | |||||||
Net income | $ | 3,102 | $ | 14,464 | |||
Interest expense (income), net | 296 | (32 | ) | ||||
Income tax provision | 198 | 4,558 | |||||
Depreciation | 8,370 | 8,643 | |||||
Acquisition support costs | 6,962 | — | |||||
Closure costs (excluding accelerated depreciation) | 195 | 469 | |||||
Adjusted EBITDA | $ | 19,123 | $ | 28,102 | |||
Adjusted EBITDA as a percentage of net sales | 11.0 | % | 15.1 | % | |||
Adjusted EBITDA as a percentage of value added sales | 20.0 | % | 27.5 | % | |||
Critical Accounting Estimates
The preparation of consolidated financial statements in conformity with U.S. GAAP requires management to apply significant judgment in making estimates and assumptions that affect amounts reported therein, as well as financial information included in
29
this Management’s Discussion and Analysis of Financial Condition and Results of Operations. These estimates and assumptions, which are based upon historical experience, industry trends, terms of various past and present agreements and contracts, and information available from other sources that are believed to be reasonable under the circumstances, form the basis for making judgments about the carrying values of assets and liabilities that are not readily apparent through other sources. There can be no assurance that actual results reported in the future will not differ from these estimates, or that future changes in these estimates will not adversely impact our results of operations or financial condition.
Risk Management
We are subject to various risks and uncertainties in the ordinary course of business due, in part, to the competitive global nature of the industry in which we operate, changing commodity prices for the materials used in the manufacture of our products and the development of new products.
We have operations in Mexico with sale and purchase transactions denominated in both pesos and dollars. The peso is the functional currency of certain of our operations in Mexico. The settlement of accounts receivable and accounts payable for these operations requires the transfer of funds denominated in the Mexican peso, the value of which increased 8.8 percent in relation to the U.S. dollar in the three months of 2017. Foreign currency transaction losses totaled $0.4 million in the three months of 2017 and foreign currency translation gains totaled $0.2 million during the three months of 2016. All transaction gains and losses are included in other income (expense) in the condensed consolidated statements of operations.
As it relates to foreign currency translation gains and losses, however, since 1990, the Mexican peso has experienced periods of relative stability followed by periods of major declines in value. The impact of these changes in value relative to our Mexico operations resulted in a cumulative unrealized translation loss at March 26, 2017 of $96.1 million. Translation gains and losses are included in other comprehensive income in the condensed consolidated statements of comprehensive income.
When market conditions warrant, we may enter into purchase commitments to secure the supply of certain commodities used in the manufacture of our products, such as aluminum, natural gas and other raw materials. We currently have no purchase commitments in place for the delivery of aluminum, natural gas or other raw materials in 2017.
Item 3. Quantitative and Qualitative Disclosures About Market Risk
Foreign Currency. A significant portion of our business operations are conducted in Mexico. As a result, we have a certain degree of market risk with respect to our cash flows due to changes in foreign currency exchange rates when transactions are denominated in currencies other than our functional currency, including inter-company transactions.
In accordance with our corporate risk management policies, we may enter into foreign currency forward and option contracts with financial institutions to protect against foreign exchange risks associated with certain existing assets and liabilities, certain firmly committed transactions and forecasted future cash flows. We have implemented a program to hedge a portion of our material foreign exchange exposures, for up to approximately 33 months. However, we may choose not to hedge certain foreign exchange exposures for a variety of reasons including, but not limited to, accounting considerations and the prohibitive economic cost of hedging particular exposures. We do not use derivative contracts for trading, market-making, or speculative purposes. For additional information on our derivatives, see Note 5, "Derivative Financial Instruments" in Notes to Condensed Consolidated Financial Statements in Item 1.
At March 26, 2017, the fair value liability of foreign currency exchange derivatives was $10.2 million. The potential loss in fair value for such financial instruments from a 10 percent adverse change in quoted foreign currency exchange rates would be $14.3 million at March 26, 2017.
During the first three months of 2017, the Mexican peso to U.S. dollar exchange rate averaged 20.52 pesos to $1.00. Based on the balance sheet at March 26, 2017 the value of net assets for our operations in Mexico was 2,465 million pesos. Accordingly, a 10 percent change in the relationship between the peso and the U.S. dollar may result in a translation impact of between $10.9 million and $13.4 million, which would be recognized in other comprehensive income.
Our business requires us to settle transactions between currencies in both directions - i.e., peso to U.S. dollar and vice versa. To the greatest extent possible, we attempt to match the timing of transaction settlements between currencies to create a “natural hedge.” For the first three months of 2017, we had a $0.4 million net foreign exchange transaction loss related to the peso. Based on the current business model and levels of production and sales activity, the net imbalance between currencies depends on specific
30
circumstances. While changes in the terms of the contracts with our customers will be creating an imbalance between currencies that we are hedging with foreign currency forward contracts, there can be no assurances that our hedging program will effectively offset the impact of the imbalance between currencies or that the net transaction balance will not change significantly in the future.
Commodity Purchase Commitments. When market conditions warrant, we enter into purchase commitments to secure the supply of certain commodities used in the manufacture of our products, such as aluminum, natural gas and other raw materials. However, we do not enter into derivatives or other financial instrument transactions for speculative purposes. At March 26, 2017, we had no purchase commitments in place for the delivery of aluminum, natural gas or other raw materials in 2017.
Also see Item 7A - "Quantitative and Qualitative Disclosures About Market Risk" in Part II of our 2016 Annual Report on Form 10-K and Item 2 - "Management’s Discussion and Analysis of Financial Condition and Results of Operations – Risk Management” in this Quarterly Report on Form 10-Q.
Item 4. Controls and Procedures
Evaluation of Disclosure Controls and Procedures
The company's management, with the participation of the Chief Executive Officer and Chief Financial Officer, evaluated the effectiveness of the company's disclosure controls and procedures (as defined in Rules 13a-15(e) and 15d-15(e) under the Exchange Act) as of March 26, 2017. Our disclosure controls and procedures are designed to ensure that information required to be disclosed in reports we file or submit under the Exchange Act is recorded, processed, summarized and reported within the time periods specified in SEC rules and forms and that such information is accumulated and communicated to our management, including our Chief Executive Officer and Chief Financial Officer, to allow timely decisions regarding required disclosures.
Based on this evaluation, our Chief Executive Officer and Chief Financial Officer concluded that, as of March 26, 2017, our disclosure controls and procedures were effective.
Changes in Internal Control Over Financial Reporting
There has been no change in our internal control over financial reporting during the fiscal quarter ended March 26, 2017 that has materially affected, or is reasonably likely to materially affect, our internal control over financial reporting.
31
PART II
OTHER INFORMATION
Item 1. Legal Proceedings
We are party to various legal and environmental proceedings incidental to our business. Certain claims, suits and complaints arising in the ordinary course of business have been filed or are pending against us. Based on facts now known, we believe all such matters are adequately provided for, covered by insurance, are without merit and/or involve such amounts that would not materially adversely affect our consolidated results of operations, cash flows or financial position.
Item 1A. Risk Factors
The following risk factor supplements the risk factors disclosed in Part I, Item 1A “Risk Factors” in our Annual Report on Form 10-K for the year ended December 25, 2016.
Failure to complete the acquisition of UNIWHEELS, or once completed, failure to successfully integrate the UNIWHEELS business, and the additional indebtedness incurred to finance the UNIWHEELS acquisition, could adversely impact our stock price and future business and operations.
We announced on March 23, 2017 that we commenced a tender offer for 100% of the outstanding shares of UNIWHEELS. This tender offer commenced with an agreement with the owner of 61% of the outstanding UNIWHEELS shares, UNIWHEELS Holdings (Malta) Ltd. (“UNIWHEELS Malta”), which has irrevocably agreed to tender its shares. The tender offer is not conditioned on receipt of any antitrust approvals. The aggregate equity purchase price, assuming all outstanding shares are tendered, is anticipated currently to be approximately $715 million. The transaction is conditioned on Superior being able to acquire at least 75% of the total outstanding shares of UNIWHEELS through the tender offer. If the acquisition of UNIWHEELS is not completed for any reason, we may incur acquisition-related expenses without realizing the expected benefits, and the price of our common stock may decline to the extent that the current market price reflects an assumption that the acquisition will be completed.
Our integration of the UNIWHEELS business into our operations will be a complex and time-consuming process that may not be successful. The primary areas of focus for successfully combining the business of UNIWHEELS with our operations may include, among others: retaining and integrating management and other key employees; integrating information, communications and other systems; and managing the growth of the combined company.
Even if we successfully integrate the business of UNIWHEELS into our operations, there can be no assurance that we will realize the anticipated benefits. We are seeking to acquire UNIWHEELS with the expectation that the acquisition will result in various benefits for the combined company including, among others, business and growth opportunities and significant synergies. Increased competition and/or deterioration in business conditions may limit our ability to expand this business. As such, we may not be able to realize the synergies, goodwill, business opportunities and growth prospects anticipated in connection with the acquisition.
If we consummate the acquisition of UNIWHEELS, we expect to have consolidated indebtedness that will be greater than our indebtedness prior to the acquisition. The increased indebtedness and higher debt-to-equity ratio of our company may have the effect, among other things, of reducing our flexibility to respond to changing business and economic conditions and increasing borrowing costs. Our level of indebtedness could have important consequences. For example, it may: require a portion of our cash flow from operations for the payment of principal of, and interest on, our indebtedness, thus reducing our ability to use our cash flow to fund working capital, capital expenditures and general corporate requirements; and limit our ability to obtain additional financing to fund working capital, capital expenditures, additional acquisitions or general corporate requirements, particularly if the ratings assigned to our debt securities by rating organizations are revised downward.
Item 2. Unregistered Sales of Equity Securities and Use of Proceeds
Recent Sales of Unregistered Securities
During the first three months of 2017, there were no sales of unregistered securities.
32
Purchases of Equity Securities by the Issuer and Affiliated Purchasers
The following table shows our purchases of our common stock during the first quarter of 2017:
Total Number of Shares Purchased | Average Price Paid per Share | Total Number of Shares Purchased as Part of Publicly Announced Plans and Programs | Maximum Approximate Dollar Value of Shares That May Yet be Purchased Under the Plans or Programs | ||||||||||
(Thousands of dollars, except per share amounts) | |||||||||||||
December 26, 2016 - January 22, 2017 | 9,180 | $ | 24.41 | 9,180 | |||||||||
January 23, 2017 - February 19, 2017 | 134,370 | $ | 23.17 | 134,370 | |||||||||
February 20, 2017 - March 26, 2017 | 72,291 | $ | 23.19 | 72,291 | |||||||||
Total | 215,841 | 215,841 | $ | 34,547 | |||||||||
33
Item 6. Exhibits
2.1 | Undertaking Agreement, dated March 23, 2017, between Superior Industries International, Inc. and Uniwheels Holding (Malta) Ltd. (incorporated by reference to Exhibit 2.1 to the Registrant's Form 8-K filed on March 24, 2017). | |
2.2 | Combination Agreement, dated March 23, 2017, between Superior Industries International, Inc. and Uniwheels AG (incorporated by reference to Exhibit 2.2 to the Registrant's Form 8-K filed on March 24, 2017). | |
10.1 | Indemnification Agreement, dated March 23, 2017, between Superior Industries International, Inc. and Uniwheels Holding (Malta) Ltd. (incorporated by reference to Exhibit 10.1 to the Registrant's Form 8-K filed on March 24, 2017). | |
10.2 | Investment Agreement, dated March 22, 2017, between Superior Industries International, Inc. and TPG Growth III Sidewall, L.P. (incorporated by reference to Exhibit 10.2 to the Registrant's Form 8-K filed on March 24, 2017). | |
10.3 | Credit Agreement, dated March 22, 2017, among Superior Industries International, Inc., Citibank, N.A., as Administrative Agent, and the Lenders party thereto (incorporated by reference to Exhibit 10.3 to the Registrant's Form 8-K filed on March 24, 2017). | |
10.4 | Bridge Credit Agreement, dated March 22, 2017, among Superior Industries International, Inc., Citibank, N.A., as Administrative Agent, and the Lenders party thereto (incorporated by reference to Exhibit 10.4 to the Registrant's Form 8-K filed on March 24, 2017). | |
31.1 | Certification of Donald J. Stebbins, Chief Executive Officer and President, Pursuant to Exchange Act Rules 13a-14(a) and 15d-14(a), as Adopted Pursuant to Section 302(a) of the Sarbanes-Oxley Act of 2002 (filed herewith). | |
31.2 | Certification of Kerry A. Shiba, Executive Vice President and Chief Financial Officer, Pursuant to Exchange Act Rules 13a-14(a) and 15d-14(a), as Adopted Pursuant to Section 302(a) of the Sarbanes-Oxley Act of 2002 (filed herewith). | |
32.1 | Certification of Donald J. Stebbins, Chief Executive Officer and President, and Kerry A. Shiba, Executive Vice President and Chief Financial Officer, Pursuant to 18 U.S.C. Section 1350, as Adopted Pursuant to Section 906 of the Sarbanes-Oxley Act of 2002 (furnished herewith). | |
101 | Interactive data file (furnished electronically herewith pursuant to Rule 406T of Regulation S-T). | |
34
SIGNATURES
Pursuant to the requirements of the Securities Exchange Act of 1934, the registrant has duly caused this report to be signed on its behalf by the undersigned thereunto duly authorized.
SUPERIOR INDUSTRIES INTERNATIONAL, INC.
(Registrant)
Date: | April 28, 2017 | /s/ Donald J. Stebbins | ||
Donald J. Stebbins Chief Executive Officer and President | ||||
Date: | April 28, 2017 | /s/ Kerry A. Shiba | ||
Kerry A. Shiba Executive Vice President and Chief Financial Officer | ||||
35