Attached files
| file | filename |
|---|---|
| 8-K - 8-K - Catalent, Inc. | a8-krefdmaterialsdraft6jan.htm |

35th Annual J.P. Morgan
Healthcare Conference
John Chiminski
Chairman & CEO
January 9, 2017

1
Forward Looking Statements
This presentation contains both historical and forward-looking statements. All statements other than statements of historical fact are, or
may be deemed to be, forward-looking statements within the meaning of Section 27A of the Securities Act of 1933, as amended, and
Section 21E of the Securities Exchange Act of 1934, as amended. These forward-looking statements generally can be identified by the use
of statements that include phrases such as “believe,” “expect,” “anticipate”, “intend”, “estimate”, “plan”, “project”, “foresee”, “likely”,
“may”, “will”, “would” or other words or phrases with similar meanings. Similarly, statements that describe our objectives, plans or goals
are, or may be, forward-looking statements. These statements are based on current expectations of future events. If underlying
assumptions prove inaccurate or unknown risks or uncertainties materialize, actual results could vary materially from our expectations and
projections. Some of the factors that could cause actual results to differ include, but are not limited to, the following: general industry
conditions and competition; product or other liability risk inherent in the design, development, manufacture and marketing of our offerings;
inability to enhance our existing or introduce new technology or services in a timely manner; economic conditions, such as interest rate and
currency exchange rate fluctuations; technological advances and patents attained by competitors; and our substantial debt and debt service
requirements that restrict our operating and financial flexibility and impose significant interest and financial costs; or difficulty in integrating
acquisitions into our existing business, thereby reducing or eliminating the anticipated benefits of the acquisition. For a more detailed
discussion of these and other factors, see the information under the caption “Risk Factors” in our Annual Report on Form 10-K for the fiscal
year ended June 30, 2016 filed with the Securities and Exchange Commission. All forward-looking statements in this presentation speak
only as of the date of this presentation or as of the date they are made, and we do not undertake to update any forward-looking statement
as a result of new information or future events or developments unless and to the extent required by law.
Jan 2017 (C) Catalent Inc. 2017 All rights reserved
Non-GAAP Financial Measures
Management measures operating performance based on consolidated earnings from continuing operations before interest expense,
expense/ (benefit) for income taxes and depreciation and amortization and is adjusted for the income or loss attributable to non-
controlling interest (“EBITDA from continuing operations”). EBITDA from continuing operations is not defined under U.S. GAAP and is not a
measure of operating income, operating performance or liquidity presented in accordance with U.S. GAAP and is subject to important
limitations. Management believes these non-GAAP financial measures provide useful supplemental information for its investors’ evaluation
of the Company’s business performance and are useful for period-over-period comparisons of the performance of the Company’s business.

2
Non-GAAP Financial Measures (cont.)
We believe that the presentation of EBITDA from continuing operations enhances an investor’s understanding of our financial performance. We believe this
measure is a useful financial metric to assess our operating performance from period to period by excluding certain items that we believe are not representative of
our core business and we use this measure for business planning purposes. In addition, given the significant investments that we have made in the past in
property, plant and equipment, depreciation and amortization expenses represent a meaningful portion of our cost structure. We believe that EBITDA from
continuing operations will provide investors with a useful tool for assessing the comparability between periods of our ability to generate cash from operations
sufficient to pay taxes, service debt and undertake capital expenditures because it eliminates depreciation and amortization. We present EBITDA from continuing
operations in order to provide supplemental information that we consider relevant for the readers of our financial statements, and such information is not meant to
replace or supersede U.S. GAAP measures. Our definition of EBITDA from continuing operations may differ from similarly titled measures used by other companies.
As changes in exchange rates are an important factor in understanding period-to-period comparisons, we believe the presentation of results on a constant currency
basis in addition to reported results helps improve investors’ ability to understand our operating results and evaluate our performance in comparison to prior
periods. Constant currency information compares results between periods, as if exchange rates had remained constant period-over-period. We use results on a
constant currency basis as one measure to evaluate our performance. We calculate constant currency by calculating current-year results using prior-year foreign
currency exchange rates. We generally refer to such amounts calculated on a constant currency basis as excluding the impact of foreign exchange translation.
These results should be considered in addition to, not as a substitute for, results reported in accordance with GAAP. Results on a constant currency basis, as we
present them, may not be comparable to similarly titled measures used by other companies.
In addition, the Company evaluates the performance of its segments based on segment earnings before non-controlling interest, other (income) expense,
impairments, restructuring costs, interest expense, income tax (benefit)/expense, and depreciation and amortization (“Segment EBITDA”).
Under our credit agreement, our ability to engage in certain activities such as incurring certain additional indebtedness, making certain investments and paying
certain dividends is tied to ratios based on Adjusted EBITDA (which is defined as “Consolidated EBITDA” in the credit agreement). Adjusted EBITDA is based on the
definitions in the our credit agreement, is not defined under U.S. GAAP, and is subject to important limitations. We have included the calculations of Adjusted
EBITDA for the periods presented. Adjusted EBITDA is the covenant compliance measure used in certain covenants under our credit agreement, particularly those
governing debt incurrence and restricted payments. Because not all companies use identical calculations, our presentation of Adjusted EBITDA may not be
comparable to other similarly titled measures of other companies.
The Company does not provide a reconciliation of forward-looking non-GAAP financial measures to their comparable GAAP financial measures because it could not
do so without unreasonable effort due to the unavailability of the information needed to calculate reconciling items and due to the variability, complexity and
limited visibility of the adjusting items that would be excluded from the non-GAAP financial measures in future periods. When planning, forecasting and analyzing
future periods, the Company does so primarily on a non-GAAP basis without preparing a GAAP analysis as that would require estimates for various cash and non-
cash reconciling items that would be difficult to predict with reasonable accuracy. For example, equity compensation expense would be difficult to estimate because
it depends on the company’s future hiring and retention needs, as well as the future fair market value of the company’s common stock, all of which are difficult to
predict and subject to constant change. It is equally difficult to anticipate the need for or magnitude of a presently unforeseen one-time restructuring expense or
the values of end-of-period foreign currency exchange rates. As a result, the Company does not believe that a GAAP reconciliation would provide meaningful
supplemental information about the Company’s outlook.
Jan 2017 (C) Catalent Inc. 2017 All rights reserved

Jan 2017 (C) Catalent Inc. 2017 All rights reserved 3
Every year we reliably supply:
? 70 billion+ doses of 7,000 products
? 1 in every 20 doses taken globally –
Rx and consumer
? 1,000+ customers in 80+ countries
? 165+ new product launches
Working to be the world’s most trusted, reliable and innovative drug
dev’t and delivery partner, operating with a Patient First mindset!
Catalent is the leading global provider of advanced dosage
delivery technologies and drug development solutions

4
Catalent’s Business Segments
Softgel
Technologies
Drug Delivery
Solutions
Clinical Supply
Services
Sales1 $308M
EBITDA2 $53M
EBITDA
Margin 17%
Sales1 $806M
EBITDA2 $215M
EBITDA
Margin 27%
Sales1 $775M
EBITDA2 $164M
EBITDA
Margin 21%
Soft capsules for the pharmaceutical and
consumer health markets
Complex dosage forms and development
solutions for drugs and biologics
Product supply solutions for global
clinical trials of drugs and biologics
Note: All amounts reflect results for Catalent’s fiscal year ended of June 30, 2016 . Dollar amounts are in millions of U.S. dollars. Segment results exclude corporate and unallocated costs.
OptiShell™Vegicaps®Liqui-Gels®
(1) Segment revenues include $40.8M of inter-segment revenue
(2) See Appendix for reconciliation of non-GAAP financial measures to the most directly comparable GAAP measure
#1 Rx
#1 overall
#1 complex oral dose
#1 inhalation
#1 complex BFS
#2 clinical trial supply
Jan 2017 (C) Catalent Inc. 2017 All rights reserved

Jan 2017 5
Market Trends Accelerating Future CDMO Demand
(C) Catalent Inc. 2017 All rights reserved
End-market demand is
strengthening
+2%
2011-’16
CAGR
+6%
2016-’21
forecast
CAGR
All sectors forecast to grow
faster vs last five years
Key growth drivers:
? Biologics +9%, up 1%
? Consumer +4%, up 6%
? VC/small cap +13%, up 11%
R&D pipelines up 50%
over last five years
More than half of R&D spend
now preclin, first in a decade
Key growth drivers:
? Biologics 40%/+11% CAGR
? Small mol. 60%/+7% CAGR
? VC/small cap ~75%
8,441
programs
in 2011
12,489
programs
in 2016
Finished Dose Form
outsourcing growing
~30% volume outsourced
today, ~40% by 2020
? High formulation complexity
? Greater VC/small cap share
? Large co’s – cost pressures,
surges in demand
+7%
o/s FDF
2011-’16
CAGR
+10%
o/s FDF
2016-’20
CAGR
Sources: EvaluatePharma, Pharmaprojects, Frost & Sullivan
Stronger, more diverse
growth – sectors, regions
Growth in all molecule
types for all company types
R&D, manufacturing share
outsourced expanding

Branded
Drugs
40%
Generics
12%
Biologics
13%
OTC
13%
VMS /
Other
22%
Jan 2017 6
Diverse Revenue Base
(C) Catalent Inc. 2017 All rights reserved
US
45%
Europe
39%
RoW
16%
Geography Product Type Products
Top 20
25%
All
Other
75%
Top product
<3% of
sales
Consistent
with the
industry
50%+ not
exposed to
patent cliffs

Top 20
25%
All
Other
75%
7
Extensive Customer Relationships
Spanning Full Breadth of Industry
(C) Catalent Inc. 2017 All rights reserved
87
of top 100
drug marketers
22
of top 25
generics companies
24
of top 25
biologics companies
21
of top 25 consumer
health companies
Top
customer
<10% of
total sales
1,000+ customers in 80+ countries
Jan 2017

Jan 2017 8
Our Follow the Molecule Strategy Drives
Long-Duration, Predictable Revenues
Catalent’s technologies and Follow the
Molecule™ approach yield long-duration
revenues with strong customer retention
● Included in customers’ regulatory filings
● 1,100+ patents/applications, 125+
families
● Extensive dev’t and manufacturing know-
how from > 1,000 past launches
● Contracting excellence: 65%+ of long-cycle
revenues covered by long-term contracts
● Follow the molecule approach provides
multiple entry points with multiple
parties throughout a molecule’s life
(C) Catalent Inc. 2017 All rights reserved

Our Patient First Operating Model Sustains
Operational, Compliance Excellence
We operate with a Patient First mindset, focused on
primacy of patient safety, impact and outcomes
World-class manufacturing & supply network with
significant global scale
● Rigorous cGMP, EHS, operational and security controls in place
● 70 billion+ doses to ~1,000 customers in 80+ countries
Uncompromising quality systems based on industry-
leading regulatory expertise
● 1,100+ employees focused on quality assurance and regulatory
● 49 regulatory audits in FY’16; 250+ over past 5 years
● 400+ customer and internal audits annually
Jan 2017 (C) Catalent Inc. 2017 All rights reserved 9
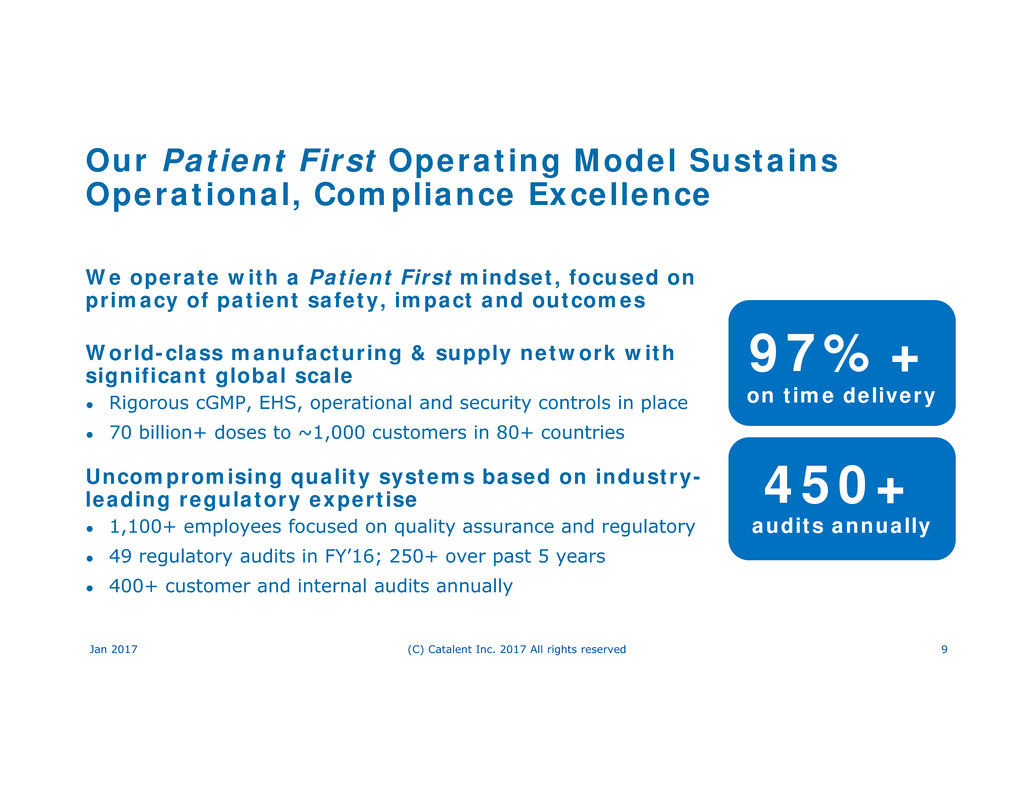
97%+
on time delivery
450+
audits annually

Jan 2017 10
Our Fast-Growing Biologics Business
Serves Critical Industry Needs
(C) Catalent Inc. 2017 All rights reserved
Proven GPEx® cell-line technology
• Extensive early-stage access – 600+ to date
• Two GPEx-based NBEs in Phase III
• 7 GPEx biosimilars launched, many more in dev’t
Strong demand for biomanufacturing
• Single-use bioreactor based Madison, WI facility
• Revenues tripled; new $34M investment ? 3rd Train
• Diversified base – antibodies, recombinant, mRNA
Expanding biologics analytical services ($500M mkt)
Next-generation SMARTag® antibody-drug
conjugation ramping and meeting milestones
• 12+ agreements to date
• Out-licensed CD22 SMARTag-based compound

Jan 2017 11
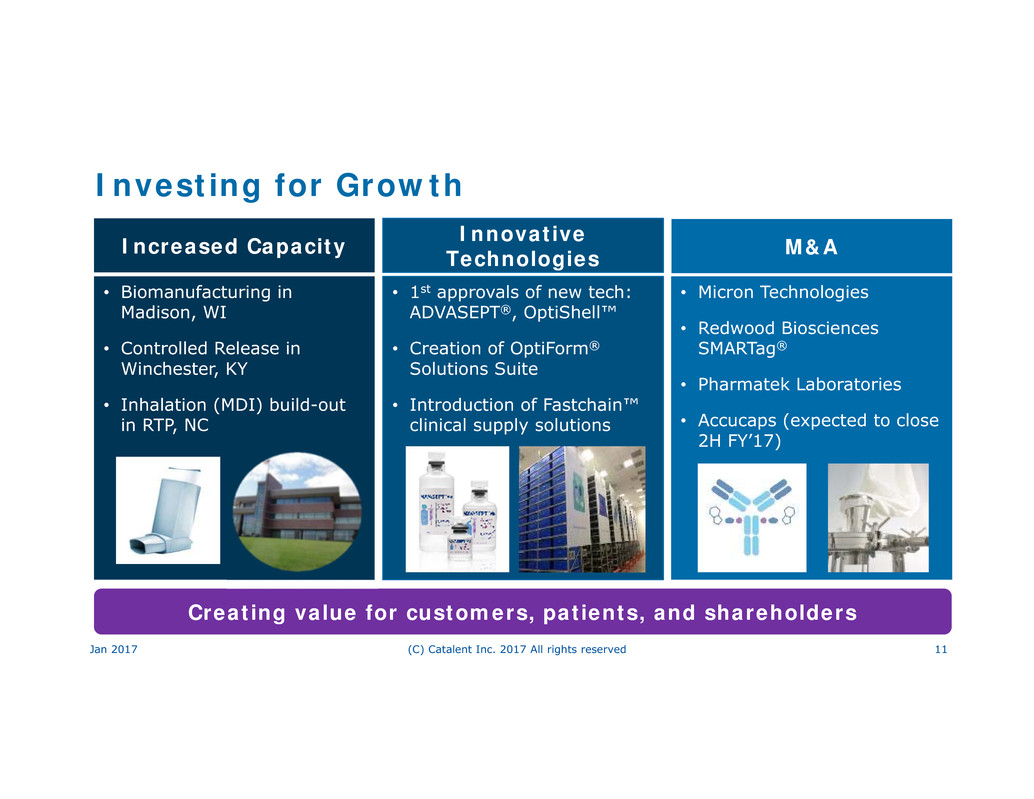
Investing for Growth
(C) Catalent Inc. 2017 All rights reserved
• Biomanufacturing in
Madison, WI
• Controlled Release in
Winchester, KY
• Inhalation (MDI) build-out
in RTP, NC
• 1st approvals of new tech:
ADVASEPT®, OptiShell™
• Creation of OptiForm®
Solutions Suite
• Introduction of Fastchain™
clinical supply solutions
Increased Capacity Innovative Technologies
• Micron Technologies
• Redwood Biosciences
SMARTag®
• Pharmatek Laboratories
• Accucaps (expected to close
2H FY’17)
M&A
Creating value for customers, patients, and shareholders

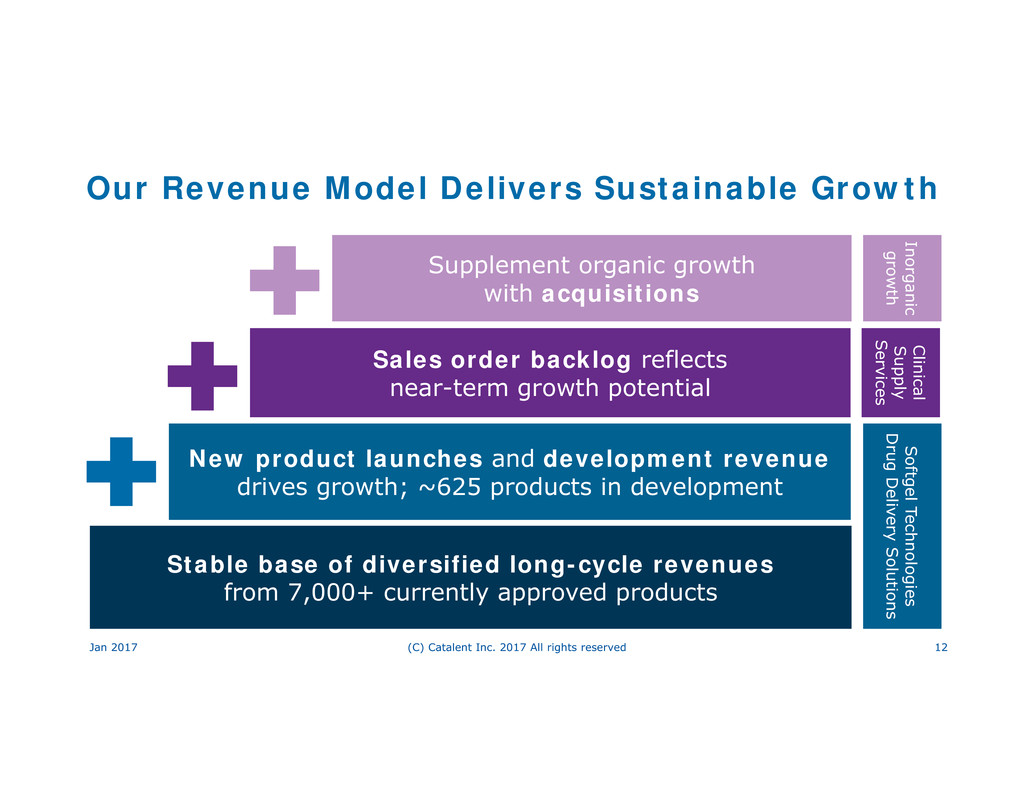
Our Revenue Model Delivers Sustainable Growth
Jan 2017 (C) Catalent Inc. 2017 All rights reserved 12
Supplement organic growth
with acquisitions
Inorganic
grow
th
C
linical
S
upply
S
ervices
S
oftgel Technologies
Drug
Deli
very
Solution
s
Sales order backlog reflects
near-term growth potential
New product launches and development revenue
drives growth; ~625 products in development
Stable base of diversified long-cycle revenues
from 7,000+ currently approved products

13
Strong Historical Financial Performance
Net Revenue ($M) Adjusted EBITDA ($M)
See Appendix for a reconciliation of non-GAAP financial measures to the most directly comparable GAAP measure
$1,399
$1,848
$1,920
-
$1,995
FY’09 FY’16 FY’17
Guidance
$274
$401
$430 -
$455
FY’09 FY’16 FY’17
Guidance
Revenue and Adj. EBITDA CAGRs negatively impacted by FX translation and
temporary suspension of Beinheim facility in FY’16
4% - 8%
Growth
7% - 13%
Growth
7% @
const. FX
8% @
const. FX
Jan 2017 (C) Catalent Inc. 2017 All rights reserved

Jan 2017 14
Recent Developments
(C) Catalent Inc. 2017 All rights reserved
Operational highlights
‒ Announced that Triphase Accelerator obtained worldwide rights to an oncology treatment
developed using Catalent's proprietary SMARTag® technology
‒ Reached an agreement with Moderna Therapeutics to support near-term GMP efforts for
Phase 1/2 clinical studies for its personalized cancer vaccines
‒ OPKO Health's RAYALDEE® has launched using our proprietary OptiShell™ technology
Inorganic activity
‒ Acquired Pharmatek Laboratories, a specialist in drug development and clinical
manufacturing; adds extensive formulation and development capabilities
‒ Agreed to acquire Accucaps, a developer and manufacturer of Over-the-Counter (OTC) and
pharmaceutical softgels
Capital structure enhancements
‒ Issued €380M, 8-year, 4.75% notes; proceeds used to fund acquisitions and pay down debt
‒ Re-priced Term Loan: 50 bps reduction in USD tranche, 75 bps reduction in EUR tranche

Jan 2017 15
Capitalization and Allocation
(C) Catalent Inc. 2017 All rights reserved
Capital allocation priorities:
• Capex to drive organic growth
• M&A to supplement organic growth
• Share repurchase
• Debt reduction
Improving free cash flow
generation expected in FY’17:
~60%-70% of Adj. Net Income
Deleveraging of ~.75x per year through EBITDA growth

Organic Revenue Growth • 4 – 6% CAGR
Organic Adj. EBITDA Growth • 6 – 8% CAGR
Leverage
• Long-term target of 3.5x
• Ability to increase for acquisitions
16
Strategic plans targeting long-term growth
(1) These goals are forward-looking, are subject to significant business, economic, regulatory and competitive uncertainties and contingencies, many of which are beyond the control of
the Company and its management, and are based upon assumptions with respect to future decisions, which are subject to change. Actual results will vary and those variations may
be material. For discussion of some of the important factors that could cause these variations, please consult the “Risk Factors” section of our Form 10-K for the year ended June
30, 2016. Nothing in this presentation should be regarded as a representation by any person that these goals will be achieved, and the Company undertakes no duty to update its
goals
(2) The most directly comparable GAAP measure to adjusted EBITDA is earnings/(loss) from continuing operations. An example of the factors involved in the reconciliation is provided in
an appendix to this presentation.
Catalent’s Financial Objectives1,2
Jan 2017 (C) Catalent Inc. 2017 All rights reserved

Appendix
17

Adjusted EBITDA Reconciliation
Actual
(US $M) 2009 2010 2011 2012 2013 2014 2015 2016
Earnings / (loss) from continuing operations (197.6) (216.8) (29.1) 18.1 (50.9) 17.9 210.2 111.2
Interest expense, net 182.1 161.0 165.5 183.2 203.2 163.1 105.0 88.5
Income tax (benefit) / provision 16.9 1.4 23.7 0.5 27.0 49.5 (97.7) 33.7
Depreciation and amortization 124.6 117.6 115.4 129.7 152.2 142.9 140.8 140.6
Non-controlling interest 0.6 (2.6) (3.9) (1.2) 0.1 1.0 1.9 0.3
EBITDA from continuing operations 126.6 60.6 271.6 330.3 331.6 374.4 360.2 374.3
Non-cash stock compensation (0.3) 2.6 4.0 3.7 2.8 4.5 9.0 10.8
Impairment charges and (gain) / loss on sale
of assets 139.5 214.8 3.6 1.8 5.2 3.2 4.7 2.7
Financing related expenses -- -- -- -- 16.9 11.0 21.8 --
US GAAP restructuring 11.3 17.7 12.5 19.5 18.4 19.7 13.4 9.0
Acquisition, integration and other special
items 4.6 11.6 14.4 33.1 15.5 9.8 13.8 18.2
Property and casualty losses -- -- 11.6 (8.8) -- -- -- --
Foreign exchange (gain) / loss (18.7) (3.8) 25.5 (4.6) 5.7 (3.5) (2.7) (10.5)
Other (non-cash) 10.8 10.5 10.6 13.2 16.6 13.2 22.9 (3.3)
Total adjustments 147.2 253.4 82.2 57.9 81.1 57.9 82.9 26.9
Adjusted EBITDA 273.8 314.0 353.8 388.2 412.7 432.3 443.1 401.2
18Jan 2017 (C) Catalent Inc. 2017 All rights reserved

Jan 2017 19
Our Offerings are Well-Aligned with
Market Growth Accelerators
(C) Catalent Inc. 2017 All rights reserved
Increasingly complex pipeline:
harder to formulate and deliver
? 75% current, ~90%+ of pre-clinical
? Broadest toolkit, proven know-how
? Extensive IP
Rapid growth in biologics drives
dev’t and manufacturing demand
? Key growth area: <5,000L BR capacity
? GPEx®, SMARTag® feed biomanufacturing
? New 3rd suite expansion
Fast-growing consumer market
offers new opportunities
? Strong base – 35% of our FY’16 rev
? Limited US/Canada participation today
? Accucaps buy: fit-for-purpose capacity
Increasing outsourcing demand
for development & CMC
? We lead CMC R&D – FY’16 rev up 19%
? Small/mid-cap pipeline, market share
? Large-cap in-house: do more with less

discover more.
CATALENT PHARMA SOLUTIONS
14 SCHOOLHOUSE ROAD
SOMERSET, NJ 08873
+ 1 866 720 3148
WWW.CATALENT.COM
