Attached files
UNITED STATES
SECURITIES AND EXCHANGE COMMISSION
Washington, D.C. 20549
______________________________
FORM 10-K
______________________________
x ANNUAL REPORT PURSUANT TO SECTION 13 OR 15(d) OF THE SECURITIES EXCHANGE ACT OF 1934
For the fiscal year ended June 30, 2015
or
o TRANSITION REPORT PURSUANT TO SECTION 13 OR 15(D) OF THE SECURITIES EXCHANGE ACT OF 1934
For the transition period from to
Commission File Number: 001-36587
______________________________
CATALENT, INC.
(Exact name of registrant as specified in its charter)
______________________________
Delaware | 20-8737688 |
(State or other jurisdiction of incorporation or organization) | (I.R.S. Employer Identification No.) |
14 Schoolhouse Road Somerset, New Jersey | 08873 |
(Address of principal executive offices) | (Zip Code) |
______________________________
Securities registered pursuant to Section 12(b) of the Act:
Title of each class | Name of each exchange on which registered |
Common Stock, $0.01 par value per share | New York Stock Exchange |
Securities registered pursuant to Section 12(g) of the Act: None
______________________________
Indicate by check mark if the registrant is a well-known seasoned issuer, as defined in Rule 405 of the Securities Act. Yes x No o
Indicate by check mark if the registrant is not required to file reports pursuant to Section 13 or Section 15(d) of the Act. Yes o No x
Indicate by check mark whether the registrant (1) has filed all reports required to be filed by Section 13 or 15(d) of the Securities Exchange Act of 1934 during the preceding 12 months (or for such shorter period that the registrant was required to file such reports), and (2) has been subject to such filing requirements for the past 90 days. Yes x No o
Indicate by check mark whether the registrant has submitted electronically and posted on its corporate Web site, if any, every Interactive Data File required to be submitted and posted pursuant to Rule 405 of Regulation S-T (§ 232.405 of this chapter) during the preceding 12 months (or for such shorter period that the registrant was required to submit and post such files). Yes x No o
Indicate by check mark if disclosure of delinquent filers pursuant to Item 405 of Regulation S-K (§ 229.405 of this chapter) is not contained herein, and will not be contained, to the best of registrant’s knowledge, in definitive proxy or information statements incorporated by reference in Part III of this Form 10-K or any amendment to this Form 10-K. o
Indicate by check mark whether the registrant is a large accelerated filer, an accelerated filer, a non-accelerated filer, or a smaller reporting company. See the definitions of “large accelerated filer,” “accelerated filer,” and “smaller reporting company" in Rule 12b-2 of the Exchange Act.
Large accelerated filer | o | Accelerated filer | o | |
Non-accelerated filer | x | (Do not check if a smaller reporting company) | Smaller reporting company | o |
Indicate by check mark whether the registrant is a shell company (as defined in Rule 12b-2 of the Act). Yes o No x
As of December 31, 2014, the aggregate market value of the registrant's voting and non-voting common equity held by non-affiliates was $1.4 billion. On September 1, 2015 there were 124,519,427 shares of the Registrant’s Common Stock, par value $0.01 per share, issued and outstanding.
DOCUMENTS INCORPORATED BY REFERENCE
Portions of the Registrant's Proxy Statement relating to the 2015 Annual Meeting of Shareholders are incorporated by reference into Part III of this report.
1
CATALENT, INC.
INDEX TO ANNUAL REPORT ON FORM 10-K
For the Year Ended June 30, 2015
Item | Page | |
PART I | ||
Item 1. | ||
Item 1A. | ||
Item 1B. | ||
Item 2. | ||
Item 3. | ||
Item 4. | ||
PART II | ||
Item 5. | ||
Item 6. | ||
Item 7. | ||
Item 7A. | ||
Item 8. | ||
Item 9. | ||
Item 9A. | ||
Item 9B. | ||
PART III | ||
Item 10. | ||
Item 11. | ||
Item 12. | ||
Item 13. | ||
Item 14. | ||
PART IV | ||
Item 15. | ||
2
PART I
Special Note Regarding Forward-Looking Statements
In addition to historical information, this Annual Report on Form 10-K of Catalent, Inc. (“Catalent” or the “Company”) contains “forward-looking statements” within the meaning of Section 27A of the Securities Act of 1933, as amended (the “Securities Act”), and Section 21E of the Securities Exchange Act of 1934, as amended (the “Exchange Act”), which are subject to the “safe harbor” created by those sections. All statements, other than statements of historical facts, included in this Annual Report on Form 10-K are forward-looking statements. In some cases, you can identify these forward-looking statements by the use of words such as “outlook,” “believes,” “expects,” “potential,” “continues,” “may,” “will,” “should,” “could,” “seeks,” “predicts,” “intends,” “plans,” “estimates,” “anticipates” or the negative version of these words or other comparable words.
These statements are based on assumptions and assessments made by our management in light of their experience and, their perception of historical trends, current conditions, expected future developments and other factors they believe to be appropriate. Any forward-looking statement is subject to various risks and uncertainties. Accordingly, there are or will be important factors that could cause actual outcomes or results to differ materially from those indicated in these statements.
Some of the factors that may cause actual results, developments and business decisions to differ materially from those contemplated by such forward-looking statements include, but are not limited to, those described under the section entitled “Risk Factors” in this Annual Report on Form 10-K for the fiscal year ended June 30, 2015 and the following:
• | We participate in a highly competitive market, and increased competition may adversely affect our business. |
• | The demand for our offerings depends in part on our customers’ research and development and the clinical and market success of their products. Our business, financial condition and results of operations may be harmed if our customers spend less on, or are less successful, in these activities. |
• | We are subject to product and other liability risks that could adversely affect our results of operations, financial condition, liquidity, and cash flows. |
• | Failure to comply with existing and future regulatory requirements could adversely affect our results of operations and financial condition. |
• | Failure to provide quality offerings to our customers could have an adverse effect on our business and subject us to regulatory actions and costly litigation. |
• | The services and offerings we provide are highly exacting and complex, and if we encounter problems providing the services or support required, our business could suffer. |
• | Our global operations are subject to economic, political and regulatory risks. |
• | If we do not enhance our existing or introduce new technology or service offerings in a timely manner, our offerings may become obsolete over time, customers may not buy our offerings and our revenue and profitability may decline. |
• | We and our customers depend on patents, copyrights, trademarks, trade secrets and other forms of intellectual property protections, but these protections may not be adequate. |
• | Our future results of operations are subject to fluctuations in the costs, availability, and suitability of the components of the products we manufacture, including active pharmaceutical ingredients, excipients, purchased components, and raw materials. |
• | Changes in market access or healthcare reimbursement for our customers’ products in the United States or internationally could adversely affect our results of operations and financial condition by affecting demand for our offerings. |
• | As a global enterprise, fluctuations in the exchange rate of the U.S. dollar against foreign currencies could have a material adverse effect on our financial performance and results of operations. |
3
• | Tax legislation initiatives or challenges to our tax positions could adversely affect our results of operations and financial condition. |
• | Our ability to use our net operating loss carryforwards and certain other tax attributes may be limited. |
• | We are dependent on key personnel. |
• | Risks generally associated with information and communications systems could adversely affect our results of operations. |
• | We have in the past engaged and may in the future engage in acquisitions and other transactions that may complement or expand our business or divest of non-strategic businesses or assets. We may not be able to complete such transactions, and such transactions, if executed, pose significant risks and could have a negative effect on our operations. |
• | Our offerings and our customers’ products may infringe on the intellectual property rights of third parties. |
• | We are subject to environmental, health and safety laws and regulations, which could increase our costs and restrict our operations in the future. |
• | We are subject to labor and employment laws and regulations, which could increase our costs and restrict our operations in the future. |
• | Certain of our pension plans are underfunded, and additional cash contributions we may make will reduce the cash available for our business, such as the payment of our interest expense. |
• | Our substantial leverage could adversely affect our ability to raise additional capital to fund our operations, limit our ability to react to changes in the economy or in our industry, expose us to interest-rate risk to the extent of our variable rate debt and prevent us from meeting our obligations under our indebtedness. |
• | Affiliates of The Blackstone Group L.P. (“Blackstone”) have substantial influence over us and their interests may conflict with ours or yours in the future. |
We caution you that the risks, uncertainties and other factors referenced above may not contain all of the risks, uncertainties and other factors that are important to you. In addition, we cannot assure you that we will realize the results, benefits or developments that we expect or anticipate or, even if substantially realized, that they will result in the consequences or affect us or our business in the way expected. There can be no assurance that (i) we have correctly measured or identified all of the factors affecting our business or the extent of these factors’ likely impact, (ii) the available information with respect to these factors on which such analysis is based is complete or accurate, (iii) such analysis is correct or (iv) our strategy, which is based in part on this analysis, will be successful. All forward-looking statements in this report apply only as of the date of this report or as of the date they were made and we undertake no obligation to publicly update or review any forward-looking statement, whether as a result of new information, future developments or otherwise, except as required by law.
Social Media
We use our website (www.catalent.com), our corporate Facebook page (https://www.facebook.com/CatalentPharmaSolutions) and our corporate Twitter account (@catalentpharma) as channels of distribution of Company information. The information we post through these channels may be deemed material. Accordingly, investors should monitor these channels, in addition to following our press releases, Securities and Exchange Commission ("SEC") filings and public conference calls and webcasts. The contents of our website and social media channels are not, however, a part of this report.
4
Trademarks and Service Marks
We have U.S. or foreign registration in the following marks, among others: “ADVASEPT®,” “OptiForm®,” “GPEx®,” “Liqui-Gels®,” “Vegicaps®,” “Zydis®,” and “Zydis®Nano”. This Annual Report on Form 10-K also includes trademarks and trade names owned by other parties, and these trademarks and trade names are the property of their respective owners. We use certain other trademarks and service marks, including OptiShell™, OptiDose™, OptiMelt™, OptiPact™, SMARTag™, OptiGel™, OptiGel™ Bio, Easyburst™, Savorgel™, Galacorin™ and Softdrop™ on an unregistered basis in the United States and abroad.
Solely for convenience, the trademarks, service marks and trade names identified in this Annual Report on Form 10-K may appear without the ® and ™ symbols, but such references are not intended to indicate, in any way, that we will not assert, to the fullest extent under applicable law, our rights or the rights of the applicable licensors to these trademarks, service marks, and trade names.
5
ITEM 1. | BUSINESS |
Overview
We are the leading global provider of advanced delivery technologies and development solutions for drugs, biologics and consumer health products. Our oral, injectable, and respiratory delivery technologies address the full diversity of the pharmaceutical industry including small molecules, large molecule biologics and consumer health products. Through our extensive capabilities and deep expertise in product development, we help our customers take products to market faster, including nearly half of new drug products approved by the Food and Drug Administration (the "FDA") in the last decade. Our advanced delivery technology platforms, broad and deep intellectual property, and proven formulation, manufacturing and regulatory expertise enable our customers to develop more products and better treatments. Across both development and delivery, our commitment to reliably supply our customers’ needs is the foundation for the value we provide; annually, we produce more than 70 billion doses for nearly 7,000 customer products. We believe that through our investments in growth-enabling capacity and capabilities, our ongoing focus on operational and quality excellence, the sales of existing customer products, the introduction of new customer products, our patents and innovation activities, and our entry into new markets, we will continue to benefit from attractive and differentiated margins, and realize the growth potential from these areas.
Since 2010, we have made investments to expand our sales and marketing activities, leading to growth in the number of active development programs for our customers in both of our two main strategic areas. This has further enhanced our extensive, long-duration relationships and long-term contracts with a broad and diverse range of industry-leading customers. In the fiscal year ended June 30, 2015, we did business with 82 of the top 100 branded drug marketers, 19 of the top 20 generics marketers, 40 of the top 50 biologics marketers, and 23 of the top 25 consumer health marketers globally. Selected key customers include Pfizer, Johnson & Johnson, GlaxoSmithKline, Novartis, Roche, Actavis and Teva. We have many long-standing relationships with our customers, particularly in advanced delivery technologies, where we tend to follow a prescription molecule through all phases of its lifecycle, from the original brand prescription, development and launch to generics or over-the-counter switch. A prescription pharmaceutical product relationship with an innovator will often last for nearly two decades, extending from mid-clinical development through the end of the product’s life cycle. We serve customers who require innovative product development, superior quality, advanced manufacturing and skilled technical services to support their development and marketed product needs. Our broad and diverse range of technologies closely integrates with our customers’ molecules to yield final dose forms, and this generally results in the inclusion of Catalent in our customers’ prescription product regulatory filings. Both of these factors translate to long-duration supply relationships at an individual product level.
We believe our customers value us because our depth of development solutions and advanced delivery technologies, intellectual property, consistent and reliable supply, geographic reach, and substantial expertise enable us to create a broad range of business and product solutions that can be customized to fit their individual needs. Today we employ approximately 900 scientists and technicians and hold approximately 1,300 patents and patent applications in advanced delivery, drug and biologics formulation and manufacturing. The aim of our offerings is to allow our customers to bring more products to market faster, and develop and market differentiated new products that improve patient outcomes. We believe our leading market position, significant global scale, and diversity of customers, offerings, regulatory categories, products, and geographies reduce our exposure to potential strategic and product shifts within the industry.
We provide a number of proprietary, differentiated technologies, products and service offerings to our customers across our advanced delivery technologies and development solutions platforms. The core technologies within our advanced delivery technologies platform include softgel capsules, our Zydis oral dissolving tablets, blow-fill-seal unit dose liquids and a range of other oral, injectable and respiratory technologies. The technologies and service offerings within our development solutions platform span the drug development process, ranging from OptiForm formula optimization technology, Micron Technologies particle size engineering for small molecules, and GPEx and SMARTag platforms for development of biologics and antibody-drug conjugates (ADCs), to formulation, analytical services, early stage clinical development, clinical trials supply and regulatory consulting. Our offerings serve a critical need in the development and manufacturing of difficult-to-formulate products across a number of product types.
We have advanced our technologies and grown our service offerings over more than 80 years through internal development, strategic alliances, in-licensing and acquisitions. We initially introduced our softgel capsule technology in the 1930s and have continued to expand our range of new, technologically enhanced offerings. Since fiscal 2013, we have launched OptiShell, OptiDose, OptiMelt, Zydis Nano and Zydis Bio, and in fiscal 2015 we launched OptiPact. To extend the reach of our technologies and services, we have also formed several active partnerships, including recent partnerships with BASF (Germany), CEVEC (Germany), and CTC Bio (South Korea), and have active relationships with research universities around the world. We have also augmented our portfolio through nine acquisitions since fiscal 2012, including significantly expanding
6
the scale of our Development and Clinical Services business through the acquisition of the Aptuit CTS business in February 2012, adding an ADC business through the completion of our acquisition of the Redwood BioScience business in October 2014, and extending our particle engineering capabilities via our November 2014 acquisition of Micron Technologies, a leader in the category. We believe our own internal innovation, supplemented by current and future external partnerships and acquisitions, will continue to strengthen and extend our leadership positions in the delivery and development of drugs, biologics and consumer health products.
History
Catalent was formed in April 2007, when affiliates of Blackstone acquired the core of the Pharmaceutical Technologies and Services (“PTS”) segment of Cardinal Health, Inc. (“Cardinal”). Cardinal had created PTS through a series of acquisitions beginning with R.P. Scherer Corporation in 1998, with the intent of creating the world’s leading outsourcing provider of specialized, market-leading solutions to the global pharmaceutical and biotechnology industry. We are a holding company that indirectly owns Catalent Pharma Solutions, Inc. (the "Operating Company"), which owns, directly or indirectly, all of our operating subsidiaries. Since our 2007 acquisition, we have regularly reviewed our portfolio of offerings and operations in the context of our strategic growth plan, and, as a result, we have sold five businesses and consolidated operations at four facilities, integrating them into the remaining facility network. We have also actively acquired new businesses and facilities, completing nine transactions since fiscal 2012. In July 2014, we completed the initial public offering of our common stock (the "IPO"), which is now listed on the New York Stock Exchange (the “NYSE”) under the symbol “CTLT.”
Our Competitive Strengths
Leading Provider of Advanced Delivery Technologies and Development Solutions
We are the leading global provider of advanced delivery technologies and development solutions for drugs, biologics and consumer health products. In the last decade, we have earned revenue with respect to nearly half of the drugs based on new chemical entities (“NCEs”) approved by the FDA, and over the past three years with respect to nearly 80% of the top 200 largest-selling compounds globally. With approximately 900 scientists and technicians worldwide and approximately 1,300 patents and patent applications, our expertise is in providing differentiated technologies and solutions that help our customers bring more products and better treatments to market faster. For example, in the high-value area of NCEs, approximately 90% of NCE softgel approvals by the FDA over the last 25 years have been developed and supplied by us.
Diversified Operating Platform
We are diversified by virtue of our geographic scope, our large customer base, the extensive range of products we produce, our broad service offerings, and our ability to provide solutions at nearly every stage of a product’s lifecycle. We produce nearly 7,000 distinct items across multiple categories, including brand and generic prescription drugs and biologics, over-the-counter, consumer health and veterinary products, medical devices and diagnostics. In fiscal 2015, our top 20 products represented approximately 20% of total revenue, with no single customer accounting for greater than 10% of revenue and with no individual product greater than 3%. We serve approximately 1,000 customers in approximately 80 countries, with a majority of our fiscal 2015 revenues coming from outside the United States. This diversity, combined with long product lifecycles and close customer relationships, has contributed to the stability of our business. It has also allowed us to reduce our exposure to potential strategic, customer and product shifts as well as to payer-driven pricing pressures experienced by our branded drug and biologic customers.
Longstanding, Extensive Relationships with Blue Chip Customers
We have longstanding, extensive relationships with leading pharmaceutical and biotechnology customers. In fiscal 2015, we did business with 82 of the top 100 branded drug marketers, 19 of the top 20 generics marketers, 40 of the top 50 biologics marketers, and 23 of the top 25 consumer health marketers globally, as well as with nearly 1,000 other customers, including emerging and specialty companies, which are often more reliant on outside partners as a result of their more virtual business models. Regardless of size, our customers seek innovative product development, superior quality, advanced manufacturing and skilled technical services to support their development and marketed product needs.
We believe our customers value us because our depth of development solutions and advanced delivery technologies, consistent and reliable supply, geographic reach and substantial expertise enable us to create a broad range of tailored solutions, many of which are unavailable from other individual providers.
7
Deep, Broad and Growing Technology Foundation
Our breadth of proprietary and patented technologies and long track record of innovation substantially differentiate us from other industry participants. Within our oral technologies business, our leading softgel platforms, including Liqui-Gels, OptiShell and Vegicaps capsules, and our modified release technologies, including the Zydis family, OptiDose and OptiMelt technologies, provide formulation expertise to solve complex delivery challenges for our customers. We offer advanced technologies for delivery of small molecules and biologics via respiratory, ophthalmic and injectable routes, including the blow-fill-seal unit dose technology, ADVASEPT glass-free vials, and prefilled syringes. We also provide advanced biologics formulation options, including Gene Product Expression (“GPEx”) cell-line and SMARTag antibody-drug conjugate technologies. We have a market leadership position within respiratory delivery, including metered dose and dry powder inhalers, and intra-nasal forms. We have reinforced our leadership position in advanced delivery technologies over the last three years, as we have launched more than a dozen new technology platforms and applications, including in fiscal 2015 the addition of particle size engineering technologies for small molecules through our acquisition of Micron Technologies, a recognized market leader in the space. Our culture of creativity and innovation is grounded in our advanced delivery technologies, our scientists and engineers, and our patents and proprietary manufacturing processes throughout our global network. Our global product development team drives a focused application of resources to our highest priority opportunities for both new customer product introductions and platform technology development. As of June 30, 2015, we had approximately 700 product development programs in active development across our businesses.
Long-Duration Relationships Provide Sustainability
Our broad and diverse range of technologies closely integrates with our customers’ molecules to yield final dose forms, and this generally results in the inclusion of Catalent in our customers’ prescription product regulatory filings. Both of these factors translate to long-duration supply relationships at an individual product level, to which we apply our expertise in contracting to produce long-duration commercial supply agreements. These agreements typically have initial terms of three to ten years with regular renewals of one to three years (see “Contractual Arrangements” for more detail). Nearly 70% of our fiscal 2015 advanced delivery technology platform revenues (comprised of our Oral Technologies and Medication Delivery Solutions reporting segments) were covered by such long-term contractual arrangements. We believe this base provides us with a sustainable competitive advantage.
Significant Recent Growth Investments
We have made significant investments over time to establish a global manufacturing network, and today employ 5.1 million square feet of manufacturing and laboratory space across five continents. We have invested approximately $577 million in the last five fiscal years in gross capital expenditures. Growth-related investments in facilities, capacity and capabilities across our businesses have positioned us for future growth in areas aligned with anticipated future demand. Through our focus on operational, quality and regulatory excellence, we drive ongoing and continuous improvements in safety, productivity and reliable supply to customer expectations, which we believe further differentiate us. Our manufacturing network and capabilities allow us the flexibility to reliably supply the changing needs of our customers while consistently meeting their quality, delivery and regulatory compliance expectations.
High Standards of Regulatory Compliance and Operational and Quality Excellence
We operate our plants in accordance with current good manufacturing practices (“cGMP”), following our own high standards that are consistent with those of many of our large global pharmaceutical and biotechnology customers. We have more than 1,100 employees around the globe focused on quality and regulatory compliance. More than half of our facilities are registered with the FDA, with the remaining facilities registered with other applicable regulatory agencies, such as the European Medicines Agency (the “EMA”). In some cases, facilities are registered with multiple regulatory agencies. In fiscal 2015, we underwent 65 regulatory audits and, over the last five fiscal years, we successfully completed more than 250 regulatory audits. We also undergo nearly 500 customer and internal audits annually. We believe our quality and regulatory track record to be a competitive differentiator for Catalent.
Strong and Experienced Management Team
Most of our executive leadership team has been in place since fiscal 2010. Today, our management team has more than 200 years of combined and diverse experience within the pharmaceutical and healthcare industries. With an average of more than 20 years of functional experience, this team possesses deep knowledge and a wide network of industry relationships.
8
Our Strategy
We are pursuing the following key growth initiatives:
“Follow the Molecule” by Providing Solutions to our Customers across all Phases of the Product Lifecycle
We intend to use our advanced delivery technologies and development solutions across the entire lifecycle of our customers’ products to drive future growth. Our development solutions span the drug development process, starting with our platforms for development of small molecules, biologics and antibody-drug conjugates, to formulation and analytical services, through early stage clinical development and manufacturing of clinical trials supply, to regulatory consulting. Once a molecule is ready for late-stage trials and subsequent commercialization, we provide our customers with a range of advanced delivery technologies and manufacturing expertise that allow them to deliver their molecules to the end-users in appropriate dosage forms. The relationship between a molecule and our advanced delivery technologies typically starts with developing and manufacturing the innovator product, then extends throughout the molecule’s commercial life, including through potential generic launches or over-the-counter (“OTC”) conversion. For prescription products, we are typically the sole and/or exclusive provider, and are reflected in customers’ new drug applications.
Our breadth of solutions gives us multiple entry points into the lifecycle of our customers’ molecules. Our initial commercial opportunity arises during the discovery and development of a molecule, when our development and particle engineering solutions can be applied. Once a product reaches late-stage development, we can provide our customers with drug delivery solutions for the commercialization of their products. We have two additional entry points during the commercial phase: upon loss-of-exclusivity and upon OTC conversion. At these points, we partner with the makers and marketers of both generic and OTC products to provide them with advanced delivery technologies that can be applied to their products through these stages of the product lifecycle. Our revenues from our advanced delivery technologies are primarily driven by volumes and, as a result, the loss of exclusivity may not have a significant negative impact if we continue to work with both branded and generic partners.
An example of this can be found in a leading over-the-counter respiratory brand, which today uses both our Zydis fast dissolve and our Liqui-Gels softgel technologies. We originally began development of the prescription format of this product for our multinational pharmaceutical company partner in 1992 to address specific patient sub-segment needs. After four years of development, we then commercially supplied the prescription Zydis product for six years, and we continue to provide the Zydis form during the switch to OTC status in the United States and other markets in the early 2000s. More recently, we proactively brought a softgel product concept for the brand to the customer, which the customer elected to develop and launch as well. By following this molecule, we have built a strong, 24-year long relationship across multiple formats and markets.
Continue to Grow Through New Product Launches and Projects
We intend to grow by supplementing our existing diverse base of commercialized advanced delivery technology products with new development programs. As of June 30, 2015, our product development teams were working on approximately 700 new customer programs. Our base of active development programs has expanded in recent years from growing market demand, as well as from our investments since 2010 to expand our global sales and marketing function; once developed and approved in the future, we expect these programs to add to long-duration commercial revenues under long-term contracts and grow our existing product base. In the year ended June 30, 2015, we introduced 165 new products, which is in line with new product introductions in the year ended June 30, 2014. We also expect that our expanded offerings and capacity such as bioanalytical testing and metered dose inhaler production, our acquisition of Micron Technologies, our expanded presence in Brazil, and our market entry into China will further expand our active advanced delivery technologies development programs, and position us for future growth. Our development solutions business is driven by thousands of projects annually, ranging from individual short-duration analytical projects to multi-year clinical supply programs.
9
Accelerate Growth with Existing Customers through Increased Penetration and Broadening of Services
While we have a broad presence across the pharmaceutical and biotechnology industries, we believe there are significant opportunities for additional revenue growth in our existing customer base, by providing advanced delivery solutions for new pipeline or commercial molecules, and by expanding the range and depth of our development solutions used by those customers. Within our top 50 customers, nearly 75% use less than half of our individual offerings. In order to ensure we provide the most value to our customers, we have increased our field sales and marketing force by approximately 20% since fiscal 2009. We have continued to follow a targeted account strategy, designating certain accounts as global accounts, based on current materiality, partnering approach and growth potential. We also designate other accounts as growth accounts, based primarily on partnering approach and potential to become global accounts in the future. In both cases, we assign incremental business development product development resources to identify and pursue new opportunities to partner. Global accounts represented nearly 32% of our revenues in fiscal 2015, while growth accounts represented approximately 9% of revenues in that same period.
Enter Into and Expand Into Attractive Technologies and Geographies
We have made a number of internal investments in new geographies and markets, including the construction of a state-of-the-art biomanufacturing facility in Wisconsin to serve the growing global biologics development market, the acquisition of particle engineering provider Micron Technologies to extend our drug solubility enhancement capabilities, and the acquisition of the SMARTag™ antibody-drug conjugate technology to address the growing need for improved targeted delivery of therapeutic compounds directly to tumor sites.
In addition, we intend to increase our presence in emerging/high-growth geographies and other markets where we are currently only narrowly represented, including China, Brazil, Japan, and the animal health market. We have made recent investments in such high-growth areas, including the establishment of the first provider in China of end-to-end clinical supply solutions, and a softgel facility in China focused initially on the export of cost-advantaged consumer health products, as well as our acquisition of a Brazilian softgel provider in fiscal 2014.
Capitalize on Our Substantial Technology Platform
We have a broad and diverse technology platform that is supported by approximately 1,300 patents and patent applications in more than 125 families across advanced delivery technologies, drug and biologics formulation and manufacturing. This platform is supported by substantial know-how and trade secrets that provide us with additional competitive advantages. For example, we have significant softgel fill and formulation databases and substantial softgel regulatory approval expertise, and as a result, approximately 90% of NCE softgel approvals by the FDA over the last 25 years have been developed and supplied by us.
In addition to resolving product challenges for our customers’ molecules, for more than two decades we have applied our technology platforms and development expertise to proactively develop proof of concept products, whether improved versions of existing drugs, new generic formulations or innovative consumer health products. In the consumer health area, we file product dossiers with regulators in relevant jurisdictions for Catalent-created products, which help contribute sustainable growth to our consumer health business. We expect to continue to seek proactive development and other non-traditional relationships to increase demand for and value realized from our technology platforms. These activities have provided us with opportunities to capture an increased share of end-market value through out-licensing, profit-sharing and other arrangements.
Leverage Existing Infrastructure and Operational Discipline to Drive Profitable Growth
Through our existing infrastructure, including our global network of operating locations and programs, we promote operational discipline and drive margin expansion. With our Lean Six Sigma programs, a global procurement function and conversion cost productivity metrics in place, we have created a culture of functional excellence and cost accountability. We intend to continue to apply this discipline to further leverage our operational network for profitable growth. Since fiscal 2009, we have expanded gross margin by over 600 basis points and Adjusted EBITDA margin by over 400 basis points.
10
Pursue Strategic Acquisitions and Licensing to Build upon our Existing Platform
We operate in highly fragmented markets in both our advanced delivery technologies and development solutions businesses. Within those markets, the five top players represent only 30% and 10% of the total market share, respectively, by revenue. Our broad platform, global infrastructure and diversified customer base provide us with a strong foundation from which to consolidate within these markets and to generate operating leverage through such acquisitions. Since fiscal 2012, we have executed nine transactions, investing more than $700 million, and have demonstrated an ability to efficiently and effectively integrate these acquisitions.
We intend to continue to opportunistically source and execute bolt-on acquisitions within our existing business areas, as well as to undertake transactions that provide us with expansion opportunities within new geographic markets or adjacent market segments. We have a dedicated corporate development team in place to identify these opportunities and have a rigorous and financially disciplined process for evaluating, executing and integrating such acquisitions.
Our Reportable Segments
Our offerings and services are summarized below by reporting segment.
Segment | Offerings and Services | Fiscal 2015 Revenue* | ||
(Dollars in millions) | ||||
Oral Technologies | Formulation, development and manufacturing of prescription and consumer health products using our proprietary softgel, Liqui-Gels, Vegicaps, OptiShell, OptiDose, OptiMelt, OptiPact, and Zydis technologies; as well as other proprietary and conventional oral drug delivery technologies. | $ | 1,141.1 | |
Medication Delivery Solutions | Formulation, development, and manufacturing for prefilled syringes and other injectable formats; blow-fill-seal unit dose development and manufacturing, including our ADVASEPT technology; and biologic cell line development and manufacturing, including our GPEx and SMARTag technologies. | $ | 261.9 | |
Development & Clinical Services | Manufacturing, packaging, storage, distribution and inventory management for global clinical trials of drugs and biologics; analytical and bioanalytical development and testing; scientific consulting services; development services and manufacturing for conventional oral dose forms; and development and manufacturing of products. | $ | 438.8 | |
*Segment Revenue includes inter-segment revenue of $11.0 million.
This table should be read in conjunction with Note 17 to the Consolidated Financial Statements.
Oral Technologies
Our Oral Technologies segment provides advanced oral delivery technologies, including formulation, development and manufacturing of oral dose forms for prescription and consumer health products across all phases of a molecule’s lifecycle. These oral dose forms include softgel, modified release technologies (“MRT”) and immediate release solid oral products. At certain facilities we also provide integrated primary packaging services for the products we manufacture. In fiscal 2015, we generated approximately $787.5 million in revenue from our softgel products and approximately $391.5 million in revenue from our MRT products (including intra-segment revenue of approximately $37.9 million).
Through our Softgel Technologies business, we provide formulation, development and manufacturing services for soft gelatin capsules, or “softgels,” which we first commercialized in the 1930s and have continually enhanced. We are the market leader in overall softgel manufacturing, and hold the leading market position in the prescription arena. Our principal softgel technologies include traditional softgel capsules (in which the shell is made from animal-derived materials) and Vegicaps and OptiShell capsules (in which the shell is made from vegetable-derived materials), which are used in a broad range of customer products including prescription drugs, over-the-counter medications, and vitamins and supplements. Softgel capsules encapsulate liquid, paste or oil-based active compounds in solution or suspension within an outer shell, filling and sealing the capsule simultaneously. We typically perform all encapsulation for a product within one of our softgel facilities, with active ingredients provided by customers or sourced directly by us. Softgels have historically been used to solve formulation challenges or technical issues for a specific drug, to help improve the clinical performance of compounds, to provide important market differentiation, particularly for over-the-counter compounds, and to provide safe handling of hormonal, potent and cytotoxic drugs. We also participate in the softgel vitamin, mineral and supplement business in selected regions around the
11
world. With the 2001 introduction of our vegetable-derived softgel shell, Vegicaps capsules, consumer health manufacturers have been able to extend the softgel dose form to a broader range of active ingredients and serve patient/consumer populations that were previously inaccessible due to religious, dietary or cultural preferences. In recent years this platform has been extended to pharmaceutical active ingredients via the OptiShell platform. Our Vegicaps and OptiShell capsules are patent protected in most major global markets. Physician and patient studies we have conducted have demonstrated a preference for softgels versus traditional tablet and hard capsule dose forms in terms of ease of swallowing, real or perceived speed of delivery, ability to remove or eliminate unpleasant odor or taste and, for physicians, perceived improved patient adherence with dosing regimens.
Through our Modified Release Technologies business we provide formulation, development and manufacturing services for fast-dissolve tablets and both proprietary and conventional controlled release products. We launched our orally dissolving tablet business in 1986 with the introduction of Zydis tablets, a unique oral dosage form that is freeze-dried in its package, can be swallowed without water, and typically dissolves in the mouth in less than three seconds. Most often used for indications, drugs and patient groups that can benefit from rapid oral disintegration, the Zydis technology is utilized in a wide range of products and indications, including treatments for a variety of central nervous system-related conditions such as migraines, Parkinson’s Disease, schizophrenia, and pain relief and consumer healthcare products targeting allergy relief. Zydis tablets continue to be used in new ways by our customers as we extend the application of the technology to new categories, such as for immunotherapies, vaccines and biologics delivery. More recently we have added two new technology platforms to the Modified Release Technologies business portfolio, including the highly flexible OptiDose tab-in-tab technology, already commercially proven in Japan and the OptiMelt hot melt extrusion technology. We plan to continue to expand the development pipeline of customer products for all of our Modified Release Technologies products. Representative Oral Technologies business customers include Pfizer, Novartis, GlaxoSmithKline, Eli Lilly, Johnson & Johnson and Allergan.
Medication Delivery Solutions
Our Medication Delivery Solutions segment provides formulation, development and manufacturing services for delivery of drugs and biologics, administered via injection, inhalation and ophthalmic routes, using both traditional and advanced technologies. Our range of injectable manufacturing offerings includes filling drugs or biologics into pre-filled syringes, with flexibility to accommodate other formats within our existing network, increasingly focused on complex pharmaceuticals and biologics. With our range of technologies we are able to meet a wide range of specifications, timelines and budgets. The complexity of the manufacturing process, the importance of experience and know-how, regulatory compliance, and high start-up capital requirements create significant barriers to entry and, as a result, limit the number of competitors in the market. For example, blow-fill-seal is an advanced aseptic processing technology which uses a continuous process to form, fill with drug, and seal a plastic container in a sterile environment. Blow-fill-seal units are currently used for a variety of pharmaceuticals in liquid form, such as respiratory, ophthalmic and otic products. We are a leader in the outsourced blow-fill-seal market, and operate one of the largest capacity commercial manufacturing blow-fill-seal facilities in the world. Our sterile blow-fill-seal manufacturing has significant capacity and flexibility of manufacturing configurations. This business provides flexible and scalable solutions for unit-dose delivery of complex formulations such as suspensions and emulsions. Further, the business provides engineering and manufacturing solutions related to complex containers. Our regulatory expertise can lead to decreased time to commercialization, and our dedicated development production lines support feasibility, stability and clinical runs. In fiscal 2015, we announced the completion and opening of a large-scale expansion at our Winchester, KY manufacturing facility, doubling its footprint to 180,000 square feet and substantially expanding its capacity to handle fluid bed and other complex manufacturing tasks in the business segment. We plan to continue to expand our product line in existing and new markets, and in higher margin specialty products with additional respiratory, ophthalmic, injectable and nasal applications. Representative customers include Pfizer, Sanofi-Aventis, Novartis, Roche and Teva.
Our biologics offerings include our formulation development and cell-line manufacturing based on our advanced and patented GPEx technology, which is used to develop stable, high-yielding mammalian cell lines for both innovator and bio-similar biologic compounds. Our GPEx technology can provide rapid cell line development, high biologics production yields, flexibility and versatility. We believe our development stage SMARTag next-generation antibody-drug conjugate technology will provide more precision targeting for delivery of drugs to tumors or other locations, with improved safety versus existing technologies. In fiscal 2013, we launched our recently completed biologics facility in Madison, Wisconsin, with expanded capability and capacity to produce clinical-scale biologic supplies; combined with offerings from our other businesses and external partners, we now provide the broadest range of technologies and services supporting the development and launch of new biologic entities, biosimilars or biobetters to bring a product from gene to market commercialization, faster.
12
Development and Clinical Services
Our Development and Clinical Services segment provides manufacturing, packaging, storage and inventory management for drugs and biologics in clinical trials. We offer customers flexible solutions for clinical supplies production, and provide distribution and inventory management support for both simple and complex clinical trials. This includes dose form manufacturing or over-encapsulation where needed; supplying placebos, comparator drug procurement and clinical packages and kits for physicians and patients; inventory management; investigator kit ordering and fulfillment; and return supply reconciliation and reporting. We support trials in all regions of the world through our facilities and distribution network. In fiscal 2013, we established our first clinical supply services facility in China as a joint venture and assumed full ownership in fiscal 2015. We are the leading provider of integrated development solutions and one of the leading providers of clinical trial supplies and respiratory products.
We also offer analytical chemical and cell-based testing and scientific services, stability testing, respiratory products formulation and manufacturing, regulatory consulting, and bioanalytical testing for biologic products. Our respiratory product capabilities include development and manufacturing services for inhaled products for delivery via metered dose inhalers, dry powder inhalers and intra-nasal sprays. We also provide formulation development and clinical and commercial manufacturing for conventional and specialty oral dose forms. We provide global regulatory and clinical support services for our customers’ regulatory and clinical strategies during all stages of development. Demand for our offerings is driven by the need for scientific expertise and depth and breadth of services offered, as well as by the reliable supply thereof, including quality, execution and performance. We acquired Micron Technologies in November 2014, extending our particle engineering capabilities.
Development and Product Supply Chain Solutions
In addition to our proprietary offerings, we are also differentiated in the market by our ability to bring together our development solutions and advanced delivery technologies to offer innovative development and product supply solutions which can be combined or tailored in many ways to enable our customers to take their drugs, biologics and consumer health products from laboratory to market. Once a product is on the market, we can provide comprehensive integrated product supply, from the sourcing of the bulk active ingredient to comprehensive manufacturing and packaging to the testing required for release to distribution. Customer solutions we develop are flexible, scalable and creative, so that they meet the unique needs of both large and emerging companies, and for products of all sizes. We believe that our development and product supply solutions will continue to contribute to our future growth.
Sales and Marketing
Our target customers include large pharmaceutical and biotechnology companies, mid-size, emerging and specialty pharmaceutical and biotechnology companies, and consumer health companies, along with companies in other selected healthcare market segments such as animal health and medical devices and companies in adjacent industries, such as cosmetics. We have longstanding, extensive relationships with leading pharmaceutical and biotechnology customers. In fiscal 2015, we did business with 82 of the top 100 branded drug marketers, 19 of the top 20 generics marketers, 40 of the top 50 biologics marketers, and 23 of the top 25 consumer health marketers globally, as well as with nearly 1,000 other customers. Faced with access, pricing and reimbursement pressures as well as other market challenges, large pharmaceutical and biotechnology companies have increasingly sought partners to enhance the clinical competitiveness of their drugs and biologics and improve the productivity of their research and development activities, while reducing their fixed cost base. Many mid-size, emerging and specialty pharmaceutical and biotechnology companies, while facing the same pricing and market pressures, have chosen not to build a full infrastructure, but rather to partner with other companies through licensing agreements or outsourcing to access the critical skills, technologies and services required to bring their products to market. Consumer health companies require rapidly developed, innovative dose forms and formulations to keep up in the fast-paced over-the-counter medication and vitamins markets. These market segments are all critically important to our growth, but require distinct solutions, marketing and sales approaches, and market strategy.
We follow a hybrid demand generation organization model, with global and growth account teams offering the full breadth of Catalent’s solutions to selected accounts, and technical specialist teams providing the in-depth technical knowledge and practical experience essential for each individual offering. All business development and field sales representatives ultimately report to a single sales head, and significant ongoing investments are made to enhance their skills and capabilities. Our sales organization currently consists of more than 150 full-time, experienced sales professionals, supported by inside sales and sales operations. We also have built a dedicated strategic marketing team, providing strategic market and product planning and management for our offerings. As part of our marketing efforts, we participate in major trade shows relevant to the offerings globally and ensure adequate visibility to our offerings and solutions through a comprehensive print and on-line advertising and publicity program. We believe that Catalent is a strong brand with high overall awareness in our established markets and target customers, and that our brand identity has become a competitive advantage for us.
13
Global Accounts
We manage selected accounts globally due to their substantial current business and growth potential by establishing strategic plans, goals and targets. We recorded approximately 32% of our total revenue in fiscal 2015 from these global accounts. Each global account is assigned a dedicated business development professional with substantial industry experience. These account leaders, along with the leadership of the sales and marketing function members of the executive leadership team, are responsible for managing and extending the overall account relationship. Growing sales, profitability, and increasing account penetration are key goals and are directly linked to compensation. Account leaders also work closely with the rest of the sales organization to ensure alignment around critical priorities for the accounts.
Emerging, Specialty and Virtual Accounts
Emerging, specialty and virtual pharmaceutical and biotechnology companies are expected to be critical drivers of industry growth globally. Historically, many of these companies have chosen not to build a full infrastructure, but rather partner with other companies to produce their products. We expect them to continue to do so in the future, providing a critical source for future integrated solutions demand. We expect to continue to increase our penetration of geographic clusters of emerging companies in North America, Europe, South America and Asia. We regularly use active pipeline and product screening and customer targeting to identify the optimal candidates for partnering based on product profiles, funding status, and relationships, to ensure that our technical sales specialists and field sales representatives develop custom solutions designed to address the specific needs of customers in the market.
Contractual Arrangements
We generally enter into a broad range of contractual arrangements with our customers, including agreements with respect to feasibility, development, supply, licenses, and quality. The terms of these contracts vary significantly depending on the offering and customer requirements. Some of our agreements may include a variety of revenue arrangements such as fee-for-service, royalties, profit-sharing and fixed fees. We generally secure pricing and contract mechanisms in our supply agreements that allow for periodic resetting of pricing terms and, in some cases, these agreements provide for our ability to renegotiate pricing in the event of certain price increases for the raw materials utilized in the products we make. Our typical supply agreements include indemnification from our customers for product liability and intellectual property matters and caps on our contractual liabilities, subject in each case to negotiated exclusions. In addition, our manufacturing supply agreement terms range from three to ten years with regular renewals of one to three years, although some of our agreements are terminable upon much shorter notice periods, such as 30 or 90 days. For our development solutions offerings, we may enter into master service agreements, which provide for standardized terms and conditions and make it easier and faster for customers with multiple development needs to access our offerings.
Backlog
While we generally have long-term supply agreements that provide for a revenue stream over a period of years, our backlog represents, as of a point in time, future service revenues from work not yet completed. For our Oral Technologies and Medication Delivery Solutions segments, backlog represents firm orders for manufacturing services and includes minimum volumes, where applicable. For our Development and Clinical Services segment, backlog represents estimated future service revenues from work not yet completed under signed contracts. Using these methods of reporting backlog, as of June 30, 2015, our backlog was approximately $827.6 million, as compared to approximately $782.1 million as of June 30, 2014, including approximately $417.7 million and $373.8 million, respectively, related to our Development and Clinical Services segment. We expect to recognize approximately 77% of revenue from the backlog in existence as of June 30, 2015 by the completion of the fiscal year ending June 30, 2016.
To the extent projects are delayed, the timing of our revenue could be affected. If a customer cancels an order, we may be reimbursed for the costs we have incurred. For orders that are placed inside a contractual firm period, we generally have a contractual right to payment in the event of cancellation. Fluctuations in our reported backlog levels also result from the timing and order pattern of our customers who often seek to manage their level of inventory on hand. Because of customer ordering patterns, our backlog reported for certain periods may fluctuate and may not be indicative of future results.
Manufacturing Capabilities
We operate manufacturing facilities, development centers and sales offices throughout the world. We have thirty-one facilities on five continents with 5.1 million square feet of manufacturing, lab and related space. Our manufacturing capabilities include the full suite of competencies relevant to support each site’s activities, including regulatory, quality assurance and in-house validation.
14
We operate our plants in accordance with cGMP. More than half of our facilities are registered with the FDA, with the remaining facilities being registered with other applicable regulatory agencies, such as the EMA. In some cases certain facilities are registered with multiple regulatory agencies.
We have invested approximately $385.9 million of cash outflows in our manufacturing facilities since fiscal 2013 through improvements and expansions in our facilities, including approximately $141.0 million on capital expenditures in fiscal 2015. We believe that our facilities and equipment are in good condition, are well maintained and are able to operate at or above present levels for the foreseeable future, in all material respects.
Our manufacturing operations are focused on employee health and safety, regulatory compliance, operational excellence, continuous improvement, and process standardization across the organization. In fiscal 2015, we achieved approximately 98% on-time shipment delivery versus customer request date across our network as a result of this focus. Our manufacturing operations are structured around an enterprise management philosophy and methodology that utilizes principles and tools common to a number of quality management programs, including Six Sigma and Lean Manufacturing.
Raw Materials
We use a broad and diverse range of raw materials in the design, development and manufacture of our products. This includes, but is not limited to, key materials such as gelatin, starch, and iota carrageenan for the Oral Technologies segment; packaging films for our Development & Clinical Services segment, and resin for our blow-fill-seal business in our Medication Delivery Solutions segment. The raw materials that we use are sourced externally on a global basis. Globally, our supplier relationships could be interrupted due to natural disasters and international supply disruptions, including those caused by pandemics, geopolitical and other issues. For example, the supply of gelatin is obtained from a limited number of sources. In addition, much of the gelatin we use is bovine-derived. Past concerns of contamination from Bovine Spongiform Encephalopathy (“BSE”) have narrowed the number of possible sources of particular types of gelatin. If there were a future disruption in the supply of gelatin from any one or more key suppliers, there can be no assurance that we could obtain an alternative supply from our other suppliers. If future restrictions were to emerge on the use of bovine-derived gelatin from certain geographic sources due to concerns of contamination from BSE, any such restriction could hinder our ability to timely supply our customers with products and the use of alternative non-bovine-derived gelatin for specific customer products could be subject to lengthy formulation, testing and regulatory approval.
We work very closely with our suppliers to assure continuity of supply while maintaining excellence in material quality and reliability, and we have an active and effective supplier audit program. We continually evaluate alternate sources of supply, although we do not frequently pursue regulatory qualification of alternative sources for key raw materials due to the strength of our existing supplier relationships, the reliability of our current supplier base and the time and expense associated with the regulatory process. Although a change in suppliers could require significant effort or investment by us in circumstances where the items supplied are integral to the performance of our products or incorporate specialized material such as gelatin, we do not believe that the loss of any existing supply arrangement would have a material adverse effect on our business. See “Risk Factors-Risks Relating to Our Business and Industry-Our future results of operations are subject to fluctuations in the costs, availability, and suitability of the components of the products we manufacture, including active pharmaceutical ingredients, excipients, purchased components, and raw materials.”
Competition
We compete on several fronts both domestically and internationally, including with other companies that offer advanced delivery technologies or development services to pharmaceutical, biotechnology and consumer health companies based in North America, South America, Europe and the Asia-Pacific region. We also may compete with the internal operations of those pharmaceutical, biotechnology and consumer health manufacturers that choose to source these services internally, where possible.
Competition is driven by proprietary technologies and know-how (where relevant), consistency of operational performance, quality, price, value and speed. While we do have competitors who compete with us in our individual offerings, we do not believe we have competition from any directly comparable companies.
Research and Development Costs
Our research activities are primarily directed toward the development of new offerings and manufacturing process improvements. Costs incurred in connection with the development of new offerings and manufacturing process improvements are recorded within selling, general, and administrative expenses. Such research and development costs included in selling,
15
general, and administrative expenses amounted to $12.2 million, $17.5 million and $14.5 million for the fiscal years ended June 30, 2015, June 30, 2014 and June 30, 2013, respectively. Costs incurred in connection with research and development services we provide to customers and services performed in support of the commercial manufacturing process for customers are recorded within cost of sales. Such research and development costs included in cost of sales amounted to $41.3 million, $34.0 million and $35.0 million for the fiscal years ended June 30, 2015, June 30, 2014 and June 30, 2013, respectively.
Employees
As of June 30, 2015, we had approximately 8,700 employees in thirty-one facilities on five continents: ten facilities are in the United States, with certain employees at one facility being represented by a labor organization with their terms and conditions of employment being subject to a collective bargaining agreement. National works councils and/or labor organizations are active at all twelve of our European facilities consistent with labor environments/laws in European countries. Similar relationships with labor organizations or national works councils exist in our plants in Argentina, Brazil, and Australia. Our management believes that our employee relations are satisfactory.
North America | Europe | South America | Asia Pacific | Total | |
Approximate Number of Employees | 3,600 | 3,500 | 900 | 700 | 8,700 |
Intellectual Property
We rely on a combination of know-how, trade secrets, patents, copyrights and trademarks and other intellectual property laws, nondisclosure and other contractual provisions and technical measures to protect a number of our offerings, services and intangible assets. These proprietary rights are important to our ongoing operations. Certain of our operations and products are under intellectual property licenses from third parties, and in certain instances we license our technology to third parties. We also have a long track record of innovation across our lines of business and, to further encourage active innovation, we have developed incentive compensation systems linked to patent filings and other recognition and reward programs for scientists and non-scientists alike.
We have applied in the United States and certain foreign countries for registration of a number of trademarks, service marks and patents, some of which have been registered and issued, and also hold common law rights in various trademarks and service marks. We hold approximately 1,300 patents and patent applications worldwide in advanced drug delivery and biologics formulations and technologies, and manufacturing and other areas.
We hold patents and license rights relating to certain aspects of our formulations, nutritional and pharmaceutical dosage forms, mammalian cell engineering, and sterile manufacturing services. We also hold patents relating to certain processes and products. We have a number of pending patent applications in the United States and certain foreign countries, and intend to pursue additional patents as appropriate. We have enforced and will continue to enforce our intellectual property rights in the United States and worldwide.
We do not consider any particular patent, trademark, license, franchise or concession to be material to our overall business.
Regulatory Matters
The manufacture, distribution and marketing of the healthcare products of our customers are subject to extensive ongoing regulation by the FDA, other United States (“U.S.”) governmental authorities and foreign regulatory authorities. Certain of our subsidiaries are required to register for permits and/or licenses with, and must comply with the operating and security standards of, the Drug Enforcement Agency (the “DEA”), the FDA, the Department of Health and Human Services (the “DHHS”), the European Union (the “EU”) member states and various state boards of pharmacy, state health departments and/or comparable state agencies as well as foreign agencies, and certain accrediting bodies depending upon the type of operations and location of product distribution, manufacturing and sale.
In addition, certain of our subsidiaries are subject to the United States Federal Food, Drug, and Cosmetic Act, the Public Health Service Act, the Controlled Substances Act and comparable state and foreign regulations in certain of their activities.
16
Laws regulating the manufacture and distribution of healthcare products also exist in most other countries where our subsidiaries conduct business. In addition our international manufacturing operations are subject to local certification requirements, and must comply with domestic and/or foreign good manufacturing practices and quality system regulations established by the FDA and/or applicable foreign regulatory authorities.
We are also subject to various federal, state, local, foreign and transnational laws, regulations and recommendations, both in the United States and abroad, relating to safe working conditions, laboratory and manufacturing practices and the use, transportation and disposal of hazardous or potentially hazardous substances. In addition, U.S. and international import and export laws and regulations require us to abide by certain standards relating to the cross-border transit of finished goods, raw materials and supplies and the handling of information. We are also subject to various other laws and regulations concerning the conduct of our foreign operations, including the U.S. Foreign Corrupt Practices Act, the U.K. Anti-Bribery Act and other anti-bribery laws and laws pertaining to the accuracy of our internal books and records.
The costs associated with complying with the various applicable federal regulations, as well as state, local, foreign and transnational regulations, could be significant and the failure to comply with such legal requirements could have an adverse effect on our results of operations and financial condition. See “Risk Factors-Risks Relating to Failure to comply with existing and future regulatory requirements could adversely affect our results of operations and financial condition,” for additional discussion of the costs associated with complying with the various regulations.
In fiscal 2015, we underwent 65 regulatory audits and, over the last five fiscal years, we successfully completed more than 250 regulatory audits, with more than 50% resulting in no reported observations.
Quality Assurance
We are committed to ensuring and maintaining the highest standard of regulatory compliance while providing high quality products to our customers. To meet these commitments, we have developed and implemented a Catalent-wide quality management system throughout the organization. We have more than 1,100 employees around the globe focusing on quality and regulatory compliance. Our senior management team is actively involved in setting quality policies, standards and internal position papers as well as managing internal and external quality performance. Our quality assurance department provides quality leadership and supervises our quality systems programs. An internal audit program monitors compliance with applicable regulations, standards and internal policies. In addition, our facilities are subject to periodic inspection by the FDA and other equivalent local, state and foreign regulatory authorities and customers. All FDA, DEA and other regulatory inspectional observations have been resolved or are on track to be completed at the prescribed timeframe provided in response to the agency. We believe that our operations are in compliance in all material respects with the regulations under which our facilities are governed.
Environmental Matters
Our operations are subject to a variety of environmental, health and safety laws and regulations, including those of the U.S. Environmental Protection Agency (the “EPA”) and equivalent state, local and foreign regulatory agencies in each of the jurisdictions in which we operate. These laws and regulations govern, among other things, air emissions, wastewater discharges, the use, handling and disposal of hazardous substances and wastes, soil and groundwater contamination and employee health and safety. Our manufacturing facilities use, in varying degrees, hazardous substances in their processes. These substances include, among others, chlorinated solvents, and in the past chlorinated solvents were used at one or more of our facilities, including a number we no longer own or operate. As at our current facilities, contamination at such formerly owned or operated properties can result and has resulted in liability to us, for which we have recorded appropriate reserves as needed. We believe that our operations are in compliance in all material respects with the environment, health and safety regulations applicable to our facilities.
Available Information
We file annual, quarterly and special reports and other information with the SEC. Our filings with the SEC are available to the public on the SEC’s website at www.sec.gov. Those filings are also available to the public on, or accessible through, our website for free via the “Investors” section at www.catalent.com.
The information we file with the SEC or contained on or accessible through our corporate website or any other website that we may maintain is not incorporated by reference and is not part of this Annual Report on Form 10-K. You may also read and copy, at SEC prescribed rates, any document we file with the SEC at the SEC’s Public Reference Room located at 100 F Street, N.E., Washington D.C. 20549. You can call the SEC at 1-800-SEC-0330 to obtain information on the operation of the Public Reference Room.
17
ITEM 1A. | RISK FACTORS |
If any of the following risks actually occur, our business, financial condition, operating results or cash flow could be materially and adversely affected. Additional risks or uncertainties not presently known to us, or that we currently believe are immaterial, may also impair our business operations.
Risks Relating to Our Business and Industry
We participate in a highly competitive market and increased competition may adversely affect our business.
We operate in a market that is highly competitive. We compete on several fronts, both domestically and internationally, including competing with other companies that provide similar offerings to pharmaceutical, biotechnology and consumer health companies based in North America, Latin America, Europe and the Asia-Pacific region. We also may compete with the internal operations of those pharmaceutical, biotechnology and consumer health manufacturers that choose to source these offerings internally, where possible.
We face material competition in each of our markets. Competition is driven by proprietary technologies and know-how, capabilities, consistency of operational performance, quality, price, value and speed. Some competitors may have greater financial, research and development, operational and marketing resources than we do. Competition may also increase as additional companies enter our markets or use their existing resources to compete directly with ours. Expanded competition from companies in low-cost jurisdictions, such as India and China, may in the future adversely affect our results of operations or limit our growth. Greater financial, research and development, operational and marketing resources may allow our competitors to respond more quickly with new, alternative or emerging technologies. Changes in the nature or extent of our customer requirements may render our offerings obsolete or non-competitive and could adversely affect our results of operations and financial condition.
The demand for our offerings depends in part on our customers’ research and development and the clinical and market success of their products. Our business, financial condition and results of operations may be harmed if our customers spend less on, or are less successful in, these activities.
Our customers are engaged in research, development, production and marketing of pharmaceutical, biotechnology and consumer health products. The amount of customer spending on research, development, production and marketing, as well as the outcomes of such research, development, and marketing activities, have a large impact on our sales and profitability, particularly the amount our customers choose to spend on our offerings. Our customers determine the amounts that they will spend based upon, among other things, available resources and their need to develop new products, which, in turn, is dependent upon a number of factors, including their competitors’ research, development and production initiatives, and the anticipated market uptake, clinical and reimbursement scenarios for specific products and therapeutic areas. In addition, consolidation in the industries in which our customers operate may have an impact on such spending as customers integrate acquired operations, including research and development departments and their budgets. Our customers finance their research and development spending from private and public sources. A reduction in spending by our customers could have a material adverse effect on our business, financial condition and results of operations. If our customers are not successful in attaining or retaining product sales due to market conditions, reimbursement issues or other factors, our results of operations may be materially adversely affected.
We are subject to product and other liability risks that could adversely affect our results of operations, financial condition, liquidity and cash flows.
We are subject to potentially significant product liability and other liability risks that are inherent in the design, development, manufacture and marketing of our offerings. We may be named as a defendant in product liability lawsuits, which may allege that our offerings have resulted or could result in an unsafe condition or injury to consumers. Such lawsuits could be costly to defend and could result in reduced sales, significant liabilities and diversion of management’s time, attention and resources. Even claims without merit could subject us to adverse publicity and require us to incur significant legal fees.
Furthermore, product liability claims and lawsuits, regardless of their ultimate outcome, could have a material adverse effect on our business operations, financial condition and reputation and on our ability to attract and retain customers. We have historically sought to manage this risk through the combination of product liability insurance and contractual indemnities and liability limitations in our agreements with customers and vendors. The availability of product liability insurance for companies in the pharmaceutical industry is generally more limited than insurance available to companies in other industries. Insurance carriers providing product liability insurance to those in the pharmaceutical and biotechnology industries generally limit the amount of available policy limits, require larger self-insured retentions and exclude coverage for certain products and claims.
18
We maintain product liability insurance with annual aggregate limits in excess of $25 million. There can be no assurance that a successful product liability claim or other liability claim would be adequately covered by our applicable insurance policies or by any applicable contractual indemnity or liability limitations.
Failure to comply with existing and future regulatory requirements could adversely affect our results of operations and financial condition.
The healthcare industry is highly regulated. We are subject to various local, state, federal, foreign and transnational laws and regulations, which include the operating and security standards of the DEA, the FDA, various state boards of pharmacy, state health departments, the DHHS, the EU member states and other comparable agencies and, in the future, any changes to such laws and regulations could adversely affect us. In particular, we are subject to laws and regulations concerning good manufacturing practices and drug safety. Our subsidiaries may be required to register for permits and/or licenses with, and may be required to comply with the laws and regulations of the DEA, the FDA, the DHHS, foreign agencies including the EMA, and other various state boards of pharmacy, state health departments and/or comparable state agencies as well as certain accrediting bodies depending upon the type of operations and location of product distribution, manufacturing and sale.
The manufacture, distribution and marketing of our offerings for use in our customers’ products are subject to extensive ongoing regulation by the FDA, the DEA, the EMA, and other equivalent local, state, federal and foreign regulatory authorities. Failure by us or by our customers to comply with the requirements of these regulatory authorities could result in warning letters, product recalls or seizures, monetary sanctions, injunctions to halt manufacture and distribution, restrictions on our operations, civil or criminal sanctions, or withdrawal of existing or denial of pending approvals, including those relating to products or facilities. In addition, such a failure could expose us to contractual or product liability claims as well as contractual claims from our customers, including claims for reimbursement for lost or damaged active pharmaceutical ingredients, which cost could be significant.
In addition, any new offering or product classified as a pharmaceutical product must undergo lengthy and rigorous clinical testing and other extensive, costly and time-consuming procedures mandated by the FDA, the EMA and other equivalent local, state, federal and foreign regulatory authorities. We or our customers may elect to delay or cancel anticipated regulatory submissions for current or proposed new products for any number of reasons.
Although we believe that we comply in all material respects with applicable laws and regulations, there can be no assurance that a regulatory agency or tribunal would not reach a different conclusion concerning the compliance of our operations with applicable laws and regulations. In addition, there can be no assurance that we will be able to maintain or renew existing permits, licenses or any other regulatory approvals or obtain, without significant delay, future permits, licenses or other approvals needed for the operation of our businesses. Any noncompliance by us with applicable laws and regulations or the failure to maintain, renew or obtain necessary permits and licenses could have an adverse effect on our results of operations and financial condition.
Failure to provide quality offerings to our customers could have an adverse effect on our business and subject us to regulatory actions and costly litigation.
Our results depend on our ability to execute and improve when necessary our quality management strategy and systems, and effectively train and maintain our employee base with respect to quality management. Quality management plays an essential role in determining and meeting customer requirements, preventing defects and improving our offerings. While we have a network of quality systems throughout our business units and facilities that relate to the design, formulation, development, manufacturing, packaging, sterilization, handling, distribution and labeling of our customers’ products which use our offerings, quality and safety issues may occur with respect to any of our offerings. A quality or safety issue could have an adverse effect on our business, financial condition and results of operations and may subject us to regulatory actions, including product recalls, product seizures, injunctions to halt manufacture or distribution, restrictions on our operations, or civil sanctions, including monetary sanctions and criminal actions. In addition, such an issue could subject us to costly litigation, including claims from our customers for reimbursement for the cost of lost or damaged active pharmaceutical ingredients, the cost of which could be significant.
The services and offerings we provide are highly exacting and complex, and if we encounter problems providing the services or support required, our business could suffer.
The offerings we provide are highly exacting and complex, particularly in our Medication Delivery Solutions segment, due in part to strict regulatory requirements. From time to time, problems may arise in connection with facility operations or during preparation or provision of an offering, in both cases for a variety of reasons including, but not limited to, equipment
19
malfunction, sterility variances or failures, failure to follow specific protocols and procedures, problems with raw materials, environmental factors and damage to, or loss of, manufacturing operations due to fire, flood or similar causes. Such problems could affect production of a particular batch or series of batches, requiring the destruction of product, or could halt facility production altogether. This could, among other things, lead to increased costs, lost revenue, damage to customer relations, reimbursement to customers for lost active pharmaceutical ingredients, time and expense spent investigating the cause and, depending on the cause, similar losses with respect to other batches or products. Production problems in our drug and biologic manufacturing operations could be particularly significant because the cost of raw materials is often higher than in our other businesses. If problems are not discovered before the product is released to the market, recall and product liability costs may also be incurred. In addition, such risks may be greater at facilities that are new or going through significant expansion or renovation.
Our global operations are subject to a number of economic, political and regulatory risks.
We conduct our operations in various regions of the world, including North America, South America, Europe and the Asia-Pacific region. Global economic and regulatory developments affect businesses such as ours in many ways. Our operations are subject to the effects of global competition, including potential competition from manufacturers in low-cost jurisdictions such as India and China. Local jurisdiction risks include regulatory risks arising from local laws. Our global operations are also affected by local economic environments, including inflation and recession. Political changes, some of which may be disruptive, can interfere with our supply chain and customers and some or all of our activities in a particular location. While some of these risks can be hedged using derivatives or other financial instruments and some are insurable, such attempts to mitigate these risks are costly and not always successful. Also, fluctuations in foreign currency exchange rates can adversely affect our consolidated financial results.
If we do not enhance our existing or introduce new technology or service offerings in a timely manner, our offerings may become obsolete over time, customers may not buy our offerings and our revenue and profitability may decline.
The healthcare industry is characterized by rapid technological change. Demand for our offerings may change in ways we may not anticipate because of such evolving industry standards as well as a result of evolving customer needs that are increasingly sophisticated and varied and the introduction by others of new offerings and technologies that provide alternatives to our offerings. Several of our higher margin offerings are based on proprietary technologies. The patents for these technologies will ultimately expire, and these offerings may become subject to competition. Without the timely introduction of enhanced or new offerings, our offerings may become obsolete over time, in which case our revenue and operating results would suffer. For example, if we are unable to respond to changes in the nature or extent of the technological or other needs of our pharmaceutical customers through enhancing our offerings, our competition may develop offering portfolios that are more competitive than ours and we could find it more difficult to renew or expand existing agreements or obtain new agreements. Innovations directed at continuing to offer enhanced or new offerings generally will require a substantial investment before we can determine their commercial viability, and we may not have the financial resources necessary to fund these innovations.
The success of enhanced or new offerings will depend on several factors, including our ability to:
• | properly anticipate and satisfy customer needs, including increasing demand for lower cost products; |
• | enhance, innovate, develop and manufacture new offerings in an economical and timely manner; |
• | differentiate our offerings from competitors’ offerings; |
• | achieve positive clinical outcomes for our customers’ new products; |
• | meet safety requirements and other regulatory requirements of governmental agencies; |
• | obtain valid and enforceable intellectual property rights; and |
• | avoid infringing the proprietary rights of third parties. |
Even if we succeed in creating enhanced or new offerings from these innovations, they may still fail to result in commercially successful offerings or may not produce revenue in excess of the costs of development, and they may be quickly rendered obsolete by changing customer preferences or the introduction by our competitors of offerings embodying new technologies or features. Finally, innovations may not be accepted quickly in the marketplace because of, among other things, entrenched patterns of clinical practice, the need for regulatory clearance and uncertainty over market access or government or third-party reimbursement.
20
We and our customers depend on patents, copyrights, trademarks, trade secrets and other forms of intellectual property protections, but, these protections may not be adequate.
We rely on a combination of know-how, trade secrets, patents, copyrights and trademarks and other intellectual property laws, nondisclosure and other contractual provisions and technical measures to protect a number of our offerings and intangible assets. These proprietary rights are important to our ongoing operations. There can be no assurance that these protections will prove meaningful against competitive offerings or otherwise be commercially valuable or that we will be successful in obtaining additional intellectual property or enforcing our intellectual property rights against unauthorized users. Our exclusive rights under certain of our offerings are protected by patents, some of which will expire in the near term. When patents covering an offering expire, loss of exclusivity may occur and this may force us to compete with third parties, thereby affecting our revenue and profitability. We do not currently expect any material loss of revenue to occur as a result of the expiration of any Catalent patent.
Our proprietary rights may be invalidated, circumvented or challenged. We have in the past been subject to patent oppositions before the European Patent Office and we may in the future be subject to patent oppositions in Europe or other jurisdictions in which we hold patent rights. In addition, in the future, we may need to take legal actions to enforce our intellectual property rights, to protect our trade secrets or to determine the validity and scope of the proprietary rights of others. The outcome of any such legal action may be unfavorable to us.
These legal actions regardless of outcome might result in substantial costs and diversion of resources and management attention. Although we use reasonable efforts to protect our proprietary and confidential information, there can be no assurance that our confidentiality and non-disclosure agreements will not be breached, our trade secrets will not otherwise become known by competitors or that we will have adequate remedies in the event of unauthorized use or disclosure of proprietary information. Even if the validity and enforceability of our intellectual property is upheld, a court might construe our intellectual property not to cover the alleged infringement. In addition, intellectual property enforcement may be unavailable in some foreign countries. There can be no assurance that our competitors will not independently develop technologies that are substantially equivalent or superior to our technology or that third parties will not design around our patent claims to produce competitive offerings. The use of our technology or similar technology by others could reduce or eliminate any competitive advantage we have developed, cause us to lose sales or otherwise harm our business.
We have applied in the United States and certain foreign countries for registration of a number of trademarks, service marks and patents, some of which have been registered or issued, and also claim common law rights in various trademarks and service marks. In the past, third parties have opposed our applications to register intellectual property and there can be no assurance that they will not do so in the future. It is possible that in some cases we may be unable to obtain the registrations for trademarks, service marks and patents for which we have applied and a failure to obtain trademark and patent registrations in the United States or other countries could limit our ability to protect our trademarks and proprietary technologies and impede our marketing efforts in those jurisdictions.
Our use of certain intellectual property rights is also subject to license agreements with third parties for certain patents, software and information technology systems and proprietary technologies. If these license agreements were terminated for any reason, it could result in the loss of our rights to this intellectual property, our operations may be materially adversely affected and we may be unable to commercialize certain offerings.
In addition, many of our branded pharmaceutical customers rely on patents to protect their products from generic competition. Because incentives exist in some countries, including the United States, for generic pharmaceutical companies to challenge these patents, pharmaceutical and biotechnology companies are under the ongoing threat of a challenge to their patents. If our customers’ patents were successfully challenged and as a result subjected to generic competition, the market for our customers’ products could be significantly adversely affected, which could have an adverse effect on our results of operations and financial condition.
Our future results of operations are subject to fluctuations in the costs, availability, and suitability of the components of the products we manufacture, including active pharmaceutical ingredients, excipients, purchased components, and raw materials.
We depend on various active pharmaceutical ingredients, components, compounds, raw materials, and energy supplied primarily by others for our offerings. This includes, but is not limited to, gelatin, starch, iota carrageenan, petroleum-based products and resin. Also, our customers frequently provide their active pharmaceutical or biologic ingredient for formulation or incorporation in the finished product. It is possible that any of our customer supplier relationships could be interrupted due to
21
natural disasters, international supply disruptions caused by pandemics, geopolitical issues and other events, or could be terminated in the future.
For example, gelatin is a key component in our Oral Technologies segment. Gelatin is available from only a limited number of sources. In addition, much of the gelatin we use is bovine-derived. Past concerns of contamination from BSE have narrowed the number of possible sources of particular types of gelatin. If there were a future disruption in the supply of gelatin from any one or more key suppliers, we may not be able to obtain an adequate alternative supply from our other suppliers. If future restrictions were to emerge on the use of bovine-derived gelatin due to concerns of contamination from BSE, any such restriction could hinder our ability to timely supply our customers with products and the use of alternative non-bovine-derived gelatin could be subject to lengthy formulation, testing and regulatory approval.
Any sustained interruption in our receipt of adequate supplies could have an adverse effect on us. In addition, while we have processes intended to reduce volatility in component and material pricing, we may not be able to successfully manage price fluctuations and future price fluctuations or shortages may have an adverse effect on our results of operations.
Changes in market access or healthcare reimbursement for our customers’ products in the United States or internationally could adversely affect our results of operations and financial condition.
The healthcare industry has changed significantly over time, and we expect the industry to continue to evolve. Some of these changes, such as ongoing healthcare reform, adverse changes in governmental or private funding of healthcare products and services, legislation or regulations governing patient access to care and privacy, or the delivery, pricing or reimbursement approval of pharmaceuticals and healthcare services or mandated benefits, may cause healthcare industry participants to change the amount of our offerings they purchase or the price they are willing to pay for our offerings. Changes in the healthcare industry’s pricing, selling, inventory, distribution or supply policies or practices could also significantly reduce our revenue and results of operations. In particular, volatility in individual product demand may result from changes in public or private payer reimbursement or coverage.
Fluctuations in the exchange rate of the U.S. dollar and other foreign currencies could have a material adverse effect on our financial performance and results of operations.
As a company with many international operations, certain revenues, costs, assets and liabilities, including a portion of our senior secured credit facilities, are denominated in currencies other than the U.S. dollar. As a result, changes in the exchange rates of these currencies or any other applicable currency to the U.S. dollar will affect our revenues, earnings and cash flows and could result in unrealized and realized exchange losses despite any efforts we may undertake to manage or mitigate our exposure to foreign currency fluctuations.
Tax legislation initiatives or challenges to our tax positions could adversely affect our results of operations and financial condition.
We are a large multinational corporation with operations in the United States and international jurisdictions, including North America, South America, Europe and the Asia-Pacific region. As such, we are subject to the tax laws and regulations of the United States federal, state and local governments and of many international jurisdictions. From time to time, various legislative initiatives may be proposed that could adversely affect our tax positions. There can be no assurance that our effective tax rate or tax payments will not be adversely affected by these initiatives. In addition, United States federal, state and local, as well as international tax laws and regulations are extremely complex and subject to varying interpretations. There can be no assurance that our tax positions will not be challenged by relevant tax authorities or that we would be successful in any such challenge.
22
Our ability to use our net operating loss carryforwards and certain other tax attributes may be limited.
We have net operating loss carryforwards available to reduce future taxable income. Utilization of our net operating loss carryforwards may be subject to a substantial limitation under Section 382 of the Internal Revenue Code of 1986, as amended (the “Code”), and comparable provisions of state, local and foreign tax laws due to changes in ownership of our company that may occur in the future. Under Section 382 of the Code and comparable provisions of state, local and foreign tax laws, if a corporation undergoes an “ownership change,” generally defined as a greater than 50% change by value in its equity ownership over a three-year period, the corporation’s ability to carryforward its pre-change net operating loss carryforwards to reduce its post-change income may be limited. We may experience ownership changes in the future as a result of future changes in our stock ownership. As a result, if we generate taxable income in future years, our ability to use our pre-change net operating loss carryforwards to reduce U.S. federal and state taxable income may be subject to limitations, which could result in increased future tax liability to us.
We may be required to re-establish a full valuation allowance against our U.S. deferred tax assets in the future.
We have deferred tax assets for net operating loss carryforwards and other temporary differences. We currently do not maintain a valuation allowance for a portion of our U.S. net deferred tax assets. We may experience, in the future, a decline in U.S. federal taxable income, resulting from a decline in profitability of our U.S. operations, an increased level of debt in the U.S. or other factors. In assessing our ability to realize our U.S. deferred tax assets, we may conclude that it is more likely than not that some portion or all of our U.S. deferred tax assets will not be realized. As a result, we may be required to record a full valuation allowance against our U.S. deferred tax assets, which could adversely impact our effective income tax rate.
We are dependent on key personnel.
We depend on senior executive officers and other key personnel, including our technical personnel, to operate and grow our business and to develop new enhancements, offerings and technologies. The loss of any of these officers or other key personnel combined with a failure to attract and retain suitably skilled technical personnel could adversely affect our operations.
In addition to our executive officers, we rely on approximately 150 senior employees to lead and direct the Company. Our senior leadership team (“SLT”) is comprised of our executive officers and other vice presidents and directors who hold critical positions and possess specialized talents and capabilities that give us a competitive advantage in the market. The members of the SLT hold positions such as general manager of manufacturing, general manager of analytical and development laboratories, vice president/general manager of business unit commercial development, director of operations, and vice president of quality and regulatory activities.
With respect to our technical talent, we have approximately 900 scientists and technicians whose areas of expertise and specialization cover subjects such as advanced delivery, drug and biologics formulation and manufacturing. Many of our sites and laboratories are located in competitive labor markets like Morrisville, North Carolina; Brussels, Belgium; Woodstock, Illinois; Madison, Wisconsin; and Schorndorf, Germany. Global and regional competitors and, in some cases, customers and suppliers, compete for the same skills and talent as we do.
Risks generally associated with information and communications systems could adversely affect our results of operations.
We rely on information systems in our business to obtain, rapidly process, analyze and manage data to:
• | facilitate the manufacture and distribution of thousands of inventory items to and from our facilities; |
• | receive, process and ship orders on a timely basis; |
• | manage the accurate billing and collections for thousands of customers; |
• | manage the accurate accounting and payment for thousands of vendors; and |
• | schedule and operate our global network of development, manufacturing and packaging facilities. |
Our results of operations could be adversely affected if these systems are interrupted, damaged by unforeseen events or fail for any extended period of time, including due to the actions of third parties.
23
We may in the future engage in acquisitions and other transactions that may complement or expand our business or divest of non-strategic businesses or assets. We may not be able to complete such transactions, and such transactions, if executed, pose significant risks and could have a negative effect on our operations.
Our future success may be dependent on opportunities to buy other businesses or technologies and possibly enter into joint ventures that could complement, enhance or expand our current business or offerings and services or that might otherwise offer us growth opportunities. We may face competition from other companies in pursuing acquisitions in the pharmaceutical and biotechnology industry. Our ability to acquire targets may also be limited by applicable antitrust laws and other regulations in the United States and other foreign jurisdictions in which we do business. To the extent that we are successful in making acquisitions, we may have to expend substantial amounts of cash, incur debt and assume loss-making divisions. We may not be able to complete such transactions, for reasons including, but not limited to, a failure to secure financing. Any transactions that we are able to identify and complete may involve a number of risks, including the diversion of management’s attention to integrate the acquired businesses or joint ventures, the possible adverse effects on our operating results during the integration process, the potential loss of customers or employees in connection with the acquisition, delays or reduction in realizing expected synergies, unexpected liabilities relating to a joint venture of acquired business and our potential inability to achieve our intended objectives for the transaction. In addition, we may be unable to maintain uniform standards, controls, procedures and policies, and this may lead to operational inefficiencies.
To the extent that we are not successful in completing divestitures, as such may be determined by future strategic plans and business performance, we may have to expend substantial amounts of cash, incur debt and continue to absorb loss-making or under-performing divisions. Any divestitures that we are unable to complete may involve a number of risks, including diversion of management’s attention, a negative impact on our customer relationships, costs associated with retaining the targeted divestiture, closing and disposing of the affected business or transferring business to other facilities.
Our offerings and our customers’ products may infringe on the intellectual property rights of third parties.
From time to time, third parties have asserted intellectual property infringement claims against us and our customers and there can be no assurance that third parties will not assert infringement claims against either us or our customers in the future. While we believe that our offerings do not infringe in any material respect upon proprietary rights of other parties and/or that meritorious defenses would exist with respect to any assertions to the contrary, there can be no assurance that we would not be found to infringe on the proprietary rights of others. Patent applications in the United States and some foreign countries are generally not publicly disclosed until the patent is issued or published, and we may not be aware of currently filed patent applications that relate to our offerings or processes. If patents later issue on these applications, we may be found liable for subsequent infringement. There has been substantial litigation in the pharmaceutical and biotechnology industries with respect to the manufacture, use and sale of products that are the subject of conflicting patent rights.
Any claims that our offerings or processes infringe these rights (including claims arising through our contractual indemnification of our customers), regardless of their merit or resolution, could be costly and may divert the efforts and attention of our management and technical personnel. We may not prevail in such proceedings given the complex technical issues and inherent uncertainties in intellectual property litigation. If such proceedings result in an adverse outcome, we could, among other things, be required to:
• | pay substantial damages (potentially treble damages in the United States); |
• | cease the manufacture, use or sale of the infringing offerings or processes; |
• | discontinue the use of the infringing technology; |
• | expend significant resources to develop non-infringing technology; |
• | license technology from the third party claiming infringement, which license may not be available on commercially reasonable terms, or may not be available at all; and |
• | lose the opportunity to license our technology to others or to collect royalty payments based upon successful protection and assertion of our intellectual property against others. |
In addition, our customers’ products may be subject to claims of intellectual property infringement and such claims could materially affect our business if their products cease to be manufactured or they have to discontinue the use of the infringing technology.
Any of the foregoing could affect our ability to compete or have a material adverse effect on our business, financial condition and results of operations.
24
We are subject to environmental, health and safety laws and regulations, which could increase our costs and restrict our operations in the future.
Our operations are subject to a variety of environmental, health and safety laws and regulations, including those of the EPA and the U.S. Occupational Safety & Health Administration and equivalent local, state, and foreign regulatory agencies in each of the jurisdictions in which we operate. These laws and regulations govern, among other things, air emissions, wastewater discharges, the use, handling and disposal of hazardous substances and wastes, soil and groundwater contamination and employee health and safety. Any failure by us to comply with environmental, health and safety requirements could result in the limitation or suspension of production or subject us to monetary fines or civil or criminal sanctions, or other future liabilities in excess of our reserves. We are also subject to laws and regulations governing the destruction and disposal of raw materials and non-compliant products, the handling of regulated material that are included in our offerings, and the disposal of our offerings at the end of their useful life. In addition, compliance with environmental, health and safety requirements could restrict our ability to expand our facilities or require us to acquire costly pollution control equipment, incur other significant expenses or modify our manufacturing processes. Our manufacturing facilities may use, in varying degrees, hazardous substances in their processes. These substances include, among others, chlorinated solvents, and in the past chlorinated solvents were used at one or more of our facilities, including a number we no longer own or operate. As at our current facilities, contamination at such formerly owned or operated properties can result and has resulted in liability to us. In the event of the discovery of new or previously unknown contamination either at our facilities or at third-party locations, including facilities we formerly owned or operated, the issuance of additional requirements with respect to existing contamination, or the imposition of other cleanup obligations for which we are responsible, we may be required to take additional, unplanned remedial measures for which no reserves have been recorded. We are conducting monitoring and cleanup of contamination at certain facilities currently or formerly owned or operated by us. We have established accounting reserves for certain contamination liabilities but cannot assure you that such liabilities will not exceed our reserves.
We are subject to labor and employment laws and regulations, which could increase our costs and restrict our operations in the future.
We employ approximately 8,700 employees worldwide, including approximately 3,600 employees in North America, 3,500 in Europe, 900 in South America and 700 in the Asia/Pacific region. Certain employees at one of our North American facilities are represented by a labor organization, and national works councils and/or labor organizations are active at all of our European facilities consistent with labor environments/laws in European countries. Similar relationships with labor organizations or national works councils exist in our plants in Argentina, Brazil and Australia. Our management believes that our employee relations are satisfactory. However, further organizing activities or collective bargaining may increase our employment-related costs and we may be subject to work stoppages and other labor disruptions. Moreover, as employers are subject to various employment-related claims, such as individual and class actions relating to alleged employment discrimination, wage-hour and labor standards issues, such actions, if brought against us and successful in whole or in part, may affect our ability to compete or have a material adverse effect on our business, financial condition and results of operations.
Certain of our pension plans are underfunded, and additional cash contributions we may make will reduce the cash available for our business, such as the payment of our interest expense.
Certain of our current and former employees in the United States, United Kingdom, Germany, France, Japan and Australia are participants in defined benefit pension plans that we sponsor. As of June 30, 2015, the underfunded amount of our pension plans on a worldwide basis was approximately $101.7 million, primarily related to our fiscal 2012 plans in the United Kingdom and Germany. In addition, we have an estimated obligation of approximately $39.5 million, as of June 30, 2015, related to our withdrawal from a multiemployer pension plan in which we participated, resulting in a total underfunded amount related to our pension plans of $141.2 million as of June 30, 2015. In general, the amount of future contributions to the underfunded plans will depend upon asset returns and a number of other factors and, as a result, the amount we may be required to contribute to such plans in the future may vary. Such cash contributions to the plans will reduce the cash available for our business to pursue strategic growth initiatives or the payment of interest expense on the notes or our other indebtedness.
25
Risks Relating to Our Indebtedness
Our substantial leverage could adversely affect our ability to raise additional capital to fund our operations, limit our ability to react to changes in the economy or in our industry, expose us to interest-rate risk to the extent of our variable rate debt and prevent us from meeting our obligations under our indebtedness.
We are highly leveraged. As of June 30, 2015, we had $1,826.8 million (dollar equivalent) of senior indebtedness; an additional $188.3 million of un-utilized capacity and $11.7 million of outstanding letters of credit under our revolving credit facility.
Our high degree of leverage could have important consequences for us, including:
• | increasing our vulnerability to adverse economic, industry or competitive developments; |
• | exposing us to the risk of increased interest rates because certain of our borrowings, including borrowings under our senior secured credit facilities, are at variable rates of interest; |
• | exposing us to the risk of fluctuations in exchange rates because certain of our borrowings, including certain of our senior secured term loan facilities, are denominated in euros; |
• | making it more difficult for us to satisfy our obligations with respect to our indebtedness, and any failure to comply with the obligations of any of our debt instruments, including restrictive covenants and borrowing conditions, could result in an event of default under the agreements governing such indebtedness; |
• | restricting us from making strategic acquisitions or causing us to make non-strategic divestitures; |
• | limiting our ability to obtain additional financing for working capital, capital expenditures, product development, debt service requirements, acquisitions and general corporate or other purposes; and |
• | limiting our flexibility in planning for, or reacting to, changes in our business or market conditions and placing us at a competitive disadvantage compared to our competitors who are less highly leveraged and who, therefore, may be able to take advantage of opportunities that our leverage prevents us from exploiting. |
Our total interest expense, net was $105.0 million, $163.1 million and $203.2 million for fiscal years 2015, 2014 and 2013, respectively. After taking into consideration our ratio of fixed-to-floating rate debt, a 100 basis point increase in such rates would increase our annual interest expense by approximately $0.6 million.
Despite our high indebtedness level, we and our subsidiaries will still be able to incur significant additional amounts of debt, which could further exacerbate the risks associated with our substantial indebtedness.
We and our subsidiaries may be able to incur substantial additional indebtedness in the future. Although the agreements governing our indebtedness contain restrictions on the incurrence of additional indebtedness, these restrictions are subject to a number of significant qualifications and exceptions and, under certain circumstances, the amount of indebtedness that could be incurred in compliance with these restrictions could be substantial.
Our debt agreements contain restrictions that limit our flexibility in operating our business.
The agreements governing our outstanding indebtedness contain various covenants that limit our ability to engage in specified types of transactions. These covenants limit the ability of our subsidiary, Catalent Pharma Solutions, Inc., and its restricted subsidiaries to, among other things:
• | incur additional indebtedness and issue certain preferred stock; |
• | pay certain dividends on, repurchase or make distributions in respect of capital stock or make other restricted payments; |
• | place limitations on distributions from restricted subsidiaries; |
• | issue or sell capital stock of restricted subsidiaries; |
• | guarantee certain indebtedness; |
• | make certain investments; |
• | sell or exchange assets; |
• | enter into transactions with affiliates; |
26
• | create certain liens; and |
• | consolidate, merge or transfer all or substantially all of their assets and the assets of their subsidiaries on a consolidated basis. |
A breach of any of these covenants could result in a default under one or more of these agreements, including as a result of cross default provisions, and, in the case of our revolving credit facility, permit the lenders to cease making loans to us.
We may utilize derivative financial instruments to reduce our exposure to market risks from changes in interest rates on our variable-rate indebtedness and we will be exposed to risks related to counterparty credit worthiness or non-performance of these instruments.
We may enter into pay-fixed interest-rate swaps to limit our exposure to changes in variable interest rates. Such instruments may result in economic losses should exchange rates decline to a point lower than our fixed-rate commitments. We will be exposed to credit-related losses that could adversely affect our results of operations in the event of fluctuations in the fair value of the interest-rate swaps due to a change in the credit worthiness or non-performance by the counterparties to the interest-rate swaps.
Risks Related to Ownership of Our Common Stock
Our stock price may change significantly, and you may not be able to resell shares of our common stock at or above the price you paid or at all, and you could lose all or part of your investment as a result.
The trading price of our common stock has been, and continues to be volatile. Since shares of our common stock were offered for sale in our initial public offering on July 31, 2014 through June 30, 2015, our common stock price ranged from $19.85 to $32.11. The trading price of our common stock may be adversely affected due to a number of factors such as those listed in “Risks Related to Our Business and Our Industry” and the following:
• | results of operations that vary from the expectations of securities analysts and investors; |
• | results of operations that vary from those of our competitors; |
• | changes in expectations as to our future financial performance, including financial estimates and investment recommendations by securities analysts and investors; |
• | declines in the market prices of stocks generally, or those of pharmaceutical or other healthcare companies; |
• | strategic actions by us or our competitors; |
• | announcements by us or our competitors of significant contracts, new products, acquisitions, joint marketing relationships, joint ventures, other strategic relationships or capital commitments; |
• | changes in general economic or market conditions or trends in our industry or markets; |
• | changes in business or regulatory conditions; |
• | future sales of our common stock or other securities; |
• | investor perceptions or the investment opportunity associated with our common stock relative to other investment alternatives; |
• | the public response to press releases or other public announcements by us or third parties, including our filings with the SEC; |
• | announcements relating to litigation; |
• | guidance, if any, that we provide to the public, any changes in this guidance or our failure to meet this guidance; |
• | the development and sustainability of an active trading market for our stock; |
• | changes in accounting principles; and |
• | other events or factors, including those resulting from natural disasters, war, acts of terrorism or responses to these events. |
27
Broad market and industry fluctuations may adversely affect the market price of our common stock, regardless of our actual operating performance. In addition, price volatility may be greater if the public float and trading volume of our common stock is low, and the amount of public float on any given day can vary depending on whether our stockholders choose to hold for the long term.
In the past, following periods of market volatility, stockholders have instituted securities class action litigation. If we were involved in securities litigation, it could have a substantial cost and divert resources and the attention of executive management from our business regardless of the outcome of such litigation.
Because we have no plans to pay cash dividends on our common stock for the foreseeable future, you may not receive any return on investment unless you sell your common stock for a price greater than that which you paid for it.
We currently intend to retain future earnings, if any, for future operations, expansion and debt repayment and have no current plans to pay any cash dividend for the foreseeable future. The declaration, amount and payment of any future dividend on shares of our common stock will be at the sole discretion of our board of directors. Our board of directors may take into account general and economic conditions, our financial condition and results of operations, our available cash and current and anticipated cash needs, possible future favorable deployment of our cash, our future capital requirements, contractual, legal, tax and regulatory restrictions and implications on the payment of dividends by us to our stockholders or by our subsidiaries to us and such other factors as our board of directors may deem relevant. In addition, our ability to pay dividends is limited by covenants of our outstanding indebtedness and may be limited by covenants of any future indebtedness we or our subsidiaries incur. As a result, you may not receive any return on an investment in our common stock unless you sell our common stock for a price greater than that which you paid for it.
If securities analysts do not publish research or reports about our business or if they downgrade our stock or our sector, our stock price and trading volume could decline.
The trading market for our common stock relies in part on the research and reports that industry or financial analysts publish about us or our business. We do not control these analysts. Furthermore, if one or more of the analysts who do cover us downgrade our stock or our industry, or change their views regarding the stock of any of our competitors or other healthcare sector companies, or publish inaccurate or unfavorable research about our business, the price of our stock could decline. If one or more of these analysts ceases coverage of the Company or fails to publish reports on us regularly, we could lose visibility in the market, which in turn could cause our stock price or trading volume to decline.
Future sales, or the perception of future sales of common stock, by us or our existing stockholders could cause the market price for our common stock to decline.
The sale of shares of our common stock in the public market, or the perception that such sales could occur, could harm the prevailing market price of shares of our common stock. These sales, or the possibility that these sales may occur, also might make it more difficult for us to sell equity securities in the future at a time and at a price that we deem appropriate.
As of September 1, 2015, 151,304 shares of our common stock, representing less than 1% of our total outstanding shares of common stock, are “restricted securities” within the meaning of Rule 144 of the Securities Act (“Rule 144”) and subject to certain restrictions on resale. Restricted securities may be sold in the public market only if they are registered under the Securities Act or are sold pursuant to an exemption from registration such as Rule 144.
In addition, 1,242,291 shares of common stock will be eligible for sale upon exercise of vested options. A total of 6.7 million shares of common stock was reserved for issuance under the 2014 Omnibus Incentive Plan, of which 4,335,548 shares of common stock remain available for future issuance at September 1, 2015. These shares can be sold in the public market upon issuance, subject to restrictions under the securities laws applicable to resales by affiliates.
Pursuant to a registration rights agreement, certain holders of restricted shares, subject to certain conditions, may require us to register or otherwise facilitate the sale under the Securities Act of their shares of common stock. Any exercise of their registration rights, or any sale by one or more of them of a substantial number of shares, could cause the then-prevailing market price of our common stock to decline. The shares subject to the registration rights agreement represent approximately 23.6% of our outstanding common stock.
The market price of shares of our common stock could drop significantly if the holders of these shares sell them or are perceived by the market as intending to sell them. These factors could also make it more difficult for us to raise additional funds through future offerings of shares of our common stock that we wish to issue or other securities. In the future, we may also issue our securities in connection with investments or acquisitions. The amount of shares of our common stock issued in connection with an investment or acquisition could constitute a material portion of then-outstanding shares of our common stock. Any issuance of additional securities in connection with investments or acquisitions may result in dilution to you.
28
Anti-takeover provisions in our organizational documents could delay or prevent a change of control.
Certain provisions of our amended and restated certificate of incorporation and amended and restated bylaws may have an anti-takeover effect and may delay, defer or prevent a merger, acquisition, tender offer, takeover attempt or other change of control transaction that a stockholder might consider in its best interest, including those attempts that might result in a premium over the market price for the shares held by our stockholders.
These provisions provide for, among other things:
•a classified board of directors with staggered three-year terms;
•the ability of our board of directors to issue one or more series of preferred stock;
• | advance notice for nominations of directors by stockholders and for stockholders to include matters to be considered at our annual meetings; |
• | certain limitations on convening special stockholder meetings; |
• | the removal of directors only for cause and only upon the affirmative vote of holders of at least 66 2/3% of the shares of common stock entitled to vote generally in the election of directors; and |
• | that certain provisions may be amended only by the affirmative vote of at least 66 2/3% of the shares of common stock entitled to vote generally in the election of directors. |
These anti-takeover provisions could make it more difficult for a third party to acquire us, even if the third-party’s offer may be considered beneficial by many of our stockholders. As a result, our stockholders may be limited in their ability to obtain a premium for their shares.
Affiliates of Blackstone have substantial influence over us, and their interests may conflict with ours or yours in the future.
Affiliates of Blackstone beneficially own approximately 21% of our common stock. As a result, investment funds associated with or designated by affiliates of Blackstone have the ability to influence the election of the members of our board of directors and thereby affect our policies and operations, including the appointment of management, future issuances of our common stock or other securities, the payment of dividends, if any, on our common stock, the incurrence or modification of debt by us, amendments to our amended and restated certificate of incorporation and amended and restated bylaws and the entering into of extraordinary transactions, and their interests may not in all cases be aligned with your interests. In addition, Blackstone may have an interest in pursuing acquisitions, divestitures and other transactions that, in its judgment, could enhance its investment, even though such transactions might involve risks to you.
Blackstone is in the business of making investments in companies and may from time to time acquire and hold interests in businesses that compete directly or indirectly with us. For example, Blackstone has made investments in Biomet, Inc., Emcure Pharmaceuticals Ltd., Apria Healthcare Group Inc., Nycomed Holding A/S, DJO Global LLC, Independent Clinical Services Ltd, Southern Cross Healthcare Group PLC, Stiefel Laboratories, Inc., Team Health Holdings, Inc. and Vanguard Health Systems, Inc.
Our amended and restated certificate of incorporation provides that none of Blackstone, any of its affiliates or any director who is not employed by us (including any non-employee director who serves as one of our officers in both his director and officer capacities) or his or her affiliates has any duty to refrain from engaging, directly or indirectly, in the same business activities or similar business activities or lines of business in which we operate. Blackstone also may pursue acquisition opportunities that may be complementary to our business, and, as a result, those acquisition opportunities may not be available to us. So long as Blackstone continues to own a significant amount of our combined voting power, Blackstone will continue to be able to strongly influence our decisions, and, so long as Blackstone and its affiliates collectively own at least 5% of all outstanding shares of our stock entitled to vote generally in the election of directors, it will be able to appoint individuals to our board of directors under a stockholders agreement. The concentration of ownership could deprive you of an opportunity to receive a premium for your shares of common stock as part of a sale of the Company and ultimately might affect the market price of our common stock.
29
ITEM 1B. | UNRESOLVED STAFF COMMENTS |
None.
30
ITEM 2. | PROPERTIES |
Our principal executive offices are located at 14 Schoolhouse Road, Somerset, New Jersey. We also operate manufacturing operations, development centers, and sales offices throughout the world. We have thirty-one facilities on five continents with approximately 5.1 million square feet of manufacturing, lab and related space. Our manufacturing capabilities encompass a full suite of competencies including regulatory, quality assurance and in-house validation at all of the production sites. The following table sets forth our manufacturing and laboratory facilities by area and region as of June 30, 2015:
Facility Sites | Country | Region | Segment | Total Square Footage | Leased/Owned | |||||||
1 | Eberbach | Germany | Europe | Oral Technologies | 370,580 | Leased | ||||||
2 | St. Petersburg, FL | USA | North America | Oral Technologies | 328,073 | Owned | ||||||
3 | Somerset, NJ | USA | North America | Oral Technologies | 265,000 | Owned | ||||||
4 | Buenos Aires | Argentina | South America | Oral Technologies | 265,000 | Owned | ||||||
5 | Swindon | United Kingdom | Europe | Oral Technologies | 253,314 | Owned | ||||||
6 | Haining | China | Asia Pacific | Oral Technologies | 219,930 | Owned | ||||||
7 | Winchester, KY | USA | North America | Oral Technologies | 180,000 | Owned | ||||||
8 | Schorndorf | Germany | Europe | Oral Technologies | 166,027 | Owned | ||||||
9 | Braeside | Australia | Asia Pacific | Oral Technologies | 163,100 | Owned | ||||||
10 | Sorocaba | Brazil | South America | Oral Technologies | 124,685 | Owned | ||||||
11 | Kakegawa | Japan | Asia Pacific | Oral Technologies | 107,300 | Owned | ||||||
12 | Aprilia | Italy | Europe | Oral Technologies | 92,010 | Owned | ||||||
13 | Beinheim | France | Europe | Oral Technologies | 78,100 | Owned | ||||||
14 | Dee Why | Australia | Asia Pacific | Oral Technologies | 59,836 | Leased | ||||||
15 | Indaiatuba | Brazil | South America | Oral Technologies | 53,800 | Owned | ||||||
16 | Woodstock, IL | USA | North America | Medication Delivery Solutions | 421,665 | Owned | ||||||
17 | Brussels | Belgium | Europe | Medication Delivery Solutions | 302,961 | Owned | ||||||
18 | Limoges | France | Europe | Medication Delivery Solutions | 179,000 | Owned | ||||||
19 | Madison, WI | USA | North America | Medication Delivery Solutions | 102,723 | Leased | ||||||
20 | Emeryville, CA | USA | North America | Medication Delivery Solutions | 6,418 | Leased | ||||||
21 | Kansas City, MO | USA | North America | Development & Clinical Services | 410,000 | Owned | ||||||
22 | Philadelphia, PA | USA | North America | Development & Clinical Services | 206,878 | Leased/Owned | ||||||
23 | Bathgate | United Kingdom | Europe | Development & Clinical Services | 191,000 | Owned | ||||||
24 | Morrisville, NC | USA | North America | Development & Clinical Services | 186,406 | Leased | ||||||
25 | Deeside | United Kingdom | Europe | Development & Clinical Services | 127,533 | Leased | ||||||
26 | Malvern, PA | USA | North America | Development & Clinical Services | 84,000 | Leased | ||||||
27 | Bolton | United Kingdom | Europe | Development & Clinical Services | 60,830 | Owned | ||||||
28 | Schorndorf | Germany | Europe | Development & Clinical Services | 54,693 | Owned | ||||||
29 | Shanghai | China | Asia Pacific | Development & Clinical Services | 31,000 | Leased | ||||||
30 | Dartford | United Kingdom | Europe | Development & Clinical Services | 20,250 | Leased | ||||||
31 | Singapore | Singapore | Asia Pacific | Development & Clinical Services | 7,942 | Leased | ||||||
Total | 5,120,054 | |||||||||||
31
ITEM 3. | LEGAL PROCEEDINGS |
From time to time, we may be involved in legal proceedings arising in the ordinary course of business, including, without limitation, inquiries and claims concerning environmental contamination as well as litigation and allegations in connection with acquisitions, product liability, manufacturing or packaging defects and claims for reimbursement for the cost of lost or damaged active pharmaceutical ingredients, the cost of which could be significant. We intend to vigorously defend ourselves against such other litigation and do not currently believe that the outcome of any such other litigation will have a material adverse effect on our financial statements. In addition, the healthcare industry is highly regulated in the U.S. and abroad and governmental agencies continue to scrutinize certain practices affecting governmental programs, international operations and otherwise.
From time to time, we receive subpoenas or requests for information from various governmental agencies, including from state attorneys general and the U.S. Department of Justice relating to the business practices of customers or suppliers. We generally respond to such subpoenas and requests in a timely and thorough manner, which responses sometimes require considerable time and effort and can result in considerable costs being incurred by us. We expect to incur additional costs in the future in connection with existing and future requests.
32
ITEM 4. | MINE SAFETY DISCLOSURES |
Not Applicable.
33
PART II
ITEM 5. | MARKET FOR REGISTRANT’S COMMON EQUITY, RELATED STOCKHOLDER MATTERS AND ISSUER PURCHASES OF EQUITY SECURITIES |
The principal market for trading of the Company’s common stock is the NYSE. The Company’s common stock began trading on the NYSE under the symbol CTLT as of July 31, 2014. Prior to that date there was no public market for our common stock.
The following table sets forth the high and low sale prices per share for our common stock as reported on the NYSE for the period indicated:
Common Stock Market Prices | 4th Quarter | 3rd Quarter | 2nd Quarter | 1st Quarter | |||
Fiscal year ended June 30, 2015 | |||||||
High | $32.11 | $31.66 | $30.18 | $25.17 | |||
Low | $26.17 | $26.32 | $22.85 | $19.85 | |||
As of September 1, 2015 we had approximately 35 holders of record of our common stock. This number does not include beneficial owners whose shares were held in street name.
We have no current plans to pay dividends on our common stock. Any decision to declare and pay dividends in the future will be made at the sole discretion of our board of directors and will depend on, among other things, our results of operations, cash requirements, financial condition, contractual restrictions and other factors that our board of directors may deem relevant. Because we are a holding company and have no direct operations, we will only be able to pay dividends from funds we receive from our subsidiaries. In addition, our ability to pay dividends will be limited by covenants in our existing indebtedness and may be limited by the agreements governing other indebtedness we or our subsidiaries incur in the future. See “Management's Discussion and Analysis of Financial Condition and Results of Operations − Debt Covenants.”
We did not declare or pay any dividends on our common stock in fiscal 2015 or fiscal 2014.
Recent Sales of Unregistered Securities
We did not sell any registered securities during the period covered by this Annual Report on Form 10-K.
Purchases of Equity Securities
There was no purchase by us, on our behalf, or on behalf of any affiliate of our registered equity securities during the period covered by this Annual Report on Form 10-K.
34
Performance Graph
Set forth below is a line graph comparing the cumulative total shareholder return on the Company’s common stock since July 31, 2014 (the date our common stock commenced trading on the NYSE) through June 30, 2015, based on the market price of the Company’s common stock and assuming reinvestment of dividends, with the cumulative total shareholder return of companies on the Standard & Poor’s Composite 1500 Index and Standard & Poor’s 1500 Healthcare Index. The graph assumes that $100 was invested in the Company’s common stock and in each index at the market close on July 31, 2014. The stock price performance of the following graph is not necessarily indicative of future stock performance.
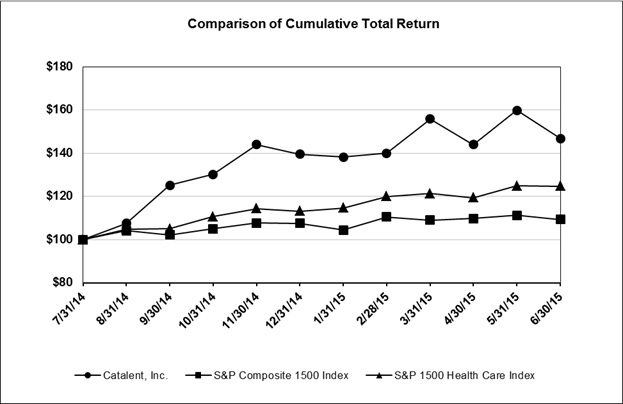
35
ITEM 6. | SELECTED FINANCIAL DATA |
The following table sets forth our selected historical financial and operating data for, or as of the end of, each of the five years ended June 30, 2015. The selected financial data as of June 30, 2015 and 2014, and for the fiscal years ended June 30, 2015, 2014 and 2013 has been derived from our audited consolidated financial statements included in “Financial Statements and Supplementary Data.” The financial data as of June 30, 2013, 2012 and 2011 and for the years ended June 30, 2012 and 2011 have been derived from our audited consolidated financial statements not included in this Annual Report on Form 10-K. This table should be read in conjunction with the Consolidated Financial Statements and the Notes thereto.
Year Ended June 30, | |||||||||||||||||||
(Dollars in millions, except as noted) | 2015 | 2014 | 2013 | 2012 | 2011 | ||||||||||||||
Statement of Operations Data: | |||||||||||||||||||
Net revenue | $ | 1,830.8 | $ | 1,827.7 | $ | 1,800.3 | $ | 1,694.8 | $ | 1,531.8 | |||||||||
Cost of sales | 1,215.5 | 1,229.1 | 1,231.7 | 1,136.2 | 1,029.7 | ||||||||||||||
Gross margin | 615.3 | 598.6 | 568.6 | 558.6 | 502.1 | ||||||||||||||
Selling, general and administrative expenses | 337.3 | 334.8 | 340.6 | 348.1 | 288.3 | ||||||||||||||
Impairment charges and (gain)/loss on sale of assets | 4.7 | 3.2 | 5.2 | 1.8 | 3.6 | ||||||||||||||
Restructuring and other | 13.4 | 19.7 | 18.4 | 19.5 | 12.5 | ||||||||||||||
Property and casualty (gain)/loss, net (1) | — | — | — | (8.8 | ) | 11.6 | |||||||||||||
Operating earnings/(loss) | 259.9 | 240.9 | 204.4 | 198.0 | 186.1 | ||||||||||||||
Interest expense, net | 105.0 | 163.1 | 203.2 | 183.2 | 165.5 | ||||||||||||||
Other (income)/expense, net | 42.4 | 10.4 | 25.1 | (3.8 | ) | 26.0 | |||||||||||||
Earnings/(loss) from continuing operations before income taxes | 112.5 | 67.4 | (23.9 | ) | 18.6 | (5.4 | ) | ||||||||||||
Income tax expense/(benefit) | (97.7 | ) | 49.5 | 27.0 | 0.5 | 23.7 | |||||||||||||
Earnings/(loss) from continuing operations | 210.2 | 17.9 | (50.9 | ) | 18.1 | (29.1 | ) | ||||||||||||
Earnings/(loss) from discontinued operations, net of tax | 0.1 | (2.7 | ) | 1.2 | (41.3 | ) | (21.0 | ) | |||||||||||
Net earnings/(loss) | 210.3 | 15.2 | (49.7 | ) | (23.2 | ) | (50.1 | ) | |||||||||||
Less: Net earnings/(loss) attributable to noncontrolling interest, net of tax | (1.9 | ) | (1.0 | ) | (0.1 | ) | 1.2 | 3.9 | |||||||||||
Net earnings/(loss) attributable to Catalent | $ | 212.2 | $ | 16.2 | $ | (49.6 | ) | $ | (24.4 | ) | $ | (54.0 | ) | ||||||
Basic earnings per share attributable to Catalent common shareholders: | |||||||||||||||||||
Earnings/(loss) from continuing operations | $ | 1.77 | $ | 0.25 | $ | (0.68 | ) | $ | 0.23 | $ | (0.44 | ) | |||||||
Net earnings/(loss) | 1.77 | 0.22 | (0.66 | ) | (0.33 | ) | (0.72 | ) | |||||||||||
Diluted earnings per share attributable to Catalent common shareholders: | |||||||||||||||||||
Earnings/(loss) from continuing operations | $ | 1.75 | $ | 0.25 | $ | (0.68 | ) | $ | 0.22 | $ | (0.44 | ) | |||||||
Net earnings/(loss) | 1.75 | 0.21 | (0.66 | ) | (0.32 | ) | (0.72 | ) | |||||||||||
(1) | In March 2011, a U.K. based packaging facility was damaged by fire. The 2011 and 2012 amounts reported are net of insurance recovery. |
36
Year Ended June 30, | |||||||||||||||||||
(Dollars in millions) | 2015 | 2014 | 2013 | 2012 | 2011 | ||||||||||||||
Balance Sheet Data (at period end): | |||||||||||||||||||
Cash and cash equivalents | $ | 151.3 | $ | 74.4 | $ | 106.4 | $ | 139.0 | $ | 205.1 | |||||||||
Goodwill | 1,061.5 | 1,097.1 | 1,023.4 | 1,029.9 | 906.0 | ||||||||||||||
Total assets | 3,145.4 | 3,090.2 | 2,949.5 | 3,032.1 | 2,729.1 | ||||||||||||||
Long term debt, including current portion and other short term borrowing | 1,887.9 | 2,710.6 | 2,691.6 | 2,683.5 | 2,346.6 | ||||||||||||||
Total liabilities | 2,505.6 | 3,457.5 | 3,359.8 | 3,382.8 | 2,939.0 | ||||||||||||||
Total shareholders’ equity/(deficit) | $ | 634.0 | $ | (371.8 | ) | $ | (410.3 | ) | $ | (350.7 | ) | $ | (209.9 | ) | |||||
Year Ended June 30, | |||||||||||||||||||
(Dollars in millions) | 2015 | 2014 | 2013 | 2012 | 2011 | ||||||||||||||
Other Financial Data: | |||||||||||||||||||
Capital expenditures | $ | 141.0 | $ | 122.4 | $ | 122.5 | $ | 104.2 | $ | 87.3 | |||||||||
Ratio of Earnings to Fixed Charges (2) | 2.0x | 1.4x | — | 1.1x | — | ||||||||||||||
Net cash provided by/(used in) continuing operations: | |||||||||||||||||||
Operating activities | 171.7 | 180.2 | 139.1 | 87.7 | 111.6 | ||||||||||||||
Investing activities | (271.8 | ) | (175.2 | ) | (122.1 | ) | (538.2 | ) | (83.3 | ) | |||||||||
Financing activities | 196.5 | (42.1 | ) | (49.3 | ) | 352.9 | (26.1 | ) | |||||||||||
Net cash provided by/(used in) discontinued operations: | 0.1 | 2.1 | (1.4 | ) | 43.9 | 21.0 | |||||||||||||
Effect of foreign currency on cash | $ | (19.6 | ) | $ | 3.0 | $ | 1.1 | $ | (12.4 | ) | $ | 17.9 | |||||||
(2) | The ratio of earnings to fixed charges is calculated by dividing the sum of earnings from continuing operations before income taxes, equity in earnings (loss) from non-consolidated investments and fixed charges, by fixed charges. Fixed charges consist of interest expenses, capitalized interest and imputed interest on our leased obligations. For fiscal years 2011 and 2013, earnings were insufficient to cover fixed charges by $4.0 million and $25.9 million, respectively. For fiscal years 2012, 2014 and 2015, the ratio of earnings to fixed charges was 1.1x, 1.4x, and 2.0x, respectively. |
37
ITEM 7. | MANAGEMENT’S DISCUSSION AND ANALYSIS OF FINANCIAL CONDITION AND RESULTS OF OPERATIONS |
The following discussion and analysis of our financial condition and results of operations should be read in conjunction with “Item 6. Selected Financial Data” and our consolidated financial statements and related notes that appear elsewhere in this Annual Report on Form 10-K. In addition to historical consolidated financial information, the following discussion contains forward-looking statements that reflect our plans, estimates, and beliefs. Our actual results could differ materially from those discussed in the forward-looking statements. Factors that could cause or contribute to these differences include those discussed below and elsewhere in this Annual Report on Form 10-K, particularly in “Item 1A. Risk Factors.”
Overview
We are the leading global provider of advanced delivery technologies and development solutions for drugs, biologics and consumer health products. Our oral, injectable, and respiratory delivery technologies provide delivery solutions across the full diversity of the pharmaceutical industry including small molecules, large molecule biologics and consumer health products. Through our extensive capabilities and deep expertise in product development, we help our customers take products to market faster, including nearly half of new drug products approved by the FDA in the last decade. Our advanced delivery technology platforms, broad and deep intellectual property, and proven formulation, manufacturing and regulatory expertise enable our customers to develop more products and better treatments. Across both development and delivery, our commitment to reliably supply our customers’ needs is the foundation for the value we provide; annually, we produce more than 70 billion doses for nearly 7,000 customer products. We believe that through our investments in growth-enabling capacity and capabilities, our ongoing focus on operational and quality excellence, the sales of existing customer products, the introduction of new customer products, our patents and innovation activities, and our entry into new markets, we will continue to benefit from attractive and differentiated margins, and realize the growth potential from these areas.
For financial reporting purposes, we present three distinct financial reporting segments based on criteria established by U.S. GAAP: Oral Technologies, Medication Delivery Solutions and Development and Clinical Services. The Oral Technologies segment includes the Softgel Technologies and Modified Release Technologies operating segments.
Oral Technologies
Our Oral Technologies segment provides advanced oral delivery technologies, including formulation, development and manufacturing of oral dose forms for prescription and consumer health products across all phases of a molecule’s lifecycle. These oral dose forms include softgel, modified release technologies and immediate release solid oral products. At certain facilities we also provide integrated primary packaging services for the products we manufacture. In fiscal 2015, we generated approximately $787.5 million in revenue from our softgel products and approximately $391.5 million in revenue from our MRT products (including intra-segment revenue of approximately $37.9 million).
Through our Softgel Technologies business, we provide formulation, development and manufacturing services for soft gelatin capsules, or “softgels,” which we first commercialized in the 1930s and have continually enhanced. We are the market leader in overall softgel manufacturing, and hold the leading market position in the prescription arena. Our principal softgel technologies include traditional softgel capsules (in which the shell is made from animal-derived materials) and Vegicaps and OptiShell capsules (in which the shell is made from vegetable-derived materials), which are used in a broad range of customer products, including prescription drugs, over-the-counter medications, and vitamins and supplements. Softgel capsules encapsulate liquid, paste or oil-based active compounds in solution or suspension within an outer shell, filling and sealing the capsule simultaneously. We perform all encapsulation within one of our softgel facilities, with active ingredients provided by customers or sourced directly by us. Softgels have historically been used to solve formulation challenges or technical issues for a specific drug, to help improve the clinical performance of compounds, to provide important market differentiation, particularly for over-the-counter compounds, and to provide safe handling of hormonal, potent and cytotoxic drugs. We also participate in the softgel vitamin, mineral and supplement business in selected regions around the world. With the 2001 introduction of our vegetable-derived softgel shell, Vegicaps capsules, consumer health manufacturers have been able to extend the softgel dose form to a broader range of active ingredients and serve patient/consumer populations that were previously inaccessible due to religious, dietary or cultural preferences. In recent years this platform has been extended to pharmaceutical active ingredients via the OptiShell platform. Our Vegicaps and OptiShell capsules are patent protected in most major global markets. Physician and patient studies we have conducted have demonstrated a preference for softgels versus traditional tablet and hard capsule dose forms in terms of ease of swallowing, real or perceived speed of delivery, ability to remove or eliminate unpleasant odor or taste and, for physicians, perceived improved patient adherence with dosing regimens.
38
Through our Modified Release Technologies business we provide formulation, development and manufacturing services for fast-dissolve tablets and both proprietary and conventional controlled release products. We launched our orally dissolving tablet business in 1986 with the introduction of Zydis tablets, a unique oral dosage form that is freeze-dried in its package, can be swallowed without water, and typically dissolves in the mouth in less than three seconds. Most often used for indications, drugs and patient groups that can benefit from rapid oral disintegration, the Zydis technology is utilized in a wide range of products and indications, including treatments for a variety of central nervous system-related conditions such as migraines, Parkinson’s Disease, schizophrenia, and pain relief. Zydis tablets continue to be used in new ways by our customers as we extend the application of the technology to new categories, such as for immunotherapies, vaccines and biologics delivery. More recently we have added two new technology platforms to the Modified Release Technologies business portfolio, including the highly flexible OptiDose tab-in-tab technology, already commercially proven in Japan; and the OptiMelt hot melt extrusion technology. We plan to continue to expand the development pipeline of customer products for all of our Modified Release technologies products.
Representative Oral Technologies business customers include Pfizer, Novartis, GlaxoSmithKline, Eli Lilly, Johnson & Johnson and Allergan.
We have fifteen Oral Technologies facilities in ten countries, including three in North America, five in Europe, three in South America and four in the Asia-Pacific region. Our Oral Technologies segment represented approximately 62% of total net revenue for fiscal 2015 on a combined basis before inter-segment eliminations.
Medication Delivery Solutions
Our Medication Delivery Solutions segment provides formulation, development and manufacturing services for delivery of drugs and biologics, administered via injection, inhalation and ophthalmic routes, using both traditional and advanced technologies. Our range of injectable manufacturing offerings includes filling drugs or biologics into pre-filled syringes, with flexibility to accommodate other formats within our existing network, focused increasingly on complex pharmaceuticals and biologics. With our wide variety of technologies we are able to meet a wide range of specifications, timelines and budgets. The complexity of the manufacturing process, the importance of experience and know-how, regulatory compliance, and high start-up capital requirements create significant barriers to entry and, as a result, limit the number of competitors in the market. For example, blow-fill-seal is an advanced aseptic processing technology that uses a continuous process to form, fill with drug, and seal a plastic container in a sterile environment. Blow-fill-seal units are currently used for a variety of pharmaceuticals in liquid form, such as respiratory, ophthalmic and otic products. We are a leader in the outsourced blow-fill-seal market, and operate one of the largest capacity commercial manufacturing blow-fill-seal facilities in the world. Our sterile blow-fill-seal manufacturing has significant capacity and flexibility in its manufacturing configurations. This business provides flexible and scalable solutions for unit-dose delivery of complex formulations such as suspensions and emulsions, products that are temperature, light and/or oxygen-sensitive. We also provide innovative design and engineering container design and manufacturing solutions related to complex container design and manufacturing. Our regulatory expertise can lead to decreased time to commercialization, and our dedicated development production lines support feasibility, stability and clinical runs. We plan to continue to expand our product line in existing and new markets, and in higher margin specialty products with additional respiratory, ophthalmic, injectable and nasal applications. Representative customers include Pfizer, Sanofi-Aventis, Novartis, Roche and Teva.
Our biologics offerings include our formulation development and cell-line manufacturing based on our advanced and patented GPEx technology, which is used to develop stable, high-yielding mammalian cell lines for both innovator and bio-similar biologic compounds. Our GPEx technology can provide rapid cell line development, high biologics production yields, flexibility and versatility. We believe our development stage SMARTag next-generation antibody-drug conjugate technology will provide more precision targeting for delivery of drugs to tumors or other locations, with improved safety versus existing technologies. In fiscal 2013, we launched a new biologics facility in Madison, Wisconsin, with expanded capability and capacity to produce clinical scale biologic supplies; combined with offerings from other businesses of Catalent and external partners, we now provide the broadest range of technologies and services supporting the development and launch of new biologic entities, biosimilars or biobetters to bring a product from gene to market commercialization, faster.
We have five Medication Delivery Solutions manufacturing facilities, including three in North America and two in Europe. Our Medication Delivery Solutions segment represented approximately 14% of total net revenue for fiscal 2015 on a combined basis before inter-segment eliminations.
39
Development and Clinical Services
Our Development and Clinical Services segment provides manufacturing, packaging, storage and inventory management for drugs and biologics in clinical trials. We offer customers flexible solutions for clinical supplies production, and provide distribution and inventory management support for both simple and complex clinical trials. This includes dose form manufacturing or over-encapsulation where needed; supplying placebos, comparator drug procurement and clinical packages and kits for physicians and patients; inventory management; investigator kit ordering and fulfillment; and return supply reconciliation and reporting. We support trials in all regions of the world through our facilities and distribution network. In fiscal 2012, we substantially expanded this business via our acquisition of the clinical trial supplies (CTS) business of Aptuit.
We also offer analytical chemical and cell-based testing and scientific services, stability testing, respiratory products formulation and manufacturing, regulatory consulting, and bioanalytical testing for biologic products. Our respiratory product capabilities include development and manufacturing services for inhaled products for delivery via metered dose inhalers, dry powder inhalers and intra-nasal sprays. We also provide formulation development and clinical and commercial manufacturing for conventional and specialty oral dose forms. We provide global regulatory and clinical support services for our customers’ regulatory and clinical strategies during all stages of development. Demand for our offerings is driven by the need for scientific expertise and depth and breadth of services offered, as well as by the reliable supply thereof, including quality, execution and performance.
We have eleven Development and Clinical Service facilities, including four in North America, five in Europe and two in the Asia Pacific region. Our Development and Clinical Services segment represented approximately 24% of total net revenue for fiscal 2015 on a combined basis before inter-segment eliminations.
Critical Accounting Policies and Estimates
The following disclosure supplements the descriptions of our accounting policies contained in Note 1 to our Consolidated Financial Statements (the “Consolidated Financial Statements”) included elsewhere in this Annual Report on Form 10-K in regard to significant areas of judgment. Management was required to make certain estimates and assumptions during the preparation of the Consolidated Financial Statements in accordance with generally accepted accounting principles. These estimates and assumptions affect the reported amount of assets and liabilities and disclosures of contingent assets and liabilities in our Consolidated Financial Statements included elsewhere in this Annual Report on Form 10-K. They also affect the reported amount of net earnings during the reporting periods. Actual results could differ from those estimates. Because of the size of the financial statement elements to which they relate, some of our accounting policies and estimates have a more significant impact on our consolidated financial statements than others.
Management has discussed the development and selection of these critical accounting policies and estimates with the audit committee of the board of directors. A discussion of some of our more significant accounting policies and estimates follows.
Revenues and Expenses
Net Revenue
We sell products and services directly to our pharmaceutical, biotechnology and consumer health customers. The majority of our business is conducted through supply or development agreements. The majority of our revenue is charged on a price-per-unit basis and is recognized either upon shipment or delivery of the product or service. Revenue generated from research and development arrangements are generally priced by project and are recognized either upon completion of the required service or achievement of a specified project phase or milestone.
Our overall net revenue is generally affected by the following factors:
• | Changes in the level or timing of research and development activities and sales activities by our customers; |
• | Fluctuations in overall economic activity within the geographic markets in which we operate; |
• | Change in the level of competition we face from our competitors; |
• | New intellectual property we develop and expiration of our patents; |
• | Changes in prices of our products and services, which are generally relatively stable due to our long-term contracts; and |
40
• | Fluctuations in exchange rates between foreign currencies, in which a substantial portion of our revenues and expenses are denominated, and the U.S. dollar. |
Operating Expenses
Cost of sales consists of direct costs incurred to manufacture and package products and costs associated with supplying other revenue-generating services. Cost of sales includes labor costs for employees involved in the production process and the cost of raw materials and components used in the process or product. Cost of sales also includes labor costs of employees supporting the production process, such as production management, quality, engineering, and other support services. Other costs in this category include the external research and development costs on behalf of our customers, depreciation of fixed assets, utility costs, freight, operating lease expenses and other general manufacturing expenses.
Selling, general and administrative expenses consist of all expenditures incurred in connection with the sales and marketing of our products, as well as administrative expenses to support our businesses. The category includes salaries and related benefit costs of employees supporting our sales and marketing, finance, human resources, information technology and legal functions, research and development costs in pursuit of our own proactive development and costs related to executive management. Other costs in this category include depreciation of fixed assets, amortization of our intangible assets, professional fees, and marketing and other expenses to support selling and administrative areas.
Direct expenses incurred by a segment are included in that segment’s results. Shared sales and marketing, information technology services and general administrative costs are allocated to each segment based upon the specific activity being performed for each segment or are charged on the basis of the segment’s respective revenues or other applicable measurement. Certain corporate expenses are not allocated to the segments. We do not allocate the following costs to the segments:
• | Impairment charges and (gain)/loss on sale of assets; |
• | Equity compensation; |
• | Restructuring expenses and other special items; |
• | Sponsor advisory fee and the related termination fee incurred in connection with our initial public offering; |
• | Noncontrolling interest; and |
• | Other income/(expense), net. |
Our operating expenses are generally affected by the following factors:
• | The utilization rate of our facilities: as our utilization rate increases, we achieve greater economies of scale as fixed manufacturing costs are spread over a larger number of units produced; |
• | Production volumes: as volumes change, the level of resources employed also fluctuate, including raw materials, component costs, employment costs and other related expenses, and our utilization rate may also be affected; |
• | The mix of different products or services that we sell; |
• | The cost of raw materials, components and general expense; |
• | Implementation of cost control measures and our ability to effect cost savings through our Operational Excellence, Lean Manufacturing and Lean Six Sigma programs; and |
• | Fluctuations in exchange rates between foreign currencies, in which a substantial portion of our revenues and expenses are denominated, and the U.S. dollar. |
Allowance for Inventory Obsolescence
We write down our inventory for estimated obsolescence or unmarketable inventory equal to the difference between the cost of the inventory and the estimated market value based upon assumptions about future demand and market conditions. If actual market conditions are less favorable than those projected, additional inventory write-downs may be required resulting in a charge to income in the period such determination was made.
Long-lived and Other Definite-Lived Intangible Assets
We allocate the cost of an acquired company to the tangible and identifiable intangible assets and liabilities acquired, with the remaining amount being recorded as goodwill. Certain intangible assets are amortized over their estimated useful life.
41
We assess the impairment of identifiable intangibles if events or changes in circumstances indicate that the carrying value of the asset may not be recoverable. Factors that we consider important that could trigger an impairment review include the following:
• | Significant under-performance relative to historical or projected future operating results; |
• | Significant changes in the manner of use of the acquired assets or the strategy of the overall business; |
• | Significant negative industry or economic trends; and |
• | Recognition of goodwill impairment charges. |
If we determine that the carrying value of intangibles and/or long-lived assets may not be recoverable based on the existence of one or more of the above indicators of impairment, we measure any impairment based on fair value, which we derive either by the estimated cash flows expected to result from the use of the asset and its eventual disposition or on assumptions we believe marketplace participants would utilize and comparable marketplace information in similar arm’s length transactions. We then compare weighted values to the asset’s carrying amount. Any impairment loss recognized would represent the excess of the asset’s carrying value over its estimated fair value. Significant estimates and judgments are required when estimating such fair values. If it is determined that these assets are impaired, an impairment charge would be recorded and the amount could be material. See Note 4 to our Consolidated Financial Statements included elsewhere in this Annual Report on Form 10-K for further discussion.
Goodwill
We account for purchased goodwill and intangible assets with indefinite lives in accordance with Accounting Standard Codification (“ASC”) 350 Goodwill, Intangible and Other Assets. Under ASC 350, goodwill and intangible assets with indefinite lives are tested for impairment at least annually utilizing both qualitative and quantitative assessments. Our annual goodwill impairment test was conducted as of April 1, 2015. We assess goodwill for possible impairment by comparing the carrying value of our reporting units to their fair values. We determine the fair value of our reporting units utilizing estimated future discounted cash flows and incorporate assumptions that we believe marketplace participants would utilize. In addition, we use comparative market information and other factors to corroborate the discounted cash flow results. No reporting units were at risk of failing step one in the goodwill impairment test under the provisions of ASC 350 as of April 1, 2015. See Note 3 to our Consolidated Financial Statements included elsewhere in this Annual Report on Form 10-K for further discussion.
Derivative Instruments and Hedging Activities
We may use derivative instruments as part of our overall strategy to manage our exposure to market risks primarily associated with fluctuations in interest rates. As a matter of policy, we do not use derivatives for trading or speculative purposes.
As required by ASC 815 Derivatives and Hedging (ASC 815), we record all derivatives on the balance sheet at fair value. The accounting for changes in the fair value of derivatives depends on the intended use of the derivative, whether we have elected to designate a derivative in a hedging relationship and apply hedge accounting and whether the hedging relationship has satisfied the criteria necessary to apply hedge accounting. Derivatives designated and qualifying as a hedge of the exposure to changes in the fair value of an asset, liability, or firm commitment attributable to a particular risk, such as interest-rate risk, are considered fair value hedges. Derivatives designated and qualifying as a hedge of the exposure to variability in expected future cash flows, or other types of forecasted transactions, are considered cash flow hedges. Derivatives may also be designated as hedges of the foreign currency exposure of a net investment in a foreign operation. Hedge accounting generally provides for the matching of the timing of gain or loss recognition on the hedging instrument with the recognition of the changes in the fair value of the hedged asset or liability that are attributable to the hedged risk in a fair value hedge or the earnings effect of the hedged forecasted transactions in a cash flow hedge. We may enter into derivative contracts that are intended to economically hedge certain of its risk, even though hedge accounting does not apply or we elect not to apply hedge accounting under ASC 815.
Income Taxes
In accordance with ASC 740 Income Taxes (ASC 740), we account for income taxes using the asset and liability method. The asset and liability method requires recognition of deferred tax assets and liabilities for expected future tax consequences of temporary differences that currently exist between tax bases and financial reporting bases of our assets and liabilities. Deferred tax assets and liabilities are measured using enacted tax rates in the respective jurisdictions in which we operate. Deferred taxes are not provided on the undistributed earnings of subsidiaries outside of the United States when it is expected that these
42
earnings will be permanently reinvested. We have not made any provision for U.S. income taxes on the undistributed earnings of foreign subsidiaries as those earnings are considered permanently reinvested in the operations of those foreign subsidiaries.
We had valuation allowances of $82.4 million and $218.2 million as of June 30, 2015 and 2014, respectively, against our deferred tax assets. We considered all available evidence, both positive and negative, in assessing the need for a valuation allowance for deferred tax assets. We evaluated three possible sources of taxable income when assessing the realization of deferred tax assets:
•Future reversals of existing taxable temporary differences;
•Tax planning strategies; and
•Future taxable income exclusive of reversing temporary differences and carryforwards.
We considered the need to maintain a valuation allowance on deferred tax assets based on management’s assessment of whether it is more likely than not that deferred tax assets would be realized based on future reversals of existing taxable temporary differences and the ability to generate sufficient taxable income within the carryforward period available under the applicable tax law. The deferred tax liabilities are expected to reverse in the same period and jurisdiction and are of the same character as the temporary differences giving rise to a portion of the deferred tax assets.
During the year ended June 30, 2015, we released the majority of our U.S. federal valuation allowance of $136.7 million based on projected U.S. future earnings in excess of the $294.1 million required to realize its net U.S. federal deferred tax assets. Of the $294.1 million, $329.5 million relates to the federal net operating loss carryforward (NOL), which expires in the years 2028 to 2032. The remaining $35.4 million relates to other net deferred tax liabilities.
The reversal of the valuation allowance was the result of a continuing trend of U.S. taxable income and the expectation that this trend will continue, rather than relying on tax planning strategies to support the realization of deferred tax assets. We have experienced three consecutive years of positive U.S. taxable earnings as of the current quarter and expect to sustain this position in the future, due to the positive impact on U.S. earnings from reduced interest expense resulting from a reduction in our external debt, among other factors.
While the U.S. federal valuation allowance was reversed, the U.S. state valuation allowance on $483.8 million of pre-apportioned state net operating losses were maintained. Due to uncertainty around earnings, apportionment, certain restrictions at the state level, and the history of tax losses, anticipated utilization rates were not sufficient to overcome the negative evidence and allow a release.
ASC 740 provides that a tax benefit from an uncertain tax position may be recognized when it is more likely than not that the position will be sustained upon examination, including resolution of any related appeal or litigation process, based on the technical merits. We recognized no material adjustment in the liability for unrecognized income tax benefits.
The calculation of our income tax liabilities involves dealing with uncertainties in the application of complex domestic and foreign income tax regulations. Unrecognized tax benefits are generated when there are differences between tax positions taken in a tax return and amounts recognized in the Consolidated Financial Statements. Tax benefits are recognized in the Consolidated Financial Statements when it is more likely than not that a tax position will be sustained upon examination. To the extent we prevail in matters for which liabilities have been established, or are required to pay amounts in excess of our liabilities, our effective income tax rate in a given period could be materially affected. An unfavorable income tax settlement may require the use of cash and result in an increase in our effective income tax rate in the year it is resolved. A favorable income tax settlement would be recognized as a reduction in the effective income tax rate in the year of resolution. At June 30, 2015 and 2014, we recorded unrecognized tax benefits and related interest and penalties of $73.2 million and $65.9 million, respectively.
The anticipated future trends included in our assessment of the realizability of our deferred tax assets are the same assumptions and anticipated future trends that were incorporated into the estimated fair value of our reporting units for purposes of testing goodwill for impairment. Such assumptions and anticipated future trends were also incorporated into other assessments of our tangible and intangible assets for impairment, as applicable. We are not currently relying on any tax-planning strategy to support the realization of deferred tax assets.
New Accounting Pronouncements
Refer to Note 1 to the Consolidated Financial Statements for a description of recent accounting pronouncements.
43
Factors Affecting our Performance
Fluctuations in Operating Results
Our financial reporting periods operate on a June 30 fiscal year end. Our revenue and net earnings are generally higher in our third and fourth quarters of each fiscal year. These fluctuations are primarily the result of the timing of our, and our customers’, annual operational maintenance periods at locations in Europe and the United Kingdom, the seasonality associated with pharmaceutical and biotechnology budgetary spending decisions, clinical trial and research and development schedules and, to a lesser extent, the time of the year some of our customers’ products are in higher demand.
Acquisition and Related Integration Efforts
Our growth and profitability are affected by the acquisitions we are able to complete and the speed at which we integrate those acquisitions into our existing operating platforms. Since January 1, 2012, we have completed nine acquisitions, the largest of which was the February 2012 purchase of the Aptuit CTS business. Since that acquisition, we consolidated one operation in December 2012 and completed the consolidation of a second operation in December 2013. In February 2012, we acquired the remaining 49% ownership interest in our German softgel joint venture. We commenced two joint ventures in China in fiscal 2013 and 2014, and completed the acquisition of the partner’s interest in one venture in fiscal 2015. We purchased a softgel operation in Brazil in fiscal 2014 and have integrated it into our softgel business. Further, in October 2014, the Company acquired the remaining shares of Redwood Bioscience Inc. (“Redwood”) and its SMARTag ADC technology platform. The acquired business is based in the U.S. and is included in the Medication Delivery Solutions segment. Additionally, in November 2014, the Company acquired 100% of the shares of MTI Pharma Solutions, Inc. (“Micron Technologies”), a company specializing in particle size reduction (micronization), milling and analytical contract services. The acquired business is based in the U.S. and the U.K. and is included in the Development and Clinical Services segment. Our efforts to integrate Redwood and Micron Technologies are substantially complete.
Foreign Exchange Rates
Significant portions of our revenues and costs are affected by changes in foreign exchange rates. Our operating network is global and, as a result, our revenues and operating expenses are influenced by changes in foreign exchange rates. In fiscal 2015, approximately 56% of our revenue was generated from our operations outside the United States. Much of the revenue generated outside the United States and many of the expenses associated with our operations outside the United States are denominated in currencies other than the U.S. dollar, particularly the British pound, the euro, the Brazilian real, the Argentine peso, the Japanese yen and the Australian dollar. Changes in those currencies relative to the U.S. dollar will impact our revenues and expenses.
Components of our Revenue, Costs and Expenses
Revenue
We sell products and services directly to our pharmaceutical, biotechnology and consumer health customers. The majority of our business is conducted through supply or development agreements. Contractual provisions, which may include pricing, are sometimes adjusted through arm’s-length negotiations with customers in the course of renewing a contract. Our revenue is charged on a price-per-unit or service basis and is recognized either upon shipment or delivery of the product or service. Revenue generated from research and development arrangements are generally priced by project and are recognized either upon completion of the required service or achievement of a specified project phase or milestone. The broad capabilities we have to serve our customers provides us limited concentration risk with no customer exceeding 10% and no single product generating more than 3% of revenue.
Costs and Expenses
Cost of sales consists of direct costs incurred to manufacture products and costs associated with supplying other revenue-generating services. Cost of sales includes labor costs for employees involved in the production process and the cost of raw materials and components used in the process or product. Cost of sales also includes labor costs of employees supporting the production process, such as production management, quality, engineering, and other support services. Other costs in this category include the external research and development costs, depreciation of fixed assets used in the manufacturing process, utility costs, freight, operating lease expenses and other general manufacturing expenses.
Selling, general and administration expenses consist of all expenditures incurred in connection with the sales and marketing of our products, as well as administrative expenses to support our businesses. The category includes salaries and
44
related benefit costs of employees supporting sales and marketing, finance, human resources, information technology, research and development costs and costs related to executive management. Other costs in this category include depreciation of other fixed assets, amortization of our intangible assets, professional fees, marketing and other expenses to support selling and administrative areas.
Trends Affecting Our Business
Industry
We participate in nearly every sector of the $800 billion annual revenue global pharmaceutical industry, including but not limited to the prescription drug and biologic sectors as well as consumer health, which includes the over-the-counter and vitamins and nutritional supplement sectors. Innovative pharmaceuticals continue to play a critical role in the global market, while generic drug share is increasing in both developed and developing markets. Sustained developed market demand and rapid growth in emerging economies is driving the consumer health product growth rate to more than double that for pharmaceuticals. Payors, both public and private, have sought to limit the economic impact of such demand through greater use of generic drugs, access and spending controls and health technology assessment techniques, favoring products that deliver truly differentiated outcomes.
New Molecule Development and R&D Sourcing
Continued strengthening in early stage development pipelines for drugs and biologics, compounded by increasing clinical trial breadth and complexity, sustain our belief in the attractive growth prospects for development solutions. Large companies are in many cases reconfiguring their R&D resources, increasingly involving the appointment of strategic partners for important outsourced functions. Additionally, an increasing portion of compounds in development are from companies who less frequently have full R&D infrastructure, and thus are more likely to need strategic development solutions partners.
Demographics
Aging population demographics in developed countries, combined with health care reforms in many global markets that are expanding access to treatments to a greater proportion of their populations, will continue to drive increases in demand for both pharmaceutical and consumer health products. Increasing economic affluence in developing regions will further increase demand for health care treatments, and we are taking active steps to allow us to participate effectively in these growth regions and product categories.
Finally, we believe the market access and payor pressures our customers face, global supply chain complexity, and the increasing demand for improved treatments will continue to escalate the need for product differentiation, improved outcomes and treatment cost reduction, all of which can often be addressed using our advanced delivery technologies.
Non-GAAP Performance Metrics
Use of EBITDA from continuing operations
Management measures operating performance based on consolidated earnings from continuing operations before interest expense, expense/(benefit) for income taxes and depreciation and amortization, which is further adjusted for the income or loss attributable to noncontrolling interests (“EBITDA from continuing operations”). EBITDA from continuing operations is not defined under U.S. GAAP and is not a measure of operating income, operating performance or liquidity presented in accordance with U.S. GAAP and is subject to important limitations.
We believe that the presentation of EBITDA from continuing operations enhances an investor’s understanding of our financial performance. We believe this measure is a useful financial metric to assess our operating performance from period to period by excluding certain items that we believe are not representative of our core business and use this measure for business planning purposes. In addition, given the significant investments that we have made in the past in property, plant and equipment, depreciation and amortization expenses represent a meaningful portion of our cost structure. We believe that disclosing EBITDA from continuing operations will provide investors with a useful tool for assessing the comparability between periods of our ability to generate cash from operations sufficient to pay taxes, to service debt and to undertake capital expenditures because it eliminates depreciation and amortization expense. We present EBITDA from continuing operations in order to provide supplemental information that we consider relevant for the readers of our consolidated financial statements included elsewhere in this Annual Report on Form 10-K, and such information is not meant to replace or supersede U.S. GAAP
45
measures. Our definition of EBITDA from continuing operations may not be the same as similarly titled measures used by other companies.
In addition, we evaluate the performance of our segments based on segment earnings before noncontrolling interest, other (income)/expense, impairments, restructuring costs, interest expense, income tax expense/(benefit), and depreciation and amortization (“Segment EBITDA”).
Use of Constant Currency
As exchange rates are an important factor in understanding period-to-period comparisons, we believe the presentation of results on a constant currency basis in addition to reported results helps improve investors’ ability to understand our operating results and evaluate our performance in comparison to prior periods. Constant currency information compares results between periods as if exchange rates had remained constant period-over-period. We use results on a constant currency basis as one measure to evaluate our performance. In this Annual Report on Form 10-K, we calculate constant currency by calculating current-year results using prior-year foreign currency exchange rates. We generally refer to such amounts calculated on a constant currency basis as excluding the impact of foreign exchange. These results should be considered in addition to, not as a substitute for, results reported in accordance with U.S. GAAP. Results on a constant currency basis, as we present them, may not be comparable to similarly titled measures used by other companies and are not measures of performance presented in accordance with U.S. GAAP.
Fiscal Year Ended June 30, 2015 compared to the Fiscal Year Ended June 30, 2014
Results for the fiscal year ended June 30, 2015 compared to the fiscal year ended June 30, 2014 were as follows:
Fiscal Year Ended June 30, | FX impact (unfavorable) / favorable | Constant Currency Increase/(Decrease) | ||||||||||||||||
(Dollars in millions) | 2015 | 2014 | Change $ | Change % | ||||||||||||||
Net revenue | $ | 1,830.8 | $ | 1,827.7 | $ | (117.9 | ) | $ | 121.0 | 7 | % | |||||||
Cost of sales | 1,215.5 | 1,229.1 | (82.2 | ) | 68.6 | 6 | % | |||||||||||
Gross margin | 615.3 | 598.6 | (35.7 | ) | 52.4 | 9 | % | |||||||||||
Selling, general and administrative expenses | 337.3 | 334.8 | (11.0 | ) | 13.5 | 4 | % | |||||||||||
Impairment charges and (gain)/loss on sale of assets | 4.7 | 3.2 | (0.1 | ) | 1.6 | 50 | % | |||||||||||
Restructuring and other | 13.4 | 19.7 | (2.0 | ) | (4.3 | ) | (22 | )% | ||||||||||
Operating earnings/(loss) | 259.9 | 240.9 | (22.6 | ) | 41.6 | 17 | % | |||||||||||
Interest expense, net | 105.0 | 163.1 | (1.2 | ) | (56.9 | ) | (35 | )% | ||||||||||
Other (income)/expense, net | 42.4 | 10.4 | (5.2 | ) | 37.2 | * | ||||||||||||
Earnings/(loss) from continuing operations before income taxes | 112.5 | 67.4 | (16.2 | ) | 61.3 | 91 | % | |||||||||||
Income tax expense/(benefit) | (97.7 | ) | 49.5 | (4.3 | ) | (142.9 | ) | * | ||||||||||
Earnings/(loss) from continuing operations | 210.2 | 17.9 | (11.9 | ) | 204.2 | * | ||||||||||||
Net earnings/(loss) from discontinued operations, net of tax | 0.1 | (2.7 | ) | — | 2.8 | * | ||||||||||||
Net earnings/(loss) | 210.3 | 15.2 | (11.9 | ) | 207.0 | * | ||||||||||||
Less: Net earnings/(loss) attributable to noncontrolling interest, net of tax | (1.9 | ) | (1.0 | ) | 0.1 | (1.0 | ) | * | ||||||||||
Net earnings/(loss) attributable to Catalent | $ | 212.2 | $ | 16.2 | $ | (12.0 | ) | $ | 208.0 | * | ||||||||
* Percentage not meaningful
Net Revenue
Net revenue increased by $121.0 million, or 7%, as compared to the twelve months ended June 30, 2014, excluding the impact of foreign exchange. The increase in net revenue was driven by increased sales across all three reportable segments, led primarily by our Oral Technologies segment.
Gross Margin
46
Gross margin increased by $52.4 million, or 9%, as compared to the twelve months ended June 30, 2014, excluding the impact of foreign exchange. On a constant currency basis, gross margin, as a percentage of revenue, increased 60 basis points to 33.4% in the twelve months ended June 30, 2015 as compared to 32.8% in the prior year. The increase in gross margin was primarily due to increased sales across all three reportable segments and a favorable shift in revenue mix within our modified release technologies business within our Oral Technologies segment and within our analytical services integrated operations within our Development and Clinical Services segment. Growth in gross margin was partially offset by an unfavorable shift in product mix from our softgel offering within our Oral Technologies segment.
Selling, General and Administrative Expense
Selling, general and administrative expense increased by $13.5 million, or 4%, as compared to the twelve months ended June 30, 2014, excluding the impact of foreign exchange, primarily due to $12 million of incremental expense related to entities we acquired during the year. The $12 million was primarily comprised of non-cash depreciation and amortization expense of $7 million, integration costs of $4 million, and employee compensation costs of $1 million. In addition, selling, general and administrative expense increased $4.5 million related to our non-cash equity compensation plans as a result of a change from a cash-based long-term incentive plan to an equity-based long-term incentive plan. These costs were partially offset by a $12.9 million reduction in expense due to the elimination of the recurring sponsor advisory fee agreement as a result of our IPO during the first quarter.
Restructuring and Other
Restructuring and other charges of $13.4 million for the twelve months ended June 30, 2015 decreased by $6.3 million, or 32%, compared to the twelve months ended June 30, 2014. The twelve months ended June 30, 2015 included restructuring initiatives enacted to improve cost efficiency primarily related to employee severance expenses. The prior period charges included restructuring initiatives across several of our operations enacted to improve cost efficiency, including site consolidation in pursuit of synergies related to the Aptuit CTS acquisition and employee-related severance expenses during the twelve months ended June 30, 2014.
Interest Expense, net
Interest expense, net, of $105.0 million for the twelve months ended June 30, 2015 decreased by $58.1 million, or 36%, compared to the twelve months ended June 30, 2014, primarily driven by lower levels of outstanding debt as compared to the prior year. The Company redeemed $350 million of Senior Notes and $275 million of Senior Subordinated Notes on August 28, 2014 and September 4, 2014, respectively. In addition, the Company reduced an aggregate of $234.5 million of outstanding borrowings under an unsecured term loan during the first quarter. The funds utilized to reduce our debt levels were generated by proceeds from our IPO, which was completed during the first quarter of fiscal 2015. The decrease in interest expense, net was partially offset by incremental borrowings of $191 million during the second quarter of fiscal 2015 in support of acquisitions.
Other (Income)/Expense, net
Other expense, net of $42.4 million for the twelve months ended June 30, 2015 increased from $10.4 million in the twelve months ended June 30, 2014. The increase was primarily driven by a sponsor advisory fee agreement termination fee of $29.8 million, which we agreed to pay in connection with our IPO. In addition, we incurred $21.8 million of expense associated with the early redemption of our Senior Notes and pre-payment of an unsecured term loan, of which $9.8 million was a cash expense. Offsetting these other expense items were non-recurring non-cash purchase accounting gains, net, of approximately $8.9 million related to acquisitions completed during the period and $2.4 million of non-cash net gains associated with foreign exchange. Other expense, net for the twelve months ended June 30, 2014, was primarily driven by expenses of approximately $11 million related to the May 2014 refinancing of our Senior Secured Credit Facility and the write off of unamortized deferred financing fees. Also included were non-cash unrealized gains related to foreign currency translation, partially offset by realized losses related to foreign currency translation.
47
Provision/(Benefit) for Income Taxes
Our benefit for income taxes for the twelve months ended June 30, 2015 was $97.7 million relative to earnings before income taxes of $112.5 million. Our provision for income taxes for the twelve months ended June 30, 2014 was $49.5 million relative to earnings before income taxes of $67.4 million. The income tax benefit for the current period is not comparable to the same period of the prior year due to changes in pretax income over many jurisdictions and the impact of discrete items. Generally, fluctuations in the effective tax rate are primarily due to changes in our geographic pretax income resulting from our business mix and changes in the tax impact of permanent differences, restructuring, other special items and other discrete tax items, which may have unique tax implications depending on the nature of the item. Our effective tax rate at June 30, 2015 reflects the release of the U.S. federal valuation allowance and an increase in a tax reserve related to an adjustment to inter-company interest income in Germany, partially offset by a corresponding deduction in the United Kingdom.
Segment Review
The Company’s results on a segment basis for the fiscal year ended June 30, 2015 compared to the fiscal year ended June 30, 2014 were as follows:
Fiscal Year Ended June 30, | FX impact (unfavorable) / favorable | Constant Currency Increase/(Decrease) | ||||||||||||||||
(Dollars in millions) | 2015 | 2014 | Change $ | Change % | ||||||||||||||
Oral Technologies | ||||||||||||||||||
Net revenue | $ | 1,141.1 | $ | 1,180.1 | $ | (95.7 | ) | $ | 56.7 | 5 | % | |||||||
Segment EBITDA | 313.7 | 324.3 | (27.7 | ) | 17.1 | 5 | % | |||||||||||
Medication Delivery Solutions | ||||||||||||||||||
Net revenue | 261.9 | 246.1 | (15.3 | ) | 31.1 | 13 | % | |||||||||||
Segment EBITDA | 53.9 | 48.7 | (2.5 | ) | 7.7 | 16 | % | |||||||||||
Development and Clinical Services | ||||||||||||||||||
Net revenue | 438.8 | 412.2 | (7.0 | ) | 33.6 | 8 | % | |||||||||||
Segment EBITDA | 93.4 | 83.5 | (2.2 | ) | 12.1 | 14 | % | |||||||||||
Inter-segment revenue elimination | (11.0 | ) | (10.7 | ) | 0.1 | (0.4 | ) | 4 | % | |||||||||
Unallocated Costs (1) | (100.8 | ) | (82.1 | ) | 7.5 | (26.2 | ) | 32 | % | |||||||||
Combined Total | ||||||||||||||||||
Net revenue | $ | 1,830.8 | $ | 1,827.7 | $ | (117.9 | ) | $ | 121.0 | 7 | % | |||||||
EBITDA from continuing operations | $ | 360.2 | $ | 374.4 | $ | (24.9 | ) | $ | 10.7 | 3 | % | |||||||
(1) | Unallocated costs includes equity-based compensation, certain acquisition-related costs, impairment charges, certain other corporate directed costs, and other costs that are not allocated to the segments as follows: |
Fiscal Year Ended June 30, | |||||||
(Dollars in millions) | 2015 | 2014 | |||||
Impairment charges and gain/(loss) on sale of assets | $ | (4.7 | ) | $ | (3.2 | ) | |
Equity compensation | (9.0 | ) | (4.5 | ) | |||
Restructuring and other special items (2) | (27.2 | ) | (29.4 | ) | |||
Sponsor advisory fee | — | (12.9 | ) | ||||
Noncontrolling interest | 1.9 | 1.0 | |||||
Other income/(expense), net (3) | (42.4 | ) | (10.4 | ) | |||
Non-allocated corporate costs, net | (19.4 | ) | (22.7 | ) | |||
Total unallocated costs | $ | (100.8 | ) | $ | (82.1 | ) | |
(2) | Segment results do not include restructuring and certain acquisition-related costs. |
48
(3) | Amounts for fiscal 2015 primarily relate to the expense associated with the termination of the sponsor advisory fee agreement of $29.8 million resulting from the IPO, expenses related to financing transactions of $21.8 million, non-recurring non-cash purchase accounting gains of approximately $8.9 million related to acquisitions completed. |
Provided below is a reconciliation of earnings/(loss) from continuing operations to EBITDA from continuing operations:
Fiscal Year Ended June 30, | |||||||
(Dollars in millions) | 2015 | 2014 | |||||
Earnings/(loss) from continuing operations | $ | 210.2 | $ | 17.9 | |||
Depreciation and amortization | 140.8 | 142.9 | |||||
Interest expense, net | 105.0 | 163.1 | |||||
Income tax (benefit)/expense | (97.7 | ) | 49.5 | ||||
Noncontrolling interest | 1.9 | 1.0 | |||||
EBITDA from continuing operations | $ | 360.2 | $ | 374.4 | |||
Oral Technologies segment
2015 vs. 2014 | |||||
Factors Contributing to Year-Over-Year Change | Fiscal Year Ended June 30, | ||||
Net Revenue | Segment EBITDA | ||||
Organic revenue / Segment EBITDA | 4 | % | 5 | % | |
Impact of acquisitions | 1 | % | — | % | |
Impact of divestitures / business restructuring | — | % | — | % | |
Constant currency change | 5 | % | 5 | % | |
Foreign exchange fluctuation | (8 | )% | (9 | )% | |
Total % Change | (3 | )% | (4 | )% | |
Oral Technologies’ net revenue increased $56.7 million, or 5%, excluding the impact of foreign exchange. The primary driver was an increase in sales from our modified release technologies business and higher end market demand for certain customer products using our softgel offering totaling approximately $36 million, or 3%, as compared to the twelve months ended June 30, 2014. Revenue also increased as a result of higher revenue from product participation related activities of approximately $20 million, or 2%, as compared to the prior year.
Oral Technologies’ segment EBITDA increased by $17.1 million, or 5%, as compared to the twelve months ended June 30, 2014, excluding the impact of foreign exchange. The increase was primarily driven by increased profit from our product participation related activities coupled with higher revenues and timing of contractual settlements related to our core manufacturing operations within our modified release technologies platform, partially offset by unfavorable product mix in our softgel offering.
49
Medication Delivery Solutions segment
2015 vs. 2014 | |||||
Factors Contributing to Year-Over-Year Change | Fiscal Year Ended June 30, | ||||
Net Revenue | Segment EBITDA | ||||
Organic revenue / Segment EBITDA | 12 | % | 20 | % | |
Impact of acquisitions | 1 | % | (4 | )% | |
Impact of divestitures / business restructuring | — | % | — | % | |
Constant currency change | 13 | % | 16 | % | |
Foreign exchange fluctuation | (7 | )% | (5 | )% | |
Total % Change | 6 | % | 11 | % | |
Net revenue in our Medication Delivery Solutions segment increased by $31.1 million, or 13%, as compared to the twelve months ended June 30, 2014, excluding the impact of foreign exchange, due to increased revenue across all of our offerings. The segment growth was driven by increased demand for products utilizing our blow-fill-seal technology platform of approximately 7%, increased demand from our biologics offerings of approximately 4%, and increased demand for our injectable products at our European pre-filled syringe operations of approximately 2%.
Medication Delivery Solutions’ segment EBITDA increased by $7.7 million, or 16%, as compared to the twelve months ended June 30, 2014 excluding the impact of foreign exchange. The increase was primarily attributable to favorable product mix within our blow-fill-seal technology platform and increased profit generated from our biologics offerings, partially offset by unfavorable revenue mix from our injectable products at our European pre-filled syringe operations.
Development and Clinical Services segment
2015 vs. 2014 | |||||
Factors Contributing to Year-Over-Year Change | Fiscal Year Ended June 30, | ||||
Net Revenue | Segment EBITDA | ||||
Organic revenue / Segment EBITDA | 4 | % | 10 | % | |
Impact of acquisitions | 4 | % | 4 | % | |
Impact of divestitures / business restructuring | — | % | — | % | |
Constant currency change | 8 | % | 14 | % | |
Foreign exchange fluctuation | (2 | )% | (2 | )% | |
Total % Change | 6 | % | 12 | % | |
Development and Clinical Services’ net revenue increased by $33.6 million, or 8%, as compared to the twelve months ended June 30, 2014, excluding the impact of foreign exchange. Net revenue increased 4% as a result of the Micron Technologies acquisition completed during the second quarter of fiscal 2015. Organically, the Development and Clinical Services’ net revenue increased 4% as compared to the prior year, primarily due to growth in analytical services of $15 million, or 4%, as a result of our integrated oral solids development and manufacturing capabilities.
Development and Clinical Services’ segment EBITDA increased by $12.1 million, or 14%, excluding the impact of foreign exchange, as compared to the twelve months ended June 30, 2014. Segment EBITDA increased 4% as a result of the Micron Technologies acquisition discussed above. Excluding the impact of the acquisition, segment EBITDA increased 10%, primarily due to increased demand for our integrated oral solids development and manufacturing capabilities within analytical services.
50
Fiscal Year Ended June 30, 2014 compared to Fiscal Year Ended June 30, 2013
Results for the fiscal year ended June 30, 2014 compared to the fiscal year ended June 30, 2013 are as follows:
Fiscal Year Ended June 30, | FX impact (unfavorable) / favorable | Constant Currency Increase/(Decrease) | ||||||||||||||||
(Dollars in millions) | 2014 | 2013 | Change $ | Change % | ||||||||||||||
Net revenue | $ | 1,827.7 | $ | 1,800.3 | $ | (1.6 | ) | $ | 29.0 | 2 | % | |||||||
Cost of products sold | 1,229.1 | 1,231.7 | 0.2 | (2.8 | ) | * | ||||||||||||
Gross margin | 598.6 | 568.6 | (1.8 | ) | 31.8 | 6 | % | |||||||||||
Selling, general and administrative expenses | 334.8 | 340.6 | (0.2 | ) | (5.6 | ) | (2 | )% | ||||||||||
Impairment charges and (gain)/loss on sale of assets | 3.2 | 5.2 | 0.1 | (2.1 | ) | (40 | )% | |||||||||||
Restructuring and other | 19.7 | 18.4 | 0.1 | 1.2 | 7 | % | ||||||||||||
Operating earnings/(loss) | 240.9 | 204.4 | (1.8 | ) | 38.3 | 19 | % | |||||||||||
Interest expense, net | 163.1 | 203.2 | 1.4 | (41.5 | ) | (20 | )% | |||||||||||
Other (income)/expense, net | 10.4 | 25.1 | (2.6 | ) | (12.1 | ) | (48 | )% | ||||||||||
Earnings/(loss) from continuing operations before income taxes | 67.4 | (23.9 | ) | (0.6 | ) | 91.9 | * | |||||||||||
Income tax expense/(benefit) | 49.5 | 27.0 | (1.3 | ) | 23.8 | 88 | % | |||||||||||
Earnings/(loss) from continuing operations | 17.9 | (50.9 | ) | 0.7 | 68.1 | * | ||||||||||||
Net earnings/(loss) from discontinued operations, net of tax | (2.7 | ) | 1.2 | — | (3.9 | ) | * | |||||||||||
Net earnings/(loss) | 15.2 | (49.7 | ) | 0.7 | 64.2 | * | ||||||||||||
Less: Net earnings/(loss) attributable to noncontrolling interest, net of tax | (1.0 | ) | (0.1 | ) | — | (0.9 | ) | * | ||||||||||
Net earnings/(loss) attributable to Catalent | $ | 16.2 | $ | (49.6 | ) | $ | 0.7 | $ | 65.1 | * | ||||||||
* Percentage not meaningful
Net Revenue
Net revenue increased by $29.0 million, or 2%, as compared to the twelve months ended June 30, 2013 excluding the impact of foreign exchange. The increase in net revenue was primarily due to increased demand for our softgel offering within our Oral Technologies segment and increased demand in our Medication Delivery Solutions segment, partially offset by decreased sales within our modified release technologies business included in Oral Technologies attributable to the prior year period including approximately $39 million of packaging services related revenue. In June 2013, we wound down our U.K. packaging services operation and no material revenue is included in the fiscal 2014 period.
Gross Margin
Gross margin increased by $31.8 million, or 6%, as compared to the twelve months ended June 30, 2013 on a constant currency basis. The increase in gross margin was primarily due to a favorable shift in revenue mix within our Medication Delivery Solutions segment and modified release technologies business within our Oral Technologies segment as well as increased demand for our softgel offering within our Oral Technologies segment.
Selling, General and Administrative Expense
Selling, general and administrative expense decreased by $5.6 million, as compared to the twelve months ended June 30, 2013 excluding the impact of foreign exchange, primarily due to decreased integration costs related to the acquisition of the Aptuit CTS business and decreased amortization and depreciation expense, partially offset by employee compensation costs driven by inflationary increases.
51
Restructuring and Other
Restructuring and other charges of $19.7 million for the twelve months ended June 30, 2014 increased by $1.3 million, or 7%, compared to the twelve months ended June 30, 2013. The prior period charges primarily related to headcount reduction within our Oral Technologies segment during the twelve months ended June 30, 2013. The twelve months ended June 30, 2014 included restructuring initiatives across several of our operations which were enacted to improve cost efficiency, including the consolidation of our former Allendale clinical services operation into our Philadelphia location and employee related severance expenses.
Interest Expense, net
Interest expense, net of $163.1 million for the twelve months ended June 30, 2014 decreased by $40.1 million, or 20%, compared to the twelve months ended June 30, 2013, primarily driven by the absence of interest-rate swaps in the fiscal 2014 period coupled with a lower average interest-rate as a result of debt refinancing activity that occurred during the third quarter of fiscal 2013.
Other (Income)/Expense, net
Other expense, net of $10.4 million for the twelve months ended June 30, 2014 decreased from $25.1 million in the twelve months ended June 30, 2013. Other expense, net for the twelve months ended June 30, 2013 was primarily driven by expenses related to the October 2012 redemption of certain former senior indebtedness, which included expenses related to call premiums paid and the write-off of unamortized deferred financing fees. Other expense, net of $10.4 million for the twelve months ended June 30, 2014 was primarily driven by expenses of approximately $11 million related to the May 2014 refinancing of our Senior Secured Credit Facility and the write off of unamortized deferred financing fees. Also included were non-cash unrealized gains related to foreign currency translation, partially offset by realized losses related to foreign currency translation.
Provision/(Benefit) for Income Taxes
Our provision for income taxes for the twelve months ended June 30, 2014 was $49.5 million relative to earnings before income taxes of $67.4 million. Our provision for income taxes for the twelve months ended June 30, 2013 was $27.0 million relative to losses before income taxes of $23.9 million. The income tax provision for the fiscal 2014 period is not comparable to the same period of the prior year due to changes in pretax income over many jurisdictions and the impact of discrete items. Generally, fluctuations in the effective tax rate are primarily due to changes in our geographic pretax income resulting from our business mix and changes in the tax impact of permanent differences, restructuring, other special items and other discrete tax items, which may have unique tax implications depending on the nature of the item. Our effective tax rate at June 30, 2014 reflects an increase in a tax reserve related to the potential disallowance of certain tax benefits in the United Kingdom, partially offset by a deferred tax benefit resulting from a reduction in the United Kingdom statutory tax rate during the first quarter of fiscal 2014 and benefits derived from operations outside the United States, which are generally taxed at lower rates than the U.S. statutory rate of 35%.
52
Segment Review
The Company’s results on a segment basis for the fiscal year ended June 30, 2014 compared to the fiscal year ended June 30, 2013 are as follows:
Fiscal Year Ended June 30, | FX impact (unfavorable) / favorable | Constant Currency Increase/(Decrease) | ||||||||||||||||
(Dollars in millions) | 2014 | 2013 | Change $ | Change % | ||||||||||||||
Oral Technologies | ||||||||||||||||||
Net revenue | $ | 1,180.1 | $ | 1,186.3 | $ | (13.5 | ) | $ | 7.3 | 1 | % | |||||||
Segment EBITDA | 324.3 | 315.7 | (4 | ) | 12.6 | 4 | % | |||||||||||
Medication Delivery Solutions | ||||||||||||||||||
Net revenue | 246.1 | 219.3 | 5.6 | 21.2 | 10 | % | ||||||||||||
Segment EBITDA | 48.7 | 31.5 | 1 | 16.2 | 51 | % | ||||||||||||
Development and Clinical Services | ||||||||||||||||||
Net revenue | 412.2 | 404.8 | 6.4 | 1.0 | * | |||||||||||||
Segment EBITDA | 83.5 | 75.0 | 2.0 | 6.5 | 9 | % | ||||||||||||
Inter-segment revenue elimination | (10.7 | ) | (10.1 | ) | (0.1 | ) | (0.5 | ) | 5 | % | ||||||||
Unallocated Costs(1) | (82.1 | ) | (90.6 | ) | 2.5 | 6.0 | (7 | )% | ||||||||||
Combined Total | ||||||||||||||||||
Net revenue | $ | 1,827.7 | $ | 1,800.3 | $ | (1.6 | ) | $ | 29.0 | 2 | % | |||||||
EBITDA from continuing operations | $ | 374.4 | $ | 331.6 | $ | 1.5 | $ | 41.3 | 12 | % | ||||||||
*Percentage not meaningful
(1) | Unallocated costs includes equity-based compensation, certain acquisition-related costs, impairment charges, certain other corporate directed costs, and other costs that are not allocated to the segments as follows: |
Fiscal Year Ended June 30, | |||||||
(Dollars in millions) | 2014 | 2013 | |||||
Impairment charges and gain/(loss) on sale of assets | $ | (3.2 | ) | $ | (5.2 | ) | |
Equity compensation | (4.5 | ) | (2.8 | ) | |||
Restructuring and other special items (2) | (29.4 | ) | (29.0 | ) | |||
Property and casualty losses | — | — | |||||
Sponsor advisory fee | (12.9 | ) | (12.4 | ) | |||
Noncontrolling interest | 1.0 | 0.1 | |||||
Other income/(expense), net (3) | (10.4 | ) | (25.1 | ) | |||
Non-allocated corporate costs, net | (22.7 | ) | (16.2 | ) | |||
Total unallocated costs | $ | (82.1 | ) | $ | (90.6 | ) | |
(2) | Segment results do not include restructuring and certain acquisition-related costs |
(3) | Primarily relates to realized and unrealized gains/(losses) related to foreign currency translation and expenses related to financing transactions during the period. |
Provided below is a reconciliation of earnings/(loss) from continuing operations to EBITDA from continuing operations:
53
Fiscal Year Ended June 30, | |||||||
(Dollars in millions) | 2014 | 2013 | |||||
Earnings/(loss) from continuing operations | $ | 17.9 | $ | (50.9 | ) | ||
Depreciation and amortization | 142.9 | 152.2 | |||||
Interest expense, net | 163.1 | 203.2 | |||||
Income tax (benefit)/expense | 49.5 | 27.0 | |||||
Noncontrolling interest | 1.0 | 0.1 | |||||
EBITDA from continuing operations | $ | 374.4 | $ | 331.6 | |||
Oral Technologies segment
2014 vs. 2013 | |||||
Factors Contributing to Year-Over-Year Change | Fiscal Year Ended June 30, | ||||
Net Revenue | Segment EBITDA | ||||
Organic Growth / Segment EBITDA | 1 | % | 3 | % | |
Impact of acquisitions | 2 | % | 1 | % | |
Impact of divestitures / business restructuring | (2 | )% | — | % | |
Constant currency change | 1 | % | 4 | % | |
Foreign exchange fluctuation | (2 | )% | (1 | )% | |
Total % Change | (1 | )% | 3 | % | |
Oral Technologies’ net revenue increased $7.3 million during fiscal 2014, or 1%, excluding the impact of foreign exchange. The increase is primarily due to favorable demand for our softgel offering of approximately $29 million, or 2%, as compared to the fiscal year ended June 30, 2013, partially offset by decreased sales of approximately $21 million, or 2% within our modified release technologies business which was attributable to the fiscal 2013 period including approximately $39 million of packaging services related revenue. In June 2013 we wound down our U.K. packaging services operation and no material revenue is included in the fiscal 2014 period.
Oral Technologies’ segment EBITDA increased by $12.6 million, or 4%, as compared to the twelve months ended June 30, 2013 excluding the impact of foreign exchange. The increase was primarily driven by favorable product mix in both our softgel offering and modified release technologies platform within our Oral Technologies segment.
Medication Delivery Solutions segment
2014 vs. 2013 | |||||
Factors Contributing to Year-Over-Year Change | Fiscal Year Ended June 30, | ||||
Net Revenue | Segment EBITDA | ||||
Organic Growth / Segment EBITDA | 10 | % | 51 | % | |
Impact of acquisitions | — | % | — | % | |
Impact of divestitures / business restructuring | — | % | — | % | |
Constant currency change | 10 | % | 51 | % | |
Foreign exchange fluctuation | 2 | % | 4 | % | |
Total % Change | 12 | % | 55 | % | |
Net revenue in our Medication Delivery Solutions segment increased by $21.2 million, or 10%, as compared to the twelve months ended June 30, 2013, excluding the impact of foreign exchange, primarily due to increased demand for injectable products at our European pre-filled syringe operations of approximately $15 million, or 7%, as well as increased demand for products utilizing our blow-fill-seal technology platform of approximately $7 million, or 3%.
54
Medication Delivery Solutions’ segment EBITDA increased by $16.2 million, or 51%, as compared to the twelve months ended June 30, 2013 excluding the impact of foreign exchange. The increase was primarily attributable to the increased demand for injectable and blow-fill-seal products as noted above.
Development and Clinical Services segment
2014 vs. 2013 | |||||
Factors Contributing to Year-Over-Year Change | Fiscal Year Ended June 30, | ||||
Net Revenue | Segment EBITDA | ||||
Organic Growth / Segment EBITDA | — | % | 9 | % | |
Impact of acquisitions | — | % | — | % | |
Impact of divestitures / business restructuring | — | % | — | % | |
Constant currency change | — | % | 9 | % | |
Foreign exchange fluctuation | 2 | % | 2 | % | |
Total % Change | 2 | % | 11 | % | |
Development and Clinical Services’ net revenue was level as compared to the twelve months ended June 30, 2013, excluding the impact of foreign exchange. Increased demand from our analytical service operations of approximately $18 million, or 5%, was offset by lower revenue for manufacturing and packaging services of approximately $18 million, or 5%. As we consolidated two of our clinical services operations in pursuit of acquisition synergies, we experienced revenue declines due to the hesitancy of customers to renew or place new business while we transitioned customer clinical studies.
Development and Clinical Services’ segment EBITDA increased by $6.5 million, or 9%, excluding the impact of foreign exchange, as compared to the twelve months ended June 30, 2013, primarily due to increased demand for analytical services and favorable revenue mix across the segment, partially offset by decreased demand for manufacturing and packaging services.
Liquidity and Capital Resources
Overview
Our principal source of liquidity has been cash flow generated from operations. The principal uses of cash are to fund planned operating and capital expenditures, business or asset acquisitions, interest payments on debt and any mandatory or discretionary principal payments on our debt. As of June 30, 2015, our financing needs were supported by a five-year $200 million revolving credit facility that matures in May 2019 and is reduced by $11.7 million in letters of credit. The revolving credit facility includes borrowing capacity available for letters of credit and for short-term borrowings, referred to as swing-line borrowings. As of June 30, 2015, we had no outstanding borrowings under our revolving credit facility.
We continue to believe that our cash from operations and available borrowings under the revolving credit facility will be adequate to meet our future liquidity needs for at least the next twelve months. We have no significant debt maturity until the senior secured term loans mature in May 2021.
Cash Flows
Fiscal Year Ended June 30, 2015 Compared to the Fiscal Year Ended June 30, 2014
The following table summarizes our Consolidated Statement of Cash Flows from continuing operations for the fiscal year ended June 30, 2015 compared with the fiscal year ended June 30, 2014:
Fiscal Year Ended June 30, | |||||||||||
(in millions) | 2015 | 2014 | $ Change | ||||||||
Net cash provided by/(used in): | |||||||||||
Operating activities from continuing operations | $ | 171.7 | $ | 180.2 | $ | (8.5 | ) | ||||
Investing activities from continuing operations | $ | (271.8 | ) | $ | (175.2 | ) | $ | (96.6 | ) | ||
Financing activities from continuing operations | $ | 196.5 | $ | (42.1 | ) | $ | 238.6 | ||||
55
Operating activities
For the fiscal year ended June 30, 2015, cash provided by operating activities from continuing operations was $171.7 million compared to $180.2 million for the comparable prior-year period. Cash provided by operating activities decreased compared to the same period last year by $8.5 million driven by net cash outflows associated with working capital changes compared to the previous period. These cash outflows were offset by higher earnings from continuing operations in the fiscal year ended June 30, 2015 as compared to the year ended June 30, 2014 which benefited from lower interest expense in the current year as a result of paying down high-interest debt with proceeds from the IPO.
Investing activities
For the fiscal year ended June 30, 2015, cash used in investing activities from continuing operations was $271.8 million, which primarily related to acquisitions of property, plant and equipment of $138.2 million, intangible asset additions of $2.8 million, and acquisitions of $130.8 million. We acquired the remaining interest in Redwood and purchased the stock of MTI Pharma Solutions, Inc. (Micron Technologies). Cash used in investing activities from continuing operations for the comparable prior-year period was $175.2 million, which was primarily related to the acquisition of property, plant and equipment of $122.4 million and $53.7 million for acquisition activities, including the purchases of a softgel manufacturing business in Brazil and a 67% controlling interest in a softgel manufacturing facility located in Haining, China.
Financing activities
For the fiscal year ended June 30, 2015, cash provided by financing activities was $196.5 million compared to cash used in financing activities of $42.1 million in the same period a year ago. The net proceeds raised in connection with our IPO of $948.8 million were primarily used to fund debt payments in the first quarter of $863.8 million. The current year also includes $12.6 million of call premiums paid in connection with the early termination of certain debt instruments in the period. Additionally, on December 1, 2014, we entered into Amendment No. 1 to our credit agreement to provide additional senior secured financing of incremental dollar and euro-denominated term loan facilities of $100 million and €72.8 million ($91 million), respectively. The proceeds of the borrowing were primarily used to pay the remaining $40.5 million outstanding on the unsecured term loans, fund acquisitions completed in the second quarter of $111.6 million and for general corporate purposes. Although we completed two secondary offerings of our common stock during fiscal 2015, we did not sell shares of our common stock in these offerings and did not receive any of the proceeds.
Fiscal Year Ended June 30, 2014 Compared to the Fiscal Year Ended June 30, 2013
The following table summarizes our Consolidated Statement of Cash Flows from continuing operations for the fiscal year ended June 30, 2014 compared with the fiscal year ended June 30, 2013:
Fiscal Year Ended June 30, | |||||||||||
(in millions) | 2014 | 2013 | $ Change | ||||||||
Net cash provided by/(used in): | |||||||||||
Operating activities from continuing operations | $ | 180.2 | $ | 139.1 | $ | 41.1 | |||||
Investing activities from continuing operations | $ | (175.2 | ) | $ | (122.1 | ) | $ | (53.1 | ) | ||
Financing activities from continuing operations | $ | (42.1 | ) | $ | (49.3 | ) | $ | 7.2 | |||
Operating activities
For the fiscal year ended June 30, 2014, cash provided by operating activities from continuing operations was $180.2 million compared to $139.1 million for the fiscal 2013 period. Cash provided by operating activities from continuing operations increased compared to the fiscal 2013 period by $41.1 million primarily due to increased revenues and lower interest expense, driven by the absence of interest-rate swaps in the fiscal 2014 period and an overall lower weighted interest-rate as a result of debt refinancing activity during fiscal 2013.
Investing activities
For the fiscal year ended June 30, 2014, cash used in investing activities from continuing operations was $175.2 million, which primarily related to acquisitions of property, plant and equipment of $122.4 million. During the fiscal year ended June 30, 2014, we also expended $53.7 million for acquisition activities, including the purchase of a 100% interest in a softgel manufacturing business in Brazil and a 67% controlling interesting in a softgel manufacturing facility located in Haining, China. There were no acquisitions in the fiscal 2013 period. Cash used in investing activities from continuing operations for
56
the comparable prior year period was $122.1 million, which primarily related to the acquisition of property, plant and equipment of $122.5 million.
Financing activities
For the fiscal year ended June 30, 2014, cash used in financing activities was $42.1 million compared to cash used in financing activities of $49.3 million in the fiscal 2013 period. The $42.1 million used in financing activities attributable to the fiscal year ended June 30, 2014 was comprised of $1,741.3 million, in principal payments offset by net borrowings of $1,723.7 million primarily related to refinancing our Secured Credit Agreement during the fourth quarter of fiscal 2014. In addition, a net decrease of $17.5 million in short-term borrowings was due primarily to the full repayment of certain indebtedness acquired in connection with two business combinations executed during the period and the repayment of the short-term borrowings outside of the United States. In the comparable period ended June 30, 2013 cash flows used in financing activities consisted largely of fees paid related to financing activity during the period, normal term loan principal payments and payment of other long-term obligations as well as cash inflows and outflows associated with debt refinancing activities during the year.
Debt and Financing Arrangements
Senior Secured Credit Facilities
On May 20, 2014, we entered into the Amended and Restated Credit Agreement to provide senior secured financing consisting of a seven-year $1,400.0 million term loan (the “Dollar Term Loan”), a seven-year €250.0 million term loan and a five-year $200 million revolving credit facility, the proceeds of which were used to prepay in full all outstanding all term loans under its previous senior secured facility. A $200 million revolving credit facility replaced the prior facility and includes borrowing capacity available for letters of credit and for short-term borrowings, referred to as the swing line borrowings. Borrowings under the term loan facilities and the revolving credit facility bear interest, at our option, at a rate equal to a margin over either (a) a base rate determined by reference to the higher of (1) the rate of interest published by The Wall Street Journal as its “prime lending rate” and (2) the federal funds rate plus 1/2 of 1% or (b) a LIBOR rate determined by reference to the London Interbank Offered Rate set by ICE Benchmark Administration (or any successor thereto). The applicable margin for the term loans and borrowings under the revolving credit facility may be reduced if we attain a certain total net leverage ratio. The applicable margin for borrowings is 3.50% for loans based on a LIBOR rate and 2.50% for loans based on the base rate. The LIBOR rate for term loans is subject to a floor of 1.00% and the base rate for term loans is subject to a floor of 2.00%.
On December 1, 2014, we entered into Amendment No. 1 to the Amended and Restated Credit Agreement (as amended, the “Credit Agreement”) to provide additional senior secured financing of incremental Dollar and Euro denominated term loan facilities of $100 million and €72.8 million ($91 million), respectively. The incremental term loans have substantially similar terms as our existing term loan facilities. The proceeds of the borrowing were primarily used to pay the remaining $40.5 million outstanding on the unsecured term loans, fund acquisitions completed in the second quarter of $111.6 million and general corporate purposes.
As of June 30, 2015, there were $11.7 million in outstanding letters of credit, which reduced the borrowing capacity under the $200 million revolving credit facility.
Redemption of Notes and Unsecured Term Loan Prepayment
On July 29, 2014, we provided notice of our election to redeem the entire $350.0 million aggregate principal amount outstanding 7.875% senior notes due 2018 and redeemed them on August 28, 2014 at a redemption price of 101.5% of their principal amount plus accrued and unpaid interest. The redemption was funded with proceeds from the IPO.
On August 5, 2014, we provided notice of its election to redeem the entire €225.0 million aggregate principal amount outstanding of 9.75% senior subordinated notes due 2017 and redeemed them on September 4, 2014 at a redemption price of 101.625% of their principal amount plus accrued and unpaid interest. The redemption was funded with proceeds from the IPO.
On August 6, 2014, we repaid $114.5 million of the outstanding borrowings under the unsecured term loans with proceeds from the IPO. On September 12, 2014, we repaid $120.0 million of the outstanding borrowings under the unsecured term loans with proceeds from the additional shares purchased by the representatives of the underwriters in connection with the IPO. On December 1, 2014, we repaid the remaining $40.5 million outstanding on the unsecured term loans with proceeds from the incremental senior secured term loans.
57
Guarantees and Security
All obligations under the Senior Secured Credit Facilities, and the guarantees of those obligations, are secured by substantially all of the following assets of the Company and each guarantor, subject to certain exceptions:
• | a pledge of 100% of the capital stock of the borrower and 100% of the equity interests directly held by the borrower and each guarantor in any wholly owned material subsidiary of the borrower or any guarantor (which pledge, in the case of any non-U.S. subsidiary of a U.S. subsidiary, will not include more than 65% of the voting stock of such non-U.S. subsidiary); and |
• | a security interest in, and mortgages on, substantially all tangible and intangible assets of the borrower and of each guarantor, subject to certain limited exceptions. |
Debt Covenants
The Credit Agreement contains a number of covenants that, among other things, restrict, subject to certain exceptions, our (and our restricted subsidiaries’) ability to incur additional indebtedness or issue certain preferred shares; create liens on assets; engage in mergers and consolidations; sell assets; pay dividends and distributions or repurchase capital stock; engage in certain transactions with affiliates; make investments, loans or advances; make certain acquisitions; enter into sale and leaseback transactions and change our lines of business.
The Credit Agreement also contains change of control provisions and certain customary affirmative covenants and events of default. The revolving credit facility requires compliance with a net leverage covenant when there is a 30% or more draw outstanding at a period end. As of June 30, 2015, we were in compliance with all material covenants related to our long-term debt obligations.
Subject to certain exceptions, our Credit Agreement permits us and our restricted subsidiaries to incur certain additional indebtedness, including secured indebtedness. None of our non-U.S. subsidiaries or Puerto Rico subsidiaries is a guarantor of the loans.
Liquidity in Foreign Subsidiaries
As of June 30, 2015 and June 30, 2014, the amounts of cash and cash equivalents held by foreign subsidiaries were $116.3 million and $53.5 million, respectively, out of the total consolidated cash and cash equivalents of $151.3 million and $74.4 million, respectively. We believe that the amount of funds held by foreign subsidiaries as of such dates not readily convertible into other foreign currencies, including U.S. dollars, was $1.7 million and $3.5 million, respectively. Based on our domestic cash flows from operations and our other sources of liquidity, we believe we have sufficient access to funds for our expected future domestic liquidity needs. Our intent is to continue to reinvest undistributed earnings of our foreign local entities and we do not currently plan to repatriate them to fund our operations in the United States. In the event we need to repatriate funds from outside of the United States, such repatriation would likely be subject to restrictions by local laws and/or tax consequences including foreign withholding taxes or U.S. income taxes. It is not feasible to estimate the amount of U.S. tax that might be payable on the remittance of such earnings.
Historical and Adjusted EBITDA
Under the Credit Agreement, the ability of the Operating Company to engage in certain activities such as incurring certain additional indebtedness, making certain investments and paying certain dividends is tied to ratios based on Adjusted EBITDA (which is defined as “Consolidated EBITDA” in the credit agreement). Adjusted EBITDA is a covenant compliance measure in our Credit Agreement, particularly those covenants governing debt incurrence and restricted payments. Adjusted EBITDA is not defined under U.S. GAAP and is subject to important limitations. Because not all companies use identical calculations, our presentation of Adjusted EBITDA may not be comparable to other similarly titled measures of other companies.
The most directly comparable GAAP measure to EBITDA from continuing operations and Adjusted EBITDA is earnings/(loss) from continuing operations. In calculating Adjusted EBITDA, we add back certain non-cash, non-recurring and other items that are included in the definitions of EBITDA from continuing operations and consolidated net income, as required in the Credit Agreement. Adjusted EBITDA, among other things:
• | does not include non-cash stock-based employee compensation expense and certain other non-cash charges; |
• | does not include cash and non-cash restructuring, severance and relocation costs incurred to realize future cost savings and enhance our operations; |
58
• | adds back noncontrolling interest expense, which represents minority investors’ ownership of certain of our consolidated subsidiaries and is, therefore, not available to us; and |
• | includes estimated cost savings that have not yet been fully reflected in our results. |
A reconciliation between earnings / (loss) from continuing operations and Adjusted EBITDA, which also shows the adjustments from EBITDA from continuing operations, follows:
Twelve Months Ended | |||||||
June 30 2015 | June 30, 2014 | ||||||
Earnings/(loss) from continuing operations | $ | 210.2 | $ | 17.9 | |||
Interest expense, net | 105.0 | 163.1 | |||||
Income tax expense/(benefit) (1) | (97.7 | ) | 49.5 | ||||
Depreciation and amortization | 140.8 | 142.9 | |||||
Noncontrolling interest | 1.9 | 1.0 | |||||
EBITDA from continuing operations | 360.2 | 374.4 | |||||
Equity compensation | 9.0 | 4.5 | |||||
Impairment charges and (gain)/loss on sale of assets | 4.7 | 3.2 | |||||
Financing related expenses and other (2) | 21.8 | 11.0 | |||||
U.S. GAAP Restructuring | 13.4 | 19.7 | |||||
Acquisition, integration and other special items | 13.8 | 9.8 | |||||
Foreign exchange loss/(gain) (included in other, net) (3) | (2.7 | ) | (3.5 | ) | |||
Other adjustments (4) | 22.9 | 0.3 | |||||
Sponsor advisory fee (5) | — | 12.9 | |||||
Subtotal | 443.1 | 432.3 | |||||
Estimated cost savings | — | — | |||||
Adjusted EBITDA | $ | 443.1 | $ | 432.3 | |||
FX impact (unfavorable) | $ | (27.5 | ) | ||||
Adjusted EBITDA - Constant Currency | $ | 470.6 | $ | 432.3 | |||
(1) | Represents the amount of income tax-related expense/(benefit) recorded within our net earnings/(loss) that may not result in cash payment or receipt. |
(2) | Financing-related expenses for the three months ended September 30, 2014 include $20.6 million of early debt termination expenses incurred in connection with the repayment of debt with the net proceeds of the IPO. See footnote 4 for an additional $29.8 million of IPO-related costs; totaling $50.4 million. |
(3) | Foreign exchange gain of $2.7 million for the twelve months ended June 30, 2015 included $16.4 million of unrealized foreign currency exchange rate gains primarily driven by losses of $31.4 million related to inter-company loans denominated in a currency different from the functional currency of either the borrower or the lender, partially offset by foreign currency exchange gains of $47.8 million driven by the ineffective portion of the net investment hedge related to the Euro-denominated debt. The foreign exchange adjustment was also affected by the exclusion of realized foreign currency exchange rate losses from the non-cash and cash settlement of inter-company loans of $13.7 million. Inter-company loans are between our entities and do not reflect the ongoing results of the Company’s trade operations. |
Foreign exchange gain of $3.5 million for the twelve months ended June 30, 2014 included $17.1 million of unrealized foreign currency exchange rate gains primarily driven by gains of $26.6 million related to inter-company loans denominated in a currency different from the functional currency of either the borrower or the lender, partially offset by foreign currency exchange losses of $9.5 million driven by the ineffective portion of the net investment
59
hedge related to the Euro-denominated debt. The foreign exchange adjustment was also affected by the exclusion of realized foreign currency exchange rate losses from the non-cash and cash settlement of inter-company loans of $13.6 million. Inter-company loans are between our entities and do not reflect the ongoing results of the company’s trade operations.
(4) | Other Adjustments for the twelve months ended June 30, 2015 includes $29.8 million for a sponsor advisory agreement termination fee paid in connection with the IPO. See footnote 2 for an additional $20.6 million of IPO-related costs; totaling $50.4 million. |
(5) | Represents the amount of sponsor advisory fee for each respective period. The sponsor advisory fee agreement was terminated in connection with the completion of our IPO. |
Interest Rate Risk Management
A portion of the debt used to finance our operations is exposed to interest-rate fluctuations. We may use various hedging strategies and derivative financial instruments to create an appropriate mix of fixed-and floating-rate assets and liabilities. Historically, we have used interest-rate swaps to manage the economic effect of variable rate interest obligations associated with our floating rate term loans so that the interest payable on the term loans effectively becomes fixed at a certain rate, thereby reducing the impact of future interest-rate changes on our future interest expense. As of June 30, 2015, we did not have any interest-rate swap agreements in place that would have the economic effect of modifying the variable interest obligations associated with our floating-rate term loans. During fiscal year 2013, our two U.S. dollar-denominated and one euro-denominated interest-rate swap agreements, which were designated as effective cash flow hedges for financial reporting purposes, matured. Our Japanese yen interest-rate swap, effective as an economic hedge but not designated as effective for financial reporting purposes also matured during fiscal 2013.
Currency Risk Management
We are exposed to fluctuations in the EUR-USD exchange rate on its investments in foreign operations in Europe. While we do not actively hedge against changes in foreign currency, we have mitigated the exposure of our investments in our European operations by denominating a portion of our debt in euros. At June 30, 2015, we had $355.8 million of euro-denominated debt outstanding that qualifies as a hedge of a net investment in foreign operations. Refer to Note 8 to our Consolidated Financial Statements for further discussion of net investment hedge activity in the period.
Periodically, we may utilize forward currency exchange contracts to manage our exposure to the variability of cash flows primarily related to the foreign exchange rate changes of future foreign currency transaction costs. In addition, we may utilize foreign currency forward contracts to protect the value of existing foreign currency assets and liabilities. Currently, we do not utilize foreign currency exchange contracts. We expect to continue to evaluate hedging opportunities for foreign currency in the future.
Contractual Obligations
The following table summarizes our significant contractual obligations as of June 30, 2015:
(Dollars in millions) | Total | Fiscal 2016 | Fiscal 2017 - Fiscal 2018 | Fiscal 2019 - Fiscal 2020 | Thereafter | |||||||||||||||
Long-term debt obligations (1) | $ | 1,848.9 | $ | 22.4 | $ | 39.2 | $ | 37.2 | $ | 1,750.1 | ||||||||||
Interest on long-term obligations (2) | 517.6 | 84.8 | 166.1 | 162.6 | 104.1 | |||||||||||||||
Capital lease obligations (3) | 55.5 | 1.9 | 4.8 | 5.9 | 42.9 | |||||||||||||||
Operating lease obligations (4) | 35.8 | 8.4 | 11.3 | 8.3 | 7.8 | |||||||||||||||
Purchase obligations (5) | 57.6 | 51.1 | 4.0 | 2.5 | — | |||||||||||||||
Other long-term liabilities (6) | 40.5 | 2.3 | 4.4 | 3.5 | 30.3 | |||||||||||||||
Total | $ | 2,555.9 | $ | 170.9 | $ | 229.8 | $ | 220.0 | $ | 1,935.2 | ||||||||||
(1) | Represents gross maturities of our long-term debt obligations excluding capital lease obligations as of June 30, 2015. |
(2) | Represents estimated interest payments relating to our long-term obligations including capital lease obligations. Estimated future interest payments on our variable-rate debt obligations were calculated using the interest and exchange rates as of June 30, 2015. |
60
(3) | Represents maturities of our capital lease obligations included within long-term debt as of June 30, 2015. |
(4) | Represents minimum rental payments for operating leases having initial or remaining non-cancelable lease terms. |
(5) | Purchase obligations includes agreements to purchase goods or services that are enforceable, specify all significant terms, including the following: fixed or minimum quantities to be purchased; fixed, minimum or variable price provisions; and approximate timing of the transaction. Purchase obligations disclosed above may include estimates of the time period in which cash outflows will occur. Purchase orders entered into in the normal course of business and authorizations to purchase that involve no firm commitment from either party are excluded from the above table. In addition, contracts that can be unilaterally canceled with no termination fee or with proper notice are excluded from our total purchase obligations except for the amount of the termination fee or the minimum amount of goods that must be purchased during the requisite notice period. |
(6) | Primarily relates to certain long-term employee-related liabilities for operations that we have discontinued. |
The table excludes our retirement and other post-retirement benefits ("OPEB") obligations. The timing and amount of payments for these obligations may be affected by a number of factors, including the funded status of the plans. In fiscal 2016, we are not required to make contributions to our plans to satisfy regulatory funding standards. Beyond fiscal 2016, the actual amounts required to be contributed are dependent upon, among other things, interest rates, underlying asset returns and the impact of legislative or regulatory actions related to pension funding obligations. Payments due under our OPEB plans are not required to be funded in advance, but are paid as medical costs are incurred by covered retiree populations, and are principally dependent upon the future cost of retiree medical benefits under our plans. Refer to Note 10 to the Consolidated Financial Statements for further discussion.
Off-Balance Sheet Arrangements
Other than operating leases and letters of credit under the senior secured credit facility, we do not have any material off-balance sheet arrangements as of June 30, 2015. See Note 6 to the Consolidated Financial Statements for further detail.
61
ITEM 7A. | QUANTITATIVE AND QUALITATIVE DISCLOSURES ABOUT MARKET RISK |
We are exposed to cash flow and earnings fluctuations as a result of certain market risks. These market risks primarily relate to changes in interest rates associated with our long-term debt obligations and foreign exchange rate changes.
Interest Rate Risk
The Company has historically used interest-rate swaps to manage the economic effect of variable rate interest obligations associated with our floating-rate term loans so that the interest payable on the term loans effectively becomes fixed at a certain rate, thereby reducing the impact of future interest-rate changes on our future interest expense. As of June 30, 2015, we did not have any interest-rate swap agreements in place that would either have the economic effect of modifying the variable interest obligations associated with our floating-rate term loans or would be considered effective cash flow hedges for financial reporting purposes. Our two U.S. dollar-denominated and one euro-denominated interest-rate swap agreements, which were designated as effective cash flow hedges for financial reporting purposes, matured in April 2013. Our Japanese yen interest-rate swap, effective as an economic hedge but not designated as effective for financial reporting purposes, matured in May 2013.
In February 2013, in connection with the refinancing our €44.9 million term loan, we de-designated €35.0 million of the €240.0 million notional Euribor-based interest-rate swap. Prior to de-designation, the effective portion of the change in fair value of the derivative was recorded as a component of other comprehensive income/(loss). The other comprehensive income/(loss) balance associated with the de-designated portion of the derivative was reclassified to earnings during the second half of fiscal 2013.
Foreign Currency Exchange Risk
By the nature of our global operations, we are exposed to cash flow and earnings fluctuations resulting from foreign exchange rate variation. These exposures are transactional and translational in nature. Since we manufacture and sell our products throughout the world, our foreign currency risk is diversified. Principal drivers of this diversified foreign exchange exposure include the European euro, British pound, Argentinean peso, Brazilian real and Australian dollar. Our transactional exposure arises from the purchase and sale of goods and services in currencies other than the functional currency of our operational units. We also have exposure related to the translation of financial statements of our foreign divisions into U.S. dollars, the functional currency of the parent. The financial statements of our operations outside the U.S. are measured using the local currency as the functional currency. Adjustments to translate the assets and liabilities of these foreign operations in U.S. dollars are accumulated as a component of other comprehensive income/(loss) utilizing period-end exchange rates. Foreign currency transaction gains and losses calculated by utilizing weighted average exchange rates for the period are included in the statements of operations in “other expense, net.” Such foreign currency transaction gains and losses include inter-company loans denominated in non-U.S. dollar currencies.
62
ITEM 8. | FINANCIAL STATEMENTS AND SUPPLEMENTARY DATA |
INDEX TO FINANCIAL STATEMENTS
Consolidated Financial Statements as of June 30, 2015 and 2014 and for the years ended June 30, 2015, 2014 and 2013
63
Report of Independent Registered Public Accounting Firm
The Board of Directors and Shareholders of
Catalent, Inc.
We have audited the accompanying consolidated balance sheets of Catalent, Inc. and subsidiaries as of June 30, 2015 and 2014, and the related consolidated statements of operations, comprehensive income/(loss), changes in shareholders’ equity/(deficit), and cash flows for each of the three years in the period ended June 30, 2015. Our audits also included the financial statement schedule listed in the Index at Item 15(a). These financial statements and schedule are the responsibility of the Company’s management. Our responsibility is to express an opinion on these financial statements and schedule based on our audits.
We conducted our audits in accordance with the standards of the Public Company Accounting Oversight Board (United States). Those standards require that we plan and perform the audit to obtain reasonable assurance about whether the financial statements are free of material misstatement. We were not engaged to perform an audit of the Company’s internal control over financial reporting. Our audits included consideration of internal control over financial reporting as a basis for designing audit procedures that are appropriate in the circumstances, but not for the purpose of expressing an opinion on the effectiveness of the Company’s internal control over financial reporting. Accordingly, we express no such opinion. An audit also includes examining, on a test basis, evidence supporting the amounts and disclosures in the financial statements, assessing the accounting principles used and significant estimates made by management, and evaluating the overall financial statement presentation. We believe that our audits provide a reasonable basis for our opinion.
In our opinion, the consolidated financial statements referred to above present fairly, in all material respects, the consolidated financial position of Catalent, Inc. and subsidiaries at June 30, 2015 and 2014 and the consolidated results of their operations and their cash flows for each of the three years in the period ended June 30, 2015, in conformity with U.S. generally accepted accounting principles. Also, in our opinion, the related financial statement schedule, when considered in relation to the basic financial statements taken as a whole, presents fairly in all material respects the information set forth therein.
/s/ Ernst & Young LLP
MetroPark, New Jersey
September 2, 2015
64
Catalent, Inc. and Subsidiaries
Consolidated Statements of Operations
(Dollars in millions, except per share data)
Year ended June 30, | |||||||||||
2015 | 2014 | 2013 | |||||||||
Net revenue | $ | 1,830.8 | $ | 1,827.7 | $ | 1,800.3 | |||||
Cost of sales | 1,215.5 | 1,229.1 | 1,231.7 | ||||||||
Gross margin | 615.3 | 598.6 | 568.6 | ||||||||
Selling, general and administrative expenses | 337.3 | 334.8 | 340.6 | ||||||||
Impairment charges and (gain)/loss on sale of assets | 4.7 | 3.2 | 5.2 | ||||||||
Restructuring and other | 13.4 | 19.7 | 18.4 | ||||||||
Operating earnings/(loss) | 259.9 | 240.9 | 204.4 | ||||||||
Interest expense, net | 105.0 | 163.1 | 203.2 | ||||||||
Other (income)/expense, net | 42.4 | 10.4 | 25.1 | ||||||||
Earnings/(loss) from continuing operations before income taxes | 112.5 | 67.4 | (23.9 | ) | |||||||
Income tax expense/(benefit) | (97.7 | ) | 49.5 | 27.0 | |||||||
Earnings/(loss) from continuing operations | 210.2 | 17.9 | (50.9 | ) | |||||||
Net earnings/(loss) from discontinued operations, net of tax | 0.1 | (2.7 | ) | 1.2 | |||||||
Net earnings/(loss) | 210.3 | 15.2 | (49.7 | ) | |||||||
Less: Net earnings/(loss) attributable to noncontrolling interest, net of tax | (1.9 | ) | (1.0 | ) | (0.1 | ) | |||||
Net earnings/(loss) attributable to Catalent | $ | 212.2 | $ | 16.2 | $ | (49.6 | ) | ||||
Amounts attributable to Catalent: | |||||||||||
Earnings/(loss) from continuing operations less net income (loss) attributable to noncontrolling interest | 212.1 | 18.9 | (50.8 | ) | |||||||
Net earnings/(loss) attributable to Catalent | 212.2 | 16.2 | (49.6 | ) | |||||||
Earnings per share attributable to Catalent: | |||||||||||
Basic | |||||||||||
Earnings/(loss) continuing operations | 1.77 | 0.25 | (0.68 | ) | |||||||
Net earnings/(loss) | 1.77 | 0.22 | (0.66 | ) | |||||||
Diluted | |||||||||||
Earnings/(loss) continuing operations | 1.75 | 0.25 | (0.68 | ) | |||||||
Net earnings/(loss) | 1.75 | 0.21 | (0.66 | ) | |||||||
The accompanying notes are an integral part of these consolidated financial statements.
65
Catalent, Inc. and Subsidiaries
Consolidated Statements of Comprehensive Income/(Loss)
(Dollars in millions)
Year Ended June 30, | |||||||||||
2015 | 2014 | 2013 | |||||||||
Net earnings/(loss) | $ | 210.3 | $ | 15.2 | $ | (49.7 | ) | ||||
Other comprehensive income/(loss), net of tax | |||||||||||
Foreign currency translation adjustments | (144.0 | ) | 32.4 | (47.9 | ) | ||||||
Defined benefit pension plan | (6.4 | ) | (15.5 | ) | 8.7 | ||||||
Deferred compensation/(benefit) | 0.6 | 1.7 | 0.8 | ||||||||
Earnings/(loss) on derivatives for the period | — | — | 24.5 | ||||||||
Other comprehensive income/(loss), net of tax | (149.8 | ) | 18.6 | (13.9 | ) | ||||||
Comprehensive income/(loss) | 60.5 | 33.8 | (63.6 | ) | |||||||
Comprehensive income/(loss) attributable to noncontrolling interest | (1.9 | ) | (0.6 | ) | (0.1 | ) | |||||
Comprehensive income/(loss) attributable to Catalent | $ | 62.4 | $ | 34.4 | $ | (63.5 | ) | ||||
The accompanying notes are an integral part of these consolidated financial statements.
66
Catalent, Inc. and Subsidiaries
Consolidated Balance Sheets
(Dollars in millions except per share data)
June 30, 2015 | June 30, 2014 | ||||||
ASSETS | |||||||
Current assets: | |||||||
Cash and cash equivalents | $ | 151.3 | $ | 74.4 | |||
Trade receivables, net | 372.4 | 403.7 | |||||
Inventories | 132.9 | 134.8 | |||||
Prepaid expenses and other | 80.9 | 74.6 | |||||
Total current assets | 737.5 | 687.5 | |||||
Property, plant, and equipment, net | 885.2 | 873.0 | |||||
Other assets: | |||||||
Goodwill | 1,061.5 | 1,097.1 | |||||
Other intangibles, net | 368.7 | 357.6 | |||||
Deferred income taxes | 64.1 | 26.3 | |||||
Other | 28.4 | 48.7 | |||||
Total assets | $ | 3,145.4 | $ | 3,090.2 | |||
LIABILITIES, REDEEMABLE NONCONTROLLING INTEREST, AND SHAREHOLDERS’ EQUITY/(DEFICIT) | |||||||
Current liabilities: | |||||||
Current portion of long-term obligations and other short-term borrowings | $ | 23.8 | $ | 25.2 | |||
Accounts payable | 128.2 | 148.1 | |||||
Other accrued liabilities | 247.0 | 279.7 | |||||
Total current liabilities | 399.0 | 453.0 | |||||
Long-term obligations, less current portion | 1,864.1 | 2,685.4 | |||||
Pension liability | 143.7 | 154.7 | |||||
Deferred income taxes | 56.3 | 103.2 | |||||
Other liabilities | 42.5 | 61.2 | |||||
Commitment and contingencies (see Note 16) | — | — | |||||
Redeemable noncontrolling interest | 5.8 | 4.5 | |||||
Shareholders’ equity/(deficit): | |||||||
Common stock $0.01 par value; 1.0 billion and 84,000,000 shares authorized in 2015 and 2014, respectively; 124,319,279 and 74,821,348 shares issued and outstanding in 2015 and 2014, respectively. | 1.2 | 0.7 | |||||
Preferred stock $0.01 par value; 100 million and 0 authorized in 2015 and 2014, respectively, 0 issued and outstanding in 2015 and 2014. | |||||||
Additional paid in capital | 1,973.7 | 1,031.4 | |||||
Accumulated deficit | (1,166.9 | ) | (1,379.1 | ) | |||
Accumulated other comprehensive income/(loss) | (174.0 | ) | (24.2 | ) | |||
Total Catalent shareholders’ equity/(deficit) | 634.0 | (371.2 | ) | ||||
Noncontrolling interest | — | (0.6 | ) | ||||
Total shareholders’ equity/(deficit) | 634.0 | (371.8 | ) | ||||
Total liabilities, redeemable noncontrolling interest and shareholders’ equity/(deficit) | $ | 3,145.4 | $ | 3,090.2 | |||
The accompanying notes are an integral part of these consolidated financial statements
67
Catalent, Inc. and Subsidiaries
Consolidated Statement of Changes in Shareholders’ Equity/(Deficit)
(Dollars in millions, except share data in thousands)
Shares of Common Stock | Common Stock | Additional Paid in Capital | Accumulated Deficit | Accumulated Other Comprehensive (Loss)/Income | Noncontrolling Interest | Total Shareholders’ Equity/(Deficit) | ||||||||||||||||||||
Balance at June 30, 2012 | 74,756.1 | $ | 0.7 | $ | 1,023.2 | $ | (1,345.7 | ) | $ | (28.9 | ) | $ | — | $ | (350.7 | ) | ||||||||||
Equity contribution | 40.0 | 0.7 | 0.5 | 1.2 | ||||||||||||||||||||||
Equity compensation | 2.8 | 2.8 | ||||||||||||||||||||||||
Net earnings/(loss) | (49.6 | ) | (0.1 | ) | (49.7 | ) | ||||||||||||||||||||
Other comprehensive income /(loss), net of tax | (13.9 | ) | (13.9 | ) | ||||||||||||||||||||||
Balance at June 30, 2013 | 74,796.1 | 0.7 | 1,026.7 | (1,395.3 | ) | (42.8 | ) | 0.4 | (410.3 | ) | ||||||||||||||||
Equity contribution | 25.2 | 0.2 | (0.4 | ) | (0.2 | ) | ||||||||||||||||||||
Equity compensation | 4.5 | 4.5 | ||||||||||||||||||||||||
Net earnings/(loss) | 16.2 | (0.6 | ) | 15.6 | ||||||||||||||||||||||
Other comprehensive income /(loss), net of tax | 18.6 | 18.6 | ||||||||||||||||||||||||
Balance at June 30, 2014 | 74,821.3 | 0.7 | 1,031.4 | (1,379.1 | ) | (24.2 | ) | (0.6 | ) | (371.8 | ) | |||||||||||||||
Equity contribution | 48,875.0 | 0.5 | 946.1 | 946.6 | ||||||||||||||||||||||
Stock option exercises | 623.0 | |||||||||||||||||||||||||
Equity compensation | 9.0 | 9.0 | ||||||||||||||||||||||||
Cash paid, in lieu of equity, for tax withholding | (10.3 | ) | (10.3 | ) | ||||||||||||||||||||||
Noncontrolling interest ownership changes | (2.5 | ) | 1.0 | (1.5 | ) | |||||||||||||||||||||
Net earnings/(loss) | 212.2 | (0.4 | ) | 211.8 | ||||||||||||||||||||||
Other comprehensive income /(loss), net of tax | (149.8 | ) | (149.8 | ) | ||||||||||||||||||||||
Balance at June 30, 2015 | 124,319.3 | $ | 1.2 | $ | 1,973.7 | $ | (1,166.9 | ) | $ | (174.0 | ) | $ | — | $ | 634.0 | |||||||||||
The accompanying notes are an integral part of these consolidated financial statements
68
Catalent, Inc. and Subsidiaries
Consolidated Statements of Cash Flows
(Dollars in millions)
Year ended June 30, | |||||||||||
2015 | 2014 | 2013 | |||||||||
CASH FLOWS FROM OPERATING ACTIVITIES: | |||||||||||
Net earnings/(loss) | $ | 210.3 | $ | 15.2 | $ | (49.7 | ) | ||||
Net earnings/(loss) from discontinued operations | 0.1 | (2.7 | ) | 1.2 | |||||||
Earnings/(loss) from continuing operations | 210.2 | 17.9 | (50.9 | ) | |||||||
Adjustments to reconcile (loss)/earnings from continued operations to net cash from operations: | |||||||||||
Depreciation and amortization | 140.8 | 142.9 | 152.2 | ||||||||
Non-cash foreign currency transaction (gains)/losses, net | (16.4 | ) | (17.1 | ) | 6.6 | ||||||
Amortization and write off of debt financing costs | 16.0 | 14.0 | 19.0 | ||||||||
Asset impairments and (gain)/loss on sale of assets | 4.7 | 3.2 | 5.2 | ||||||||
Non-cash gain on acquisition | (8.9 | ) | — | — | |||||||
Call premium and financing fees paid | 12.6 | 7.2 | 10.8 | ||||||||
Equity compensation | 9.0 | 4.5 | 2.8 | ||||||||
Provision/(benefit) for deferred income taxes | (120.7 | ) | (15.1 | ) | 8.3 | ||||||
Provision for bad debts and inventory | 12.7 | 9.8 | 10.4 | ||||||||
Change in operating assets and liabilities: | |||||||||||
Decrease/(increase) in trade receivables | (7.5 | ) | (38.0 | ) | (23.6 | ) | |||||
Decrease/(increase) in inventories | (19.2 | ) | (8.5 | ) | (10.5 | ) | |||||
Increase/(decrease) in accounts payable | (11.7 | ) | (7.6 | ) | 17.9 | ||||||
Other accrued liabilities and operating items, net | (49.9 | ) | 67.0 | (9.1 | ) | ||||||
Net cash provided by/(used in) operating activities from continuing operations | 171.7 | 180.2 | 139.1 | ||||||||
Net cash provided by/(used in) operating activities from discontinued operations | 0.1 | (1.9 | ) | (1.4 | ) | ||||||
Net cash provided by/(used in) operating activities | 171.8 | 178.3 | 137.7 | ||||||||
CASH FLOWS FROM INVESTING ACTIVITIES: | |||||||||||
Acquisition of property and equipment and other productive assets | (141.0 | ) | (122.4 | ) | (122.5 | ) | |||||
Proceeds from sale of property and equipment | — | 0.9 | 2.9 | ||||||||
Payment for acquisitions, net | (130.8 | ) | (53.7 | ) | (2.5 | ) | |||||
Net cash provided by/(used in) investing activities from continuing operations | (271.8 | ) | (175.2 | ) | (122.1 | ) | |||||
Net cash provided by/(used in) investing activities from discontinued operations | — | 4.0 | — | ||||||||
Net cash provided by/(used in) investing activities | (271.8 | ) | (171.2 | ) | (122.1 | ) | |||||
CASH FLOWS FROM FINANCING ACTIVITIES: | |||||||||||
Net change in short-term borrowings | — | (17.5 | ) | (3.9 | ) | ||||||
Proceeds from Borrowing, net | 150.4 | 1,723.7 | 672.7 | ||||||||
Payments related to long-term obligations | (879.8 | ) | (1,741.3 | ) | (708.5 | ) | |||||
Call premium and financing fees paid | (12.6 | ) | (7.2 | ) | (10.8 | ) | |||||
Equity contribution | 948.8 | 0.2 | 1.2 | ||||||||
Cash paid, in lieu of equity, for tax withholding obligation | (10.3 | ) | — | — | |||||||
Net cash (used in)/provided by financing activities from continuing operations | 196.5 | (42.1 | ) | (49.3 | ) | ||||||
Net cash (used in)/provided by financing activities from discontinued operations | — | — | — | ||||||||
Net cash (used in)/provided by financing activities | 196.5 | (42.1 | ) | (49.3 | ) | ||||||
Effect of foreign currency on cash | (19.6 | ) | 3.0 | 1.1 | |||||||
NET INCREASE/(DECREASE) IN CASH AND EQUIVALENTS | 76.9 | (32.0 | ) | (32.6 | ) | ||||||
CASH AND EQUIVALENTS AT BEGINNING OF PERIOD | 74.4 | 106.4 | 139.0 | ||||||||
CASH AND EQUIVALENTS AT END OF PERIOD | $ | 151.3 | $ | 74.4 | $ | 106.4 | |||||
SUPPLEMENTARY CASH FLOW INFORMATION: | |||||||||||
Interest paid | $ | 107.1 | $ | 153.8 | $ | 200.1 | |||||
Income taxes paid, net | $ | 34.0 | $ | 21.0 | $ | 14.2 | |||||
The accompanying notes are an integral part of these consolidated financial statements
69
Catalent, Inc. and Subsidiaries
Notes to Consolidated Financial Statements
(Dollars in millions, except per share data)
1. | BASIS OF PRESENTATION AND SUMMARY OF SIGNIFICANT ACCOUNTING POLICIES |
Business
Catalent, Inc. (“Catalent” or the “Company”) directly and wholly owns PTS Intermediate Holdings LLC (“Intermediate Holdings”). Intermediate Holdings directly and wholly owns Catalent Pharma Solutions, Inc. (the “Operating Company”). The financial results of Catalent are primarily comprised of the financial results of Operating Company and its subsidiaries on a consolidated basis.
In July 2014, the Company’s board of directors and holders of the requisite number of outstanding shares of its capital stock approved an amendment to the Company’s amended and restated certificate of incorporation to effect a 70-for-1 stock split of its outstanding common stock (the “stock split”). The stock split became effective on July 17, 2014 upon the filing of the Company’s Certificate of Amendment of the Amended and Restated Certificate of Incorporation with the Delaware Secretary of State. On the effective date of the stock split, (i) each outstanding share of common stock was increased to seventy shares of common stock, (ii) the number of shares of common stock issuable under each outstanding option to purchase common stock was proportionately increased on a one-to-seventy basis, (iii) the exercise price of each outstanding option to purchase common stock was proportionately decreased on a one-to-seventy basis, and (iv) the number of shares underlying each restricted stock unit was proportionately increased on a one-to-seventy basis. All of the share and per share information referenced throughout the financial statements and notes to the consolidated financial statements have been retroactively adjusted to reflect this stock split.
On July 31, 2014, the Company commenced an initial public offering of its common stock (the “IPO”). As part of its IPO, the Company sold a total of 48.9 million shares at a price of $20.50 per share, before underwriting discounts and commissions. Net of these discounts and commissions and other offering expenses, the Company obtained total proceeds from the IPO, including the underwriters’ over-allotment option, of $952.2 million, which it used to fully redeem the outstanding Senior Subordinated Notes, redeem the outstanding Senior Notes, repay portions of the Company’s unsecured term loan, and pay to Blackstone and certain other shareholders an advisory agreement termination fee of $29.8 million (recorded within other income/(expense), net on the Consolidated Statement of Operations), and for other corporate purposes. The Company’s common stock began trading on the New York Stock Exchange (the “NYSE”) under the symbol “CTLT” as of the IPO. Refer to Note 6 for further discussion regarding debt repayments.
On March 9, 2015, an affiliate of The Blackstone Group, L.P. that owned shares in the Company (“Blackstone”), Genstar Capital and Aisling Capital (collectively the "selling stockholders") completed a secondary offering of 27.3 million shares of the Company’s common stock, including 3.6 million shares sold pursuant to the over-allotment option granted to the underwriters at a price of $29.50 per share before underwriting discounts and commissions. On June 2, 2015, the selling stockholders completed an additional secondary offering of 16.1 million shares, including 2.1 million shares sold pursuant to the over-allotment option, at a price of $29.00 per share, before underwriting discounts and commissions. The Company did not sell any stock in either secondary offering and did not receive any proceeds of the sales. Blackstone’s ownership in the Company was reduced to 32.7%following the March offering and to 20.8% following the June offering, and as a result the Company has not qualified as a “controlled company” under applicable NYSE listing standards since March 9, 2015.
We are the leading global provider of development solutions and advanced delivery technologies for drugs, biologics and consumer health products. Through our extensive capabilities and deep expertise in product development, we help our customers bring more products to market, faster. Our advanced delivery technology platforms, the broadest and most diverse combination of intellectual property and proven formulation, manufacturing and regulatory expertise available to the industry, enable our customers to bring more products and better treatments to the market. Across both development and delivery, our commitment to reliably supply our customers’ needs serves as the foundation for the value we provide. We operate through four operating segments: Development and Clinical Services, Softgel Technologies, Modified Release Technologies, and Medication Delivery Solutions. We believe that through our prior and ongoing investments in growth-enabling capacity and capabilities, our entry into new markets, our ongoing focus on operational and quality excellence, our innovation activities, the sales of existing customer products, and the introduction of new customer products, we will continue to benefit from attractive margins and realize the growth potential from these areas.
For financial reporting purposes, we present three financial reporting segments based on criteria established by U.S. GAAP: Development and Clinical Services, Oral Technologies and Medication Delivery Solutions. The Oral Technologies segment includes the Softgel Technologies and Modified Release Technologies (“MRT”) businesses.
70
Oral Technologies
The Company’s Oral Technologies segment provides advanced oral delivery technologies, including formulation, development and manufacturing of oral dose forms for prescription and consumer health products across all phases of a molecule’s lifecycle. These oral dose forms include softgel, modified release technology and immediate release solid oral technology products. At certain facilities the Company also provides integrated primary packaging services for the products the Company manufactures. In fiscal 2015, the Company generated approximately $787.5 million in revenue from its softgel products and approximately $391.5 million in revenue from its MRT products (including intra-segment revenue of approximately $37.9 million).
Through the Softgel Technologies business, the Company provides formulation, development and manufacturing services for soft gelatin capsules, or “softgels,” which the Company first commercialized in the 1930s. The Company is the market leader in overall softgel manufacturing and holds the leading market position in the prescription arena. The Company’s principal softgel technologies include traditional softgel capsules (in which the shell is made from animal-derived materials) and Vegicaps and OptiShell capsules (in which the shell is made from vegetable-derived materials), which are used in a broad range of customer products including prescription drugs, over-the-counter medications, and vitamins and supplements. Softgel capsules encapsulate liquid, paste or oil-based active compounds in solution or suspension within an outer shell, filling and sealing the capsule simultaneously. The Company performs all encapsulation within one of the Company’s softgel facilities, with active ingredients provided by customers or sourced directly by the Company. Softgels have historically been used to solve formulation challenges or technical issues for a specific drug, to help improve the clinical performance of compounds, to provide important market differentiation, particularly for over-the-counter compounds, and to provide safe handling of hormonal, potent and cytotoxic drugs. The Company also participates in the softgel over-the-counter and vitamin, mineral and supplement business in selected regions around the world. With the 2001 introduction of the Company’s vegetable-derived softgel shell, Vegicaps capsules, consumer health manufacturers have been able to extend the softgel dose form to a broader range of active ingredients and serve patient/consumer populations that were previously inaccessible due to religious, dietary or cultural preferences. In recent years this platform has been extended to pharmaceutical active ingredients via the OptiShell platform. The Company’s Vegicaps and OptiShell capsules are patent protected in most major global markets. Physician and patient studies that the Company has conducted have demonstrated a preference for softgels versus traditional tablet and hard capsule dose forms in terms of ease of swallowing, real or perceived speed of delivery, ability to remove or eliminate unpleasant odor or taste and, for physicians, perceived improved patient adherence with dosing regimens.
Through the Company’s Modified Release Technologies business, the Company provides formulation, development and manufacturing services for fast-dissolve tablets and both proprietary and conventional controlled release products. The Company launched its orally dissolving tablet business in 1986 with the introduction of Zydis tablets, a unique oral dosage form that is freeze-dried in its package, can be swallowed without water, and typically dissolves in the mouth in less than three seconds. Most often used for indications, drugs and patient groups that can benefit from rapid oral disintegration, the Zydis technology is utilized in a wide range of products and indications, including treatments for a variety of central nervous system-related conditions such as migraines, Parkinson’s Disease, schizophrenia, and pain relief. Zydis tablets continue to be used in new ways by its customers as the Company extends the application of the technology to new categories, such as for immunotherapies, vaccines and biologics delivery. More recently, the Company has added two new technology platforms to the Modified Release business portfolio, including the highly flexible OptiDose tab-in-tab technology, already commercially proven in Japan, and the OptiMelt hot melt extrusion technology. The Company plans to continue to expand the development pipeline of customer products for all of its modified release technologies. Representative Oral Technologies business customers include Pfizer, Novartis, GlaxoSmithKline, Eli Lilly, Johnson & Johnson and Allergan.
Medication Delivery Solutions
The Company’s Medication Delivery Solutions segment provides formulation, development and manufacturing services for delivery of drugs and biologics, administered via injection, inhalation and ophthalmic routes, using both traditional and advanced technologies. The Company’s range of injectable manufacturing offerings includes filling drugs or biologics into pre-filled syringes, with flexibility to accommodate other formats within its existing network, focused increasingly on complex pharmaceuticals and biologics. With the Company’s wide variety of technologies, it is able to meet a wide range of specifications, timelines and budgets. The complexity of the manufacturing process, the importance of experience and know-how, regulatory compliance, and high start-up capital requirements create significant barriers to entry and, as a result, limit the number of competitors in the market. For example, blow-fill-seal is an advanced aseptic processing technology that uses a continuous process to form, fill with drug, and seal a plastic container in a sterile environment. Blow-fill-seal units are currently used for a variety of pharmaceuticals in liquid form, such as respiratory, ophthalmic and otic products. The Company is a leader in the outsourced blow-fill-seal market, and operates one of the largest capacity commercial manufacturing blow-fill-seal facilities in the world. The Company’s sterile blow-fill-seal business provides flexible and scalable solutions for unit-dose delivery of complex formulations
71
such as suspensions and emulsions, as well as innovative design and engineering container design and manufacturing solutions. The Company’s regulatory expertise can lead to decreased time to commercialization, and its dedicated development production lines support feasibility, stability and clinical runs. The Company plans to continue to expand its product line in existing and new markets, and in higher margin specialty products with additional respiratory, ophthalmic, and injectable applications. Representative customers include Pfizer, Sanofi-Aventis, Novartis, Roche and Teva.
The Company’s biologics offerings include its formulation development and cell-line manufacturing based on its advanced and patented Gene Product Expression (“GPEx”) technology, which is used to develop stable, high-yielding mammalian cell lines for both innovator and bio-similar biologic compounds. The Company’s GPEx technology can provide rapid cell line development, high biologics production yields, flexibility and versatility. The Company believes its development stage SMARTag next-generation antibody-drug conjugate technology will provide more precision targeting for delivery of drugs to tumors or other locations, with improved safety versus existing technologies. In fiscal 2013, the Company launched its new biologics facility in Madison, Wisconsin, with expanded capability and capacity to produce clinical-scale biologic supplies; combined with offerings from other businesses of Catalent and external partners, the Company now provides the broadest range of technologies and services supporting the development and launch of new biologic entities, biosimilars or biobetters to bring a product from gene to market commercialization, faster. Additionally, in fiscal 2015, the Company completed a large-scale expansion at its Winchester, Kentucky manufacturing facility, doubling its footprint to 180,000 square feet.
Development and Clinical Services
The Company’s Development & Clinical Services segment provides manufacturing, packaging, storage and inventory management for drugs and biologics in clinical trials. The Company offers customers flexible solutions for clinical supplies production, and provides distribution and inventory management support for both simple and complex clinical trials. This includes dose-form manufacturing or over-encapsulation where needed; supplying placebos, comparator drug procurement and clinical packages and kits for physicians and patients; inventory management; investigator kit ordering and fulfillment; and return supply reconciliation and reporting. The Company supports trials in all regions of the world through its facilities and distribution network. In fiscal 2013, the Company formed a joint venture with ShangPharma Corporation to expand its clinical supply services network into China and acquired the remaining interest in the venture in fiscal 2015.
The Company also offers analytical chemical and cell-based testing and scientific services, stability testing, respiratory products formulation and manufacturing, regulatory consulting, and bioanalytical testing for biologic products. The Company’s respiratory product capabilities include development and manufacturing services for inhaled products for delivery via metered dose inhalers, dry powder inhalers and intra-nasal sprays. The Company also provides formulation development and clinical and commercial manufacturing for conventional and specialty oral dose forms. The Company provides global regulatory and clinical support services for its customers’ regulatory and clinical strategies during all stages of development. Demand for the Company’s offerings is driven by the need for scientific expertise and depth and breadth of services offered, as well as by the reliable supply thereof, including quality, execution and performance. The Company acquired Micron Technologies in November 2014, extending its particle engineering capabilities. The Company is the leading provider of integrated development solutions and one of the leading providers of clinical trial supplies and respiratory products.
Basis of Presentation
These financial statements include all of the Company’s subsidiaries, including those operating outside the United States (U.S) and are prepared in accordance with accounting principles generally accepted in the United States (U.S. GAAP). All significant transactions among the Company’s businesses have been eliminated.
Reclassifications
The Company made certain reclassifications to conform components of the prior periods’ income tax rate reconciliation, which is included in Footnote 9 Income Taxes, to current year presentation. There was no impact to the consolidated financial statements as a result of this reclassification.
Use of Estimates
The preparation of financial statements in conformity with US GAAP requires management to make estimates and assumptions that affect amounts reported in the financial statements and accompanying notes. Such estimates include, but are not limited to, allowance for doubtful accounts, inventory and long-lived asset valuation, goodwill and other intangible asset valuation and impairment, equity-based compensation, income taxes, derivative financial instruments and pension plan asset and liability valuation. Actual amounts may differ from these estimated amounts.
72
Foreign Currency Translation
The financial statements of the Company’s operations outside the U.S. are generally measured using the local currency as the functional currency. Adjustments to translate the assets and liabilities of these foreign operations into U.S. dollars are accumulated as a component of other comprehensive income/(loss) utilizing period-end exchange rates. The currency fluctuation related to certain long-term inter-company loans deemed to not be repayable in the foreseeable future have been recorded within the cumulative translation adjustment, a component of other comprehensive income/(loss). In addition, the currency fluctuation associated with the portion of the Company’s euro-denominated debt designated as a net investment hedge is included as a component of other comprehensive income/(loss). Foreign currency transaction gains and losses calculated by utilizing weighted average exchange rates for the period are included in the statements of operations in “other expense, net.” Such foreign currency transaction gains and losses include inter-company loans that are long-term in nature.
Revenue Recognition
In accordance with ASC 605 Revenue Recognition, the Company recognizes revenue when persuasive evidence of an arrangement exists, product delivery has occurred or the services have been rendered, the price is fixed or determinable and collectability is reasonably assured. In cases where the Company has multiple contracts with the same customer, the Company evaluates those contracts to assess if the contracts are linked or are separate arrangements. Factors the Company considers include the timing of negotiation, interdependency with other contracts or elements and payment terms. The Company and its customers generally view each contract discussion as a separate arrangement.
Manufacturing and packaging service revenue is recognized upon delivery of the product in accordance with the terms of the contract, which specify when transfer of title and risk of loss occurs. Some of the Company’s manufacturing contracts with its customers have annual minimum purchase requirements. At the end of the contract year, revenue is recognized for the unfilled purchase obligation in accordance with the contract terms. Development service contracts generally take the form of a fee-for-service arrangement. After the Company has evidence of an arrangement, the price is determinable and there is a reasonable expectation regarding payment, the Company recognizes revenue at the point in time the service obligation is completed and accepted by the customer. Examples of output measures include a formulation report, analytical and stability testing, clinical batch production or packaging and the storage and distribution of a customer’s clinical trial material. Development service revenue is primarily driven by the Company’s Development and Clinical Services segment.
Arrangements containing multiple elements, including service arrangements, are accounted for in accordance with the provisions of ASC 605-25, Revenue Recognition: Multiple-Element Arrangements. The Company determines the separate units of account in accordance with ASC 605-25. If the deliverable meets the criteria of a separate unit of accounting, the arrangement consideration is allocated to each element based upon its relative selling price. In determining the best evidence of selling price of a unit of account the Company utilizes vendor-specific objective evidence (“VSOE”), which is the price the Company charges when the deliverable is sold separately. When VSOE is not available, management uses relevant third-party evidence (“TPE”) of selling price, if available. When neither VSOE nor TPE of selling price exists, management uses its best estimate of selling price.
Cash and Cash Equivalents
All liquid investments purchased with an original maturity of three months or less are considered to be cash and equivalents. The carrying value of these cash equivalents approximates fair value.
Receivables and Allowance for Doubtful Accounts
Trade receivables are primarily comprised of amounts owed to the Company through its operating activities and are presented net of an allowance for doubtful accounts. The Company monitors past due accounts on an ongoing basis and establishes appropriate reserves to cover probable losses. An account is considered past due on the first day after its due date. The Company makes judgments as to its ability to collect outstanding receivables and provide allowances when it is assessed that all or a portion of the receivable will not be collected. The Company determines its allowance by considering a number of factors, including the length of time accounts receivable are past due, the Company’s previous loss history, the specific customer’s ability to pay its obligation to the Company, and the condition of the general economy and the customer’s industry. The Company writes off accounts receivable when they become uncollectible.
73
Concentrations of Credit Risk and Major Customers
Concentration of credit risk, with respect to accounts receivable, is limited due to the large number of customers and their dispersion across different geographic areas. The customers are primarily concentrated in the pharmaceutical and healthcare industry. The Company normally does not require collateral or any other security to support credit sales. The Company performs ongoing credit evaluations of its customers’ financial conditions and maintains reserves for credit losses. Such losses historically have been within the Company’s expectations. During fiscal years 2015 and 2014, no single customer exceeded 10% of revenue or accounts receivable.
Inventories
Inventory is stated at the lower of cost or market, using the first-in, first-out (“FIFO”) method. The Company provides reserves for excess, obsolete or slow-moving inventory based on changes in customer demand, technology developments or other economic factors. Inventory consists of costs associated with raw material, labor and overhead.
Goodwill
The Company accounts for purchased goodwill and intangible assets with indefinite lives in accordance with ASC 350 Goodwill, Intangible and Other Assets. Under ASC 350, goodwill and intangible assets with indefinite lives are not amortized, but instead are tested for impairment at least annually. The Company’s annual goodwill impairment test was conducted as of April 1, 2015. The Company assesses goodwill for possible impairment by comparing the carrying value of its reporting units to their fair values. The Company determines the fair value of its reporting units utilizing estimated future discounted cash flows and incorporates assumptions that it believes marketplace participants would utilize. In addition, the Company uses comparative market information and other factors to corroborate the discounted cash flow results.
Property and Equipment and Other Definite Lived Intangible Assets
Property and equipment are stated at cost. Depreciation expense is computed using the straight-line method over the estimated useful lives of the assets, including capital lease assets that are amortized over the shorter of their useful lives or the terms of the respective leases. The Company generally uses the following range of useful lives for its property and equipment categories: buildings and improvements—5 to 50 years; machinery and equipment—3 to 10 years; and furniture and fixtures—3 to 7 years. Depreciation expense was $94.3 million for the fiscal year ended June 30, 2015, $100.5 million for the fiscal year ended June 30, 2014, and $108.8 million for the fiscal year ended June 30, 2013. Depreciation expense includes amortization of assets related to capital leases. The Company charges repairs and maintenance costs to expense as incurred. The amount of capitalized interest was immaterial for all periods presented.
Intangible assets with finite lives, primarily including customer relationships, patents and trademarks are amortized over their useful lives. The Company evaluates the recoverability of its other long-lived assets, including amortizing intangible assets, if circumstances indicate impairment may have occurred pursuant to ASC 360 Property, Plant and Equipment. This analysis is performed by comparing the respective carrying values of the assets to the current and expected future cash flows, on an un-discounted basis, to be generated from such assets. If such analysis indicates that the carrying value of these assets is not recoverable, the carrying value of such assets is reduced to fair value through a charge to the Consolidated Statements of Operations. Fair value is determined based on assumptions the Company believes marketplace participants would utilize and comparable marketplace information in similar arm’s length transactions. The Company recorded impairment charges related to definite lived intangible assets and property, plant and equipment, net of gains on sale, of approximately $4.7 million, $3.2 million and $5.2 million, as of June 30, 2015, June 30, 2014 and June 30, 2013 respectively.
74
Post-Retirement and Pension Plans
The Company sponsors various retirement and pension plans, including defined benefit retirement plans and defined contribution retirement plans. The measurement of the related benefit obligations and the net periodic benefit costs recorded each year are based upon actuarial computations, which require management’s judgment as to certain assumptions. These assumptions include the discount rates used in computing the present value of the benefit obligations and the net periodic benefit costs, the expected future rate of salary increases (for pay-related plans) and the expected long-term rate of return on plan assets (for funded plans). The discount rates are derived based on a hypothetical yield curve represented by a series of annualized individual discount rates. The expected long-term rate of return on plan assets is based on the target asset allocation and the average expected rate of growth for the asset classes invested. The average expected rate of growth is derived from a combination of historic returns, current market indicators, the expected risk premium for each asset class and the opinion of professional advisors. The Company uses a measurement date of June 30 for all its retirement and postretirement benefit plans.
Derivative Instruments, Hedging Activities, and Fair Value
Derivatives Instruments
The Company is exposed to certain risks arising from both its business operations and economic conditions. The Company principally manages its exposures to a wide variety of business and operational risks through management of its core business activities. The Company manages economic risks, including interest-rate, liquidity, and credit risk primarily by managing the amount, sources and duration of its debt funding and the use of derivative financial instruments. Specifically, the Company enters into derivative financial instruments to manage exposures that arise from business activities that result in the receipt or payment of future known and uncertain cash amounts, the value of which are determined by interest rates. The Company’s derivative financial instruments are used to manage differences in the amount, timing, and duration of the Company’s known or expected cash receipts and its known or expected cash payments principally related to the Company’s borrowings. The Company does not net any of its derivative positions under master netting arrangements.
Hedging Activities
The Company’s objectives in using interest-rate derivatives are to add stability to interest expense and to manage its exposure to interest-rate movements. To accomplish this objective, the Company has primarily used interest-rate swaps as part of its interest-rate risk management strategy. Interest-rate swaps designated as cash flow hedges involve the receipt of variable-rate amounts from a counterparty in exchange for the Company making fixed-rate payments over the life of the agreements without exchange of the underlying notional amount.
The effective portion of changes in the fair value of derivatives designated and that qualify as cash flow hedges for financial reporting purposes is recorded in accumulated other comprehensive income on the balance sheet and is subsequently reclassified into earnings in the period that the hedged forecasted transaction affects earnings. During the fiscal year 2013, the Company used such derivatives to hedge the variable cash flows associated with existing variable-rate debt; however, as of June 30, 2015 and June 30, 2014, the Company did not have any such derivatives in place. The ineffective portion of the change in fair value of a derivative is recognized directly in earnings.
The Company is exposed to fluctuations in the EUR-USD exchange rate on its investments in foreign operations in Europe. While the Company does not actively hedge against changes in foreign currency, it has mitigated the exposure of investments in its European operations through a net-investment hedge by denominating a portion of its debt in euros.
Fair Value
The Company is required to measure certain assets and liabilities at fair value, either upon initial measurement or for subsequent accounting or reporting. The Company uses fair value extensively in the initial measurement of net assets acquired in a business combination and when accounting for and reporting on certain financial instruments. The Company estimates fair value using an exit price approach, which requires, among other things, that it determine the price that would be received to sell an asset or paid to transfer a liability in an orderly market. The determination of an exit price is considered from the perspective of market participants, considering the highest and best use of assets and, for liabilities, assuming the risk of non-performance will be the same before and after the transfer. A single estimate of fair value results from a complex series of judgments about future events and uncertainties and relies heavily on estimates and assumptions. When estimating fair value, depending on the nature and complexity of the assets or liability, the Company may use one or all of the following approaches:
• | Market approach, which is based on market prices and other information from market transactions involving identical or comparable assets or liabilities. |
75
• | Cost approach, which is based on the cost to acquire or construct comparable assets less an allowance for functional and/or economic obsolescence. |
• | Income approach, which is based on the present value of the future stream of net cash flows. |
These fair value methodologies depend on the following types of inputs:
• | Quoted prices for identical assets or liabilities in active markets (called Level 1 inputs). |
• | Quoted prices for similar assets or liabilities in active markets or quoted prices for identical or similar assets or liabilities in markets that are directly or indirectly observable (called Level 2 inputs). |
• | Unobservable inputs that reflect estimates and assumptions (called Level 3 inputs). |
• |
Self-Insurance
The Company is partially self-insured for certain employee health benefits and partially self-insured for product liability and workers compensation claims. Accruals for losses are provided based upon claims experience and actuarial assumptions, including provisions for incurred but not reported losses.
Shipping and Handling
Shipping and handling costs are included in cost of sales in the Consolidated Statements of Operations. Shipping and handling revenue received was immaterial for all periods presented and is presented within net revenues.
Accumulated Other Comprehensive Income/(Loss)
Accumulated other comprehensive income/(loss), which is reported in the accompanying Consolidated Statements of Changes in Shareholders’ Equity, consists of net earnings/(loss), foreign currency translation, deferred compensation, minimum pension liability and unrealized gains and losses from derivatives.
Research and Development Costs
The Company expenses research and development costs as incurred. Costs incurred in connection with the development of new offerings and manufacturing process improvements are recorded within selling, general, and administrative expenses. Such research and development costs included in selling, general, and administrative expenses amounted to $12.2 million, $17.5 million and $14.5 million for fiscal years ended June 30, 2015, June 30, 2014 and June 30, 2013, respectively. Costs incurred in connection with research and development services the Company provides to customers and services performed in support of the commercial manufacturing process for customers are recorded within cost of sales. Such research and development costs included in cost of sales amounted to $41.3 million, $34.0 million and $35.0 million for fiscal years ended June 30, 2015, June 30, 2014 and June 30, 2013, respectively.
Earnings / (Loss) Per Share
The Company reports net earnings (loss) per share in accordance with ASC 260 Earnings per Share. Under ASC 260, basic earnings per share, which excludes dilution, is computed by dividing net earnings or loss available to common stockholders by the weighted average number of common shares outstanding for the period. Diluted earnings per share reflects the potential dilution of securities that could be exercised or converted into common shares, and is computed by dividing net earnings or loss available to common stockholders by the weighted average of common shares outstanding plus the dilutive potential common shares. Diluted earnings per share include in-the-money stock options, restricted stock units, and restricted stock using the treasury stock method. During a loss period, the assumed exercise of in-the-money stock options has an anti-dilutive effect and therefore, these instruments are excluded from the computation of diluted earnings per share in a loss period.
76
Income Taxes
In accordance with ASC 740 Income Taxes, the Company accounts for income taxes using the asset and liability method. The asset and liability method requires recognition of deferred tax assets and liabilities for expected future tax consequences of temporary differences that currently exist between tax bases and financial reporting bases of the Company’s assets and liabilities. Deferred tax assets and liabilities are measured using enacted tax rates in the respective jurisdictions in which the Company operates. In assessing the ability to realize deferred tax assets, the Company considers whether it is more likely than not that some portion or all of the deferred tax assets will not be realized. The calculation of the Company’s tax liabilities involves dealing with uncertainties in the application of complex tax regulations in each of its tax jurisdictions. The number of years with open tax audits varies depending on the tax jurisdiction. A number of years may lapse before a particular matter is audited and finally resolved. The Company applies ASC 740 to determine the accounting for uncertain tax positions. This guidance clarifies the accounting for income taxes, by prescribing a minimum recognition threshold a tax position is required to meet before being recognized in the financial statements and providing guidance on derecognition, measurement, classification, interest and penalties, accounting in interim periods, disclosure and transition.
Equity-Based Compensation
The Company accounts for its equity-based compensation awards in accordance with ASC 718 Compensation-Stock Compensation. Under ASC 718, companies recognize compensation expense using a fair value based method for costs related to share-based payments including stock options and restricted stock units. The expense is measured based on the grant date fair value of the awards that are expected to vest, and the expense is recorded over the applicable requisite service period. In the absence of an observable market price for a share-based award, the fair value is based upon a valuation methodology that takes into consideration various factors, including the exercise price of the award, the expected term of the award, the current price of the underlying shares, the expected volatility of the underlying share price based on peer companies, the expected dividends on the underlying shares and the risk-free interest rate.
The terms of the Company’s equity-based compensation plans permit shares that are issued upon an employee’s exercise of an option to be withheld through a net settlement transaction as a means of paying the exercise price, meeting tax withholding requirements, or both.
Recent Financial Accounting Standards
In July 2015, the Financial Accounting Standards Board (“FASB”) issued Accounting Standards Update No. 2015-11, Simplifying the Measurement of Inventory. The new standard changes the measurement principle for inventory from the lower of cost or market to lower of cost and net realizable value. The standard is effective for public entities for annual and interim periods beginning after December 15, 2016. Early adoption is permitted. Entities are required to disclose the nature and reason for the change in accounting principle in the first interim and annual period of adoption. Catalent is currently evaluating the impact of this standard on its consolidated results of operations and financial position.
In April 2015, the FASB issued Accounting Standards Update No. 2015-03, Simplifying the Presentation of Debt Issuance Costs. The new standard requires that debt issuance costs be presented in the balance sheet as a direct reduction from the carrying value of the associated debt liability, consistent with the presentation of a debt discount. The standard is effective for public entities for annual and interim periods beginning after December 15, 2015. Early adoption is permitted for financial statements that have not been previously issued. The new guidance will be applied on a retrospective basis. Catalent is currently evaluating the impact of this standard on its consolidated results of operations and financial position.
In June 2014, the FASB issued Accounting Standard Update No. 2014-12 Accounting for Share Based Payments When the Terms of an Award Provide That a Performance Target Could be Achieved after the Requisite Service Period. The new standard provides guidance for accounting for share-based payments when the terms of an award provide that a performance target could be achieved after the requisite service period. The standard states that a performance target in a share-based payment that affects vesting and that could be achieved after the requisite service period should be accounted for as a performance condition. As such, the performance target should not be reflected in estimating the grant-date fair value of the award. The standard is effective for annual periods beginning after December 15, 2015. Catalent does not expect a material impact on its consolidated results of operations and financial position upon adoption.
In May 2014, the FASB issued Accounting Standards Update No. 2014-09, Revenue from Contracts with Customers. The new standard will supersede nearly all existing revenue recognition guidance. The standard’s core principle is that a company will recognize revenue when it transfers promised goods or services to customers in an amount that reflects the consideration to which the company expects to be entitled in exchange for those goods or services. In doing so, the standard creates a five-step model that requires a company to exercise judgment when considering the terms of the contracts and all relevant facts and circumstances. The
77
five steps require a company to identify customer contracts, identify the separate performance obligations, determine the transaction price, allocate the transaction price to the separate performance obligations and recognize revenue when each performance obligation is satisfied. On July 9, 2015, the FASB approved a one-year deferral of the effective date so that the standard is effective for public entities for annual and interim periods beginning after December 15, 2017. The standard allows for either full retrospective adoption, where the standard is applied to all periods presented, or modified retrospective adoption where the standard is applied only to the most current period presented in the financial statements. Early adoption is permitted. Catalent is currently evaluating the impact of this standard on its consolidated results of operations and financial position.
In April 2014, the FASB issued Accounting Standards Update No. 2014-08, Reporting Discontinued Operations and Disclosures of Disposals of an Entity (“ASU 2014-08”). ASU 2014-08 changes the requirements for reporting discontinued operations under ASC Subtopic 250-20 by limiting discontinued operations reporting to disposals of components of an entity that represent strategic shifts that have (or will have) a major effect on an entity’s operations and financial results. The disclosure requirements for discontinued operations under ASU 2014-08 will be expanded in order to provide users of financial statements with more information about the assets, liabilities, revenues and expenses of discontinued operations. ASU 2014-08 is effective on a prospective basis for (1) all disposals (or classifications as held for sale) of components of an entity that occur within annual periods beginning on or after December 15, 2014, and interim periods within those years, and (2) all businesses that are classified as held for sale on acquisition that occur within annual periods beginning on or after December 15, 2014 and interim periods within those years. Catalent does not expect a material impact on its consolidated results of operations and financial position upon adoption.
In March 2013, the FASB issued Accounting Standards Update No. 2013-05 Parent’s Accounting for the Cumulative Translation Adjustment upon Derecognition of Certain Subsidiaries or Groups of Assets within a Foreign Entity or of an Investment in a Foreign Entity. The new standard resolves the diversity in practice concerning the release of the cumulative translation adjustment into net income when a parent either sells a part or all of its investment in a foreign entity or no longer holds a controlling financial interest in a subsidiary or group of assets within a foreign entity. The guidance is effective for fiscal years and interim reporting periods within those fiscal years beginning after December 15, 2013. The guidance applies prospectively to derecognition events occurring after the effective date; prior periods are not to be adjusted. Adoption did not have a material impact on the disclosures included in the Company’s consolidated financial statements.
In February 2013, the FASB issued Accounting Standards Update No. 2013-04 Obligations Resulting from Joint and Several Liability Arrangements (“ASU 2013-04”). ASU 2013-04 provides guidance for the recognition, measurement, and disclosure resulting from joint and several liability arrangements. Examples of obligations that fall within the scope of the guidance include certain debt arrangements, other contractual obligations, and settled litigation. The new guidance is effective on a retrospective basis for fiscal years and interim periods within those fiscal years beginning after December 15, 2013. Adoption did not have a material impact on the disclosures included in the Company’s consolidated financial statements.
2. | BUSINESS COMBINATIONS |
During the twelve months ended June 30, 2015, the Company completed acquisitions which were immaterial, individually and in the aggregate, to the overall consolidated financial position and results of operations of the Company. Notably, in October 2014, the Company acquired the remaining shares of Redwood Bioscience Inc. and its SMARTag Antibody-Drug Conjugate (ADC) technology platform. The acquired business is based in the U.S. and is included in the Medication Delivery Solutions segment. Additionally, in November 2014, the Company acquired 100% of the shares of MTI Pharma Solutions, Inc. (Micron Technologies), a company specializing in particle size reduction (micronization), milling and analytical contract services. The acquired business is based in the U.S. and the U.K. and is included in the Development and Clinical Services segment.
The Company’s consolidated balance sheet as of June 30, 2015 includes the fair value allocation for these acquisitions which was completed in the fiscal year. Aggregate purchase consideration for both acquisitions totaled $110.8 million. As a result of the preliminary fair value allocation, the Company recognized intangible assets of $56 million, comprised of $34 million of Customer Relationships and $22 million of Core Technology. The remainder of fair value was allocated to tangible assets acquired and goodwill.
3. | GOODWILL |
The following table summarizes the changes between June 30, 2015 and June 30, 2014 in the carrying amount of goodwill in total and by reporting segment:
78
(Dollars in millions) | Oral Technologies | Medication Delivery Solutions | Development & Clinical Services | Total | |||||||||||
Balance at June 30, 2013 (1) | $ | 833.2 | $ | — | $ | 190.2 | $ | 1,023.4 | |||||||
Additions/(impairments) | 32.6 | — | — | 32.6 | |||||||||||
Foreign currency translation adjustments | 26.0 | — | 15.1 | 41.1 | |||||||||||
Balance at June 30, 2014 | 891.8 | — | 205.3 | 1,097.1 | |||||||||||
Additions/(impairments) | 2.1 | 19.9 | 39.0 | 61.0 | |||||||||||
Foreign currency translation adjustments | (81.9 | ) | — | (14.7 | ) | (96.6 | ) | ||||||||
Balance at June 30, 2015 | $ | 812.0 | $ | 19.9 | $ | 229.6 | $ | 1,061.5 | |||||||
(1) | The opening balance is reflective of impairment charges recorded in fiscal 2008 and fiscal 2009 related to the Medication Delivery Solutions segment of approximately $158.0 million. |
No goodwill impairment charges were required during the current or comparable prior year period. When required, impairment charges are recorded within the consolidated statements of operations as impairment charges and (gain)/loss on sale of assets.
4. | DEFINITE-LIVED LONG-LIVED ASSETS |
The Company’s definite-lived long-lived assets include property, plant and equipment as well as other intangible assets with definite lives. Refer to Note 18 Supplemental Balance Sheet Information for details related to property, plant and equipment.
The details of other intangible assets subject to amortization as of June 30, 2015 and June 30, 2014, are as follows:
(Dollars in millions) | Weighted Average Life | Gross Carrying Value | Accumulated Amortization | Net Carrying Value | |||||||||
June 30, 2015 | |||||||||||||
Amortized intangibles: | |||||||||||||
Core technology | 18 years | $ | 177.6 | $ | (57.6 | ) | $ | 120.0 | |||||
Customer relationships | 14 years | 259.2 | (81.8 | ) | 177.4 | ||||||||
Product relationships | 12 years | 222.9 | (151.6 | ) | 71.3 | ||||||||
Total intangible assets | $ | 659.7 | $ | (291.0 | ) | $ | 368.7 | ||||||
(Dollars in millions) | Weighted Average Life | Gross Carrying Value | Accumulated Amortization | Net Carrying Value | |||||||||
June 30, 2014 | |||||||||||||
Amortized intangibles: | |||||||||||||
Core technology | 20 years | $ | 150.2 | $ | (53.3 | ) | $ | 96.9 | |||||
Customer relationships | 14 years | 234.6 | (68.0 | ) | 166.6 | ||||||||
Product relationships | 12 years | 237.6 | (143.5 | ) | 94.1 | ||||||||
Total intangible assets | $ | 622.4 | $ | (264.8 | ) | $ | 357.6 | ||||||
Amortization expense was $46.5 million, $42.4 million, and $43.4 million for the fiscal year ended June 30, 2015, June 30, 2014, and June 30, 2013, respectively. Future amortization expense for the next five years is estimated to be:
(Dollars in millions) | 2016 | 2017 | 2018 | 2019 | 2020 | ||||||||||||||
Amortization expense | $ | 47.6 | $ | 46.9 | $ | 46.8 | $ | 40.8 | $ | 26.1 | |||||||||
79
The Company impaired definite lived intangible assets of $3.4 million in the fiscal year ended June 30, 2015. There was no intangible asset impairment in the fiscal years ended June 30, 2014 and June 30, 2013, respectively.
5. | RESTRUCTURING AND OTHER COSTS |
The Company has implemented plans to restructure certain operations, both domestically and internationally. The restructuring plans focused on various aspects of operations, including closing and consolidating certain manufacturing operations, rationalizing headcount and aligning operations in a strategic and more cost-efficient structure. In addition, the Company may incur restructuring charges in the future in cases where a material change in the scope of operation with its business occurs.
The following table summarizes the significant costs recorded within restructuring costs:
Year ended June 30, | |||||||||||
(Dollars in millions) | 2015 | 2014 | 2013 | ||||||||
Restructuring costs: | |||||||||||
Employee-related reorganization (1) | $ | 11.5 | $ | 16.5 | $ | 15.1 | |||||
Asset impairments | — | — | 0.7 | ||||||||
Facility exit and other costs (2) | 1.9 | 3.2 | 2.6 | ||||||||
Total restructuring costs | $ | 13.4 | $ | 19.7 | $ | 18.4 | |||||
(1) | Employee-related costs consist primarily of severance costs and also include outplacement services provided to employees who have been involuntarily terminated and duplicate payroll costs during transition periods. |
(2) | Facility exit and other costs consist of accelerated depreciation, equipment relocation costs and costs associated with planned facility expansions and closures to streamline Company operations. |
6. | LONG-TERM OBLIGATIONS AND OTHER SHORT-TERM BORROWINGS |
Long-term obligations and other short-term borrowings consist of the following at June 30, 2015 and June 30, 2014:
(Dollars in millions) | Maturity | June 30, 2015 | June 30, 2014 | ||||||
Senior Secured Credit Facilities | |||||||||
Term loan facility dollar-denominated | May 2021 | $ | 1,471.0 | $ | 1,383.9 | ||||
Term loan facility euro-denominated | May 2021 | 355.8 | 338.6 | ||||||
9 3/4 % Senior Subordinated euro-denominated Notes | April 2017 | — | 293.9 | ||||||
7 7/8 % Senior Notes | October 2018 | — | 348.7 | ||||||
Senior Unsecured Term Loan Facility | December 2017 | — | 274.3 | ||||||
$200 million Revolving Credit Facility | May 2019 | — | — | ||||||
Capital lease obligations | 2020 to 2032 | 55.5 | 64.0 | ||||||
Other obligations | 2016 to 2018 | 5.6 | 7.2 | ||||||
Total | 1,887.9 | 2,710.6 | |||||||
Less: Current portion of long-term obligations and other short-term borrowings | 23.8 | 25.2 | |||||||
Long-term obligations, less current portion | $ | 1,864.1 | $ | 2,685.4 | |||||
Senior Secured Credit Facilities
On May 20, 2014, the Operating Company entered into the Amended and Restated Credit Agreement to provide senior secured financing consisting of a seven-year $1,400.0 million dollar term loan (the “Dollar Term Loan”), a seven-year €250.0 million euro term loan (the “Euro Term Loan”) and a five-year $200.0 million revolving credit facility (the "revolving credit facility"), the proceeds of which were used to prepay in full all outstanding Refinancing Dollar Term-1 Loans, Refinancing Dollar Term-2 Loans and Extended Euro Term Loans. The revolving credit facility includes borrowing capacity available for letters of credit and for short-term borrowings, referred to as the swing line borrowings. Borrowings under the term loan facilities and the revolving credit facility bear interest, at the Company’s option, at a rate equal to a margin over either (a) a base rate determined by reference to the higher of (1) the rate of interest published by The Wall Street Journal as its “prime lending rate” and (2) the federal funds rate plus one half of 1% or (b) a LIBOR rate determined by reference to the London
80
Interbank Offered Rate set by ICE Benchmark Administration (or any successor thereto). The applicable margin for the term loans and borrowings under the revolving credit facility may be reduced subject to the Company attaining a certain total net leverage ratio. The applicable margin for borrowings is 3.50% for loans based on a LIBOR rate and 2.50% for loans based on base rate. The LIBOR rate for term loans is subject to a floor of 1.00% and the base rate for term loans is subject to a floor of 2.00%. Cash paid associated with this financing activity approximated $23.9 million. The Company expensed $7.2 million of unamortized deferred finance costs and debt discounts.
On December 1, 2014, the Operating Company entered into Amendment No. 1 to the Amended and Restated Credit Agreement (as amended, the "Credit Agreement") to provide additional senior secured financing of incremental dollar- and euro- denominated term loan facilities of $100 million and €72.8 million ($91 million), respectively. The incremental term loans have substantially similar terms as Catalent’s existing term loan facilities. The proceeds of the borrowing were primarily used to pay the remaining $40.5 million outstanding on the unsecured term loans, fund acquisitions completed in the second quarter of $111.6 million and general corporate purposes. The Company incurred approximately $2.8 million in financing costs, of which $1.2 million was recorded in other (income) / expense, net in the consolidated statement of operations.
As of June 30, 2015, there were $11.7 million in outstanding letters of credit that reduced the borrowing capacity under the approximately $200 million revolving line of credit.
Redemption of Notes and Unsecured Term Loan Prepayment
In July 2014, the Company provided notice of its election to redeem the entire $350.0 million aggregate principal amount outstanding of 7.875% senior notes due 2018 and redeemed them in August 2014 at a redemption price of 101.5% of their principal amount plus accrued and unpaid interest. The redemption was funded with proceeds from the IPO. In connection with the redemption the Company recorded $5.3 million in expense related to the call premium and expensed $5.9 million of unamortized debt discount and deferred financing costs, both in other (income) / expense, net in the consolidated statements of operations.
In August 2014, the Company provided notice of its election to redeem the entire €225.0 million aggregate principal amount outstanding of 9.75% senior subordinated notes due 2017 and redeemed them in September 2014 at a redemption price of 101.625% of their principal amount plus accrued and unpaid interest. The redemption was funded with proceeds from the IPO. In connection with the redemption the Company recorded $4.5 million in expense related to the call premium and expensed $4.0 million of unamortized debt discount and deferred financing costs, both in other (income) / expense, net in the consolidated statements of operations.
In August 2014, the Company repaid $114.5 million of the outstanding borrowings under the unsecured term loans with proceeds from the IPO. In September 2014, the Company repaid $120.0 million of the outstanding borrowings under the unsecured term loans with proceeds from the additional shares purchased by the representatives of the underwriters in connection with the IPO. In connection with the debt payments, the Company expensed $0.9 million of unamortized debt discount and deferred financing costs in other (income) / expense, net in the consolidated statements of operations. In December 2014, the Company paid the remaining $40.5 million outstanding on the unsecured term loans with proceeds from the incremental senior secured term loans.
Long-Term and Other Obligations
Other obligations consist primarily of capital leases for buildings and other loans for business and working capital needs.
Maturities of long-term obligations, including capital leases of $55.5 million, and other short-term borrowings for future fiscal years are:
(Dollars in millions) | 2016 | 2017 | 2018 | 2019 | 2020 | Thereafter | Total | |||||||||
Maturities of long-term and other obligations | $ | 24.3 | 22.9 | 21.1 | 21.4 | 21.7 | 1,793.0 | $ | 1,904.4 | |||||||
Debt Issuance Costs
Debt issuance costs are capitalized within prepaid expenses and other assets on the balance sheet and amortized over the life of the related obligation through charges to interest expense in the Consolidated Statements of Operations. The unamortized total of debt issuance costs were approximately $9.5 million and $19.7 million as of June 30, 2015 and June 30, 2014, respectively. Amortization of debt issuance costs, excluding amounts expensed as part of the current year financing activity, totaled $2.2 million and $10.2 million for the fiscal years ended June 30, 2015 and June 30, 2014, respectively.
81
Guarantees and Security
All obligations under the Senior Secured Credit Facilities, and the guarantees of those obligations, are secured by substantially all of the following assets of the Operating Company and each guarantor, subject to certain exceptions:
• | a pledge of 100% of the capital stock of the borrower and 100% of the equity interests directly held by the borrower and each guarantor in any wholly owned material subsidiary of the borrower or any guarantor (which pledge, in the case of any non-U.S. subsidiary of a U.S. subsidiary, will not include more than 65% of the voting stock of such non-U.S. subsidiary); and |
• | a security interest in, and mortgages on, substantially all tangible and intangible assets of the borrower and of each guarantor, subject to certain limited exceptions. |
Debt Covenants
The Credit Agreement contains a number of covenants that, among other things, restrict, subject to certain exceptions, the Company’s (and the Company’s restricted subsidiaries’) ability to incur additional indebtedness or issue certain preferred shares; create liens on assets; engage in mergers and consolidations; sell assets; pay dividends and distributions or repurchase capital stock; engage in certain transactions with affiliates; make investments, loans or advances; make certain acquisitions; enter into sale and leaseback transactions and change its lines of business.
The Credit Agreement also contains change of control provisions and certain customary affirmative covenants and events of default. The revolving credit facility requires compliance with a net leverage covenant when there is a 30% or more draw outstanding at a period end. As of June 30, 2015, the Company was in compliance with all material covenants related to its long-term obligations.
Subject to certain exceptions, the Credit Agreement permits the Company and its restricted subsidiaries to incur certain additional indebtedness, including secured indebtedness. None of the Company’s non-U.S. subsidiaries or Puerto Rico subsidiaries is a guarantor of the loans.
Under the Credit Agreement, the Company’s ability to engage in certain activities such as incurring certain additional indebtedness, making certain investments and paying certain dividends is tied to ratios based on Adjusted EBITDA (which is defined as “Consolidated EBITDA” in the Credit Agreement). Adjusted EBITDA is based on the definitions in the Credit Agreement and is not defined under U.S. GAAP, and is subject to important limitations.
Fair Value of Debt Measurements
The estimated fair value of the long-term debt, which is considered a Level 2 liability, is based on the quoted market prices for the same or similar issues or on the current rates offered for debt of the same remaining maturities and considers collateral, if any. The carrying amounts and the estimated fair values of financial instruments as of June 30, 2015 and June 30, 2014 are as follows:
June 30, 2015 | June 30, 2014 | ||||||||||||||
(Dollars in millions) | Carrying Value | Estimated Fair Value | Carrying Value | Estimated Fair Value | |||||||||||
Long-term debt and other | $ | 1,887.9 | $ | 1,854.7 | $ | 2,710.6 | $ | 2,680.2 | |||||||
82
7. | EARNINGS PER SHARE |
The reconciliations between basic and diluted earnings per share attributable to Catalent common shareholders for the fiscal years ended June 30, 2015, 2014 and 2013 are as follows (in millions, except per share data):
Year ended June 30, | |||||||||||
2015 | 2014 | 2013 | |||||||||
Earnings / (loss) from continuing operations less net income / (loss) attributable to noncontrolling interest | $ | 212.1 | $ | 18.9 | $ | (50.8 | ) | ||||
Earnings / (loss) from discontinued operations | 0.1 | (2.7 | ) | 1.2 | |||||||
Net earnings / (loss) attributable to Catalent | $ | 212.2 | $ | 16.2 | $ | (49.6 | ) | ||||
Weighted average shares outstanding | 119,575,568 | 75,045,147 | 74,970,628 | ||||||||
Dilutive securities issuable-stock plans | 1,773,068 | 1,078,710 | — | ||||||||
Total weighted average diluted shares outstanding | 121,348,636 | 76,123,857 | 74,970,628 | ||||||||
Basic earnings per share of common stock: | |||||||||||
Earnings / (loss) from continuing operations | $ | 1.77 | $ | 0.25 | $ | (0.68 | ) | ||||
Earnings / (loss) from discontinued operations | — | (0.03 | ) | 0.02 | |||||||
Net earnings / (loss) attributable to Catalent | $ | 1.77 | $ | 0.22 | $ | (0.66 | ) | ||||
Diluted earnings per share of common stock-assuming dilution: | |||||||||||
Earnings / (loss) from continuing operations | $ | 1.75 | $ | 0.25 | $ | (0.68 | ) | ||||
Earnings / (loss) from discontinued operations | — | (0.04 | ) | 0.02 | |||||||
Net earnings / (loss) attributable to Catalent | $ | 1.75 | $ | 0.21 | $ | (0.66 | ) | ||||
The computation of diluted earnings per share for June 30, 2015 and 2014 excludes the effect of potential shares issuable under the Company's pre-IPO employee stock option plan of 2.1 million and 2.3 million options, respectively, because the vesting provisions of those awards specify performance or market-based conditions that had not been met as of the period end. The computation of diluted earnings per share for June 30, 2013 excludes the effect of the potential common shares issuable under the employee stock option plan of approximately 6.5 million shares, and excludes restricted share awards of 0.3 million, because the Company had a net loss for the year and the effect would therefore be anti-dilutive.
8. | DERIVATIVE INSTRUMENTS AND HEDGING ACTIVITIES |
Risk Management Objective of Using Derivatives
The Company is exposed to fluctuations in the applicable exchange rate on its investments in foreign operations. While the Company does not actively hedge against changes in foreign currency, the Company has mitigated the exposure of its investments in its European operations by denominating a portion of its debt in euros. At June 30, 2015, the Company had euro-denominated debt outstanding of $355.8 million that qualifies as a hedge of a net investment in foreign operations. For non-derivatives designated and qualifying as net investment hedges, the effective portion of the translation gains or losses are reported in accumulated other comprehensive income/(loss) as part of the cumulative translation adjustment. The ineffective portions of the translation gains or losses are reported in the statement of operations. The following table includes net investment hedge activity during fiscal year ended June 30, 2015 and June 30, 2014:
(Dollars in millions) | June 30, 2015 | June 30, 2014 | |||||
Unrealized foreign exchange gain/(loss) within other comprehensive income | $ | 30.0 | $ | (13.6 | ) | ||
Unrealized foreign exchange gain/(loss) within statement of operations | $ | 47.7 | $ | (9.6 | ) | ||
83
The net accumulated gain of this net investment as of June 30, 2015 within other comprehensive income/(loss) was approximately $79.5 million. Amounts are reclassified out of accumulated other comprehensive income/(loss) into earnings when the entity to which the gains and losses reside is either sold or substantially liquidated.
Cash Flow Hedges of Interest Rate Risk
During fiscal 2013, the Company’s two U.S. dollar-denominated and one euro-denominated interest-rate swap agreements, which were designated as effective cash flow hedges for financial reporting purposes, matured. Its Japanese yen interest-rate swap, effective as an economic hedge but not designated as effective for financial reporting purposes also matured during fiscal 2013. As of June 30, 2015, the Company did not have any interest-rate swap agreements in place that would have the economic effect of modifying the variable interest obligations associated with our floating rate term loans.
On February 28, 2013, in connection with the refinancing of the Company’s €44.9 million term loan, Catalent de-designated €35.0 million of the €240.0 million notional Euribor-based interest-rate swap. Prior to de-designation, the effective portion of the change in fair value of the derivative was recorded as a component of other comprehensive income/(loss). The other comprehensive income/(loss) balance associated with the de-designated portion of the derivative was reclassified to earnings when the originally hedged forecasted interest payments on the hedged debt affected earnings. The amount of losses reclassified into earnings as a result of the discontinuance of a portion of the Euribor-based interest-rate swap as a cash flow hedge for the fiscal year ended June 30, 2013 was $0.1 million.
The table below presents the fair value of the Company’s derivative financial instruments as well as their classification on the Consolidated Statement of Operations for the fiscal years ended June 30, 2015, June 30, 2014 and June 30, 2013,
(Dollars in millions) | The Effect of Derivative Instruments on the Consolidated Statement of Operations for the | ||||||||||
Fiscal Years Ended June 30, 2015, June 30, 2014 and June 30, 2013 | |||||||||||
Derivatives in ASC 815 Cash Flow Hedging Relationships | Amount of (Gain) or Loss Recognized in OCI on Derivative (Effective Portion) | Location of (Gain) or Loss Reclassified from Accumulated OCI into Income (Effective Portion) | Amount of (Gain) or Loss Reclassified from Accumulated OCI into Income (Effective Portion) | Location of (Gain) or Loss Recognized in Income on Derivative (Ineffective Portion and Amount excluded from Effectiveness Testing) | Amount of (Gain) or Loss Recognized in Income on Derivative (Ineffective Portion and Amount excluded from Effectiveness Testing) | ||||||
Fiscal Year 2015: | |||||||||||
Interest Rate Swaps | $ | — | Interest expense, net | $ | — | Other (income)/expense, net | $ | — | |||
Fiscal Year 2014: | |||||||||||
Interest Rate Swaps | $ | — | Interest expense, net | $ | — | Other (income)/expense, net | $ | — | |||
Fiscal Year 2013: | |||||||||||
Interest Rate Swaps | $ | 1.1 | Interest income/ (expense), net | $ | 21.6 | Other (income)/expense, net | $ | 0.1 | |||
9. | INCOME TAXES |
Earnings/(loss) from continuing operations before income taxes and discontinued operations are as follows for the fiscal years ended 2015, 2014, and 2013:
Fiscal Year Ended June 30, | |||||||||||
(Dollars in millions) | 2015 | 2014 | 2013 | ||||||||
U.S. Operations | $ | 25.8 | $ | (75.6 | ) | $ | (124.9 | ) | |||
Non-U.S. Operation | $ | 86.7 | $ | 143.0 | $ | 101.0 | |||||
$ | 112.5 | $ | 67.4 | $ | (23.9 | ) | |||||
84
The provision /(benefit) for income taxes consists of the following for the fiscal years ended 2015, 2014, and 2013:
Fiscal Year Ended June 30, | |||||||||||
(Dollars in millions) | 2015 | 2014 | 2013 | ||||||||
Current: | |||||||||||
Federal | $ | — | $ | — | $ | (0.4 | ) | ||||
State and local | (0.8 | ) | (1.2 | ) | (2.4 | ) | |||||
Non-U.S. | 31.9 | 55.7 | 21.2 | ||||||||
Total | $ | 31.1 | $ | 54.5 | $ | 18.4 | |||||
Deferred: | |||||||||||
Federal | $ | (125.3 | ) | $ | 5.3 | $ | 8.8 | ||||
State and local | (1.1 | ) | 0.4 | (0.3 | ) | ||||||
Non-U.S. | (2.4 | ) | (10.7 | ) | 0.1 | ||||||
Total | (128.8 | ) | (5.0 | ) | 8.6 | ||||||
Total provision/(benefit) | $ | (97.7 | ) | $ | 49.5 | $ | 27.0 | ||||
A reconciliation of the provision/(benefit) based on the federal statutory income tax rate to the Company’s effective income tax rate is as follows for the fiscal years ended 2015, 2014, and 2013:
Fiscal Year Ended June 30, | |||||||||||
(Dollars in millions) | 2015 | 2014 | 2013 | ||||||||
Provision at U.S. federal statutory tax rate | $ | 39.4 | $ | 23.6 | $ | (8.4 | ) | ||||
State and local income taxes | (2.4 | ) | 0.6 | 0.6 | |||||||
Foreign tax rate differential | (23.9 | ) | (25.5 | ) | (15.1 | ) | |||||
Permanent items | 1.7 | 24.6 | 52.6 | ||||||||
Unrecognized tax positions | 14.7 | 34.2 | — | ||||||||
Tax valuation allowance | (133.2 | ) | (9.5 | ) | 3.8 | ||||||
Foreign tax credit - Non U.S. | (0.1 | ) | (0.8 | ) | (3.3 | ) | |||||
Withholding tax and other foreign taxes | 1.4 | 6.2 | 4.7 | ||||||||
Change in tax rate | 1.3 | (5.0 | ) | (4.6 | ) | ||||||
Tax effect of OCI deferred taxes - U.S. | — | — | 2.9 | ||||||||
Foreign currency impact on permanently reinvested loans | 2.7 | — | — | ||||||||
Other | 0.7 | 1.1 | (6.2 | ) | |||||||
$ | (97.7 | ) | $ | 49.5 | $ | 27.0 | |||||
The income tax benefit for the current period is not comparable to the same period of the prior year due to changes in pretax income over many jurisdictions and the impact of discrete items. Generally, fluctuations in the effective tax rate are primarily due to changes in the geographic mix of pretax income and changes in the tax impact of permanent differences, restructuring, other special items and other discrete tax items, which may have unique tax implications depending on the nature of the item. The effective tax rate at June 30, 2015 reflects the release of the U.S. federal valuation allowance and an increase in a tax reserve related to an adjustment to inter-company interest income in Germany, partially offset by a corresponding deduction in the United Kingdom due to enacted tax rate changes.
As of June 30, 2015, the Company had $412.5 million of undistributed earnings from non-U.S. subsidiaries that are intended to be permanently reinvested in non-U.S. operations. As these earnings are considered permanently reinvested, no U.S. tax provision has been accrued related to the repatriation of these earnings. It is not feasible to estimate the amount of U.S. tax that might be payable on the eventual remittance of such earnings.
85
Deferred income taxes arise from temporary differences between financial reporting and tax reporting bases of assets and liabilities, and operating loss and tax credit carryforwards for tax purposes. The components of the deferred income tax assets and liabilities are as follows at June 30, 2015 and 2014:
Fiscal Year Ended June 30, | |||||||
(Dollars in millions) | 2015 | 2014 | |||||
Deferred income tax assets: | |||||||
Accrued liabilities | $ | 24.0 | $ | 25.1 | |||
Equity compensation | 8.4 | 10.0 | |||||
Loss and tax credit carryforwards | 204.0 | 196.2 | |||||
Foreign currency | 18.4 | 23.2 | |||||
Pension | 38.8 | 50.6 | |||||
Property-related | 9.7 | 11.8 | |||||
Intangibles | 10.5 | 16.3 | |||||
Other | 17.1 | 16.9 | |||||
Other comprehensive income | 4.1 | 4.0 | |||||
Total deferred income tax assets | 335.0 | 354.1 | |||||
Valuation allowance | (82.4 | ) | (218.2 | ) | |||
Net deferred income tax assets | $ | 252.6 | $ | 135.9 | |||
Fiscal Year Ended June 30, | |||||||
(Dollars in millions) | 2015 | 2014 | |||||
Deferred income tax liabilities: | |||||||
Accrued liabilities | (0.6 | ) | (0.2 | ) | |||
Equity compensation | — | — | |||||
Foreign currency | (0.4 | ) | (0.1 | ) | |||
Property-related | (44.5 | ) | (15.1 | ) | |||
Goodwill and other intangibles | (156.1 | ) | (164.7 | ) | |||
Other | (1.8 | ) | (1.2 | ) | |||
Other comprehensive income | (23.2 | ) | (19.8 | ) | |||
Total deferred income tax liabilities | $ | (226.6 | ) | (201.1 | ) | ||
Net deferred tax asset/(liability) | $ | 26.0 | $ | (65.2 | ) | ||
Deferred tax assets and liabilities in the preceding table are in the following captions in the balance sheet at June 30, 2015 and 2014:
Fiscal Year Ended June 30, | |||||||
(Dollars in millions) | 2015 | 2014 | |||||
Current deferred tax asset | $ | 19.7 | $ | 12.7 | |||
Non-current deferred tax asset | 64.1 | 26.3 | |||||
Current deferred tax liability | 1.5 | 1.0 | |||||
Non-current deferred tax liability | 56.3 | 103.2 | |||||
Net deferred tax asset/(liability) | $ | 26.0 | $ | (65.2 | ) | ||
At June 30, 2015, the Company has federal net operating loss carryforwards of $344.6 million, all of which are subject to Internal Revenue Code Section 382 limitations; $13.2 million, because they were generated in years prior to April 10, 2007,
86
when the Company was owned by Cardinal, and the remainder due to a change in ownership event when Blackstone, Genstar Capital, and Aisling Capital completed a secondary offering of the Company’s stock in March 2015. The federal loss carryforwards will expire in fiscal years 2022 through 2033. At June 30, 2015, the Company has state tax loss carryforwards of $483.8 million. Approximately $181.5 million of these losses are state tax losses generated in periods prior to the period ending June 30, 2007. Substantially all state carryforwards have a twenty year carryforward period. In accordance with ASC 718, $56.8 million of federal and state losses were generated in the current and prior tax years as a result of tax deductions for equity. Such deductions are not being recognized for financial statement purposes because a cash tax benefit was not realized by the Company, as determined using a with-and-without approach as described in ASC 740-20. As a result, these deductions are not reflected in the federal and state net operating loss carryforward amounts indicated above. At June 30, 2015, the Company has international tax loss carryforwards of $101.8 million. Substantially all of these carryforwards are available for at least three years or have an indefinite carryforward period.
The Company had valuation allowances of $82.4 million and $218.2 million as of June 30, 2015 and 2014, respectively, against our deferred tax assets.
The Company considered all available evidence, both positive and negative, in assessing the need for a valuation allowance for deferred tax assets. Three possible sources of taxable income were evaluated when assessing the realization of deferred tax assets:
• | Future reversals of existing taxable temporary differences; |
• | Tax planning strategies; and |
• | Future taxable income exclusive of reversing temporary differences and carryforwards. |
The Company considered the need to maintain a valuation allowance on deferred tax assets based on management’s assessment of whether it is more likely than not that deferred tax assets would be realized based on future reversals of existing taxable temporary differences and the ability to generate sufficient taxable income within the carryforward period available under the applicable tax law. The deferred tax liabilities are expected to reverse in the same period and jurisdiction and are of the same character as the temporary differences giving rise to a portion of the deferred tax assets.
During the current period, the Company released the majority of its U.S. federal valuation allowance of $136.7 million based on projected U.S. future earnings in excess of the $294.1 million required to realize its net U.S. federal deferred tax assets. Of the $294.1 million, $329.5 million relates to the federal net operating loss carryforward (NOL) which expires in the years 2028 to 2032. The remaining $35.4 million relates to other net deferred tax liabilities. A valuation allowance of $10.4 million was retained on U.S. federal deferred tax assets for capital losses.
The reversal of the valuation allowance was the result of a continuing trend of U.S. taxable income and the expectation that this trend will continue, rather than relying on tax planning strategies to support the realization of deferred tax assets. We have experienced three consecutive years of positive U.S. taxable earnings as of the current quarter and expect to sustain this position in the future, due to the positive impact on U.S. earnings from reduced interest expense resulting from a reduction in our external debt, among other factors.
While the U.S. federal valuation allowance was reversed, the U.S. state valuation allowance on $483.8 million of pre-apportioned state net operating losses were maintained. Due to uncertainty around earnings, apportionment, certain restrictions at the state level, and the history of tax losses, anticipated utilization rates were not sufficient to overcome the negative evidence and allow a release.
As part of the 2007 acquisition from Cardinal, the Company has been indemnified by Cardinal for tax liabilities that may arise in the future that relate to tax periods prior to April 10, 2007 (the “Formation Date”). The indemnification agreement includes, among other taxes, any and all Federal, state and international income based taxes as well as any interest and penalties that may be related thereto.
Similarly, as part of the 2012 purchase of the CTS business from Aptuit, Inc., the Company has been indemnified by Aptuit, Inc. for tax liabilities that may arise in the future that relate to tax periods prior to February 17, 2012. The indemnification agreement includes, among other taxes, any and all Federal, state and international income based taxes as well as any interest and penalties that may be related thereto.
Additionally, as part of the 2015 purchase of the Micron Technologies businesses, the Company has been indemnified for tax liabilities that may arise in the future that relate to tax periods prior to the acquisition, on November 3, 2014. The indemnification agreement includes, among other taxes, any and all Federal, state and international income-based taxes as well as any interest and penalties that may be related thereto.
87
The amount of income taxes the Company may pay is subject to ongoing audits by federal, state and foreign tax authorities, which may result in proposed assessments. The Company’s estimate for the potential outcome for any uncertain tax issue is highly judgmental. The Company assesses its income tax positions and record benefits for all years subject to examination based upon management’s evaluation of the facts, circumstances and information available at the reporting date. For those tax positions for which it is more likely than not that a tax benefit will be sustained, the Company records the amount that has a greater than 50% likelihood of being realized upon settlement with a taxing authority that has full knowledge of all relevant information. Interest and penalties are accrued, where applicable.
ASC 740 includes guidance on the accounting for uncertainty in income taxes recognized in the financial statements. This standard also provides that a tax benefit from an uncertain tax position may be recognized when it is more likely than not that the position will be sustained upon examination, including resolutions of any related appeals or litigation processes, based on the technical merits. As of June 30, 2015, the Company had a total of $66.9 million of unrecognized tax benefits. A reconciliation of our unrecognized tax benefit, excluding accrued interest for June 30, 2015, June 30, 2014 and June 30, 2013 are as follows:
(Dollars in millions) | |||
Balance at June 30, 2013 | $ | 37.7 | |
Additions based on tax positions related to the current year | 7.5 | ||
Additions for tax positions of prior years | 25.1 | ||
Reductions for tax positions of prior years | (4.8 | ) | |
Settlements | $ | (4.9 | ) |
Balance at June 30, 2014 | $ | 60.6 | |
Additions based on tax positions related to the current year | 7.3 | ||
Additions for tax positions of prior years | 5.5 | ||
Reductions for tax positions of prior years | (5.4 | ) | |
Settlements | (0.5 | ) | |
Lapse of the applicable statute of limitations | (0.6 | ) | |
Balance at June 30, 2015 | $ | 66.9 | |
Of this amount, $46.7 million and $41.4 million represent the amount of unrecognized tax benefits that, if recognized, would favorably impact the effective income tax rate as of June 30, 2015 and June 30, 2014, respectively. An additional $20.2 million represents the amount of unrecognized tax benefits that, if recognized, would not impact the effective income tax rate due to a full valuation allowance.
In the normal course of business, the Company is subject to examination by taxing authorities throughout the world, including major jurisdictions such as Germany, United Kingdom, France, the United States, and various states. The Company is no longer subject to examinations by the relevant tax authorities for years prior to fiscal 2005.
The Company recognizes interest and penalties related to uncertain tax positions in income tax expense. As of June 30, 2015, the Company has approximately $6.3 million of accrued interest related to uncertain tax positions, an increase of $1.2 million from the prior year. The Company had approximately $5.1 million and $5.0 million of accrued interest related to uncertain tax positions as of June 30, 2014 and 2013, respectively. The portion of such interest and penalties subject to indemnification by Cardinal is $2.3 million, an increase of $0.3 million from the prior year.
10. | EMPLOYEE RETIREMENT BENEFIT PLANS |
The Company sponsors various retirement plans, including defined benefit pension plans and defined contribution plans. Substantially all of the Company’s domestic non-union employees are eligible to participate in an employer-sponsored retirement savings plans, which include features under Section 401(k) of the Internal Revenue Code of 1986, as amended, and provide for company matching contributions. The Company’s contributions to the plans are determined by its Board of Directors subject to certain minimum requirements as specified in the plans. The Company uses a measurement date of June 30 for all of its retirement and postretirement benefit plans.
In addition, the Company has recorded obligations related to its withdrawal from a multi-employer pension plan related to a former commercial packaging site, a clinical services site and a former printed components operation. The Company’s withdrawal from these multi-employer pension plans has been classified as a mass withdrawal under the Multiemployer Pension Plan Amendments Act of 1980, and, as amended, under the Pension Protection Act of 2006. The withdrawal from the plan resulted in the recognition of liabilities associated with the Company’s long-term obligations in prior year periods not
88
presented, which were primarily recorded as an expense within discontinued operations. The estimated discounted value of the projected contributions related to these plans is $39.5 million and $39.6 million as of June 30, 2015 and June 30, 2014, respectively. The annual cash impact associated with the Company’s long-term obligation approximates $1.7 million per year.
The following table provides a reconciliation of the change in projected benefit obligation and fair value of plan assets for the defined benefit retirement and other retirement plans, excluding the multi-employer pension plan liability:
At June 30, | Retirement Benefits | Other Post-Retirement Benefits | |||||||||||||
(Dollars in millions) | 2015 | 2014 | 2015 | 2014 | |||||||||||
Accumulated Benefit Obligation | $ | 316.0 | $ | 324.4 | $ | 3.7 | $ | 4.4 | |||||||
Change in Benefit Obligation | |||||||||||||||
Benefit obligation at beginning of year | 333.8 | 289.1 | 4.4 | 4.9 | |||||||||||
Company service cost | 2.7 | 2.8 | — | — | |||||||||||
Interest cost | 11.4 | 12.2 | 0.2 | 0.2 | |||||||||||
Employee contributions | — | — | — | — | |||||||||||
Plan amendments | — | — | — | — | |||||||||||
Curtailments | (1.6 | ) | — | — | — | ||||||||||
Settlements | — | (1.7 | ) | — | — | ||||||||||
Special termination benefits | — | — | — | — | |||||||||||
Divestitures | — | — | — | — | |||||||||||
Business combinations | — | — | — | — | |||||||||||
Benefits paid | (9.6 | ) | (10.9 | ) | (0.2 | ) | (0.3 | ) | |||||||
Actual expenses | — | (0.1 | ) | — | — | ||||||||||
Actuarial (gain)/loss | 20.8 | 24.3 | (0.7 | ) | (0.4 | ) | |||||||||
Exchange rate gain/(loss) | (33.8 | ) | 18.1 | — | — | ||||||||||
Benefit obligation at end of year | 323.7 | 333.8 | 3.7 | 4.4 | |||||||||||
Change in Plan Assets | |||||||||||||||
Fair value of plan assets at beginning of year | 222.2 | 198.4 | — | — | |||||||||||
Actual return on plan assets | 18.4 | 14.0 | — | — | |||||||||||
Company contributions | 9.0 | 8.6 | 0.2 | 0.3 | |||||||||||
Employee contributions | — | — | — | — | |||||||||||
Settlements | — | (1.7 | ) | — | — | ||||||||||
Special company contributions to fund termination benefits | — | — | — | — | |||||||||||
Divestitures | — | — | — | — | |||||||||||
Business combinations | — | — | — | — | |||||||||||
Benefits paid | (9.6 | ) | (10.9 | ) | (0.2 | ) | (0.3 | ) | |||||||
Actual expenses | — | (0.1 | ) | — | — | ||||||||||
Exchange rate gain/(loss) | (18.0 | ) | 13.9 | — | — | ||||||||||
Fair value of plan assets at end of year | 222.0 | 222.2 | — | — | |||||||||||
Funded Status | |||||||||||||||
Funded status at end of year | (101.7 | ) | (111.4 | ) | (3.7 | ) | (4.4 | ) | |||||||
Employer contributions between measurement date and reporting date | — | — | — | — | |||||||||||
Net pension asset (liability) | (101.7 | ) | (111.4 | ) | (3.7 | ) | (4.4 | ) | |||||||
89
The following table provides a reconciliation of the net amount recognized in the Consolidated Balance Sheets:
At June 30, | Retirement Benefits | Other Post-Retirement Benefits | |||||||||||||
(Dollars in millions) | 2015 | 2014 | 2015 | 2014 | |||||||||||
Amounts Recognized in Statement of Financial Position | |||||||||||||||
Noncurrent assets | $ | 0.6 | $ | 0.7 | $ | — | $ | — | |||||||
Current liabilities | (0.9 | ) | (1.0 | ) | (0.8 | ) | (0.4 | ) | |||||||
Noncurrent liabilities | (101.4 | ) | (111.1 | ) | (2.9 | ) | (4.0 | ) | |||||||
Total asset/(liability) | (101.7 | ) | (111.4 | ) | (3.7 | ) | (4.4 | ) | |||||||
Amounts Recognized in Accumulated Other Comprehensive Income | |||||||||||||||
Transition (asset)/obligation | — | — | — | — | |||||||||||
Prior service cost | 0.1 | 0.2 | — | — | |||||||||||
Net (gain)/loss | 63.2 | 52.2 | (1.6 | ) | (0.9 | ) | |||||||||
Total accumulated other comprehensive income at the end of the year | 63.3 | 52.4 | (1.6 | ) | (0.9 | ) | |||||||||
Additional Information for Plan with ABO in Excess of Plan Assets | |||||||||||||||
Projected benefit obligation | 309.6 | 318.1 | 3.7 | 4.4 | |||||||||||
Accumulated benefit obligation | 304.1 | 311.2 | 3.7 | 4.4 | |||||||||||
Fair value of plan assets | 207.3 | 206.0 | — | — | |||||||||||
Additional Information for Plan with PBO in Excess of Plan Assets | |||||||||||||||
Projected benefit obligation | 309.6 | 318.1 | 3.7 | 4.4 | |||||||||||
Accumulated benefit obligation | 304.1 | 311.2 | 3.7 | 4.4 | |||||||||||
Fair value of plan assets | 207.3 | 206.0 | — | — | |||||||||||
Components of Net Periodic Benefit Cost | |||||||||||||||
Service Cost | 2.7 | 2.8 | — | — | |||||||||||
Interest Cost | 11.4 | 12.2 | 0.2 | 0.2 | |||||||||||
Expected return on plan assets | (10.5 | ) | (10.4 | ) | — | — | |||||||||
Amortization of unrecognized: | |||||||||||||||
Transition (asset)/obligation | — | — | — | — | |||||||||||
Prior service cost | — | — | — | — | |||||||||||
Net (gain)/loss | 1.8 | 1.3 | (0.1 | ) | — | ||||||||||
Ongoing periodic cost | 5.4 | 5.9 | 0.1 | 0.2 | |||||||||||
Settlement/curtailment expense/(income) | (0.2 | ) | 0.2 | — | — | ||||||||||
Net periodic benefit cost | 5.2 | 6.1 | 0.1 | 0.2 | |||||||||||
90
At June 30, | Retirement Benefits | Other Post-Retirement Benefits | |||||||||||||
(Dollars in millions) | 2015 | 2014 | 2015 | 2014 | |||||||||||
Other Changes in Plan Assets and Benefit Obligations Recognized in Other Comprehensive Income | |||||||||||||||
Net (gain)/loss arising during the year | $ | 13.0 | $ | 20.7 | (0.7 | ) | (0.3 | ) | |||||||
Prior service cost (credit) during the year | — | — | — | — | |||||||||||
Transition asset/(obligation) recognized during the year | — | — | — | — | |||||||||||
Prior service cost recognized during the year | — | — | — | — | |||||||||||
Net gain/(loss) recognized during the year | (3.2 | ) | (1.5 | ) | 0.1 | — | |||||||||
Exchange rate gain/(loss) recognized during the year | (0.6 | ) | 0.5 | — | — | ||||||||||
Total recognized in other comprehensive income | $ | 9.2 | $ | 19.7 | $ | (0.6 | ) | $ | (0.3 | ) | |||||
Total Recognized in Net Periodic Benefit Cost and Other Comprehensive Income | |||||||||||||||
Total recognized in net periodic benefit cost and other comprehensive income | $ | 14.4 | $ | 27.3 | $ | (0.5 | ) | $ | (0.2 | ) | |||||
Estimated Amounts to be Amortized from Accumulated Other Comprehensive Income into Net Periodic Benefit Cost | |||||||||||||||
Amortization of: | |||||||||||||||
Transition (asset)/obligation | $ | — | $ | — | $ | — | $ | — | |||||||
Prior service cost/(credit) | — | — | — | — | |||||||||||
Net (gain)/loss | 2.9 | 2.0 | (0.1 | ) | (0.1 | ) | |||||||||
Financial Assumptions Used to Determine Benefit Obligations at the Balance Sheet Date | |||||||||||||||
Discount rate (%) | 3.38 | % | 3.73 | % | 3.69 | % | 3.67 | % | |||||||
Rate of compensation increases (%) | 2.06 | % | 2.10 | % | N/A | N/A | |||||||||
Financial Assumptions Used to Determine Net Periodic Benefit Cost for Financial Year | |||||||||||||||
Discount rate (%) | 3.73 | % | 4.14 | % | 3.67 | % | 3.92 | % | |||||||
Rate of compensation increases (%) | 2.10 | % | 2.51 | % | N/A | N/A | |||||||||
Expected long-term rate of return (%) | 5.11 | % | 5.11 | % | N/A | N/A | |||||||||
Expected Future Contributions | |||||||||||||||
Financial Year | |||||||||||||||
2016 | $ | 7.6 | $ | 0.8 | |||||||||||
91
At June 30, | Retirement Benefits | Other Post-Retirement Benefits | |||||||||
(Dollars in millions) | 2015 | 2014 | 2015 | 2014 | |||||||
Expected Future Benefit Payments | |||||||||||
Financial Year | |||||||||||
2016 | 10.5 | 9.7 | 0.8 | 0.4 | |||||||
2017 | 9.5 | 11.3 | 0.3 | 0.4 | |||||||
2018 | 11.1 | 10.6 | 0.3 | 0.4 | |||||||
2019 | 11.2 | 12.7 | 0.3 | 0.4 | |||||||
2020 | 13.9 | 12.7 | 0.3 | 0.4 | |||||||
2021-2025 | 72.0 | 77.5 | 1.1 | 1.6 | |||||||
Actual Asset Allocation (%) | |||||||||||
Equities | 34.2 | % | 34.0 | % | — | % | — | % | |||
Government Bonds | 28.2 | % | 27.0 | % | — | % | — | % | |||
Corporate Bonds | 17.3 | % | 17.1 | % | — | % | — | % | |||
Property | 3.1 | % | 3.0 | % | — | % | — | % | |||
Insurance Contracts | 8.5 | % | 9.5 | % | — | % | — | % | |||
Other | 8.7 | % | 9.4 | % | — | % | — | % | |||
Total | 100.0 | % | 100.0 | % | — | % | — | % | |||
Actual Asset Allocation (Amount) | |||||||||||
Equities | 75.7 | 75.7 | — | — | |||||||
Government Bonds | 62.7 | 60.0 | — | — | |||||||
Corporate Bonds | 38.5 | 37.9 | — | — | |||||||
Property | 6.9 | 6.6 | — | — | |||||||
Insurance Contracts | 18.9 | 21.0 | — | — | |||||||
Other | 19.3 | 21.0 | — | — | |||||||
Total | 222.0 | 222.2 | — | — | |||||||
Target Asset Allocation (%) | |||||||||||
Equities | 34.5 | % | 34.3 | % | — | % | — | % | |||
Government Bonds | 24.8 | % | 24.5 | % | — | % | — | % | |||
Corporate Bonds | 22.1 | % | 21.7 | % | — | % | — | % | |||
Property | 3.5 | % | 3.6 | % | — | % | — | % | |||
Insurance Contracts | 6.3 | % | 7.1 | % | — | % | — | % | |||
Other | 8.8 | % | 8.8 | % | — | % | — | % | |||
Total | 100.0 | % | 100.0 | % | — | % | — | % | |||
The Company employs a building block approach in determining the long-term rate of return for plan assets. Historical markets are studied and long-term historical relationships between equities and fixed income are preserved consistent with the widely accepted capital market principle that assets with higher volatility generate a greater return over the long run. Current market factors such as inflation and interest rates are evaluated before long-term capital market assumptions are determined. The long-term portfolio return is established via a building block approach with proper consideration of diversification and rebalancing. Peer data and historical returns are reviewed to check for reasonability and appropriateness.
Plan assets are recognized and measured at fair value in accordance with the accounting standards regarding fair value measurements. The following are valuation techniques used to determine the fair value of each major category of assets:
• | Short-term Investments, Equity securities, Fixed Income Securities, and Real Estate are valued using quoted market prices or other valuation methods, and thus are classified within Level 1 or Level 2. |
92
• | Insurance Contracts and Other include investments with some observable and unobservable prices that are adjusted by cash contributions and distributions, and thus are classified within Level 2 or Level 3. |
The following table provides a summary of plan assets that are measured in fair value as of June 30, 2015, aggregated by the level in the fair value hierarchy within which those measurements fall:
(Dollars in millions) | Total Assets | Level 1 | Level 2 | Level 3 | ||||||||||||
Equity Securities | $ | 75.7 | $ | — | $ | 75.7 | — | |||||||||
Debt Securities | 101.2 | — | 101.2 | — | ||||||||||||
Real Estate | 6.9 | — | 0.3 | 6.6 | ||||||||||||
Other | 38.2 | — | 17.3 | 20.9 | ||||||||||||
Total | $ | 222.0 | $ | — | $ | 194.5 | $ | 27.5 | ||||||||
Level 3 real estate assets consist of a U.K. Property fund ("UBS Life Triton Property Fund") that directly invests in properties that are held in the U.K. The funds are priced using the Net Asset Value ("NAV") of the fund and investors also get Bid and Offer prices on a monthly basis. Investment properties are measured at fair value as determined by third-party independent appraisers. Their value is ascertained by reference to the market value, having regard to whether they are let or un-let at the date of valuation, in accordance with the Appraisal and Valuation Manual issued by the Royal Institution of Chartered Surveyors.
Level 3 other assets consist of an insurance contract in the UK to fulfill the benefit obligations for a portion of the participant benefits. The value of this commitment is determined using the same assumptions and methods used to value the UK Retirement & Death Benefit Plan pension liability. Level 3 other assets also include the partial funding of a pension liability relating to current and former employees of the Company’s Eberbach facility through a Company promissory note or loan with an annual rate of interest of 5%. The value of this commitment fluctuates due to contributions and benefit payments in addition to loan interest.
The following table provides a summary of plan assets that are measured in fair value as of June 30, 2014, aggregated by the level in the fair value hierarchy within which those measurements fall:
(Dollars in millions) | Total Assets | Level 1 | Level 2 | Level 3 | ||||||||||||
Equity Securities | $ | 75.7 | $ | 6.1 | $ | 69.6 | — | |||||||||
Debt Securities | 97.9 | 26.8 | 71.1 | — | ||||||||||||
Real Estate | 6.6 | — | 0.4 | 6.2 | ||||||||||||
Other | 42.0 | — | 18.1 | 23.9 | ||||||||||||
Total | $ | 222.2 | $ | 32.9 | $ | 159.2 | $ | 30.1 | ||||||||
93
The following table provides a reconciliation of the beginning and ending balances of level 3 assets as well as the changes during the period attributable to assets held and those purchases, sales, settlements, contributions and benefits that were paid:
Asset Category Allocations - June 30, 2015
Total (Level 3) | Fair Value Measurement | Fair Value Measurement | Fair Value Measurement | ||||||||
All figures in U.S. Dollars | Using Significant | Using Significant | Using Significant | ||||||||
(Dollars in millions) | Unobservable Inputs | Unobservable Inputs | Unobservable Inputs | ||||||||
Total (Level 3) | Insurance Contracts | Other | |||||||||
Beginning Balance at June 30, 2014 | $ | 30.1 | $ | 4.7 | $ | 25.4 | |||||
Actual return on plan assets: | |||||||||||
Relating to assets still held at the reporting date | (2.0 | ) | 0.2 | (2.2 | ) | ||||||
Relating to assets sold during the period | — | — | — | ||||||||
Purchases, sales, settlements, contributions and benefits paid | (0.6 | ) | (0.2 | ) | (0.4 | ) | |||||
Transfers in and/or out of Level 3 | — | — | — | ||||||||
Ending Balance at June 30, 2015 | $ | 27.5 | $ | 4.7 | $ | 22.8 | |||||
The investment policy reflects the long-term nature of the plans’ funding obligations. The assets are invested to provide the opportunity for both income and growth of principal. This objective is pursued as a long-term goal designed to provide required benefits for participants without undue risk. It is expected that this objective can be achieved through a well-diversified asset portfolio. All equity investments are made within the guidelines of quality, marketability and diversification mandated by the Employee Retirement Income Security Act (“ERISA”) (for plans subject to ERISA) and other relevant legal requirements. Investment managers are directed to maintain equity portfolios at a risk level approximately equivalent to that of the specific benchmark established for that portfolio. Assets invested in fixed income securities and pooled fixed income portfolios are managed actively to pursue opportunities presented by changes in interest rates, credit ratings or maturity premiums.
At June 30, | Other Post-Retirement Benefits | ||||||
(Actual dollar amounts) | 2015 | 2014 | |||||
Assumed Healthcare Cost Trend Rates at the Balance Sheet Date | |||||||
Healthcare cost trend rate – initial (%) | |||||||
Pre-65 | n/a | 7.60 | % | ||||
Post-65 | 11.35 | % | 10.91 | % | |||
Healthcare cost trend rate – ultimate (%) | |||||||
Pre-65 | n/a | 4.70 | % | ||||
Post-65 | 4.64 | % | 4.70 | % | |||
Year in which ultimate rates are reached | |||||||
Pre-65 | n/a | 2021 | |||||
Post-65 | 2022 | 2020 | |||||
Effect of 1% Change in Healthcare Cost Trend Rate | |||||||
Healthcare cost trend rate up 1% | |||||||
on APBO at balance sheet date | $ | 171,309 | $ | 278,651 | |||
on total service and interest cost | 8,181 | 11,363 | |||||
Effect of 1% Change in Healthcare Cost Trend Rate | |||||||
Healthcare cost trend rate down 1% | |||||||
on APBO at balance sheet date | $ | (152,189 | ) | $ | (245,360 | ) | |
on total service and interest cost | (7,282 | ) | (10,008 | ) | |||
Expected Future Contributions | |||||||
Financial Year | |||||||
2016 | $ | 830,044 | |||||
94
11. | RELATED PARTY TRANSACTIONS |
Advisor Transaction and Management Fees
Prior to the IPO, the Company was party to a transaction and advisory fee agreement with affiliates of Blackstone and certain other investors in BHP PTS Holdings L.L.C. (the “Investors”), pursuant to which the Company historically paid an annual sponsor advisory fee to Blackstone and the other Investors for certain monitoring, advisory and consulting services to the Company. In connection with the IPO, the Company paid the Investors an advisory agreement termination fee of $29.8 million in August 2014, which was recorded within other (income)/expense, net in the Consolidated Statements of Operations, and terminated the agreement. As a result, the Company did not have management fees for fiscal year ended June 30, 2015. For fiscal years ended June 30, 2014 and 2013, this management fee was approximately $12.9 million and $12.4 million, respectively. This fee was recorded as expense within selling, general and administrative expenses in the Consolidated Statements of Operations.
In connection with each of two secondary offerings of our common stock demanded by Blackstone during fiscal 2015 following the IPO, we entered into underwriting agreements with Blackstone, the other shareholders selling in the offerings, and the underwriters managing the offerings setting forth the terms of the offerings and making various representations to the underwriters regarding various facts and circumstances relating to the offerings. The underwriting agreements required us to pay certain expenses relating to the offerings and to indemnify Blackstone, the other sellers, and the underwriters for the offerings against liabilities arising from breaches of our representations and certain other matters relating to the offerings.
Other Related Party Transactions
The Company participates in an employer health program agreement with Equity Healthcare LLC (“Equity Healthcare”). Equity Healthcare negotiates with providers of standard administrative services for health benefit plans and other related services for cost discounts and quality of service monitoring capability by Equity Healthcare. Because of the combined purchasing power of its client participants, Equity Healthcare is able to negotiate pricing terms for providers that are believed to be more favorable than the companies could obtain for themselves on an individual basis. In consideration for these services, the Company paid Equity Healthcare a fee of $2.80 and $2.70 per participating employee per month in calendar years 2015 and 2014, respectively. As of June 30, 2015, the Company had approximately 2,500 employees enrolled in its health benefit plans in the United States. Equity Healthcare is an affiliate of Blackstone.
12. | EQUITY AND ACCUMULATED OTHER COMPREHENSIVE INCOME (LOSS) |
Description of Capital Stock and Initial Public Offering
The Company is authorized to issue 1,000,000,000 shares of common stock, par value $0.01 per share, and 100,000,000 shares of preferred stock, par value $0.01 per share. In accordance with the Company’s amended and restated certificate of incorporation, each share of common stock has one vote, and the common stock votes together as a single class. In July 2014, the Company’s board of directors and holders of the requisite number of outstanding shares of its capital stock have approved an amendment to the Company’s amended and restated certificate of incorporation to effect a 70-for-1 stock split. The stock split became effective on July 17, 2014 upon the filing with the Delaware Secretary of State of an amendment to the Company’s amended and restated certificate of incorporation. Refer to Note 1 for further discussion of the Company’s July 2014 recapitalization and discussion of the Company’s public offerings of common stock.
95
Accumulated other comprehensive income/(loss)
Accumulated other comprehensive income/(loss) by component and changes for the fiscal years June 30, 2015, June 30, 2014 and June 30, 2013 consists of:
(Dollars in millions) | Foreign Currency Translation Adjustments | Unrealized Gains/(Losses) on Derivatives | Deferred Compensation | Pension Liability Adjustments | Other Comprehensive Income/(Loss) | ||||||||||||||
Balance at June 30, 2012 | $ | 29.5 | $ | (24.5 | ) | $ | 0.7 | $ | (34.6 | ) | $ | (28.9 | ) | ||||||
Activity, net of tax | (47.9 | ) | 24.5 | 0.8 | 8.7 | (13.9 | ) | ||||||||||||
Balance at June 30, 2013 | (18.4 | ) | — | 1.5 | (25.9 | ) | (42.8 | ) | |||||||||||
Activity, net of tax | 32.4 | — | 1.7 | (15.5 | ) | 18.6 | |||||||||||||
Balance at June 30, 2014 | 14.0 | — | 3.2 | (41.4 | ) | (24.2 | ) | ||||||||||||
Activity, net of tax | (144.0 | ) | — | 0.6 | (6.4 | ) | (149.8 | ) | |||||||||||
Balance at June 30, 2015 | $ | (130.0 | ) | $ | — | $ | 3.8 | $ | (47.8 | ) | $ | (174.0 | ) | ||||||
The components of the changes in the cumulative translation adjustment and minimum pension liability for the fiscal years ended June 30, 2015, June 30, 2014 and June 30, 2013 consists of:
Year Ended June 30, | |||||||||||
2015 | 2014 | 2013 | |||||||||
Foreign currency translation adjustments: | |||||||||||
Net investment hedge | $ | 30.0 | $ | (13.6 | ) | $ | (20.9 | ) | |||
Long term inter-company loans | (9.0 | ) | 28.3 | (4.8 | ) | ||||||
Translation adjustments | (152.7 | ) | 17.7 | (22.2 | ) | ||||||
Total cumulative translation adjustment, pretax | (131.7 | ) | 32.4 | (47.9 | ) | ||||||
Tax (1) | (12.3 | ) | — | — | |||||||
Total cumulative translation adjustment, net of tax | $ | (144.0 | ) | $ | 32.4 | $ | (47.9 | ) | |||
Net change in minimum pension liability | |||||||||||
Net gain/(loss) arising during the year | $ | (12.3 | ) | $ | (20.4 | ) | $ | 9.5 | |||
Net (gain)/loss recognized during the year | 3.1 | 1.5 | 1.1 | ||||||||
Foreign Exchange Translation and Other | 0.6 | (0.5 | ) | (0.4 | ) | ||||||
Total Pension, pretax | (8.6 | ) | (19.4 | ) | 10.2 | ||||||
Tax | 2.2 | 3.9 | (1.5 | ) | |||||||
Net change in minimum pension liability, net of tax | $ | (6.4 | ) | $ | (15.5 | ) | $ | 8.7 | |||
(1) | Tax related to foreign currency translation adjustments primarily relates to the Net investment hedge activity. |
96
13. | EQUITY-BASED COMPENSATION |
2007 Stock Incentive Plan
The Company’s stock-based compensation is comprised of stock options and restricted stock units. Awards issued under the Company’s pre-IPO incentive compensation plan, known as the 2007 PTS Holdings Corp. Stock Incentive Plan, as amended (the “2007 Plan”), were generally issued for the purpose of retaining key employees and directors. The Company adopted two forms of non-qualified stock option agreements (each, a “Form Option Agreement”) for awards granted under the 2007 Plan. Under the Company’s Form Option Agreement adopted in 2009, a portion of the stock option awards vest in equal annual installments over a five-year period contingent solely upon the participant’s continued employment with the Company, or one of its subsidiaries, another portion of the stock option awards vest over a specified performance period upon achievement of pre-determined operating performance targets over time and the remaining portion of the stock option awards vest upon realization of certain internal rates of return or multiple of investment goals. Under the Company’s other Form Option Agreement, adopted in 2013, a portion of the stock option awards vest over a specified performance period upon achievement of pre-determined operating performance targets over time while the other portion of the stock option awards vest upon realization of a specified multiple of investment goal. The Form Option Agreements include certain forfeiture provisions upon a participant’s separation from service with the Company. Following the IPO, the Company decided not to grant any further awards under the 2007 Plan; however, all outstanding awards granted prior to the IPO remained outstanding in accordance with the terms of the 2007 Plan.
2014 Omnibus Incentive Plan
In connection with the IPO, the Company’s Board of Directors adopted the 2014 Omnibus Incentive Plan effective July 31, 2014 (the “2014 Plan”). The 2014 Plan provides certain members of management, employees and directors of the Company and its subsidiaries with the opportunity to obtain various incentives, including grants of stock options and restricted stock units. A maximum of 6,700,000 shares of common stock may be issued under the 2014 Plan.
Restricted stock units under the 2014 Plan may be granted to members of management and directors. At the IPO, the Company granted to members of management restricted stock units that had certain performance-related vesting requirements (“performance stock units”). These restricted stock units had a grant date fair value of $14.7 million, which represents approximately 692,000 shares of common stock. Under the 2014 Plan, the performance share units vest based on achieving Company financial performance metrics established at the outset of each three-year performance period. The metrics for fiscal 2015 are a mix of cumulative revenue growth and cumulative EBITDA growth targets. The performance share units vest following the end of the three-year performance period based on achievement of the targets. The restricted stock awards vest on the third anniversary of the date of grant subject to the participant’s continued employment with the Company.
Stock options were also granted as part of the IPO under the 2014 Plan for selected executives of the Company with an aggregate intrinsic value of $2.3 million, which represents approximately 509,000 shares of common stock. Each stock option vests in equal annual installments over a four-year period from the date of grant, contingent solely upon the participant’s continued employment with the Company.
Stock Compensation Expense
Stock compensation expense recognized in the consolidated statements of income was $9.0 million, $4.5 million and $2.8 million in fiscal years 2015, 2014 and 2013, respectively. All stock compensation expense is classified in selling, general and administrative expenses along with the wages and benefits of the option participants. Stock compensation expense is based on awards expected to vest, and therefore has been reduced by estimated forfeitures. Forfeitures are required to be estimated at the time of grant and revised in subsequent periods, if necessary, if actual forfeitures differ from those estimates.
Methodology and Assumptions
Stock options are granted with an exercise price equal to the fair market value on the date of grant. In the 2007 Plan, stock options granted generally vest in equal annual installments over a five year period from the grant date. Stock options granted typically have a contractual term of 10 years. The grant-date fair value, adjusted for estimated forfeitures, is recognized as expense on a ratable basis over the substantive vesting period. The fair value of stock options is determined using the Black-Scholes-Merton option pricing model for service and performance based awards, and an adaptation of the Black-Scholes-Merton option valuation model, which takes into consideration the internal rate of return thresholds, for market based awards. This model adaptation is essentially equivalent to the use of path dependent-lattice model.
The weighted average of assumptions used in estimating the fair value of stock options granted during each year were as follows:
97
Year Ended June 30, | |||||
2015 | 2014 | 2013 | |||
Expected volatility | 32% | 31% | 30% - 31% | ||
Expected life (in years) | 6.25 | 5.66 - 6.50 | 5.82 - 6.50 | ||
Risk-free interest rates | 2% | 0.3% - 2.2% | 0.3% - 1.9% | ||
Dividend yield | None | None | None | ||
The Company is newly public, and as a result has limited relevant historical volatility experience; therefore, the expected volatility assumption is based on the historical volatility of closing share price of a comparable peer group. The Company selected peer companies from the pharmaceutical industry with similar characteristics to us, including market capitalization, number of employees and product focus. In addition, since the Company does not have a pattern of exercise behavior of option holders, the Company used the simplified method to determine the expected life of each option, which is the mid-point between the vesting date and the end of the contractual term. The risk-free interest-rate for the expected life of the option is based on the comparable U.S. Treasury yield curve in effect at the time of grant. The weighted-average grant-date fair value of stock options in 2015, 2014, and 2013 was $7.23 per share, $5.41 per share and $4.23 per share, respectively.
The following table summarizes stock option activity and shares outstanding for the year ended June 30, 2015:
Time | Performance | Market | |||||||||||||||||||
Weighted | |||||||||||||||||||||
Average | Number | WA | Aggregate | Number | WA | Aggregate | Number | WA | Aggregate | ||||||||||||
Exercise | of | Contractual | Intrinsic | of | Contractual | Intrinsic | of | Contractual | Intrinsic | ||||||||||||
Price | shares | Term | Value | shares | Term | Value | shares | Term | Value | ||||||||||||
Outstanding as of June 30, 2014 | $ | 13.96 | 2,632,280 | 5.96 | $ | 24,001,410 | 1,563,730 | 7.55 | $ | 9,483,970 | 2,337,860 | 7.06 | $ | 16,702,850 | |||||||
Granted | $ | 20.97 | 784,078 | 6.25 | — | — | — | — | — | — | — | ||||||||||
Exercised | $ | 11.70 | (1,279,524 | ) | — | 21,268,432 | (340,900 | ) | — | 5,517,749 | — | — | — | ||||||||
Forfeited | $ | 16.05 | (129,135 | ) | — | — | (125,580 | ) | — | — | (264,250 | ) | — | — | |||||||
Expired / Canceled | — | — | — | — | — | — | — | — | — | — | |||||||||||
Outstanding as of June 30, 2015 | $ | 15.62 | 2,007,699 | 6.83 | 25,979,873 | 1,097,250 | 6.87 | 14,296,090 | 2,073,610 | 5.81 | 30,739,825 | ||||||||||
Expected to vest as of June 30, 2015 | $ | 15.56 | 1,934,120 | 6.75 | 25,327,072 | 1,071,956 | 6.85 | 14,025,624 | 1,399,048 | 5.63 | 21,319,082 | ||||||||||
Vested and expected to vest as of June 30, 2015 | $ | 12.83 | 961,932 | 4.96 | $ | 16,107,185 | 467,936 | 5.54 | $ | 7,485,413 | — | — | — | ||||||||
In fiscal 2015, participants exercised the option to purchase 623 thousand shares, resulting in $10.3 million of cash paid on behalf of participants for withholding taxes. The intrinsic value of the options exercised in fiscal 2015 was $26.8 million. The total fair value of options vested during the period was $3.6 million.
In fiscal 2014, participants exercised the option to purchase 20 thousand shares, resulting in an inconsequential impact on the Company’s cash balance and income tax accounts. The intrinsic value of the options exercised in fiscal 2014 was $0.4 million.
As of June 30, 2015, $4.8 million of unrecognized compensation cost related to stock options is expected to be recognized as expense over a weighted-average period of approximately 3.08 years.
Restricted Stock Units
The Company may grant restricted stock units ("RSUs") to employees for recognition and retention purposes. RSUs generally vest over a three to five-year period. The grant-date fair value, adjusted for estimated forfeitures, is recognized as expense ratably on a graded vesting schedule over the vesting period. The fair value of RSUs is determined based on the number of shares granted and the fair value of the Company’s common stock on the date of grant.
98
The following table summarizes non-vested RSU activity for the year ended June 30, 2015:
RSU Units | Weighted Average Grant- Date Fair Value | |||||
Non-vested as of June 30, 2014 | 55,020 | $ | 17.43 | |||
Granted (1) | 800,654 | 21.49 | ||||
Vested | 26,703 | 12.94 | ||||
Forfeited | 55,671 | 21.27 | ||||
Non-vested as of June 30, 2015 | 773,300 | $ | 21.51 | |||
(1) | The number of shares granted in fiscal 2015 increased as compared to the prior year as a result of a change from a cash-based long-term incentive plan to an equity-based long-term incentive plan for the Company’s senior employees. |
As of June 30, 2015, $10.5 million of unrecognized compensation cost related to RSUs is expected to be recognized as expense over a weighted-average period of approximately 2.1 years. The weighted-average grant-date fair value of RSUs in fiscal years 2015 and 2014 was $21.49 and $21.64, respectively. There were no RSU grants in fiscal year 2013. The fair value of RSUs vested in fiscal 2015, 2014 and 2013 was $0.6 million, $0.6 million and $0.6 million, respectively.
14. | OTHER (INCOME) / EXPENSE, NET |
The components of Other (Income) / Expense, net for the twelve months ended June 30, 2015, 2014, 2013 are as follows:
Twelve Months Ended June 30, | |||||||||||
(Dollars in millions) | 2015 | 2014 | 2013 | ||||||||
Other (Income) / Expense, net | |||||||||||
Debt extinguishment costs | $ | 21.8 | $ | 11.1 | $ | 17.0 | |||||
Gain on acquisition, net (1) | (8.9 | ) | — | — | |||||||
Sponsor advisory agreement termination fee (2) | 29.8 | — | — | ||||||||
Foreign currency (gains) and losses | (2.4 | ) | (2.5 | ) | 3.2 | ||||||
Other | 2.1 | 1.8 | 4.9 | ||||||||
Total Other (Income) / Expense | $ | 42.4 | $ | 10.4 | $ | 25.1 | |||||
(1) | Included within Other (income) / expense, net are gains associated with acquisitions completed during the respective periods. Such income events are non-standard in nature and not reflective of the Company’s core operating results. During the twelve months ended June 30, 2015, the Company recorded a gain of $3.2 million on the re-measurement of a cost investment in an entity that became a wholly owned subsidiary as of October 2014, a $7.0 million bargain purchase gain for an acquisition completed in July 2014, and a $1.3 million loss on the redeemable noncontrolling interest in June 2015. |
(2) | The Company paid a sponsor advisory agreement termination fee of $29.8 million in connection with its IPO. |
15. | REDEEMABLE NONCONTROLLING INTEREST |
In July 2013, the Company acquired a 67% controlling interest in a softgel manufacturing facility located in Haining, China. The noncontrolling interest shareholders have the right to jointly sell the remaining 33% interest to Catalent during the 30-day period following the third anniversary of closing for a price based on the greater of (1) an amount that would provide the noncontrolling interest shareholders a return on their investment of a predetermined amount per annum on their pro rata share of the initial valuation or (2) a multiple of the sum of the target’s earnings before interest, taxes, depreciation and amortization and amortization less net debt for the four quarters immediately preceding such sale. Noncontrolling interest with redemption features, such as the arrangement described above, that are not solely within the Company’s control are considered redeemable noncontrolling interests, which is considered temporary equity and is therefore reported outside of permanent equity on the Company’s consolidated balance sheet at the greater of the initial carrying amount adjusted for the noncontrolling interest’s share of net income/(loss) or its redemption value.
99
In June 2015, the Company reached an agreement to acquire the remaining 33% from the noncontrolling interest shareholders for purchase consideration of $5.8 million. As a result of the purchase agreement, the Company recorded a $1.3 million loss in Other Income/Expense, net to reflect the current redemption value as of June 30, 2015. The transaction is expected to close in fiscal 2016 after customary closing conditions are met, including regulatory approvals.
16. | COMMITMENTS AND CONTINGENCIES |
Rental Payments and Expense
The future minimum rental payments for operating leases having initial or remaining non-cancelable lease terms in excess of one year at June 30, 2015 are:
(Dollars in millions) | 2016 | 2017 | 2018 | 2019 | 2020 | Thereafter | Total | ||||||||||||||
Minimum rental payments | $ | 8.4 | $ | 6.0 | $ | 5.3 | $ | 4.2 | $ | 4.1 | $ | 7.8 | $ | 35.8 | |||||||
Rental expense relating to operating leases was approximately $10.0 million, $9.5 million, and $9.4 million for the fiscal years ended June 30, 2015, June 30, 2014 and June 30, 2013, respectively. Sublease rental income was not material for any period presented.
Other Matters
As previously disclosed with regard to the Company’s participation in a multi-employer pension plan, the Company notified the plan trustees of its withdrawal from such plan in fiscal 2012. The actuarial review process, which is administered by the plan trustees, was completed during the third quarter of fiscal 2015, and the resulting estimated liability reflects the present value of its expected future long-term obligations. The annual cash impact associated with the Company’s long-term obligation approximates $1.7 million per year. Refer to Note 10 to the Consolidated Financial Statements for further discussion.
From time to time, the Company may be involved in legal proceedings arising in the ordinary course of business, including, without limitation, inquiries and claims concerning environmental contamination as well as litigation and allegations in connection with acquisitions, product liability, manufacturing or packaging defects and claims for reimbursement for the cost of lost or damaged active pharmaceutical ingredients, the cost of which could be significant. The Company intends to vigorously defend itself against such other litigation and does not currently believe that the outcome of any such other litigation will have a material adverse effect on the Company’s financial statements. In addition, the healthcare industry is highly regulated and governmental agencies continue to scrutinize certain practices affecting governmental programs and otherwise.
From time to time, the Company receives subpoenas or requests for information from various governmental agencies, including from state attorneys general and the U.S. Department of Justice relating to the business practices of customers or suppliers. The Company generally responds to such subpoenas and requests in a timely and thorough manner, which responses sometimes require considerable time and effort and can result in considerable costs being incurred. The Company expects to incur costs in future periods in connection with existing and future requests.
17. | SEGMENT INFORMATION |
The Company conducts its business within the following operating segments: Softgel Technologies, Modified Release Technologies, Medication Delivery Solutions and Development & Clinical Services. The Softgel Technologies and Modified Release Technologies segments are aggregated into one reportable operating segment – Oral Technologies. The Company evaluates the performance of its segments based on segment earnings before noncontrolling interest, other (income) expense, impairments, restructuring costs, interest expense, income tax (benefit)/expense, and depreciation and amortization (“Segment EBITDA”). EBITDA from continuing operations is consolidated earnings from continuing operations before interest expense, income tax (benefit)/expense, depreciation and amortization and is adjusted for the income or loss attributable to noncontrolling interest. The Company’s presentation of Segment EBITDA and EBITDA from continuing operations may not be comparable to similarly titled measures used by other companies.
100
The following tables include net revenue and Segment EBITDA during the fiscal years ended June 30, 2015, June 30, 2014, and June 30, 2013:
(Dollars in millions) | Fiscal Year Ended June 30, | ||||||||||
2015 | 2014 | 2013 | |||||||||
Oral Technologies | |||||||||||
Net revenue | $ | 1,141.1 | $ | 1,180.1 | $ | 1,186.3 | |||||
Segment EBITDA | $ | 313.7 | $ | 324.3 | $ | 315.7 | |||||
Medication Delivery Solutions | |||||||||||
Net revenue | 261.9 | 246.1 | 219.3 | ||||||||
Segment EBITDA | 53.9 | 48.7 | 31.5 | ||||||||
Development and Clinical Services | |||||||||||
Net revenue | 438.8 | 412.2 | 404.8 | ||||||||
Segment EBITDA | 93.4 | 83.5 | 75.0 | ||||||||
Inter-segment revenue elimination | (11.0 | ) | (10.7 | ) | (10.1 | ) | |||||
Unallocated costs (1) | (100.8 | ) | (82.1 | ) | (90.6 | ) | |||||
Combined Total | |||||||||||
Net revenue | $ | 1,830.8 | $ | 1,827.7 | $ | 1,800.3 | |||||
EBITDA from continuing operations | $ | 360.2 | $ | 374.4 | $ | 331.6 | |||||
(1) | Unallocated costs include restructuring and special items, equity-based compensation, impairment charges, certain other corporate directed costs, and other costs that are not allocated to the segments as follows: |
(Dollars in millions) | Fiscal Year Ended June 30, | ||||||||||
2015 | 2014 | 2013 | |||||||||
Impairment charges and gain/(loss) on sale of assets | $ | (4.7 | ) | $ | (3.2 | ) | $ | (5.2 | ) | ||
Equity compensation | (9.0 | ) | (4.5 | ) | (2.8 | ) | |||||
Restructuring and other items (2) | (27.2 | ) | (29.4 | ) | (29.0 | ) | |||||
Sponsor advisory fee | — | (12.9 | ) | (12.4 | ) | ||||||
Noncontrolling interest | 1.9 | 1.0 | 0.1 | ||||||||
Other income/(expense), net (3) | (42.4 | ) | (10.4 | ) | (25.1 | ) | |||||
Non-allocated corporate costs, net | (19.4 | ) | (22.7 | ) | (16.2 | ) | |||||
Total unallocated costs | $ | (100.8 | ) | $ | (82.1 | ) | $ | (90.6 | ) | ||
(2) | Segment results do not include restructuring and certain acquisition-related costs. |
(3) | Amounts primarily relate to the expense associated with the termination of the sponsor advisory services agreement of $29.8 million in connection with the IPO, expenses related to financing transactions of $21.8 million and acquisition-related gains of $8.9 million, all during the current year; and foreign currency translation gains and losses during all periods presented. |
101
Provided below is a reconciliation of earnings/(loss) from continuing operations to EBITDA from continuing operations:
(Dollars in millions) | Fiscal Year Ended June 30, | ||||||||||
2015 | 2014 | 2013 | |||||||||
Earnings/(loss) from continuing operations | $ | 210.2 | $ | 17.9 | $ | (50.9 | ) | ||||
Depreciation and amortization | 140.8 | 142.9 | 152.2 | ||||||||
Interest expense, net | 105.0 | 163.1 | 203.2 | ||||||||
Income tax (benefit)/expense | (97.7 | ) | 49.5 | 27.0 | |||||||
Noncontrolling interest | 1.9 | 1.0 | 0.1 | ||||||||
EBITDA from continuing operations | $ | 360.2 | $ | 374.4 | $ | 331.6 | |||||
The following table includes total assets for each segment, as well as reconciling items necessary to total the amounts reported in the Consolidated Financial Statements:
(Dollars in millions) | June 30, 2015 | June 30, 2014 | |||||
Assets | |||||||
Oral Technologies | $ | 2,477.3 | $ | 2,585.6 | |||
Medication Delivery Solutions | 247.8 | 292.8 | |||||
Development and Clinical Services | 703.2 | 672.1 | |||||
Corporate and eliminations | (282.9 | ) | (460.3 | ) | |||
Total assets | $ | 3,145.4 | $ | 3,090.2 | |||
The following tables include depreciation and amortization expense and capital expenditures for the fiscal years ended June 30, 2015, June 30, 2014 and June 30, 2013 for each segment, as well as reconciling items necessary to total the amounts reported in the Consolidated Financial statements:
Depreciation and Amortization Expense
(Dollars in millions) | Fiscal Year Ended June 30, | ||||||||||
2015 | 2014 | 2013 | |||||||||
Oral Technologies | $ | 73.6 | $ | 80.8 | $ | 86.7 | |||||
Medication Delivery Solutions | 23.7 | 22.6 | 20.6 | ||||||||
Development and Clinical Services | 36.6 | 30.9 | 33.2 | ||||||||
Corporate | 6.9 | 8.6 | 11.7 | ||||||||
Total depreciation and amortization expense | $ | 140.8 | $ | 142.9 | $ | 152.2 | |||||
Capital Expenditures
(Dollars in millions) | Fiscal Year Ended June 30, | ||||||||||
2015 | 2014 | 2013 | |||||||||
Oral Technologies | $ | 75.6 | $ | 56.1 | $ | 47.7 | |||||
Medication Delivery Solutions | 22.6 | 25.0 | 47.7 | ||||||||
Development and Clinical Services | 24.0 | 28.2 | 21.3 | ||||||||
Corporate | 18.8 | 13.1 | 5.8 | ||||||||
Total capital expenditure | $ | 141.0 | $ | 122.4 | $ | 122.5 | |||||
102
The following table presents revenue and long-lived assets by geographic area:
Net Revenue | Long-Lived Assets(1) | ||||||||||||||||||
(Dollars in millions) | Fiscal Year Ended June 30, | ||||||||||||||||||
2015 | 2014 | 2013 | June 30, 2015 | June 30, 2014 | |||||||||||||||
United States | $ | 799.3 | $ | 682.3 | $ | 695.8 | $ | 479.0 | $ | 413.7 | |||||||||
Europe | 795.4 | 888.8 | 863.2 | 314.6 | 348.5 | ||||||||||||||
International Other | 268.6 | 278.8 | 270.1 | 91.6 | 110.8 | ||||||||||||||
Eliminations | (32.5 | ) | (22.2 | ) | (28.8 | ) | — | — | |||||||||||
Total | $ | 1,830.8 | $ | 1,827.7 | $ | 1,800.3 | $ | 885.2 | $ | 873.0 | |||||||||
(1) | Long-lived assets include property and equipment, net of accumulated depreciation. |
18. | SUPPLEMENTAL BALANCE SHEET INFORMATION |
Supplementary balance sheet information at June 30, 2015 and June 30, 2014 is detailed in the following tables.
Inventories
Work-in-process and finished goods inventories include raw materials, labor and overhead. Total inventories consisted of the following:
(Dollars in millions) | June 30, 2015 | June 30, 2014 | |||||
Raw materials and supplies | $ | 76.9 | $ | 84.1 | |||
Work-in-process | 26.3 | 23.8 | |||||
Finished goods | 43.8 | 39.8 | |||||
Total inventory, gross | 147.0 | 147.7 | |||||
Inventory reserve | (14.1 | ) | (12.9 | ) | |||
Inventories | $ | 132.9 | $ | 134.8 | |||
Prepaid expenses and other
Prepaid expenses and other current assets consist of the following:
(Dollars in millions) | June 30, 2015 | June 30, 2014 | |||||
Prepaid expenses | $ | 22.0 | $ | 16.6 | |||
Spare parts supplies | 11.5 | 12.5 | |||||
Deferred income taxes | 19.7 | 12.7 | |||||
Other current assets | 27.7 | 32.8 | |||||
Prepaid expenses and other | $ | 80.9 | $ | 74.6 | |||
103
Property, plant, and equipment, net
Property, plant, and equipment, net consist of the following:
(Dollars in millions) | June 30, 2015 | June 30, 2014 | |||||
Land, buildings and improvements | $ | 637.6 | $ | 619.0 | |||
Machinery, equipment and capitalized software | 727.9 | 683.6 | |||||
Furniture and fixtures | 10.1 | 8.1 | |||||
Construction in progress | 97.6 | 110.9 | |||||
Property and equipment, at cost | 1,473.2 | 1,421.6 | |||||
Accumulated depreciation | (588.0 | ) | (548.6 | ) | |||
Property, plant, and equipment, net | $ | 885.2 | $ | 873.0 | |||
Other assets
Other assets consist of the following:
(Dollars in millions) | June 30, 2015 | June 30, 2014 | |||||
Deferred long-term debt financing costs | $ | 9.5 | $ | 19.7 | |||
Other | 18.9 | 29.0 | |||||
Total other assets | $ | 28.4 | $ | 48.7 | |||
104
Other accrued liabilities
Other accrued liabilities consist of the following:
(Dollars in millions) | June 30, 2015 | June 30, 2014 | |||||
Accrued employee-related expenses | $ | 87.8 | $ | 86.7 | |||
Restructuring accrual | 7.3 | 10.3 | |||||
Deferred income taxes | 1.5 | 1.0 | |||||
Accrued interest | 0.2 | 12.2 | |||||
Deferred revenue and fees | 39.0 | 47.1 | |||||
Accrued income tax | 55.8 | 61.5 | |||||
Other accrued liabilities and expenses | 55.4 | 60.9 | |||||
Other accrued liabilities | $ | 247.0 | $ | 279.7 | |||
Allowance for doubtful accounts
Trade receivables allowance for doubtful accounts activity is as follows:
(Dollars in millions) | June 30, 2015 | June 30, 2014 | June 30, 2013 | ||||||||
Trade receivables allowance for doubtful accounts | |||||||||||
Beginning balance | $ | 5.4 | $ | 5.7 | $ | 4.2 | |||||
Charged to cost and expenses | 2.7 | 0.5 | 2.1 | ||||||||
Deductions and other | (1.1 | ) | (1.0 | ) | (0.6 | ) | |||||
Impact of foreign exchange | (0.4 | ) | 0.2 | ||||||||
Closing balance | $ | 6.6 | $ | 5.4 | $ | 5.7 | |||||
Inventory reserve
Inventory reserve activity is as follows:
(Dollars in millions) | June 30, 2015 | June 30, 2014 | June 30, 2013 | ||||||||
Inventory reserve | |||||||||||
Beginning balance | $ | 12.9 | $ | 11.8 | $ | 8.5 | |||||
Charged to cost and expenses | 9.5 | 10.2 | 8.7 | ||||||||
Deductions | (6.5 | ) | (9.5 | ) | (5.9 | ) | |||||
Impact of foreign exchange | (1.8 | ) | 0.4 | 0.5 | |||||||
Closing balance | $ | 14.1 | $ | 12.9 | $ | 11.8 | |||||
19. SUBSEQUENT EVENTS
During the preparation of its consolidated financial statements, the Company completed an evaluation of the impact of subsequent events and determined there was no significant subsequent event requiring disclosure in or adjustment to these financial statements.
105
20. | QUARTERLY FINANCIAL DATA (UNAUDITED) |
The following table summarizes the Company’s unaudited quarterly results of operation.
(Dollars in millions, except per share data) | Fiscal Year 2015, By Quarters | ||||||||||||||
First | Second | Third | Fourth | ||||||||||||
Net revenue | $ | 418.3 | $ | 455.8 | $ | 446.6 | $ | 510.1 | |||||||
Gross margin | 125.3 | 156.1 | 152.2 | 181.7 | |||||||||||
Earnings/(loss) from continuing operations less net income (loss) attributable to noncontrolling interest | (19.9 | ) | 46.7 | 31.5 | 153.8 | ||||||||||
Net earnings/(loss) from discontinued operations, net of tax | 0.4 | (0.2 | ) | — | (0.1 | ) | |||||||||
Net earnings/(loss) attributable to Catalent | $ | (19.5 | ) | $ | 46.5 | $ | 31.5 | $ | 153.7 | ||||||
Earnings per share attributable to Catalent: | |||||||||||||||
Basic | |||||||||||||||
Earnings/(loss) from continuing operations | $ | (0.19 | ) | $ | 0.38 | $ | 0.25 | $ | 1.23 | ||||||
Net earnings/(loss) | $ | (0.18 | ) | $ | 0.37 | $ | 0.25 | $ | 1.23 | ||||||
Diluted | |||||||||||||||
Earnings/(loss) from continuing operations | $ | (0.19 | ) | $ | 0.37 | $ | 0.25 | $ | 1.22 | ||||||
Net earnings/(loss) | $ | (0.18 | ) | $ | 0.37 | $ | 0.25 | $ | 1.22 | ||||||
(Dollars in millions, except per share data) | Fiscal Year 2014, By Quarters | ||||||||||||||
First | Second | Third | Fourth | ||||||||||||
Net revenue | $ | 414.3 | $ | 440.7 | $ | 453.1 | $ | 519.6 | |||||||
Gross margin | 119.2 | 137.4 | 151.7 | 190.3 | |||||||||||
Earnings/(loss) from continuing operations less net income (loss) attributable to noncontrolling interest | 1.9 | (18.6 | ) | 8.4 | 27.2 | ||||||||||
Net earnings/(loss) from discontinued operations, net of tax | (0.4 | ) | (0.6 | ) | (1.7 | ) | — | ||||||||
Net earnings/(loss) attributable to Catalent | $ | 1.5 | $ | (19.2 | ) | $ | 6.7 | $ | 27.2 | ||||||
Earnings per share attributable to Catalent: | |||||||||||||||
Basic | |||||||||||||||
Earnings/(loss) from continuing operations | $ | 0.03 | $ | (0.25 | ) | $ | 0.11 | $ | 0.36 | ||||||
Net earnings/(loss) | $ | 0.02 | $ | (0.26 | ) | $ | 0.09 | $ | 0.36 | ||||||
Diluted | |||||||||||||||
Earnings/(loss) from continuing operations | $ | 0.02 | $ | (0.25 | ) | $ | 0.11 | $ | 0.36 | ||||||
Net earnings/(loss) | $ | 0.02 | $ | (0.26 | ) | $ | 0.09 | $ | 0.36 | ||||||
106
ITEM 9. | CHANGES IN AND DISAGREEMENTS WITH ACCOUNTANTS ON ACCOUNTING AND FINANCIAL DISCLOSURE |
None.
ITEM 9A. | CONTROLS AND PROCEDURES |
Disclosure Controls and Procedures
We maintain disclosure controls and procedures that are designed to ensure that information required to be disclosed in the Company’s reports under the Exchange Act is recorded, processed, summarized and reported within the time periods specified in the SEC’s rules and forms, and that such information is accumulated and communicated to the Company’s management, including the Company’s President and Chief Executive Officer, and the Company’s Executive Vice President and Chief Financial Officer, as appropriate, to allow timely decisions regarding required disclosures. Any controls and procedures, no matter how well designed and operated, can provide only reasonable assurance of achieving the desired control objectives. The Company’s management, with the participation of the Company’s President and Chief Executive Officer, and the Company’s Executive Vice President and Chief Financial Officer, has evaluated the effectiveness of the design and operation of the Company’s disclosure controls and procedures as of the end of the period covered by this Annual Report on Form 10-K. Based upon that evaluation, the Company’s President and Chief Executive Officer and the Company’s Executive Vice President and Chief Financial Officer concluded that, as of June 30, 2015, the Company’s disclosure controls and procedures were effective to accomplish their objectives at the reasonable assurance level.
Management’s Annual Report on Internal Control Over Financial Reporting
Our management is responsible for establishing and maintaining adequate internal control over our financial reporting. Our internal control over financial reporting is designed to provide reasonable assurances regarding the reliability of financial reporting and the preparation of our consolidated financial statements in accordance with U.S. generally accepted accounting principles.
Our internal control over financial reporting includes those policies and procedures that:
• | pertain to the maintenance of records that, in reasonable detail, accurately and fairly reflect the transactions and dispositions of our assets; |
• | provide reasonable assurance that transactions are recorded as necessary to permit preparation of financial statements in accordance with U.S. generally accepted accounting principles, and that receipts and expenditures are being made only in accordance with authorizations of our management and directors; and |
• | provide reasonable assurance regarding prevention or timely detection of unauthorized acquisition, use or disposition of our assets that could have a material effect on the financial statements. |
Because of its inherent limitations, internal control over financial reporting may not prevent or detect misstatements. Also, projections of any evaluation of effectiveness to future periods are subject to the risk that controls may become inadequate because either conditions change or the degree of compliance with our policies and procedures may deteriorate.
Our management has assessed the effectiveness of our internal control over financial reporting as of June 30, 2015. In making this assessment, management used the framework set forth by the Committee of Sponsoring Organizations of the Treadway Commission (COSO) in Internal Control-Integrated Framework (2013). Based on this assessment, our management concluded that our internal control over financial reporting was effective as of June 30, 2015.
Changes in Internal Control over Financial Reporting
There was no change in the Company’s internal control over financial reporting (as such term is defined in Rules 13a-15(f) and 15d-15(f) under the Exchange Act) that occurred during the Company’s most recent fiscal quarter that has materially affected, or is reasonably likely to materially affect, the Company’s internal control over financial reporting.
107
ITEM 9B. | OTHER INFORMATION |
Iran Threat Reduction and Syria Human Rights Act of 2012
Pursuant to Section 219 of the Iran Threat Reduction and Syria Human Rights Act of 2012 (“ITRSHRA”), which added Section 13(r) of the Exchange Act, the Company hereby incorporates by reference herein Exhibit 99.1 of this report, which includes disclosures publicly filed and/or provided to Blackstone by Travelport Worldwide Limited, which may be considered our affiliate.
108
PART III
ITEM 10. | DIRECTORS, EXECUTIVE OFFICERS AND CORPORATE GOVERNANCE |
Information concerning our Directors and Executive Officers, “Section 16(a) Beneficial Ownership Reporting Compliance,” definitive shareholder communications with our Board of Directors, and corporate governance may be found in our Proxy Statement for the 2015 Annual Meeting of Shareholders, which will be filed within 120 days after June 30, 2015, the close of our fiscal year covered by this Annual Report on Form 10-K (the “Proxy Statement”). Such information is incorporated by reference.
ITEM 11. | EXECUTIVE COMPENSATION |
Information concerning executive compensation may be found in our Proxy Statement, which will be filed within 120 days after June 30, 2015, the close of our fiscal year. Such information is incorporated herein by reference.
ITEM 12. | SECURITY OWNERSHIP OF CERTAIN BENEFICIAL OWNERS AND MANAGEMENT AND RELATED STOCKHOLDER MATTERS |
Information regarding security ownership of certain beneficial owners and management may be found in the Proxy Statement, which will be filed within 120 days after June 30, 2015, the close of our fiscal year. Such information is incorporated herein by reference.
ITEM 13. | CERTAIN RELATIONSHIPS AND RELATED PARTY TRANSACTIONS, AND DIRECTOR INDEPENDENCE |
Information regarding certain relationships and related party transactions, and director independence may be found in our Proxy Statement, which will be filed within 120 days after June 30, 2015, the close of our fiscal year. Such information is incorporated herein by reference.
ITEM 14. | PRINCIPAL ACCOUNTANT FEES AND SERVICES |
Information regarding the fees paid to and services performed by our independent accountants may be found in our Proxy Statement, which will be filed within 120 days after June 30, 2015, the close of our fiscal year. Such information is incorporated herein by reference.
109
PART IV
ITEM 15. | EXHIBITS AND FINANCIAL STATEMENT SCHEDULES |
(a)(1) Financial Statements. The Financial Statements listed in the Index to Financial Statements, are filed under Item 8 of this Annual Report on Form 10-K.
(a)(2) Financial Statements Schedule.
Deferred Tax Assets - Valuation Allowance
(Dollars in millions) | Beginning Balance | Current Period (Charge) / Benefit | Deductions and Other | Ending Balance | |||||||||||
Year ended June 30, 2013 | |||||||||||||||
Tax Valuation Allowance | $ | (203.3 | ) | $ | (9.1 | ) | $ | 4.0 | $ | (208.4 | ) | ||||
Year ended June 30, 2014 | |||||||||||||||
Tax Valuation Allowance | $ | (208.4 | ) | $ | (16.1 | ) | $ | 6.3 | $ | (218.2 | ) | ||||
Year ended June 30, 2015 | |||||||||||||||
Tax Valuation Allowance | $ | (218.2 | ) | $ | 107.7 | $ | 28.1 | $ | (82.4 | ) | |||||
(b) Exhibits.
The agreements and other documents filed as exhibits to this report are not intended to provide factual information or other disclosure other than with respect to the terms of the agreements or other documents themselves and you should not rely on them for that purpose. In particular, any representation or warranty made by us in these agreements or other documents were made solely within the specific context of the relevant agreement or document and may not describe the actual state of affairs as of the date they were made or at any other time.
Exhibit No. | Description | |
3.1 | Amended and Restated Certificate of Incorporation of Catalent, Inc. (incorporated by reference to Exhibit 3.1 to the Company’s Current Report on Form 8-K filed on August 5, 2014, File No. 001-36587) | |
3.2 | Amended and Restated Bylaws of Catalent, Inc. (incorporated by reference to Exhibit 3.2 to the Company’s Current Report on Form 8-K filed on August 5, 2014, File No. 001-36587) | |
10.1 | Stockholders Agreement, dated as of August 5, 2014, between Catalent, Inc. and Blackstone Healthcare Partners L.L.C. (incorporated by reference to Exhibit 10.1 to the Company’s Current Report on Form 8-K filed on August 5, 2014, File No. 001-36587) | |
10.2 | Registration Rights Agreement, dated as of August 5, 2014, by and among Catalent, Inc. and certain of its stockholders (incorporated by reference to Exhibit 10.2 to the Company’s Current Report on Form 8-K filed on August 5, 2014, File No. 001-36587) | |
10.3 | Form of Severance Agreement between named executive officers and Catalent Pharma Solutions, Inc. (incorporated by reference to Exhibit 10.3 to Catalent Pharma Solutions, Inc.’s Annual Report on Form 10-K filed on September 17, 2010, File No. 333-147871) † | |
10.4 | Offer Letter, dated August 25, 2009, between William Downie and Catalent Pharma Solutions, Inc. (incorporated by reference to Exhibit 10.4 to Catalent Pharma Solutions, Inc.’s Annual Report on Form 10-K filed on September 4, 2012, File No. 333-147871) † | |
10.5 | Letter Agreement, dated November 18, 2010, between Catalent Pharma Solutions, Inc. and William Downie (incorporated by reference to Exhibit 10.6 to Catalent Pharma Solutions, Inc.’s Annual Report on Form 10-K filed on September 4, 2012, File No. 333-147871) † | |
110
10.6 | Employment Agreement, dated as of October 11, 2011, and effective as of September 26, 2011, by and between Catalent Pharma Solutions, Inc. and Matthew Walsh (including Form of Restricted Stock Unit Agreement and Form of Nonqualified Stock Option Agreement) (incorporated by reference to Exhibit 10.42 to Catalent Pharma Solutions, Inc.’s Annual Report on Form 10-K filed on September 4, 2012, File No. 333-147871) † | |
10.7 | Management Equity Subscription Agreement dated September 8, 2010 by and between Catalent, Inc. (formerly known as PTS Holdings Corp.) and Melvin D. Booth (incorporated by reference to Exhibit 10.7 to Catalent Pharma Solutions, Inc.’s Annual Report on Form 10-K filed on September 17, 2010, File No. 333-147871) † | |
10.8 | Amended and Restated Management Equity Subscription Agreement dated as of October 11, 2011 by and between Catalent, Inc. (formerly known as PTS Holdings Corp.) and Matthew Walsh (incorporated by reference to Exhibit 10.43 to Catalent Pharma Solutions, Inc.’s Annual Report on Form 10-K filed on September 4, 2012, File No. 333-147871) † | |
10.9 | Form of Unit Subscription Agreement (incorporated by reference to Exhibit 10.12 to Catalent Pharma Solutions, Inc.’s Amendment No. 1 to the Registration Statement on Form S-4/A filed on March 3, 2008, File No. 333-147871) † | |
10.10 | Form of Management Equity Subscription Agreement (incorporated by reference to Exhibit 10.13 to Catalent Pharma Solutions, Inc.’s Amendment No. 1 to the Registration Statement on Form S-4/A filed on March 3, 2008, File No. 333-147871) † | |
10.11 | Form of Nonqualified Stock Option Agreement (executives) (incorporated by reference to Exhibit 10.14 to Catalent Pharma Solutions, Inc.’s Amendment No. 1 to the Registration Statement on Form S-4/A filed on March 3, 2008, File No. 333-147871) † | |
10.12 | Form of Nonqualified Stock Option Agreement (non-employee directors) (incorporated by reference to Exhibit 10.15 to Catalent Pharma Solutions, Inc.’s Amendment No. 1 to the Registration Statement on Form S-4/A filed on March 3, 2008, File No. 333-147871) † | |
10.13 | 2007 PTS Holdings Corp. Stock Incentive Plan (incorporated by reference to Exhibit 10.16 to Catalent Pharma Solutions, Inc.’s Registration Statement on Form S-4 filed on December 6, 2007, File No. 333-147871) † | |
10.14 | Amendment No. 1 to the 2007 PTS Holdings Corp. Stock Incentive Plan, dated September 8, 2010 (incorporated by reference to Exhibit 10.16 to Catalent Pharma Solutions, Inc.’s Annual Report on Form 10-K filed on September 17, 2010, File No. 333-147871) † | |
10.15 | Amendment No. 2 to the 2007 PTS Holdings Corp. Stock Incentive Plan, dated June 25, 2013 (incorporated by reference to Exhibit 10.45 to Catalent, Inc.’s Amendment No. 1 to the Registration Statement on Form S-1/A as filed on September 28, 2014, File No. 333-193542) † | |
10.16 | Form of Nonqualified Stock Option Agreement (executives) approved October 23, 2009 (incorporated by reference to Exhibit 10.1 to Catalent Pharma Solutions, Inc.’s Quarterly Report on Form 10-Q filed on February 12, 2010, File No. 333-147871) † | |
10.17 | Form of Nonqualified Stock Option Agreement Amendment (executives) approved October 23, 2009 (incorporated by reference to Exhibit 10.3 to Catalent Pharma Solutions, Inc.’s Quarterly Report on Form 10-Q filed on February 12, 2010), File No. 333-147871) † | |
10.18 | Form of Nonqualified Stock Option Agreement (executives) approved June 25, 2013 (incorporated by reference to Exhibit 10.45 of Catalent Pharma Solutions, Inc.’s Annual Report on Form 10-K filed on September 10, 2013, File No. 333-147871) † | |
10.19 | Form of Nonqualified Stock Option Agreement (Chief Executive Officer) approved June 25, 2013 (incorporated by reference to Exhibit 10.46 of Catalent Pharma Solutions Inc.’s Annual Report on Form 10-K filed on September 10, 2013, File No. 333-147871) † | |
10.20 | Form of Nonqualified Stock Option Agreement (John R. Chiminski) approved October 23, 2009 (incorporated by reference to Exhibit 10.4 to Catalent Pharma Solutions, Inc.’s Quarterly Report on Form 10-Q filed on February 12, 2010, File No. 333-147871) † | |
10.21 | Form of Restricted Stock Unit Agreement (John R. Chiminski) approved October 23, 2009 (incorporated by reference to Exhibit 10.5 to Catalent Pharma Solutions, Inc.’s Quarterly Report on Form 10-Q filed on February 12, 2010, File No. 333-147871) † | |
111
10.22 | Catalent Pharma Solutions, LLC Deferred Compensation Plan (incorporated by reference to Exhibit 10.19 to Catalent Pharma Solutions, Inc.’s Annual Report on Form 10-K filed on September 28, 2009, File No. 333-147871) † | |
10.23 | First Amendment to the Catalent Pharma Solutions, LLC Deferred Compensation Plan (incorporated by reference to Exhibit 10.1 to Catalent Pharma Solutions, Inc.’s Quarterly Report on Form 10-Q filed on February 17, 2009, File No. 333-147871) † | |
10.24 | Second Amendment to the Catalent Pharma Solutions, LLC Deferred Compensation Plan (incorporated by reference to Exhibit 10.21 to Catalent Pharma Solutions, Inc.’s Annual Report on Form 10-K filed on September 28, 2009, File No. 333-147871) † | |
10.25 | Catalent, Inc. 2014 Omnibus Incentive Plan (incorporated by reference to Exhibit 10.3 to the Company’s Current Report on Form 8-K filed on August 5, 2014, File No. 001-36587) † | |
10.26 | Form of Stock Option Agreement for U.S. Employees (incorporated by reference to Exhibit 10.4 to the Company’s Current Report on Form 8-K filed on August 5, 2014, File No. 001-36587) † | |
10.27 | Form of Restricted Stock Unit Agreement for U.S. Employees (incorporated by reference to Exhibit 10.5 to the Company’s Current Report on Form 8-K filed on August 5, 2014, File No. 001-36587) † | |
10.28 | Form of Restricted Stock Unit Agreement for Non-Employee Directors (incorporated by reference to Exhibit 10.6 to the Company’s Current Report on Form 8-K filed on August 5, 2014, File No. 001-36587) † | |
10.29 | Form of Stock Option Agreement for Non-U.S. Employees (incorporated by reference to Exhibit 10.7 to the Company’s Current Report on Form 8-K filed on August 5, 2014, File No. 001-36587) † | |
10.30 | Form of Restricted Stock Unit Agreement for Non-U.S. Employees (incorporated by reference to Exhibit 10.8 to the Company’s Current Report on Form 8-K filed on August 5, 2014, File No. 001-36587) † | |
10.31 | Amended and Restated Credit Agreement, dated as of May 20, 2014, relating to the Credit Agreement, dated as of April 10, 2007, as amended, among Catalent Pharma Solutions, Inc., PTS Intermediate Holdings LLC, Morgan Stanley Senior Funding, Inc., as the administrative agent, collateral agent and swing line lender and other lenders as parties thereto (incorporated by reference to Exhibit 10.1 to Catalent Pharma Solutions, Inc.’s Current Report on Form 8-K filed on May 27, 2014, File No. 333-147871) | |
10.32 | Form of Performance Share Unit for U.S. Employees (incorporated by reference to Exhibit 10.1 to the Company’s Quarterly Report on Form 10-Q filed on November 13, 2014, File No. 001-36587) † | |
10.33 | Form of Performance Share Unit for Non-U.S. Employees (incorporated by reference to Exhibit 10.2 to the Company’s Quarterly Report on Form 10-Q filed on November 13, 2014, File No. 001-36587)† | |
10.34 | Intellectual Property Security Agreement, dated as of April 10, 2007, among PTS Acquisition Corp., Cardinal Health 409, Inc., PTS Intermediate Holdings LLC, Certain Subsidiaries of Holdings Identified Therein and Morgan Stanley Senior Funding, Inc. (incorporated by reference to Exhibit 10.21 to Catalent Pharma Solutions, Inc.’s Registration Statement on Form S-4 filed on December 6, 2007, File No. 333-147871) | |
10.35 | Intellectual Property Security Agreement Supplement, dated as of July 1, 2008, to the Intellectual Property Security Agreement, dated as of April 10, 2007, among PTS Acquisition Corp., Cardinal Health 409, Inc., PTS Intermediate Holdings LLC, Certain Subsidiaries of Holdings Identified Therein and Morgan Stanley Senior Funding, Inc. (incorporated by reference to Exhibit 10.28 to Catalent Pharma Solutions, Inc.’s Annual Report on Form 10-K filed on September 29, 2008, File No. 333-147871) | |
10.36 | Amendment No. 1, dated December 1, 2014 to Amended and Restated Credit Agreement, dated as of May 20, 2014 among Catalent Pharma Solutions, Inc., PTS Intermediate Holdings LLC, Morgan Stanley Senior Funding, Inc., as the administrative agent, collateral agent and swing line lender and other lenders as parties thereto (incorporated by reference to Exhibit 10.1 to the Company’s Current Report on Form 8-K filed on December 2, 2014, File No. 001-36587) | |
10.37 | Employment Agreement, dated October 22, 2014 by and among Catalent, Inc. and John R. Chiminski (incorporated by reference to Exhibit 10.1 to the Company’s Current Report on Form 8-K filed on October 24, 2014), File No. 001-36587 † | |
112
10.38 | Relocation agreement, dated November 18, 2010, between William Downie and Catalent Pharma Solutions, Inc. † * | |
10.39 | Offer letter, dated May 4, 2009, between Stephen Leonard and Catalent Pharma Solutions, Inc. † * | |
10.40 | Offer letter, dated April 18, 2011, between Sharon Johnson and Catalent Pharma Solutions, Inc. † * | |
10.41 | Relocation agreement, dated April 6, 2011, between Sharon Johnson and Catalent Pharma Solutions, Inc. † * | |
12.1 | Statement Regarding Computation of Ratio of Earnings to Fixed Charges* | |
21.1 | Subsidiaries of the Registrant* | |
23.1 | Consent of Ernst & Young LLP* | |
31.1 | Certification of the Chief Executive Officer pursuant to Rule 13a-14(a) or Rule 15d-14(a) of the Securities Exchange Act of 1934, as amended* | |
31.2 | Certification of the Chief Financial Officer pursuant to Rule 13a-14(a) or Rule 15d-14(a) of the Securities Exchange Act of 1934, as amended* | |
32.1 | Certification of the Chief Executive Officer pursuant to 18 U.S.C. Section 1350, as adopted pursuant to Section 906 of the Sarbanes-Oxley Act of 2002** | |
32.2 | Certification of the Chief Financial Officer pursuant to 18 U.S.C. Section 1350, as adopted pursuant to Section 906 of the Sarbanes-Oxley Act of 2002** | |
101.1 | The following materials are formatted in XBRL (eXtensible Business Reporting Language): (i) the Consolidated Statements of Operations, (ii) the Consolidated Statements of Comprehensive Income (Loss), (iii) the Consolidated Balance Sheets, (iv) the Consolidated Statement of Changes in Shareholders’ Equity (Deficit), (v) the Consolidated Statements of Cash Flows and (vi) Notes to Consolidated Financial Statements | |
* Filed herewith
** Furnished herewith
† Represents a management contract, compensatory plan or arrangement in which directors and/or executive officers are eligible to participate.
113
SIGNATURES
Pursuant to the requirements of Section 13 or 15(d) of the Securities Exchange Act of 1934, the registrant has duly caused this report to be signed on its behalf by the undersigned, thereunto duly authorized.
CATALENT, INC. | ||||
Date: | September 2, 2015 | By: | /s/ STEVEN L. FASMAN | |
Steven L. Fasman | ||||
Senior Vice President & General Counsel and Secretary | ||||
Pursuant to the requirements of the Securities Exchange Act of 1934, this report has been signed below by the following persons on behalf of the registrant and in the capacities and on the dates indicated.
Signature | Title | Date | |
/s/ JOHN R. CHIMINSKI | President & Chief Executive Officer (Principal Executive Officer) and Director | September 2, 2015 | |
John R. Chiminski | |||
/s/ CHINH E. CHU | Chairman of the Board and Director | September 2, 2015 | |
Chinh E. Chu | |||
/s/ MELVIN D. BOOTH | Director | September 2, 2015 | |
Melvin D. Booth | |||
/s/ J. MARTIN CARROLL | Director | September 2, 2015 | |
J. Martin Carroll | |||
/s/ ROLF CLASSON | Director | September 2, 2015 | |
Rolf Classon | |||
/s/ BRUCE MCEVOY | Director | September 2, 2015 | |
Bruce McEvoy | |||
/s/ GREGORY T. LUCIER | Director | September 2, 2015 | |
Gregory T. Lucier | |||
/s/ JAMES QUELLA | Director | September 2, 2015 | |
James Quella | |||
/s/ JACK STAHL | Director | September 2, 2015 | |
Jack Stahl | |||
/s/ MATTHEW M. WALSH | Executive Vice President & Chief Financial Officer | September 2, 2015 | |
Matthew M. Walsh | (Principal Financial Officer and Principal Accounting Officer) | ||
114