Attached files
| file | filename |
|---|---|
| 8-K - 8-K - OGLETHORPE POWER CORP | a16-21551_18k.htm |
Exhibit 99.1
Third Quarter 2016 Investor Update

Notice to Recipients Cautionary Note Regarding Forward Looking Statements Certain of the information contained in this presentation, including certain of the statements made by representatives of Oglethorpe Power Corporation (An Electric Membership Corporation) (“Oglethorpe”), that are not historical facts are forward-looking statements. Although Oglethorpe believes that in making these forward-looking statements its expectations are based on reasonable assumptions, Oglethorpe cautions the reader not to put undue reliance on these forward-looking statements, which are not guarantees of future performance. Forward-looking statements involve uncertainties and there are important factors, many of which are outside management’s control, which could cause actual results to differ materially from those expressed or implied by these forward-looking statements. Some of the risks, uncertainties and assumptions that may cause actual results to differ from these forward-looking statements are described under the headings “Cautionary Statement Regarding Forward-Looking Statements” in our Quarterly Report on Form 10-Q for the quarter ended September 30, 2016, filed with the Securities and Exchange Commission on November 10, 2016 and “Item 1A – Risk Factors” in our Annual Report on Form 10-K for the fiscal year ended December 31, 2015, filed with the Securities and Exchange Commission on March 29, 2016. This electronic presentation is provided as of November 16, 2016. If you are viewing this presentation after that date, there may have been events that occurred subsequent to such date that would have a material adverse effect on the information that was presented. Oglethorpe undertakes no obligation to publicly update any forward-looking statements. 2

Operations Update Vogtle 3 & 4 Construction Update Financial Results Presenters and Agenda Mike Price Executive Vice President and Chief Operating Officer Betsy Higgins Executive Vice President and Chief Financial Officer Mike Smith President and Chief Executive Officer 3

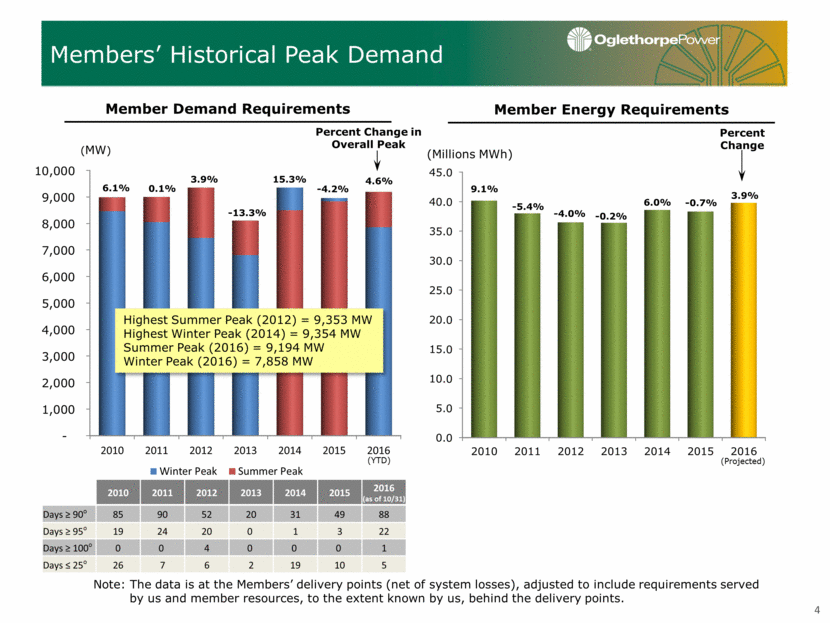
Members’ Historical Peak Demand Member Demand Requirements Member Energy Requirements Percent Change -0.2% Note: The data is at the Members’ delivery points (net of system losses), adjusted to include requirements served by us and member resources, to the extent known by us, behind the delivery points. 9.1% -5.4% -4.0% 6.0% (Projected) -0.7% (MW) Percent Change in Overall Peak 6.1% -13.3% 0.1% 3.9% 15.3% -4.2% Highest Summer Peak (2012) = 9,353 MW Highest Winter Peak (2014) = 9,354 MW Summer Peak (2016) = 9,194 MW Winter Peak (2016) = 7,858 MW 4.6% 3.9% 2010 2011 2012 2013 2014 2015 2016 (as of 10/31) Days > 90o 85 90 52 20 31 49 88 Days > 95o 19 24 20 0 1 3 22 Days > 100o 0 0 4 0 0 0 1 Days < 25o 26 7 6 2 19 10 5 4 (YTD) - 1,000 2,000 3,000 4,000 5,000 6,000 7,000 8,000 9,000 10,000 2010 2011 2012 2013 2014 2015 2016 Winter Peak Summer Peak 2010 2011 2012 2013 2014 2015 2016 (Millions MWh)

Capacity and Energy Note: Capacity and energy includes Oglethorpe and Smarr EMC resources. Capacity reflects summer reserve planning capacity. 2016 Energy (September YTD) 2016 Capacity 5 54% 16% 20% 10% Rocky Mountain Pumped Storage Hydro Sewell Creek Energy Facility Chattahoochee Energy Facility Hawk Road Energy Facility Plant Wansley Talbot Energy Facility Hartwell Energy Facility Plant Vogtle Plant Hatch Doyle Generating Plant Smarr Energy Facilitiy Plant Scherer Thomas A. Smith Energy Facility 43% 35% 18% 4%

Capacity Factor Through September 30 Nuclear Coal Gas - CC Gas - CT Pumped Storage Hydro 6 Note: Oglethorpe’s sales to members have increased in 2016 primarily due to T.A. Smith Facility serving member load beginning 1/1/2016. 0% 25% 50% 75% 100% Hatch Vogtle Scherer Wansley Chattahoochee T.A. Smith Doyle Hawk Road Hartwell Talbot Rocky Mountain 2015 2016

7 General Operations Update Historical Gas Burn (Dts) YTD 2016 through 10/31/16 7M 11M 8M 9M 3M 7M 8M 13M 19M 25M 28M 62M 40M 44M 63M 86M M 10M 20M 30M 40M 50M 60M 70M 80M 90M 100M 2001 2002 2003 2004 2005 2006 2007 2008 2009 2010 2011 2012 2013 2014 2015 2016 YTD Dts

30% share (660 MW) of 2,200 MW Westinghouse AP1000 units at existing Vogtle site. Spent $3.2 billion of total OPC budget of $5.0 billion including AFUDC and contingency. Current in-service dates of June, 2019 and June, 2020 for Units 3 and 4. Risk of delay to Unit 3 in-service date has increased and a several month delay is likely. Unit 4 in-service date remains achievable, but risk remains. Vogtle 3 & 4 Project Update $3.2 billion spent through 9/30/2016 Actuals Forecasts DEC 2011 DCD Final Rule Effective MAY 2005 Development Agreement MAR 2008 Filed COL with NRC APR 2006 Definitive Agreements MAY 2010 Signed DOE Conditional Term Sheet AUG 2006 Filed Early Site Permit (ESP) with NRC AUG 2009 NRC Issuance of ESP/LWA AUG 2011 NRC Completed Work on FSER for both AP1000 DCD and COL FEB 2012 COLs Issued MAR 2013 Unit 3 First Nuclear Concrete FEB 2014 Start of DOE Funding NOV 2013 Unit 4 First Nuclear Concrete 2017 2016 2015 2014 2013 2012 2011 2010 2009 2007 2008 2018 2006 2005 2019 2020 2017 2016 2015 2014 2013 2012 2011 2010 2009 2007 2008 2018 2006 2005 2019 2020 JUN 2020 Unit 4 In-Service DEC 2015 Settlement Agreement with Contractors DEC 2018 Unit 3 Fuel Load DEC 2019 Unit 4 Fuel Load JUN 2019 Unit 3 In-Service 8 0 0.5 1 1.5 2 2.5 3 3.5 4 4.5 5 (Billions)

Vogtle Construction Update – Unit 3 Set Shield Building courses 5 & 6 west side panels Set both Moisture Separator Reheaters in the Turbine Building Completed Turbine Building structural steel Set all three low pressure turbine lower outer casings Progress Look Ahead Set the Reactor Vessel in containment Continue Shield Building panel erection Continue build-out of Annex Building walls and floors to support Initial Energization Set 1st Steam Generator inside containment Set CV Ring 2 9

Vogtle Construction Update – Unit 4 Progress Look Ahead CA01 module assembly complete Began U4 Annex Building foundation work Began assembly of CA03 module Set all 12 water boxes and crossover pipe for condenser in Turbine Building Set CA01 module in containment Set the first course Shield Building panels on the west side Place concrete under containment west side to EL 103’ Place concrete in CA20 walls 10

Low Interest Rates – Financing project with low-cost long-term debt. Original projections (from 2008) – 7.5% weighted average rate. Current projections – less than 5% weighted average rate, even assuming interest rate increases of 50-140 bp per year from 2017 through 2019. 4.26% weighted average rate already set on $3.1 billion (62% of $5 billion budget). Contingency – $5 billion budget contains contingency. Could cover up to a 1 year delay on Unit 3 plus a several month delay on Unit 4. There is potential for growth in the contingency if interest rates end up lower. Rate Management Programs – Members are planning and preparing today. Revenue deferral plans at many of our Member EMCs. Oglethorpe rate management program – expensing IDC. Structuring of 3rd party power supply contracts. Over $200 million today; expect over $500 million by Unit 3 in service date. Clean Energy – Would provide value under the Clean Power Plan (rate option). Zero-emission energy. Expected to generate over 5 million MWh per year (~17% of OPC’s sales). 1 MWh from Vogtle 3&4 = 1 ERC (Emission Reduction Credit). Assuming value of one ERC ranges from $1 - $10; Vogtle’s ERCs could generate value between $5 million - $50 million annually. Vogtle 3 & 4 Financial Highlights 11

RUS & DOE Loan Status Total Amount Outstanding under All RUS Guaranteed Loans: $2.6 billion 12 (a) RUS and DOE guaranteed loans are funded through Federal Financing Bank. (b) Represents accrued capitalized interest being financed with the DOE guaranteed loan. (c) Aggregate borrowings under the Facility may not exceed the lesser of 70% of Eligible Project Costs or the amount shown. (d) RUS loan committed as of September 29, 2016. Loan is expected to close in 2017. RUS Guaranteed Loans(a) as of October 31, 2016 DOE Guaranteed Loan(a) as of October 31, 2016 $555 million is available to advance based on eligible project expenses incurred through September 30, 2016. Purpose/Use of Proceeds Approved Advanced Remaining Amount Approved Loans General & Environmental Improvements $230,050,000 $172,456,778 $57,593,222 General & Environmental Improvements (d) 448,307,000 0 448,307,000 $678,357,000 $172,456,778 $505,900,222 Purpose/Use of Proceeds Approved Advanced Remaining Amount Vogtle Units 3 & 4 Principal $2,721,597,857 $1,120,000,000 $1,601,597,857 Capitalized Interest 335,471,604 60,627,989 274,843,615 $3,057,069,461 $1,180,627,989 $1,876,441,472 Purpose/Use of Proceeds Approved(c) Advanced Remaining Amount Vogtle Units 3 & 4 Principal $2,721,597,857 $1,420,000,000 $1,301,597,857 Capitalized Interest(b) 335,471,604 99,557,046 235,914,558 $3,057,069,461 $1,519,557,046 $1,537,512,415 Purpose/Use of Proceeds Approved Advanced Remaining Amount Vogtle Units 3 & 4 Principal $2,721,597,857 $1,120,000,000 $1,601,597,857 Capitalized Interest 335,471,604 60,627,989 274,843,615 $3,057,069,461 $1,180,627,989 $1,876,441,472

Renewed $150 million bilateral credit facility with J.P. Morgan Chase Bank. 2-year term to October 2018. Provides letter of credit enhancement for Series 2009 tax-exempt VRDBs. Next DOE loan advance for Vogtle 3&4 will be in December 2016. Currently expected to be $150 million. 2017 (potentially as early as Q2) – Refunding $122 million of tax-exempt auction rate securities; timing subject to short-term interest rate moves. Late 2017 – Refunding of ~$400 million tax-exempt fixed rate bonds, callable on January 1, 2018. Recent and Upcoming Financing Activities 13

$110M CFC Unsecured ($210M facility reduced to $110M) $140M CFC Incremental Secured Term Loan Commitment(a) Time Now Plus Optional Term Out Until 2043 (a) Issued under a $250 million secured term loan agreement, however outstanding advances under the CFC $110 million line of credit reduce the availability to borrow under this secured term loan agreement. $150 Million JP Morgan Line of Credit Renewal Extended to October 2018 14 NRUCFC 235 $ CoBank 150 $ Bank of Tokyo - Mitsubishi UFJ 125 $ Mizuho Bank 100 $ Bank of America 100 $ Royal Bank of Canada 100 $ Bank of Montreal 100 $ Wells Fargo Bank 50 $ Fifth Third Bank 50 $ Goldman Sachs Bank 50 $ U.S. Bank 50 $ BB&T 50 $ Regions Bank 50 $

Rate Structure Assures Recovery of All Costs + Margin Formulary Rate under Wholesale Power Contract Minimum MFI requirement of 1.10x under First Mortgage Indenture Expense Type Components Recovery Timeframe Variable Fuel, Variable O&M 30 – 60 days Fixed Margin, Interest, Depreciation, Fixed O&M, A&G Billed on levelized annual budget Trued up to actuals at year end Oglethorpe budgets conservatively Key Points: Cost inputs not subject to any regulatory approvals. Formula changes subject to RUS & DOE approval. Prior period adjustment mechanism covers any year-end shortfall below required 1.10 MFI (board approval not required). Margin Coverage (projected) 15 1.10 1.10 1.12 1.14 1.14 1.14 1.14 1.14 1.14 1.14 $19.1 $19.3 $26.4 $33.7 $37.7 $39.3 $41.5 $46.6 $48.3 $50.5 $0.0 $20.0 $40.0 $60.0 1.05 1.10 1.15 1.20 2007 2008 2009 2010 2011 2012 2013 2014 2015 2016 Net Margin (MM) MFI Coverage

Income Statement Excerpts 16 Margins for Interest ratio is calculated on an annual basis and is determined by dividing Oglethorpe’s Margins for Interest by Interest Charges, both as defined in Oglethorpe’s First Mortgage Indenture. The Indenture obligates Oglethorpe to establish and collect rates that, subject to any necessary regulatory approvals, are reasonably expected to yield a Margins for Interest ratio equal to at least 1.10x for each fiscal year. In addition, the Indenture requires Oglethorpe to show that it has met this requirement for certain historical periods as a condition for issuing additional obligations under the Indenture. Oglethorpe increased its Margins for Interest ratio to 1.14x each year, starting in 2010, above the minimum 1.10x ratio required by the Indenture, and the 2016 budget also includes a 1.14x MFI ratio. Oglethorpe’s Board of Directors will continue to evaluate margin coverage throughout the Vogtle construction period and may chose to further increase, or decrease, the Margins for Interest ratio in the future, although not below 1.10. Nine Months Ended Year Ended September 30, December 31, ($ in thousands) 2016 2015 2015 2014 2013 Statement of Revenues and Expenses: Operating Revenues: Sales to Members $1,158,134 $938,047 $1,219,052 $1,314,869 $1,166,618 Sales to Non-Members 383 114,136 130,773 93,294 78,758 Operating Expenses 942,347 851,142 1,092,367 1,148,766 1,013,852 Other Income 43,887 37,377 52,030 46,371 43,433 Net Interest Charges 197,552 196,289 261,147 259,133 233,477 Net Margin $62,505 $42,129 $48,341 $46,635 $41,480 Margins for Interest Ratio(a) n/a n/a 1.14x 1.14x 1.14x Sales to Members Average Power Cost (cents/kWh) 5.82 6.47 6.64 6.52 6.29 Sales to Members (MWh) 19,886,944 14,488,210 18,371,558 20,154,108 18,549,886

Balance Sheet Excerpts (a) The equity ratio is calculated, pursuant to Oglethorpe’s First Mortgage Indenture, by dividing patronage capital and membership fees by total capitalization plus unamortized debt issuance costs and bond discounts and long-term debt due within one year (Total Long-Term Debt and Equities in the table above). Oglethorpe has no financial covenant that requires it to maintain a minimum equity ratio; however, a covenant in the Indenture restricts distributions of equity (patronage capital) to its Members if its equity ratio is below 20%. Oglethorpe also has a covenant in two credit agreements that currently requires a minimum total patronage capital of $675 million. The equity ratio is less than that of many investor-owned utilities because Oglethorpe operates on a not-for-profit basis and has a significant amount of authority to set and change rates to ensure sufficient cost recovery to produce margins to meet financial coverage requirements. 17 September 30, December 31, ($ in thousands) 2016 2015 2014 Balance Sheet Data: Assets: Electric Plant: Net Plant in Service $4,683,334 $4,670,310 $4,582,551 CWIP 3,126,508 2,868,669 2,374,392 Nuclear Fuel 366,698 373,145 369,529 Total Electric Plant 8,176,540 7,912,124 7,326,472 Investments, Current Assets and Deferred Charges 2,405,223 2,147,659 2,122,348 Total Assets $10,581,763 $10,059,783 $9,448,820 Capitalization: Patronage Capital and Membership Fees $871,970 $809,465 $761,124 Accumulated Other Comprehensive Margin (Deficit) 416 58 468 Subtotal $872,386 $809,523 $761,592 Long-term Debt and Obligations under Capital Leases $7,979,786 $7,387,655 7,116,033 Other 18,459 17,561 16,434 Total Capitalization 8,870,631 8,214,739 7,894,059 Plus: Unamortized debt issuance costs and bond discounts on LT debt 102,037 97,988 101,939 Plus: Long-term Debt and Capital Leases due within one year 153,274 189,840 160,754 Total Long-Term Debt and Equities $9,125,942 $8,502,567 $8,156,752 Equity Ratio(a) 9.6% 9.5% 9.3%

Oglethorpe’s Available Liquidity as of November 7, 2016 Represents 654 days of liquidity on hand (excluding Cushion of Credit). 18 In addition, as of October 31, Oglethorpe had $464.9 million on deposit in the RUS Cushion of Credit Account. The RUS Cushion of Credit Account is designated as restricted cash and investments and can only be used to pay debt service on RUS guaranteed loans. (a) Borrowings Detail $251.5 MM Letter of Credit Support for VRDBs/T.A. Smith $177.2 MM Vogtle Interim Financing $2.0 MM Vogtle Hedging - 500 1,000 1,500 2,000 Total Credit Facilities Less Borrowings Available Credit Facilities Capacity Cash Total Liquidity $1,610 $431 $1,179 $318 $1,497 (Millions)

Liquidity Net Margin Wholesale Power Cost Interim Financing Balance Sheet Electric Plant Average Cost of Funds: 0.66% Secured LT Debt (9.30.2016): $8.1 billion Weighted Average Cost: 4.36% Equity/Capitalization Ratio (9.30.2016): 9.6% 2016 1.14 MFI September 30, 2016 (dollars in millions) 2016 Cost of Power Sales to Members (excluding Rate Management Program). Additional Member Collections for Rate Management Programs. 19 2016 2016 Long Term Debt Actuals Forecast ($200) $0 $200 $400 $600 DOE Taxable RUS $525 $250 $86 $149 ($ Millions) Actual Issuance Forecasted Issuance Actual Repayment Forecasted Repayment Existing Facilities (CP), $7 Vogtle 3 & 4 Interim Financing (CP) , $149 $1,000 1,000 $1,610 $1,610 $0 $250 $500 $750 $1,000 $1,250 $1,500 $1,750 $2,000 $2,250 $2,500 Jan Feb Mar Apr May Jun Jul Aug Sep Oct Nov Dec Borrowings (Mil) Cash Borrowings CP Availability Total Available Lines of Credit Cash Balances (Mil) 4.0 4.5 5.0 5.5 6.0 6.5 7.0 7.5 8.0 Budget YTD Actual YTD 6.01 5.76 6.08 5.82 ¢/kWh $- $20 $40 $60 $80 Jan Feb Mar Apr May Jun Jul Aug Sep Oct Nov Dec Millions Actual Budget $0 $1 $2 $3 $4 $5 $6 $7 $8 $9 YE 2015 9/30/2016 $4.67 $4.68 $0.37 $0.37 $2.87 $3.13 (Billions) Construction Work in Progress Nuclear Fuel Electric Plant in Service Total Assets ($ Millions) $10,060 $10,582

A link to this presentation will be posted on Oglethorpe’s website www.opc.com. Oglethorpe’s SEC filings, including its annual reports on Form 10-K, quarterly reports on Form 10-Q, current reports on Form 8-K are made available on its website. Member information is filed as an exhibit to Form 10-Q for the first quarter of each year. (Exhibits are available on EDGAR but not on Oglethorpe’s website.) For additional information please contact: Additional Information 20 Betsy Higgins Executive Vice President and Chief Financial Officer betsy.higgins@opc.com 770-270-7168

