Attached files
| file | filename |
|---|---|
| EX-99.1 - EXHIBIT 99.1 - CCO HOLDINGS LLC | ccoh9302016exh991-quarterl.htm |
| EX-32.2 - EXHIBIT 32.2 - CCO HOLDINGS LLC | ccoh9302016exh-322.htm |
| EX-32.1 - EXHIBIT 32.1 - CCO HOLDINGS LLC | ccoh9302016exh-321.htm |
| EX-31.2 - EXHIBIT 31.2 - CCO HOLDINGS LLC | ccoh9302016exh-312.htm |
| EX-31.1 - EXHIBIT 31.1 - CCO HOLDINGS LLC | ccoh9302016exh-311.htm |
UNITED STATES
SECURITIES AND EXCHANGE COMMISSION
SECURITIES AND EXCHANGE COMMISSION
Washington, D.C. 20549
______________
FORM 10-Q
______________
(Mark One) | ||
x | QUARTERLY REPORT PURSUANT TO SECTION 13 OR 15(d) OF THE SECURITIES EXCHANGE ACT OF 1934 | |
For the quarterly period ended September 30, 2016 | ||
or | ||
o | TRANSITION REPORT PURSUANT TO SECTION 13 OR 15(d) OF THE SECURITIES EXCHANGE ACT OF 1934 | |
For the Transition Period From to
Commission File Number: | 001-37789 |
333-112593-01 | |
CCO Holdings, LLC
CCO Holdings Capital Corp.
(Exact name of registrant as specified in its charter)
Delaware | 86-1067239 | |
Delaware | 20-0257904 | |
(State or other jurisdiction of incorporation or organization) | (I.R.S. Employer Identification Number) | |
400 Atlantic Street Stamford, Connecticut 06901 | (203) 905-7801 | |
(Address of principal executive offices including zip code) | (Registrant’s telephone number, including area code) | |
Indicate by check mark whether the registrant (1) has filed all reports required to be filed by Section 13 or 15(d) of the Securities Exchange Act of 1934 during the preceding 12 months (or for such shorter period that the registrant was required to file such reports), and (2) has been subject to such filing requirements for the past 90 days. Yes x No o
Indicate by check mark whether the registrants have submitted electronically and posted on their corporate website, if any, every Interactive Data File required to be submitted and posted pursuant to Rule 405 of Regulation S-T (§232.405 of this chapter) during the preceding 12 months (or for such shorter period that the registrants were required to submit and post such files). Yes x No o
Indicate by check mark whether the registrant is a large accelerated filer, an accelerated filer, a non-accelerated filer, or a smaller reporting company. See definition of “large accelerated filer,” “accelerated filer,” and “smaller reporting company” in Rule 12b-2 of the Exchange Act.
Large accelerated filer o Accelerated filer o Non-accelerated filer x Smaller reporting company o
Indicate by check mark whether the registrant is a shell company (as defined in Rule 12b-2 of the Act). Yes o No x
Number of shares of common stock of CCO Holdings Capital Corporation outstanding as of September 30, 2016: 1
CCO HOLDINGS, LLC
CCO HOLDINGS CAPITAL CORP.
QUARTERLY REPORT ON FORM 10-Q FOR THE PERIOD ENDED SEPTEMBER 30, 2016
QUARTERLY REPORT ON FORM 10-Q FOR THE PERIOD ENDED SEPTEMBER 30, 2016
TABLE OF CONTENTS
Page No. | ||||
This quarterly report on Form 10-Q is for the three and nine months ended September 30, 2016. The United States Securities and Exchange Commission (“SEC”) allows us to “incorporate by reference” information that we file with the SEC, which means that we can disclose important information to you by referring you directly to those documents. In this quarterly report, “CCO Holdings,” “we,” “us” and “our” refer to CCO Holdings, LLC and its subsidiaries.
i
Explanatory Note
On May 18, 2016, Charter Communications, Inc. (formerly known as CCH I, LLC, or “Charter,” an indirect parent company of CCO Holdings, LLC) completed its previously reported merger transactions among Charter, Time Warner Cable Inc. (“Legacy TWC”), Charter Communications, Inc. (“Legacy Charter”), and certain other subsidiaries of Charter (the “TWC Transaction”). Also on May 18, 2016, Charter completed its previously reported acquisition of Bright House Networks, LLC (“Legacy Bright House”) from Advance/Newhouse Partnership (the “Bright House Transaction,” and, together with the TWC Transaction, the “Transactions”). As a result of the Transactions, Charter became the new public parent company that holds the combined operations of Legacy Charter, Legacy TWC and Legacy Bright House and was renamed Charter Communications, Inc. Substantially all of the operations acquired in the Transactions were contributed down to CCO Holdings. The financial statements presented in this quarterly report reflect the operations of CCO Holdings as a subsidiary of Legacy Charter through May 17, 2016 and CCO Holdings as a subsidiary of Charter on and after May 18, 2016. See Part I, Item 1. Financial Statements, Notes to Consolidated Financial Statements, Note 2, “Mergers and Acquisitions - Selected Pro Forma Financial Information” for certain financial information presented as if the Transactions had closed on January 1, 2015. Also see Exhibit 99.1 in this Quarterly Report on Form 10-Q for the three and nine months ended September 30, 2016 for pro forma financial information for each quarter of 2015 and the first and second quarter of 2016. Throughout this report references to the “Company” or to “CCO Holdings” refer to the combined company following the completion of the Transactions.
Upon closing of the TWC Transaction, the CCOH Safari, LLC notes became obligations of CCO Holdings and CCO Holdings Capital Corp., and the CCO Safari II, LLC notes and CCO Safari III, LLC credit facilities became obligations of Charter Communications Operating, LLC (“Charter Operating”) and Charter Communications Operating Capital Corp. CCOH Safari, LLC merged into CCO Holdings and CCO Safari II, LLC and CCO Safari III, LLC merged into Charter Operating.
ii
CAUTIONARY STATEMENT REGARDING FORWARD-LOOKING STATEMENTS:
This quarterly report includes forward-looking statements within the meaning of Section 27A of the Securities Act of 1933, as amended (the “Securities Act”), and Section 21E of the Securities Exchange Act of 1934, as amended (the “Exchange Act”), regarding, among other things, our plans, strategies and prospects, both business and financial including, without limitation, the forward-looking statements set forth in the “Results of Operations” and “Liquidity and Capital Resources” sections under Part I, Item 2. “Management’s Discussion and Analysis of Financial Condition and Results of Operations” in this quarterly report. Although we believe that our plans, intentions and expectations as reflected in or suggested by these forward-looking statements are reasonable, we cannot assure you that we will achieve or realize these plans, intentions or expectations. Forward-looking statements are inherently subject to risks, uncertainties and assumptions including, without limitation, the factors described under “Risk Factors” under Part II, Item 1A of this quarterly report on Form 10-Q. Many of the forward-looking statements contained in this quarterly report may be identified by the use of forward-looking words such as “believe,” “expect,” “anticipate,” “should,” “planned,” “will,” “may,” “intend,” “estimated,” “aim,” “on track,” “target,” “opportunity,” “tentative,” “positioning,” “designed,” “create,” “predict,” “project,” “initiatives,” “seek,” “would,” “could,” “continue,” “ongoing,” “upside,” “increases” and “potential,” among others. Important factors that could cause actual results to differ materially from the forward-looking statements we make in this quarterly report are set forth in this quarterly report on Form 10-Q, in our annual report on Form 10-K, and in other reports or documents that we file from time to time with the SEC, and include, but are not limited to:
Risks Related to the recently completed Transactions:
• | our ability to promptly, efficiently and effectively integrate acquired operations; |
• | managing a significantly larger company than before the completion of the Transactions; |
• | our ability to achieve the synergies and value creation contemplated by the Transactions; |
• | diversion of management time on issues related to the integration of the Transactions; |
• | changes in Legacy Charter, Legacy TWC or Legacy Bright House operations’ businesses, future cash requirements, capital requirements, results of operations, revenues, financial condition and/or cash flows; |
• | disruption in our business relationships as a result of the Transactions; |
• | the increase in indebtedness as a result of the Transactions, which will increase interest expense and may decrease our operating flexibility; |
• | operating costs and business disruption that may be greater than expected; |
• | the ability to retain and hire key personnel and maintain relationships with providers or other business partners; and |
• | costs, disruptions and possible limitations on operating flexibility related to, and our ability to comply with, regulatory conditions applicable to us as a result of the Transactions. |
Risks Related to Our Business
• | our ability to sustain and grow revenues and cash flow from operations by offering video, Internet, voice, advertising and other services to residential and commercial customers, to adequately meet the customer experience demands in our markets and to maintain and grow our customer base, particularly in the face of increasingly aggressive competition, the need for innovation and the related capital expenditures; |
• | the impact of competition from other market participants, including but not limited to incumbent telephone companies, direct broadcast satellite operators, wireless broadband and telephone providers, digital subscriber line (“DSL”) providers, fiber to the home providers, video provided over the Internet by (i) market participants that have not historically competed in the multichannel video business, (ii) traditional multichannel video distributors, and (iii) content providers that have historically licensed cable networks to multichannel video distributors, and providers of advertising over the Internet; |
• | general business conditions, economic uncertainty or downturn, unemployment levels and the level of activity in the housing sector; |
• | our ability to obtain programming at reasonable prices or to raise prices to offset, in whole or in part, the effects of higher programming costs (including retransmission consents); |
• | our ability to develop and deploy new products and technologies including our cloud-based user interface, Spectrum Guide®, and downloadable security for set-top boxes, and any other cloud-based consumer services and service platforms; |
• | the effects of governmental regulation on our business or potential business combination transactions; |
• | any events that disrupt our networks, information systems or properties and impair our operating activities or our reputation; |
• | the availability and access, in general, of funds to meet our debt obligations prior to or when they become due and to fund our operations and necessary capital expenditures, either through (i) cash on hand, (ii) free cash flow, or (iii) access to the capital or credit markets; and |
iii
• | our ability to comply with all covenants in our indentures and credit facilities, any violation of which, if not cured in a timely manner, could trigger a default of our other obligations under cross-default provisions. |
All forward-looking statements attributable to us or any person acting on our behalf are expressly qualified in their entirety by this cautionary statement. We are under no duty or obligation to update any of the forward-looking statements after the date of this quarterly report.
iv
PART I. FINANCIAL INFORMATION
Item 1. Financial Statements.
CCO HOLDINGS, LLC AND SUBSIDIARIES
CONSOLIDATED BALANCE SHEETS
(dollars in millions)
CONSOLIDATED BALANCE SHEETS
(dollars in millions)
September 30, 2016 | December 31, 2015 | ||||||
(unaudited) | |||||||
ASSETS | |||||||
CURRENT ASSETS: | |||||||
Cash and cash equivalents | $ | 996 | $ | 5 | |||
Accounts receivable, less allowance for doubtful accounts of | |||||||
$134 and $21, respectively | 1,229 | 264 | |||||
Prepaid expenses and other current assets | 351 | 55 | |||||
Total current assets | 2,576 | 324 | |||||
INVESTMENT IN CABLE PROPERTIES: | |||||||
Property, plant and equipment, net of accumulated | |||||||
depreciation of $9,486 and $6,509, respectively | 32,657 | 8,317 | |||||
Franchises | 66,245 | 6,006 | |||||
Customer relationships, net | 15,439 | 856 | |||||
Goodwill | 30,165 | 1,168 | |||||
Total investment in cable properties, net | 144,506 | 16,347 | |||||
LOANS RECEIVABLE - RELATED PARTY | — | 693 | |||||
OTHER NONCURRENT ASSETS | 1,172 | 116 | |||||
Total assets | $ | 148,254 | $ | 17,480 | |||
LIABILITIES AND MEMBER’S EQUITY | |||||||
CURRENT LIABILITIES: | |||||||
Accounts payable and accrued liabilities | $ | 6,004 | $ | 1,476 | |||
Current portion of long-term debt | 2,050 | — | |||||
Payables to related party | 399 | 331 | |||||
Total current liabilities | 8,453 | 1,807 | |||||
LONG-TERM DEBT | 59,946 | 13,945 | |||||
LOANS PAYABLE - RELATED PARTY | 640 | 333 | |||||
DEFERRED INCOME TAXES | 32 | 28 | |||||
OTHER LONG-TERM LIABILITIES | 2,905 | 45 | |||||
MEMBER’S EQUITY: | |||||||
Member’s equity | 76,261 | 1,335 | |||||
Accumulated other comprehensive loss | (8 | ) | (13 | ) | |||
Total CCO Holdings member’s equity | 76,253 | 1,322 | |||||
Noncontrolling interests | 25 | — | |||||
Total member’s equity | 76,278 | 1,322 | |||||
Total liabilities and member’s equity | $ | 148,254 | $ | 17,480 | |||
The accompanying notes are an integral part of these consolidated financial statements.
1
CCO HOLDINGS, LLC AND SUBSIDIARIES
CONSOLIDATED STATEMENTS OF OPERATIONS
(dollars in millions)
CONSOLIDATED STATEMENTS OF OPERATIONS
(dollars in millions)
Unaudited
Three Months Ended September 30, | Nine Months Ended September 30, | ||||||||||||||
2016 | 2015 | 2016 | 2015 | ||||||||||||
REVENUES | $ | 10,037 | $ | 2,450 | $ | 18,728 | $ | 7,242 | |||||||
COSTS AND EXPENSES: | |||||||||||||||
Operating costs and expenses (exclusive of items shown separately below) | 6,490 | 1,620 | 12,173 | 4,802 | |||||||||||
Depreciation and amortization | 2,435 | 538 | 4,409 | 1,580 | |||||||||||
Other operating (income) expenses, net | 193 | 19 | (20 | ) | 69 | ||||||||||
9,118 | 2,177 | 16,562 | 6,451 | ||||||||||||
Income from operations | 919 | 273 | 2,166 | 791 | |||||||||||
OTHER EXPENSES: | |||||||||||||||
Interest expense, net | (729 | ) | (192 | ) | (1,391 | ) | (648 | ) | |||||||
Loss on extinguishment of debt | — | — | (110 | ) | (126 | ) | |||||||||
Gain (loss) on financial instruments, net | 71 | (5 | ) | 16 | (10 | ) | |||||||||
Other expense, net | (2 | ) | — | (2 | ) | — | |||||||||
(660 | ) | (197 | ) | (1,487 | ) | (784 | ) | ||||||||
Income before income taxes | 259 | 76 | 679 | 7 | |||||||||||
Income tax benefit | 7 | 219 | — | 212 | |||||||||||
Consolidated net income | 266 | 295 | 679 | 219 | |||||||||||
Less: Net income attributable to noncontrolling interests | (1 | ) | (13 | ) | (1 | ) | (34 | ) | |||||||
Net income attributable to CCO Holdings member | $ | 265 | $ | 282 | $ | 678 | $ | 185 | |||||||
The accompanying notes are an integral part of these consolidated financial statements.
2
CCO HOLDINGS, LLC AND SUBSIDIARIES
CONSOLIDATED STATEMENTS OF COMPREHENSIVE INCOME
(dollars in millions)
Unaudited
Three Months Ended September 30, | Nine Months Ended September 30, | ||||||||||||||
2016 | 2015 | 2016 | 2015 | ||||||||||||
Consolidated net income | $ | 266 | $ | 295 | $ | 679 | $ | 219 | |||||||
Net impact of interest rate derivative instruments, net of tax | 2 | 2 | 6 | 7 | |||||||||||
Foreign currency translation adjustment | (1 | ) | — | (1 | ) | — | |||||||||
Consolidated comprehensive income | 267 | 297 | 684 | 226 | |||||||||||
Less: Net income attributable to noncontrolling interests | (1 | ) | (13 | ) | (1 | ) | (34 | ) | |||||||
Comprehensive income attributable to CCO Holdings member | $ | 266 | $ | 284 | $ | 683 | $ | 192 | |||||||
The accompanying notes are an integral part of these consolidated financial statements.
3
CCO HOLDINGS, LLC AND SUBSIDIARIES
CONSOLIDATED STATEMENTS OF CHANGES IN MEMBER’S EQUITY
CONSOLIDATED STATEMENTS OF CHANGES IN MEMBER’S EQUITY
(dollars in millions)
Unaudited
Member’s Equity | Accumulated Other Comprehensive Loss | Total CCO Holdings Member’s Equity | Noncontrolling Interests | Total Member’s Equity | |||||||||||
BALANCE, December 31, 2014 | $ | 534 | $ | (22 | ) | $ | 512 | $ | 436 | $ | 948 | ||||
Net income | 185 | — | 185 | 34 | 219 | ||||||||||
Changes in accumulated other comprehensive loss, net | — | 7 | 7 | — | 7 | ||||||||||
Stock compensation expense, net | 58 | — | 58 | — | 58 | ||||||||||
Contributions from parent | 15 | — | 15 | — | 15 | ||||||||||
Distributions to parent | (73 | ) | — | (73 | ) | — | (73 | ) | |||||||
BALANCE, September 30, 2015 | $ | 719 | $ | (15 | ) | $ | 704 | $ | 470 | $ | 1,174 | ||||
BALANCE, December 31, 2015 | $ | 1,335 | $ | (13 | ) | $ | 1,322 | $ | — | $ | 1,322 | ||||
Net income | 678 | — | 678 | 1 | 679 | ||||||||||
Changes in accumulated other comprehensive loss, net | — | 5 | 5 | — | 5 | ||||||||||
Stock compensation expense, net | 168 | — | 168 | — | 168 | ||||||||||
Accelerated vesting of equity awards | 202 | — | 202 | — | 202 | ||||||||||
Contributions from parent | 478 | — | 478 | — | 478 | ||||||||||
Distributions to parent | (3,084 | ) | — | (3,084 | ) | — | (3,084 | ) | |||||||
Contribution of net assets acquired in the TWC Transaction | 87,530 | — | 87,530 | — | 87,530 | ||||||||||
Contribution of net assets acquired in the Bright House Transaction | 12,156 | — | 12,156 | — | 12,156 | ||||||||||
Merger of parent companies and the Safari Escrow Entities | (23,202 | ) | — | (23,202 | ) | — | (23,202 | ) | |||||||
Contribution of noncontrolling interests | — | — | — | 24 | 24 | ||||||||||
BALANCE, September 30, 2016 | $ | 76,261 | $ | (8 | ) | $ | 76,253 | $ | 25 | $ | 76,278 | ||||
The accompanying notes are an integral part of these consolidated financial statements.
4
CCO HOLDINGS, LLC AND SUBSIDIARIES
CONSOLIDATED STATEMENTS OF CASH FLOWS
(dollars in millions)
CONSOLIDATED STATEMENTS OF CASH FLOWS
(dollars in millions)
Unaudited
Nine Months Ended September 30, | ||||||||
2016 | 2015 | |||||||
CASH FLOWS FROM OPERATING ACTIVITIES: | ||||||||
Consolidated net income | $ | 679 | $ | 219 | ||||
Adjustments to reconcile consolidated net income to net cash flows from operating activities: | ||||||||
Depreciation and amortization | 4,409 | 1,580 | ||||||
Stock compensation expense | 168 | 58 | ||||||
Accelerated vesting of equity awards | 202 | — | ||||||
Noncash interest (income) expense, net | (148 | ) | 21 | |||||
Other pension benefits | (533 | ) | — | |||||
Loss on extinguishment of debt | 110 | 126 | ||||||
(Gain) loss on financial instruments, net | (16 | ) | 10 | |||||
Deferred income taxes | (14 | ) | (216 | ) | ||||
Other, net | (10 | ) | 4 | |||||
Changes in operating assets and liabilities, net of effects from acquisitions: | ||||||||
Accounts receivable | (2 | ) | (4 | ) | ||||
Prepaid expenses and other assets | 105 | (20 | ) | |||||
Accounts payable, accrued liabilities and other | 483 | 15 | ||||||
Receivables from and payables to related party, including deferred management fees | 105 | 28 | ||||||
Net cash flows from operating activities | 5,538 | 1,821 | ||||||
CASH FLOWS FROM INVESTING ACTIVITIES: | ||||||||
Purchases of property, plant and equipment | (3,437 | ) | (1,292 | ) | ||||
Change in accrued expenses related to capital expenditures | 86 | 11 | ||||||
Purchases of cable systems, net of cash acquired | (7 | ) | — | |||||
Change in restricted cash and cash equivalents | — | 3,514 | ||||||
Other, net | (8 | ) | (15 | ) | ||||
Net cash flows from investing activities | (3,366 | ) | 2,218 | |||||
CASH FLOWS FROM FINANCING ACTIVITIES: | ||||||||
Borrowings of long-term debt | 5,997 | 3,771 | ||||||
Repayments of long-term debt | (4,120 | ) | (7,411 | ) | ||||
Repayments loans payable - related parties | (253 | ) | (317 | ) | ||||
Payments for debt issuance costs | (283 | ) | (24 | ) | ||||
Contributions from parent | 478 | 15 | ||||||
Distributions to parent | (3,084 | ) | (73 | ) | ||||
Proceeds from termination of interest rate derivatives | 88 | — | ||||||
Other, net | (4 | ) | — | |||||
Net cash flows from financing activities | (1,181 | ) | (4,039 | ) | ||||
NET INCREASE IN CASH AND CASH EQUIVALENTS | 991 | — | ||||||
CASH AND CASH EQUIVALENTS, beginning of period | 5 | — | ||||||
CASH AND CASH EQUIVALENTS, end of period | $ | 996 | $ | — | ||||
CASH PAID FOR INTEREST | $ | 1,479 | $ | 657 | ||||
The accompanying notes are an integral part of these consolidated financial statements.
5
CCO HOLDINGS, LLC AND SUBSIDIARIES
NOTES TO CONSOLIDATED FINANCIAL STATEMENTS
(UNAUDITED)
(dollars in millions, except where indicated)
1. Organization and Basis of Presentation
Organization
CCO Holdings, LLC (“CCO Holdings”) is a holding company whose principal assets are the equity interests in its operating subsidiaries. CCO Holdings is a direct subsidiary of CCH I Holdings, LLC (“CCH I”), which is an indirect subsidiary of Charter Communications, Inc. (“Charter”), Charter Communications Holdings, LLC (“Charter Holdings”) and Spectrum Management Holding Company, LLC (“Spectrum Holdings”). The consolidated financial statements include the accounts of CCO Holdings and all of its subsidiaries where the underlying operations reside, which are collectively referred to herein as the “Company.” All significant intercompany accounts and transactions among consolidated entities have been eliminated. Charter, Charter Holdings and Spectrum Holdings have performed financing, cash management, treasury and other services for CCO Holdings on a centralized basis. Changes in member’s equity in the consolidated balance sheets related to these activities have been considered cash receipts (contributions) and payments (distributions) for purposes of the consolidated statements of cash flows and are reflected in financing activities.
The Company is the second largest cable operator in the United States and a leading broadband communications company providing video, Internet and voice services to residential and business customers. The Company also sells video and online advertising inventory to local, regional and national advertising customers, and networking and enterprise-class, cloud-enabled hosting, managed applications and transport services to business customers and owns and operates regional sports networks and local sports, news and lifestyle channels. The Company’s residential services also include security and home management services.
The Company’s operations are managed and reported to its Chief Executive Officer (“CEO”), the Company’s chief operating decision maker, on a consolidated basis. The CEO assesses performance and allocates resources based on the consolidated results of operations. Under this organizational and reporting structure, the Company has one reportable segment, cable services.
Basis of Presentation
The accompanying consolidated financial statements have been prepared in accordance with U.S. generally accepted accounting principles (“GAAP”) and the rules and regulations of the Securities and Exchange Commission (the “SEC”). Accordingly, certain information and footnote disclosures typically included in the Company’s Annual Report filed as Exhibit 99.2 in the Company’s Current Report on Form 8-K filed with the SEC on June 6, 2016 have been condensed or omitted for this quarterly report. The accompanying consolidated financial statements are unaudited and are subject to review by regulatory authorities. However, in the opinion of management, such financial statements include all adjustments, which consist of only normal recurring adjustments, necessary for a fair presentation of the results for the periods presented. Interim results are not necessarily indicative of results for a full year.
The preparation of financial statements in conformity with GAAP requires management to make estimates and assumptions that affect the reported amounts of assets and liabilities and disclosure of contingent assets and liabilities at the date of the financial statements and the reported amounts of revenues and expenses during the reporting period. Areas involving significant judgments and estimates include capitalization of labor and overhead costs; depreciation and amortization costs; purchase accounting valuations of assets and liabilities including, but not limited to, property, plant and equipment, intangibles and goodwill; pension benefits; income taxes; contingencies and programming expense. Actual results could differ from those estimates.
2. Mergers and Acquisitions
TWC Transaction
On May 18, 2016, the transactions contemplated by the Agreement and Plan of Mergers dated as of May 23, 2015 (the “Merger Agreement”), by and among Time Warner Cable Inc. (“Legacy TWC”), Charter Communications, Inc. prior to the closing of the Merger Agreement (“Legacy Charter”), CCH I, LLC, previously a wholly owned subsidiary of Legacy Charter (“New Charter”) and certain other subsidiaries of New Charter were completed (the “TWC Transaction,” and together with the Bright House Transaction described below, the “Transactions”). As a result of the TWC Transaction, New Charter became the new public parent company that holds the operations of the combined companies and was renamed Charter Communications, Inc.
6
CCO HOLDINGS, LLC AND SUBSIDIARIES
NOTES TO CONSOLIDATED FINANCIAL STATEMENTS
(UNAUDITED)
(dollars in millions, except where indicated)
Pursuant to the terms of the Merger Agreement, upon consummation of the TWC Transaction, each outstanding share of Legacy TWC common stock (other than Legacy TWC common stock held by Liberty Broadband Corporation (“Liberty Broadband”) and Liberty Interactive Corporation (“Liberty Interactive” and, collectively, the “Liberty Parties”)), was converted into the right to receive, at the option of each such holder of Legacy TWC common stock, either (a) $100 in cash and Charter Class A common stock equivalent to 0.5409 shares of Legacy Charter Class A common stock (the “Option A Consideration”) or (b) $115 in cash and Charter Class A common stock equivalent to 0.4562 shares of Legacy Charter Class A common stock (the “Option B Consideration”). The actual number of shares of Charter Class A common stock that Legacy TWC stockholders received, excluding the Liberty Parties, was calculated by multiplying the exchange ratios of 0.5409 or 0.4562 specified above by 0.9042 (the “Parent Merger Exchange Ratio”), which was also the exchange ratio that was used to determine the number of shares of Charter Class A common stock that Legacy Charter stockholders received per share of Legacy Charter Class A common stock. Such exchange ratio did not impact the aggregate value represented by the shares of Charter Class A common stock issued in the TWC Transaction; however, it did impact the actual number of shares issued in the TWC Transaction.
Out of approximately 277 million shares of TWC common stock outstanding at the closing of the TWC Transaction, excluding TWC common stock held by the Liberty Parties, approximately 274 million shares were converted into the right to receive the Option A Consideration and approximately 3 million shares were converted into the right to receive the Option B Consideration. The Liberty Parties received approximately one share of Charter Class A common stock for each share of Legacy TWC common stock they owned (equivalent to 1.106 shares of Legacy Charter Class A common stock multiplied by the Parent Merger Exchange Ratio).
As of the date of completion of the Transactions, the total value of the TWC Transaction was approximately $85 billion, including cash, equity and Legacy TWC assumed debt. The purchase price also included an estimated pre-combination vesting period fair value of $514 million for Legacy TWC equity awards converted into Charter awards upon closing of the TWC Transaction (“Converted TWC Awards”) and $69 million of cash paid to former Legacy TWC employees and non-employee directors who held equity awards, whether vested or not vested.
Bright House Transaction
Also, on May 18, 2016, Legacy Charter and Advance/Newhouse Partnership (“A/N”), the former parent of Bright House Networks, LLC (“Bright House”), completed their previously announced transaction, pursuant to a definitive Contribution Agreement (the “Contribution Agreement”), under which Charter acquired Bright House (the “Bright House Transaction”). Pursuant to the Bright House Transaction, Charter became the owner of the membership interests in Bright House and the other assets primarily related to Bright House (other than certain excluded assets and liabilities and non-operating cash). As of the date of acquisition, the purchase price totaled approximately $12.2 billion consisting of (a) $2.0 billion in cash, (b) 25 million convertible preferred units of Charter Holdings with a face amount of $2.5 billion that pay a 6% annual preferential dividend, (c) approximately 31.0 million common units of Charter Holdings that are exchangeable into Charter Class A common stock on a one-for-one basis and (d) one share of Charter Class B common stock.
Liberty Transaction
In connection with the TWC Transaction, Legacy Charter and Liberty Broadband completed their previously announced transactions pursuant to their investment agreement, in which Liberty Broadband purchased for cash approximately 22.0 million shares of Charter Class A common stock valued at $4.3 billion at the closing of the TWC Transaction to partially finance the cash portion of the TWC Transaction consideration, and in connection with the Bright House Transaction, Liberty Broadband purchased approximately 3.7 million shares of Charter Class A common stock valued at $700 million at the closing of the Bright House Transaction (the “Liberty Transaction”).
Financing for the Transactions
Charter partially financed the cash portion of the purchase price of the Transactions with additional indebtedness and cash on hand. In 2015, Legacy Charter issued $15.5 billion aggregate principal amount of CCO Safari II, LLC (“CCO Safari II”) senior secured notes, $3.8 billion aggregate principal amount of CCO Safari III, LLC (“CCO Safari III”) senior secured bank loans and $2.5 billion aggregate principal amount of CCOH Safari, LLC (“CCOH Safari” and collectively with CCO Safari II and CCO Safari III, the “Safari Escrow Entities”) senior unsecured notes. The net proceeds were initially deposited into escrow accounts. Upon closing of the TWC Transaction, the proceeds were released from escrow and the CCOH Safari notes became obligations of CCO
7
CCO HOLDINGS, LLC AND SUBSIDIARIES
NOTES TO CONSOLIDATED FINANCIAL STATEMENTS
(UNAUDITED)
(dollars in millions, except where indicated)
Holdings and CCO Holdings Capital Corp. (“CCO Holdings Capital”), and the CCO Safari II notes and CCO Safari III credit facilities became obligations of Charter Communications Operating, LLC (“Charter Operating”) and Charter Communications Operating Capital Corp. CCOH Safari merged into CCO Holdings and CCO Safari II and CCO Safari III merged into Charter Operating. In connection with the closing of the Bright House Transaction, Charter Operating closed on a $2.6 billion aggregate principal amount term loan A facility (“Term Loan A”). See Note 7.
Acquisition Accounting
The Transactions enable Charter to apply its operating strategy to a larger set of assets, accelerate product development and innovation through greater scale as well as more effectively compete in medium and large commercial markets. Substantially all of the operations acquired in the Transactions were contributed down to the Company. The operating results of Legacy TWC and Legacy Bright House have been included in the Company’s consolidated statements of operations for the period from the date of the Transactions through September 30, 2016. For the three and nine months ended September 30, 2016, revenues included in the Company’s consolidated statements of operations were $6.4 billion and $9.5 billion, respectively, and consolidated net income was $62 million and $434 million, respectively, for Legacy TWC. For the three and nine months ended September 30, 2016, revenues included in the Company’s consolidated statements of operations were $1.0 billion and $1.5 billion, respectively, and consolidated net income was $126 million and $167 million, respectively, for Legacy Bright House. Consolidated net income includes non-operating expenses such as interest expense and income taxes based on what is included in the respective legal entities and does not include allocations of additional corporate level non-operating expenses.
Charter applied acquisition accounting to the Transactions. The total purchase price was allocated to the identifiable tangible and intangible assets acquired and the liabilities assumed based on their estimated fair values. The fair values were primarily based on third-party valuations using assumptions developed by management and other information compiled by management including, but not limited to, future expected cash flows. The excess of the purchase price over those fair values was recorded as goodwill. Goodwill recognized in the Transactions is representative of resources that do not meet the definition of an identifiable intangible asset and include buy-side synergies, economies of scale of the combined operations, increased market share, assembled workforces and improved credit rating.
The fair values of the assets acquired and liabilities assumed were preliminarily determined using the income, cost and market approaches. The fair values were primarily based on significant inputs that are not observable in the market and thus represent a Level 3 measurement, other than long-term debt assumed in the TWC Transaction which represents a Level 1 measurement. See Note 10.
Property, plant and equipment was valued utilizing the cost approach. The cost approach considers the amount required to replace an asset by constructing or purchasing a new asset with similar utility, then adjusts the value in consideration of all forms of depreciation as of the appraisal date as described below:
• | Physical depreciation - the loss in value or usefulness attributable solely to use of the asset and physical causes such as wear and tear and exposure to the elements. |
• | Functional obsolescence - the loss in value due to factors inherent in the asset itself and due to changes in technology, design or process resulting in inadequacy, overcapacity, lack of functional utility or excess operating costs. |
• | Economic obsolescence - the loss in value due to unfavorable external conditions such as economics of the industry or geographic area, or change in ordinances. |
The cost approach relies on assumptions regarding current material and labor costs required to rebuild and repurchase significant components of property, plant and equipment along with assumptions regarding the age and estimated useful lives of property, plant and equipment.
Franchise rights and customer relationships were valued using an income approach model based on the present value of the estimated discrete future cash flows attributable to each of the intangible assets identified. See Note 6 to the consolidated financial statements in Exhibit 99.2 in the Company’s Current Report on Form 8-K filed with the SEC on June 6, 2016 for more information on the income approach model. The weighted average life of customer relationships acquired in the TWC Transaction and Bright House Transaction was 11 years and 10 years, respectively.
8
CCO HOLDINGS, LLC AND SUBSIDIARIES
NOTES TO CONSOLIDATED FINANCIAL STATEMENTS
(UNAUDITED)
(dollars in millions, except where indicated)
The fair value of equity investments was based on either applying implied multiples to estimated cash flows or utilizing a discounted cash flow model. The implied multiples were estimated based on precedent transactions and comparable companies. The discounted cash flow model required estimating the present value of future cash flows of the investee.
Legacy TWC long-term debt assumed was adjusted to fair value based on quoted market prices. At the acquisition date, the quoted market values of all but two of Legacy TWC’s bonds were higher than the principal amount of the related debt instrument, which resulted in the recognition of a net debt premium of approximately $2.4 billion. The quoted market value of a debt instrument is higher than the principal amount of the debt when the market interest rates are lower than the stated interest rate of the debt. This debt premium is amortized as a reduction to interest expense over the remaining life of the applicable debt.
Generally, no fair value adjustments were reflected in current assets and current liabilities as carrying value is estimated to approximate fair value because of the short-term nature of the items. However, fair value adjustments were reflected in other noncurrent assets and other long-term liabilities relating to contract-based assets and liabilities, capital lease obligations, deferred liabilities and pension liabilities. Out-of-market contract-based assets and liabilities relating to non-cancelable executory contracts and operating leases were recognized based on discounted cash flow models to the extent the terms of the non-cancelable contracts are favorable or unfavorable compared with the relative market terms of the same or similar contract at the acquisition date. The out-of-market element will be amortized as if the contract were consummated at market terms on the acquisition date. Capital lease obligations were measured at fair value based on the present value of amounts to be paid under the lease agreement using a market participant discount rate. Deferred liabilities were not recorded in acquisition accounting to the extent there was no associated payment obligation or substantive performance obligation. The pension liabilities assumed in the TWC Transaction are measured at fair value based on an actuarially determined projected benefit obligation, less the fair value of pension investments, as of the acquisition date. See Note 17 for fair value assumptions considered in acquisition accounting for the pension liabilities.
An adjustment was recorded for the deferred tax impact of acquisition accounting adjustments primarily related to property, plant and equipment, franchises, customer relationships and assumed Legacy TWC long-term debt. The incremental deferred tax liabilities were calculated primarily based on the tax effect of the step-up in book basis of net assets of Legacy TWC excluding the amount attributable to nondeductible goodwill. Deferred tax liabilities are recorded at Charter and not contributed down as the Company, and majority of its indirect subsidiaries, are limited liability companies that are not subject to income tax.
The Charter Class A common stock issued to Legacy TWC stockholders and Charter Holdings common units issued to A/N were valued based on the opening share price of Charter Class A common stock on the acquisition date. The convertible preferred units of Charter Holdings issued to A/N were valued at approximately $3.2 billion based on a binomial lattice model for convertible bonds that models the future changes in the common equity value of Charter. The valuation relies on management’s assumptions including risk-free interest rate, volatility and discount yield. The pre-combination vesting period fair value of the Converted TWC Awards was based on the portion of the requisite service period completed at the acquisition date by Legacy TWC employee award holders applied to the total fair value of the Converted TWC Awards. See Note 16 for fair value assumptions considered in acquisition accounting for the Converted TWC Awards.
9
CCO HOLDINGS, LLC AND SUBSIDIARIES
NOTES TO CONSOLIDATED FINANCIAL STATEMENTS
(UNAUDITED)
(dollars in millions, except where indicated)
The allocation of the purchase price to tangible and intangible assets and certain liabilities is preliminary and is subject to change based on finalization and review of such valuations. During the measurement period, the Company will continue to obtain information to assist in finalizing the fair value of net assets acquired, which may differ materially from the preliminary estimates. The Company will apply any measurement period adjustments, including any related impacts to net income (loss), in the reporting period in which the adjustments are determined. The tables below present the calculation of the purchase price and the preliminary allocation of the purchase price to the assets acquired and liabilities assumed in the Transactions.
TWC Purchase Price
Shares of Charter Class A common stock issued (including the Liberty Parties) (in millions) | 143.0 | ||
Charter Class A common stock closing price per share | $ | 224.91 | |
Fair value of Charter Class A common stock issued | $ | 32,164 | |
Cash paid to Legacy TWC stockholders (excluding the Liberty Parties) | $ | 27,770 | |
Pre-combination vesting period fair value of Converted TWC Awards | 514 | ||
Cash paid for Legacy TWC non-employee equity awards | 69 | ||
Total purchase price | $ | 60,517 | |
TWC Preliminary Allocation of Purchase Price
Cash and cash equivalents | $ | 1,058 | |
Current assets | 1,309 | ||
Property, plant and equipment | 21,431 | ||
Franchises | 53,395 | ||
Customer relationships | 13,700 | ||
Goodwill | 28,459 | ||
Other noncurrent assets | 1,061 | ||
Accounts payable and accrued liabilities | (3,752 | ) | |
Debt | (24,900 | ) | |
Deferred income taxes | (28,071 | ) | |
Other long-term liabilities | (3,169 | ) | |
Noncontrolling interests | (4 | ) | |
$ | 60,517 | ||
During the three months ended September 30, 2016, the Company made measurement period adjustments to the fair value of certain assets acquired and liabilities assumed in the TWC Transaction, including a decrease of $145 million to property, plant and equipment; an increase of $25 million to accrued liabilities; a decrease of $81 million to deferred income taxes; and an increase in other long-term liabilities of $2 million resulting in a net increase of $91 million to goodwill. The measurement period adjustment to property, plant and equipment also resulted in an increase of $12 million in depreciation expense relating to the prior quarter that was recorded in the third quarter of 2016. The Company expects to record additional measurement period adjustments in future periods.
10
CCO HOLDINGS, LLC AND SUBSIDIARIES
NOTES TO CONSOLIDATED FINANCIAL STATEMENTS
(UNAUDITED)
(dollars in millions, except where indicated)
Bright House Purchase Price
Charter Holdings common units issued to A/N (in millions) | 31.0 | ||
Charter Class A common stock closing price per share | $ | 224.91 | |
Fair value of Charter Holdings common units issued to A/N | $ | 6,971 | |
Fair value of Charter Holdings convertible preferred units issued to A/N | 3,163 | ||
Cash paid to A/N | 2,022 | ||
Total purchase price | $ | 12,156 | |
Bright House Preliminary Allocation of Purchase Price
Current assets | $ | 132 | |
Property, plant and equipment | 2,884 | ||
Franchises | 6,844 | ||
Customer relationships | 2,040 | ||
Goodwill | 534 | ||
Other noncurrent assets | 86 | ||
Accounts payable and accrued liabilities | (330 | ) | |
Other long-term liabilities | (12 | ) | |
Noncontrolling interests | (22 | ) | |
$ | 12,156 | ||
During the three months ended September 30, 2016, the Company made measurement period adjustments to the fair value of certain assets acquired and liabilities assumed in the Bright House Transaction, including a decrease of $382 million to property, plant and equipment and a corresponding increase of $382 million to goodwill. The measurement period adjustment to property, plant and equipment had an inconsequential impact on depreciation expense recorded in the prior quarter. The Company expects to record additional measurement period adjustments in future periods.
In connection with the Transactions, Charter contributed down to the Company the net assets and liabilities of TWC and Bright House except for the deferred tax liabilities of Charter, as noted above, and net assets of approximately $1.0 billion primarily comprised of cash and cash equivalents used as a source for the cash portion of the TWC purchase price.
11
CCO HOLDINGS, LLC AND SUBSIDIARIES
NOTES TO CONSOLIDATED FINANCIAL STATEMENTS
(UNAUDITED)
(dollars in millions, except where indicated)
Selected Pro Forma Financial Information
The following unaudited pro forma financial information of the Company is based on the historical consolidated financial statements of CCO Holdings, Legacy TWC and Legacy Bright House and is intended to provide information about how the Transactions and related financing may have affected the Company’s historical consolidated financial statements if they had closed as of January 1, 2015. The pro forma financial information below is based on available information and assumptions that the Company believes are reasonable. The pro forma financial information is for illustrative and informational purposes only and is not intended to represent or be indicative of what the Company’s financial condition or results of operations would have been had the transactions described above occurred on the date indicated. The pro forma financial information also should not be considered representative of the Company’s future financial condition or results of operations.
Three Months Ended September 30, | Nine Months Ended September 30, | ||||||||||
2015 | 2016 | 2015 | |||||||||
Revenues | $ | 9,342 | $ | 29,748 | $ | 27,813 | |||||
Net income attributable to CCO Holdings member | $ | 253 | $ | 1,112 | $ | 342 | |||||
3. Property, Plant and Equipment
Property, plant and equipment consists of the following as of September 30, 2016 and December 31, 2015:
September 30, 2016 | December 31, 2015 | ||||||
Cable distribution systems | $ | 22,942 | $ | 8,158 | |||
Customer premise equipment and installations | 11,916 | 4,632 | |||||
Vehicles and equipment | 1,178 | 379 | |||||
Buildings and improvements | 3,108 | 540 | |||||
Furniture, fixtures and equipment | 2,999 | 1,117 | |||||
42,143 | 14,826 | ||||||
Less: accumulated depreciation | (9,486 | ) | (6,509 | ) | |||
$ | 32,657 | $ | 8,317 | ||||
The Company periodically evaluates the estimated useful lives used to depreciate its assets and the estimated amount of assets that will be abandoned or have minimal use in the future. A significant change in assumptions about the extent or timing of future asset retirements, or in the Company’s use of new technology and upgrade programs, could materially affect future depreciation expense.
Depreciation expense for the three and nine months ended September 30, 2016 was $1.7 billion and $3.2 billion, respectively, and was $471 million and $1.4 billion for the three and nine months ended September 30, 2015, respectively. Property, plant and equipment preliminarily increased by $24.3 billion as a result of the Transactions. See Note 2.
12
CCO HOLDINGS, LLC AND SUBSIDIARIES
NOTES TO CONSOLIDATED FINANCIAL STATEMENTS
(UNAUDITED)
(dollars in millions, except where indicated)
4. Franchises, Goodwill and Other Intangible Assets
Indefinite-lived and finite-lived intangible assets consist of the following as of September 30, 2016 and December 31, 2015:
September 30, 2016 | December 31, 2015 | |||||||||||||||||||||||
Gross Carrying Amount | Accumulated Amortization | Net Carrying Amount | Gross Carrying Amount | Accumulated Amortization | Net Carrying Amount | |||||||||||||||||||
Indefinite-lived intangible assets: | ||||||||||||||||||||||||
Franchises | $ | 66,245 | $ | — | $ | 66,245 | $ | 6,006 | $ | — | $ | 6,006 | ||||||||||||
Goodwill | 30,165 | — | 30,165 | 1,168 | — | 1,168 | ||||||||||||||||||
Other intangible assets | 4 | — | 4 | 4 | — | 4 | ||||||||||||||||||
$ | 96,414 | $ | — | $ | 96,414 | $ | 7,178 | $ | — | $ | 7,178 | |||||||||||||
Finite-lived intangible assets: | ||||||||||||||||||||||||
Customer relationships | $ | 18,356 | $ | (2,917 | ) | $ | 15,439 | $ | 2,616 | $ | (1,760 | ) | $ | 856 | ||||||||||
Other intangible assets | 635 | (120 | ) | 515 | 173 | (82 | ) | 91 | ||||||||||||||||
$ | 18,991 | $ | (3,037 | ) | $ | 15,954 | $ | 2,789 | $ | (1,842 | ) | $ | 947 | |||||||||||
Amortization expense related to customer relationships and other intangible assets for the three and nine months ended September 30, 2016 was $748 million and $1.2 billion, respectively, and was $67 million and $205 million for the three and nine months ended September 30, 2015, respectively. Franchises, goodwill and customer relationships preliminarily increased by $60.2 billion, $29.0 billion and $15.7 billion, respectively, as a result of the Transactions. See Note 2.
The Company expects amortization expense on its finite-lived intangible assets will be as follows:
Three months ended December 31, 2016 | $ | 741 | ||
2017 | 2,773 | |||
2018 | 2,488 | |||
2019 | 2,201 | |||
2020 | 1,906 | |||
Thereafter | 5,845 | |||
$ | 15,954 | |||
Actual amortization expense in future periods will differ from these estimates as a result of new intangible asset acquisitions or divestitures, changes in useful lives, purchase accounting adjustments, impairments and other relevant factors.
5. Investments
In connection with the Transactions, the Company acquired approximately $508 million of Legacy TWC and Legacy Bright House equity-method and cost-method investments, which were adjusted to fair value as a result of applying acquisition accounting. The equity-method investments acquired and related ownership percentages as of September 30, 2016 include Sterling Entertainment Enterprises, LLC (“Sterling” - d/b/a SportsNet New York - 26.8% owned), MLB Network, LLC (“MLB Network” - 6.4% owned), iN Demand L.L.C. (“iN Demand” - 39.8% owned) and National Cable Communications LLC (“NCC” - 20.0% owned), among other less significant equity-method and cost-method investments acquired. Sterling and MLB Network are primarily engaged in the development of sports programming services. iN Demand provides programming on a video on demand, pay-per-view and subscription basis. NCC represents multi-video program distributors to advertisers.
13
CCO HOLDINGS, LLC AND SUBSIDIARIES
NOTES TO CONSOLIDATED FINANCIAL STATEMENTS
(UNAUDITED)
(dollars in millions, except where indicated)
The Company applies the equity method of accounting to these and other less significant equity-method investments, all of which are recorded in other noncurrent assets in the consolidated balance sheets as of September 30, 2016 and December 31, 2015. For each of the three and nine months ended September 30, 2016, net losses from equity-method investments were $2 million which were recorded in other expense, net in the consolidated statements of operations, and for both the three and nine months ended September 31, 2015, gains (losses) from equity-method investments were insignificant.
Noncontrolling interests assumed in the Transactions were recorded at fair value on the acquisition date and primarily relate to the third-party interest in CV of Viera, LLP, the Company’s consolidated joint venture in a small cable system in Florida. For both the three and nine months ended September 30, 2016, net income attributable to noncontrolling interest was $1 million.
In 2015, noncontrolling interest included the 2% accretion of the preferred membership interests in CC VIII, LLC (“CC VIII”) plus approximately 18.6% of CC VIII’s income, net of accretion. On December 31, 2015, the CC VIII preferred interest held by CCH I, LLC was contributed to CC VIII and subsequently canceled.
6. Accounts Payable and Accrued Liabilities
Accounts payable and accrued liabilities consist of the following as of September 30, 2016 and December 31, 2015:
September 30, 2016 | December 31, 2015 | |||||||
Accounts payable – trade | $ | 447 | $ | 112 | ||||
Accrued capital expenditures | 611 | 296 | ||||||
Deferred revenue | 346 | 96 | ||||||
Accrued liabilities: | ||||||||
Interest | 841 | 167 | ||||||
Programming costs | 1,768 | 451 | ||||||
Franchise-related fees | 242 | 65 | ||||||
Compensation | 770 | 118 | ||||||
Other | 979 | 171 | ||||||
$ | 6,004 | $ | 1,476 | |||||
14
CCO HOLDINGS, LLC AND SUBSIDIARIES
NOTES TO CONSOLIDATED FINANCIAL STATEMENTS
(UNAUDITED)
(dollars in millions, except where indicated)
7. Long-Term Debt
Long-term debt consists of the following as of September 30, 2016 and December 31, 2015:
September 30, 2016 | December 31, 2015 | ||||||||||||||
Principal Amount | Accreted Value | Principal Amount | Accreted Value | ||||||||||||
CCO Holdings, LLC: | |||||||||||||||
7.000% senior notes due January 15, 2019 | $ | — | $ | — | $ | 600 | $ | 594 | |||||||
7.375% senior notes due June 1, 2020 | — | — | 750 | 744 | |||||||||||
5.250% senior notes due March 15, 2021 | 500 | 496 | 500 | 496 | |||||||||||
6.500% senior notes due April 30, 2021 | — | — | 1,500 | 1,487 | |||||||||||
6.625% senior notes due January 31, 2022 | 750 | 741 | 750 | 740 | |||||||||||
5.250% senior notes due September 30, 2022 | 1,250 | 1,231 | 1,250 | 1,229 | |||||||||||
5.125% senior notes due February 15, 2023 | 1,000 | 991 | 1,000 | 990 | |||||||||||
5.125% senior notes due May 1, 2023 | 1,150 | 1,141 | 1,150 | 1,140 | |||||||||||
5.750% senior notes due September 1, 2023 | 500 | 496 | 500 | 495 | |||||||||||
5.750% senior notes due January 15, 2024 | 1,000 | 991 | 1,000 | 990 | |||||||||||
5.875% senior notes due April 1, 2024 | 1,700 | 1,684 | — | — | |||||||||||
5.375% senior notes due May 1, 2025 | 750 | 744 | 750 | 744 | |||||||||||
5.750% senior notes due February 15, 2026 | 2,500 | 2,459 | — | — | |||||||||||
5.500% senior notes due May 1, 2026 | 1,500 | 1,487 | — | — | |||||||||||
5.875% senior notes due May 1, 2027 | 800 | 794 | 800 | 794 | |||||||||||
Charter Communications Operating, LLC: | |||||||||||||||
3.579% senior notes due July 23, 2020 | 2,000 | 1,982 | — | — | |||||||||||
4.464% senior notes due July 23, 2022 | 3,000 | 2,972 | — | — | |||||||||||
4.908% senior notes due July 23, 2025 | 4,500 | 4,457 | — | — | |||||||||||
6.384% senior notes due October 23, 2035 | 2,000 | 1,980 | — | — | |||||||||||
6.484% senior notes due October 23, 2045 | 3,500 | 3,466 | — | — | |||||||||||
6.834% senior notes due October 23, 2055 | 500 | 495 | — | — | |||||||||||
Credit facilities | 8,965 | 8,863 | 3,552 | 3,502 | |||||||||||
Time Warner Cable, LLC: | |||||||||||||||
5.850% senior notes due May 1, 2017 | 2,000 | 2,050 | — | — | |||||||||||
6.750% senior notes due July 1, 2018 | 2,000 | 2,157 | — | — | |||||||||||
8.750% senior notes due February 14, 2019 | 1,250 | 1,430 | — | — | |||||||||||
8.250% senior notes due April 1, 2019 | 2,000 | 2,292 | — | — | |||||||||||
5.000% senior notes due February 1, 2020 | 1,500 | 1,624 | — | — | |||||||||||
4.125% senior notes due February 15, 2021 | 700 | 742 | — | — | |||||||||||
4.000% senior notes due September 1, 2021 | 1,000 | 1,059 | — | — | |||||||||||
5.750% sterling senior notes due June 2, 2031 (a) | 810 | 879 | — | — | |||||||||||
6.550% senior debentures due May 1, 2037 | 1,500 | 1,693 | — | — | |||||||||||
7.300% senior debentures due July 1, 2038 | 1,500 | 1,797 | — | — | |||||||||||
6.750% senior debentures due June 15, 2039 | 1,500 | 1,731 | — | — | |||||||||||
5.875% senior debentures due November 15, 2040 | 1,200 | 1,259 | — | — | |||||||||||
5.500% senior debentures due September 1, 2041 | 1,250 | 1,258 | — | — | |||||||||||
5.250% sterling senior notes due July 15, 2042 (b) | 843 | 811 | — | — | |||||||||||
4.500% senior debentures due September 15, 2042 | 1,250 | 1,135 | — | — | |||||||||||
15
CCO HOLDINGS, LLC AND SUBSIDIARIES
NOTES TO CONSOLIDATED FINANCIAL STATEMENTS
(UNAUDITED)
(dollars in millions, except where indicated)
Time Warner Cable Enterprises LLC: | |||||||||||||||
8.375% senior debentures due March 15, 2023 | 1,000 | 1,282 | — | — | |||||||||||
8.375% senior debentures due July 15, 2033 | 1,000 | 1,327 | — | — | |||||||||||
Total debt | 60,168 | 61,996 | 14,102 | 13,945 | |||||||||||
Less current portion: | |||||||||||||||
5.850% senior notes due May 1, 2017 | 2,000 | 2,050 | — | — | |||||||||||
Long-term debt | $ | 58,168 | $ | 59,946 | $ | 14,102 | $ | 13,945 | |||||||
(a) | Principal amount includes £625 million valued at $810 million as of September 30, 2016 using the exchange rate at that date. |
(b) | Principal amount includes £650 million valued at $843 million as of September 30, 2016 using the exchange rate at that date. |
The accreted values presented in the table above represent the principal amount of the debt less the original issue discount at the time of sale, deferred financing costs, and, (i) in regards to the Legacy TWC debt assumed, a fair value premium adjustment as a result of applying acquisition accounting plus the accretion of those amounts to the balance sheet date and (ii) in regards to the fixed-rate British pound sterling denominated notes (the “Sterling Notes”), a remeasurement of the principal amount of the debt and any premium or discount into US dollars as of the balance sheet date. See Note 9. However, the amount that is currently payable if the debt becomes immediately due is equal to the principal amount of the debt. The Company has availability under the Charter Operating credit facilities of approximately $2.8 billion as of September 30, 2016.
As discussed in Note 2, upon consummation of the Transactions, CCOH Safari merged into CCO Holdings and CCO Safari II and CCO Safari III merged into Charter Operating and, as a result, the Company assumed $21.8 billion aggregate principal amount of debt. During the three and nine months ended September 30, 2015, Charter incurred interest expense on this debt of approximately $163 million and $275 million, respectively.
CCO Holdings
In February 2016, CCO Holdings and CCO Holdings Capital jointly issued $1.7 billion aggregate principal amount of 5.875% senior notes due 2024 (the “2024 Notes”) and, in April 2016, they issued $1.5 billion aggregate principal amount of 5.500% senior notes due 2026 (the “2026 Notes”) at a price of 100.075% of the aggregate principal amount. The net proceeds from both issuances were used to repurchase all of CCO Holdings’ 7.000% senior notes due 2019, 7.375% senior notes due 2020 and 6.500% senior notes due 2021 and to pay related fees and expenses and for general corporate purposes. These debt repurchases resulted in a loss on extinguishment of debt of $110 million for the nine months ended September 30, 2016.
The 2024 Notes and 2026 Notes are senior debt obligations of CCO Holdings and CCO Holdings Capital and rank equally with all other current and future unsecured, unsubordinated obligations of CCO Holdings and CCO Holdings Capital. They are structurally subordinated to all obligations of subsidiaries of CCO Holdings.
CCO Holdings may redeem some or all of the 2024 Notes and 2026 Notes at any time with a make-whole premium. Beginning in 2019 for the 2024 notes and 2021 for the 2026 notes, the optional redemption price declines to 100% of the respective series’ principal amount, plus accrued and unpaid interest, if any.
In addition, at any time prior to April 1, 2019 in regards to the 2024 Notes and May 1, 2019 in regards to the 2026 Notes, CCO Holdings may redeem up to 40% of the aggregate principal amount of the 2024 Notes and 2026 Notes at a premium plus accrued and unpaid interest to the redemption date, with the net cash proceeds of one or more equity offerings (as defined in the indenture); provided that certain conditions are met. In the event of specified change of control events, CCO Holdings must offer to purchase the outstanding CCO Holdings notes from the holders at a purchase price equal to 101% of the total principal amount of the notes, plus any accrued and unpaid interest.
In April 2015, CCO Holdings and CCO Holdings Capital closed on transactions in which they issued $1.15 billion aggregate principal amount of 5.125% senior unsecured notes due 2023 (the “2023 Notes”), $750 million aggregate principal amount of 5.375% senior unsecured notes due 2025 (the “2025 Notes”) and $800 million aggregate principal amount of 5.875% senior unsecured notes due 2027 (the “2027 Notes” and collectively, the “Notes”). The net proceeds from the issuance of the 2023 Notes
16
CCO HOLDINGS, LLC AND SUBSIDIARIES
NOTES TO CONSOLIDATED FINANCIAL STATEMENTS
(UNAUDITED)
(dollars in millions, except where indicated)
and 2025 Notes were used to finance tender offers and a subsequent call in which $1.0 billion aggregate principal amount of CCO Holdings’ outstanding 7.250% senior notes due 2017 and $700 million aggregate principal amount of CCO Holdings’ outstanding 8.125% senior notes due 2020 were repurchased, as well as for general corporate purposes. The net proceeds from the issuance of the 2027 Notes were used to call $800 million of the $1.4 billion aggregate principal amount of CCO Holdings’ outstanding 7.000% senior notes due 2019. These debt repurchases resulted in a loss on extinguishment of debt of $123 million for the nine months ended September 30, 2015.
The Company also recorded a loss on extinguishment of debt of approximately $3 million for the nine months ended September 30, 2015 as a result of the repayment of debt upon termination of the proposed transactions with Comcast Corporation (“Comcast”).
Charter Operating
In connection with the closing of the TWC Transaction, Charter Operating replaced its existing revolving credit facility with a new $3.0 billion senior secured revolving credit facility under Charter Operating’s Amended and Restated Credit Agreement dated May 18, 2016 (the “Credit Agreement”). As of September 30, 2016, $220 million of the revolving credit facility was utilized to collateralize $325 million of letters of credit issued on the Company’s behalf. In connection with the closing of the Bright House Transaction, Charter Operating closed on a $2.6 billion aggregate principal amount Term Loan A pursuant to the terms of the Credit Agreement of which $2.0 billion was used to fund the cash portion of the Bright House Transaction and of which $638 million was used to prepay and terminate Charter Operating’s existing Term A-1 Loans. Interest on Term Loan A was set at LIBOR plus 2%. As of September 30, 2016, the aggregate principal amount of Charter Operating’s credit facilities was $9.0 billion, which includes $3.8 billion aggregate principal amount of CCO Safari III credit facilities that became obligations of Charter Operating upon the closing of the TWC Transaction.
The Credit Agreement and the Charter Operating senior notes are guaranteed by CCO Holdings, TWC, LLC (as defined below), TWCE (as defined below) and substantially all of the operating subsidiaries of Charter Operating (collectively, the “Subsidiary Guarantors”). Term Loan A and borrowings under the incremental revolving credit facility are secured by a perfected first priority security interest in substantially all of the assets of Charter Operating and the Subsidiary Guarantors, subject to certain customary exceptions and the liens rank equally with the liens on the collateral securing obligations under the Charter Operating notes and credit facilities and the Time Warner Cable, LLC (the successor to Legacy TWC outstanding debt obligations, “TWC, LLC”) senior notes and debentures and the Time Warner Cable Enterprises LLC (“TWCE”) senior debentures assumed in the TWC Transaction.
Assumed Legacy TWC Indebtedness
The Company assumed approximately $22.4 billion in aggregate principal amount of TWC, LLC senior notes and debentures and TWCE senior debentures with varying maturities. The Company applied acquisition accounting to Legacy TWC, and as a result, the debt assumed was adjusted to fair value using quoted market values as of the closing date. This fair value adjustment resulted in recognition of a net debt premium of approximately $2.4 billion.
TWC, LLC Senior Notes and Debentures
The TWC, LLC senior notes and debentures are guaranteed by CCO Holdings, Charter Operating, TWCE and the Subsidiary Guarantors and rank equally with the liens on the collateral securing obligations under the Charter Operating notes and credit facilities. Interest on each series of TWC, LLC senior notes and debentures is payable semi-annually (with the exception of the Sterling Notes, which is payable annually) in arrears.
The TWC, LLC indenture contains customary covenants relating to restrictions on the ability of TWC, LLC or any material subsidiary to create liens and on the ability of TWC, LLC and TWCE to consolidate, merge or convey or transfer substantially all of their assets. The TWC, LLC indenture also contains customary events of default.
The TWC, LLC senior notes and debentures may be redeemed in whole or in part at any time at TWC, LLC’s option at a redemption price equal to the greater of (i) all of the applicable principal amount being redeemed and (ii) the sum of the present values of the remaining scheduled payments on the applicable TWC, LLC senior notes and debentures discounted to the redemption date on a semi-annual basis (with the exception of the Sterling Notes, which are on an annual basis), at a comparable government bond rate
17
CCO HOLDINGS, LLC AND SUBSIDIARIES
NOTES TO CONSOLIDATED FINANCIAL STATEMENTS
(UNAUDITED)
(dollars in millions, except where indicated)
plus a designated number of basis points as further described in the indenture and the applicable note or debenture, plus, in each case, accrued but unpaid interest to, but not including, the redemption date.
The Company may offer to redeem all, but not less than all, of the Sterling Notes in the event of certain changes in the tax laws of the U.S. (or any taxing authority in the U.S.). This redemption would be at a redemption price equal to 100% of the principal amount, together with accrued and unpaid interest on the Sterling Notes to, but not including, the redemption date.
TWCE Senior Debentures
The TWCE senior debentures are guaranteed by CCO Holdings, Charter Operating, TWC, LLC and the Subsidiary Guarantors and rank equally with the liens on the collateral securing obligations under the Charter Operating notes and credit facilities. Interest on each series of TWCE senior debentures is payable semi-annually in arrears. The TWCE senior debentures are not redeemable before maturity.
The TWCE indenture contains customary covenants relating to restrictions on the ability of TWCE or any material subsidiary to create liens and on the ability of TWC, LLC and TWCE to consolidate, merge or convey or transfer substantially all of their assets. The TWCE indenture also contains customary events of default.
Liquidity and Future Principal Payments
The Company continues to have significant amounts of debt, and its business requires significant cash to fund principal and interest payments on its debt, capital expenditures and ongoing operations. As set forth below, the Company has significant future principal payments. The Company continues to monitor the capital markets, and it expects to undertake refinancing transactions and utilize free cash flow and cash on hand to further extend or reduce the maturities of its principal obligations. The timing and terms of any refinancing transactions will be subject to market conditions.
Based on outstanding indebtedness as of September 30, 2016, the amortization of term loans, and the maturity dates for all senior and subordinated notes and debentures, total future principal payments on the total borrowings under all debt agreements as of September 30, 2016 are as follows:
Year | Amount | |||
Three months ended December 31, 2016 | $ | 49 | ||
2017 | 2,197 | |||
2018 | 2,197 | |||
2019 | 3,546 | |||
2020 | 5,216 | |||
Thereafter | 46,963 | |||
$ | 60,168 | |||
8. Loans Receivable (Payable) - Related Party
Loans payable - related party as of September 30, 2016 consists of loans from Charter Communications Holdings Company, LLC (“Charter Holdco”) to the Company of $640 million. Interest accrues on loans payable - related party at LIBOR plus 2%.
Loans receivable - related party as of December 31, 2015 consists of loans from the Company to CCOH Safari II, LLC, CCOH Safari, CCO Safari II and CCO Safari III of $96 million, $34 million, $508 million and $55 million, respectively, which were settled with the Company upon the merger of the Safari Escrow Entities into the Company. Loans payable-related party as of December 31, 2015 consists of loans from Charter Holdco and CCH II, LLC to the Company of $48 million and $285 million, respectively.
18
CCO HOLDINGS, LLC AND SUBSIDIARIES
NOTES TO CONSOLIDATED FINANCIAL STATEMENTS
(UNAUDITED)
(dollars in millions, except where indicated)
9. Accounting for Derivative Instruments and Hedging Activities
The Company uses derivative instruments to manage interest rate risk on variable debt and foreign exchange risk on the Sterling Notes, and does not hold or issue derivative instruments for speculative trading purposes.
Interest rate derivative instruments are used to manage interest costs and to reduce the Company’s exposure to increases in floating interest rates. The Company manages its exposure to fluctuations in interest rates by maintaining a mix of fixed and variable rate debt. Using interest rate derivative instruments, the Company agrees to exchange, at specified intervals through 2017, the difference between fixed and variable interest amounts calculated by reference to agreed-upon notional principal amounts. As of September 30, 2016 and December 31, 2015, the Company had $1.1 billion in notional amounts of interest rate derivative instruments outstanding. The notional amounts of interest rate derivative instruments do not represent amounts exchanged by the parties and, thus, are not a measure of exposure to credit loss. The amounts exchanged were determined by reference to the notional amount and the other terms of the contracts.
Upon closing of the TWC Transaction, the Company acquired interest rate derivative instrument assets with a fair value of $85 million (excluding accrued interest), which were terminated and settled with their respective counterparties in the second quarter of 2016 with an $88 million cash payment to the Company of which $14 million was for interest accrued through the date of termination. The termination resulted in an $11 million loss for the nine months ended September 30, 2016 which was recorded in gain (loss) on financial instruments, net in the consolidated statements of operations.
Upon closing of the TWC Transaction, the Company assumed cross-currency derivative instrument liabilities with a fair value of $72 million (excluding accrued interest). Cross-currency derivative instruments are used to effectively convert £1.275 billion aggregate principal amount of fixed-rate British pound sterling denominated debt, including annual interest payments and the payment of principal at maturity, to fixed-rate U.S. dollar denominated debt. The cross-currency swaps have maturities of June 2031 and July 2042. The Company is required to post collateral on the cross-currency derivative instruments when the derivative contracts are in a liability position. In May 2016, the Company entered into a collateral holiday agreement for 80% of both the 2031 and 2042 cross-currency swaps, which eliminates the requirement to post collateral for three years.
The effect of derivative instruments on the consolidated balance sheets is presented in the table below:
September 30, 2016 | December 31, 2015 | ||||||
Interest Rate Derivatives | |||||||
Accrued interest | $ | 1 | $ | 3 | |||
Other long-term liabilities | $ | 7 | $ | 10 | |||
Accumulated other comprehensive loss | $ | (7 | ) | $ | (13 | ) | |
Cross-Currency Derivatives | |||||||
Other long-term liabilities | $ | 240 | $ | — | |||
The Company’s interest rate and cross-currency derivative instruments are not designated as hedges and are marked to fair value each period, with the impact recorded as a gain or loss on financial instruments, net in the consolidated statements of operations. While these derivative instruments are not designated as cash flow hedges for accounting purposes, management continues to believe such instruments are closely correlated with the respective debt, thus managing associated risk.
19
CCO HOLDINGS, LLC AND SUBSIDIARIES
NOTES TO CONSOLIDATED FINANCIAL STATEMENTS
(UNAUDITED)
(dollars in millions, except where indicated)
The effect of financial instruments on the consolidated statements of operations is presented in the table below.
Three Months Ended September 30, | Nine Months Ended September 30, | ||||||||||||||
2016 | 2015 | 2016 | 2015 | ||||||||||||
Gain (loss) on Financial Instruments, Net: | |||||||||||||||
Change in fair value of interest rate derivative instruments | $ | 7 | $ | (3 | ) | $ | 5 | $ | (3 | ) | |||||
Change in fair value of cross-currency derivative instruments | 17 | — | (168 | ) | — | ||||||||||
Remeasurement of Sterling Notes to U.S. dollars | 49 | — | 196 | — | |||||||||||
Termination of interest rate derivative instruments | — | — | (11 | ) | — | ||||||||||
Loss reclassified from accumulated other comprehensive loss due to discontinuance of hedge accounting | (2 | ) | (2 | ) | (6 | ) | (7 | ) | |||||||
$ | 71 | $ | (5 | ) | $ | 16 | $ | (10 | ) | ||||||
10. Fair Value Measurements
The accounting guidance establishes a three-level hierarchy for disclosure of fair value measurements, based on the transparency of inputs to the valuation of an asset or liability as of the measurement date, as follows:
• | Level 1 – inputs to the valuation methodology are quoted prices (unadjusted) for identical assets or liabilities in active markets. |
• | Level 2 – inputs to the valuation methodology include quoted prices for similar assets and liabilities in active markets, and inputs that are observable for the asset or liability, either directly or indirectly, for substantially the full term of the financial instrument. |
• | Level 3 – inputs to the valuation methodology are unobservable and significant to the fair value measurement. |
Financial Assets and Liabilities
The Company has estimated the fair value of its financial instruments as of September 30, 2016 and December 31, 2015 using available market information or other appropriate valuation methodologies. Considerable judgment, however, is required in interpreting market data to develop the estimates of fair value. Accordingly, the estimates presented in the accompanying consolidated financial statements are not necessarily indicative of the amounts the Company would realize in a current market exchange.
The carrying amounts of cash and cash equivalents, receivables, payables and other current assets and liabilities approximate fair value because of the short maturity of those instruments.
The Company’s cash and cash equivalents as of September 30, 2016 were primarily invested in money market funds. Money market funds are valued at the closing price reported by the fund sponsor from an actively traded exchange which approximates fair value. The money market funds potentially subject the Company to concentration of credit risk. The amount invested within any one financial instrument did not exceed $250 million as of September 30, 2016. As of September 30, 2016, there were no significant concentrations of financial instruments in a single investee, industry or geographic location.
Interest rate derivative instruments are valued using a present value calculation based on an implied forward LIBOR curve (adjusted for Charter Operating’s and counterparties’ credit risk). The weighted average pay rate for the Company’s currently effective interest rate derivative instruments was 1.61% at September 30, 2016 and December 31, 2015 (exclusive of applicable spreads). The cross-currency derivative instruments are valued using a present value calculation based on expected forward interest and exchange rates (adjusted for Charter Operating’s and counterparties’ credit risk).
20
CCO HOLDINGS, LLC AND SUBSIDIARIES
NOTES TO CONSOLIDATED FINANCIAL STATEMENTS
(UNAUDITED)
(dollars in millions, except where indicated)
Financial instruments accounted for at fair value on a recurring basis are presented in the table below.
September 30, 2016 | December 31, 2015 | |||||||||||||||||||||||
Level 1 | Level 2 | Level 3 | Level 1 | Level 2 | Level 3 | |||||||||||||||||||
Assets | ||||||||||||||||||||||||
Money market funds | $ | 480 | $ | — | $ | — | $ | — | $ | — | $ | — | ||||||||||||
Liabilities | ||||||||||||||||||||||||
Interest rate derivative instruments | $ | — | $ | 8 | $ | — | $ | — | $ | 13 | $ | — | ||||||||||||
Cross-currency derivative instruments | $ | — | $ | 240 | $ | — | $ | — | $ | — | $ | — | ||||||||||||
A summary of the carrying value and fair value of debt as of September 30, 2016 and December 31, 2015 is as follows:
September 30, 2016 | December 31, 2015 | |||||||||||||||
Carrying Value | Fair Value | Carrying Value | Fair Value | |||||||||||||
Senior notes and debentures | $ | 53,133 | $ | 56,899 | $ | 10,443 | $ | 10,718 | ||||||||
Credit facilities | $ | 8,863 | $ | 8,975 | $ | 3,502 | $ | 3,500 | ||||||||
The estimated fair value of the Company’s senior notes and debentures as of September 30, 2016 and December 31, 2015 is based on quoted market prices in active markets and is classified within Level 1 of the valuation hierarchy, while the estimated fair value of the Company’s credit facilities is based on quoted market prices in inactive markets and is classified within Level 2.
Nonfinancial Assets and Liabilities
The Company’s nonfinancial assets such as equity-method investments, franchises, property, plant, and equipment, and other intangible assets are not measured at fair value on a recurring basis; however, they are subject to fair value adjustments in certain circumstances, such as when there is evidence that an impairment may exist. No impairments were recorded during the three and nine months ended September 30, 2016 and 2015. Upon closing of the Transactions, all of Legacy TWC and Legacy Bright House nonfinancial assets and liabilities were recorded at preliminary fair values. See Note 2.
11. Operating Costs and Expenses
Operating costs and expenses, exclusive of items shown separately in the consolidated statements of operations, consist of the following for the periods presented:
Three Months Ended September 30, | Nine Months Ended September 30, | ||||||||||||||
2016 | 2015 | 2016 | 2015 | ||||||||||||
Programming | $ | 2,404 | $ | 667 | $ | 4,648 | $ | 2,004 | |||||||
Regulatory, connectivity and produced content | 508 | 108 | 936 | 324 | |||||||||||
Costs to service customers | 1,825 | 438 | 3,329 | 1,285 | |||||||||||
Marketing | 591 | 163 | 1,134 | 474 | |||||||||||
Transition costs | 32 | 12 | 78 | 50 | |||||||||||
Other | 1,130 | 232 | 2,048 | 665 | |||||||||||
$ | 6,490 | $ | 1,620 | $ | 12,173 | $ | 4,802 | ||||||||
21
CCO HOLDINGS, LLC AND SUBSIDIARIES
NOTES TO CONSOLIDATED FINANCIAL STATEMENTS
(UNAUDITED)
(dollars in millions, except where indicated)
Programming costs consist primarily of costs paid to programmers for basic, premium, digital, video on demand, and pay-per-view programming. Regulatory, connectivity and produced content costs represent payments to franchise and regulatory authorities, costs directly related to providing video, Internet and voice services as well as payments for sports, local and news content produced by the Company. Costs to service customers include costs related to field operations, network operations and customer care for the Company’s residential and small and medium business customers, including internal and third-party labor for installations, service and repairs, maintenance, billing and collection, occupancy and vehicle costs. Marketing costs represent the costs of marketing to current and potential commercial and residential customers including labor costs. Transition costs represent incremental costs incurred to integrate the TWC and Bright House operations and to increase the scale of the Company’s business as a result of the Transactions. See Note 2. Other includes bad debt expense, corporate overhead, advertising sales expense, indirect costs associated with the Company’s enterprise business customers and regional sports and news networks, property tax expense, insurance expense and stock compensation expense, among others.
12. Other Operating Expenses, Net
Other operating expenses, net consist of the following for the periods presented:
Three Months Ended September 30, | Nine Months Ended September 30, | ||||||||||||||
2016 | 2015 | 2016 | 2015 | ||||||||||||
Merger and restructuring costs | $ | 205 | $ | 19 | $ | 513 | $ | 51 | |||||||
Other pension benefits | (13 | ) | — | (533 | ) | — | |||||||||
Special charges, net | 4 | 1 | 10 | 13 | |||||||||||
(Gain) loss on sale of assets, net | (3 | ) | (1 | ) | (10 | ) | 5 | ||||||||
$ | 193 | $ | 19 | $ | (20 | ) | $ | 69 | |||||||
Merger and restructuring costs
Merger and restructuring costs represent costs incurred in connection with merger and acquisition transactions and related restructuring, such as advisory, legal and accounting fees, employee retention costs, employee termination costs related to the Transactions and other exit costs. The Company expects to incur additional merger and restructuring costs in connection with the Transactions. Changes in accruals for merger and restructuring costs from December 31, 2015 through September 30, 2016 are presented below:
Employee Retention Costs | Employee Termination Costs | Transaction and Advisory Costs | Other Costs | Total | |||||||||||||||
Liability, December 31, 2015 | $ | — | $ | — | $ | 33 | $ | — | $ | 33 | |||||||||
Liability assumed in the Transactions | 80 | 9 | 3 | — | 92 | ||||||||||||||
Costs incurred | 20 | 219 | 62 | 10 | 311 | ||||||||||||||
Cash paid | (91 | ) | (40 | ) | (68 | ) | (10 | ) | (209 | ) | |||||||||
Remaining liability, September 30, 2016 | $ | 9 | $ | 188 | $ | 30 | $ | — | $ | 227 | |||||||||
In addition to the costs incurred indicated above, the Company recorded $57 million and $202 million of expense related to accelerated vesting of equity awards of terminated employees for the three and nine months ended September 30, 2016, respectively.
Other pension benefits
Other pension benefits include the pension curtailment gain, remeasurement loss, net, expected return on plan assets and interest cost components of net periodic pension cost (benefit). See Note 17.
22
CCO HOLDINGS, LLC AND SUBSIDIARIES
NOTES TO CONSOLIDATED FINANCIAL STATEMENTS
(UNAUDITED)
(dollars in millions, except where indicated)
Special charges, net
Special charges, net primarily includes employee termination costs not related to the Transactions and net amounts of litigation settlements.
(Gain) loss on sale of assets, net
(Gain) loss on sale of assets, net represents the net (gain) loss recognized on the sales and disposals of fixed assets and cable systems.
13. Income Taxes
CCO Holdings is a single member limited liability company not subject to income tax. CCO Holdings holds all operations through indirect subsidiaries. The majority of these indirect subsidiaries are limited liability companies that are not subject to income tax. Certain indirect subsidiaries that are required to file separate returns are subject to federal and state tax. CCO Holdings’ tax provision reflects the tax provision of the entities required to file separate returns.
Generally, the taxable income, gains, losses, deductions and credits of CCO Holdings are passed through to its indirect members, Charter and A/N. Charter is responsible for its share of taxable income or loss of CCO Holdings allocated to it in accordance with the CCH Limited Liability Company Agreement (“LLC Agreement”) and partnership tax rules and regulations. Charter also records financial statement deferred tax assets and liabilities related to its investment, and its underlying net assets, in CCO Holdings.
For the three months ended September 30, 2016, the Company recorded $7 million of income tax benefit and for the three and nine months ended September 30, 2015, the Company recorded $219 million and $212 million of income tax benefit, respectively. Income tax benefit for the nine months ended September 30, 2016 was insignificant. Income tax is recognized primarily through decreases (increases) in deferred tax liabilities, as well as through current federal and state income tax expense. Income tax benefit for the three and nine months ended September 30, 2015 was primarily the result of the deemed liquidation of Charter Holdco in July 2015. After the deemed liquidation of Charter Holdco, all taxable income, gains, losses, deductions and credits of Charter Holdco and its indirect subsidiaries were treated as income of Charter. The tax provision in future periods will vary based on future operating results, as well as future book versus tax differences.
In determining the Company’s tax provision for financial reporting purposes, the Company establishes a reserve for uncertain tax positions unless such positions are determined to be “more likely than not” of being sustained upon examination, based on their technical merits. There is considerable judgment involved in making such a determination. In connection with the TWC Transaction, CCO Holdings assumed $218 million of gross unrecognized tax benefits (net of return to provision adjustments), including interest and penalties, which are recorded within other long-term liabilities. The net amount of the unrecognized tax benefits that would impact the effective tax rate is $215 million. CCO Holdings does not currently anticipate that its reserve for uncertain tax positions will significantly increase or decrease during 2016; however, various events could cause current expectations to change in the future. These uncertain tax positions, if ever recognized in the financial statements, would be recorded in the consolidated statements of operations as part of the income tax provision.
No tax years for Charter, Charter Holdings, or Charter Communications Holding Company, LLC, the Company’s indirect parent companies, for income tax purposes, are currently under examination by the IRS. Legacy Charter’s tax years ending 2013 through the short period return dated May 17, 2016 remain subject to examination and assessment. Years prior to 2013 remain open solely for purposes of examination of Legacy Charter’s loss and credit carryforwards. The IRS is currently examining Legacy TWC’s income tax returns for 2011 and 2012. Legacy TWC’s tax years ending 2013 through 2015 remain subject to examination and assessment. Prior to Legacy TWC’s separation from Time Warner Inc. (“Time Warner”) in March 2009 (the “Separation”), Legacy TWC was included in the consolidated U.S. federal and certain state income tax returns of Time Warner. The IRS is currently examining Time Warner’s 2008 through 2010 income tax returns. Time Warner’s income tax returns for 2005 to 2007, which are periods prior to the separation, were settled with the exception of an immaterial item that has been referred to the IRS Appeals Division. The Company does not anticipate that these examinations will have a material impact on the Company’s consolidated financial position or results of operations. In addition, the Company is also subject to ongoing examinations of the Company’s tax returns by state and local tax authorities for various periods. Activity related to these state and local examinations did not have a
23
CCO HOLDINGS, LLC AND SUBSIDIARIES
NOTES TO CONSOLIDATED FINANCIAL STATEMENTS
(UNAUDITED)
(dollars in millions, except where indicated)
material impact on the Company’s consolidated financial position or results of operations in 2015, nor does the Company anticipate a material impact in the future.
14. Related Party Transactions
On May 23, 2015, in connection with the execution of the Merger Agreement and the amendment of the Contribution Agreement, Charter entered into the Amended and Restated Stockholders Agreement with Liberty Broadband, A/N and Legacy Charter (the “Stockholders Agreement”). As of the closing of the Merger Agreement and the Contribution Agreement on May 18, 2016, the Stockholders Agreement replaced Legacy Charter’s existing stockholders agreement with Liberty Broadband, dated September 29, 2014, and superseded the amended and restated stockholders agreement among Legacy Charter, Charter, Liberty Broadband and A/N, dated March 31, 2015.
Under the terms of the Stockholders Agreement, the number of Charter’s directors is fixed at 13, and includes its chief executive officer. Upon the closing of the Bright House Transaction, two designees selected by A/N became members of the board of directors of Charter and three designees selected by Liberty Broadband continued as members of the board of directors of Charter. The remaining eight directors are not affiliated with either A/N or Liberty Broadband. Each of A/N and Liberty Broadband is entitled to nominate at least one director to each of the committees of Charter’s board of directors, subject to applicable stock exchange listing rules and certain specified voting or equity ownership thresholds for each of A/N and Liberty Broadband, and provided that the Nominating and Corporate Governance Committee and the Compensation and Benefit Committee each have at least a majority of directors independent from A/N, Liberty Broadband and the Company (referred to as the “unaffiliated directors”). Each of the Nominating and Corporate Governance Committee and the Compensation and Benefits Committee is currently comprised of three unaffiliated directors, including one designee of each of A/N and Liberty Broadband. A/N and Liberty Broadband also have certain other committee designation and other governance rights. Upon the closing of the Bright House Transaction, Mr. Thomas Rutledge, the Company’s Chief Executive Officer (“CEO”), became the chairman of the board of Charter.
The Company is aware that Dr. John Malone may be deemed to have a 36.4% voting interest in Liberty Interactive and is Chairman of the board of directors, an executive officer position, of Liberty Interactive. Liberty Interactive owns 38.3% of the common stock of HSN, Inc. (“HSN”) and has the right to elect 20% of the board members of HSN. Liberty Interactive wholly owns QVC, Inc. (“QVC”). The Company has programming relationships with HSN and QVC which pre-date the transaction with Liberty Media. For the three and nine months ended September 30, 2016, the Company recorded payments in aggregate of approximately $18 million and $33 million, respectively, and for the three and nine months ended September 30, 2015, the Company recorded payments in aggregate of approximately $4 million and $12 million, respectively, from HSN and QVC as part of channel carriage fees and revenue sharing arrangements for home shopping sales made to customers in the Company’s footprint.
Dr. Malone and Mr. Steven Miron, each a member of Charter’s board of directors, also serve on the board of directors of Discovery Communications, Inc., (“Discovery”) and the Company is aware that Dr. Malone owns 4.9% in the aggregate of the common stock of Discovery and has a 28.6% voting interest in Discovery for the election of directors. The Company is aware that Advance/Newhouse Programming Partnership (“A/N PP”), an affiliate of A/N and in which Mr. Miron is the CEO, owns 100% of the Series A preferred stock of Discovery and 100% of the Series C preferred stock of Discovery, representing approximately 34.0% of the outstanding equity of Discovery’s stock, on an as-converted basis. A/N PP has the right to appoint three directors out of a total of ten directors to Discovery’s board to be elected by the holders of Discovery’s Series A preferred stock. In addition, Dr. Malone owns approximately 6.4% in the aggregate of the common stock of Starz and has 48.1% of the voting power, pursuant to certain irrevocable proxies granted by Lions Gate Entertainment Corp. and his ownership of common stock. Mr. Gregory Maffei, a member of Charter’s board of directors, is a non-executive Chairman of the board of Starz. The Company purchases programming from both Discovery and Starz pursuant to agreements entered into prior to Dr. Malone, Mr. Maffei and Mr. Miron joining Charter’s board of directors. Based on publicly available information, the Company does not believe that either Discovery or Starz would currently be considered related parties. The amounts paid in aggregate to Discovery and Starz represent less than 3% of total operating costs and expenses for the three and nine months ended September 30, 2016 and 2015.
The Company has agreements with certain equity-method investees (see Note 5) pursuant to which the Company has made or received related party transaction payments. The Company recorded payments to equity-method investees totaling $62 million and $94 million during the three and nine months ended September 30, 2016, respectively. The Company recorded advertising revenues from transactions with equity-method investees totaling $3 million and $4 million during the three and nine months ended September 30, 2016, respectively.
24
CCO HOLDINGS, LLC AND SUBSIDIARIES
NOTES TO CONSOLIDATED FINANCIAL STATEMENTS
(UNAUDITED)
(dollars in millions, except where indicated)
15. Commitments and Contingencies
Commitments
The following table summarizes the Company’s payment obligations as of September 30, 2016 for its contractual obligations.
Capital and Operating Lease Obligations (1) | Programming Minimum Commitments (2) | Other (3) | Total | ||||||||||||
Three months ended December 31, 2016 | $ | 82 | $ | 58 | $ | 291 | $ | 431 | |||||||
2017 | 240 | 223 | 851 | 1,314 | |||||||||||
2018 | 210 | 35 | 773 | 1,018 | |||||||||||
2019 | 167 | 24 | 657 | 848 | |||||||||||
2020 | 128 | 15 | 654 | 797 | |||||||||||
Thereafter | 505 | — | 10,105 | 10,610 | |||||||||||
$ | 1,332 | $ | 355 | $ | 13,331 | $ | 15,018 | ||||||||
(1) The Company leases certain facilities and equipment under non-cancelable capital and operating leases. Leases and rental costs charged to expense for the three months ended September 30, 2016 and 2015 were $79 million and $12 million, respectively, and for the nine months ended September 30, 2016 and 2015 were $136 million and $36 million, respectively.
(2) The Company pays programming fees under multi-year contracts ranging from three to ten years, typically based on a flat fee per customer, which may be fixed for the term, or may in some cases escalate over the term. Programming costs included in the statement of operations were $2.4 billion and $667 million for the three months ended September 30, 2016 and 2015, respectively, and $4.6 billion and $2.0 billion for the nine months ended September 30, 2016 and 2015, respectively. Certain of the Company’s programming agreements are based on a flat fee per month or have guaranteed minimum payments. The table sets forth the aggregate guaranteed minimum commitments under the Company’s programming contracts.
(3) “Other” represents other guaranteed minimum commitments, including programming rights negotiated directly with content owners for distribution on Company-owned channels or networks and commitments related to the Company’s role as an advertising and distribution sales agent for third party-owned channels or networks as well as commitments to the Company’s customer premise equipment vendors.
The following items are not included in the contractual obligation table due to various factors discussed below. However, the Company incurs these costs as part of its operations:
• | The Company rents utility poles used in its operations. Generally, pole rentals are cancelable on short notice, but the Company anticipates that such rentals will recur. Rent expense incurred for pole rental attachments for the three months ended September 30, 2016 and 2015 were $36 million and $13 million, respectively, and for the nine months ended September 30, 2016 and 2015 were $74 million and $39 million, respectively. |
• | The Company pays franchise fees under multi-year franchise agreements based on a percentage of revenues generated from video service per year. The Company also pays other franchise related costs, such as public education grants, under multi-year agreements. Franchise fees and other franchise-related costs included in the accompanying statement of operations for the three months ended September 30, 2016 and 2015 were $177 million and $52 million, respectively, and for the nine months ended September 30, 2016 and 2015 were $356 million and $158 million, respectively. |
• | The Company also has $325 million in letters of credit, of which $220 million is secured under the Charter Operating credit facility, primarily to its various worker’s compensation, property and casualty, and general liability carriers, as collateral for reimbursement of claims. |
25
CCO HOLDINGS, LLC AND SUBSIDIARIES
NOTES TO CONSOLIDATED FINANCIAL STATEMENTS
(UNAUDITED)
(dollars in millions, except where indicated)
Litigation
In 2014, following an announcement by Comcast and Legacy TWC of their intent to merge, Breffni Barrett and others filed suit in the Supreme Court of the State of New York for the County of New York against Comcast, Legacy TWC and their respective officers and directors. Later five similar class actions were consolidated with this matter (the “NY Actions”). The NY Actions were settled in July 2014, however, such settlement was terminated following the termination of the Comcast and TWC merger in April 2015. In May 2015, Charter and TWC announced their intent to merge. Subsequently, the parties in the NY Actions filed a Second Consolidated Class Action Complaint (the “Second Amended Complaint”), removing Comcast as a defendant and naming TWC, the members of the TWC board of directors, Charter and the merger subsidiaries as defendants. The Second Amended Complaint generally alleges, among other things, that the members of the TWC board of directors breached their fiduciary duties to TWC stockholders during the Charter merger negotiations and by entering into the merger agreement and approving the mergers, and that Charter aided and abetted such breaches of fiduciary duties. The complaint sought, among other relief, injunctive relief enjoining the stockholder vote on the mergers, unspecified declaratory and equitable relief, compensatory damages in an unspecified amount, and costs and attorneys’ fees.
In September 2015, the parties entered into a memorandum of understanding (“MOU”) to settle the action. Pursuant to the MOU, the defendants issued certain supplemental disclosures relating to the mergers on a Form 8-K, and plaintiffs agreed to release with prejudice all claims that could have been asserted against defendants in connection with the mergers. The settlement is conditioned on, among other things, approval by the New York Supreme Court. That court gave preliminary approval to the settlement in October 2016. A hearing to consider final approval of this settlement is set for March 2017. In the event that the New York Supreme Court does not approve the settlement, the defendants intend to vigorously defend against any further litigation.
In August 2015, a purported stockholder of Charter, Matthew Sciabacucchi, filed a lawsuit in the Delaware Court of Chancery, on behalf of a putative class of Charter stockholders, challenging the transactions between Charter, TWC, A/N, and Liberty Broadband announced by Charter on May 26, 2015 (collectively, the “Transactions”). The lawsuit names as defendants Liberty Broadband, Charter, the board of directors of Charter, and New Charter. Plaintiff alleged that the Transactions improperly benefit Liberty Broadband at the expense of other Charter shareholders, and that Charter issued a false and misleading proxy statement in connection with the Transactions. Plaintiff requested, among other things, that the Delaware Court of Chancery enjoin the September 21, 2015 special meeting of Charter stockholders at which Charter stockholders were asked to vote on the Transactions until the defendants disclosed certain information relating to Charter and the Transactions. The disclosures demanded by the plaintiff included (i) certain unlevered free cash flow projections for Charter and (ii) a Form of Proxy and Right of First Refusal Agreement (“Proxy”) by and among Liberty Broadband, A/N, Charter and New Charter, which was referenced in the description of the Second Amended and Restated Stockholders Agreement, dated May 23, 2015, among Charter, New Charter, Liberty Broadband and A/N. On September 9, 2015, Charter issued supplemental disclosures containing unlevered free cash flow projections for Charter. In return, the plaintiff agreed its disclosure claims were moot and withdrew its application to enjoin the Charter stockholder vote on the Transactions. Charter has filed a motion to dismiss this litigation but the court has not yet ruled upon it. Charter denies any liability, believes that it has substantial defenses, and intends to vigorously defend this suit.
The California Attorney General and the Alameda County, California District Attorney are investigating whether certain of Legacy Charter’s waste disposal policies, procedures and practices are in violation of the California Business and Professions Code and the California Health and Safety Code. That investigation was commenced in January 2014. A similar investigation involving Legacy TWC was initiated in February 2012. Charter is cooperating with these investigations. While the Company is unable to predict the outcome of these investigations, it does not expect that the outcome will have a material effect on its operations, financial condition, or cash flows.
On December 19, 2011, Sprint Communications Company L.P. (“Sprint”) filed a complaint in the U.S. District Court for the District of Kansas alleging that Legacy TWC infringes 12 patents purportedly relating to Voice over Internet Protocol (“VoIP”) services. The plaintiff is seeking monetary damages as well as injunctive relief. On October 8, 2015, the court stayed this litigation pending Sprint’s appeal of a judgment in a parallel case against Cox Communications, Inc. (“Cox Communications”) in the U.S. District Court for the District of Delaware invalidating six of the 12 patents at issue in the Legacy TWC litigation. The stay applied to all 12 patents at issue in Sprint’s complaint against Legacy TWC. On September 23, 2016, the U.S. Court of Appeals for the Federal Circuit reversed the district court’s order in the Cox Communications litigation invalidating the six patents. On October 5, 2016, as a result of the Federal Circuit opinion, the Kansas court lifted the stay of the Legacy TWC case. Charter intends to defend against this lawsuit vigorously, but is unable to predict the outcome of this lawsuit or reasonably estimate a range of possible loss.
26
CCO HOLDINGS, LLC AND SUBSIDIARIES
NOTES TO CONSOLIDATED FINANCIAL STATEMENTS
(UNAUDITED)
(dollars in millions, except where indicated)
The Company is a defendant or co-defendant in several lawsuits involving alleged infringement of various patents relating to various aspects of its businesses. Other industry participants are also defendants in certain of these cases. In the event that a court ultimately determines that the Company infringes on any intellectual property rights, the Company may be subject to substantial damages and/or an injunction that could require the Company or its vendors to modify certain products and services the Company offers to its subscribers, as well as negotiate royalty or license agreements with respect to the patents at issue. While the Company believes the lawsuits are without merit and intends to defend the actions vigorously, no assurance can be given that any adverse outcome would not be material to the Company’s consolidated financial condition, results of operations, or liquidity. The Company cannot predict the outcome of any such claims nor can it reasonably estimate a range of possible loss.
The Company is party to lawsuits and claims that arise in the ordinary course of conducting its business, including lawsuits claiming violation of wage and hour laws and breach of contract by vendors, including by three programmers. The ultimate outcome of these other legal matters pending against the Company cannot be predicted, and although such lawsuits and claims are not expected individually to have a material adverse effect on the Company’s consolidated financial condition, results of operations or liquidity, such lawsuits could have, in the aggregate, a material adverse effect on the Company’s consolidated financial condition, results of operations or liquidity. Whether or not the Company ultimately prevails in any particular lawsuit or claim, litigation can be time consuming and costly and injure the Company’s reputation.
16. Stock Compensation Plans
Legacy Charter’s 2009 Stock Incentive Plan (assumed by Charter upon closing of the Transactions) provides for grants of nonqualified stock options, incentive stock options, stock appreciation rights, dividend equivalent rights, performance units and performance shares, share awards, phantom stock, restricted stock units and restricted stock. Directors, officers and other employees of the Company and its subsidiaries, as well as others performing consulting services for the Company, are eligible for grants under the 2009 Stock Incentive Plan. In April 2016, Charter’s board of directors and stockholders approved an additional 9 million shares of Charter Class A common stock (or units convertible into Charter Class A common stock) under the 2009 Stock Incentive Plan.
At the closing of the TWC Transaction, Legacy TWC employee equity awards were converted into Charter Class A common stock equity awards on the same terms and conditions as were applicable under the Legacy TWC equity awards, except that the number of shares covered by each award and the option exercise prices were adjusted for the Stock Award Exchange Ratio (as defined in the Merger Agreement) such that the intrinsic value of the Converted TWC Awards was approximately equal to that of the original awards at the closing of the Transactions. The Converted TWC Awards represented approximately 4 million Charter restricted stock units and 0.8 million Charter stock options (0.5 million of which were exercisable at the time of conversion) and continue to be subject to the terms of the Legacy TWC equity plans. The Converted TWC Awards were measured at their fair value as of the closing of the TWC Transaction. Of that fair value, $514 million related to Legacy TWC employee pre-combination service and was treated as consideration transferred in the TWC Transaction (See Note 2), while $539 million relates to post-combination service and will be amortized to stock compensation expense over the remaining vesting period of the awards. The fair values of the Converted TWC Awards were based on a valuation using assumptions developed by management and other information compiled by management including, but not limited to, historical volatility and exercise trends of Legacy Charter and Legacy TWC.
The Parent Merger Exchange Ratio was also applied to outstanding Legacy Charter equity awards and option exercise prices; however, the terms of the equity awards did not change as a result of the Transactions. Charter granted the following equity awards, excluding the Converted TWC Awards, for the periods presented after applying the Parent Merger Exchange Ratio, as applicable.
Three Months Ended September 30, | Nine Months Ended September 30, | ||||||||||
2016 | 2015 | 2016 | 2015 | ||||||||
Stock options | 275,400 | 2,100 | 5,980,800 | 1,146,300 | |||||||
Restricted stock | 400 | — | 10,400 | 6,300 | |||||||
Restricted stock units | 39,300 | 500 | 890,700 | 138,400 | |||||||
27
CCO HOLDINGS, LLC AND SUBSIDIARIES
NOTES TO CONSOLIDATED FINANCIAL STATEMENTS
(UNAUDITED)
(dollars in millions, except where indicated)
Legacy Charter stock options granted prior to 2014 generally vest annually over three years from either the grant date or delayed vesting commencement dates. Stock options generally expire ten years from the grant date. Restricted stock generally vests annually one year from the date of grant. Certain stock options and restricted stock units vest based on achievement of stock price hurdles. Restricted stock units have no voting rights, and restricted stock units granted prior to 2014 vest ratably over three years from either the grant date or delayed vesting commencement dates. Beginning in 2014, stock options and restricted stock units granted cliff vest upon the three year anniversary of each grant. Legacy TWC restricted stock units that were converted into Charter restricted stock units generally vest 50% on each of the third and fourth anniversary of the grant date. Legacy TWC stock options that were converted into Charter stock options vest ratably over a four-year period and expire ten years from the grant date.
As of September 30, 2016, total unrecognized compensation remaining to be recognized in future periods totaled $296 million for stock options, $1 million for restricted stock and $364 million for restricted stock units and the weighted average period over which they are expected to be recognized is four years for stock options, one year for restricted stock and three years for restricted stock units.
The Company recorded $81 million and $168 million of stock compensation expense for the three and nine months ended September 30, 2016, respectively, which is included in operating costs and expenses. The Company also recorded $57 million and $202 million of expense for the three and nine months ended September 30, 2016, respectively, related to accelerated vesting of equity awards of terminated employees which is recorded in merger and restructuring costs. For the three and nine months ended September 30, 2015, the Company recorded $20 million and $58 million of stock compensation expense, respectively, which is included in operating costs and expenses. In connection with the TWC Transaction, Charter settled restricted stock units in the amount of $59 million for cash to be paid prior to the end of 2016 which amount is recorded in accounts payables and accrued liabilities in the consolidated balance sheets as of September 30, 2016.
17. Employee Benefit Plans
Upon completion of the TWC Transaction, Charter assumed sponsorship of Legacy TWC’s pension plans. The Company sponsors two qualified defined benefit pension plans, the TWC Pension Plan and the TWC Union Pension Plan, that provide pension benefits to a majority of Legacy TWC employees. The Company also provides a nonqualified defined benefit pension plan for certain employees under the TWC Excess Pension Plan.
Pension benefits are based on formulas that reflect the employees’ years of service and compensation during their employment period. Actuarial gains or losses are changes in the amount of either the benefit obligation or the fair value of plan assets resulting from experience different from that assumed or from changes in assumptions. The Company has elected to follow a mark-to-market pension accounting policy for recording the actuarial gains or losses annually during the fourth quarter, or earlier if a remeasurement event occurs during an interim period.
Pension benefits are recorded as a net asset or liability for the overfunded or underfunded status of defined benefit pension plans and changes in the funded status are recorded in the year in which the changes occur. As of the closing date of the TWC Transaction, the excess of the projected benefit obligation over the fair value of plan assets was recognized as a liability and deferred actuarial losses and prior service credits previously recognized were eliminated in acquisition accounting. As of the closing date of the TWC Transaction, the projected benefit obligation and the fair value of plan assets for the pension plans were $4.0 billion and $2.9 billion, respectively, and the net underfunded liability of the pension plans was recorded as a $6 million current pension liability and $1.1 billion long-term pension liability in acquisition accounting.
The rate of compensation increase used to measure the projected benefit obligation as of the closing of the TWC Transaction was an age-graded average increase of 4.25%. The weighted average of discount rates used to measure the projected benefit obligation at the closing date of the TWC Transaction was 3.99%. The Company determined the discount rates based on the yield of a large population of high-quality corporate bonds with cash flows sufficient in timing and amount to settle projected future defined benefit payments. The Company also utilized the RP 2015/MP 2015 mortality tables published by the Society of Actuaries to measure the projected benefit obligation as of the closing date of the TWC Transaction. In addition, the expected long-term rate of return on plan assets used to determine a component of net periodic benefit cost was 6.50%. In developing the expected long-term rate of return on plan assets, the Company considered the pension portfolio’s composition, past average rate of earnings and the Company’s future asset allocation targets.
28
CCO HOLDINGS, LLC AND SUBSIDIARIES
NOTES TO CONSOLIDATED FINANCIAL STATEMENTS
(UNAUDITED)
(dollars in millions, except where indicated)
Pension Plan Assets
The assets of the qualified pension plans are held in a master trust in which the qualified pension plans are the only participating plans. The investment policy for the qualified pension plans is to achieve a reasonable long-term rate of return on plan assets with an acceptable level of risk in order to maintain adequate funding levels. The investment portfolio is a mix of fixed-income and equity securities with the objective of matching plan liability performance, diversifying risk and achieving a target investment return. The Company’s allocation of plan assets includes fixed-income and equity securities of 39% and 61%, respectively, the substantial majority of which consist of Level 1 or Level 2 fair value measurements.
Net Periodic Pension Cost (Benefit)
The components of net periodic pension cost (benefit) for the three and nine months ended September 30, 2016 consisted of the following:
Three Months Ended September 30, | Nine Months Ended September 30, | ||||||
2016 | 2016 | ||||||
Service cost | $ | 51 | $ | 86 | |||
Interest cost | 34 | 55 | |||||
Expected return on plan assets | (47 | ) | (70 | ) | |||
Pension curtailment gain | — | (675 | ) | ||||
Remeasurement loss, net | — | 157 | |||||
Net periodic pension cost (benefit) | $ | 38 | $ | (447 | ) | ||
The service cost component of net periodic pension cost (benefit) is recorded in operating costs and expenses in the consolidated statements of operations. The effects of the plan amendment made subsequent to the TWC Transaction, discussed below, resulted in a $675 million pension curtailment gain and $157 million remeasurement loss, net recorded in other operating expenses, net in the consolidated statements of operations during the nine months ended September 30, 2016.
Pension Plan Curtailment Amendment
Following the closing of the TWC Transaction, Charter amended the pension plans to freeze future benefit accruals to current active plan participants as of August 31, 2016. Effective September 1, 2016, no future compensation increases or future service will be credited to participants of the pension plans and new hires will not be eligible to participate in the plans. Upon announcement and approval of the plan amendment, the assumptions underlying the pension liability and pension asset values were reassessed utilizing remeasurement date assumptions in accordance with Charter’s mark-to-market pension accounting policy to record gains and losses in the period in which a remeasurement event occurs. The $675 million curtailment gain recorded during the nine months ended September 30, 2016 was primarily driven by the reduction of the compensation rate assumption to zero in accordance with the terms of the plan amendment, reflecting the pension liability at its accumulated benefit obligation instead of its projected benefit obligation at the remeasurement date. The $157 million remeasurement loss recorded during the nine months ended September 30, 2016 was primarily driven by the effects of a reduction of the discount rate from 3.99% at the closing date of the TWC Transaction to 3.72% at remeasurement date, net of a gain to record pension assets at June 30, 2016 fair values. As of the remeasurement date, June 30, 2016, the accumulated benefit obligation and fair value of plan assets for the pension plans was $3.6 billion and $2.9 billion, respectively, for a net underfunded liability of $647 million.
Pension Plan Contributions
The Company made no cash contributions to the qualified pension plans during the three and nine months ended September 30, 2016; however, the Company may make discretionary cash contributions to the qualified pension plans in the future. Such contributions will be dependent on a variety of factors, including current and expected interest rates, asset performance, the funded status of the qualified pension plans and management’s judgment. For the nonqualified unfunded pension plan, the Company will continue to make contributions during the remainder of 2016 to the extent benefits are paid.
29
CCO HOLDINGS, LLC AND SUBSIDIARIES
NOTES TO CONSOLIDATED FINANCIAL STATEMENTS
(UNAUDITED)
(dollars in millions, except where indicated)
Defined Contribution Benefit Plans
Upon completion of the TWC Transaction, Charter assumed Legacy TWC’s defined contribution plan, the TWC Savings Plan. In June 2016, the Company announced changes to both the Charter Communications, Inc. 401(k) Plan (the “401(k) Plan”) and the TWC Savings Plan that were effective September 1, 2016. The Company’s matching contribution to the 401(k) Plan and the TWC Savings Plan equal 100% of the amount of the salary reduction the participant elects to defer up to 6% of the participant’s eligible pay. For employees who are not eligible to participate in the Company’s long-term incentive plan and who are not covered by a collective bargaining agreement, the Company also provides a contribution to a new Retirement Accumulation Plan, equal to 3% of eligible pay.
18. Consolidating Schedules
Each of Charter Operating, TWC, LLC, TWCE, CCO Holdings and certain subsidiaries jointly, severally, fully and unconditionally guarantee the outstanding debt securities of the others (other than the CCO Holdings notes) on an unsecured senior basis and the condensed consolidating financial information has been prepared and presented pursuant to SEC Regulation S-X Rule 3-10, Financial Statements of Guarantors and Issuers of Guaranteed Securities Registered or Being Registered. Certain Charter Operating subsidiaries that are regulated telephone entities only become guarantor subsidiaries upon approval by regulators. This information is not intended to present the financial position, results of operations and cash flows of the individual companies or groups of companies in accordance with generally accepted accounting principles.
The “Charter Operating and Restricted Subsidiaries” column is presented to comply with the terms of the Credit Agreement.
The “Unrestricted Subsidiary” column included in the condensed consolidating financial statements for the nine months ended September 30, 2015 consists of CCO Safari which was a non-recourse subsidiary under the Credit Agreement and held the CCO Safari Term G Loans that were repaid in April 2015.
Condensed consolidating financial statements as of September 30, 2016 and December 31, 2015 and for the nine months ended September 30, 2016 and 2015 follow.
30
CCO HOLDINGS, LLC AND SUBSIDIARIES
NOTES TO CONSOLIDATED FINANCIAL STATEMENTS
(UNAUDITED)
(dollars in millions, except where indicated)
CCO Holdings, LLC and Subsidiaries | |||||||||||||||
Condensed Consolidating Balance Sheets | |||||||||||||||
As of September 30, 2016 | |||||||||||||||
Guarantor Subsidiaries | |||||||||||||||
CCO Holdings | Charter Operating and Restricted Subsidiaries | Eliminations | CCO Holdings Consolidated | ||||||||||||
ASSETS | |||||||||||||||
CURRENT ASSETS: | |||||||||||||||
Cash and cash equivalents | $ | — | $ | 996 | $ | — | $ | 996 | |||||||
Accounts receivable, net | — | 1,229 | — | 1,229 | |||||||||||
Receivables from related party | 58 | — | (58 | ) | — | ||||||||||
Prepaid expenses and other current assets | — | 351 | — | 351 | |||||||||||
Total current assets | 58 | 2,576 | (58 | ) | 2,576 | ||||||||||
INVESTMENT IN CABLE PROPERTIES: | |||||||||||||||
Property, plant and equipment, net | — | 32,657 | — | 32,657 | |||||||||||
Franchises | — | 66,245 | — | 66,245 | |||||||||||
Customer relationships, net | — | 15,439 | — | 15,439 | |||||||||||
Goodwill | — | 30,165 | — | 30,165 | |||||||||||
Total investment in cable properties, net | — | 144,506 | — | 144,506 | |||||||||||
INVESTMENT IN SUBSIDIARIES | 89,165 | — | (89,165 | ) | — | ||||||||||
LOANS RECEIVABLE – RELATED PARTY | 494 | — | (494 | ) | — | ||||||||||
OTHER NONCURRENT ASSETS | — | 1,172 | — | 1,172 | |||||||||||
Total assets | $ | 89,717 | $ | 148,254 | $ | (89,717 | ) | $ | 148,254 | ||||||
LIABILITIES AND MEMBER’S EQUITY | |||||||||||||||
CURRENT LIABILITIES: | |||||||||||||||
Accounts payable and accrued liabilities | $ | 209 | $ | 5,795 | $ | — | $ | 6,004 | |||||||
Payables to related party | — | 457 | (58 | ) | 399 | ||||||||||
Current portion of long-term debt | — | 2,050 | — | 2,050 | |||||||||||
Total current liabilities | 209 | 8,302 | (58 | ) | 8,453 | ||||||||||
LONG-TERM DEBT | 13,255 | 46,691 | — | 59,946 | |||||||||||
LOANS PAYABLE – RELATED PARTY | — | 1,134 | (494 | ) | 640 | ||||||||||
DEFERRED INCOME TAXES | — | 32 | — | 32 | |||||||||||
OTHER LONG-TERM LIABILITIES | — | 2,905 | — | 2,905 | |||||||||||
MEMBER’S EQUITY | |||||||||||||||
Controlling interest | 76,253 | 89,165 | (89,165 | ) | 76,253 | ||||||||||
Noncontrolling interests | — | 25 | — | 25 | |||||||||||
Total member’s equity | 76,253 | 89,190 | (89,165 | ) | 76,278 | ||||||||||
Total liabilities and member’s equity | $ | 89,717 | $ | 148,254 | $ | (89,717 | ) | $ | 148,254 | ||||||
31
CCO HOLDINGS, LLC AND SUBSIDIARIES
NOTES TO CONSOLIDATED FINANCIAL STATEMENTS
(UNAUDITED)
(dollars in millions, except where indicated)
CCO Holdings, LLC and Subsidiaries | |||||||||||||||
Condensed Consolidating Balance Sheets | |||||||||||||||
As of December 31, 2015 | |||||||||||||||
Guarantor Subsidiaries | |||||||||||||||
CCO Holdings | Charter Operating and Restricted Subsidiaries | Eliminations | CCO Holdings Consolidated | ||||||||||||
ASSETS | |||||||||||||||
CURRENT ASSETS: | |||||||||||||||
Cash and cash equivalents | $ | — | $ | 5 | $ | — | $ | 5 | |||||||
Accounts receivable, net | — | 264 | — | 264 | |||||||||||
Receivables from related party | 14 | — | (14 | ) | — | ||||||||||
Prepaid expenses and other current assets | — | 55 | — | 55 | |||||||||||
Total current assets | 14 | 324 | (14 | ) | 324 | ||||||||||
INVESTMENT IN CABLE PROPERTIES: | |||||||||||||||
Property, plant and equipment, net | — | 8,317 | — | 8,317 | |||||||||||
Franchises | — | 6,006 | — | 6,006 | |||||||||||
Customer relationships, net | — | 856 | — | 856 | |||||||||||
Goodwill | — | 1,168 | — | 1,168 | |||||||||||
Total investment in cable properties, net | — | 16,347 | — | 16,347 | |||||||||||
INVESTMENT IN SUBSIDIARIES | 11,303 | — | (11,303 | ) | — | ||||||||||
LOANS RECEIVABLE – RELATED PARTY | 613 | 563 | (483 | ) | 693 | ||||||||||
OTHER NONCURRENT ASSETS | — | 116 | — | 116 | |||||||||||
Total assets | $ | 11,930 | $ | 17,350 | $ | (11,800 | ) | $ | 17,480 | ||||||
LIABILITIES AND MEMBER’S EQUITY | |||||||||||||||
CURRENT LIABILITIES: | |||||||||||||||
Accounts payable and accrued liabilities | $ | 165 | $ | 1,311 | $ | — | $ | 1,476 | |||||||
Payables to related party | — | 345 | (14 | ) | 331 | ||||||||||
Total current liabilities | 165 | 1,656 | (14 | ) | 1,807 | ||||||||||
LONG-TERM DEBT | 10,443 | 3,502 | — | 13,945 | |||||||||||
LOANS PAYABLE – RELATED PARTY | — | 816 | (483 | ) | 333 | ||||||||||
DEFERRED INCOME TAXES | — | 28 | — | 28 | |||||||||||
OTHER LONG-TERM LIABILITIES | — | 45 | — | 45 | |||||||||||
MEMBER’S EQUITY | 1,322 | 11,303 | (11,303 | ) | 1,322 | ||||||||||
Total liabilities and member’s equity | $ | 11,930 | $ | 17,350 | $ | (11,800 | ) | $ | 17,480 | ||||||
32
CCO HOLDINGS, LLC AND SUBSIDIARIES
NOTES TO CONSOLIDATED FINANCIAL STATEMENTS
(UNAUDITED)
(dollars in millions, except where indicated)
CCO Holdings, LLC and Subsidiaries | |||||||||||||||
Condensed Consolidating Statements of Operations | |||||||||||||||
For the nine months ended September 30, 2016 | |||||||||||||||
Guarantor Subsidiaries | |||||||||||||||
CCO Holdings | Charter Operating and Restricted Subsidiaries | Eliminations | CCO Holdings Consolidated | ||||||||||||
REVENUES | $ | — | $ | 18,728 | $ | — | $ | 18,728 | |||||||
COSTS AND EXPENSES: | |||||||||||||||
Operating costs and expenses (exclusive of items shown separately below) | — | 12,173 | — | 12,173 | |||||||||||
Depreciation and amortization | — | 4,409 | — | 4,409 | |||||||||||
Other operating income, net | — | (20 | ) | — | (20 | ) | |||||||||
— | 16,562 | — | 16,562 | ||||||||||||
Income from operations | — | 2,166 | — | 2,166 | |||||||||||
OTHER INCOME (EXPENSES): | |||||||||||||||
Interest expense, net | (539 | ) | (852 | ) | — | (1,391 | ) | ||||||||
Loss on extinguishment of debt | (110 | ) | — | — | (110 | ) | |||||||||
Gain on financial instruments, net | — | 16 | — | 16 | |||||||||||
Other expense, net | — | (2 | ) | — | (2 | ) | |||||||||
Equity in income of subsidiaries | 1,327 | — | (1,327 | ) | — | ||||||||||
678 | (838 | ) | (1,327 | ) | (1,487 | ) | |||||||||
Income before income taxes | 678 | 1,328 | (1,327 | ) | 679 | ||||||||||
INCOME TAX BENEFIT | — | — | — | — | |||||||||||
Consolidated net income | 678 | 1,328 | (1,327 | ) | 679 | ||||||||||
Less: Net income attributable to noncontrolling interests | — | (1 | ) | — | (1 | ) | |||||||||
Net income | $ | 678 | $ | 1,327 | $ | (1,327 | ) | $ | 678 | ||||||
33
CCO HOLDINGS, LLC AND SUBSIDIARIES
NOTES TO CONSOLIDATED FINANCIAL STATEMENTS
(UNAUDITED)
(dollars in millions, except where indicated)
CCO Holdings, LLC and Subsidiaries | |||||||||||||||||||
Condensed Consolidating Statements of Operations | |||||||||||||||||||
For the nine months ended September 30, 2015 | |||||||||||||||||||
Guarantor Subsidiaries | |||||||||||||||||||
CCO Holdings | Charter Operating and Restricted Subsidiaries | Unrestricted Subsidiary | Eliminations | CCO Holdings Consolidated | |||||||||||||||
REVENUES | $ | — | $ | 7,242 | $ | — | $ | — | $ | 7,242 | |||||||||
COSTS AND EXPENSES: | |||||||||||||||||||
Operating costs and expenses (exclusive of items shown separately below) | — | 4,802 | — | — | 4,802 | ||||||||||||||
Depreciation and amortization | — | 1,580 | — | — | 1,580 | ||||||||||||||
Other operating expenses, net | — | 69 | — | — | 69 | ||||||||||||||
— | 6,451 | — | — | 6,451 | |||||||||||||||
Income from operations | — | 791 | — | — | 791 | ||||||||||||||
OTHER INCOME (EXPENSES): | |||||||||||||||||||
Interest expense, net | (487 | ) | (114 | ) | (47 | ) | — | (648 | ) | ||||||||||
Loss on extinguishment of debt | (123 | ) | — | (3 | ) | — | (126 | ) | |||||||||||
Loss on financial instruments, net | — | (10 | ) | — | — | (10 | ) | ||||||||||||
Equity in income (loss) of subsidiaries | 795 | (50 | ) | — | (745 | ) | — | ||||||||||||
185 | (174 | ) | (50 | ) | (745 | ) | (784 | ) | |||||||||||
Income (loss) before income taxes | 185 | 617 | (50 | ) | (745 | ) | 7 | ||||||||||||
INCOME TAX BENEFIT | — | 212 | — | — | 212 | ||||||||||||||
Consolidated net income (loss) | 185 | 829 | (50 | ) | (745 | ) | 219 | ||||||||||||
Less: Net income attributable to noncontrolling interests | — | (34 | ) | — | — | (34 | ) | ||||||||||||
Net income (loss) | $ | 185 | $ | 795 | $ | (50 | ) | $ | (745 | ) | $ | 185 | |||||||
34
CCO HOLDINGS, LLC AND SUBSIDIARIES
NOTES TO CONSOLIDATED FINANCIAL STATEMENTS
(UNAUDITED)
(dollars in millions, except where indicated)
CCO Holdings, LLC and Subsidiaries | |||||||||||||||
Condensed Consolidating Statements of Comprehensive Income | |||||||||||||||
For the nine months ended September 30, 2016 | |||||||||||||||
Guarantor Subsidiaries | |||||||||||||||
CCO Holdings | Charter Operating and Restricted Subsidiaries | Eliminations | CCO Holdings Consolidated | ||||||||||||
Consolidated net income | $ | 678 | $ | 1,328 | $ | (1,327 | ) | $ | 679 | ||||||
Net impact of interest rate derivative instruments, net of tax | 6 | 6 | (6 | ) | 6 | ||||||||||
Foreign currency translation adjustment | (1 | ) | (1 | ) | 1 | (1 | ) | ||||||||
Consolidated comprehensive income | 683 | 1,333 | (1,332 | ) | 684 | ||||||||||
Less: Net income attributable to noncontrolling interests | — | (1 | ) | — | (1 | ) | |||||||||
Comprehensive income | $ | 683 | $ | 1,332 | $ | (1,332 | ) | $ | 683 | ||||||
CCO Holdings, LLC and Subsidiaries | |||||||||||||||||||
Condensed Consolidating Statements of Comprehensive Income (Loss) | |||||||||||||||||||
For the nine months ended September 30, 2015 | |||||||||||||||||||
Guarantor Subsidiaries | |||||||||||||||||||
CCO Holdings | Charter Operating and Restricted Subsidiaries | Unrestricted Subsidiary | Eliminations | CCO Holdings Consolidated | |||||||||||||||
Consolidated net income (loss) | $ | 185 | $ | 829 | $ | (50 | ) | $ | (745 | ) | $ | 219 | |||||||
Net impact of interest rate derivative instruments, net of tax | 7 | 7 | — | (7 | ) | 7 | |||||||||||||
Consolidated comprehensive income (loss) | $ | 192 | $ | 836 | $ | (50 | ) | $ | (752 | ) | $ | 226 | |||||||
Less: Net income attributable to noncontrolling interests | — | (34 | ) | — | — | (34 | ) | ||||||||||||
Comprehensive income (loss) | $ | 192 | $ | 802 | $ | (50 | ) | $ | (752 | ) | $ | 192 | |||||||
35
CCO HOLDINGS, LLC AND SUBSIDIARIES
NOTES TO CONSOLIDATED FINANCIAL STATEMENTS
(UNAUDITED)
(dollars in millions, except where indicated)
CCO Holdings, LLC and Subsidiaries | |||||||||||||||
Condensed Consolidating Statements of Cash Flows | |||||||||||||||
For the nine months ended September 30, 2016 | |||||||||||||||
Guarantor Subsidiaries | |||||||||||||||
CCO Holdings | Charter Operating and Restricted Subsidiaries | Eliminations | CCO Holdings Consolidated | ||||||||||||
NET CASH FLOWS FROM OPERATING ACTIVITIES | $ | (533 | ) | $ | 6,071 | $ | — | $ | 5,538 | ||||||
CASH FLOWS FROM INVESTING ACTIVITIES: | |||||||||||||||
Purchases of property, plant and equipment | — | (3,437 | ) | — | (3,437 | ) | |||||||||
Change in accrued expenses related to capital expenditures | — | 86 | — | 86 | |||||||||||
Purchases of cable systems, net of cash assumed | — | (7 | ) | — | (7 | ) | |||||||||
Contributions to subsidiaries | (437 | ) | — | 437 | — | ||||||||||
Distributions from subsidiaries | 3,455 | — | (3,455 | ) | — | ||||||||||
Change in restricted cash and cash equivalents | — | — | — | — | |||||||||||
Other, net | — | (8 | ) | — | (8 | ) | |||||||||
Net cash flows from investing activities | 3,018 | (3,366 | ) | (3,018 | ) | (3,366 | ) | ||||||||
CASH FLOWS FROM FINANCING ACTIVITIES: | |||||||||||||||
Borrowings of long-term debt | 3,201 | 2,796 | — | 5,997 | |||||||||||
Repayments of long-term debt | (2,937 | ) | (1,183 | ) | — | (4,120 | ) | ||||||||
Repayments loans payable - related parties | (71 | ) | (182 | ) | — | (253 | ) | ||||||||
Payments for debt issuance costs | (73 | ) | (210 | ) | — | (283 | ) | ||||||||
Proceeds from termination of interest rate derivatives | — | 88 | — | 88 | |||||||||||
Contributions from parent | 478 | 437 | (437 | ) | 478 | ||||||||||
Distributions to parent | (3,084 | ) | (3,455 | ) | 3,455 | (3,084 | ) | ||||||||
Other, net | 1 | (5 | ) | — | (4 | ) | |||||||||
Net cash flows from financing activities | (2,485 | ) | (1,714 | ) | 3,018 | (1,181 | ) | ||||||||
NET INCREASE IN CASH AND CASH EQUIVALENTS | — | 991 | — | 991 | |||||||||||
CASH AND CASH EQUIVALENTS, beginning of period | — | 5 | — | 5 | |||||||||||
CASH AND CASH EQUIVALENTS, end of period | $ | — | $ | 996 | $ | — | $ | 996 | |||||||
36
CCO HOLDINGS, LLC AND SUBSIDIARIES
NOTES TO CONSOLIDATED FINANCIAL STATEMENTS
(UNAUDITED)
(dollars in millions, except where indicated)
CCO Holdings, LLC and Subsidiaries | |||||||||||||||||||
Condensed Consolidating Statements of Cash Flows | |||||||||||||||||||
For the nine months ended September 30, 2015 | |||||||||||||||||||
Guarantor Subsidiaries | |||||||||||||||||||
CCO Holdings | Charter Operating and Restricted Subsidiaries | Unrestricted Subsidiary | Eliminations | CCO Holdings Consolidated | |||||||||||||||
NET CASH FLOWS FROM OPERATING ACTIVITIES | $ | (510 | ) | $ | 2,386 | $ | (55 | ) | $ | — | $ | 1,821 | |||||||
CASH FLOWS FROM INVESTING ACTIVITIES: | |||||||||||||||||||
Purchases of property, plant and equipment | — | (1,292 | ) | — | — | (1,292 | ) | ||||||||||||
Change in accrued expenses related to capital expenditures | — | 11 | — | — | 11 | ||||||||||||||
Contribution to subsidiary | (46 | ) | (24 | ) | — | 70 | — | ||||||||||||
Distributions from subsidiaries | 521 | — | — | (521 | ) | — | |||||||||||||
Change in restricted cash and cash equivalents | — | — | 3,514 | — | 3,514 | ||||||||||||||
Other, net | — | (15 | ) | — | — | (15 | ) | ||||||||||||
Net cash flows from investing activities | 475 | (1,320 | ) | 3,514 | (451 | ) | 2,218 | ||||||||||||
CASH FLOWS FROM FINANCING ACTIVITIES: | |||||||||||||||||||
Borrowings of long-term debt | 2,700 | 1,071 | — | — | 3,771 | ||||||||||||||
Repayments of long-term debt | (2,599 | ) | (1,329 | ) | (3,483 | ) | — | (7,411 | ) | ||||||||||
Borrowings (repayments) loans payable - related parties | 16 | (333 | ) | — | — | (317 | ) | ||||||||||||
Payments for debt issuance costs | (24 | ) | — | — | — | (24 | ) | ||||||||||||
Contributions from parent | 15 | 46 | 24 | (70 | ) | 15 | |||||||||||||
Distributions to parent | (73 | ) | (521 | ) | — | 521 | (73 | ) | |||||||||||
Net cash flows from financing activities | 35 | (1,066 | ) | (3,459 | ) | 451 | (4,039 | ) | |||||||||||
NET INCREASE IN CASH AND CASH EQUIVALENTS | — | — | — | — | — | ||||||||||||||
CASH AND CASH EQUIVALENTS, beginning of period | — | — | — | — | — | ||||||||||||||
CASH AND CASH EQUIVALENTS, end of period | $ | — | $ | — | $ | — | $ | — | $ | — | |||||||||
37
CCO HOLDINGS, LLC AND SUBSIDIARIES
NOTES TO CONSOLIDATED FINANCIAL STATEMENTS
(UNAUDITED)
(dollars in millions, except where indicated)
19. Recently Issued Accounting Standards
In May 2014, the Financial Accounting Standards Board (“FASB”) issued Accounting Standards Update (“ASU”) No. 2014-09, Revenue from Contracts with Customers (“ASU 2014-09”), which is a comprehensive revenue recognition standard that will supersede nearly all existing revenue recognition guidance under U.S. GAAP. The new standard provides a single principles-based, five-step model to be applied to all contracts with customers, which steps are to (1) identify the contract(s) with the customer, (2) identify the performance obligations in the contract, (3) determine the transaction price, (4) allocate the transaction price to the performance obligations in the contract and (5) recognize revenue when each performance obligation is satisfied. More specifically, revenue will be recognized when promised goods or services are transferred to the customer in an amount that reflects the consideration expected in exchange for those goods or services. ASU 2014-09 will be effective, reflecting the one-year deferral, for interim and annual periods beginning after December 15, 2017 (January 1, 2018 for the Company). Early adoption of the standard is permitted but not before the original effective date. Companies can transition to the standard either retrospectively or as a cumulative-effect adjustment as of the date of adoption. The Company is currently in the process of evaluating the impact that the adoption of ASU 2014-09 will have on its consolidated financial statements and the selected method of transition to the new standard.
In April 2015, the FASB issued ASU No. 2015-05, Customer’s Accounting for Fees Paid in a Cloud Computing Arrangement (“ASU 2015-05”), which provides guidance in determining whether fees for purchasing cloud computing services (or hosted software solutions) are considered internal-use software or should be considered a service contract. The cloud computing agreement that includes a software license should be accounted for in the same manner as internal-use software if customer has contractual right to take possession of the software during the hosting period without significant penalty and it is feasible to either run the software on customer’s hardware or contract with another vendor to host the software. Arrangements that don’t meet the requirements for internal-use software should be accounted for as a service contract. ASU 2015-05 was effective for interim and annual periods beginning after December 15, 2015 (January 1, 2016 for the Company). The adoption of ASU 2015-05 did not have a material impact on the Company’s financial statements.
In February 2016, the FASB issued ASU No. 2016-02, Leases (“ASU 2016-02”), which requires lessees to recognize almost all leases on their balance sheet as a right-of-use asset and a lease liability. Lessees are allowed to account for short-term leases (i.e., leases with a term of 12 months or less) off-balance sheet, consistent with current operating lease accounting. For income statement purposes, the FASB retained a dual model, requiring leases to be classified as either operating or finance. Classification will be based on criteria that are largely similar to those applied in current lease accounting, but without explicit bright lines. ASU 2016-02 will be effective for interim and annual periods beginning after December 15, 2018 (January 1, 2019 for the Company). Early adoption is permitted. The new standard requires a modified retrospective transition through a cumulative-effect adjustment as of the beginning of the earliest period presented in the financial statements. The Company is currently in the process of evaluating the impact that the adoption of ASU 2016-02 will have on its consolidated financial statements.
In March 2016, the FASB issued ASU No. 2016-09, Improvements to Employee Share-Based Payment Accounting (“ASU 2016-09”), which includes multiple provisions intended to simplify various aspects of the accounting for share-based payments. The new standard (1) requires all excess tax benefits and deficiencies to be recognized as income tax expense or benefit in the income statement in the period in which they occur regardless of whether the benefit reduces taxes payable in the current period, (2) requires classification of excess tax benefits as an operating activity on the statements of cash flows, (3) allows an entity to make an entity-wide accounting policy election to either estimate the number of awards that are expected to vest or account for forfeitures when they occur and (4) causes the threshold under which employee share-based awards partially settled in cash can qualify for equity classification to increase to the maximum statutory tax rates in the applicable jurisdiction. ASU 2016-09 will be effective for interim and annual periods after December 15, 2016 (January 1, 2017 for the Company). Early adoption of the standard is permitted but requires adoption of all provisions included in the amendment in the same period. The new standard generally requires a modified retrospective transition through a cumulative-effect adjustment as of the beginning of the period of adoption, with certain provisions requiring either a prospective or retrospective transition. The Company is currently in the process of evaluating the impact that the adoption of ASU 2016-09 will have on its consolidated financial statements.
In August 2016, the FASB issued ASU No. 2016-15, Classification of Certain Cash Receipts and Cash Payments (“ASU 2016-15”), which clarifies how entities should classify cash receipts and cash payments related to eight specific cash flow matters on the statement of cash flows, with the objective of reducing existing diversity in practice. ASU 2016-15 will be effective for interim and annual periods beginning after December 15, 2017 (January 1, 2018 for the Company). Early adoption is permitted. The
38
CCO HOLDINGS, LLC AND SUBSIDIARIES
NOTES TO CONSOLIDATED FINANCIAL STATEMENTS
(UNAUDITED)
(dollars in millions, except where indicated)
Company is currently in the process of evaluating the impact that the adoption of ASU 2016-15 will have on its consolidated financial statements.
39
Item 2. Management’s Discussion and Analysis of Financial Condition and Results of Operations.
General
CCO Holdings, LLC (“CCO Holdings”) is a holding company whose principal assets are the equity interests in its operating subsidiaries. CCO Holdings is a direct subsidiary of CCH I Holdings, LLC (“CCH I”), which is an indirect subsidiary of Charter Communications, Inc. (“Charter”), Charter Communications Holdings, LLC (“Charter Holdings”) and Spectrum Management Holding Company, LLC (“Spectrum Holdings”). The consolidated financial statements include the accounts of CCO Holdings and all of its subsidiaries where the underlying operations reside. All significant intercompany accounts and transactions among consolidated entities have been eliminated.
We are the second largest cable operator in the United States and a leading broadband communications company providing video, Internet and voice services with approximately 25.9 million residential and commercial customers at September 30, 2016. We also sell video and online advertising inventory to local, regional and national advertising customers and networking and enterprise-class, cloud-enabled hosting, managed applications and transport services to business customers and own and operate regional sports networks and local sports, news and lifestyle channels. Our residential services also include security and home management services.
TWC Transaction
On May 18, 2016, the transactions contemplated by the Agreement and Plan of Mergers dated as of May 23, 2015 (the “Merger Agreement”), by and among Time Warner Cable Inc. (“Legacy TWC”), Charter Communications, Inc. prior to the closing of the Merger Agreement (“Legacy Charter”), CCH I, LLC, previously a wholly owned subsidiary of Legacy Charter (“New Charter”) and certain other subsidiaries of New Charter were completed (the “TWC Transaction,” and together with the Bright House Transaction described below, the “Transactions”). As a result of the TWC Transaction, New Charter became the new public parent company that holds the operations of the combined companies and was renamed Charter Communications, Inc.
Pursuant to the terms of the Merger Agreement, upon consummation of the TWC Transaction, each outstanding share of Legacy TWC common stock (other than Legacy TWC common stock held by Liberty Broadband Corporation (“Liberty Broadband”) and Liberty Interactive Corporation (“Liberty Interactive” and, collectively, the “Liberty Parties”)), was converted into the right to receive, at the option of each such holder of Legacy TWC common stock, either (a) $100 in cash and Charter Class A common stock equivalent to 0.5409 shares of Legacy Charter Class A common stock (the “Option A Consideration”) or (b) $115 in cash and Charter Class A common stock equivalent to 0.4562 shares of Legacy Charter Class A common stock (the “Option B Consideration”). The actual number of shares of Charter Class A common stock that Legacy TWC stockholders received, excluding the Liberty Parties, was calculated by multiplying the exchange ratios of 0.5409 or 0.4562 specified above by 0.9042 (the “Parent Merger Exchange Ratio”), which was also the exchange ratio that was used to determine the number of shares of Charter Class A common stock that Legacy Charter stockholders received per share of Legacy Charter Class A common stock. Such exchange ratio did not impact the aggregate value represented by the shares of Charter Class A common stock issued in the TWC Transaction; however, it did impact the actual number of shares issued in the TWC Transaction.
Out of approximately 277 million shares of TWC common stock outstanding at the closing of the TWC Transaction, excluding TWC common stock held by the Liberty Parties, approximately 274 million shares were converted into the right to receive the Option A Consideration and approximately 3 million shares were converted into the right to receive the Option B Consideration. The Liberty Parties received approximately one share of Charter Class A common stock for each share of Legacy TWC common stock they owned (equivalent to 1.106 shares of Legacy Charter Class A common stock multiplied by the Parent Merger Exchange Ratio).
As of the date of the Transactions, the total value of the TWC Transaction was approximately $85 billion, including cash, equity and Legacy TWC assumed debt. The purchase price also includes an estimated pre-combination vesting period fair value of $514 million for Legacy TWC equity awards converted into Charter awards upon closing of the TWC Transaction (“Converted TWC Awards”) and $69 million of cash paid to former Legacy TWC employees and non-employee directors who held equity awards, whether vested or not vested.
Bright House Transaction
Also, on May 18, 2016, Legacy Charter and Advance/Newhouse Partnership (“A/N”), the former parent of Bright House Networks, LLC (“Bright House”), completed their previously announced transaction, pursuant to a definitive Contribution Agreement (the “Contribution Agreement”), under which Charter acquired Bright House (the “Bright House Transaction”). Pursuant to the Bright
40
House Transaction, Charter became the owner of the membership interests in Bright House and the other assets primarily related to Bright House (other than certain excluded assets and liabilities and non-operating cash). As of the date of acquisition, the purchase price totaled approximately $12.2 billion consisting of (a) $2 billion in cash, (b) 25 million convertible preferred units of Charter Holdings with a face amount of $2.5 billion that pay a 6% annual preferential dividend, (c) approximately 31.0 million common units of Charter Holdings that are exchangeable into Charter Class A common stock on a one-for-one basis and (d) one share of Charter Class B common stock.
Liberty Transaction
In connection with the TWC Transaction, Legacy Charter and Liberty Broadband completed their previously announced transactions pursuant to their investment agreement, in which Liberty Broadband purchased for cash approximately 22.0 million shares of Charter Class A common stock valued at $4.3 billion at the closing of the TWC Transaction to partially finance the cash portion of the TWC Transaction consideration. In connection with the Bright House Transaction, Liberty Broadband purchased approximately 3.7 million shares of Charter Class A common stock valued at $700 million at the closing of the Bright House Transaction.
Financing for the Transactions
Charter partially financed the cash portion of the purchase price of the Transactions with additional indebtedness and cash on hand. In 2015, Charter issued $15.5 billion aggregate principal amount of CCO Safari II, LLC (“CCO Safari II”) senior secured notes, $3.8 billion aggregate principal amount of CCO Safari III, LLC (“CCO Safari III”) senior secured bank loans and $2.5 billion aggregate principal amount of CCOH Safari, LLC (“CCOH Safari”) senior unsecured notes. The net proceeds were initially deposited into an escrow account. Upon closing of the TWC Transaction and release of the proceeds, the CCOH Safari notes became obligations of CCO Holdings and CCO Holdings Capital Corp. (“CCO Holdings Capital”), and the CCO Safari II notes and CCO Safari III credit facilities became obligations of Charter Communications Operating, LLC (“Charter Operating”) and Charter Communications Operating Capital Corp. CCOH Safari merged into CCO Holdings and CCO Safari II and CCO Safari III merged into Charter Operating. In connection with the closing of the Bright House Transaction, Charter Operating closed on a $2.6 billion aggregate principal amount term loan A facility.
Transaction-Related Commitments
The Federal Communications Commission (the “FCC”) order approving the Transactions contained certain conditions including build out of an additional two million locations with access to a high-speed connection within five years. At least one million of those connections must be in competition with another high-speed broadband provider in the market served. The FCC order also provides that Charter will not be permitted to charge usage-based prices or impose data caps and will be prohibited from charging interconnection fees for seven years, although the FCC sets forth a process in which the FCC could eliminate the conditions after five years.
Under the terms of the order with the Department of Justice (“DOJ”), Charter is prohibited from entering into or enforcing any agreement with a programmer that forbids, limits or creates incentives to limit the programmer’s provision of content to one or more on-line video distributors (“OVDs”). The settlement further provides that Charter will not be able to avail itself of other distributors’ most favored nation (“MFN”) provisions if they are inconsistent with this prohibition. The settlement also prohibits Charter from retaliating against programmers for licensing to OVDs. These DOJ conditions are in force for seven years, although Charter may petition the DOJ to eliminate the conditions after five years.
41
Corporate Entity Structure
The chart below sets forth our entity structure and that of our direct and indirect parents and subsidiaries. This chart does not include all of our affiliates and subsidiaries and, in some cases, we have combined separate entities for presentation purposes. The equity ownership percentages shown below are approximations. Indebtedness amounts shown below are principal amounts as of September 30, 2016. See Note 7 to the accompanying consolidated financial statements which also includes the accreted values of the indebtedness described below.
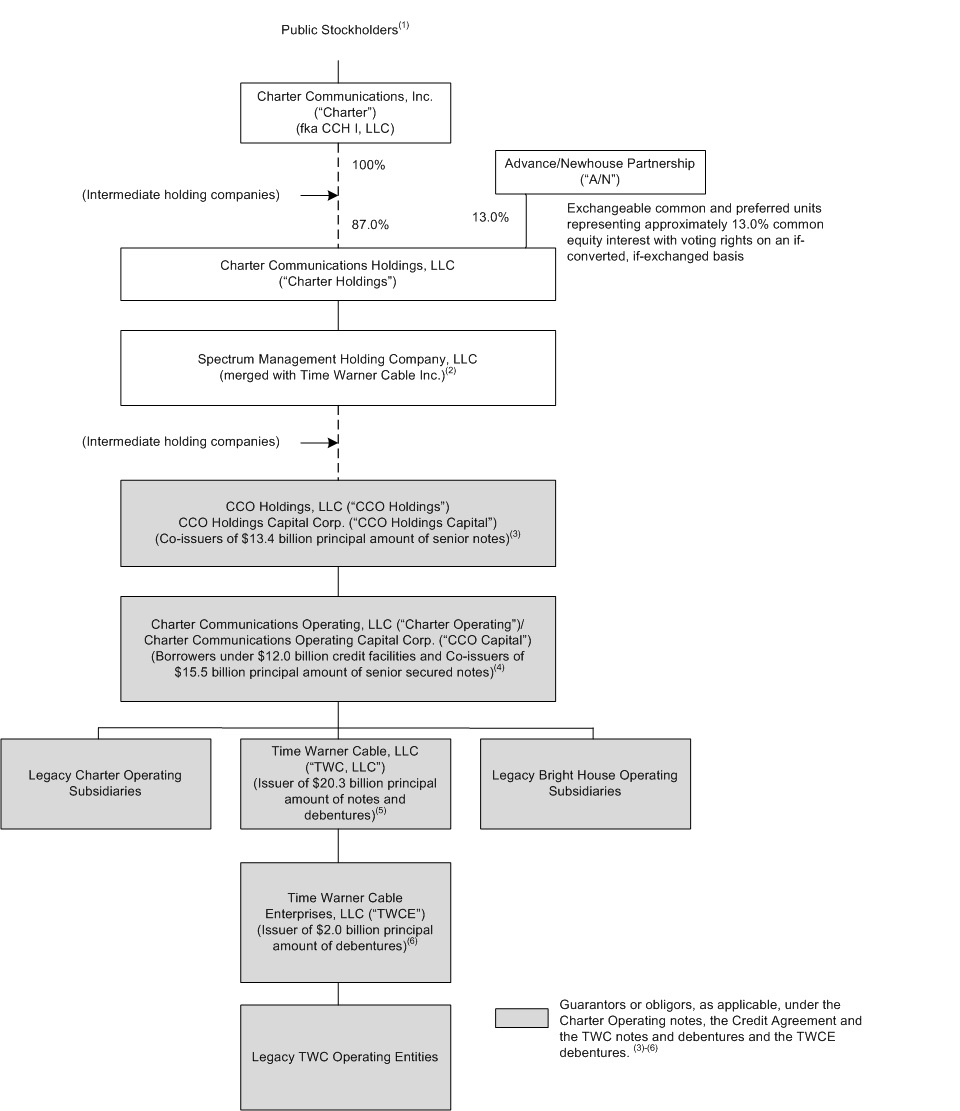
42
(1) | As of September 30, 2016, Liberty Broadband beneficially owned approximately 17.4% of Charter’s Class A common stock and A/N beneficially owned approximately 13.0% of Charter’s Class A common stock, in each case assuming the exchange of the membership interests held by A/N for Charter’s Class A common stock. |
(2) | In the Transactions, Legacy TWC transferred substantially all of its assets to TWC, LLC and merged with and into Spectrum Management Holding Company, LLC (formerly named Nina Company II, LLC) (“Spectrum Management”) with Spectrum Management as the surviving entity. Spectrum Management was the successor to the SEC reporting obligations of Legacy TWC (which have since been terminated). |
(3) | In connection with the Transactions, on May 18, 2016, the proceeds of $2.5 billion principal amount of senior notes previously issued by CCOH Safari and held in escrow were released from escrow, and CCOH Safari merged with and into CCO Holdings, which, among other things, assumed the obligations under these debt securities and agreed to guarantee, along with Time Warner Cable, LLC (“TWC, LLC”), Time Warner Cable Enterprises LLC (“TWCE”) and substantially all of the operating subsidiaries of Charter Operating (collectively, the “Subsidiary Guarantors”), the Charter Operating notes, the TWC, LLC and TWCE debt securities and the Charter Operating credit facilities. |
(4) | In connection with the Transactions, on May 18, 2016, (a) the proceeds of $15.5 billion principal amount of senior notes previously issued by CCO Safari II and held in escrow were released from escrow, and CCO Safari II merged with and into Charter Operating, which, among other things, assumed these debt obligations, (b) the $3.8 billion credit facility of CCO Safari III was issued, and CCO Safari III merged with and into Charter Operating, which, among other things, assumed the obligations under this credit facility and (c) Charter Operating agreed to guarantee, along with the Subsidiary Guarantors the TWC, LLC senior notes and debentures and the TWCE senior debentures. As of September 30, 2016, the Charter Operating credit facilities were comprised of $2.6 billion aggregate principal amount term loan A facility, $1.4 billion aggregate principal amount term loan E facility, $1.2 billion aggregate principal amount term loan F facility, $995 million aggregate principal amount term loan H facility and $2.8 billion aggregate principal amount term loan I facility. Charter Operating also has availability under its revolving credit facility of approximately $2.8 billion as of September 30, 2016. |
(5) | In connection with the TWC Transaction, Legacy TWC transferred substantially all of its assets to TWC, LLC (f/k/a TWC NewCo LLC), and, among other things, TWC, LLC assumed all the obligations under $20.3 billion principal amount of notes and debentures previously issued by Legacy TWC, and agreed to guarantee the Charter Operating and TWCE notes and debentures and the Charter Operating credit agreement. |
(6) | In connection with the Transactions, TWCE agreed to guarantee the Charter Operating and TWC, LLC notes and debentures and the Charter Operating credit agreement. |
Overview
Since 2012, Legacy Charter has actively invested in its network and operations and improved the quality and value of the products and packages that Legacy Charter offered. Through the roll-out of Spectrum pricing and packaging we have simplified our offers and improved our packaging of products, delivering more value to new and existing customers. Further, through the transition of our Legacy Charter markets to our all-digital platform, we increased our offerings to more than 200 HD channels in most of the Legacy Charter markets and offered Internet speeds of at least 60Mbps, among other benefits. We believe that this product set combined with improved customer service, as we insource our workforce in our call centers and in our field operations, has led to lower customer churn and longer customer lifetimes.
As a result of the Transactions, quarterly revenues increased by over $7 billion year over year. We also saw an increase in expenses related to our increased scale. In September 2016, we began launching Spectrum pricing and packaging to Legacy TWC markets and we expect that by mid 2017, we will offer Spectrum pricing and packaging in all Legacy TWC and Legacy Bright House markets. In 2017, we intend to begin converting the remaining Legacy TWC and Legacy Bright House analog markets to an all-digital platform and we expect to complete this initiative by the end of 2018. By the end of 2016, we expect that most of our corporate organization, as well as our marketing, sales and product development departments, will be centralized. Field operations will be managed through eleven regional areas, each designed to represent a combination of designated marketing areas and managed with largely the same set of field employees that were with the three legacy companies prior to completion of the Transactions. Over a multi-year period, Legacy TWC and Legacy Bright House customer care centers will migrate to Charter’s model of using virtualized, U.S.-based in-house call centers. We will focus on deploying superior products and service with minimal service disruptions as we integrate our information technology and network operations. We expect customer and financial results to trend similar to Legacy Charter following the implementation of the Legacy Charter operating strategies across the
43
Legacy TWC and Legacy Bright House markets. As a result of implementing our operating strategy at Legacy TWC and Legacy Bright House, we cannot be certain that we will be able to grow revenues or maintain our margins at recent historical rates.
Our most significant competitors are direct broadcast satellite providers and certain telephone companies that offer services that provide features and functions similar to our Internet, video and voice services, including in some cases wireless services. These services are frequently offered in bundles similar to ours. In addition, some consumers have chosen to receive video over the Internet rather than through pay television services including from us.
The Company realized revenue, Adjusted EBITDA and income from operations during the periods presented on an actual basis and pro forma basis, assuming the Transactions occurred as of January 1, 2015, as follows (in millions).
Three Months Ended September 30, | Nine Months Ended September 30, | ||||||||||||||||||||
2016 | 2015 | % Growth | 2016 | 2015 | % Growth | ||||||||||||||||
Actual | |||||||||||||||||||||
Revenues | $ | 10,037 | $ | 2,450 | 309.6 | % | $ | 18,728 | $ | 7,242 | 158.6 | % | |||||||||
Adjusted EBITDA | $ | 3,628 | $ | 850 | 326.8 | % | $ | 6,723 | $ | 2,498 | 169.1 | % | |||||||||
Income from operations | $ | 919 | $ | 273 | 236.6 | % | $ | 2,166 | $ | 791 | 173.8 | % | |||||||||
Pro Forma | |||||||||||||||||||||
Revenues | $ | 10,037 | $ | 9,342 | 7.4 | % | $ | 29,748 | $ | 27,813 | 7.0 | % | |||||||||
Adjusted EBITDA | $ | 3,628 | $ | 3,176 | 14.2 | % | $ | 10,596 | $ | 9,574 | 10.7 | % | |||||||||
Income from operations | $ | 919 | $ | 766 | 20.0 | % | $ | 3,354 | $ | 2,422 | 38.5 | % | |||||||||
Adjusted EBITDA is defined as consolidated net income (loss) plus net interest expense, income tax expense, depreciation and amortization, stock compensation expense, loss on extinguishment of debt, (gain) loss on financial instruments, net, other expense, net and other operating expenses, such as merger and restructuring costs, other pension benefits, special charges and gain (loss) on sale or retirement of assets. See “—Use of Adjusted EBITDA and Free Cash Flow” for further information on Adjusted EBITDA and free cash flow. Growth in total revenue, Adjusted EBITDA and income from operations was primarily due to the Transactions.
On a pro forma basis, assuming the Transactions occurred as of January 1, 2015, total revenue growth was primarily due to growth in our Internet and commercial businesses. On a pro forma basis, Adjusted EBITDA growth was primarily due to an increase in residential and commercial revenues offset by increases in programming costs and other operating costs. In addition to the factors discussed above, income from operations on a pro forma basis was affected by increases in depreciation and amortization, merger and restructuring costs and stock compensation expense.
We incurred the following costs in connection with the Transactions (in millions).
Three Months Ended September 30, | Nine Months Ended September 30, | ||||||||||||||
2016 | 2015 | 2016 | 2015 | ||||||||||||
Operating expenses | $ | 32 | $ | 12 | $ | 78 | $ | 50 | |||||||
Other operating expenses | $ | 205 | $ | 19 | $ | 513 | $ | 51 | |||||||
Capital expenditures | $ | 109 | $ | 24 | $ | 273 | $ | 66 | |||||||
Amounts included in transition operating expenses and transition capital expenditures represent incremental costs incurred to integrate the Legacy TWC and Legacy Bright House operations and to bring the three companies’ systems and processes into a uniform operating structure. Costs are incremental and would not be incurred absent the integration. Other operating expenses associated with the Transactions represent merger and restructuring costs and include advisory, legal and accounting fees, employee retention costs, employee termination costs and other exit costs.
44
All customer statistics as of September 30, 2016 include operations of Legacy TWC, Legacy Bright House and Legacy Charter each of which is based on the legacy company’s reporting methodology. Such methodologies differ and these differences may be material. Once statistical reporting is fully integrated, all prior periods will be recast to reflect a consistent methodology. The following table summarizes our customer statistics for video, Internet and voice as of September 30, 2016 and 2015 (in thousands except per customer data and footnotes).
Approximate as of | |||||||
September 30, | |||||||
2016 (a) | 2015 (a) | ||||||
Customer Relationships (b) | |||||||
Residential | 24,551 | 6,202 | |||||
Small and Medium Business | 1,367 | 375 | |||||
Total Customer Relationships | 25,918 | 6,577 | |||||
Residential Primary Service Units (“PSU”) | |||||||
Video | 16,887 | 4,293 | |||||
Internet | 21,017 | 5,112 | |||||
Voice | 10,288 | 2,551 | |||||
48,192 | 11,956 | ||||||
Monthly Residential Revenue per Residential Customer (c) | $ | 109.69 | $ | 110.69 | |||
Small and Medium Business PSUs | |||||||
Video | 388 | 104 | |||||
Internet | 1,185 | 331 | |||||
Voice | 751 | 208 | |||||
2,324 | 643 | ||||||
Monthly Small and Medium Business Revenue per Customer (d) | $ | 214.64 | $ | 176.19 | |||
Enterprise PSUs (e) | 93 | 28 | |||||
After giving effect to the Transactions, September 30, 2015 residential and small and medium business customer relationships would have been 23,436,000 and 1,221,000, respectively, residential video, Internet and voice PSUs would have been 16,944,000, 19,416,000 and 9,655,000, respectively and small and medium business PSUs would have been 354,000, 1,045,000 and 643,000, respectively; Enterprise PSUs would have been 77,000.
(a) | We calculate the aging of customer accounts based on the monthly billing cycle for each account. On that basis, as of September 30, 2016 and 2015, customers include approximately 200,900 and 36,800 customers, respectively, whose accounts were over 60 days past due, approximately 15,200 and 1,200 customers, respectively, whose accounts were over 90 days past due, and approximately 8,900 and 800 customers, respectively, whose accounts were over 120 days past due. |
(b) | Customer relationships include the number of customers that receive one or more levels of service, encompassing video, Internet and voice services, without regard to which service(s) such customers receive. Customers who reside in residential multiple dwelling units (“MDUs”) and that are billed under bulk contracts are counted based on the number of billed units within each bulk MDU. Total customer relationships excludes enterprise customer relationships. |
(c) | Monthly residential revenue per residential customer is calculated as total residential video, Internet and voice quarterly revenue divided by three divided by average residential customer relationships during the respective quarter. |
45
(d) | Monthly small and medium business revenue per customer is calculated as total small and medium business quarterly revenue divided by three divided by average small and medium business customer relationships during the respective quarter. |
(e) | Enterprise PSUs represent the aggregate number of fiber service offerings counting each separate service offering as an individual PSU. |
Critical Accounting Policies and Estimates
For a discussion of our critical accounting policies and the means by which we develop estimates therefore, see Exhibit 99.1 in our Current Report on Form 8-K filed with the SEC on June 6, 2016 and “Item 2. Management’s Discussion and Analysis of Financial Condition and Results of Operations” in our Quarterly Report on Form 10-Q for the three and six months ended June 30, 2016. There have been no material changes from the critical accounting policies described in our Form 8-K and Form 10-Q.
Results of Operations
We completed the Transactions on May 18, 2016 and have included the Legacy TWC and Legacy Bright House operating results since that date. In accordance with U.S. generally accepted accounting principles (“GAAP”), operating results from Legacy TWC and Legacy Bright House prior to the closing of the Transactions have been excluded. For purposes of management’s discussion and analysis, we have given explanations of increases and decreases in our results of operations on an actual basis, as well as on a pro forma basis assuming the Transactions occurred as of January 1, 2015. Due to the size of the Transactions, we believe that providing a discussion of our results of operations on a pro forma basis provides management and investors a more meaningful perspective on our financial and operational performance and trends. The results of operations data on a pro forma basis are provided for illustrative purposes only and are based on available information and assumptions that we believe are reasonable and do not purport to represent what our actual consolidated results of operations would have been had the Transactions occurred as of January 1, 2015, nor are they necessarily indicative of future consolidated results of operations or consolidated financial position.
See Exhibit 99.1 in this Quarterly Report on Form 10-Q for the three and nine months ended September 30, 2016 for pro forma financial information for each quarter of 2015 and the first and second quarter of 2016.
46
The following table sets forth the consolidated statements of operations for the periods presented (dollars in millions, except per share data):
Three Months Ended September 30, | Nine Months Ended September 30, | ||||||||||||||
2016 | 2015 | 2016 | 2015 | ||||||||||||
Revenues | $ | 10,037 | $ | 2,450 | $ | 18,728 | $ | 7,242 | |||||||
Costs and Expenses: | |||||||||||||||
Operating costs and expenses (exclusive of items shown separately below) | 6,490 | 1,620 | 12,173 | 4,802 | |||||||||||
Depreciation and amortization | 2,435 | 538 | 4,409 | 1,580 | |||||||||||
Other operating (income) expenses, net | 193 | 19 | (20 | ) | 69 | ||||||||||
9,118 | 2,177 | 16,562 | 6,451 | ||||||||||||
Income from operations | 919 | 273 | 2,166 | 791 | |||||||||||
Other Expenses: | |||||||||||||||
Interest expense, net | (729 | ) | (192 | ) | (1,391 | ) | (648 | ) | |||||||
Loss on extinguishment of debt | — | — | (110 | ) | (126 | ) | |||||||||
Gain (loss) on financial instruments, net | 71 | (5 | ) | 16 | (10 | ) | |||||||||
Other expense, net | (2 | ) | — | (2 | ) | — | |||||||||
(660 | ) | (197 | ) | (1,487 | ) | (784 | ) | ||||||||
Income before income taxes | 259 | 76 | 679 | 7 | |||||||||||
Income tax benefit | 7 | 219 | — | 212 | |||||||||||
Consolidated net income | 266 | 295 | 679 | 219 | |||||||||||
Less: Net income attributable to noncontrolling interests | (1 | ) | (13 | ) | (1 | ) | (34 | ) | |||||||
Net income attributable to CCO Holdings member | $ | 265 | $ | 282 | $ | 678 | $ | 185 | |||||||
Revenues. Total revenues grew $7.6 billion or 310% for the three months ended September 30, 2016 as compared to the three months ended September 30, 2015, and grew $11.5 billion or 159% for the nine months ended September 30, 2016 as compared to the nine months ended September 30, 2015. Revenue growth primarily reflects the Transactions and increases in the number of residential Internet and triple play customers and in commercial business customers, growth in rates driven by higher equipment revenue and rate increases offset by a decrease in basic video customers. The Transactions increased revenues for three and nine months ended September 30, 2016 as compared to the three and nine months September 30, 2015 by approximately $7.4 billion and $11.0 billion, respectively. On a pro forma basis, assuming the Transactions occurred as of January 1, 2015, total revenue growth was 7% for both the three and nine months ended September 30, 2016 compared to the corresponding periods in 2015.
47
Revenues by service offering were as follows (dollars in millions; all percentages are calculated using whole numbers. Minor differences may exist due to rounding):
Three Months Ended September 30, | |||||||||||||||||||||
Actual | Pro forma | ||||||||||||||||||||
2016 | 2015 | % Change | 2016 | 2015 | % Change | ||||||||||||||||
Video | $ | 4,094 | $ | 1,143 | 258 | % | $ | 4,094 | $ | 3,973 | 3 | % | |||||||||
Internet | 3,206 | 762 | 321 | % | 3,206 | 2,844 | 13 | % | |||||||||||||
Voice | 728 | 135 | 441 | % | 728 | 707 | 3 | % | |||||||||||||
Residential revenue | 8,028 | 2,040 | 293 | % | 8,028 | 7,524 | 7 | % | |||||||||||||
Small and medium business | 868 | 193 | 347 | % | 868 | 767 | 13 | % | |||||||||||||
Enterprise | 508 | 93 | 453 | % | 508 | 461 | 10 | % | |||||||||||||
Commercial revenue | 1,376 | 286 | 381 | % | 1,376 | 1,228 | 12 | % | |||||||||||||
Advertising sales | 419 | 77 | 449 | % | 419 | 374 | 12 | % | |||||||||||||
Other | 214 | 47 | 354 | % | 214 | 216 | (1 | )% | |||||||||||||
$ | 10,037 | $ | 2,450 | 310 | % | $ | 10,037 | $ | 9,342 | 7 | % | ||||||||||
Nine Months Ended September 30, | |||||||||||||||||||||
Actual | Pro forma | ||||||||||||||||||||
2016 | 2015 | % Change | 2016 | 2015 | % Change | ||||||||||||||||
Video | $ | 7,869 | $ | 3,420 | 130 | % | $ | 12,291 | $ | 12,009 | 2 | % | |||||||||
Internet | 5,960 | 2,222 | 168 | % | 9,376 | 8,371 | 12 | % | |||||||||||||
Voice | 1,286 | 404 | 219 | % | 2,185 | 2,117 | 3 | % | |||||||||||||
Residential revenue | 15,115 | 6,046 | 150 | % | 23,852 | 22,497 | 6 | % | |||||||||||||
Small and medium business | 1,590 | 565 | 181 | % | 2,520 | 2,223 | 13 | % | |||||||||||||
Enterprise | 903 | 268 | 237 | % | 1,500 | 1,339 | 12 | % | |||||||||||||
Commercial revenue | 2,493 | 833 | 199 | % | 4,020 | 3,562 | 13 | % | |||||||||||||
Advertising sales | 728 | 222 | 229 | % | 1,189 | 1,105 | 8 | % | |||||||||||||
Other | 392 | 141 | 178 | % | 687 | 649 | 6 | % | |||||||||||||
$ | 18,728 | $ | 7,242 | 159 | % | $ | 29,748 | $ | 27,813 | 7 | % | ||||||||||
48
Video revenues consist primarily of revenues from basic and digital video services provided to our residential customers, as well as franchise fees, equipment rental and video installation revenue. Excluding the impacts of the Transactions, residential video customers increased by 51,000 from September 30, 2015 to September 30, 2016.
The increase in video revenues is attributable to the following (dollars in millions):
Three months ended September 30, 2016 compared to three months ended September 30, 2015 Increase / (Decrease) | Nine months ended September 30, 2016 compared to nine months ended September 30, 2015 Increase / (Decrease) | ||||||
Incremental video services, price adjustments and bundle revenue allocation | $ | 24 | $ | 98 | |||
Increase in average basic video customers | 13 | 24 | |||||
Decrease in video on demand and pay-per-view | (2 | ) | (19 | ) | |||
TWC Transaction | 2,521 | 3,749 | |||||
Bright House Transaction | 395 | 597 | |||||
$ | 2,951 | $ | 4,449 | ||||
On a pro forma basis, assuming the Transactions occurred as of January 1, 2015, residential video customers decreased by 57,000 from September 30, 2015 to September 30, 2016 and the increase in video revenues is attributable to the following (dollars in millions):
Three months ended September 30, 2016 compared to three months ended September 30, 2015 Increase / (Decrease) | Nine months ended September 30, 2016 compared to nine months ended September 30, 2015 Increase / (Decrease) | ||||||
Incremental video services, price adjustments and bundle revenue allocation | $ | 130 | $ | 375 | |||
Increase (decrease) in video on demand and pay-per-view | 2 | (61 | ) | ||||
Decrease in average basic video customers | (11 | ) | (32 | ) | |||
$ | 121 | $ | 282 | ||||
Excluding the impacts of the Transactions, residential Internet customers grew by 467,000 customers from September 30, 2015 to September 30, 2016. The increase in Internet revenues from our residential customers is attributable to the following (dollars in millions):
Three months ended September 30, 2016 compared to three months ended September 30, 2015 Increase / (Decrease) | Nine months ended September 30, 2016 compared to nine months ended September 30, 2015 Increase / (Decrease) | ||||||
Increase in average residential Internet customers | $ | 73 | $ | 213 | |||
Service level changes, price adjustments and bundle revenue allocation | 14 | 50 | |||||
TWC Transaction | 2,017 | 2,973 | |||||
Bright House Transaction | 340 | 502 | |||||
$ | 2,444 | $ | 3,738 | ||||
49
On a pro forma basis, assuming the Transactions occurred as of January 1, 2015, residential Internet customers increased by 1,601,000 from September 30, 2015 to September 30, 2016 and the increase in Internet revenues is attributable to the following (dollars in millions):
Three months ended September 30, 2016 compared to three months ended September 30, 2015 Increase / (Decrease) | Nine months ended September 30, 2016 compared to nine months ended September 30, 2015 Increase / (Decrease) | ||||||
Increase in average residential Internet customers | $ | 248 | $ | 719 | |||
Service level changes, price adjustments and bundle revenue allocation | 114 | 286 | |||||
$ | 362 | $ | 1,005 | ||||
Excluding the impacts of the Transactions, residential voice customers grew by 114,000 customers from September 30, 2015 to September 30, 2016. The increase in voice revenues from our residential customers is attributable to the following (dollars in millions):
Three months ended September 30, 2016 compared to three months ended September 30, 2015 Increase / (Decrease) | Nine months ended September 30, 2016 compared to nine months ended September 30, 2015 Increase / (Decrease) | ||||||
Increase in average residential voice customers | $ | 6 | $ | 22 | |||
Price adjustments and bundle revenue allocation | (4 | ) | (15 | ) | |||
TWC Transaction | 507 | 750 | |||||
Bright House Transaction | 84 | 125 | |||||
$ | 593 | $ | 882 | ||||
On a pro forma basis, assuming the Transactions occurred as of January 1, 2015, residential voice customers increased by 633,000 from September 30, 2015 to September 30, 2016 and the increase in voice revenues is attributable to the following (dollars in millions):
Three months ended September 30, 2016 compared to three months ended September 30, 2015 Increase / (Decrease) | Nine months ended September 30, 2016 compared to nine months ended September 30, 2015 Increase / (Decrease) | ||||||
Increase in average residential voice customers | $ | 53 | $ | 196 | |||
Price adjustments and bundle revenue allocation | (32 | ) | (128 | ) | |||
$ | 21 | $ | 68 | ||||
50
Excluding the impacts of the Transactions, small and medium business PSUs grew by 127,000 from September 30, 2015 to September 30, 2016. The increase in small and medium business commercial revenues is attributable to the following (dollars in millions):
Three months ended September 30, 2016 compared to three months ended September 30, 2015 Increase / (Decrease) | Nine months ended September 30, 2016 compared to nine months ended September 30, 2015 Increase / (Decrease) | ||||||
Increase in small and medium business customers | $ | 33 | $ | 95 | |||
Price adjustments | (9 | ) | (29 | ) | |||
TWC Transaction | 565 | 831 | |||||
Bright House Transaction | 86 | 128 | |||||
$ | 675 | $ | 1,025 | ||||
On a pro forma basis, assuming the Transactions occurred as of January 1, 2015, small and medium business PSUs increased by 282,000 from September 30, 2015 to September 30, 2016 and the increase in small and medium business commercial revenues is attributable to the following (dollars in millions):
Three months ended September 30, 2016 compared to three months ended September 30, 2015 Increase / (Decrease) | Nine months ended September 30, 2016 compared to nine months ended September 30, 2015 Increase / (Decrease) | ||||||
Increase in small and medium business customers | $ | 92 | $ | 265 | |||
Price adjustments and service level changes | 9 | 32 | |||||
$ | 101 | $ | 297 | ||||
Excluding the impacts of the Transactions, enterprise PSUs increased 7,000 from September 30, 2015 to September 30, 2016. On a pro forma basis, assuming the Transactions occurred as of January 1, 2015, enterprise PSUs increased by 16,000 from September 30, 2015 to September 30, 2016. The Transactions increased enterprise commercial revenues for the three and nine months ended September 30, 2016 compared to the corresponding periods in 2015 by $411 million and $607 million, respectively. On a pro forma basis, assuming the Transactions occurred as of January 1, 2015, enterprise commercial revenues increased $47 million and $161 million during the three and nine months ended September 30, 2016, respectively, compared to the corresponding periods in 2015 primarily due to growth in customers.
Advertising sales revenues consist primarily of revenues from commercial advertising customers, programmers and other vendors, as well as local cable and advertising on regional sports and news channels. Advertising sales revenues increased $342 million and $506 million during the three and nine months ended September 30, 2016, respectively, compared to the corresponding periods in 2015 primarily due to the Transactions. The Transactions increased advertising sales revenues for the three and nine months ended September 30, 2016 compared to the corresponding periods in 2015 by $336 million and $495 million, respectively. On a pro forma basis, assuming the Transactions occurred as of January 1, 2015, advertising sales revenues increased $45 million and $84 million during the three and nine months ended September 30, 2016, respectively, compared to the corresponding periods in 2015 primarily due to an increase in political advertising.
Other revenues consist of revenue from regional sports and news channels (excluding intercompany charges or advertising sales on those channels), home shopping, late payment fees, wire maintenance fees and other miscellaneous revenues. Other revenues increased $167 million and $251 million during the three and nine months ended September 30, 2016, respectively, compared to the corresponding periods in 2015 primarily as a result of the Transactions. The Transactions increased other revenues for the three and nine months ended September 30, 2016 compared to the corresponding periods in 2015 by $173 million and $257 million, respectively. On a pro forma basis, assuming the Transactions occurred as of January 1, 2015, other revenues decreased $2 million
51
and increased by $38 million during the three and nine months ended September 30, 2016, respectively, compared to the corresponding periods in 2015. The increase during the nine months ended September 30, 2016 compared to 2015 is primarily due to a settlement related to an early contract termination and an increase in processing fees.
Operating costs and expenses. The increases in our operating costs and expenses, exclusive of items shown separately in the consolidated statements of operations, are attributable to the following (dollars in millions):
Three months ended September 30, 2016 compared to three months ended September 30, 2015 Increase / (Decrease) | Nine months ended September 30, 2016 compared to nine months ended September 30, 2015 Increase / (Decrease) | ||||||
Programming | $ | 1,737 | $ | 2,644 | |||
Regulatory, connectivity and produced content | 400 | 612 | |||||
Costs to service customers | 1,387 | 2,044 | |||||
Marketing | 428 | 660 | |||||
Transition costs | 20 | 28 | |||||
Other | 898 | 1,383 | |||||
$ | 4,870 | $ | 7,371 | ||||
Programming costs were approximately $2.4 billion and $667 million, representing 37% and 41% of total operating costs and expenses for the three months ended September 30, 2016 and 2015, respectively, and $4.6 billion and $2.0 billion, representing 38% and 42% of total operating costs and expenses for the nine months ended September 30, 2016 and 2015, respectively. The increases in operating costs and expenses for the three and nine months ended September 30, 2016 compared to the corresponding prior periods were primarily due to the Transactions which increased operating costs and expenses by approximately $4.7 billion and $7.0 billion, respectively.
The increase in other expense is attributable to the following (dollars in millions):
Three months ended September 30, 2016 compared to three months ended September 30, 2015 Increase / (Decrease) | Nine months ended September 30, 2016 compared to nine months ended September 30, 2015 Increase / (Decrease) | ||||||
Corporate costs | $ | 240 | $ | 384 | |||
Advertising sales expense | 149 | 226 | |||||
Enterprise | 137 | 207 | |||||
Bad debt expense | 86 | 118 | |||||
Property tax and insurance | 79 | 120 | |||||
Stock compensation expense | 61 | 110 | |||||
Other | 146 | 218 | |||||
$ | 898 | $ | 1,383 | ||||
The increases in other expense for the three and nine months ended September 30, 2016 compared to the corresponding prior periods were primarily due to the Transactions which increased other expense by approximately $850 million and $1.3 billion, respectively.
52
On a pro forma basis, assuming the Transactions occurred as of January 1, 2015, increases in our operating costs and expenses, exclusive of items shown separately in the consolidated statements of operations, are attributable to the following (dollars in millions):
Three months ended September 30, 2016 compared to three months ended September 30, 2015 Increase / (Decrease) | Nine months ended September 30, 2016 compared to nine months ended September 30, 2015 Increase / (Decrease) | ||||||
Programming | $ | 182 | $ | 524 | |||
Regulatory, connectivity and produced content | (15 | ) | 11 | ||||
Costs to service customers | (33 | ) | 55 | ||||
Marketing | 4 | 86 | |||||
Transition costs | 20 | 28 | |||||
Other | 104 | 244 | |||||
$ | 262 | $ | 948 | ||||
On a pro forma basis, assuming the Transactions occurred as of January 1, 2015, programming costs were approximately $2.4 billion and $2.2 billion, representing 37% and 36% of total operating costs and expenses for the three months ended September 30, 2016 and 2015, respectively, and $7.2 billion and $6.7 billion, representing 37% and 36% of total operating costs and expenses for the nine months ended September 30, 2016 and 2015, respectively.
Programming costs consist primarily of costs paid to programmers for basic, digital, premium, video on demand, and pay-per-view programming. The increase in pro forma programming costs is primarily a result of annual contractual rate adjustments, including increases in amounts paid for retransmission consents and the introduction of new networks offset by synergies as a result of the Transactions and lower pay-per-view programming expenses. We expect pro forma programming expenses will continue to increase due to a variety of factors, including annual increases imposed by programmers with additional selling power as a result of media consolidation, increased demands by owners of broadcast stations for payment for retransmission consent or linking carriage of other services to retransmission consent, and additional programming, particularly new sports services. We have been unable to fully pass these increases on to our customers nor do we expect to be able to do so in the future without a potential loss of customers.
On a pro forma basis, assuming the Transactions occurred as of January 1, 2015, the increase in other expense is attributable to the following (dollars in millions):
Three months ended September 30, 2016 compared to three months ended September 30, 2015 Increase / (Decrease) | Nine months ended September 30, 2016 compared to nine months ended September 30, 2015 Increase / (Decrease) | ||||||
Corporate costs | $ | 25 | $ | 94 | |||
Advertising sales expense | 23 | 57 | |||||
Stock compensation expense | 19 | 35 | |||||
Enterprise | 12 | 33 | |||||
Property tax and insurance | (5 | ) | 16 | ||||
Other | 30 | 17 | |||||
$ | 104 | $ | 252 | ||||
The increases in corporate costs relate primarily to increases in the number of employees. Stock compensation expense increased primarily due to increases in headcount and the value of equity issued.
53
Depreciation and amortization. Depreciation and amortization expense increased by $1.9 billion and $2.8 billion during the three and nine months ended September 30, 2016, respectively, compared to the corresponding periods in 2015 primarily as a result of additional depreciation and amortization related to the Transactions, inclusive of the incremental amounts as a result of the higher fair values recorded in acquisition accounting.
Other operating expenses, net. The changes in other operating expenses, net are attributable to the following (dollars in millions):
Three months ended September 30, 2016 compared to three months ended September 30, 2015 Increase / (Decrease) | Nine months ended September 30, 2016 compared to nine months ended September 30, 2015 Increase / (Decrease) | ||||||
Merger and restructuring costs | $ | 186 | $ | 462 | |||
Other pension benefits | (13 | ) | (533 | ) | |||
Special charges, net | 3 | (3 | ) | ||||
(Gain) loss on sale of assets, net | (2 | ) | (15 | ) | |||
$ | 174 | $ | (89 | ) | |||
The increase in merger and restructuring costs is primarily due to approximately $171 million and $451 million of employee retention and employee termination costs incurred during the three and nine months ended September 30, 2016, respectively. The increase in other pension benefits during the nine months ended September 30, 2016 compared to the corresponding prior period is primarily due to the pension curtailment gain of $675 million, net of the remeasurement loss of $157 million. For more information, see Notes 12 and 17 to the accompanying consolidated financial statements contained in “Item 1. Financial Statements.”
Interest expense, net. Net interest expense increased by $537 million and $743 million for the three and nine months ended September 30, 2016, respectively, compared to the corresponding periods in 2015 primarily as a result of an increase of approximately $239 million and $354 million, respectively, of interest expense associated with the debt incurred to fund the Transactions, and $243 million and $359 million, respectively, associated with debt assumed from Legacy TWC.
Loss on extinguishment of debt. Loss on extinguishment of debt of $110 million and $126 million for the nine months ended September 30, 2016 and 2015, respectively, primarily represent losses recognized as a result of the repurchase of CCO Holdings notes. For more information, see Note 7 to the accompanying consolidated financial statements contained in “Item 1. Financial Statements.”
Gain (loss) on financial instruments, net. Interest rate derivative instruments are used to manage our interest costs and to reduce our exposure to increases in floating interest rates, and cross-currency derivative instruments are used to manage foreign exchange risk related to the foreign currency denominated debt assumed in the TWC Transaction. We recorded gains of $71 million and $16 million during the three and nine months ended September 30, 2016, respectively, and losses of $5 million and $10 million during the three and nine months ended September 30, 2015, respectively. Gains and losses on financial instruments are recognized due to changes in the fair value of our interest rate and cross currency derivative instruments and the remeasurement of the fixed-rate British pound sterling denominated notes (the “Sterling Notes”) into U.S. dollars. The nine months ended September 30, 2016, also includes an $11 million loss realized upon termination of Legacy TWC interest rate swap derivative instruments. For more information, see Note 9 to the accompanying consolidated financial statements contained in “Item 1. Financial Statements.”
Other expense, net. Other expense, net primarily represents equity losses on our equity-method investments. For more information, see Note 5 to the accompanying consolidated financial statements contained in “Item 1. Financial Statements.”
Income tax benefit. We recognized income tax benefit of $7 million for the three months ended September 30, 2016, and $219 million and $212 million for the three and nine months ended September 30, 2015, respectively. Current federal and state income tax expense was $7 million and $14 million for the three and nine months ended September 30, 2016, respectively, and $4 million for the nine months ended September 30, 2015. The tax provision in future periods will vary based on current and future temporary differences, as well as future operating results. For more information, see Note 13 to the accompanying consolidated financial statements contained in “Item 1. Financial Statements.”
54
Net income attributable to noncontrolling interest. Net income attributable to noncontrolling interest in 2016 relates to our third-party interest in CV of Viera, LLP, a consolidated joint venture in a small cable system in Florida assumed in the Transactions. Net income attributable to noncontrolling interest in 2015 included the 2% accretion of the preferred membership interests in CC VIII, LLC (“CC VIII”) plus approximately 18.6% of CC VIII’s income, net of accretion. On December 31, 2015, the CC VIII preferred interest held by CCH I, LLC was contributed to CC VIII and subsequently canceled. For more information, see Note 5 to the accompanying consolidated financial statements contained in “Item 1. Financial Statements.”
Net income (loss) attributable to CCO Holdings member. Net income attributable to CCO Holdings member decreased from $282 million for the three months ended September 30, 2015 to $265 million for the three months ended September 30, 2016, and increased from $185 million for the nine months ended September 30, 2015 to $678 million for the nine months ended September 30, 2016 primarily as a result of the factors described above. On a pro forma basis, assuming the Transactions occurred as of January 1, 2015, net income attributable to CCO Holdings member increased from $253 million for the three months ended September 30, 2015 to $265 million for the three months ended September 30, 2016, and increased from $342 million for the nine months ended September 30, 2015 to $1.1 billion for the nine months ended September 30, 2016.
Use of Adjusted EBITDA and Free Cash Flow
We use certain measures that are not defined by U.S. generally accepted accounting principles (“GAAP”) to evaluate various aspects of our business. Adjusted EBITDA and free cash flow are non-GAAP financial measures and should be considered in addition to, not as a substitute for, consolidated net income (loss) and net cash flows from operating activities reported in accordance with GAAP. These terms, as defined by us, may not be comparable to similarly titled measures used by other companies. Adjusted EBITDA and free cash flow are reconciled to consolidated net income (loss) and net cash flows from operating activities, respectively, below.
Adjusted EBITDA is defined as consolidated net income (loss) plus net interest expense, income tax benefit, depreciation and amortization, stock compensation expense, loss on extinguishment of debt, (gain) loss on financial instruments, other expense, net and other operating expenses, such as merger and restructuring costs, other pension benefits, special charges and (gain) loss on sale or retirement of assets. As such, it eliminates the significant non-cash depreciation and amortization expense that results from the capital-intensive nature of our businesses as well as other non-cash or special items, and is unaffected by our capital structure or investment activities. However, this measure is limited in that it does not reflect the periodic costs of certain capitalized tangible and intangible assets used in generating revenues and our cash cost of financing. These costs are evaluated through other financial measures.
Free cash flow is defined as net cash flows from operating activities, less capital expenditures and changes in accrued expenses related to capital expenditures.
Management and Charter’s board of directors use Adjusted EBITDA and free cash flow to assess our performance and our ability to service our debt, fund operations and make additional investments with internally generated funds. In addition, Adjusted EBITDA generally correlates to the leverage ratio calculation under our credit facilities or outstanding notes to determine compliance with the covenants contained in the facilities and notes (all such documents have been previously filed with the Securities and Exchange Commission (the “SEC”)). For the purpose of calculating compliance with leverage covenants, we use Adjusted EBITDA, as presented, excluding certain expenses paid by our operating subsidiaries to other Charter entities. Our debt covenants refer to these expenses as management fees, which were $330 million and $79 million for the three months ended September 30, 2016 and 2015, respectively, and $634 million and $231 million for the nine months ended September 30, 2016 and 2015, respectively.
55
Three Months Ended September 30, | Nine Months Ended September 30, | ||||||||||||||
2016 | 2015 | 2016 | 2015 | ||||||||||||
Actual | |||||||||||||||
Consolidated net income | $ | 266 | $ | 295 | $ | 679 | $ | 219 | |||||||
Plus: Interest expense, net | 729 | 192 | 1,391 | 648 | |||||||||||
Income tax benefit | (7 | ) | (219 | ) | — | (212 | ) | ||||||||
Depreciation and amortization | 2,435 | 538 | 4,409 | 1,580 | |||||||||||
Stock compensation expense | 81 | 20 | 168 | 58 | |||||||||||
Loss on extinguishment of debt | — | — | 110 | 126 | |||||||||||
(Gain) loss on financial instruments, net | (71 | ) | 5 | (16 | ) | 10 | |||||||||
Other, net | 195 | 19 | (18 | ) | 69 | ||||||||||
Adjusted EBITDA | $ | 3,628 | $ | 850 | $ | 6,723 | $ | 2,498 | |||||||
Net cash flows from operating activities | $ | 2,790 | $ | 677 | $ | 5,538 | $ | 1,821 | |||||||
Less: Purchases of property, plant and equipment | (1,748 | ) | (509 | ) | (3,437 | ) | (1,292 | ) | |||||||
Change in accrued expenses related to capital expenditures | (52 | ) | 28 | 86 | 11 | ||||||||||
Free cash flow | $ | 990 | $ | 196 | $ | 2,187 | $ | 540 | |||||||
Three Months Ended September 30, | Nine Months Ended September 30, | ||||||||||||||
2016 | 2015 | 2016 | 2015 | ||||||||||||
Pro Forma | |||||||||||||||
Consolidated net income | $ | 266 | $ | 266 | $ | 1,113 | $ | 376 | |||||||
Plus: Interest expense, net | 729 | 724 | 2,160 | 2,270 | |||||||||||
Income tax benefit | (7 | ) | (219 | ) | — | (212 | ) | ||||||||
Depreciation and amortization | 2,435 | 2,354 | 7,054 | 6,955 | |||||||||||
Stock compensation expense | 81 | 62 | 219 | 184 | |||||||||||
Loss on extinguishment of debt | — | — | 110 | 126 | |||||||||||
(Gain) loss on financial instruments, net | (71 | ) | 5 | (16 | ) | 10 | |||||||||
Other, net | 195 | (16 | ) | (44 | ) | (135 | ) | ||||||||
Adjusted EBITDA | $ | 3,628 | $ | 3,176 | $ | 10,596 | $ | 9,574 | |||||||
Liquidity and Capital Resources
Introduction
This section contains a discussion of our liquidity and capital resources, including a discussion of our cash position, sources and uses of cash, access to credit facilities and other financing sources, historical financing activities, cash needs, capital expenditures and outstanding debt.
Overview of Our Contractual Obligations and Liquidity
We have significant amounts of debt. The principal amount of our debt as of September 30, 2016 was $60.2 billion, consisting of $9.0 billion of credit facility debt, $37.8 billion of investment grade senior secured notes and $13.4 billion of high-yield senior unsecured notes. Our business requires significant cash to fund principal and interest payments on our debt. As of September 30, 2016, $49 million of our long-term debt matures in 2016, $2.2 billion in 2017, $2.2 billion in 2018, $3.5 billion in 2019, $5.2 billion in 2020 and $47.0 billion thereafter.
56
Our projected cash needs and projected sources of liquidity depend upon, among other things, our actual results, and the timing and amount of our expenditures. Free cash flow was $990 million and $196 million for the three months ended September 30, 2016 and 2015, respectively, and $2.2 billion and $540 million for the nine months ended September 30, 2016 and 2015, respectively. As of September 30, 2016, the amount available under our credit facilities was approximately $2.8 billion and cash on hand was approximately $1.0 billion. We expect to utilize free cash flow, cash on hand and availability under our credit facilities as well as future refinancing transactions to further extend the maturities of or reduce the principal on our obligations. The timing and terms of any refinancing transactions will be subject to market conditions. Additionally, we may, from time to time, and depending on market conditions and other factors, use cash on hand and the proceeds from securities offerings or other borrowings to retire our debt through open market purchases, privately negotiated purchases, tender offers or redemption provisions. We believe we have sufficient liquidity from cash on hand, free cash flow and Charter Operating’s revolving credit facility as well as access to the capital markets to fund our projected cash needs.
We continue to evaluate the deployment of our anticipated future free cash flow including to invest in our business growth and other strategic opportunities, including mergers and acquisitions as well as distributions to our parent company for stock repurchases and dividends and to reduce our leverage. Charter’s target leverage remains at 4 to 4.5 times, and 3.5 times at the Charter Operating level. On October 25, 2016, Charter’s board of directors authorized management to engage in opportunistic share repurchases of up to $750 million in any six-month period with the first period commencing the day of any repurchase after Charter’s third quarter 2016 earnings release and provided that Charter’s net debt remains within its then current target leverage range. Charter is not obligated to acquire any particular amount of common stock, and the timing of any purchases that may occur cannot be predicted and will largely depend on market conditions and other potential uses of capital. Purchases may include open market purchases or negotiated transactions. To the extent such purchase occurs, CCO Holdings would likely be required to fund such purchases through parent company distributions. As possible acquisitions, swaps or dispositions arise in our industry, we actively review them against our objectives including, among other considerations, improving the operational efficiency, clustering or technology capabilities of our business and achieving appropriate return targets, and we may participate to the extent we believe these possibilities present attractive opportunities. However, there can be no assurance that we will actually complete any acquisitions, dispositions or system swaps, or that any such transactions will be material to our operations or results.
Free Cash Flow
Free cash flow increased $794 million and $1.6 billion during the three and nine months ended September 30, 2016 compared to the corresponding prior periods in 2015, respectively, due to the following (dollars in millions).
Three months ended September 30, 2016 compared to three months ended September 30, 2015 Increase / (Decrease) | Nine months ended September 30, 2016 compared to nine months ended September 30, 2015 Increase / (Decrease) | ||||||
Increase in Adjusted EBITDA | $ | 2,778 | $ | 4,225 | |||
Changes in working capital, excluding change in accrued interest | 154 | 652 | |||||
Increase in capital expenditures | (1,239 | ) | (2,145 | ) | |||
Increase in cash paid for interest, net | (757 | ) | (819 | ) | |||
Increase in merger and restructuring costs | (129 | ) | (260 | ) | |||
Other, net | (13 | ) | (6 | ) | |||
$ | 794 | $ | 1,647 | ||||
57
Contractual Obligations
The following table summarizes our payment obligations as of September 30, 2016 under our long-term debt and certain other contractual obligations and commitments (dollars in millions).
Payments by Period | |||||||||||||||||||||
Total | Remainder of 2016 | 2017-2018 | 2019-2020 | More than 5 years | |||||||||||||||||
Long-Term Debt Principal Payments (a) | $ | 60,168 | $ | 49 | $ | 4,394 | $ | 8,762 | $ | 46,963 | |||||||||||
Long-Term Debt Interest Payments (b) | 38,978 | 724 | 6,503 | 5,703 | 26,048 | ||||||||||||||||
Capital and Operating Lease Obligations (c) | 1,332 | 82 | 450 | 295 | 505 | ||||||||||||||||
Programming Minimum Commitments (d) | 355 | 58 | 258 | 39 | — | ||||||||||||||||
Other (e) | 13,331 | 291 | 1,624 | 1,311 | 10,105 | ||||||||||||||||
Total | $ | 114,164 | $ | 1,204 | $ | 13,229 | $ | 16,110 | $ | 83,621 | |||||||||||
(a) | The table presents maturities of long-term debt outstanding as of September 30, 2016. Refer to Note 7 to the accompanying consolidated financial statements contained in “Item 1. Financial Statements” for a description of our long-term debt. |
(b) | Interest payments on variable debt are estimated using amounts outstanding as of September 30, 2016 and the average implied forward London Interbank Offering Rate (“LIBOR”) rates applicable for the quarter during the interest rate reset based on the yield curve in effect at September 30, 2016. Actual interest payments will differ based on actual LIBOR rates and actual amounts outstanding for applicable periods. |
(c) | We lease certain facilities and equipment under noncancelable capital and operating leases. Leases and rental costs charged to expense for the three months ended September 30, 2016 and 2015 were $79 million and $12 million, respectively, and for the nine months ended September 30, 2016 and 2015 were $136 million and $36 million, respectively. |
(d) | We pay programming fees under multi-year contracts ranging from three to ten years, typically based on a flat fee per customer, which may be fixed for the term, or may in some cases escalate over the term. Programming costs included in the accompanying statement of operations were approximately $2.4 billion and $667 million for the three months ended September 30, 2016 and 2015, respectively, and $4.6 billion and $2.0 billion for the nine months ended September 30, 2016 and 2015, respectively. Certain of our programming agreements are based on a flat fee per month or have guaranteed minimum payments. The table sets forth the aggregate guaranteed minimum commitments under our programming contracts. |
(e) | “Other” represents other guaranteed minimum commitments, including programming rights negotiated directly with content owners for distribution on Company-owned channels or networks and commitments related to our role as an advertising and distribution sales agent for third party-owned channels or networks as well as commitments to our customer premise equipment vendors. |
Charter has agreed to certain commitments that were effective upon the consummation of the Transactions. See “Transaction-Related Commitments” for more information. Additionally, see Note 15 to the accompanying consolidated financial statements contained in “Item 1. Financial Statements” for items not included in the contractual obligations table, but we incur as part of operations.
Limitations on Distributions
Distributions by us and our subsidiaries to a parent company for payment of principal on parent company notes are restricted under indentures and credit facilities governing our indebtedness, unless there is no default under the applicable indenture and credit facilities, and unless each applicable subsidiary’s leverage ratio test is met at the time of such distribution. As of September 30, 2016, there was no default under any of these indentures or credit facilities, and each subsidiary met its applicable leverage ratio tests based on September 30, 2016 financial results. Such distributions would be restricted, however, if any such subsidiary fails to meet these tests at the time of the contemplated distribution. In the past, certain subsidiaries have from time to time failed to meet their leverage ratio test. There can be no assurance that they will satisfy these tests at the time of the contemplated distribution. Distributions by Charter Operating for payment of principal on parent company notes are further restricted by the covenants in its credit facilities.
58
However, without regard to leverage, during any calendar year or any portion thereof during which we are a flow-through entity for tax purposes, and so long as no event of default exists, we and our subsidiaries may make distributions to our parent companies in an amount sufficient to make permitted tax payments.
In addition to the limitation on distributions under the various indentures discussed above, distributions by our subsidiaries may be limited by applicable law, including the Delaware Limited Liability Company Act, under which our subsidiaries may only make distributions if they have “surplus” as defined in the act.
Historical Operating, Investing, and Financing Activities
Cash and Cash Equivalents. We held $996 million and $5 million in cash and cash equivalents as of September 30, 2016 and December 31, 2015, respectively.
Operating Activities. Net cash provided by operating activities increased $3.7 billion during the nine months ended September 30, 2016 compared to the nine months ended September 30, 2015, primarily due to an increase in Adjusted EBITDA of $4.2 billion offset by an increase in cash paid for interest, net of $819 million.
Investing Activities. Net cash used in investing activities was $3.4 billion and net cash provided by investing activities was $2.2 billion for the nine months ended September 30, 2016 and 2015, respectively. The increase in cash used was primarily due to the repayment in 2015 of $3.5 billion of net proceeds held in escrow upon the termination of the proposed transactions with Comcast as well as an increase in capital expenditures of $2.1 billion.
Financing Activities. Net cash used in financing activities was $1.2 billion and $4.0 billion for the nine months ended September 30, 2016 and 2015, respectively. The decrease in cash used was primarily due to the repayment in 2015 of $3.5 billion of net proceeds held in escrow upon the termination of the proposed transactions with Comcast.
Capital Expenditures
We have significant ongoing capital expenditure requirements. Capital expenditures were $1.7 billion and $509 million for the three months ended September 30, 2016 and 2015, respectively, and $3.4 billion and $1.3 billion for the nine months ended September 30, 2016 and 2015, respectively. The increase was driven by the Transactions. On a pro forma basis, assuming the Transactions occurred as of January 1, 2015, the increase for the nine months ended September 30, 2016 compared to the corresponding prior period was driven by higher product development investments, transition capital expenditures incurred in connection with the Transactions and support capital investments. See the table below for more details.
The actual amount of our capital expenditures in 2016 will depend on a number of factors, including the pace of transition planning to service a larger customer base as a result of the Transactions and growth rates of both our residential and commercial businesses.
Our capital expenditures are funded primarily from cash flows from operating activities and borrowings on our credit facility. In addition, our accrued liabilities related to capital expenditures increased by $86 million and $11 million for the nine months ended September 30, 2016 and 2015, respectively.
59
The following tables present our major capital expenditures categories on an actual and pro forma basis, assuming the Transactions occurred as of January 1, 2015, in accordance with National Cable and Telecommunications Association (“NCTA”) disclosure guidelines for the three and nine months ended September 30, 2016 and 2015. The disclosure is intended to provide more consistency in the reporting of capital expenditures among peer companies in the cable industry. These disclosure guidelines are not required disclosures under GAAP, nor do they impact our accounting for capital expenditures under GAAP (dollars in millions):
Three Months Ended September 30, | Nine Months Ended September 30, | ||||||||||||||
2016 | 2015 | 2016 | 2015 | ||||||||||||
Actual | |||||||||||||||
Customer premise equipment (a) | $ | 662 | $ | 163 | $ | 1,177 | $ | 448 | |||||||
Scalable infrastructure (b) | 441 | 142 | 937 | 335 | |||||||||||
Line extensions (c) | 249 | 57 | 467 | 144 | |||||||||||
Upgrade/rebuild (d) | 156 | 38 | 307 | 94 | |||||||||||
Support capital (e) | 240 | 109 | 549 | 271 | |||||||||||
Total capital expenditures | $ | 1,748 | $ | 509 | $ | 3,437 | $ | 1,292 | |||||||
Capital expenditures included in total related to: | |||||||||||||||
Commercial services | $ | 278 | $ | 70 | $ | 533 | $ | 186 | |||||||
Transition (f) | $ | 109 | $ | 24 | $ | 273 | $ | 66 | |||||||
Three Months Ended September 30, | Nine Months Ended September 30, | ||||||||||||||
2016 | 2015 | 2016 | 2015 | ||||||||||||
Pro Forma | |||||||||||||||
Customer premise equipment (a) | $ | 662 | $ | 712 | $ | 2,074 | $ | 2,097 | |||||||
Scalable infrastructure (b) | 441 | 330 | 1,556 | 1,188 | |||||||||||
Line extensions (c) | 249 | 237 | 751 | 725 | |||||||||||
Upgrade/rebuild (d) | 156 | 171 | 461 | 438 | |||||||||||
Support capital (e) | 240 | 249 | 815 | 690 | |||||||||||
Total capital expenditures | $ | 1,748 | $ | 1,699 | $ | 5,657 | $ | 5,138 | |||||||
(a) | Customer premise equipment includes costs incurred at the customer residence to secure new customers and revenue generating units. It also includes customer installation costs and customer premise equipment (e.g., set-top boxes and cable modems). |
(b) | Scalable infrastructure includes costs not related to customer premise equipment, to secure growth of new customers and revenue generating units, or provide service enhancements (e.g., headend equipment). |
(c) | Line extensions include network costs associated with entering new service areas (e.g., fiber/coaxial cable, amplifiers, electronic equipment, make-ready and design engineering). |
(d) | Upgrade/rebuild includes costs to modify or replace existing fiber/coaxial cable networks, including betterments. |
(e) | Support capital includes costs associated with the replacement or enhancement of non-network assets due to technological and physical obsolescence (e.g., non-network equipment, land, buildings and vehicles). |
(f) | Transition represents incremental costs incurred to integrate the Legacy TWC and Legacy Bright House operations and to bring the three companies’ systems and processes into a uniform operating structure. |
Recently Issued Accounting Standards
See Note 19 to the accompanying consolidated financial statements contained in “Item 1. Financial Statements” for a discussion of recently issued accounting standards.
60
Item 3. Quantitative and Qualitative Disclosures About Market Risk.
We use derivative instruments to manage interest rate risk on variable debt and foreign exchange risk on the Sterling Notes, and do not hold or issue derivative instruments for speculative trading purposes.
Interest rate derivative instruments are used to manage interest costs and to reduce our exposure to increases in floating interest rates. We manage our exposure to fluctuations in interest rates by maintaining a mix of fixed and variable-rate debt. Using interest rate derivative instruments, we agree to exchange, at specified intervals through 2017, the difference between fixed and variable interest amounts calculated by reference to agreed-upon notional principal amounts.
Upon closing of the TWC Transaction, we assumed cross-currency derivative instruments. Cross-currency derivative instruments are used to effectively convert £1.275 billion aggregate principal amount of fixed-rate British pound sterling denominated debt, including annual interest payments and the payment of principal at maturity, to fixed-rate U.S. dollar denominated debt. The cross-currency derivative instruments have maturities of June 2031 and July 2042. We are required to post collateral on the cross-currency derivative instruments when such instruments are in a liability position. In May 2016, we entered into a collateral holiday agreement for 80% of both the 2031 and 2042 cross-currency swaps, which eliminates the requirement to post collateral for three years. For more information, see Note 9 to the accompanying consolidated financial statements contained in “Item 1. Financial Statements.”
As of September 30, 2016 and December 31, 2015, the principal amount of our debt was approximately $60.2 billion and $14.1 billion, respectively. As of September 30, 2016 and December 31, 2015, the weighted average interest rate on the credit facility debt, including the effects of our interest rate swap agreements, was approximately 3.2% and the weighted average interest rate on the senior notes was approximately 5.9%, resulting in a blended weighted average interest rate of 5.5% and 5.2%, respectively. The interest rate on approximately 87% and 83% of the total principal amount of our debt was effectively fixed, including the effects of our interest rate swap agreements as of September 30, 2016 and December 31, 2015, respectively.
The table set forth below summarizes the fair values and contract terms of financial instruments subject to interest rate risk maintained by us as of September 30, 2016 (dollars in millions).
2016 | 2017 | 2018 | 2019 | 2020 | Thereafter | Total | Fair Value | ||||||||||||||||||||||||
Debt: | |||||||||||||||||||||||||||||||
Fixed-Rate | $ | — | $ | 2,000 | $ | 2,000 | $ | 3,250 | $ | 3,500 | $ | 40,453 | $ | 51,203 | $ | 56,899 | |||||||||||||||
Average Interest Rate | — | % | 5.85 | % | 6.75 | % | 8.44 | % | 4.19 | % | 5.76 | % | 5.86 | % | |||||||||||||||||
Variable Rate | $ | 49 | $ | 197 | $ | 197 | $ | 296 | $ | 1,716 | $ | 6,510 | $ | 8,965 | $ | 8,975 | |||||||||||||||
Average Interest Rate | 2.91 | % | 3.21 | % | 3.35 | % | 3.99 | % | 3.81 | % | 4.41 | % | 4.22 | % | |||||||||||||||||
Interest Rate Instruments: | |||||||||||||||||||||||||||||||
Variable to Fixed-Rate | $ | 250 | $ | 850 | $ | — | $ | — | $ | — | $ | — | $ | 1,100 | $ | 8 | |||||||||||||||
Average Pay Rate | 3.89 | % | 3.84 | % | — | % | — | % | — | % | — | % | 3.86 | % | |||||||||||||||||
Average Receive Rate | 3.17 | % | 3.35 | % | — | % | — | % | — | % | — | % | 3.31 | % | |||||||||||||||||
As of September 30, 2016, we had $1.1 billion in notional amounts of interest rate derivative instruments outstanding. The notional amounts of interest rate derivative instruments do not represent amounts exchanged by the parties and, thus, are not a measure of our exposure to credit loss. The amounts exchanged are determined by reference to the notional amount and the other terms of the contracts.
The estimated fair value of the interest rate derivative instruments is determined using a present value calculation based on an implied forward LIBOR curve (adjusted for Charter Operating’s and counterparties’ credit risk). Interest rates on variable-rate debt are estimated using the average implied forward LIBOR for the year of maturity based on the yield curve in effect at September 30, 2016 including applicable bank spread.
Item 4. Controls and Procedures.
As of the end of the period covered by this report, under the supervision and with the participation of our management, including our Chief Executive Officer and Chief Financial Officer, we have evaluated the effectiveness of our design and operation of
61
disclosure controls and procedures with respect to the information generated for use in this quarterly report. The evaluation was based upon reports and certifications provided by a number of executives. Based on, and as of the date of that evaluation, our Chief Executive Officer and Chief Financial Officer concluded that the disclosure controls and procedures were effective to provide reasonable assurances that information required to be disclosed in the reports we file or submit under the Securities Exchange Act of 1934 is recorded, processed, summarized and reported within the time periods specified in the SEC’s rules and forms.
In designing and evaluating the disclosure controls and procedures, our management recognized that any controls and procedures, no matter how well designed and operated, can provide only reasonable, not absolute, assurance of achieving the desired control objectives, and management necessarily was required to apply its judgment in evaluating the cost-benefit relationship of possible controls and procedures. Based upon the evaluation, we believe that our controls provide such reasonable assurances.
On May 18, 2016, we completed the Transactions and as a result, we have incorporated internal controls over significant processes specific to the Transactions and to activities post Transactions that we believe to be appropriate and necessary in consideration of the related integration, including controls associated with the Transactions for the valuations of certain Legacy TWC and Legacy Bright House assets and liabilities assumed, as well as adoption of common financial reporting and internal control practices for the combined company. As we further integrate Legacy TWC and Legacy Bright House, we will continue to validate the effectiveness and integration of internal controls.
Except as described above in the preceding paragraph, during the quarter ended September 30, 2016, there was no change in our internal control over financial reporting that has materially affected, or is reasonably likely to materially affect, our internal control over financial reporting.
62
PART II
Item 1. Legal Proceedings.
See Note 15 to the accompanying consolidated financial statements contained in “Item 1. Financial Statements,” for a description of our legal proceedings.
Item 1A. Risk Factors.
Our Quarterly Report on Form 10-Q for the three and six months ended June 30, 2016 includes “Risk Factors” under Item 1A of Part II. There have been no material changes from the updated risk factors described in our Form 10-Q.
Item 6. Exhibits.
See Exhibit Index.
63
SIGNATURES
Pursuant to the requirements of the Securities Exchange Act of 1934, as amended, CCO Holdings, LLC and CCO Holdings Capital Corp. have duly caused this quarterly report to be signed on their behalf by the undersigned, thereunto duly authorized.
CCO HOLDINGS, LLC | ||||
Registrant | ||||
By: CHARTER COMMUNICATIONS, INC., Sole Manager | ||||
By: | /s/ Kevin D. Howard | |||
Kevin D. Howard | ||||
Senior Vice President - Finance, Controller and | ||||
Date: November 10, 2016 | Chief Accounting Officer | |||
CCO HOLDINGS CAPITAL CORP. | ||||
Registrant | ||||
By: | /s/ Kevin D. Howard | |||
Kevin D. Howard | ||||
Senior Vice President - Finance, Controller and | ||||
Date: November 10, 2016 | Chief Accounting Officer | |||
S- 1
Exhibit Index
Exhibit | Description | |
31.1* | Certificate of Chief Executive Officer pursuant to Rule 13a-14(a)/Rule 15d-14(a) under the under the Securities Exchange Act of 1934. | |
31.2* | Certificate of Chief Financial Officer pursuant to Rule 13a-14(a)/Rule 15d-14(a) under the Securities Exchange Act of 1934. | |
32.1* | Certification pursuant to 18 U.S.C. Section 1350, as adopted pursuant to Section 906 of the Sarbanes-Oxley Act of 2002 (Chief Executive Officer). | |
32.2* | Certification pursuant to 18 U.S.C. Section 1350, as adopted pursuant to Section 906 of the Sarbanes-Oxley Act of 2002 (Chief Financial Officer). | |
99.1* | Reconciliation of pro forma financial information. | |
101** | The following financial statements from CCO Holdings, LLC’s Quarterly Report on Form 10-Q for the three and nine months ended September 30, 2016, filed with the Securities and Exchange Commission on November 10, 2016, formatted in XBRL (eXtensible Business Reporting Language): (i) the Consolidated Balance Sheets; (ii) the Consolidated Statements of Operations; (iii) the Consolidated Statements of Comprehensive Income; (iv) the Consolidated Statements of Changes in Member’s Equity; (v) the Consolidated Statements of Cash Flows; and (vi) the Notes to the Consolidated Financial Statements. | |
_____________
* | Filed herewith. |
** | This exhibit will not be deemed “filed” for purposes of Section 18 of the Securities Exchange Act of 1934 (15 U.S.C. 78r) or otherwise subject to the liability of that section. Such exhibit will not be deemed to be incorporated by reference into any filing under the Securities Act or Securities Exchange Act, except to the extent that the company specifically incorporates it by reference. |
E- 1