Attached files
| file | filename |
|---|---|
| EX-10.1 - EXHIBIT 10.1 - Clearway Energy, Inc. | yieldincex1012016q3.htm |
| EX-32 - EXHIBIT 32 - Clearway Energy, Inc. | yieldincex322016q3.htm |
| EX-31.3 - EXHIBIT 31.3 - Clearway Energy, Inc. | yieldincex3132016q3.htm |
| EX-31.2 - EXHIBIT 31.2 - Clearway Energy, Inc. | yieldincex3122016q3.htm |
| EX-31.1 - EXHIBIT 31.1 - Clearway Energy, Inc. | yieldincex3112016q3.htm |
UNITED STATES SECURITIES AND EXCHANGE COMMISSION
Washington, D.C. 20549
FORM 10-Q
x | Quarterly report pursuant to Section 13 or 15(d) of the Securities Exchange Act of 1934 | |
For the Quarterly Period Ended: September 30, 2016 | ||
o | Transition report pursuant to Section 13 or 15(d) of the Securities Exchange Act of 1934 | |
Commission File Number: 001-36002
NRG Yield, Inc.
(Exact name of registrant as specified in its charter)
Delaware (State or other jurisdiction of incorporation or organization) | 46-1777204 (I.R.S. Employer Identification No.) | |
804 Carnegie Center, Princeton, New Jersey (Address of principal executive offices) | 08540 (Zip Code) | |
(609) 524-4500
(Registrant’s telephone number, including area code)
Indicate by check mark whether the registrant (1) has filed all reports required to be filed by Section 13 or 15(d) of the Securities Exchange Act of 1934 during the preceding 12 months (or for such shorter period that the registrant was required to file such reports), and (2) has been subject to such filing requirements for the past 90 days.
Yes x No o
Indicate by check mark whether the registrant has submitted electronically and posted on its corporate Web site, if any, every Interactive Data File required to be submitted and posted pursuant to Rule 405 of Regulation S-T (§232.405 of this chapter) during the preceding 12 months (or for such shorter period that the registrant was required to submit and post such files).
Yes x No o
Indicate by check mark whether the registrant is a large accelerated filer, an accelerated filer, a non-accelerated filer, or a smaller reporting company. See the definitions of “large accelerated filer,” “accelerated filer,” and “smaller reporting company” in Rule 12b-2 of the Exchange Act.
Large accelerated filer x | Accelerated filer o | Non-accelerated filer o | Smaller reporting company o | |||
(Do not check if a smaller reporting company) | ||||||
Indicate by check mark whether the registrant is a shell company (as defined in Rule 12b-2 of the Exchange Act).
Yes o No x
As of October 31, 2016, there were 34,586,250 shares of Class A common stock outstanding, par value $0.01 per share, 42,738,750 shares of Class B common stock outstanding, par value $0.01 per share, 62,784,250 shares of Class C common stock outstanding, par value $0.01 per share, and 42,738,750 shares of Class D common stock outstanding, par value $0.01 per share.
TABLE OF CONTENTS
Index
2
CAUTIONARY STATEMENT REGARDING FORWARD-LOOKING INFORMATION
This Quarterly Report on Form 10-Q of NRG Yield, Inc., together with its consolidated subsidiaries, or the Company, includes forward-looking statements within the meaning of Section 27A of the Securities Act of 1933, as amended, or the Securities Act, and Section 21E of the Securities Exchange Act of 1934, as amended, or the Exchange Act. The words "believes," "projects," "anticipates," "plans," "expects," "intends," "estimates" and similar expressions are intended to identify forward-looking statements. These forward-looking statements involve known and unknown risks, uncertainties and other factors that may cause the Company's actual results, performance and achievements, or industry results, to be materially different from any future results, performance or achievements expressed or implied by such forward-looking statements. These factors, risks and uncertainties include the factors described under Item 1A — Risk Factors in Part I, Item 1A of the Company's Annual Report on Form 10-K for the year ended December 31, 2015, and the following:
• | The Company's ability to maintain and grow its quarterly dividend; |
• | The Company's ability to successfully identify, evaluate and consummate acquisitions from third parties; |
• | The Company's ability to acquire assets from NRG; |
• | The Company's ability to raise additional capital due to its indebtedness, corporate structure, market conditions or otherwise; |
• | Hazards customary to the power production industry and power generation operations such as fuel and electricity price volatility, unusual weather conditions (including wind and solar conditions), catastrophic weather-related or other damage to facilities, unscheduled generation outages, maintenance or repairs, unanticipated changes to fuel supply costs or availability due to higher demand, shortages, transportation problems or other developments, environmental incidents, or electric transmission or gas pipeline system constraints and the possibility that the Company may not have adequate insurance to cover losses as a result of such hazards; |
• | The Company's ability to operate its businesses efficiently, manage maintenance capital expenditures and costs effectively, and generate earnings and cash flows from its asset-based businesses in relation to its debt and other obligations; |
• | The willingness and ability of counterparties to the Company's offtake agreements to fulfill their obligations under such agreements; |
• | The Company's ability to enter into contracts to sell power and procure fuel on acceptable terms and prices as current offtake agreements expire; |
• | Government regulation, including compliance with regulatory requirements and changes in market rules, rates, tariffs and environmental laws; |
• | Changes in law, including judicial decisions; |
• | Operating and financial restrictions placed on the Company that are contained in the project-level debt facilities and other agreements of certain subsidiaries and project-level subsidiaries generally, in the NRG Yield Operating LLC amended and restated revolving credit facility, in the indentures governing the Senior Notes and in the indentures governing the Company's convertible notes; and |
• | The Company's ability to borrow additional funds and access capital markets, as well as the Company's substantial indebtedness and the possibility that the Company may incur additional indebtedness going forward. |
Forward-looking statements speak only as of the date they were made, and the Company undertakes no obligation to publicly update or revise any forward-looking statements, whether as a result of new information, future events or otherwise. The foregoing review of factors that could cause the Company's actual results to differ materially from those contemplated in any forward-looking statements included in this Quarterly Report on Form 10-Q should not be construed as exhaustive.
3
GLOSSARY OF TERMS
When the following terms and abbreviations appear in the text of this report, they have the meanings indicated below:
2015 Form 10-K | NRG Yield, Inc.'s Annual Report on Form 10-K for the year ended December 31, 2015 | |
2019 Convertible Notes | $345 million aggregate principal amount of 3.50% convertible notes due 2019, issued by NRG Yield, Inc. | |
2020 Convertible Notes | $287.5 million aggregate principal amount of 3.25% convertible notes due 2020, issued by NRG Yield, Inc. | |
2024 Senior Notes | $500 million aggregate principal amount of 5.375% unsecured senior notes due 2024, issued by NRG Yield Operating LLC | |
2026 Senior Notes | $350 million aggregate principal amount of 5.00% unsecured senior notes due 2026, issued by NRG Yield Operating LLC | |
2037 Notes | $200 million aggregate principal amount of 4.68% senior secured notes due 2037, issued by CVSR Holdco | |
AOCL | Accumulated Other Comprehensive Loss | |
ARO | Asset Retirement Obligation | |
ASC | The FASB Accounting Standards Codification, which the FASB established as the source of authoritative GAAP | |
ASU | Accounting Standards Updates – updates to the ASC | |
ATM Program | At-The-Market Equity Offering Program | |
Buffalo Bear | Buffalo Bear, LLC, the operating subsidiary of Tapestry Wind LLC, which owns the Buffalo Bear project | |
CAFD | Cash Available For Distribution, which the Company defines as net income before interest expense, income taxes, depreciation and amortization, plus cash distributions from unconsolidated affiliates, less cash distributions to noncontrolling interests, maintenance capital expenditures, pro-rata EBITDA from unconsolidated affiliates, cash interest paid, income taxes paid, principal amortization of indebtedness and changes in other assets | |
Company | NRG Yield, Inc. together with its consolidated subsidiaries | |
CVSR | California Valley Solar Ranch | |
CVSR Drop Down | The Company's acquisition from NRG of the remaining 51.05% interest of CVSR Holdco | |
CVSR Holdco | CVSR Holdco LLC, the indirect owner of CVSR | |
DGPV Holdco 1 | NRG DGPV Holdco 1 LLC | |
DGPV Holdco 2 | NRG DGPV Holdco 2 LLC | |
Distributed Solar | Solar power projects, typically less than 20 MW in size, that primarily sell power produced to customers for usage on site, or are interconnected to sell power into the local distribution grid | |
Drop Down Assets | Collectively, the January 2015 Drop Down Assets, November 2015 Drop Down Assets, and CVSR Drop Down | |
Economic Gross Margin | Energy and capacity revenue less cost of fuels | |
EDA | Equity Distribution Agreement | |
El Segundo | NRG West Holdings LLC, the subsidiary of Natural Gas Repowering LLC, which owns the El Segundo Energy Center project | |
ERCOT | Electric Reliability Council of Texas, the ISO and the regional reliability coordinator of the various electricity systems within Texas | |
EWG | Exempt Wholesale Generator | |
Exchange Act | The Securities Exchange Act of 1934, as amended | |
FASB | Financial Accounting Standards Board | |
FERC | Federal Energy Regulatory Commission | |
GAAP | Accounting principles generally accepted in the U.S. | |
GenConn | GenConn Energy LLC | |
HLBV | Hypothetical Liquidation at Book Value | |
IASB | International Accounting Standards Board | |
ISO | Independent System Operator, also referred to as RTO | |
4
January 2015 Drop Down Assets | The Laredo Ridge, Tapestry and Walnut Creek projects, which were acquired by NRG Yield Operating LLC from NRG on January 2, 2015 | |
Kansas South | NRG Solar Kansas South LLC, the operating subsidiary of NRG Solar Kansas South Holdings LLC, which owns the Kansas South project | |
KPPH | 1,000 Pounds Per Hour | |
Laredo Ridge | Laredo Ridge Wind, LLC, the operating subsidiary of Mission Wind Laredo, LLC, which owns the Laredo Ridge project | |
LIBOR | London Inter-Bank Offered Rate | |
Marsh Landing | NRG Marsh Landing LLC, formerly GenOn Marsh Landing LLC | |
MMBtu | Million British Thermal Units | |
MW | Megawatts | |
MWh | Saleable megawatt hours, net of internal/parasitic load megawatt-hours | |
MWt | Megawatts Thermal Equivalent | |
NERC | North American Electric Reliability Corporation | |
Net Exposure | Counterparty credit exposure to NRG Yield, Inc. net of collateral | |
NOLs | Net Operating Losses | |
November 2015 Drop Down Assets | 75% of the Class B interests of NRG Wind TE Holdco, which owns a portfolio of 12 wind facilities totaling 814 net MW, which was acquired by NRG Yield Operating LLC from NRG on November 3, 2015 | |
NRG | NRG Energy, Inc. | |
NRG Wind TE Holdco | NRG Wind TE Holdco LLC | |
NRG Yield LLC | The holding company through which the projects are owned by NRG, the holder of Class B and Class D units, and NRG Yield, Inc., the holder of the Class A and Class C units | |
NRG Yield Operating LLC | The holder of the project assets that are owned by NRG Yield LLC | |
OCI/OCL | Other comprehensive income/loss | |
Pinnacle | Pinnacle Wind, LLC, the operating subsidiary of Tapestry Wind LLC, which owns the Pinnacle project | |
PML | NRG Power Marketing LLC | |
PPA | Power Purchase Agreement | |
PUCT | Public Utility Commission of Texas | |
QF | Qualifying Facility under the Public Utility Regulatory Policies Act of 1978 | |
Recapitalization | The adoption of the Company's Second Amended and Restated Certificate of Incorporation which authorized two new classes of common stock, Class C common stock and Class D common stock, and distributed shares of such new classes of common stock to holders of the Company’s outstanding Class A common stock and Class B common stock, respectively, through a stock split on May 14, 2015 | |
RPV Holdco | NRG RPV Holdco 1 LLC | |
RTO | Regional Transmission Organization | |
SEC | U.S. Securities and Exchange Commission | |
Senior Notes | Collectively, the 2024 Senior Notes and the 2026 Senior Notes | |
September 6, 2016 Form 8-K | NRG Yield, Inc.'s Current Report on Form 8-K filed on September 6, 2016 in connection with NRG Yield, Inc.'s acquisition of the remaining 51.05% interest in CVSR from NRG | |
TA High Desert | TA-High Desert LLC, the operating subsidiary of NRG Solar Mayfair LLC, which owns the TA High Desert project | |
Taloga | Taloga Wind, LLC, the operating subsidiary of Tapestry Wind LLC, which owns the Taloga project | |
Tapestry | Collection of the Pinnacle, Buffalo Bear and Taloga projects | |
Thermal Business | The Company's thermal business, which consists of thermal infrastructure assets that provide steam, hot water and/or chilled water, and in some instances electricity, to commercial businesses, universities, hospitals and governmental units | |
UPMC | University of Pittsburgh Medical Center | |
U.S. | United States of America | |
5
Utility Scale Solar | Solar power projects, typically 20 MW or greater in size (on an alternating current, or AC, basis), that are interconnected into the transmission or distribution grid to sell power at a wholesale level | |
VaR | Value at Risk | |
VIE | Variable Interest Entity | |
Walnut Creek | NRG Walnut Creek, LLC, the operating subsidiary of WCEP Holdings, LLC, which owns the Walnut Creek project | |
6
PART I - FINANCIAL INFORMATION
ITEM 1 — FINANCIAL STATEMENTS
NRG YIELD, INC.
CONSOLIDATED STATEMENTS OF INCOME
(Unaudited)
Three months ended September 30, | Nine months ended September 30, | ||||||||||||||
(In millions, except per share amounts) | 2016 | 2015 (a) | 2016 | 2015 (a) | |||||||||||
Operating Revenues | |||||||||||||||
Total operating revenues | $ | 272 | $ | 256 | $ | 789 | $ | 729 | |||||||
Operating Costs and Expenses | |||||||||||||||
Cost of operations | 76 | 82 | 238 | 246 | |||||||||||
Depreciation and amortization | 75 | 69 | 224 | 222 | |||||||||||
General and administrative | 4 | 3 | 10 | 9 | |||||||||||
Acquisition-related transaction and integration costs | — | 1 | — | 2 | |||||||||||
Total operating costs and expenses | 155 | 155 | 472 | 479 | |||||||||||
Operating Income | 117 | 101 | 317 | 250 | |||||||||||
Other Income (Expense) | |||||||||||||||
Equity in earnings of unconsolidated affiliates | 13 | 12 | 29 | 19 | |||||||||||
Other income, net | 1 | — | 3 | 2 | |||||||||||
Loss on debt extinguishment | — | (2 | ) | — | (9 | ) | |||||||||
Interest expense | (71 | ) | (71 | ) | (213 | ) | (201 | ) | |||||||
Total other expense, net | (57 | ) | (61 | ) | (181 | ) | (189 | ) | |||||||
Income Before Income Taxes | 60 | 40 | 136 | 61 | |||||||||||
Income tax expense | 13 | 8 | 25 | 8 | |||||||||||
Net Income | 47 | 32 | 111 | 53 | |||||||||||
Less: Pre-acquisition net income (loss) of Drop Down Assets | 6 | (2 | ) | 10 | (6 | ) | |||||||||
Net Income Excluding Pre-acquisition Net Income (Loss) of Drop Down Assets | 41 | 34 | 101 | 59 | |||||||||||
Less: Net income attributable to noncontrolling interests | 8 | 17 | 31 | 37 | |||||||||||
Net Income Attributable to NRG Yield, Inc. | $ | 33 | $ | 17 | $ | 70 | $ | 22 | |||||||
Earnings Per Share Attributable to NRG Yield, Inc. Class A and Class C Common Stockholders | |||||||||||||||
Weighted average number of Class A common shares outstanding - basic | 35 | 35 | 35 | 35 | |||||||||||
Weighted average number of Class A common shares outstanding - diluted | 49 | 35 | 49 | 35 | |||||||||||
Weighted average number of Class C common shares outstanding - basic | 63 | 63 | 63 | 44 | |||||||||||
Weighted average number of Class C common shares outstanding - diluted | 73 | 63 | 63 | 44 | |||||||||||
Earnings per Weighted Average Class A and Class C Common Share - Basic | $ | 0.34 | $ | 0.18 | $ | 0.72 | $ | 0.28 | |||||||
Earnings per Weighted Average Class A Common Share - Diluted | 0.30 | 0.18 | 0.68 | 0.28 | |||||||||||
Earnings per Weighted Average Class C Common Share - Diluted | 0.32 | 0.18 | 0.72 | 0.28 | |||||||||||
Dividends Per Class A Common Share | 0.24 | 0.21 | 0.695 | 0.80 | |||||||||||
Dividends Per Class C Common Share | $ | 0.24 | $ | 0.21 | $ | 0.695 | $ | 0.41 | |||||||
(a) Retrospectively adjusted as discussed in Note 1, Nature of Business.
See accompanying notes to consolidated financial statements.
7
NRG YIELD, INC.
CONSOLIDATED STATEMENTS OF COMPREHENSIVE INCOME (LOSS)
(Unaudited)
Three months ended September 30, | Nine months ended September 30, | ||||||||||||||
(In millions) | 2016 | 2015 (a) | 2016 | 2015 (a) | |||||||||||
Net Income | $ | 47 | $ | 32 | $ | 111 | $ | 53 | |||||||
Other Comprehensive Income (Loss), net of tax | |||||||||||||||
Unrealized gain (loss) on derivatives, net of income tax benefit of $1, $9, $13 and $13 | 21 | (31 | ) | (36 | ) | (28 | ) | ||||||||
Other comprehensive income (loss) | 21 | (31 | ) | (36 | ) | (28 | ) | ||||||||
Comprehensive Income | 68 | 1 | 75 | 25 | |||||||||||
Less: Pre-acquisition net income (loss) of Drop Down Assets | 6 | (2 | ) | 10 | (6 | ) | |||||||||
Less: Comprehensive income attributable to noncontrolling interests | 30 | 2 | 16 | 32 | |||||||||||
Comprehensive Income (Loss) Attributable to NRG Yield, Inc. | $ | 32 | $ | 1 | $ | 49 | $ | (1 | ) | ||||||
(a) Retrospectively adjusted as discussed in Note 1, Nature of Business.
See accompanying notes to consolidated financial statements.
8
NRG YIELD, INC.
CONSOLIDATED BALANCE SHEETS
(In millions, except shares) | September 30, 2016 | December 31, 2015 | |||||
ASSETS | (unaudited) | ||||||
Current Assets | |||||||
Cash and cash equivalents | $ | 200 | $ | 111 | |||
Restricted cash | 138 | 131 | |||||
Accounts receivable — trade | 115 | 101 | |||||
Accounts receivable — affiliate | 2 | — | |||||
Inventory | 37 | 36 | |||||
Derivative instruments | 1 | — | |||||
Notes receivable | 17 | 17 | |||||
Prepayments and other current assets | 21 | 20 | |||||
Total current assets | 531 | 416 | |||||
Property, plant and equipment, net | 5,711 | 5,878 | |||||
Other Assets | |||||||
Equity investments in affiliates | 690 | 697 | |||||
Notes receivable | 18 | 30 | |||||
Intangible assets, net | 1,303 | 1,362 | |||||
Deferred income taxes | 182 | 170 | |||||
Other non-current assets | 47 | 136 | |||||
Total other assets | 2,240 | 2,395 | |||||
Total Assets | $ | 8,482 | $ | 8,689 | |||
LIABILITIES AND STOCKHOLDERS’ EQUITY | |||||||
Current Liabilities | |||||||
Current portion of long-term debt | $ | 281 | $ | 264 | |||
Accounts payable — trade | 23 | 23 | |||||
Accounts payable — affiliate | 29 | 86 | |||||
Derivative instruments | 32 | 39 | |||||
Accrued expenses and other current liabilities | 94 | 77 | |||||
Total current liabilities | 459 | 489 | |||||
Other Liabilities | |||||||
Long-term debt | 5,359 | 5,329 | |||||
Accounts payable — affiliate | 11 | — | |||||
Derivative instruments | 107 | 61 | |||||
Other non-current liabilities | 78 | 72 | |||||
Total non-current liabilities | 5,555 | 5,462 | |||||
Total Liabilities | 6,014 | 5,951 | |||||
Commitments and Contingencies | |||||||
Stockholders' Equity | |||||||
Preferred stock, $0.01 par value; 10,000,000 shares authorized; none issued | — | — | |||||
Class A, Class B, Class C and Class D common stock, $0.01 par value; 3,000,000,000 shares authorized (Class A 500,000,000, Class B 500,000,000, Class C 1,000,000,000, Class D 1,000,000,000); 182,848,000 shares issued and outstanding (Class A 34,586,250, Class B 42,738,750, Class C 62,784,250, Class D 42,738,750) at September 30, 2016, and December 31, 2015 | 1 | 1 | |||||
Additional paid-in capital | 1,858 | 1,855 | |||||
Retained earnings | 35 | 12 | |||||
Accumulated other comprehensive loss | (48 | ) | (27 | ) | |||
Noncontrolling interest | 622 | 897 | |||||
Total Stockholders' Equity | 2,468 | 2,738 | |||||
Total Liabilities and Stockholders' Equity | $ | 8,482 | $ | 8,689 | |||
See accompanying notes to consolidated financial statements.
9
NRG YIELD, INC.
CONSOLIDATED STATEMENTS OF CASH FLOWS
(Unaudited)
Nine months ended September 30, | |||||||
2016 | 2015 (a) | ||||||
(In millions) | |||||||
Cash Flows from Operating Activities | |||||||
Net income | $ | 111 | $ | 53 | |||
Adjustments to reconcile net income to net cash provided by operating activities: | |||||||
Equity in earnings of unconsolidated affiliates | (29 | ) | (19 | ) | |||
Distributions from unconsolidated affiliates | 39 | 40 | |||||
Depreciation, amortization and ARO accretion | 226 | 224 | |||||
Amortization of financing costs and debt discounts | 15 | 13 | |||||
Amortization of intangibles and out-of-market contracts | 57 | 41 | |||||
Adjustment for debt extinguishment | — | 9 | |||||
Changes in income taxes | 25 | 8 | |||||
Changes in derivative instruments | (5 | ) | (38 | ) | |||
Disposal of asset components | 5 | 2 | |||||
Changes in prepaid and accrued capacity payments | 2 | (1 | ) | ||||
Changes in other working capital | (7 | ) | (22 | ) | |||
Net Cash Provided by Operating Activities | 439 | 310 | |||||
Cash Flows from Investing Activities | |||||||
Acquisition of businesses, net of cash acquired | — | (37 | ) | ||||
Acquisition of Drop Down Assets, net of cash acquired | (77 | ) | (489 | ) | |||
Capital expenditures | (16 | ) | (17 | ) | |||
Increase in restricted cash | (7 | ) | (24 | ) | |||
Decrease in notes receivable | 11 | 13 | |||||
Proceeds from renewable energy grants | — | 22 | |||||
Return of investment from unconsolidated affiliates | 16 | 16 | |||||
Investments in unconsolidated affiliates | (69 | ) | (351 | ) | |||
Net Cash Used in Investing Activities | (142 | ) | (867 | ) | |||
Cash Flows from Financing Activities | |||||||
Net contributions from noncontrolling interests | 7 | 123 | |||||
Distributions to NRG for CVSR and NRG Wind TE Holdco | (122 | ) | (52 | ) | |||
Proceeds from the issuance of common stock | — | 599 | |||||
Payment of dividends and distributions to shareholders | (127 | ) | (99 | ) | |||
Payment of debt issuance costs | (6 | ) | (13 | ) | |||
Net (payments for) borrowings from the revolving credit facility | (306 | ) | 92 | ||||
Proceeds from the issuance of long-term debt | 550 | 292 | |||||
Payments for long-term debt | (204 | ) | (669 | ) | |||
Net Cash (Used in) Provided by Financing Activities | (208 | ) | 273 | ||||
Net Increase (Decrease) in Cash and Cash Equivalents | 89 | (284 | ) | ||||
Cash and Cash Equivalents at Beginning of Period | 111 | 429 | |||||
Cash and Cash Equivalents at End of Period | $ | 200 | $ | 145 | |||
(a) Retrospectively adjusted as discussed in Note 1, Nature of Business.
See accompanying notes to consolidated financial statements.
10
NRG YIELD, INC.
NOTES TO CONSOLIDATED FINANCIAL STATEMENTS
(Unaudited)
Note 1 — Nature of Business
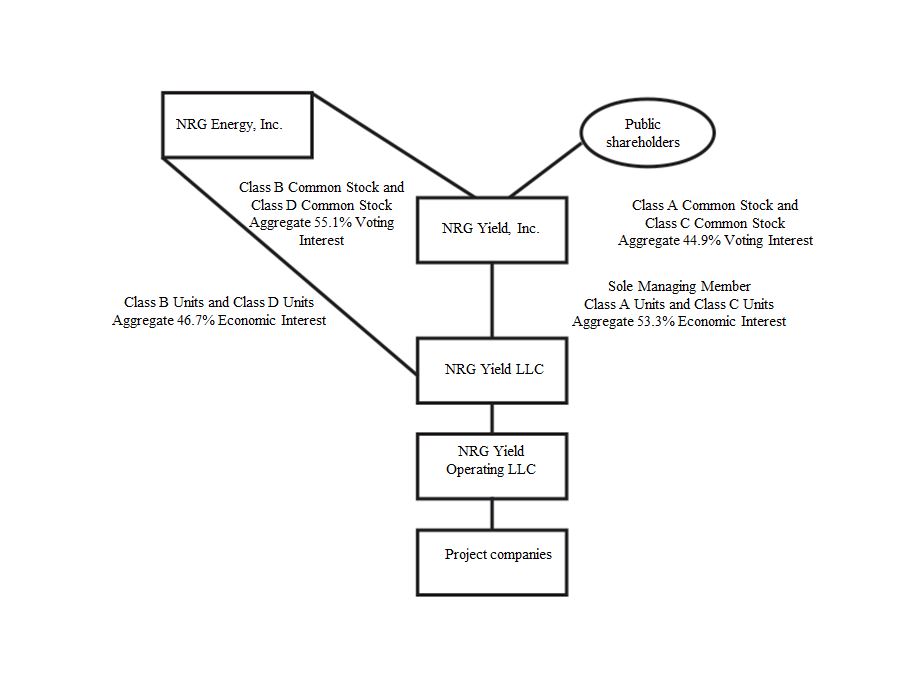
NRG Yield, Inc., together with its consolidated subsidiaries, or the Company, is a dividend growth-oriented company formed by NRG as a Delaware corporation on December 20, 2012, to serve as the primary vehicle through which NRG owns, operates and acquires contracted renewable and conventional generation and thermal infrastructure assets. NRG Yield, Inc. owns 100% of the Class A units and Class C units of NRG Yield LLC, including a controlling interest through its position as managing member. NRG Yield LLC, through its wholly owned subsidiary, NRG Yield Operating LLC, is the holder of a portfolio of renewable and conventional generation and thermal infrastructure assets, primarily located in the Northeast, Southwest and California regions of the U.S.
NRG Yield, Inc. consolidates the results of NRG Yield LLC through its controlling interest, with NRG's interest shown as noncontrolling interest in the financial statements. On May 14, 2015, NRG Yield, Inc. completed a stock split whereby each outstanding share of Class A common stock was split into one share of Class A common stock and one share of Class C common stock, and each outstanding share of Class B common stock was split into one share of Class B common stock and one share of Class D common stock. The stock split is referred to as the Recapitalization and all references to share or per share amounts in the accompanying consolidated financial statements and applicable disclosures have been retrospectively adjusted to reflect the Recapitalization. In addition, on June 29, 2015, NRG Yield, Inc. completed the issuance of 28,198,000 shares of Class C common stock for net proceeds of $599 million. The holders of NRG Yield, Inc.'s outstanding shares of Class A and Class C common stock are entitled to dividends as declared. NRG receives its distributions from NRG Yield LLC through its ownership of NRG Yield LLC Class B and Class D units.
The following table represents the structure of the Company as of September 30, 2016:
11
As of September 30, 2016, the Company's operating assets are comprised of the following projects:
Projects | Percentage Ownership | Net Capacity (MW)(a) | Offtake Counterparty | Expiration | ||||||
Conventional | ||||||||||
El Segundo | 100 | % | 550 | Southern California Edison | 2023 | |||||
GenConn Devon | 50 | % | 95 | Connecticut Light & Power | 2040 | |||||
GenConn Middletown | 50 | % | 95 | Connecticut Light & Power | 2041 | |||||
Marsh Landing | 100 | % | 720 | Pacific Gas and Electric | 2023 | |||||
Walnut Creek | 100 | % | 485 | Southern California Edison | 2023 | |||||
1,945 | ||||||||||
Utility Scale Solar | ||||||||||
Alpine | 100 | % | 66 | Pacific Gas and Electric | 2033 | |||||
Avenal | 50 | % | 23 | Pacific Gas and Electric | 2031 | |||||
Avra Valley | 100 | % | 26 | Tucson Electric Power | 2032 | |||||
Blythe | 100 | % | 21 | Southern California Edison | 2029 | |||||
Borrego | 100 | % | 26 | San Diego Gas and Electric | 2038 | |||||
CVSR | 100 | % | 250 | Pacific Gas and Electric | 2038 | |||||
Desert Sunlight 250 | 25 | % | 63 | Southern California Edison | 2035 | |||||
Desert Sunlight 300 | 25 | % | 75 | Pacific Gas and Electric | 2040 | |||||
Kansas South | 100 | % | 20 | Pacific Gas and Electric | 2033 | |||||
Roadrunner | 100 | % | 20 | El Paso Electric | 2031 | |||||
TA High Desert | 100 | % | 20 | Southern California Edison | 2033 | |||||
610 | ||||||||||
Distributed Solar | ||||||||||
AZ DG Solar Projects | 100 | % | 5 | Various | 2025 - 2033 | |||||
PFMG DG Solar Projects | 51 | % | 4 | Various | 2032 | |||||
9 | ||||||||||
Wind | ||||||||||
Alta I | 100 | % | 150 | Southern California Edison | 2035 | |||||
Alta II | 100 | % | 150 | Southern California Edison | 2035 | |||||
Alta III | 100 | % | 150 | Southern California Edison | 2035 | |||||
Alta IV | 100 | % | 102 | Southern California Edison | 2035 | |||||
Alta V | 100 | % | 168 | Southern California Edison | 2035 | |||||
Alta X (b) | 100 | % | 137 | Southern California Edison | 2038 | |||||
Alta XI (b) | 100 | % | 90 | Southern California Edison | 2038 | |||||
Buffalo Bear | 100 | % | 19 | Western Farmers Electric Co-operative | 2033 | |||||
Crosswinds | 74.3 | % | 16 | Corn Belt Power Cooperative | 2027 | |||||
Elbow Creek | 75 | % | 92 | NRG Power Marketing LLC | 2022 | |||||
Elkhorn Ridge | 50.3 | % | 41 | Nebraska Public Power District | 2029 | |||||
Forward | 75 | % | 22 | Constellation NewEnergy, Inc. | 2017 | |||||
Goat Wind | 74.9 | % | 113 | Dow Pipeline Company | 2025 | |||||
Hardin | 74.3 | % | 11 | Interstate Power and Light Company | 2027 | |||||
Laredo Ridge | 100 | % | 80 | Nebraska Public Power District | 2031 | |||||
Lookout | 75 | % | 29 | Southern Maryland Electric Cooperative | 2030 | |||||
Odin | 74.9 | % | 15 | Missouri River Energy Services | 2028 | |||||
Pinnacle | 100 | % | 55 | Maryland Department of General Services and University System of Maryland | 2031 | |||||
San Juan Mesa | 56.3 | % | 68 | Southwestern Public Service Company | 2025 | |||||
Sleeping Bear | 75 | % | 71 | Public Service Company of Oklahoma | 2032 | |||||
South Trent | 100 | % | 101 | AEP Energy Partners | 2029 | |||||
Spanish Fork | 75 | % | 14 | PacifiCorp | 2028 | |||||
Spring Canyon II (b) | 90.1 | % | 29 | Platte River Power Authority | 2039 | |||||
Spring Canyon III (b) | 90.1 | % | 25 | Platte River Power Authority | 2039 | |||||
Taloga | 100 | % | 130 | Oklahoma Gas & Electric | 2031 | |||||
Wildorado | 74.9 | % | 121 | Southwestern Public Service Company | 2027 | |||||
1,999 | ||||||||||
12
Projects | Percentage Ownership | Net Capacity (MW)(a) | Offtake Counterparty | Expiration | ||||||
Thermal | ||||||||||
Thermal equivalent MWt (c) | 100 | % | 1,315 | Various | Various | |||||
NRG Dover Energy Center LLC | 100 | % | 103 | NRG Power Marketing LLC | 2018 | |||||
Thermal generation | 100 | % | 20 | Various | Various | |||||
1,438 | ||||||||||
Total net capacity (excluding equivalent MWt)(d) | 4,686 | |||||||||
(a) Net capacity represents the maximum, or rated, generating capacity of the facility multiplied by the Company's percentage ownership in the facility as of September 30, 2016.
(b) Projects are part of tax equity arrangements.
(c) For thermal energy, net capacity represents MWt for steam or chilled water and excludes 134 MWt available under the right-to-use provisions contained in agreements between two of the Company's thermal facilities and certain of its customers.
(d) Total net capacity excludes 43 MW for RPV Holdco and 52 MW for DGPV Holdco 1 and DGPV Holdco 2 projects, of which the Company's net interests are 41 MW and 49, respectively, based on cash to be distributed. These projects are part of tax equity arrangements and are consolidated by NRG, as further described in Note 4, Variable Interest Entities, or VIEs.
Substantially all of the Company's generation assets are under long-term contractual arrangements for the output or capacity from these assets. The thermal assets are comprised of district energy systems and combined heat and power plants that produce steam, hot water and/or chilled water and in some instances, electricity, at a central plant. Three out of the fourteen district energy systems are subject to rate regulation by state public utility commissions while the other district energy systems have rates determined by negotiated bilateral contracts.
As described in Note 11, Related Party Transactions, the Company has a management services agreement with NRG for various services, including human resources, accounting, tax, legal, information systems, treasury, and risk management.
Stockholders' equity represents the equity associated with the Class A and Class C common stockholders, the equity associated with the Class B and Class D common stockholder, NRG, and the third-party interests under certain tax equity arrangements classified as noncontrolling interest.
As described in Note 3, Business Acquisitions, on September 1, 2016, the Company acquired the remaining 51.05% of CVSR, or the CVSR Drop Down, from NRG for cash consideration of $78.5 million plus an immaterial working capital adjustment. Prior to the transaction, the Company recorded its 48.95% interest in CVSR as an equity method investment. The acquisition of the CVSR Drop Down was accounted for as a transfer of entities under common control. The accounting guidance requires retrospective combination of the entities for all periods presented as if the combination has been in effect from the beginning of the financial statement period or from the date the entities were under common control (if later than the beginning of the financial statement period). Accordingly, in connection with the retrospective adjustment of prior periods, the Company removed the equity method investment from all prior periods and adjusted its financial statements to reflect its results of operations, financial position and cash flows as if it had consolidated CVSR from the beginning of the financial statement period.
Previously, on November 3, 2015, the Company acquired 75% of the Class B interests of NRG Wind TE Holdco, or the November 2015 Drop Down Assets, from NRG for cash consideration of $209 million. In February 2016, NRG made a final working capital payment of $2 million, reducing total cash consideration to $207 million. The Company has recorded all minority interests in NRG Wind TE Holdco as noncontrolling interest in the consolidated financial statements for all periods presented. On January 2, 2015, the Company acquired the Laredo Ridge, Tapestry, and Walnut Creek projects, or the January 2015 Drop Down Assets, for total cash consideration of $489 million, including $9 million for working capital.
The recast for the above transactions, referred to as Drop Down Assets, did not affect net income attributable to NRG Yield, Inc., weighted average number of shares outstanding, earnings per share or dividends.
The accompanying unaudited interim consolidated financial statements have been prepared in accordance with the SEC’s regulations for interim financial information and with the instructions to Form 10-Q. Accordingly, they do not include all of the information and notes required by GAAP for complete financial statements. The following notes should be read in conjunction with the accounting policies and other disclosures as set forth in the notes to the consolidated financial statements for the year ended December 31, 2015 included in the Company's September 6, 2016 Form 8-K. Interim results are not necessarily indicative of results for a full year.
13
In the opinion of management, the accompanying unaudited interim consolidated financial statements contain all material adjustments consisting of normal and recurring accruals necessary to present fairly the Company's consolidated financial position as of September 30, 2016, and the results of operations, comprehensive income (loss) and cash flows for the three and nine months ended September 30, 2016 and 2015.
Note 2 — Summary of Significant Accounting Policies
Use of Estimates
The preparation of consolidated financial statements in accordance with GAAP requires management to make estimates and assumptions. These estimates and assumptions impact the reported amounts of assets and liabilities and disclosures of contingent assets and liabilities as of the date of the consolidated financial statements, and the reported amounts of revenues and expenses during the reporting period. Actual results could be different from these estimates.
Accumulated Depreciation, Accumulated Amortization
The following table presents the accumulated depreciation included in the property, plant and equipment, net, and accumulated amortization included in intangible assets, net, respectively, as of September 30, 2016 and December 31, 2015:
September 30, 2016 | December 31, 2015 | ||||||
(In millions) | |||||||
Property, Plant and Equipment Accumulated Depreciation | $ | 1,002 | $ | 782 | |||
Intangible Assets Accumulated Amortization | 151 | 93 | |||||
Noncontrolling Interests
The following table reflects the changes in the Company's noncontrolling interest balance:
(In millions) | |||
Balance as of December 31, 2015 | $ | 897 | |
Capital contributions from tax equity investors, net of distributions | 7 | ||
November 2015 Drop Down Assets working capital payment | 2 | ||
Payment for CVSR Drop Down | (79 | ) | |
Pre-acquisition net income of Drop Down Assets | 10 | ||
Comprehensive income | 16 | ||
Distributions to NRG for Drop Down Assets | (172 | ) | |
Yield LLC distributions to NRG | (59 | ) | |
Balance as of September 30, 2016 | $ | 622 | |
Distributions to NRG for Drop Down Assets
Distributions to NRG for Drop Down Assets relate to NRG's 25% interest in the November 2015 Drop Down Assets as well as NRG's 51.05% interest in CVSR prior to its acquisition by the Company. This amount includes cash and non-cash distributions and includes portion of the proceeds from the senior notes issued under the CVSR Holdco Financing Arrangement on July 15, 2016, as described in Note 7, Long-term Debt.
14
Yield LLC Distributions to NRG
The following table lists the distributions paid on NRG Yield LLC's Class B and D units during the nine months ended September 30, 2016:
Third Quarter 2016 | Second Quarter 2016 | First Quarter 2016 | ||||||||
Distributions per Class B Unit | 0.24 | $ | 0.23 | $ | 0.225 | |||||
Distributions per Class D Unit | 0.24 | $ | 0.23 | $ | 0.225 | |||||
On November 2, 2016, NRG Yield LLC declared a distribution on its units of $0.25 per unit payable on December 15, 2016 to unit holders of record as of December 1, 2016.
Reclassifications
Certain prior-year amounts have been reclassified for comparative purposes.
Recent Accounting Developments
ASU 2016-16 - In October 2016, the FASB issued ASU No. 2016-16, Income Taxes (Topic 740), Intra-Entity Transfers of Assets Other Than Inventory, or ASU No. 2016-16. The amendments of ASU No. 2016-16 were issued to improve the accounting for the income tax consequences of intra-entity transfers of assets other than inventory. Current GAAP prohibits the recognition of current and deferred income taxes for an intra-entity asset transfer until the asset has been sold to an outside party which has resulted in diversity in practice and increased complexity within financial reporting. The amendments of ASU No. 2016-16 would require an entity to recognize the income tax consequences of an intra-entity transfer of an asset other than inventory when the transfer occurs and do not require new disclosure requirements. The amendments of ASU No. 2016-16 are effective for annual reporting periods beginning after December 15, 2017, and interim periods within those annual periods. Early adoption is permitted and the adoption of ASU No. 2016-16 should be applied on a modified retrospective basis through a cumulative-effect adjustment directly to retained earnings as of the beginning of the period of adoption. The Company is currently evaluating the impact of the standard on the Company’s results of operations, cash flows and financial position.
ASU 2016-15 — In August 2016, the FASB issued ASU No. 2016-15, Statement of Cash Flows (Topic 230), Classification of Certain Cash Receipts and Cash Payments, or ASU No. 2016-15. The amendments of ASU No. 2016-15 were issued to address eight specific cash flow issues for which stakeholders have indicated to the FASB that a diversity in practice existed in how entities were presenting and classifying these items in the statement of cash flows. The issues addressed by ASU No. 2016-15 include but are not limited to the classification of debt prepayment and debt extinguishment costs, payments made for contingent consideration for a business combination, proceeds from the settlement of insurance proceeds, distributions received from equity method investees and separately identifiable cash flows and the application of the predominance principle. The amendments of ASU No. 2016-15 are effective for public entities for fiscal years beginning after December 15, 2017 and interim periods in those fiscal years. Early adoption is permitted, including adoption in an interim fiscal period with all amendments adopted in the same period. The adoption of ASU No. 2016-15 is required to be applied retrospectively. The Company is currently evaluating the impact of the standard on the Company's statement of cash flows.
ASU 2016-07 — In March 2016, the FASB issued ASU No. 2016-07, Investments - Equity Method and Joint Ventures (Topic 323), or ASU No. 2016-07. The amendments of ASU No. 2016-07 eliminate the requirement that when an investment qualifies for use of the equity method as a result of an increase in the level of ownership interest or degree of influence, an investor must adjust the investment, results of operations, and retained earnings retroactively on a step-by-step basis as if the equity method had been in effect during all previous periods that the investment had been held. The amendments require that the equity method investor add the cost of acquiring the additional interest in the investee to the current basis of the investor's previously held interest and adopt the equity method of accounting with no retroactive adjustment to the investment. In addition, ASU No. 2016-07 requires that an entity that has an available-for-sale equity security that becomes qualified for the equity method of accounting recognize through earnings the unrealized holding gain or loss in accumulated other comprehensive income at the date the investment becomes qualified for use of the equity method. The guidance in ASU No. 2016-07 is effective for fiscal years beginning after December 15, 2016, and interim periods within those annual periods. The adoption of ASU No. 2016-07 is required to be applied prospectively and early adoption is permitted. The Company does not expect the standard to have a material impact on its results of operations, cash flows and financial position.
15
ASU 2016-02 — In February 2016, the FASB issued ASU No. 2016-02, Leases (Topic 842), or ASU No. 2016-02. The amendments of ASU No. 2016-02 complete the joint effort between the FASB and the International Accounting Standards Board, or IASB, to develop a common leasing standard for GAAP and International Financial Reporting Standards, or IFRS, with the objective to increase transparency and comparability among organizations by recognizing lease assets and lease liabilities on the balance sheet and to improve financial reporting. The guidance in ASU No. 2016-02 provides that a lessee that may have previously accounted for a lease as an operating lease under current GAAP should recognize the assets and liabilities that arise from a lease on the balance sheet. In addition, ASU No. 2016-02 expands the required quantitative and qualitative disclosures with regards to lease arrangements. The guidance in ASU No. 2016-02 is effective for fiscal years beginning after December 15, 2018, and interim periods within those annual periods. The adoption of ASU No. 2016-02 is required to be applied using a modified retrospective approach for the earliest period presented and early adoption is permitted. The Company is currently working through an adoption plan which includes the evaluation of lease contracts compared to the new standard and evaluating the impact of ASU No.2016-02 on the Company's results of operations, cash flows and financial position.
ASU 2016-01 — In January 2016, the FASB issued ASU No. 2016-01, Financial Instruments - Overall (Subtopic 825-10): Recognition and Measurement of Financial Assets and Financial Liabilities, or ASU No. 2016-01. The amendments of ASU No. 2016-01 eliminate available-for-sale classification of equity investments and require that equity investments (except those accounted for under the equity method of accounting, or those that result in consolidation of the investee) to be generally measured at fair value with changes in fair value recognized in net income. Further, the amendments require financial assets and financial liabilities to be presented separately in the notes to the financial statements, grouped by measurement category and form of financial asset. The guidance in ASU No. 2016-01 is effective for financial statements issued for fiscal years beginning after December 15, 2017, and interim periods within those annual periods. The Company is currently evaluating the impact of the standard on the Company's results of operations, cash flows and financial position.
ASU 2015-16 — In September 2015, the FASB issued ASU No. 2015-16, Business Combinations (Topic 805): Simplifying the Accounting for Measurement-Period Adjustments, or ASU No. 2015-16. The amendments of ASU No. 2015-16 require that an acquirer recognize measurement period adjustments to the provisional amounts recognized in a business combination in the reporting period during which the adjustments are determined. Additionally, the amendments of ASU No. 2015-16 require the acquirer to record in the same period's financial statements the effect on earnings of changes in depreciation, amortization or other income effects, if any, as a result of the measurement period adjustment, calculated as if the accounting had been completed at the acquisition date as well as disclosing on either the face of the income statement or in the notes the portion of the amount recorded in current period earnings that would have been recorded in previous reporting periods. The guidance in ASU No. 2015-16 is effective for financial statements issued for fiscal years beginning after December 15, 2015, and interim periods within those fiscal years. The amendments should be applied prospectively. The Company adopted this standard on January 1, 2016, and the adoption of this standard did not impact the Company's results of operations, cash flows or financial position.
ASU 2014-09 — In May 2014, the FASB issued ASU No. 2014-09, Revenue from Contracts with Customers (Topic 606), or ASU No. 2014-09. The amendments of ASU No. 2014-09 complete the joint effort between the FASB and the IASB, to develop a common revenue standard for GAAP and IFRS, and to improve financial reporting. In addition to ASU No. 2014-09, the FASB has issued additional guidance which provides further clarification on Topic 606 including ASU No. 2016-08, ASU No. 2016-10, ASU No. 2016-12. The guidance under Topic 606 provides that an entity should recognize revenue to depict the transfer of goods or services to customers in an amount that reflects the consideration to which the entity expects to be entitled to in exchange for the goods or services provided and establishes a four step process to be applied by an entity in evaluating its contracts with customers. In August 2015, the FASB issued ASU No. 2015-14, which formally deferred the effective date by one year to make the guidance of ASU No. 2014-09 effective for annual reporting periods beginning after December 15, 2017, including interim periods therein. Early adoption is permitted, but not prior to the original effective date, which was for annual reporting periods beginning after December 15, 2016. The Company is working through an adoption plan which includes the evaluation of revenue contracts compared to the new standard and evaluating the impact of Topic 606 on the Company' results of operations, cash flows and financial position.
Note 3 — Business Acquisitions
2016 Acquisitions
CVSR Drop Down— Prior to September 1, 2016, the Company had a 48.95% interest in CVSR, which was accounted for as an equity method investment. On September 1, 2016, the Company acquired from NRG the remaining 51.05% interest of CVSR Holdco LLC, which indirectly owns the CVSR solar facility, for total cash consideration of $78.5 million plus an immaterial working capital adjustment. The Company also assumed additional debt of $496 million, which represents 51.05% of the CVSR project level debt and 51.05% of the notes issued under the CVSR Holdco Financing Agreement, as further described in Note 7, Long-term Debt, as of the closing date. The acquisition was funded with cash on hand.
16
The assets and liabilities transferred to the Company relate to interests under common control by NRG and were recorded at historical cost in accordance with ASC 805-50, Business Combinations - Related Issues. The difference between the cash paid and historical value of the entities' equity was recorded as a distribution to NRG with the offset to noncontrolling interest. Because the transaction constituted a transfer of net assets under common control, the guidance requires retrospective combination of the entities for all periods presented as if the combination has been in effect since the inception of common control. In connection with the retrospective adjustment of prior periods, the Company has removed the equity method investment from all prior periods and adjusted its financial statements to reflect its results of operations, financial position and cash flows as if it had consolidated CVSR from the beginning of the financial statement period. As of June 30, 2016, the Company's recast consolidated balance sheet included a net receivable of $67 million related to current litigation with SunPower pursuant to indemnities in the project. The agreement between NRG and the Company for the CVSR Drop Down acquisition specified that all amounts related to the litigation with SunPower were excluded from the acquisition. Accordingly, prior to close of the transaction, the net receivable was transferred to NRG as a net reduction to its ownership interest in CVSR.
The following is the summary of historical net liabilities assumed in connection with the CVSR Drop Down as of September 1, 2016:
CVSR | |||
(In millions) | |||
Current assets | $ | 95 | |
Property, plant and equipment | 826 | ||
Non-current assets | 13 | ||
Total assets | 934 | ||
Debt (a) | 966 | ||
Other current and non-current liabilities | 12 | ||
Total liabilities | 978 | ||
Net liabilities assumed | (44 | ) | |
Accumulated Other Comprehensive Loss | (25 | ) | |
Historical Net Liabilities Assumed | $ | (19 | ) |
(a) Net of deferred financing costs of $5 million.
Since the acquisition date, CVSR has contributed $9 million in operating revenues and $4 million in net income to the Company.
2015 Acquisitions
November 2015 Drop Down Assets from NRG — On November 3, 2015, the Company acquired the November 2015 Drop Down Assets, a portfolio of 12 wind facilities totaling 814 net MW, from NRG for cash consideration of $209 million, subject to working capital adjustments. In February 2016, NRG made a final working capital payment of $2 million, reducing total cash consideration to $207 million. The Company is responsible for its pro-rata share of non-recourse project debt of $193 million and noncontrolling interest associated with a tax equity structure of $159 million (as of the acquisition date).
The Company funded the acquisition with borrowings from its revolving credit facility. The assets and liabilities transferred to the Company relate to interests under common control by NRG and were recorded at historical cost. The difference between the cash paid and historical value of the entities' equity was recorded as a distribution from NRG with the offset to noncontrolling interest.
The Class A interests of NRG Wind TE Holdco are owned by a tax equity investor, or TE Investor, who receives 99% of allocations of taxable income and other items until the flip point, which occurs when the TE Investor obtains a specified return on its initial investment, at which time the allocations to the TE Investor change to 8.53%. The Company generally receives 75% of CAFD until the flip point, at which time the allocations to the Company of CAFD change to 68.60%. If the flip point has not occurred by a specified date, 100% of CAFD is allocated to the TE Investor until the flip point occurs. NRG Wind TE Holdco is a VIE and the Company is the primary beneficiary, through its position as managing member, and consolidates NRG Wind TE Holdco.
17
Desert Sunlight — On June 29, 2015, the Company acquired 25% of the membership interest in Desert Sunlight Investment Holdings, LLC, which owns two solar photovoltaic facilities that total 550 MW, located in Desert Center, California from EFS Desert Sun, LLC, an affiliate of GE Energy Financial Services for a purchase price of $285 million. Power generated by the facilities is sold to Southern California Edison and Pacific Gas and Electric under long-term PPAs with approximately 20 years and 25 years of remaining contract life, respectively. The Company accounts for its 25% investment as an equity method investment.
Spring Canyon — On May 7, 2015, the Company acquired a 90.1% interest in Spring Canyon II, a 32 MW wind facility, and Spring Canyon III, a 28 MW wind facility, each located in Logan County, Colorado, from Invenergy Wind Global LLC. The purchase price was funded with cash on hand. Power generated by Spring Canyon II and Spring Canyon III is sold to Platte River Power Authority under long-term PPAs with approximately 24 years of remaining contract life.
University of Bridgeport Fuel Cell — On April 30, 2015, the Company completed the acquisition of the University of Bridgeport Fuel Cell project in Bridgeport, Connecticut from FuelCell Energy, Inc. The project added an additional 1.4 MW of thermal capacity to the Company's portfolio, with a 12-year contract, with the option for a 7-year extension. The acquisition is reflected in the Company's Thermal segment.
January 2015 Drop Down Assets from NRG — On January 2, 2015, the Company acquired the following projects from NRG: (i) Laredo Ridge, an 80 MW wind facility located in Petersburg, Nebraska, (ii) Tapestry, which includes Buffalo Bear, a 19 MW wind facility in Buffalo, Oklahoma; Taloga, a 130 MW wind facility in Putnam, Oklahoma; and Pinnacle, a 55 MW wind facility in Keyser, West Virginia, and (iii) Walnut Creek, a 485 MW natural gas facility located in City of Industry, California, for total cash consideration of $489 million, including $9 million for working capital, plus assumed project-level debt of $737 million. The Company funded the acquisition with cash on hand and drawings under its revolving credit facility. The assets and liabilities transferred to the Company relate to interests under common control by NRG and were recorded at historical cost. The difference between the cash paid and the historical value of the entities' equity of $61 million, as well as $23 million of AOCL, was recorded as a distribution to NRG and reduced the balance of its noncontrolling interest.
Note 4 — Variable Interest Entities, or VIEs
Entities that are Consolidated
The Company has a controlling financial interest in certain entities which have been identified as VIEs under ASC 810, Consolidations, or ASC 810. These arrangements are primarily related to tax equity arrangements entered into with third parties in order to monetize certain tax credits associated with wind facilities, as further described in Note 5, Investments Accounted for by the Equity Method and Variable Interest Entities, to the Company's consolidated financial statements included in the Company's September 6, 2016 Form 8-K.
Summarized financial information for the Company's consolidated VIEs consisted of the following as of September 30, 2016:
(In millions) | NRG Wind TE Holdco | Alta Wind TE Holdco | Spring Canyon | ||||||||
Other current and non-current assets | $ | 189 | $ | 19 | $ | 4 | |||||
Property, plant and equipment | 635 | 466 | 101 | ||||||||
Intangible assets | 2 | 278 | — | ||||||||
Total assets | 826 | 763 | 105 | ||||||||
Current and non-current liabilities | 225 | 9 | 6 | ||||||||
Total liabilities | 225 | 9 | 6 | ||||||||
Noncontrolling interest | 209 | 118 | 69 | ||||||||
Net assets less noncontrolling interests | $ | 392 | $ | 636 | $ | 30 | |||||
18
Entities that are not Consolidated
The Company has interests in entities that are considered VIEs under ASC 810, but for which it is not considered the primary beneficiary. The Company accounts for its interests in these entities under the equity method of accounting, as further described in Note 5, Investments Accounted for by the Equity Method and Variable Interest Entities, to the Company's consolidated financial statements included in the Company's September 6, 2016 Form 8-K.
NRG DGPV Holdco 1 LLC — The Company and NRG maintain a partnership, NRG DGPV Holdco 1 LLC, or DGPV Holdco 1, the purpose of which is to own or purchase solar power generation projects and other ancillary related assets from NRG Renew LLC or its subsidiaries via intermediate funds, including: (i) a tax equity-financed portfolio of 10 recently completed community solar projects representing approximately 8 MW with a weighted average remaining PPA term of 20 years; and (ii) a tax equity-financed portfolio of approximately 12 commercial photovoltaic systems representing approximately 37 MW with a weighted average remaining PPA term of 19 years. Both of these investments relate to the Company's $100 million commitment to distributed solar projects in partnership with NRG.
NRG DGPV Holdco 2 LLC — On February 29, 2016, the Company and NRG entered into an additional partnership by forming NRG DGPV Holdco 2 LLC, or DGPV Holdco 2, to own or purchase solar power generation projects representing approximately 7 MW with a weighted average remaining PPA term of 18 years as well as other ancillary related assets from NRG Renew LLC or its subsidiaries, via intermediate funds. Under this partnership, the Company committed to fund up to $50 million of capital.
The Company's maximum exposure to loss is limited to its equity investment in DGPV Holdco 1 and DGPV Holdco 2, which was $77 million on a combined basis as of September 30, 2016.
NRG RPV Holdco 1 LLC — The Company and NRG Residential Solar Solutions LLC, a subsidiary of NRG, maintain a partnership, NRG RPV Holdco 1 LLC, or RPV Holdco, that holds operating portfolios of residential solar assets developed by NRG's residential solar business, including: (i) an existing, unlevered portfolio of over 2,000 leases across nine states representing approximately 15 MW with a weighted average remaining lease term of approximately 17 years that was acquired outside of the partnership; and (ii) a tax equity-financed portfolio of approximately 5,400 leases representing approximately 28 MW, with an average lease term for the existing and new leases of approximately 17 to 20 years. In addition to the acquisition of the unlevered portfolio of leases, the Company had previously committed to fund up to $150 million of capital to invest in the tax equity financed portfolio, which was reduced to $100 million in February 2016. On August 5, 2016, the Company and NRG amended the RPV Holdco partnership to further reduce that capital commitment of $100 million to $60 million in connection with NRG’s change in business model approach in the residential solar business. As of September 30, 2016, the Company had contributed $57 million of this amount.
The Company's maximum exposure to loss is limited to its equity investment, which was $70 million as of September 30, 2016.
GenConn Energy LLC — The Company has a 50% interest in GCE Holding LLC, the owner of GenConn, which owns and operates two 190 MW peaking generation facilities in Connecticut at the Devon and Middletown sites. As of September 30, 2016, the Company's investment in GenConn was $106 million and its maximum exposure to loss is limited to its equity investment.
The following table presents summarized financial information for GCE Holding LLC:
Three months ended September 30, | Nine months ended September 30, | ||||||||||||||
(In millions) | 2016 | 2015 | 2016 | 2015 | |||||||||||
Income Statement Data: | |||||||||||||||
Operating revenues | $ | 18 | $ | 21 | $ | 54 | $ | 61 | |||||||
Operating income | 9 | 9 | 28 | 29 | |||||||||||
Net income | $ | 7 | $ | 6 | $ | 20 | $ | 20 | |||||||
September 30, 2016 | December 31, 2015 | ||||||
Balance Sheet Data: | (In millions) | ||||||
Current assets | $ | 29 | $ | 36 | |||
Non-current assets | 403 | 416 | |||||
Current liabilities | 12 | 16 | |||||
Non-current liabilities | $ | 208 | $ | 215 | |||
19
Note 5 — Fair Value of Financial Instruments
Fair Value Accounting under ASC 820
ASC 820 establishes a fair value hierarchy that prioritizes the inputs to valuation techniques used to measure fair value into three levels as follows:
• | Level 1—quoted prices (unadjusted) in active markets for identical assets or liabilities that the Company has the ability to access as of the measurement date. |
• | Level 2—inputs other than quoted prices included within Level 1 that are directly observable for the asset or liability or indirectly observable through corroboration with observable market data. |
• | Level 3—unobservable inputs for the asset or liability only used when there is little, if any, market activity for the asset or liability at the measurement date. |
In accordance with ASC 820, the Company determines the level in the fair value hierarchy within which each fair value measurement in its entirety falls, based on the lowest level input that is significant to the fair value measurement.
For cash and cash equivalents, restricted cash, accounts receivable, accounts receivable — affiliate, accounts payable, accounts payable — affiliate, accrued expenses and other liabilities, the carrying amounts approximate fair value because of the short-term maturity of those instruments and are classified as Level 1 within the fair value hierarchy.
The estimated carrying amounts and fair values of the Company’s recorded financial instruments not carried at fair market value are as follows:
As of September 30, 2016 | As of December 31, 2015 | ||||||||||||||
Carrying Amount | Fair Value | Carrying Amount | Fair Value | ||||||||||||
(In millions) | |||||||||||||||
Assets: | |||||||||||||||
Notes receivable, including current portion | $ | 35 | $ | 35 | $ | 47 | $ | 47 | |||||||
Liabilities: | |||||||||||||||
Long-term debt, including current portion | $ | 5,704 | $ | 5,729 | $ | 5,656 | $ | 5,538 | |||||||
20
The fair value of the Company's publicly-traded long-term debt is based on quoted market prices and is classified as Level 2 within the fair value hierarchy. The fair value of debt securities, non-publicly traded long-term debt and certain notes receivable of the Company are based on expected future cash flows discounted at market interest rates, or current interest rates for similar instruments with equivalent credit quality and are classified as Level 3 within the fair value hierarchy. The following table presents the level within the fair value hierarchy for long-term debt, including current portion as of September 30, 2016 and December 31, 2015:
As of September 30, 2016 | As of December 31, 2015 | ||||||||||||||
Level 2 | Level 3 | Level 2 | Level 3 | ||||||||||||
(In millions) | |||||||||||||||
Long-term debt, including current portion | $ | 1,478 | $ | 4,251 | $ | 978 | $ | 4,560 | |||||||
Recurring Fair Value Measurements
The Company records its derivative assets and liabilities at fair value on its consolidated balance sheet. There were no derivative asset positions on the Company's consolidated balance sheet as of December 31, 2015. The following table presents assets and liabilities measured and recorded at fair value on the Company's consolidated balance sheets on a recurring basis and their level within the fair value hierarchy:
As of September 30, 2016 | As of December 31, 2015 | ||||||
Fair Value (a) | Fair Value (a) | ||||||
(In millions) | Level 2 | Level 2 | |||||
Derivative assets: | |||||||
Commodity contracts | $ | 1 | $ | — | |||
Total assets | 1 | — | |||||
Derivative liabilities: | |||||||
Commodity contracts | 1 | 2 | |||||
Interest rate contracts | 138 | 98 | |||||
Total liabilities | $ | 139 | $ | 100 | |||
(a) There were no derivative assets or liabilities classified as Level 1 or Level 3 as of September 30, 2016, and December 31, 2015.
Derivative Fair Value Measurements
The Company's contracts are non-exchange-traded and valued using prices provided by external sources. For the Company’s energy markets, management receives quotes from multiple sources. To the extent that multiple quotes are received, the prices reflect the average of the bid-ask mid-point prices obtained from all sources believed to provide the most liquid market for the commodity.
The fair value of each contract is discounted using a risk free interest rate. In addition, a credit reserve is applied to reflect credit risk, which is, for interest rate swaps, calculated based on credit default swaps using the bilateral method. For commodities, to the extent that the net exposure under a specific master agreement is an asset, the Company uses the counterparty’s default swap rate. If the net exposure under a specific master agreement is a liability, the Company uses NRG's default swap rate. For interest rate swaps and commodities, the credit reserve is added to the discounted fair value to reflect the exit price that a market participant would be willing to receive to assume the liabilities or that a market participant would be willing to pay for the assets. As of September 30, 2016, the credit reserve resulted in a $4 million increase in fair value, which was composed of a $3 million gain in OCI and $1 million reduction in interest expense. It is possible that future market prices could vary from those used in recording assets and liabilities and such variations could be material.
21
Concentration of Credit Risk
In addition to the credit risk discussion in Note 2, Summary of Significant Accounting Policies, to the Company's consolidated financial statements included in the Company's September 6, 2016 Form 8-K, the following is a discussion of the concentration of credit risk for the Company's financial instruments. Credit risk relates to the risk of loss resulting from non-performance or non-payment by counterparties pursuant to the terms of their contractual obligations. The Company monitors and manages credit risk through credit policies that include: (i) an established credit approval process; (ii) daily monitoring of counterparties' credit limits; (iii) the use of credit mitigation measures such as margin, collateral, prepayment arrangements, or volumetric limits; (iv) the use of payment netting agreements; and (v) the use of master netting agreements that allow for the netting of positive and negative exposures of various contracts associated with a single counterparty. Risks surrounding counterparty performance and credit could ultimately impact the amount and timing of expected cash flows. The Company seeks to mitigate counterparty risk by having a diversified portfolio of counterparties.
Counterparty credit exposure includes credit risk exposure under certain long-term agreements, including solar and other PPAs. As external sources or observable market quotes are not available to estimate such exposure, the Company estimates the exposure related to these contracts based on various techniques including, but not limited to, internal models based on a fundamental analysis of the market and extrapolation of observable market data with similar characteristics. Based on these valuation techniques, as of September 30, 2016, credit risk exposure to these counterparties attributable to the Company's ownership interests was approximately $2.6 billion for the next five years. The majority of these power contracts are with utilities with strong credit quality and public utility commission or other regulatory support, as further described in Note 12, Segment Reporting, to the Company's consolidated financial statements included in the Company's September 6, 2016 Form 8-K. However, such regulated utility counterparties can be impacted by changes in government regulations, which the Company is unable to predict.
Note 6 — Accounting for Derivative Instruments and Hedging Activities
This footnote should be read in conjunction with the complete description under Note 7, Accounting for Derivative Instruments and Hedging Activities, to the Company's consolidated financial statements included in the Company's September 6, 2016 Form 8-K.
Energy-Related Commodities
As of September 30, 2016, the Company had forward contracts for the purchase of fuel commodities relating to the forecasted usage of the Company’s district energy centers extending through 2018. At September 30, 2016, these contracts were not designated as cash flow or fair value hedges.
Interest Rate Swaps
As of September 30, 2016, the Company had interest rate derivative instruments on non-recourse debt extending through 2031, most of which are designated as cash flow hedges.
Volumetric Underlying Derivative Transactions
The following table summarizes the net notional volume buy/(sell) of the Company's open derivative transactions broken out by commodity:
Total Volume | |||||||||
September 30, 2016 | December 31, 2015 | ||||||||
Commodity | Units | (In millions) | |||||||
Natural Gas | MMBtu | 3 | 4 | ||||||
Interest | Dollars | $ | 1,875 | $ | 1,991 | ||||
22
Fair Value of Derivative Instruments
There were no derivative asset positions on the balance sheet as of December 31, 2015. The following table summarizes the fair value within the derivative instrument valuation on the balance sheet:
Fair Value | |||||||||||
Derivative Assets | Derivative Liabilities | ||||||||||
September 30, 2016 | September 30, 2016 | December 31, 2015 | |||||||||
(In millions) | |||||||||||
Derivatives Designated as Cash Flow Hedges: | |||||||||||
Interest rate contracts current | $ | — | $ | 29 | $ | 34 | |||||
Interest rate contracts long-term | — | 94 | 56 | ||||||||
Total Derivatives Designated as Cash Flow Hedges | — | 123 | 90 | ||||||||
Derivatives Not Designated as Cash Flow Hedges: | |||||||||||
Interest rate contracts current | — | 2 | 3 | ||||||||
Interest rate contracts long-term | — | 13 | 5 | ||||||||
Commodity contracts current | 1 | 1 | 2 | ||||||||
Total Derivatives Not Designated as Cash Flow Hedges | 1 | 16 | 10 | ||||||||
Total Derivatives | $ | 1 | $ | 139 | $ | 100 | |||||
The Company has elected to present derivative assets and liabilities on the balance sheet on a trade-by-trade basis and does not offset amounts at the counterparty master agreement level. As of September 30, 2016 and December 31, 2015, there were no offsetting amounts at the counterparty master agreement level or outstanding collateral paid or received.
Accumulated Other Comprehensive Loss
The following table summarizes the effects on the Company’s accumulated OCL balance attributable to interest rate swaps designated as cash flow hedge derivatives, net of tax:
Three months ended September 30, | Nine months ended September 30, | ||||||||||||||
2016 | 2015 (a) | 2016 | 2015 (a) | ||||||||||||
(In millions) | |||||||||||||||
Accumulated OCL beginning balance | $ | (140 | ) | $ | (73 | ) | $ | (83 | ) | $ | (76 | ) | |||
Reclassified from accumulated OCL to income due to realization of previously deferred amounts | 4 | 5 | 10 | 12 | |||||||||||
Mark-to-market of cash flow hedge accounting contracts | 17 | (36 | ) | (46 | ) | (40 | ) | ||||||||
Accumulated OCL ending balance, net of income tax benefit of $29 and $19, respectively | (119 | ) | (104 | ) | (119 | ) | (104 | ) | |||||||
Accumulated OCL attributable to noncontrolling interests | (71 | ) | (72 | ) | (71 | ) | (72 | ) | |||||||
Accumulated OCL attributable to NRG Yield, Inc. | $ | (48 | ) | $ | (32 | ) | $ | (48 | ) | $ | (32 | ) | |||
Losses expected to be realized from OCL during the next 12 months, net of income tax benefit of $4 | $ | 16 | $ | 16 | |||||||||||
(a) Retrospectively adjusted as discussed in Note 1, Nature of Business.
Amounts reclassified from accumulated OCL into income and amounts recognized in income from the ineffective portion of cash flow hedges are recorded to interest expense. There was no ineffectiveness for the three and nine months ended September 30, 2016 and 2015.
Impact of Derivative Instruments on the Statements of Income
The Company has interest rate derivative instruments that are not designated as cash flow hedges. The effect of interest rate hedges is recorded to interest expense. For the three months ended September 30, 2016, and 2015, the impact to the consolidated statements of income was a gain of $2 million and a loss of $6 million, respectively. For the nine months ended September 30, 2016, and 2015, the impact to the consolidated statements of income was a loss of $7 million and a gain of $13 million, respectively.
23
A portion of the Company’s derivative commodity contracts relates to its Thermal Business for the purchase of fuel commodities based on the forecasted usage of the thermal district energy centers. Realized gains and losses on these contracts are reflected in the fuel costs that are permitted to be billed to customers through the related customer contracts or tariffs and, accordingly, no gains or losses are reflected in the consolidated statements of income for these contracts.
In 2015, certain NRG subsidiaries entered into commodity contracts with NRG Power Marketing and NRG Texas Power LLC. The purpose of these commodity contracts was to hedge the forecasted sale of power for Elbow Creek, Goat Wind, Alta X and Alta XI until the start of the PPAs. The effect of these commodity hedges was recorded to operating revenues, as described in Note 11, Related Party Transactions. For the three and nine months ended September 30, 2015, the impact to the consolidated statements of income was an unrealized loss of $2 million and an unrealized gain of $1 million, respectively.
See Note 5, Fair Value of Financial Instruments, for a discussion regarding concentration of credit risk.
24
Note 7 — Long-term Debt
This footnote should be read in conjunction with the complete description under Note 9, Long-term Debt, to the Company's consolidated financial statements included in the Company's September 6, 2016 Form 8-K. Long-term debt consisted of the following:
September 30, 2016 | December 31, 2015 | September 30, 2016, interest rate % (a) | Letters of Credit Outstanding at September 30, 2016 | |||||||||||
(In millions, except rates) | ||||||||||||||
2019 Convertible Notes (b) | $ | 334 | $ | 330 | 3.500 | |||||||||
2020 Convertible Notes (c) | 270 | 266 | 3.250 | |||||||||||
2024 Senior Notes | 500 | 500 | 5.375 | |||||||||||
2026 Senior Notes | 350 | — | 5.000 | |||||||||||
NRG Yield LLC and NRG Yield Operating LLC Revolving Credit Facility, due 2019 (d) | — | 306 | L+2.75 | $ | 64 | |||||||||
Project-level debt: | ||||||||||||||
Alpine, due 2022 | 147 | 154 | L+1.75 | 37 | ||||||||||
Alta Wind I, lease financing arrangement, due 2034 | 245 | 252 | 7.015 | 16 | ||||||||||
Alta Wind II, lease financing arrangement, due 2034 | 194 | 198 | 5.696 | 23 | ||||||||||
Alta Wind III, lease financing arrangement, due 2034 | 201 | 206 | 6.067 | 23 | ||||||||||
Alta Wind IV, lease financing arrangement, due 2034 | 130 | 133 | 5.938 | 16 | ||||||||||
Alta Wind V, lease financing arrangement, due 2035 | 208 | 213 | 6.071 | 26 | ||||||||||
Alta Realty Investments, due 2031 | 32 | 33 | 7.000 | — | ||||||||||
Alta Wind Asset Management, due 2031 | 18 | 19 | L+2.375 | — | ||||||||||
Avra Valley, due 2031 | 57 | 60 | L+1.75 | 3 | ||||||||||
Blythe, due 2028 | 20 | 21 | L+1.625 | 6 | ||||||||||
Borrego, due 2025 and 2038 | 70 | 72 | L+ 2.50/5.65 | 5 | ||||||||||
CVSR, due 2037 | 771 | 793 | 2.339 - 3.775 | — | ||||||||||
CVSR Holdco, due 2037 | 199 | — | 4.68 | 13 | ||||||||||
El Segundo Energy Center, due 2023 | 443 | 485 | L+1.625 - L+2.25 | 82 | ||||||||||
Energy Center Minneapolis, due 2017 and 2025 | 98 | 108 | 5.95 -7.25 | — | ||||||||||
Kansas South, due 2031 | 31 | 33 | L+2.00 | 4 | ||||||||||
Laredo Ridge, due 2028 | 101 | 104 | L+1.875 | 10 | ||||||||||
Marsh Landing, due 2017 and 2023 | 385 | 418 | L+1.75 - L+1.875 | 33 | ||||||||||
PFMG and related subsidiaries financing agreement, due 2030 | 28 | 29 | 6.000 | — | ||||||||||
Roadrunner, due 2031 | 37 | 40 | L+1.625 | 5 | ||||||||||
South Trent Wind, due 2020 | 58 | 62 | L+1.625 | 10 | ||||||||||
TA High Desert, due 2020 and 2032 | 51 | 52 | L+2.50/5.15 | 8 | ||||||||||
Tapestry, due 2021 | 175 | 181 | L+1.625 | 20 | ||||||||||
Viento, due 2023 | 183 | 189 | L+2.75 | 27 | ||||||||||
Walnut Creek, due 2023 | 322 | 351 | L+1.625 | 49 | ||||||||||
WCEP Holdings, due 2023 | 46 | 46 | L+3.00 | — | ||||||||||
Other | — | 2 | various | — | ||||||||||
Subtotal project-level debt: | 4,250 | 4,254 | ||||||||||||
Total debt | 5,704 | 5,656 | ||||||||||||
Less current maturities | 281 | 264 | ||||||||||||
Less deferred financing costs | 64 | 63 | ||||||||||||
Total long-term debt | $ | 5,359 | $ | 5,329 | ||||||||||
(a) As of September 30, 2016, L+ equals 3 month LIBOR plus x%, except for the Alpine term loan, Marsh Landing term loan, Walnut Creek term loan, and NRG Yield LLC and NRG Yield Operating LLC Revolving Credit Facility, where L+ equals 1 month LIBOR plus x% and Kansas South and Viento, where L+ equals 6 month LIBOR plus x%.
(b) Net of discount of $11 million and $15 million as of September 30, 2016, and December 31, 2015, respectively.
(c) Net of discount of $17 million and $21 million as of September 30, 2016, and December 31, 2015, respectively.
(d) Applicable rate is determined by the borrower leverage ratio, as defined in the credit agreement.
25
The financing arrangements listed above contain certain covenants, including financial covenants that the Company is required to be in compliance with during the term of the respective arrangement. As of September 30, 2016, the Company was in compliance with all of the required covenants.
The discussion below describes material changes to or additions of long-term debt for the nine months ended September 30, 2016.
NRG Yield Operating LLC 2026 Senior Notes
On August 18, 2016, NRG Yield Operating LLC issued $350 million of senior unsecured notes, or the 2026 Senior Notes. The 2026 Senior Notes bear interest at 5.00% and mature on September 15, 2026. Interest on the notes is payable semi-annually on March 15 and September 15 of each year, and interest payments will commence on March 15, 2017. The 2026 Senior Notes are senior unsecured obligations of NRG Yield Operating LLC and are guaranteed by NRG Yield LLC, and by certain of NRG Yield Operating LLC’s wholly owned current and future subsidiaries. A portion of the proceeds of the 2026 Senior Notes were used to repay the Company's revolving credit facility, as described below.
CVSR Holdco Financing Arrangement
On July 15, 2016, CVSR Holdco, the indirect owner of the CVSR solar facility, issued $200 million of senior secured notes, or the 2037 Notes, that bear interest at 4.68% and mature on March 31, 2037. Net proceeds were distributed to the Company and NRG based on their respective ownership as of July 15, 2016, and accordingly, the Company received net proceeds of $97.5 million.
As described in Note 3, Business Acquisitions, on September 1, 2016, the Company acquired the remaining 51.05% of CVSR, and assumed additional debt of $496 million, which represents 51.05% of the CVSR project level debt and the 2037 Notes. In connection with the retrospective adjustment of prior periods, as described in Note 1, Nature of Business, the Company now consolidates CVSR and 100% of its debt, in all periods presented.
NRG Yield LLC and NRG Yield Operating LLC Revolving Credit Facility
The Company borrowed $60 million from the revolving credit facility and repaid $366 million during the nine months ended September 30, 2016. The Company used its pro rata proceeds of $97.5 million from the CVSR Holdco Financing Arrangement, as described above, along with $28 million of cash on hand, to reduce borrowings under the Company’s revolving credit facility in July 2016. Additionally, in August 2016, the Company used a portion of its proceeds from the issuance of the 2026 Senior Notes to pay the remaining revolver balance of $193 million.
As of September 30, 2016, there were no outstanding borrowings under the revolving credit facility and the Company had $64 million of letters of credit outstanding.
Thermal Financing
On October 31, 2016, NRG Energy Center Minneapolis LLC, a subsidiary of NRG Thermal LLC, received proceeds of $125 million from the issuance of 3.55% Series D notes due October 31, 2031, or the Series D Notes, and entered into a shelf facility for the anticipated issuance of an additional $70 million of notes. The Series D Notes are, and the additional notes, if issued, will be secured by substantially all of the assets of NRG Energy Center Minneapolis LLC. NRG Thermal LLC has guaranteed the indebtedness and its guarantee is secured by a pledge of the equity interests in all of NRG Thermal LLC’s subsidiaries. NRG Energy Center Minneapolis LLC distributed the proceeds of the Series D Notes to NRG Thermal LLC, which in turn distributed the proceeds to NRG Yield Operating LLC to be utilized for general corporate purposes, including potential acquisitions.
26
Note 8 — Earnings Per Share
Basic earnings per common share is computed by dividing net income by the weighted average number of common shares outstanding. Shares issued during the year are weighted for the portion of the year that they were outstanding. Diluted earnings per share is computed in a manner consistent with that of basic earnings per share while giving effect to all potentially dilutive common shares that were outstanding during the period.
The reconciliation of the Company's basic and diluted earnings per share is shown in the following tables:
Three months ended September 30, | |||||||||||||||
2016 | 2015 | ||||||||||||||
(In millions, except per share data) (a) | Common Class A | Common Class C | Common Class A | Common Class C | |||||||||||
Basic earnings per share attributable to NRG Yield, Inc. common stockholders | |||||||||||||||
Net income attributable to NRG Yield, Inc. | $ | 12 | $ | 21 | $ | 6 | $ | 11 | |||||||
Weighted average number of common shares outstanding — basic | 35 | 63 | 35 | 63 | |||||||||||
Earnings per weighted average common share — basic | $ | 0.34 | $ | 0.34 | $ | 0.18 | $ | 0.18 | |||||||
Diluted earnings per share attributable to NRG Yield, Inc. common stockholders | |||||||||||||||
Net income attributable to NRG Yield, Inc. | $ | 15 | $ | 24 | $ | 6 | $ | 11 | |||||||
Weighted average number of common shares outstanding — diluted | 49 | 73 | 35 | 63 | |||||||||||
Earnings per weighted average common share — diluted | $ | 0.30 | $ | 0.32 | $ | 0.18 | $ | 0.18 | |||||||
Nine months ended September 30, | |||||||||||||||
2016 | 2015 | ||||||||||||||
(In millions, except per share data) (a) | Common Class A | Common Class C | Common Class A | Common Class C | |||||||||||
Basic earnings per share attributable to NRG Yield, Inc. common stockholders | |||||||||||||||
Net income attributable to NRG Yield, Inc. | $ | 25 | $ | 45 | $ | 10 | $ | 12 | |||||||
Weighted average number of common shares outstanding — basic | 35 | 63 | 35 | 44 | |||||||||||
Earnings per weighted average common share — basic | $ | 0.72 | $ | 0.72 | $ | 0.28 | $ | 0.28 | |||||||
Diluted earnings per share attributable to NRG Yield, Inc. common stockholders | |||||||||||||||
Net income attributable to NRG Yield, Inc. | $ | 34 | $ | 45 | $ | 10 | $ | 12 | |||||||
Weighted average number of common shares outstanding — diluted | 49 | 63 | 35 | 44 | |||||||||||
Earnings per weighted average common share — diluted | $ | 0.68 | $ | 0.72 | $ | 0.28 | $ | 0.28 | |||||||
(a) Net income attributable to NRG Yield, Inc. and basic and diluted earnings per share might not recalculate due to presenting values in millions rather than whole dollars.
With respect to the Class A common stock, there were a total of 15 million anti-dilutive outstanding equity instruments for the three and nine months ended September 30, 2015, related to the 2019 Convertible Notes. With respect to the Class C common stock, there were a total of 10 million anti-dilutive outstanding equity instruments for the nine months ended September 30, 2016 and 10 million and 4 million anti-dilutive outstanding equity instruments for the three and nine months ended September 30, 2015, respectively, related to the 2020 Convertible Notes.
27
Note 9 — Segment Reporting
The Company’s segment structure reflects how management currently operates and allocates resources. The Company's businesses are primarily segregated based on conventional power generation, renewable businesses which consist of solar and wind, and the thermal and chilled water business. The Corporate segment reflects the Company's corporate costs. The Company's chief operating decision maker, its Chief Executive Officer, evaluates the performance of its segments based on operational measures including adjusted earnings before interest, taxes, depreciation and amortization, or Adjusted EBITDA, and CAFD, as well as economic gross margin and net income (loss).
Three months ended September 30, 2016 | |||||||||||||||||||
(In millions) | Conventional Generation | Renewables | Thermal | Corporate | Total | ||||||||||||||
Operating revenues | $ | 82 | $ | 142 | $ | 48 | $ | — | $ | 272 | |||||||||
Cost of operations | 14 | 31 | 31 | — | 76 | ||||||||||||||
Depreciation and amortization | 20 | 50 | 5 | — | 75 | ||||||||||||||
General and administrative | — | — | — | 4 | 4 | ||||||||||||||
Operating income (loss) | 48 | 61 | 12 | (4 | ) | 117 | |||||||||||||
Equity in earnings of unconsolidated affiliates | 3 | 10 | — | — | 13 | ||||||||||||||
Other income, net | 1 | — | — | — | 1 | ||||||||||||||
Interest expense | (13 | ) | (37 | ) | (2 | ) | (19 | ) | (71 | ) | |||||||||
Income (loss) before income taxes | 39 | 34 | 10 | (23 | ) | 60 | |||||||||||||
Income tax expense | — | — | — | 13 | 13 | ||||||||||||||
Net Income (Loss) | $ | 39 | $ | 34 | $ | 10 | $ | (36 | ) | $ | 47 | ||||||||
Total Assets | $ | 2,001 | $ | 5,783 | $ | 427 | $ | 271 | $ | 8,482 | |||||||||
Three months ended September 30, 2015 (a) | |||||||||||||||||||
(In millions) | Conventional Generation | Renewables | Thermal | Corporate | Total | ||||||||||||||
Operating revenues | $ | 86 | $ | 124 | $ | 46 | $ | — | $ | 256 | |||||||||
Cost of operations | 15 | 36 | 31 | — | 82 | ||||||||||||||
Depreciation and amortization | 19 | 45 | 5 | — | 69 | ||||||||||||||
General and administrative | — | — | — | 3 | 3 | ||||||||||||||
Acquisition-related transaction and integration costs | — | — | — | 1 | 1 | ||||||||||||||
Operating income (loss) | 52 | 43 | 10 | (4 | ) | 101 | |||||||||||||
Equity in earnings of unconsolidated affiliates | 3 | 9 | — | — | 12 | ||||||||||||||
Loss on debt extinguishment | — | (2 | ) | — | — | (2 | ) | ||||||||||||
Interest expense | (11 | ) | (41 | ) | (1 | ) | (18 | ) | (71 | ) | |||||||||
Income (loss) before income taxes | 44 | 9 | 9 | (22 | ) | 40 | |||||||||||||
Income tax expense | — | — | — | 8 | 8 | ||||||||||||||
Net Income (Loss) | $ | 44 | $ | 9 | $ | 9 | $ | (30 | ) | $ | 32 | ||||||||
(a) Retrospectively adjusted as discussed in Note 1, Nature of Business.
28
Nine months ended September 30, 2016 | |||||||||||||||||||
(In millions) | Conventional Generation | Renewables | Thermal | Corporate | Total | ||||||||||||||
Operating revenues | $ | 246 | $ | 412 | $ | 131 | $ | — | $ | 789 | |||||||||
Cost of operations | 53 | 98 | 87 | — | 238 | ||||||||||||||
Depreciation and amortization | 60 | 149 | 15 | — | 224 | ||||||||||||||
General and administrative | — | — | — | 10 | 10 | ||||||||||||||
Operating income (loss) | 133 | 165 | 29 | (10 | ) | 317 | |||||||||||||
Equity in earnings of unconsolidated affiliates | 10 | 19 | — | — | 29 | ||||||||||||||
Other income, net | 1 | 2 | — | — | 3 | ||||||||||||||
Interest expense | (36 | ) | (115 | ) | (5 | ) | (57 | ) | (213 | ) | |||||||||
Income (loss) before income taxes | 108 | 71 | 24 | (67 | ) | 136 | |||||||||||||
Income tax expense | — | — | — | 25 | 25 | ||||||||||||||
Net Income (Loss) | $ | 108 | $ | 71 | $ | 24 | $ | (92 | ) | $ | 111 | ||||||||
Nine months ended September 30, 2015 (a) | |||||||||||||||||||
(In millions) | Conventional Generation | Renewables | Thermal | Corporate | Total | ||||||||||||||
Operating revenues | $ | 247 | $ | 347 | $ | 135 | $ | — | $ | 729 | |||||||||
Cost of operations | 51 | 99 | 96 | — | 246 | ||||||||||||||
Depreciation and amortization | 61 | 147 | 14 | — | 222 | ||||||||||||||
General and administrative | — | — | — | 9 | 9 | ||||||||||||||
Acquisition-related transaction and integration costs | — | — | — | 2 | 2 | ||||||||||||||
Operating income (loss) | 135 | 101 | 25 | (11 | ) | 250 | |||||||||||||
Equity in earnings of unconsolidated affiliates | 10 | 9 | — | — | 19 | ||||||||||||||
Other income, net | 1 | 1 | — | — | 2 | ||||||||||||||
Loss on debt extinguishment | (7 | ) | (2 | ) | — | — | (9 | ) | |||||||||||
Interest expense | (36 | ) | (116 | ) | (5 | ) | (44 | ) | (201 | ) | |||||||||
Income (loss) before income taxes | 103 | (7 | ) | 20 | (55 | ) | 61 | ||||||||||||
Income tax expense | — | — | — | 8 | 8 | ||||||||||||||
Net Income (Loss) | $ | 103 | $ | (7 | ) | $ | 20 | $ | (63 | ) | $ | 53 | |||||||
(a) Retrospectively adjusted as discussed in Note 1, Nature of Business.
Note 10 — Income Taxes
Effective Tax Rate
The income tax provision consisted of the following:
Three months ended September 30, | Nine months ended September 30, | ||||||||||||||
2016 | 2015 | 2016 | 2015 | ||||||||||||
(In millions, except percentages) | |||||||||||||||
Income before income taxes | $ | 60 | $ | 40 | $ | 136 | $ | 61 | |||||||
Income tax expense | 13 | 8 | 25 | 8 | |||||||||||
Effective income tax rate | 21.7 | % | 20.0 | % | 18.4 | % | 13.1 | % | |||||||
For the three and nine months ended September 30, 2016, and 2015, the overall effective tax rate was different than the statutory rate of 35% primarily due to taxable earnings allocated to NRG resulting from its interest in NRG Yield LLC and production and investment tax credits generated from certain wind and solar assets, respectively.
For tax purposes, NRG Yield LLC is treated as a partnership; therefore, the Company and NRG each record their respective share of taxable income or loss.
29
Note 11 — Related Party Transactions
In addition to the transactions and relationships described elsewhere in these notes to the consolidated financial statements, NRG and certain subsidiaries of NRG provide services to the Company and its project entities. Amounts due to NRG subsidiaries are recorded as accounts payable - affiliate and amounts due to the Company from NRG or its subsidiaries are recorded as accounts receivable - affiliate in the Company's balance sheet.
Power Hedge Contracts by and between Renewables segment Entities and NRG
Certain NRG Wind TE Holdco entities, which are subsidiaries in the Renewables segment, entered into power hedge contracts with NRG Texas Power LLC and generated $17 million during the nine months ended September 30, 2015. Effective October 2015, Elbow Creek, one of the NRG Wind TE Holdco entities, entered into a PPA with NRG Power Marketing LLC, or NRG Power Marketing, as further described below, and the hedge agreement between Elbow Creek and NRG Texas Power LLC was terminated.
Additionally, Alta X and Alta XI entered into a hedge agreement with NRG Power Marketing, as further described in Note 6, Accounting for Derivative Instruments and Hedging Activities, to hedge the forecasted sale of power until the start of the PPAs on January 1, 2016.
Power Purchase Agreement by and between Elbow Creek and NRG
In October 2015, Elbow Creek, the Company's subsidiary in the Renewables segment, entered into a PPA with NRG Power Marketing for the sale of energy and environmental attributes with the effective date of November 1, 2015, and expiring on October 31, 2022. Elbow Creek generated $6 million of revenue during the nine months ended September 30, 2016.
Operation and Maintenance (O&M) Services Agreements by and between Thermal Entities and NRG
Certain thermal entities which are wholly-owned subsidiaries of the Company are party to a Plant O&M Services Agreement with NRG, pursuant to which NRG provides necessary and appropriate services to operate and maintain the subsidiaries' plant operations, businesses and thermal facilities. NRG is reimbursed for the provided services, as well as, for all reasonable and related expenses and expenditures, and payments to third parties for services and materials rendered to or on behalf of the parties to the agreements. NRG is not entitled to any management fee or mark-up under the agreements. Total fees incurred under the agreements were $15 million and $21 million for the nine months ended September 30, 2016, and 2015, respectively. There was a balance of $23 million and $29 million due to NRG in accounts payable — affiliate as of September 30, 2016 and December 31, 2015, respectively. As of September 30, 2016, $12 million of the balance was recorded in the current liabilities of the consolidated balance sheet and $11 million was recorded in long term liabilities of the consolidated balance sheet. Subsequent to September 30, 2016, the Company made payments of $4 million to reduce the outstanding balance due to NRG.
Power Purchase Agreement by and between NRG Energy Center Dover LLC and NRG
In February 2016, NRG Energy Center Dover LLC, or NRG Dover, a subsidiary of the Company, entered into a PPA with NRG Power Marketing for the sale of energy and environmental attributes with an effective date of February 1, 2016 and expiration date of December 31, 2018. NRG Dover generated $4 million of revenue during the nine months ended September 30, 2016. The agreement in place is in addition to the existing Power Sales and Services Agreement described further below.
Power Sales and Services Agreement by and between NRG Energy Center Dover LLC and NRG
NRG Dover, a subsidiary of the Company, is party to a Power Sales and Services Agreement with NRG Power Marketing. The agreement is automatically renewed on a month-to-month basis unless terminated by either party upon at least 30 days written notice. Under the agreement, NRG Power Marketing has the exclusive right to (i) manage, market and sell power, (ii) procure fuel and fuel transportation for operation of the Dover generating facility, to include for purposes other than generating power, (iii) procure transmission services required for the sale of power, and (iv) procure and market emissions credits for operation of the Dover generating facility.
In addition, NRG Power Marketing has the exclusive right and obligation to direct the output from the generating facility, in accordance with and to meet the terms of any power sales contracts executed against the power generation of the Dover facility. Under the agreement, NRG Power Marketing pays NRG Dover gross receipts generated through sales, less costs incurred by NRG Power Marketing related to providing such services as transmission and delivery costs, as well as fuel costs. In July 2013, the coal-fueled plant was converted to a natural gas facility. For the nine months ended September 30, 2016 and 2015, NRG Dover purchased $1 million and $4 million, respectively, of natural gas from NRG Power Marketing.
30
Energy Marketing Services Agreement by and between NRG Energy Center Minneapolis LLC and NRG
NRG Energy Center Minneapolis LLC, or NRG Minneapolis, a subsidiary of the Company is party to an Energy Marketing Services Agreement with NRG Power Marketing, a wholly-owned subsidiary of NRG. Under the agreement, NRG Power Marketing procures fuel and fuel transportation for the operation of the Minneapolis generating facility. For the nine months ended September 30, 2016 and 2015, NRG Minneapolis purchased $5 million and $6 million, respectively, of natural gas from NRG Power Marketing.
O&M Services Agreements by and between GenConn and NRG
GenConn incurs fees under two O&M services agreements with wholly-owned subsidiaries of NRG. The fees incurred under the agreements were $4 million and $3 million for the nine months ended September 30, 2016 and 2015, respectively.
O&M Services Agreement by and between El Segundo and NRG
El Segundo incurs fees under an O&M services agreement with NRG El Segundo Operations, Inc., a wholly-owned subsidiary of NRG. Under the O&M services agreement, NRG El Segundo Operations, Inc. manages, operates and maintains the El Segundo facility for an initial term of ten years following the commercial operations date. For the nine months ended September 30, 2016 and 2015, the costs incurred under the agreement were $4 million. There was a balance of $1 million due to NRG El Segundo in accounts payable — affiliate as of September 30, 2016 and December 31, 2015.
Administrative Services Agreement by and between Marsh Landing and NRG
Marsh Landing is a party to an administrative services agreement with GenOn Energy Services, LLC, a wholly-owned subsidiary of NRG, which provides invoice processing and payment on behalf of Marsh Landing. Marsh Landing reimburses GenOn Energy Services, LLC for the amounts paid by it. The Company reimbursed costs under this agreement of $9 million and $11 million for the nine months ended September 30, 2016 and 2015, respectively. There was a balance of $1 million and $6 million due to GenOn Energy Services, LLC in accounts payable — affiliate as of September 30, 2016 and December 31, 2015, respectively.
Administrative Services Agreement by and between CVSR and NRG
CVSR is a party to an administrative services agreement with NRG Renew Operation & Maintenance LLC, a wholly-owned subsidiary of NRG, which provides O&M services on behalf of CVSR. Initially, the agreement was entered into with NRG Energy Services and was subsequently assigned to NRG Renew Operation & Maintenance LLC on July 15, 2015. The Company reimbursed a total of $2 million and $4 million to both entities for the expenses incurred for the nine months ended September 30, 2016 and 2015, respectively.
Management Services Agreement by and between the Company and NRG
NRG provides the Company with various operation, management, and administrative services, which include human resources, accounting, tax, legal, information systems, treasury, and risk management, as set forth in the Management Services Agreement. As of September 30, 2016, the base management fee was approximately $7.5 million per year, subject to an inflation-based adjustment annually at an inflation factor based on the year-over-year U.S. consumer price index. The fee is also subject to adjustments following the consummation of future acquisitions and as a result of a change in the scope of services provided under the Management Services Agreement. During the nine months ended September 30, 2016, the fee was increased by $0.5 million on an annual basis primarily due to the acquisition of the CVSR Drop Down. Costs incurred under this agreement were $7 million for the nine months ended September 30, 2016 and 2015, which included certain direct expenses incurred by NRG on behalf of the Company in addition to the base management fee. There was a balance of $3 million due to NRG in accounts payable — affiliate as of September 30, 2016. Subsequent to September 30, 2016, the balance has been paid in full.
Administrative Services Agreements by and between NRG Wind TE Holdco and NRG
Certain subsidiaries of NRG have entered into agreements with the Company's project entities to provide operation and maintenance services for the balance of the plants not covered by turbine supplier's maintenance and service agreements for the post-warranty period. The agreements have various terms with provisions for extension until terminated. For the nine months ended September 30, 2016 and 2015, the costs incurred under the agreements were $4 million and $3 million, respectively.
Certain subsidiaries of NRG provide support services to the NRG Wind TE Holdco project entities pursuant to various support services agreements. The agreements provide for administrative and support services and reimbursements of certain insurance, consultant, and credit costs. For the nine months ended September 30, 2016 and 2015, the costs incurred under the agreements were $2 million.
31
32
Note 12 — Contingencies
The Company's material legal proceedings are described below. The Company believes that it has valid defenses to these legal proceedings and intends to defend them vigorously. The Company records reserves for estimated losses from contingencies when information available indicates that a loss is probable and the amount of the loss, or range of loss, can be reasonably estimated. In addition, legal costs are expensed as incurred. Management assesses such matters based on current information and makes a judgment concerning its potential outcome, considering the nature of the claim, the amount and nature of damages sought, and the probability of success. The Company is unable to predict the outcome of the legal proceedings below or reasonably estimate the scope or amount of any associated costs and potential liabilities. As additional information becomes available, management adjusts its assessment and estimates of such contingencies accordingly. Because litigation is subject to inherent uncertainties and unfavorable rulings or developments, it is possible that the ultimate resolution of the Company's liabilities and contingencies could be at amounts that are different from its currently recorded reserves and that such difference could be material.
In addition to the legal proceedings noted below, the Company and its subsidiaries are party to other litigation or legal proceedings arising in the ordinary course of business. In management's opinion, the disposition of these ordinary course matters will not materially adversely affect the Company's consolidated financial position, results of operations, or cash flows.
Braun v. NRG Yield, Inc. — On April 19, 2016, plaintiffs filed a putative class action lawsuit against NRG Yield, Inc., the current and former members of its board of directors individually, and other parties in California Superior Court in Kern County, CA. Plaintiffs allege various violations of the Securities Act due to the defendants’ alleged failure to disclose material facts related to low wind production prior to NRG Yield, Inc.'s June 22, 2015 Class C common stock offering. Plaintiffs seek compensatory damages, rescission, attorney’s fees and costs. On August 3, 2016, the court approved a stipulation entered into by the parties. The stipulation provided that the plaintiffs would file an amended complaint by August 19, 2016, which they did on August 18, 2016. The defendants filed demurrers and a motion challenging jurisdiction on October 18, 2016.
Ahmed v. NRG Energy, Inc. and the NRG Yield Board of Directors — On September 15, 2016, plaintiffs filed a putative class action lawsuit against NRG Energy, Inc., the directors of NRG Yield, Inc., and other parties in the Delaware Chancery Court. The complaint alleges that the defendants breached their respective fiduciary duties with regard to the recapitalization of NRG Yield, Inc. common stock in 2015. The plaintiffs generally seek economic damages, attorney’s fees and injunctive relief. The defendants filed responsive pleadings on November 4, 2016.
33
ITEM 2 — Management's Discussion and Analysis of Financial Condition and the Results of Operations
The following discussion analyzes the Company's historical financial condition and results of operations, which were recast to include the effect of the CVSR Drop Down and the November 2015 Drop Down Assets, which were acquired from NRG on September 1, 2016 and November 3, 2015, respectively.
As you read this discussion and analysis, refer to the Company's Consolidated Financial Statements to this Form 10-Q, which present the results of operations for the three and nine months ended September 30, 2016, and 2015. Also refer to the Company's September 6, 2016 Form 8-K, which includes detailed discussions of various items impacting the Company's business, results of operations and financial condition.
The discussion and analysis below has been organized as follows:
•Executive Summary, including a description of the business and significant events that are important to understanding the results of operations and financial condition;
•Known trends that may affect the Company’s results of operations and financial condition in the future;
•Results of operations, including an explanation of significant differences between the periods in the specific line items of the consolidated statements of income;
•Financial condition addressing liquidity position, sources and uses of cash, capital resources and requirements, commitments, and off-balance sheet arrangements; and
•Critical accounting policies which are most important to both the portrayal of the Company's financial condition and results of operations, and which require management's most difficult, subjective or complex judgment.
34
Executive Summary
Introduction and Overview
The Company is a dividend growth-oriented company formed to serve as the primary vehicle through which NRG owns, operates and acquires contracted renewable and conventional generation and thermal infrastructure assets. The Company believes it is well positioned to be a premier company for investors seeking stable and growing dividend income from a diversified portfolio of lower-risk high-quality assets.
The Company owns a diversified portfolio of contracted renewable and conventional generation and thermal infrastructure assets in the U.S. The Company’s contracted generation portfolio collectively represents 4,563 net MW as of September 30, 2016. Each of these assets sells substantially all of its output pursuant to long-term offtake agreements with creditworthy counterparties. The weighted average remaining contract duration of these offtake agreements was approximately 17 years as of September 30, 2016, based on CAFD. The Company also owns thermal infrastructure assets with an aggregate steam and chilled water capacity of 1,315 net MWt and electric generation capacity of 123 net MW. These thermal infrastructure assets provide steam, hot water and/or chilled water, and in some instances electricity, to commercial businesses, universities, hospitals and governmental units in multiple locations, principally through long-term contracts or pursuant to rates regulated by state utility commissions.
Regulatory Matters
The Company’s regulatory matters are described in the Company’s 2015 Form 10-K in Item 1, Business — Regulatory Matters and Item 1A, Risk Factors.
As owners of power plants and participants in wholesale and thermal energy markets, certain of the Company's subsidiaries are subject to regulation by various federal and state government agencies. These include FERC and the PUCT, as well as other public utility commissions in certain states where the Company's assets are located. Each of the Company's U.S. generating facilities qualifies as a EWG or QF. In addition, the Company is subject to the market rules, procedures and protocols of the various ISO and RTO markets in which it participates. Likewise, the Company must also comply with the mandatory reliability requirements imposed by NERC and the regional reliability entities in the regions where the Company operates.
The Company's operations within the ERCOT footprint are not subject to rate regulation by FERC, as they are deemed to operate solely within the ERCOT market and not in interstate commerce. These operations are subject to regulation by the PUCT.
Environmental Matters
The Company’s environmental matters are described in the Company’s 2015 Form 10-K in Item 1, Business — Environmental Matters and Item 1A, Risk Factors.
The Company is subject to a wide range of environmental laws in the development, construction, ownership and operation of projects. These laws generally require that governmental permits and approvals be obtained before construction and during operation of facilities. The Company is also subject to laws and regulations surrounding the protection of wildlife, including migratory birds, eagles and threatened and endangered species. Environmental laws have become increasingly stringent and the Company expects this trend to continue.
Trends Affecting Results of Operations and Future Business Performance
Wind and Solar Resource Availability
The availability of the wind and solar resources affects the financial performance of the wind and solar facilities, which may impact the Company’s overall financial performance. Due to the variable nature of the wind and solar resources, the Company cannot predict the availability of the wind and solar resources and the potential variances from expected performance levels from quarter to quarter. To the extent the wind and solar resources are not available at expected levels, it could have a negative impact on the Company’s financial performance for such periods.
Capital Market Conditions
The capital markets in general are often subject to volatility that is unrelated to the operating performance of particular companies. The Company’s growth strategy depends on its ability to identify and acquire additional conventional and renewable facilities from NRG and unaffiliated third parties, which will require access to debt and equity financing to complete such acquisitions or replenish capital for future acquisitions. Any broad market fluctuations may affect the Company’s ability to access such capital through debt or equity financings.
35
Operational Matters
Walnut Creek Forced Outage
In July and August 2016, Walnut Creek experienced two unrelated outages causing damage to a circuit breaker and a compressor resulting in forced outages on Units 2 and 4, respectively. The Company has undertaken a root cause analysis and is reviewing what is covered by warranty or available insurance coverage. Unit 2 returned to service on August 10, 2016 and Unit 4 returned to service on September 15, 2016.
36
Consolidated Results of Operations
The following table provides selected financial information:
Three months ended September 30, | Nine months ended September 30, | ||||||||||||||||||||||
(In millions, except otherwise noted) | 2016 | 2015 | Change | 2016 | 2015 | Change | |||||||||||||||||
Operating Revenues | |||||||||||||||||||||||
Energy and capacity revenues | $ | 289 | $ | 272 | $ | 17 | $ | 840 | $ | 768 | $ | 72 | |||||||||||
Contract amortization | (17 | ) | (14 | ) | (3 | ) | (51 | ) | (40 | ) | (11 | ) | |||||||||||
Mark-to-market economic hedging activities | — | (2 | ) | 2 | — | 1 | (1 | ) | |||||||||||||||
Total operating revenues | 272 | 256 | 16 | 789 | 729 | 60 | |||||||||||||||||
Operating Costs and Expenses | |||||||||||||||||||||||
Cost of fuels | 18 | 20 | (2 | ) | 48 | 58 | (10 | ) | |||||||||||||||
Emissions credit amortization | — | — | — | 6 | — | 6 | |||||||||||||||||
Operations and maintenance | 41 | 44 | (3 | ) | 134 | 135 | (1 | ) | |||||||||||||||
Other costs of operations | 17 | 18 | (1 | ) | 50 | 53 | (3 | ) | |||||||||||||||
Depreciation and amortization | 75 | 69 | 6 | 224 | 222 | 2 | |||||||||||||||||
General and administrative | 4 | 3 | 1 | 10 | 9 | 1 | |||||||||||||||||
Acquisition-related transaction and integration costs | — | 1 | (1 | ) | — | 2 | (2 | ) | |||||||||||||||
Total operating costs and expenses | 155 | 155 | — | 472 | 479 | (7 | ) | ||||||||||||||||
Operating Income | 117 | 101 | 16 | 317 | 250 | 67 | |||||||||||||||||
Other Income (Expense) | |||||||||||||||||||||||
Equity in earnings of unconsolidated affiliates | 13 | 12 | 1 | 29 | 19 | 10 | |||||||||||||||||
Other income, net | 1 | — | 1 | 3 | 2 | 1 | |||||||||||||||||
Loss on debt extinguishment | — | (2 | ) | 2 | — | (9 | ) | 9 | |||||||||||||||
Interest expense | (71 | ) | (71 | ) | — | (213 | ) | (201 | ) | (12 | ) | ||||||||||||
Total other expense, net | (57 | ) | (61 | ) | 4 | (181 | ) | (189 | ) | 8 | |||||||||||||
Income Before Income Taxes | 60 | 40 | 20 | 136 | 61 | 75 | |||||||||||||||||
Income tax expense | 13 | 8 | 5 | 25 | 8 | 17 | |||||||||||||||||
Net Income | 47 | 32 | 15 | 111 | 53 | 58 | |||||||||||||||||
Less: Pre-acquisition net income (loss) of Drop Down Assets | 6 | (2 | ) | 8 | 10 | (6 | ) | 16 | |||||||||||||||
Net Income Excluding Pre-acquisition Net Income (Loss) of Drop Down Assets | 41 | 34 | 7 | 101 | 59 | 42 | |||||||||||||||||
Less: Net income attributable to noncontrolling interests | 8 | 17 | (9 | ) | 31 | 37 | (6 | ) | |||||||||||||||
Net Income Attributable to NRG Yield, Inc. | $ | 33 | $ | 17 | $ | 16 | $ | 70 | $ | 22 | $ | 48 | |||||||||||
Three months ended September 30, | Nine months ended September 30, | ||||||||||
Business metrics: | 2016 | 2015 | 2016 | 2015 | |||||||
Renewables MWh generated/sold (in thousands) (a) | 1,744 | 1,596 | 5,563 | 4,813 | |||||||
Conventional MWh generated (in thousands) (b) | 628 | 957 | 1,265 | 1,818 | |||||||
Thermal MWt sold (in thousands) | 496 | 468 | 1,497 | 1,519 | |||||||
Thermal MWh sold (in thousands) (c) | 12 | 92 | 61 | 219 | |||||||
(a) Volumes sold do not include the MWh generated by the Company's equity method investments.
(b) Volumes generated are not sold as the Conventional facilities sell capacity rather than energy.
(c) MWh sold do not include 110 MWh and 184 MWh generated by NRG Dover, a subsidiary of the Company, under the PPA with NRG Power Marketing during the three and nine months ended September 30, 2016, respectively, as further described in Note 11, Related Party Transactions.
37
Management’s Discussion of the Results of Operations for the Three Months ended September 30, 2016, and 2015
Gross Margin and Economic Gross Margin
In addition to gross margin, the Company evaluates its operating performance using the measure of economic gross margin, which is not a GAAP measure and may not be comparable to other companies’ presentations or deemed more useful than the GAAP information provided elsewhere in this report. Economic gross margin should be viewed as a supplement to and not a substitute for the Company' presentation of gross margin, which is the most directly comparable GAAP measure. Economic gross margin is not intended to represent gross margin. The Company believes that economic gross margin is useful to investors as it is a key operational measure reviewed by the Company's chief operating decision maker. Economic gross margin is defined as energy and capacity revenue less cost of fuels. Economic gross margin excludes the following components from GAAP gross margin: contract amortization, mark-to-market gains, emissions credit amortization and (losses) gains on economic hedging activities. Mark-to-market results consist of unrealized gains and losses on contracts that are not yet settled.
The below tables present the composition of gross margin, as well as the reconciliation to economic gross margin, for the three months ended September 30, 2016, and 2015:
Conventional Generation | Renewables | Thermal | Total | ||||||||||||
(In millions) | |||||||||||||||
Three months ended September 30, 2016 | |||||||||||||||
Energy and capacity revenues | $ | 83 | $ | 158 | $ | 48 | $ | 289 | |||||||
Cost of fuels | — | (1 | ) | (17 | ) | (18 | ) | ||||||||
Contract amortization | (1 | ) | (16 | ) | — | (17 | ) | ||||||||
Gross margin | 82 | 141 | 31 | 254 | |||||||||||
Contract amortization | 1 | 16 | — | 17 | |||||||||||
Economic gross margin | $ | 83 | $ | 157 | $ | 31 | $ | 271 | |||||||
Three months ended September 30, 2015 | |||||||||||||||
Energy and capacity revenues | $ | 88 | $ | 137 | $ | 47 | $ | 272 | |||||||
Cost of fuels | (1 | ) | (1 | ) | (18 | ) | (20 | ) | |||||||
Contract amortization | (2 | ) | (11 | ) | (1 | ) | (14 | ) | |||||||
Mark-to-market for economic hedging activities | — | (2 | ) | — | (2 | ) | |||||||||
Gross margin | 85 | 123 | 28 | 236 | |||||||||||
Contract amortization | 2 | 11 | 1 | 14 | |||||||||||
Mark-to-market for economic hedging activities | — | 2 | — | 2 | |||||||||||
Economic gross margin | $ | 87 | $ | 136 | $ | 29 | $ | 252 | |||||||
38
Gross margin increased by $18 million and economic gross margin increased by $19 million during the three months ended September 30, 2016, compared to the same period in 2015, primarily due to:
(In millions) | |||
Increase in Renewables economic gross margin due to a 20% increase in volume generated at Alta wind projects, as well as 5% increase in solar generation, primarily at CVSR | $ | 14 | |
Increase in Renewables economic gross margin due to an increase in price per MWh at Alta X and XI wind projects as the PPAs began in January 2016, compared to merchant prices in 2015 | 7 | ||
Increase in Thermal economic gross margin primarily due to increased consumption revenue at several Thermal entities | 2 | ||
Decrease in Conventional economic gross margin primarily to due forced outages at Walnut Creek in the third quarter of 2016, partially offset by increased capacity revenue at Marsh Landing due to a favorable performance test | (4 | ) | |
Increase in economic gross margin | 19 | ||
Higher contract amortization primarily for the Alta X and XI PPAs, which began in January 2016 | (3 | ) | |
Increase due to unrealized losses on forward contracts with an NRG subsidiary hedging the forecasted sale of power from Elbow Creek, Goat Wind, Alta X and Alta XI in 2015, prior to the start of the PPAs | 2 | ||
Increase in gross margin | $ | 18 | |
Operations and Maintenance Expense
Operations and maintenance expense decreased by $3 million during the three months ended September 30, 2016, compared to the same period in 2015, primarily due to fewer third party service contracts, partially offset by the forced outages at Walnut Creek in the third quarter of 2016.
Interest Expense
Interest expense remained flat during the three months ended September 30, 2016, compared to the same period in 2015, due primarily to:
(In millions) | |||
Increase due to higher revolving credit facility borrowings in 2016 | $ | 3 | |
Increase due to $200 million of debt issued by CVSR Holdco in August 2016 | 2 | ||
Decrease from changes in the fair value of Alpine interest rate swaps | (5 | ) | |
$ | — | ||
Income Tax Expense
For the three months ended September 30, 2016, the Company recorded income tax expense of $13 million on pretax income of $60 million. For the same period in 2015, the Company recorded income tax expense of $8 million on pretax income of $40 million. For the three months ended September 30, 2016 and 2015, the Company's overall effective tax rate was different than the statutory rate of 35% primarily due to taxable earnings allocated to NRG resulting from NRG's interest in NRG Yield LLC and production and investment tax credits generated from certain wind and solar assets, respectively.
Income Attributable to Noncontrolling Interests
For the three months ended September 30, 2016, the Company had income of $46 million attributable to NRG's interest in the Company and a loss of $38 million attributable to non-controlling interests with respect to its tax equity financing arrangements and the application of the HLBV method. For the three months ended September 30, 2015, the Company had income of $22 million attributable to NRG's interest in the Company and a loss of $5 million attributable to non-controlling interests with respect to its tax equity financing arrangements and the application of the HLBV method.
39
Management’s Discussion of the Results of Operations for the Nine Months ended September 30, 2016, and 2015
Gross Margin and Economic Gross Margin
In addition to gross margin, the Company evaluates its operating performance using the measure of economic gross margin, which is not a GAAP measure and may not be comparable to other companies’ presentations or deemed more useful than the GAAP information provided elsewhere in this report. Economic gross margin should be viewed as a supplement to and not a substitute for the Company' presentation of gross margin, which is the most directly comparable GAAP measure. Economic gross margin is not intended to represent gross margin. The Company believes that economic gross margin is useful to investors as it is a key operational measure reviewed by the Company's chief operating decision maker. Economic gross margin is defined as energy and capacity revenue less cost of fuels. Economic gross margin excludes the following components from GAAP gross margin: contract amortization, mark-to-market gains, emissions credit amortization and (losses) gains on economic hedging activities. Mark-to-market results consist of unrealized gains and losses on contracts that are not yet settled.
The below tables present the composition of gross margin, as well as the reconciliation to economic gross margin, for the nine months ended September 30, 2016, and 2015:
Conventional Generation | Renewables | Thermal | Total | ||||||||||||
(In millions) | |||||||||||||||
Nine months ended September 30, 2016 | |||||||||||||||
Energy and capacity revenues | $ | 250 | $ | 458 | $ | 132 | $ | 840 | |||||||
Cost of fuels | (1 | ) | (1 | ) | (46 | ) | (48 | ) | |||||||
Contract amortization | (4 | ) | (46 | ) | (1 | ) | (51 | ) | |||||||
Emissions credit amortization | (6 | ) | — | — | (6 | ) | |||||||||
Gross margin | 239 | 411 | 85 | 735 | |||||||||||
Contract amortization | 4 | 46 | 1 | 51 | |||||||||||
Emissions credit amortization | 6 | — | — | 6 | |||||||||||
Economic gross margin | $ | 249 | $ | 457 | $ | 86 | $ | 792 | |||||||
Nine months ended September 30, 2015 | |||||||||||||||
Energy and capacity revenues | $ | 251 | $ | 380 | $ | 137 | $ | 768 | |||||||
Cost of fuels | (2 | ) | (1 | ) | (55 | ) | (58 | ) | |||||||
Contract amortization | (4 | ) | (34 | ) | (2 | ) | (40 | ) | |||||||
Mark-to-market for economic hedging activities | — | 1 | — | 1 | |||||||||||
Gross margin | 245 | 346 | 80 | 671 | |||||||||||
Contract amortization | 4 | 34 | 2 | 40 | |||||||||||
Mark-to-market for economic hedging activities | — | (1 | ) | — | (1 | ) | |||||||||
Economic gross margin | $ | 249 | $ | 379 | $ | 82 | $ | 710 | |||||||
40
Gross margin increased by $64 million and economic gross margin increased by $82 million during the nine months ended September 30, 2016, compared to the same period in 2015 due to:
(In millions) | |||
Increase in Renewables economic gross margin due to a 31% increase in volume generated at the Alta wind projects, as well as a 3% increase in solar generation, primarily CVSR. Additionally, there was an increase in economic gross margin of $3 million at Spring Canyon which was acquired in May 2015 | $ | 55 | |
Increase in Renewables economic gross margin due to an increase in price per MWh at Alta X and XI wind projects as the PPAs began in January 2016, compared to merchant prices in 2015 | 23 | ||
Increase in Thermal economic gross margin primarily due to lower gas prices in addition to increased revenues in January 2016 compared to January 2015 due to higher volume | 4 | ||
Conventional Generation economic gross margin remained flat primarily due to higher revenues at El Segundo as a result of forced outages in 2015, as well as increased capacity revenue at Marsh Landing due to a favorable performance test, offset by lower revenues at Walnut Creek as a result of forced outages in 2016 | — | ||
Increase in economic gross margin | 82 | ||
Higher contract amortization primarily for the Alta X and XI PPAs, which began in January 2016 | (11 | ) | |
Emissions credit amortization of NOx allowances at Walnut Creek and El Segundo in compliance with amendments to the Regional Clean Air Incentives Market program | (6 | ) | |
Decrease due to unrealized gains on forward contracts with an NRG subsidiary hedging the forecasted sale of power from Elbow Creek, Goat Wind, Alta X and Alta XI in 2015, prior to the start of the PPAs | (1 | ) | |
Increase in gross margin | $ | 64 | |
Other Costs of Operations
Other costs of operations decreased by $3 million during the nine months ended September 30, 2016, compared to the same period in 2015, primarily due to a property tax rebate received in 2016 for the Alta projects.
Equity in Earnings of Unconsolidated Affiliates
Equity in earnings of unconsolidated affiliates increased by $10 million during the nine months ended September 30, 2016, compared to the same period in 2015, due primarily to increased equity in earnings from Desert Sunlight, which was acquired in June 2015, DGPV Holdco 1, RPV Holdco and San Juan Mesa, partially offset by losses from Elkhorn Ridge.
Interest Expense
Interest expense increased by $12 million during the nine months ended September 30, 2016, compared to the same period in 2015, due to:
(In millions) | |||
Increase due to issuance of the 2020 Convertible Notes in the second quarter of 2015 and amortization of the related discount on the notes and debt issuance costs | $ | 7 | |
Increase due to higher revolving credit facility borrowings in 2016 | 6 | ||
Increase from changes in the fair value of Alpine interest rate swaps | 3 | ||
Increase due to $200 million of debt issued by CVSR Holdco in August 2016 | 2 | ||
Decrease for redemption of Alta X and XI project-level debt | (6 | ) | |
$ | 12 | ||
41
Income Tax Expense
For the nine months ended September 30, 2016, the Company recorded income tax expense of $25 million on pretax income of $136 million. For the same period in 2015, the Company recorded income tax expense of $8 million on pretax income of $61 million. For the nine months ended September 30, 2016 and 2015, the overall effective tax rate was different than the statutory rate of 35% primarily due to taxable earnings allocated to NRG resulting from NRG's interest in NRG Yield LLC and production and investment tax credits generated from certain wind and solar assets, respectively.
Income Attributable to Noncontrolling Interests
For the nine months ended September 30, 2016, the Company had income of $98 million attributable to NRG related to its 46.7% economic interest in NRG Yield LLC and its 25% interest in NRG Wind TE Holdco. Additionally, for the nine months ended September 30, 2016, the Company had a loss of $67 million attributable to non-controlling interests with respect to its tax equity financing arrangements and the application of the HLBV method. For the nine months ended September 30, 2015, the Company had income of $35 million attributable to NRG's 55.3% economic interest in the Company and income of $2 million attributable to non-controlling interests with respect to its tax equity financing arrangements and application of the HLBV method.
Liquidity and Capital Resources
The Company's principal liquidity requirements are to meet its financial commitments, finance current operations, fund capital expenditures, including acquisitions from time to time, to service debt and to pay dividends. Historically, the Company's predecessor operations were financed as part of NRG's integrated operations and largely relied on internally generated cash flows as well as corporate and/or project-level borrowings to satisfy its capital expenditure requirements. As a normal part of the Company's business, depending on market conditions, the Company will from time to time consider opportunities to repay, redeem, repurchase or refinance its indebtedness. Changes in the Company's operating plans, lower than anticipated sales, increased expenses, acquisitions or other events may cause the Company to seek additional debt or equity financing in future periods. There can be no guarantee that financing will be available on acceptable terms or at all. Debt financing, if available, could impose additional cash payment obligations and additional covenants and operating restrictions.
Liquidity Position
As of September 30, 2016 and December 31, 2015, the Company's liquidity was approximately $769 million and $375 million, respectively, comprised of cash, restricted cash, and availability under the Company's revolving credit facility. The Company's liquidity includes $138 million and $131 million of restricted cash balances as of September 30, 2016 and December 31, 2015, respectively. Restricted cash consists primarily of funds to satisfy the requirements of certain debt agreements and funds held within the Company's projects that are restricted in their use. The Company's various financing arrangements are described in Note 7, Long-term Debt. As of September 30, 2016, the Company had $431 million of available borrowings under its revolving credit facility.
As of September 30, 2016, there were no outstanding borrowings and there were $64 million of letters of credit outstanding under the Company's revolving credit facility.
Management believes that the Company's liquidity position, cash flows from operations and availability under its revolving credit facility will be adequate to meet the Company's financial commitments; debt service obligations; growth, operating and maintenance capital expenditures; and to fund dividends to holders of the Company's Class A common stock and Class C common stock. Management continues to regularly monitor the Company's ability to finance the needs of its operating, financing and investing activity within the dictates of prudent balance sheet management.
42
Credit Ratings
Credit rating agencies rate a firm's public debt securities. These ratings are utilized by the debt markets in evaluating a firm's credit risk. Ratings influence the price paid to issue new debt securities by indicating to the market the Company's ability to pay principal, interest and preferred dividends. Rating agencies evaluate a firm's industry, cash flow, leverage, liquidity, and hedge profile, among other factors, in their credit analysis of a firm's credit risk.
On August 15, 2016, S&P lowered its corporate credit ratings on NRG Yield, Inc. and the 2024 Senior Notes to BB from BB+. The ratings outlook is stable.
The following table summarizes the credit ratings for the Company and its Senior Notes as of September 30, 2016:
S&P | Moody's | ||
NRG Yield, Inc. | BB | Ba2 | |
5.375% Senior Notes, due 2024 | BB | Ba2 | |
5.000% Senior Notes, due 2026 | BB | Ba2 | |
Sources of Liquidity
The Company's principal sources of liquidity include cash on hand, cash generated from operations, borrowings under new and existing financing arrangements and the issuance of additional equity and debt securities as appropriate given market conditions. As described in Note 7, Long-term Debt, to this Form 10-Q and Note 9, Long-term Debt, to the consolidated annual financial statements included in the Company's September 6, 2016 Form 8-K, the Company's financing arrangements consist of the revolving credit facility, the 2019 Convertible Notes, the 2020 Convertible Notes, the Senior Notes, the ATM Program and project-level financings for its various assets.
NRG Yield Operating LLC 2026 Senior Notes
On August 18, 2016, NRG Yield Operating LLC issued $350 million of senior unsecured notes, or the 2026 Senior Notes. The 2026 Senior Notes bear interest at 5.00% and mature on September 15, 2026. Interest on the notes is payable semi-annually on March 15 and September 15 of each year, and interest payments will commence on March 15, 2017. The 2026 Senior Notes are senior unsecured obligations of NRG Yield Operating LLC and are guaranteed by NRG Yield LLC, and by certain of NRG Yield Operating LLC’s wholly owned current and future subsidiaries. A portion of the proceeds of the 2026 Senior Notes were used to repay the Company's revolving credit facility.
At-the-Market Equity Offering Program
On August 9, 2016, NRG Yield, Inc. entered into an equity distribution agreement, or EDA, with Barclays Capital Inc., Credit Suisse Securities (USA) LLC, J.P. Morgan Securities LLC and RBC Capital Markets, LLC, as sales agents. Pursuant to the terms of the EDA, NRG Yield, Inc. may offer and sell shares of its Class C common stock par value $0.01 per share, from time to time through the sales agents, as NRG Yield, Inc.’s sales agents for the offer and sale of the shares, up to an aggregate sales price of $150,000,000 through an at-the-market equity offering program, or ATM Program. NRG Yield, Inc. may also sell shares of its Class C common stock to any of the sales agents, as principals for its own account, at a price agreed upon at the time of sale.
As of October 31, 2016, no shares were issued under the ATM Program.
CVSR Holdco Financing Arrangement
On July 15, 2016, CVSR Holdco, the indirect owner of the CVSR solar facility, issued $200 million of senior secured notes that bear interest at 4.68% and mature on March 31, 2037. Net proceeds were distributed to the Company and NRG based on their respective ownership as of July 15, 2016, and accordingly, the Company received net proceeds of $97.5 million. The proceeds were utilized, along with $28 million of cash on hand, to reduce borrowings under the Company’s revolving credit facility.
Thermal Financing
On October 31, 2016, NRG Energy Center Minneapolis LLC, a subsidiary of NRG Thermal LLC, received proceeds of $125 million from the issuance of 3.55% Series D notes due October 31, 2031, or the Series D Notes, and entered into a shelf facility for the anticipated issuance of an additional $70 million of notes. The Series D Notes are, and the additional notes, if issued, will be secured by substantially all of the assets of NRG Energy Center Minneapolis LLC. NRG Thermal LLC has
43
guaranteed the indebtedness and its guarantee is secured by a pledge of the equity interests in all of NRG Thermal LLC’s subsidiaries. NRG Energy Center Minneapolis LLC distributed the proceeds of the Series D Notes to NRG Thermal LLC, which in turn distributed the proceeds to NRG Yield Operating LLC to be utilized for general corporate purposes, including potential acquisitions.
Uses of Liquidity
The Company's requirements for liquidity and capital resources, other than for operating its facilities, are categorized as: (i) debt service obligations, as described more fully in Note 7, Long-term Debt; (ii) capital expenditures; (iii) acquisitions and investments; and (iv) cash dividends to investors.
Capital Expenditures
The Company's capital spending program is mainly focused on maintenance capital expenditures, or costs to maintain the assets currently operating, such as costs to replace or refurbish assets during routine maintenance, and growth capital expenditures or construction of new assets and completing the construction of assets where construction is in process. The Company develops annual capital spending plans based on projected requirements for maintenance and growth capital. For the nine months ended September 30, 2016, the Company used approximately $16 million to fund capital expenditures, of which $12 million related to maintenance capital expenditures. For the nine months ended September 30, 2015, the Company used approximately $17 million to fund capital expenditures, of which $8 million related to maintenance capital expenditures.
Acquisitions and Investments
The Company intends to acquire generation and thermal infrastructure assets developed and constructed by NRG in the future, as well as generation and thermal infrastructure assets from third parties where the Company believes its knowledge of the market and operating expertise provides a competitive advantage, and to utilize such acquisitions as a means to grow its CAFD.
CVSR — On September 1, 2016, the Company acquired the remaining 51.05% interest of CVSR Holdco LLC, which indirectly owns the CVSR solar facility, from NRG for total cash consideration of $78.5 million plus an immaterial working capital adjustment. The Company also assumed additional debt of $496 million, which represents 51.05% of the CVSR project level debt and 51.05% of the notes issued under the CVSR Holdco Financing Agreement. The acquisition was funded with cash on hand.
UPMC Thermal Project — On October 31, 2016, NRG Business Services LLC, a subsidiary of NRG, and NRG Energy Center Pittsburgh LLC, or NECP, a subsidiary of the Company, entered into a EPC agreement for the construction of a 73 MWt district energy system for NECP to provide 150 kpph of steam, 6,750 tons of chilled water and 7.5 MW of emergency backup power service to UPMC. The initial term of the energy services agreement (under fixed capacity payments) with UPMC Mercy will be for a period of twenty years from the service commencement date. Pursuant to the terms of the EPC agreement, NECP shall pay NRG Business Services LLC $79 million, subject to adjustment based upon certain conditions in the EPC agreement, upon substantial completion of the project. The project is expected to reach COD in the first quarter of 2018.
Cash Dividends to Investors
NRG Yield, Inc. intends to use the amount of cash that it receives from its distributions from NRG Yield LLC to pay quarterly dividends to the holders of its Class A common stock and Class C common stock. NRG Yield LLC intends to distribute to its unit holders in the form of a quarterly distribution all of the CAFD it generates each quarter, less reserves for the prudent conduct of the business, including among others, maintenance capital expenditures to maintain the operating capacity of the assets. CAFD is defined as net income before interest expense, income taxes, depreciation and amortization; plus cash distributions from unconsolidated affiliates; less cash distributions to noncontrolling interests, maintenance capital expenditures, pro-rata EBITDA from unconsolidated affiliates, cash interest paid, income taxes paid, principal amortization of indebtedness and changes in other assets. Dividends on the Class A common stock and Class C common stock are subject to available capital, market conditions, and compliance with associated laws, regulations and other contractual obligations. The Company expects that, based on current circumstances, comparable cash dividends will continue to be paid in the foreseeable future.
44
The following table lists the dividends paid on NRG Yield, Inc.'s Class A common stock and Class C common stock during the nine months ended September 30, 2016:
Third Quarter 2016 | Second Quarter 2016 | First Quarter 2016 | |||||||||
Dividends per Class A share | $ | 0.24 | $ | 0.23 | $ | 0.225 | |||||
Dividends per Class C share | $ | 0.24 | $ | 0.23 | $ | 0.225 | |||||
On November 2, 2016, NRG Yield, Inc. declared quarterly dividends on its Class A common stock and Class C common stock of $0.25 per share payable on December 15, 2016, to stockholders of record as of December 1, 2016.
45
Cash Flow Discussion
The following table reflects the changes in cash flows for the nine months ended September 30, 2016 compared to 2015:
Nine months ended September 30, | |||||||||||
2016 | 2015 | Change | |||||||||
(In millions) | |||||||||||
Net cash provided by operating activities | $ | 439 | $ | 310 | $ | 129 | |||||
Net cash used in investing activities | (142 | ) | (867 | ) | 725 | ||||||
Net cash (used in) provided by financing activities | (208 | ) | 273 | (481 | ) | ||||||
Net Cash Provided By Operating Activities
Changes to net cash provided by operating activities were driven by: | (In millions) | ||
Increase in operating income adjusted for non-cash items | $ | 115 | |
Changes in working capital driven primarily by the timing of wind generation in 2015 compared to 2016 | 15 | ||
Lower distributions from unconsolidated affiliates | (1 | ) | |
$ | 129 | ||
Net Cash Used In Investing Activities
Changes to net cash used in investing activities were driven by: | (In millions) | ||
Higher payments made to acquire the January 2015 Drop Down Assets compared to the CVSR Drop Down in 2016 | $ | 412 | |
Decrease in investments in unconsolidated affiliates in 2016 primarily due to the investment in Desert Sunlight made in 2015 | 282 | ||
Payments to acquire Spring Canyon and University of Bridgeport Fuel Cell in 2015, net of cash acquired | 37 | ||
Changes in restricted cash due to higher funding for certain projects' debt reserves partially offset by higher project distributions in 2016 compared to 2015 | 17 | ||
Receipt of renewable energy grants at CVSR in 2015 | (22 | ) | |
Other | (1 | ) | |
$ | 725 | ||
Net Cash (Used in) Provided By Financing Activities
Changes in net cash (used in) provided by financing activities were driven by: | (In millions) | ||
Proceeds from NRG Yield, Inc. Class C common stock offering on June 29, 2015, net of underwriting discounts and commissions | $ | (599 | ) |
Higher net payments from the revolving credit facility | (398 | ) | |
Higher net proceeds from long-term debt | 723 | ||
Decrease in net contributions from noncontrolling interests | (116 | ) | |
Increase in dividends and distributions paid to common stockholders due to the increase in dividend per share in 2016 compared to 2015 | (28 | ) | |
Decrease in debt issuance costs paid in 2016 compared to 2015 | 7 | ||
Payment of distributions to NRG due to NRG's 25% ownership of NRG Wind TE Holdco and distributions from CVSR to NRG prior to the acquisition date in 2016 | (70 | ) | |
$ | (481 | ) | |
46
NOLs, Deferred Tax Assets and Uncertain Tax Position Implications, under ASC 740
As of December 31, 2015, the Company has a cumulative federal NOL carry forward balance of $519 million for financial statement purposes, which will begin expiring in 2033. As a result of the Company's tax position, and based on current forecasts, the Company does not anticipate significant income tax payments for federal, state and local jurisdictions in 2016. Based on the Company's current and expected NOL balances generated primarily by accelerated tax depreciation of its property, plant and equipment, the Company does not expect to pay significant federal income tax for a period of approximately nine years.
The Company is subject to examination by taxing authorities for income tax returns filed in the U.S. federal jurisdiction and various state jurisdictions. The Company is not subject to U.S. federal or state income tax examinations for years prior to 2013.
The Company has no uncertain tax benefits.
Off-Balance Sheet Arrangements
Obligations under Certain Guarantee Contracts
The Company may enter into guarantee arrangements in the normal course of business to facilitate commercial transactions with third parties.
Retained or Contingent Interests
The Company does not have any material retained or contingent interests in assets transferred to an unconsolidated entity.
Obligations Arising Out of a Variable Interest in an Unconsolidated Entity
Variable interest in equity investments — As of September 30, 2016, the Company has several investments with an ownership interest percentage of 50% or less in energy and energy-related entities that are accounted for under the equity method. DGPV Holdco 1, DGPV Holdco 2, RPV Holdco and GenConn are variable interest entities for which the Company is not the primary beneficiary.
The Company's pro-rata share of non-recourse debt held by unconsolidated affiliates was approximately $450 million as of September 30, 2016. This indebtedness may restrict the ability of these subsidiaries to issue dividends or distributions to the Company. See also Note 4, Variable Interest Entities, or VIEs.
Contractual Obligations and Commercial Commitments
The Company has a variety of contractual obligations and other commercial commitments that represent prospective cash requirements in addition to our capital expenditure programs, as disclosed in the Company's September 6, 2016 Form 8-K.
Fair Value of Derivative Instruments
The Company may enter into fuel purchase contracts and other energy-related financial instruments to mitigate variability in earnings due to fluctuations in spot market prices and to hedge fuel requirements at certain generation facilities. In addition, in order to mitigate interest rate risk associated with the issuance of variable rate debt, the Company enters into interest rate swap agreements.
The tables below disclose the activities of non-exchange traded contracts accounted for at fair value in accordance with ASC 820. Specifically, these tables disaggregate realized and unrealized changes in fair value; disaggregate estimated fair values at September 30, 2016, based on their level within the fair value hierarchy defined in ASC 820; and indicate the maturities of contracts at September 30, 2016. For a full discussion of the Company's valuation methodology of its contracts, see Derivative Fair Value Measurements in Note 5, Fair Value of Financial Instruments.
Derivative Activity (Losses)/Gains | (In millions) | ||
Fair value of contracts as of December 31, 2015 | $ | (100 | ) |
Contracts realized or otherwise settled during the period | 27 | ||
Changes in fair value | (65 | ) | |
Fair Value of contracts as of September 30, 2016 | $ | (138 | ) |
47
Fair Value of contracts as of September 30, 2016 | |||||||||||||||||||
Maturity | |||||||||||||||||||
Fair Value Hierarchy Losses | 1 Year or Less | Greater Than 1 Year to 3 Years | Greater Than 3 Years to 5 Years | Greater Than 5 Years | Total Fair Value | ||||||||||||||
(In millions) | |||||||||||||||||||
Level 2 | $ | 31 | $ | 50 | $ | 31 | $ | 26 | $ | 138 | |||||||||
The Company has elected to disclose derivative assets and liabilities on a trade-by-trade basis and does not offset amounts at the counterparty master agreement level. As discussed below in Quantitative and Qualitative Disclosures about Market Risk -Commodity Price Risk, NRG, on behalf of the Company, measures the sensitivity of the portfolio to potential changes in market prices using VaR, a statistical model which attempts to predict risk of loss based on market price and volatility. NRG's risk management policy places a limit on one-day holding period VaR, which limits the net open position.
Critical Accounting Policies and Estimates
The Company's discussion and analysis of the financial condition and results of operations are based upon the consolidated financial statements, which have been prepared in accordance with GAAP. The preparation of these financial statements and related disclosures in compliance with GAAP requires the application of appropriate technical accounting rules and guidance as well as the use of estimates and judgments that affect the reported amounts of assets, liabilities, revenues and expenses, and related disclosures of contingent assets and liabilities. The application of these policies necessarily involves judgments regarding future events, including the likelihood of success of particular projects, legal and regulatory challenges, and the fair value of certain assets and liabilities. These judgments, in and of themselves, could materially affect the financial statements and disclosures based on varying assumptions, which may be appropriate to use. In addition, the financial and operating environment may also have a significant effect, not only on the operation of the business, but on the results reported through the application of accounting measures used in preparing the financial statements and related disclosures, even if the nature of the accounting policies has not changed.
On an ongoing basis, the Company evaluates these estimates, utilizing historic experience, consultation with experts and other methods the Company considers reasonable. In any event, actual results may differ substantially from the Company's estimates. Any effects on the Company's business, financial position or results of operations resulting from revisions to these estimates are recorded in the period in which the information that gives rise to the revision becomes known.
The Company identifies its most critical accounting policies as those that are the most pervasive and important to the portrayal of the Company's financial position and results of operations, and that require the most difficult, subjective and/or complex judgments by management regarding estimates about matters that are inherently uncertain. The Company's critical accounting policies include income taxes and valuation allowance for deferred tax assets, impairment of long lived assets and other intangible assets and acquisition accounting.
Recent Accounting Developments
See Note 2, Summary of Significant Accounting Policies, for a discussion of recent accounting developments.
48
ITEM 3 — Quantitative and Qualitative Disclosures About Market Risk
The Company is exposed to several market risks in its normal business activities. Market risk is the potential loss that may result from market changes associated with the Company's power generation or with an existing or forecasted financial or commodity transaction. The types of market risks the Company is exposed to are commodity price risk, interest rate risk, liquidity risk, and credit risk. The following disclosures about market risk provide an update to, and should be read in conjunction with, Item 7A — Quantitative and Qualitative Disclosures About Market Risk, of the Company's 2015 Form 10-K.
Commodity Price Risk
Commodity price risks result from exposures to changes in spot prices, forward prices, volatilities, and correlations between various commodities, such as electricity, natural gas and emissions credits. The Company manages the commodity price risk of its merchant generation operations by entering into derivative or non-derivative instruments to hedge the variability in future cash flows from forecasted power sales or purchases of fuel. The portion of forecasted transactions hedged may vary based upon management's assessment of market, weather, operation and other factors.
Based on a sensitivity analysis using simplified assumptions, the impact of a $0.50 per MMBtu increase or decrease in natural gas prices across the term of the derivative contracts would cause a change of approximately $1 million to the net value of derivatives as of September 30, 2016.
Interest Rate Risk
The Company is exposed to fluctuations in interest rates through its issuance of variable rate debt. Exposures to interest rate fluctuations may be mitigated by entering into derivative instruments known as interest rate swaps, caps, or collars and put or call options. These contracts reduce exposure to interest rate volatility and result in primarily fixed rate debt obligations when taking into account the combination of the variable rate debt and the interest rate derivative instrument. NRG's risk management policies allow the Company to reduce interest rate exposure from variable rate debt obligations.
Most of the Company's project subsidiaries enter into interest rate swaps, intended to hedge the risks associated with interest rates on non-recourse project level debt. See Note 9, Long-Term Debt, to the Company's consolidated financial statements included in the Company's September 6, 2016 Form 8-K, for more information about interest rate swaps of the Company's project subsidiaries.
If all of the interest rate swaps had been discontinued on September 30, 2016, the Company would have owed the counterparties $142 million. Based on the credit ratings of the counterparties, the Company believes its exposure to credit risk due to nonperformance by counterparties to its hedge contracts to be insignificant.
The Company has long-term debt instruments that subject it to the risk of loss associated with movements in market interest rates. As of September 30, 2016, a 1% change in interest rates would result in an approximately $3 million change in market interest expense on a rolling twelve-month basis.
As of September 30, 2016, the fair value of the Company's debt was $5,729 million and the carrying value was $5,704 million. The Company estimates that a 1% decrease in market interest rates would have increased the fair value of its long-term debt by approximately $473 million.
Liquidity Risk
Liquidity risk arises from the general funding needs of the Company's activities and in the management of the Company's assets and liabilities.
Counterparty Credit Risk
Credit risk relates to the risk of loss resulting from non-performance or non-payment by counterparties pursuant to the terms of their contractual obligations. The Company monitors and manages credit risk through credit policies that include: (i) an established credit approval process; and (ii) the use of credit mitigation measures such as prepayment arrangements or volumetric limits. Risks surrounding counterparty performance and credit could ultimately impact the amount and timing of expected cash flows. The Company seeks to mitigate counterparty risk by having a diversified portfolio of counterparties.
49
ITEM 4 — Controls and Procedures
Conclusion Regarding the Effectiveness of Disclosure Controls and Procedures
Under the supervision and with the participation of the Company's management, including its principal executive officer, principal financial officer and principal accounting officer, the Company conducted an evaluation of the effectiveness of the design and operation of its disclosure controls and procedures, as such term is defined in Rules 13a-15(e) or 15d-15(e) of the Exchange Act. Based on this evaluation, the Company's principal executive officer, principal financial officer and principal accounting officer concluded that the disclosure controls and procedures were effective as of the end of the period covered by this Quarterly Report on Form 10-Q.
Changes in Internal Control over Financial Reporting
There were no changes in the Company’s internal control over financial reporting (as such term is defined in Rule 13a-15(f) under the Exchange Act) that occurred in the third quarter of 2016 that materially affected, or are reasonably likely to materially affect, the Company’s internal control over financial reporting.
50
PART II - OTHER INFORMATION
ITEM 1 — LEGAL PROCEEDINGS
For a discussion of the material legal proceedings in which the Company was involved through September 30, 2016, see Note 12, Contingencies, to this Form 10-Q.
ITEM 1A — RISK FACTORS
Information regarding risk factors appears in Part I, Item 1A, Risk Factors, in the Company's 2015 Form 10-K. There have been no material changes in the Company's risk factors since those reported in its 2015 Form 10-K.
ITEM 2 — UNREGISTERED SALES OF EQUITY SECURITIES AND USE OF PROCEEDS
None.
ITEM 3 — DEFAULTS UPON SENIOR SECURITIES
None.
ITEM 4 — MINE SAFETY DISCLOSURES
Not applicable.
ITEM 5 — OTHER INFORMATION
None.
51
ITEM 6 — EXHIBITS
Number | Description | Method of Filing | ||
4.1 | Indenture, dated August 18, 2016, among NRG Yield Operating LLC, the guarantors named therein and Law Debenture Trust Company of New York. | Incorporated herein by reference to Exhibit 4.1 to the Registrant's Current Report on Form 8-K, filed on August 18, 2016. | ||
4.2 | Form of 5.000% Senior Note due 2026. | Incorporated herein by reference to Exhibit 4.2 to the Registrant's Current Report on Form 8-K, filed on August 18, 2016. | ||
4.3 | Registration Rights Agreement, dated August 18, 2016, among NRG Yield Operating LLC, the guarantors named therein and J.P. Morgan Securities LLC, as representative of the initial purchasers. | Incorporated herein by reference to Exhibit 4.3 to the Registrant's Current Report on Form 8-K, filed on August 18, 2016. | ||
10.1* | NRG Yield, Inc. 2013 Equity Incentive Plan Restricted Stock Unit Agreement. | Filed herewith. | ||
31.1 | Rule 13a-14(a)/15d-14(a) certification of Christopher S. Sotos. | Filed herewith. | ||
31.2 | Rule 13a-14(a)/15d-14(a) certification of Kirkland B. Andrews. | Filed herewith. | ||
31.3 | Rule 13a-14(a)/15d-14(a) certification of David Callen. | Filed herewith. | ||
32 | Section 1350 Certification. | Furnished herewith. | ||
101 INS | XBRL Instance Document. | Filed herewith. | ||
101 SCH | XBRL Taxonomy Extension Schema. | Filed herewith. | ||
101 CAL | XBRL Taxonomy Extension Calculation Linkbase. | Filed herewith. | ||
101 DEF | XBRL Taxonomy Extension Definition Linkbase. | Filed herewith. | ||
101 LAB | XBRL Taxonomy Extension Label Linkbase. | Filed herewith. | ||
101 PRE | XBRL Taxonomy Extension Presentation Linkbase. | Filed herewith. | ||
* Indicates exhibits that constitute compensatory plans or arrangements.
52
SIGNATURES
Pursuant to the requirements of the Securities Exchange Act of 1934, the registrant has duly caused this report to be signed on its behalf by the undersigned thereunto duly authorized.
NRG YIELD, INC. (Registrant) | ||||
/s/ CHRISTOPHER S. SOTOS | ||||
Christopher S. Sotos | ||||
Chief Executive Officer (Principal Executive Officer) | ||||
/s/ KIRKLAND B. ANDREWS | ||||
Kirkland B. Andrews | ||||
Chief Financial Officer (Principal Financial Officer) | ||||
/s/ DAVID CALLEN | ||||
David Callen | ||||
Date: November 4, 2016 | Chief Accounting Officer (Principal Accounting Officer) | |||
53