Attached files
| file | filename |
|---|---|
| EX-99.1 - EXHIBIT 99.1 - MEDICAL PROPERTIES TRUST INC | d286459dex991.htm |
| 8-K - FORM 8-K - MEDICAL PROPERTIES TRUST INC | d286459d8k.htm |
Exhibit 99.2

Medical Properties Trust
THIRD QUARTER 2016
Supplemental Information
MEDICALPROPERTIESTRUST.COM
TABLE OF CONTENTS
COMPANY OVERVIEW
Company Information 3
FINANCIAL INFORMATION
Reconciliation of Net Income to Funds from Operations 5
Debt Summary 6
Debt Maturity Schedule 7
Pro Forma Net Debt /Annualized EBITDA 8
PORTFOLIO INFORMATION
Lease and Mortgage Loan Maturity Schedule 9
Investments and Revenue by Asset Type, Operator,
State and Country 10
EBITDAR to Rent Coverage 13
Summary of Acquisitions and
Development Projects 14
FINANCIAL STATEMENTS
Consolidated Statements of
Income 15
Consolidated Balance Sheets 16
Other Income Generating Assets 17
FORWARD-LOOKING STATEMENT Forward-looking statements involve known and unknown risks, uncertainties and other factors that may cause the actual results of the
Company or future events to differ materially from those expressed in or underlying such forward-looking statements, including without limitation: Normalized FFO per share; expected payout ratio, the amount of acquisitions of healthcare real estate,
if any; estimated debt metrics, portfolio diversification, capital markets conditions, the repayment of debt arrangements; statements concerning the additional income to the Company as a result of ownership interests in certain hospital operations
and the timing of such income; the payment of future dividends, if any; completion of additional debt arrangement, and additional investments; national and international economic, business, real estate and other market conditions; the competitive
environment in which the Company operates; the execution of the Company’s business plan; financing risks; the Company’s ability to maintain its status as a REIT for income tax purposes; acquisition and development risks; potential
environmental and other liabilities; and other factors affecting the real estate industry generally or healthcare real estate in particular. For further discussion of the factors that could affect outcomes, please refer to the “Risk
Factors” section of the Company’s Annual Report on Form 10-K for the year ended December 31, 2015, and as updated by the Company’s subsequently filed Quarterly Reports on Form 10-Q and other SEC filings. Except as otherwise required
by the federal securities laws, the Company undertakes no obligation to update the information in this report.
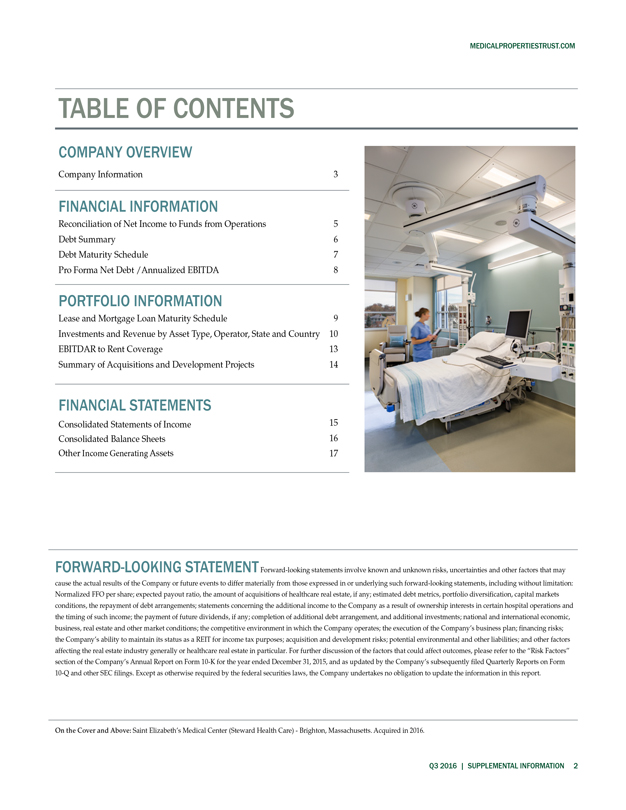
On the Cover and Above: Saint Elizabeth’s
Medical Center (Steward Health Care) - Brighton, Massachusetts. Acquired in 2016.
Q3 2016 | SUPPLEMENTAL INFORMATION 2
MEDICALPROPERTIESTRUST.COM
COMPANY OVERVIEW
MPT
Medical Properties Trust, Inc. is a Birmingham, Alabama based
self-advised real estate investment trust formed to capitalize on the changing trends in healthcare delivery by acquiring and developing net-leased healthcare facilities. MPT’s financing model allows hospitals and other healthcare facilities to
unlock the value of their underlying real estate in order to fund facility improvements, technology upgrades, staff additions and new construction. Facilities include acute care hospitals, inpatient rehabilitation hospitals, long-term acute care
hospitals, and other medical and surgical facilities.
OFFICERS
Edward K.
Aldag, Jr. Chairman, President and Chief Executive Officer
R. Steven Hamner Executive Vice President and Chief Financial Officer
Emmett E. McLean Executive Vice President, Chief Operating Officer, Treasurer and Secretary
J.
Kevin Hanna Vice President, Controller and Chief Accounting Officer
BOARD OF DIRECTORS
Edward K. Aldag, Jr.
G. Steven Dawson
R. Steven Hamner
Robert. E. Holmes, Ph.D.
Sherry A. Kellett
William G. McKenzie
D. Paul Sparks, Jr.
Michael G. Stewart
C. Reynolds Thompson, III
CORPORATE HEADQUARTERS
Medical Properties Trust, Inc.
1000 Urban Center Drive, Suite 501
Birmingham, AL 35242
(205) 969-3755
(205) 969-3756 (fax)
www.medicalpropertiestrust.com
MPT Medical Properties
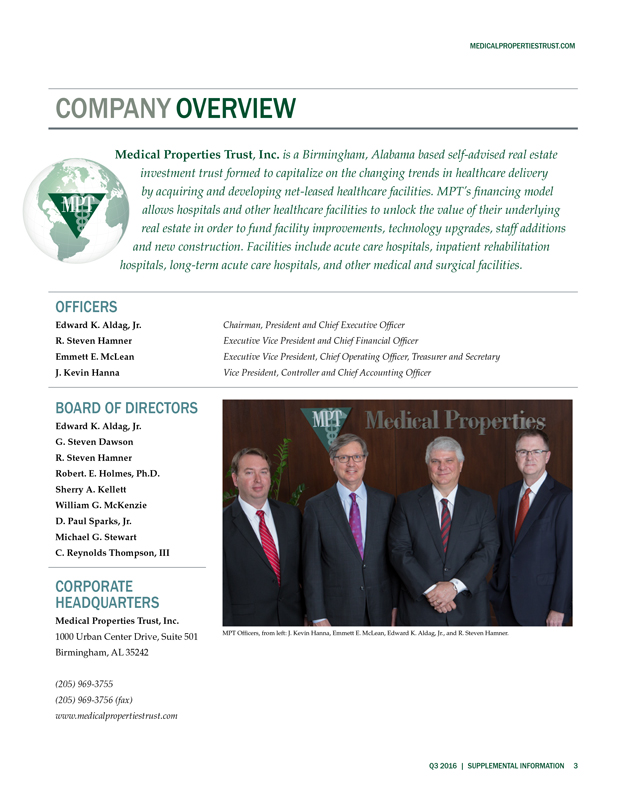
MPT Officers, from left: J. Kevin Hanna, Emmett E. McLean, Edward K.
Aldag, Jr., and R. Steven Hamner.
Q3 2016 | SUPPLEMENTAL INFORMATION 3
MEDICALPROPERTIESTRUST.COM
COMPANY
OVERVIEW(continued)
INVESTOR RELATIONS MPW CAPITAL MARKETS
Tim Berryman
LISTED Director - Investor Relations
Charles Lambert Managing Director - Capital Markets (205) 397-8897
(205) 397-8589
tberryman@medicalpropertiestrust.com
NYSE clambert@medicalpropertiestrust.com
TRANSFER AGENT
American Stock Transfer and Trust Company 6201 15th Avenue Brooklyn, NY 11219
STOCK EXCHANGE
LISTING AND TRADING SYMBOL
New York Stock Exchange (NYSE): MPW
SENIOR
UNSECURED
DEBT RATINGS
Moody’s – Ba1 Standard & Poor’s
– BBB-
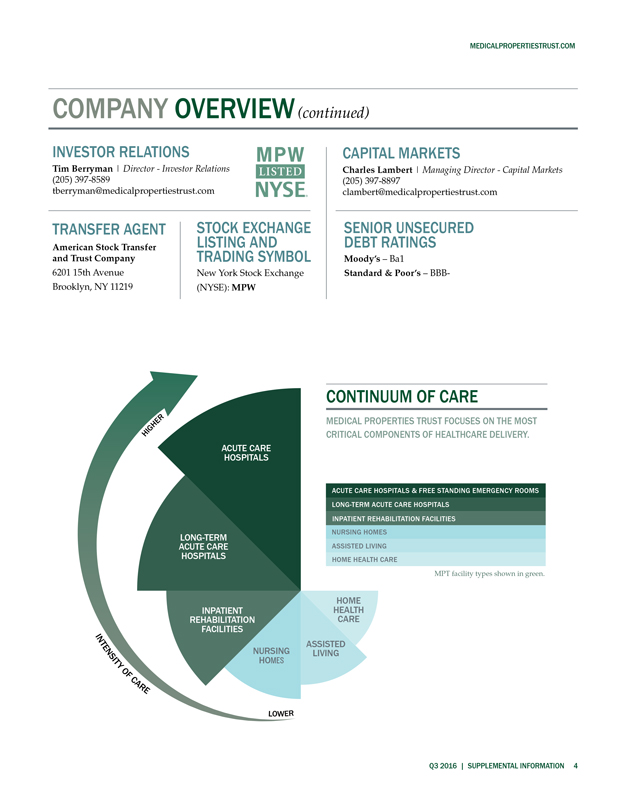
HIGHER
INTENSITY OF CARE
LOWER
ACUTE CARE HOSPITALS
LONG- TERM ACUTE CARE HOSPITALS
INPATIENT REHABILITATION FACILITIES
NURSING HOMES
ASSISTED LIVING
HOME HEALTH CARE
CONTINUUM OF CARE
MEDICAL PROPERTIES TRUST FOCUSES ON THE MOST CRITICAL COMPONENTS OF HEALTHCARE DELIVERY.
ACUTE CARE HOSPITALS & FREE STANDING EMERGENCY ROOMS
LONG-TERM ACUTE CARE
HOSPITALS
INPATIENT REHABILITATION FACILITIES
NURSING HOMES
ASSISTED LIVING
HOME HEALTH CARE
MPT facility types shown in green.
Q3 2016 | SUPPLEMENTAL INFORMATION 4
MEDICALPROPERTIESTRUST.COM
FINANCIAL
INFORMATION
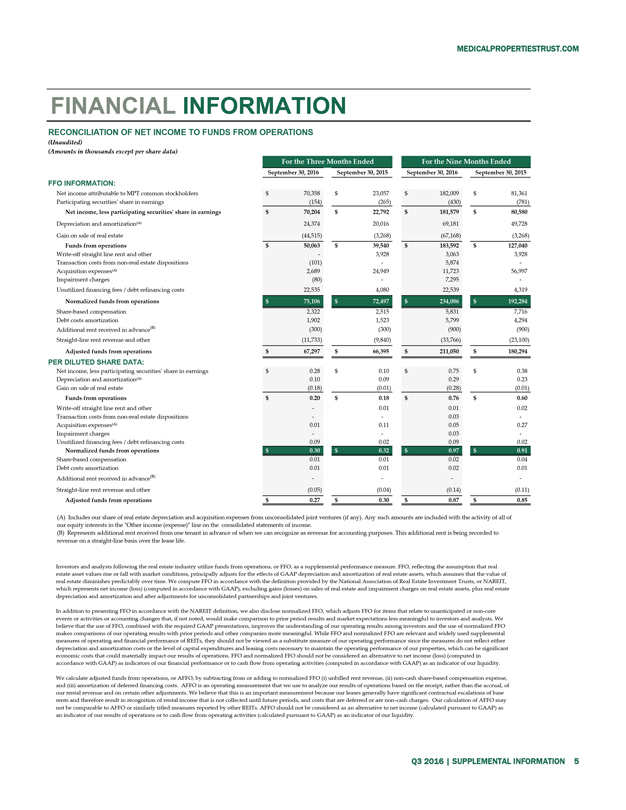
RECONCILIATION OF NET INCOME TO FUNDS FROM OPERATIONS
(Unaudited)
(Amounts in thousands except per share data)
For the Three Months Ended For
the Nine Months Ended
September 30, 2016 September 30, 2015 September 30, 2016 September 30, 2015
FFO INFORMATION:
Net income attributable to MPT common stockholders $70,358 $23,057 $182,009
$81,361
Participating securities’ share in earnings (154) (265) (430) (781)
Net income, less participating securities’ share in earnings $70,204 $22,792 $181,579 $80,580
Depreciation and amortization(A) 24,374 20,016 69,181 49,728
Gain on sale of real estate
(44,515) (3,268) (67,168) (3,268)
Funds from operations $50,063 $39,540 $183,592 $127,040
Write-off straight line rent and other - 3,928 3,063 3,928
Transaction costs from non-real
estate dispositions (101) - 5,874 -
Acquisition expenses(A) 2,689 24,949 11,723 56,997
Impairment charges (80) - 7,295 -
Unutilized financing fees / debt refinancing costs 22,535
4,080 22,539 4,319
Normalized funds from operations $75,106 $72,497 $234,086 $192,284
Share-based compensation 2,322 2,515 5,831 7,716
Debt costs amortization 1,902 1,523 5,799
4,294
Additional rent received in advance(B) (300) (300) (900) (900)
Straight-line rent revenue and other (11,733) (9,840) (33,766) (23,100)
Adjusted funds from operations $67,297 $66,395 $211,050 $180,294
PER DILUTED
SHARE DATA:
Net income, less participating securities’ share in earnings $0.28 $0.10 $0.75 $0.38
Depreciation and amortization(A) 0.10 0.09 0.29 0.23
Gain on sale of real estate (0.18) (0.01)
(0.28) (0.01)
Funds from operations $0.20 $0.18 $0.76 $0.60
Write-off
straight line rent and other - 0.01 0.01 0.02
Transaction costs from non-real estate dispositions - - 0.03 -
Acquisition expenses(A) 0.01 0.11 0.05 0.27
Impairment charges - - 0.03 -
Unutilized financing fees / debt refinancing costs 0.09 0.02 0.09 0.02
Normalized funds from
operations $0.30 $0.32 $0.97 $0.91
Share-based compensation 0.01 0.01 0.02 0.04
Debt costs amortization 0.01 0.01 0.02 0.01
Additional rent received in
advance(B) - - - -
Straight-line rent revenue and other (0.05) (0.04) (0.14) (0.11)
Adjusted funds from operations $0.27 $0.30 $0.87 $0.85
(A) Includes our share of real
estate depreciation and acquisition expenses from unconsolidated joint ventures (if any). Any such amounts are included with the activity of all of our equity interests in the “Other income (expense)” line on the consolidated
statements of income.
(B) Represents additional rent received from one tenant in advance of when we can recognize as revenue for accounting purposes. This
additional rent is being recorded to revenue on a straight-line basis over the lease life.
Investors and analysts following the real estate industry utilize funds
from operations, or FFO, as a supplemental performance measure. FFO, reflecting the assumption that real estate asset values rise or fall with market conditions, principally adjusts for the effects of GAAP depreciation and amortization of real
estate assets, which assumes that the value of real estate diminishes predictably over time. We compute FFO in accordance with the definition provided by the National Association of Real Estate Investment Trusts, or NAREIT, which represents net
income (loss) (computed in accordance with GAAP), excluding gains (losses) on sales of real estate and impairment charges on real estate assets, plus real estate depreciation and amortization and after adjustments for unconsolidated partnerships and
joint ventures.
In addition to presenting FFO in accordance with the NAREIT definition, we also disclose normalized FFO, which adjusts FFO for items that relate to
unanticipated or non-core events or activities or accounting changes that, if not noted, would make comparison to prior period results and market expectations less meaningful to investors and analysts. We believe that the use of FFO, combined with
the required GAAP presentations, improves the understanding of our operating results among investors and the use of normalized FFO makes comparisons of our operating results with prior periods and other companies more meaningful. While FFO and
normalized FFO are relevant and widely used supplemental measures of operating and financial performance of REITs, they should not be viewed as a substitute measure of our operating performance since the measures do not reflect either depreciation
and amortization costs or the level of capital expenditures and leasing costs necessary to maintain the operating performance of our properties, which can be significant economic costs that could materially impact our results of operations. FFO and
normalized FFO should not be considered an alternative to net income (loss) (computed in accordance with GAAP) as indicators of our financial performance or to cash flow from operating activities (computed in accordance with GAAP) as an indicator of
our liquidity.
We calculate adjusted funds from operations, or AFFO, by subtracting from or adding to normalized FFO (i) unbilled rent revenue, (ii) non-cash
share-based compensation expense, and (iii) amortization of deferred financing costs. AFFO is an operating measurement that we use to analyze our results of operations based on the receipt, rather than the accrual, of our rental revenue and on
certain other adjustments. We believe that this is an important measurement because our leases generally have significant contractual escalations of base rents and therefore result in recognition of rental income that is not collected until future
periods, and costs that are deferred or are non-cash charges. Our calculation of AFFO may not be comparable to AFFO or similarly titled measures reported by other REITs. AFFO should not be considered as an alternative to net income (calculated
pursuant to GAAP) as an indicator of our results of operations or to cash flow from operating activities (calculated pursuant to GAAP) as an indicator of our liquidity.
Q3 2016 | SUPPLEMENTAL INFORMATION 5
MEDICALPROPERTIESTRUST.COM
FINANCIAL
INFORMATION
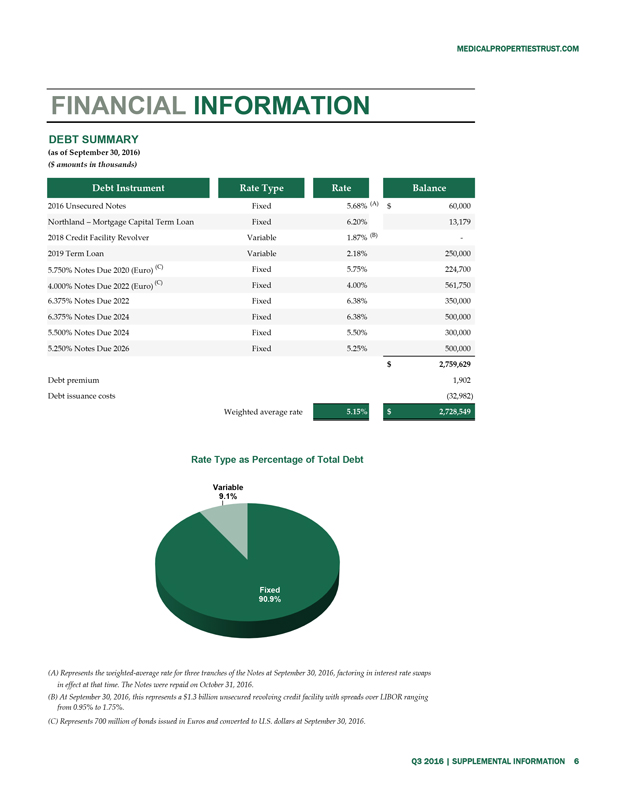
DEBT SUMMARY
(as of September 30, 2016)
($ amounts in thousands)
Debt Instrument Rate Type Rate Balance
2016 Unsecured Notes Fixed 5.68% (A) $60,000
Northland – Mortgage Capital Term Loan Fixed
6.20% 13,179
2018 Credit Facility Revolver Variable 1.87% (B) -
2019 Term
Loan Variable 2.18% 250,000
5.750% Notes Due 2020 (Euro) (C) Fixed 5.75% 224,700
4.000% Notes Due 2022 (Euro) (C) Fixed 4.00% 561,750
6.375% Notes Due 2022 Fixed 6.38% 350,000
6.375% Notes Due 2024 Fixed 6.38% 500,000
5.500% Notes Due 2024 Fixed 5.50%
300,000
5.250% Notes Due 2026 Fixed 5.25% 500,000
$2,759,629
Debt premium 1,902
Debt issuance costs (32,982)
Weighted average rate 5.15% $2,728,549
Rate Type as Percentage of Total Debt
Variable 9.1%
Fixed 90.9%
(A) Represents the weighted-average rate for three tranches of the Notes at September 30, 2016, factoring in interest rate swaps in effect at that time. The Notes were repaid on
October 31, 2016.
(B) At September 30, 2016, this represents a $1.3 billion unsecured revolving credit facility with spreads over LIBOR ranging from 0.95% to
1.75%.
(C) Represents 700 million of bonds issued in Euros and converted to U.S. dollars at September 30, 2016.
Q3 2016 | SUPPLEMENTAL INFORMATION 6
MEDICALPROPERTIESTRUST.COM
FINANCIAL
INFORMATION
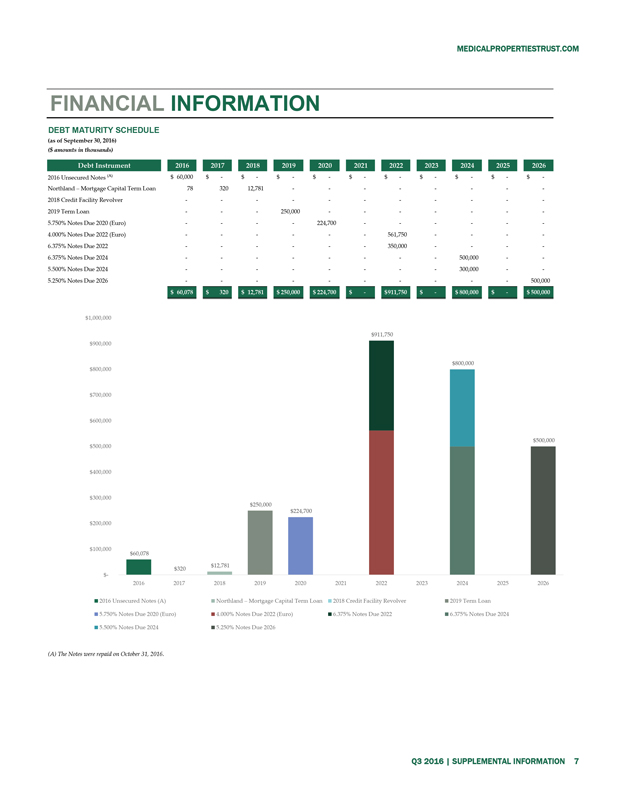
DEBT MATURITY SCHEDULE
(as of September 30, 2016)
($ amounts in thousands)
Debt Instrument 2016 2017 2018 2019 2020 2021 2022 2023 2024 2025
2026
2016 Unsecured Notes (A) $60,000 $- $- $- $- $- $- $- $- $- $-
Northland
– Mortgage Capital Term Loan 78 320 12,781 - - - - - - - -
2018 Credit Facility Revolver - - - - - - - - - - -
2019 Term Loan - - - 250,000 - - - - - - -
5.750% Notes Due 2020 (Euro) - - - - 224,700 - - -
- - -
4.000% Notes Due 2022 (Euro) - - - - - - 561,750 - - - -
6.375% Notes
Due 2022 - - - - - - 350,000 - - - -
6.375% Notes Due 2024 - - - - - - - - 500,000 - -
5.500% Notes Due 2024 - - - - - - - - 300,000 - -
5.250% Notes Due 2026 - - - - - - - - - -
500,000
$60,078 $320 $12,781 $250,000 $224,700 $- $911,750 $- $800,000 $- $500,000
$1,000,000 $900,000 $800,000 $700,000 $600,000 $500,000 $400,000 $300,000 $200,000 $100,000 $911,750
$- $60,078 $320 $12,781 $250,000 $224,700 $911,750 $800,000 $500,000
2016 2017 2018 2019 2020
2021 2022 2023 2024 2025 2026
2016 Unsecured Notes (A) Northland – Mortgage Capital Term Loan 2018 Credit Facility Revolver 2019 Term Loan
5.750% Notes Due 2020 (Euro) 4.000% Notes Due 2022 (Euro) 6.375% Notes Due 2022 6.375% Notes Due 2024
5.500% Notes Due 2024 5.250% Notes Due 2026
(A) The Notes were repaid on October 31, 2016.
Q3 2016 | SUPPLEMENTAL INFORMATION 7
MEDICALPROPERTIESTRUST.COM
FINANCIAL
INFORMATION
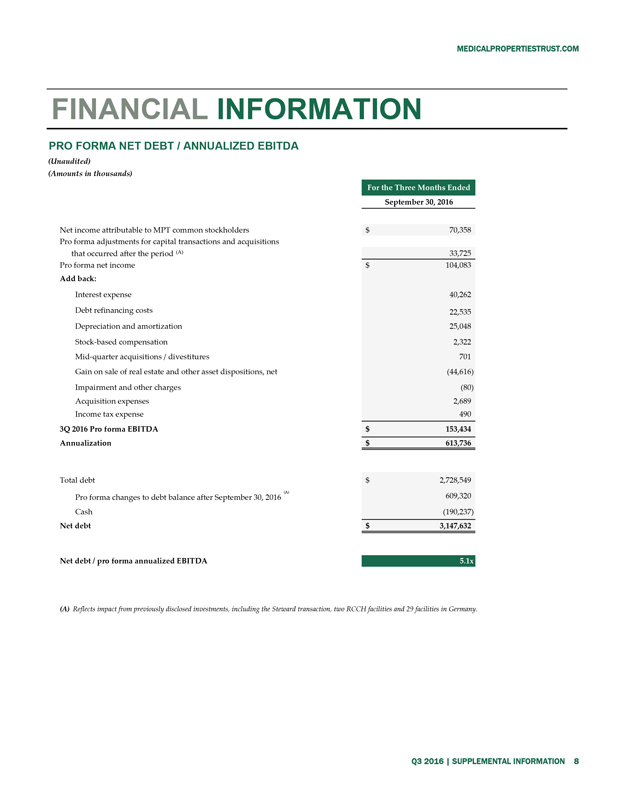
PRO FORMA NET DEBT / ANNUALIZED EBITDA
(Unaudited)
(Amounts in thousands) For the Three Months Ended
September 30, 2016
Net income attributable to MPT common stockholders $70,358
Pro forma adjustments for capital
transactions and acquisitions that occurred after the period (A) 33,725
Pro forma net income $104,083
Add back:
Interest expense 40,262
Debt refinancing costs 22,535
Depreciation and amortization 25,048
Stock-based compensation 2,322
Mid-quarter acquisitions / divestitures 701
Gain on sale of real estate and other asset dispositions, net (44,616)
Impairment and other
charges (80)
Acquisition expenses 2,689
Income tax expense 490
3Q 2016 Pro forma EBITDA $153,434
Annualization $613,736
Total debt $2,728,549
Pro forma changes to debt balance after September 30, 2016 (A) 609,320
Cash (190,237)
Net debt $3,147,632
Net debt / pro forma annualized EBITDA 5.1x
(A) Reflects impact from previously disclosed
investments, including the Steward transaction, two RCCH facilities and 29 facilities in Germany.
Q3 2016 | SUPPLEMENTAL INFORMATION 8
MEDICALPROPERTIESTRUST.COM
PORTFOLIO
INFORMATION
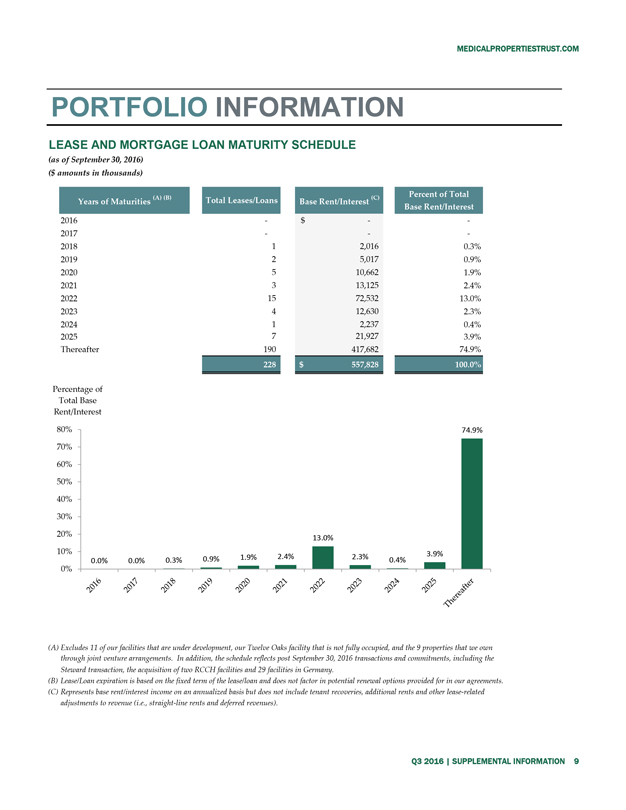
LEASE AND MORTGAGE LOAN MATURITY SCHEDULE
(as of September 30,
2016)
($ amounts in thousands)
Years of Maturities (A) (B) Total Leases/Loans
Base Rent/Interest (C) Percent of Total Base Rent/Interest
2016 - $- -
2017 -
- -
2018 1 2,016 0.3%
2019 2 5,017 0.9%
2020 5 10,662 1.9%
2021 3 13,125 2.4%
2022 15 72,532 13.0%
2023 4 12,630 2.3%
2024 1 2,237 0.4%
2025 7 21,927 3.9%
Thereafter 190 417,682
228 $557,828 100.0%
Percentage of Total Base Rent/Interest
80% 74.9%
70% 50% 40% 30% 20% 10% 0%
0.0% 0.0% 0.3% 0.9% 1.9% 2.4% 13.0% 2.3% 0.4% 3.9% 74.9%
2016 2017 2018 2019 2020 2021 2022 2023 2024 2025 Thereafter
(A) Excludes 11
of our facilities that are under development, our Twelve Oaks facility that is not fully occupied, and the 9 properties that we own through joint venture arrangements. In addition, the schedule reflects post September 30, 2016 transactions and
commitments, including the Steward transaction, the acquisition of two RCCH facilities and 29 facilities in Germany.
(B) Lease/Loan expiration is based on the
fixed term of the lease/loan and does not factor in potential renewal options provided for in our agreements.
(C) Represents base rent/interest income on an
annualized basis but does not include tenant recoveries, additional rents and other lease-related adjustments to revenue (i.e., straight-line rents and deferred revenues).
Q3 2016 | SUPPLEMENTAL INFORMATION 9
MEDICALPROPERTIESTRUST.COM
PORTFOLIO
INFORMATION
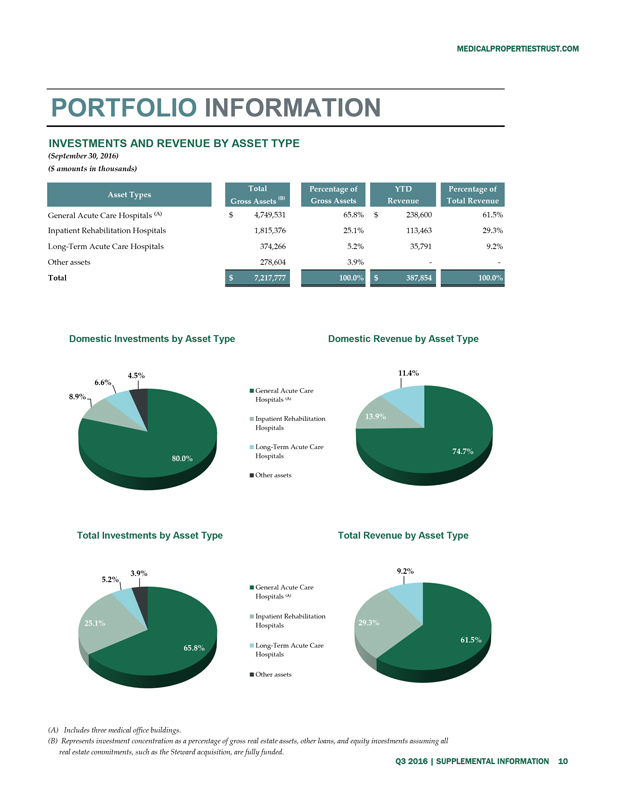
INVESTMENTS AND REVENUE BY ASSET TYPE
(September 30, 2016)
($ amounts in thousands)
| Asset Types General Acute Care Hospitals (A) Inpatient Rehabilitation Hospitals Long-Term Acute Care Hospitals Other assets Total | Total (B) Gross Assets $4,749,531 1,815,376 374,266 278,604 $7,217,777 | Percentage of Gross Assets 65.8% 25.1% 5.2% 3.9% 100.0% | YTD Revenue $238,600 113,463 35,791 — $387,854 | Percentage of Total Revenue 61.5% 29.3% 9.2% — 100.0% |
| Domestic Investments by Asset Type 4.5% 6.6% 8.9% 80.0% | General Acute Care Hospitals (A) Inpatient Rehabilitation Hospitals Long-Term Acute Care Hospitals Other assets | Domestic Revenue by Asset Type 11.4% 13.9% 74.7% |
| Total Investments by Asset Type 3.9% 5.2% 25.1% 65.8% | General Acute Care Hospitals (A) Inpatient Rehabilitation Hospitals Long-Term Acute Care Hospitals Other assets | Total Revenue by Asset Type 9.2% 29.3% 61.5% |
(A) Includes three medical office buildings.
(B)
Represents investment concentration as a percentage of gross real estate assets, other loans, and equity investments assuming all
real estate commitments, such as
the Steward acquisition, are fully funded.
Q3 2016 SUPPLEMENTAL INFORMATION 10
MEDICALPROPERTIESTRUST.COM
PORTFOLIO
INFORMATION
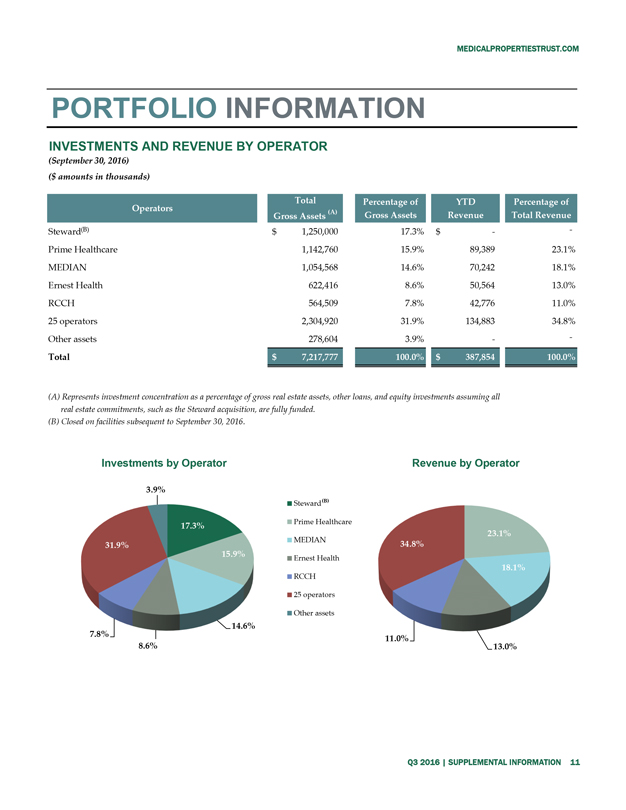
INVESTMENTS AND REVENUE BY OPERATOR
(September 30, 2016)
($ amounts in thousands)
| Operators Steward(B) Prime Healthcare MEDIAN Ernest Health RCCH 25 operators Other assets Total | Total (A) Gross Assets $1,250,000 1,142,760 1,054,568 622,416 564,509 2,304,920 278,604 $7,217,777 | Percentage of Gross Assets 17.3% 15.9% 14.6% 8.6% 7.8% 31.9% 3.9% 100.0% | YTD Revenue $— 89,389 70,242 50,564 42,776 134,883 — $387,854 | Percentage of Total Revenue — 23.1% 18.1% 13.0% 11.0% 34.8% — 100.0% |
(A) Represents investment concentration as a percentage of gross real estate assets, other loans, and equity investments assuming all real
estate commitments, such as the Steward acquisition, are fully funded.
(B) Closed on facilities subsequent to September 30, 2016.
| Investments by Operator 3.9% 17.3% 31.9% 15.9% 14.6% 7.8% 8.6% | Steward(B) Prime Healthcare MEDIAN Ernest Health RCCH 25 operators Other assets | Revenue by Operator 23.1% 34.8% 18.1% 11.0% 13.0% |
Q3 2016 | SUPPLEMENTAL INFORMATION 11
MEDICALPROPERTIESTRUST.COM
PORTFOLIO
INFORMATION
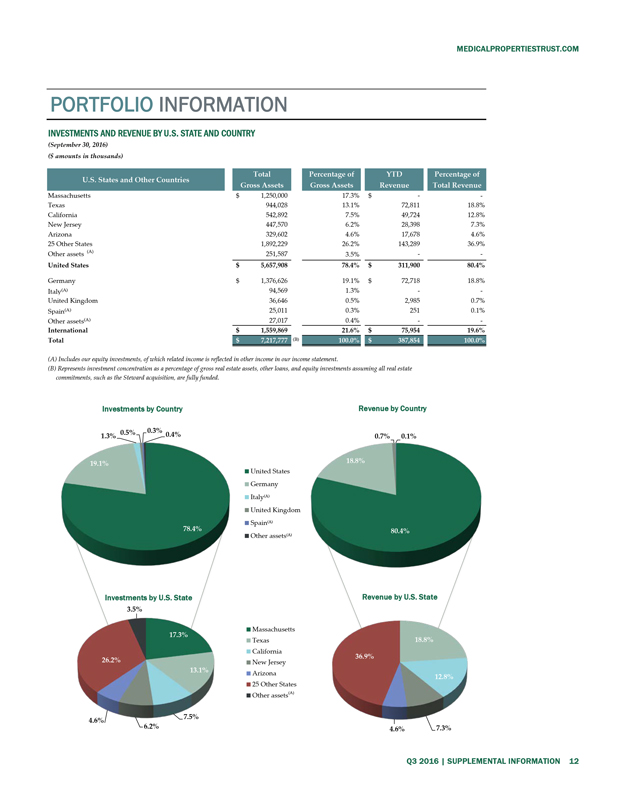
INVESTMENTS AND REVENUE BY U.S. STATE AND COUNTRY
(September 30,
2016)
($ amounts in thousands)
U.S. States and Other Countries Total Gross
Assets Percentage of Gross Assets YTD Revenue Percentage of Total Revenue
Massachusetts $ 1,250,000 17.3% $ — —
Texas 944,028 13.1% 72,811 18.8%
California 542,892 7.5% 49,724 12.8%
New Jersey 447,570 6.2% 28,398 7.3%
Arizona 329,602 4.6% 17,678 4.6%
25 Other States 1,892,229 26.2% 143,289 36.9%
Other assets (A) 251,587 3.5% — —
United States $ 5,657,908 78.4% $ 311,900 80.4%
Germany $ 1,376,626 19.1% $
72,718 18.8%
Italy(A) 94,569 1.3% — —
United Kingdom 36,646 0.5%
2,985 0.7%
Spain(A) 25,011 0.3% 251 0.1%
Other assets(A) 27,017 0.4% —
—
International $ 1,559,869 21.6% $ 75,954 19.6%
Total $ 7,217,777 (B)
100.0% $ 387,854 100.0%
(A) Includes our equity investments, of which related income is reflected in other income in our income statement.
(B) Represents investment concentration as a percentage of gross real estate assets, other loans, and equity investments assuming all real estate commitments, such as the Steward
acquisition, are fully funded.
Investments by Country
1.3% 0.5% 0.3% 0.4%
19.1% 78.4%
Investments by U.S. State
3.5%
17.3%
26.2%
13.1%
4.6% 6.2% 7.5%
United States
Germany
Italy(A)
United Kingdom
Spain(A)
Other assets(A)
Massachusetts
Texas
California
New Jersey
Arizona
25 Other States
Other assets(A)
Revenue by Country
0.7% 0.1%
18.8%
80.4%
Revenue by U.S. State
18.8%
36.9%
12.8%
4.6% 7.3%
Q3 2016 | SUPPLEMENTAL INFORMATION 12
MEDICALPROPERTIESTRUST.COM
PORTFOLIO
INFORMATION
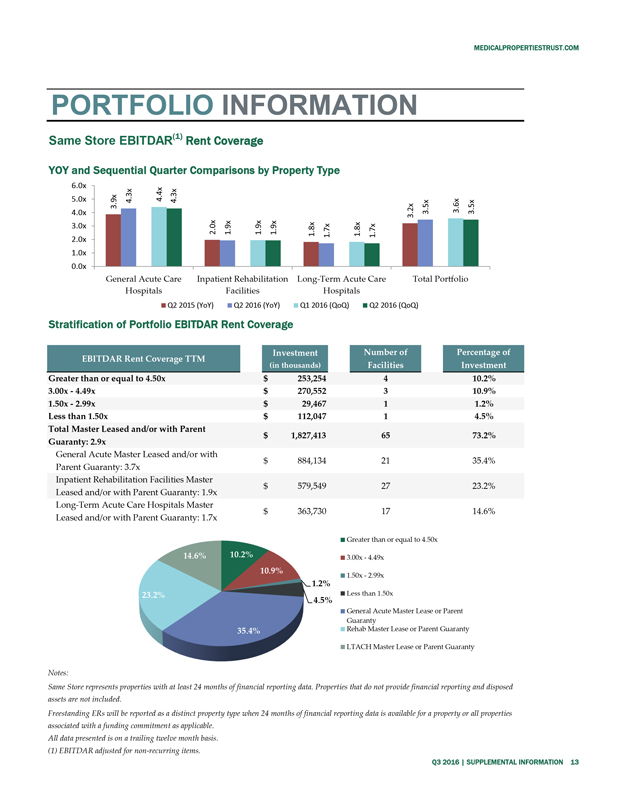
Same Store EBITDAR(1) Rent Coverage
YOY and Sequential Quarter
Comparisons by Property Type
| 6.0x 5.0x 4.0x 3.0x 2.0x 1.0x 0.0x | 3.9x 4.3x General Acute Care Hospitals | 4.4x 4.3x | 2.0x 1.9x Inpatient Rehabilitation Facilities | 1.9x 1.9x | 1.8x 1.7x Long-Term Acute Care Hospitals | 1.8x 1.7x | 3.2x 3.5x Total Portfolio | 3.6x 3.5x |
Q2 2015 (YoY) Q2 2016 (YoY) Q1 2016 (QoQ)Q2 2016 (QoQ)
Stratification of Portfolio EBITDAR Rent Coverage
| EBITDAR Rent Coverage TTM Greater than or equal to 4.50x 3.00x - 4.49x 1.50x - 2.99x Less than 1.50x Total Master Leased and/or with Parent Guaranty: 2.9x General Acute Master Leased and/or with Parent Guaranty: 3.7x Inpatient Rehabilitation Facilities Master Leased and/or with Parent Guaranty: 1.9x Long-Term Acute Care Hospitals Master Leased and/or with Parent Guaranty: 1.7x | Investment (in thousands) $253,254 $270,552 $29,467 $112,047 $1,827,413 $884,134 $579,549 $363,730 | Number of Facilities 4 3 1 1 65 21 27 17 | Percentage of Investment 10.2% 10.9% 1.2% 4.5% 73.2% 35.4% 23.2% 14.6% |
| 23.2% | 14.6% | 10.2% 10.9% 35.4% | 1.2% 4.5% | Greater than or equal to 4.50x 3.00x - 4.49x 1.50x - 2.99x Less than 1.50x General Acute Master Lease or Parent Guaranty Rehab Master Lease or Parent Guaranty LTACH Master Lease or Parent Guaranty |
Notes:
Same Store represents properties with at least
24 months of financial reporting data. Properties that do not provide financial reporting and disposed assets are not included.
Freestanding ERs will be reported
as a distinct property type when 24 months of financial reporting data is available for a property or all properties associated with a funding commitment as applicable.
All data presented is on a trailing twelve month basis.
(1) EBITDAR adjusted for non-recurring
items.
Q3 2016 SUPPLEMENTAL INFORMATION
13
MEDICALPROPERTIESTRUST.COM
PORTFOLIO
INFORMATION
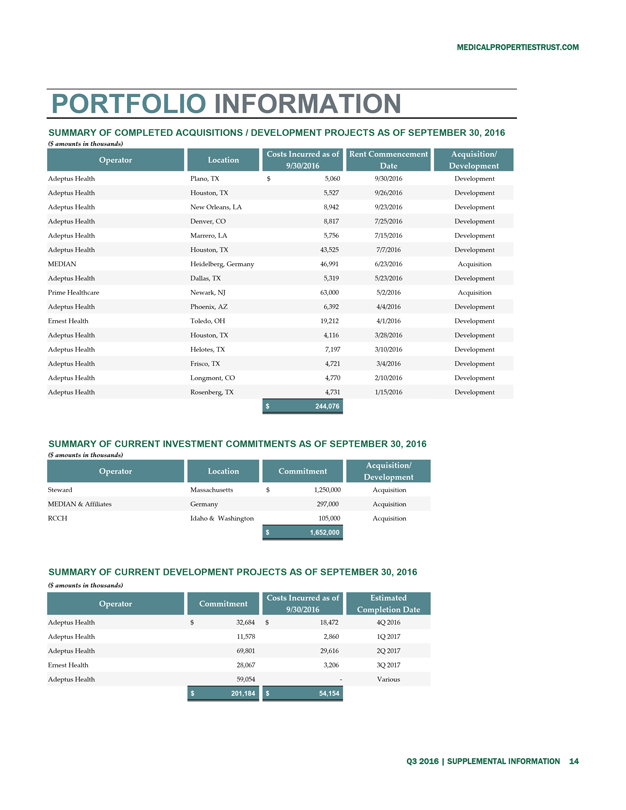
SUMMARY OF COMPLETED ACQUISITIONS / DEVELOPMENT PROJECTS AS OF SEPTEMBER 30, 2016
($ amounts in thousands)
| Operator Adeptus Health Adeptus Health Adeptus Health Adeptus Health Adeptus Health Adeptus Health MEDIAN Adeptus Health Prime Healthcare Adeptus Health Ernest Health Adeptus Health Adeptus Health Adeptus Health Adeptus Health Adeptus Health | Location Plano, TX Houston, TX New Orleans, LA Denver, CO Marrero, LA Houston, TX Heidelberg, Germany Dallas, TX Newark, NJ Phoenix, AZ Toledo, OH Houston, TX Helotes, TX Frisco, TX Longmont, CO Rosenberg, TX | Costs Incurred as of 9/30/2016 $5,060 5,527 8,942 8,817 5,756 43,525 46,991 5,319 63,000 6,392 19,212 4,116 7,197 4,721 4,770 4,731 $244,076 | Rent Commencement Date 9/30/2016 9/26/2016 9/23/2016 7/25/2016 7/15/2016 7/7/2016 6/23/2016 5/23/2016 5/2/2016 4/4/2016 4/1/2016 3/28/2016 3/10/2016 3/4/2016 2/10/2016 1/15/2016 | Acquisition/ Development Development Development Development Development Development Development Acquisition Development Acquisition Development Development Development Development Development Development Development |
SUMMARY OF CURRENT INVESTMENT COMMITMENTS AS OF SEPTEMBER 30, 2016
($ amounts in thousands)
| Operator Steward MEDIAN & Affiliates RCCH | Location Massachusetts Germany Idaho & Washington | Commitment $1,250,000 297,000 105,000 $1,652,000 | Acquisition/ Development Acquisition Acquisition Acquisition |
SUMMARY OF CURRENT DEVELOPMENT PROJECTS AS OF SEPTEMBER 30, 2016
($ amounts in thousands)
| Operator Adeptus Health Adeptus Health Adeptus Health Ernest Health Adeptus Health | Commitment $32,684 11,578 69,801 28,067 59,054 $201,184 | Costs Incurred as of 9/30/2016 $18,472 2,860 29,616 3,206 $54,154 | Estimated Completion Date 4Q 2016 1Q 2017 2Q 2017 3Q 2017 - Various |
Q3 2016 | SUPPLEMENTAL INFORMATION 14
MEDICALPROPERTIESTRUST.COM
FINANCIAL
STATEMENTS
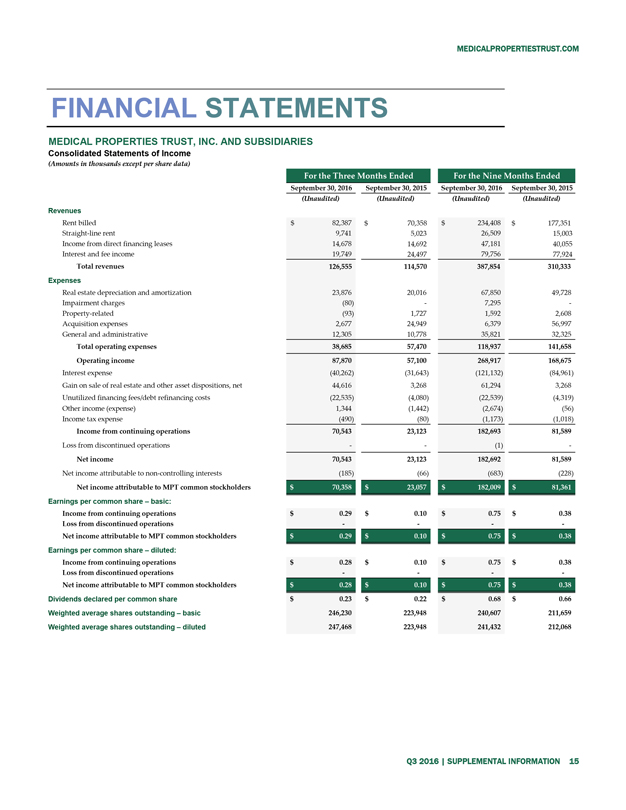
MEDICAL PROPERTIES TRUST, INC. AND SUBSIDIARIES
Consolidated
Statements of Income
(Amounts in thousands except per share data)
| Revenues Rent billed Straight-line rent Income from direct financing leases Interest and fee income Total revenues Expenses Real estate depreciation and amortization Impairment charges Property-related Acquisition expenses General and administrative Total operating expenses Operating income Interest expense Gain on sale of real estate and other asset dispositions, net Unutilized financing fees/debt refinancing costs Other income (expense) Income tax expense Income from continuing operations Loss from discontinued operations Net income Net income attributable to non-controlling interests Net income attributable to MPT common stockholders Earnings per common share – basic: Income from continuing operations Loss from discontinued operations Net income attributable to MPT common stockholders Earnings per common share – diluted: Income from continuing operations Loss from discontinued operations Net income attributable to MPT common stockholders Dividends declared per common share Weighted average shares outstanding – basic Weighted average shares outstanding – diluted | For the Three Months Ended September 30, 2016 September 30, 2015 (Unaudited) (Unaudited) $82,387 $70,358 9,741 5,023 14,678 14,692 19,749 24,497 126,555 114,570 23,876 20,016 (80) - (93) 1,727 2,677 24,949 12,305 10,778 38,685 57,470 87,870 57,100 (40,262) (31,643) 44,616 3,268 (22,535) (4,080) 1,344 (1,442) (490) (80) 70,543 23,123 - - 70,543 23,123 (185) (66) $70,358 $23,057 $0.29 $0.10 - - $0.29 $0.10 $0.28 $0.10 - - $0.28 $0.10 $0.23 $0.22 246,230 223,948 247,468 223,948 | For the Nine Months Ended September 30, 2016 September 30, 2015 (Unaudited) (Unaudited) $234,408 $177,351 26,509 15,003 47,181 40,055 79,756 77,924 387,854 310,333 67,850 49,728 7,295 - 1,592 2,608 6,379 56,997 35,821 32,325 118,937 141,658 268,917 168,675 (121,132) (84,961) 61,294 3,268 (22,539) (4,319) (2,674) (56) (1,173) (1,018) 182,693 81,589 (1) - 182,692 81,589 (683) (228) $182,009 $81,361 $0.75 $0.38 - - $0.75 $0.38 $0.75 $0.38 - - $0.75 $0.38 $0.68 $0.66 240,607 211,659 241,432 212,068 | ||||||
Q3 2016 | SUPPLEMENTAL INFORMATION 15
MEDICALPROPERTIESTRUST.COM
FINANCIAL
STATEMENTS
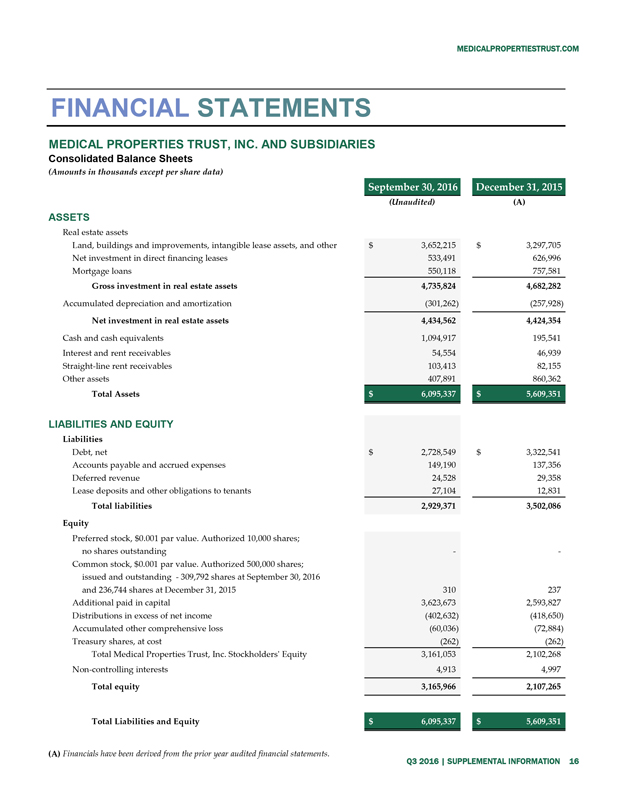
MEDICAL PROPERTIES TRUST, INC. AND SUBSIDIARIES
Consolidated
Balance Sheets
(Amounts in thousands except per share data)
| ASSETS Real estate assets Land, buildings and improvements, intangible lease assets, and other Net investment in direct financing leases Mortgage loans Gross investment in real estate assets Accumulated depreciation and amortization Net investment in real estate assets Cash and cash equivalents Interest and rent receivables Straight-line rent receivables Other assets Total Assets LIABILITIES AND EQUITY Liabilities Debt, net Accounts payable and accrued expenses Deferred revenue Lease deposits and other obligations to tenants Total liabilities Equity Preferred stock, $0.001 par value. Authorized 10,000 shares; no shares outstanding Common stock, $0.001 par value. Authorized 500,000 shares; issued and outstanding - 309,792 shares at September 30, 2016 and 236,744 shares at December 31, 2015 Additional paid in capital Distributions in excess of net income Accumulated other comprehensive loss Treasury shares, at cost Total Medical Properties Trust, Inc. Stockholders’ Equity Non-controlling interests Total equity Total Liabilities and Equity | September 30, 2016 (Unaudited) $3,652,215 533,491 550,118 4,735,824 (301,262) 4,434,562 1,094,917 54,554 103,413 407,891 $6,095,337 $2,728,549 149,190 24,528 27,104 2,929,371 - 310 3,623,673 (402,632) (60,036) (262) 3,161,053 4,913 3,165,966 $6,095,337 | December 31, 2015 (A) $3,297,705 626,996 757,581 4,682,282 (257,928) 4,424,354 195,541 46,939 82,155 860,362 $5,609,351 $3,322,541 137,356 29,358 12,831 3,502,086 - 237 2,593,827 (418,650) (72,884) (262) 2,102,268 4,997 2,107,265 $5,609,351 |
(A) Financials have been derived from the prior year audited financial statements.
Q3 2016 SUPPLEMENTAL INFORMATION 16
MEDICALPROPERTIESTRUST.COM
FINANCIAL
STATEMENTS
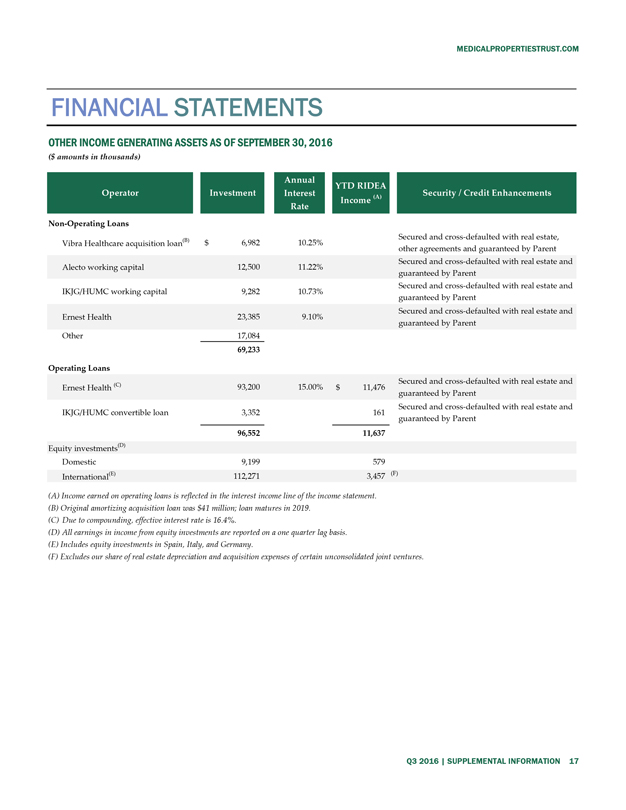
OTHER INCOME GENERATING ASSETS AS OF SEPTEMBER 30, 2016
($ amounts
in thousands)
Operator Investment Annual Interest Rate YTD RIDEA Income (A) Security / Credit Enhancements
Non-Operating Loans
Vibra Healthcare acquisition loan(B) $ 6,982 10.25%
Secured and cross-defaulted with real estate, other agreements and guaranteed by Parent
Alecto
working capital 12,500 11.22%
Secured and cross-defaulted with real estate and guaranteed by Parent
IKJG/HUMC working capital 9,282 10.73%
Secured and cross-defaulted with real estate and
guaranteed by Parent
Ernest Health 23,385 9.10%
Secured and cross-defaulted
with real estate and guaranteed by Parent
Other 17,084
69,233
Operating Loans
Ernest Health (C) 93,200 15.00% $ 11,476
Secured and cross-defaulted with real estate and guaranteed by Parent
IKJG/HUMC convertible
loan 3,352 161
Secured and cross-defaulted with real estate and guaranteed by Parent
96,552 11,637
Equity investments(D)
Domestic 9,199 579
International(E) 112,271 3,457 (F)
(A) Income earned on operating loans is reflected in the interest income line of the income statement.
(B) Original amortizing acquisition loan was $41 million; loan matures in 2019.
(C) Due to
compounding, effective interest rate is 16.4%.
(D) All earnings in income from equity investments are reported on a one quarter lag basis.
(E) Includes equity investments in Spain, Italy, and Germany.
(F) Excludes our share of real
estate depreciation and acquisition expenses of certain unconsolidated joint ventures.
Q3 2016 | SUPPLEMENTAL INFORMATION 17

MPT
Medical Properties Trust
1000 Urban Center Drive, Suite 501
Birmingham, AL 35242
(205) 969-3755 NYSE: MPW
www.medicalpropertiestrust.com
Contact:
Charles Lambert, Managing Director - Capital Markets
(205) 397-8897 or clambert@medicalpropertiestrust.com
or
Tim Berryman, Director - Investor Relations
(205) 397-8589 or
tberryman@medicalpropertiestrust.com
AT THE VERY HEART OF HEALTHCARE® .