Attached files
| file | filename |
|---|---|
| EX-99.1 - EX-99.1 - CAPITAL SENIOR LIVING CORP | d269182dex991.htm |
| 8-K - FORM 8-K - CAPITAL SENIOR LIVING CORP | d269182d8k.htm |
 Capital
Senior Living A Leading Pure-Play Senior Housing Owner-Operator
Exhibit 99.2 |
 2 Forward-Looking Statements • The forward-looking statements in this presentation are subject to certain risks and uncertainties that
could cause results to differ materially, including, but not without limitation to, the
Company’s ability to complete the refinancing of certain of our
wholly owned communities, realize the anticipated savings related to such
financing, find suitable acquisition properties at favorable terms, financing, licensing, business conditions, risks of downturns in economic conditions generally, satisfaction of closing
conditions such as those pertaining to licensures, availability of insurance at
commercially reasonable rates and changes in accounting principles and
interpretations among others, and other risks and factors identified from
time to time in our reports filed with the Securities and Exchange Commission • The Company assumes no obligation to update or supplement forward-looking statements in this
presentation that become untrue because of new information, subsequent events or
otherwise. |
 3 Non-GAAP Financial Measures • Adjusted EBITDAR, Adjusted EBITDAR Margin, Adjusted Net Income and Adjusted CFFO are financial
measures of operating performance that are not calculated in accordance with U.S.
generally accepted accounting principles (“GAAP”).
Non-GAAP financial measures may have material limitations in that they
do not reflect all of the amounts associated with our results of operations as
determined in accordance with GAAP. As a result, these non-GAAP
financial measures should not be considered a substitute for, nor superior
to, financial results and measures determined or calculated in accordance with GAAP. The Company believes that these non-GAAP measures are useful in identifying trends in day-to-day
performance because they exclude items that are of little or no significance to
operations and provide indicators to management of progress in achieving
optimal operating performance. In addition, these measures are used by
many research analysts and investors to evaluate the performance and the value of companies in the senior living industry. The Company strongly urges you to review the reconciliation of
net income from operations to Adjusted EBITDAR and Adjusted EBITDAR Margin and the
reconciliation of net loss to Adjusted Net Income and Adjusted CFFO, each
of which is included at the end of the Company’s earnings releases,
along with the Company’s consolidated balance sheets, statements of
operations, and statements of cash flows. |
 4 Capital Senior Living Investment Rationale Attractively Positioned in the Highly Fragmented Senior Housing Market Executing a Long-Term, Sustainable Growth Strategy with a Focus on Real Estate Ownership Capital Plan Supports Long-Term Growth Initiatives Track Record of Strong Growth and Uniquely Positioned for Continued Success CSU has a clear and differentiated real-estate strategy to drive industry-leading growth
and superior shareholder value
CSU has a clear and differentiated real-estate strategy to drive
industry-leading growth and superior shareholder value
1 1 4 4 2 2 3 3 |
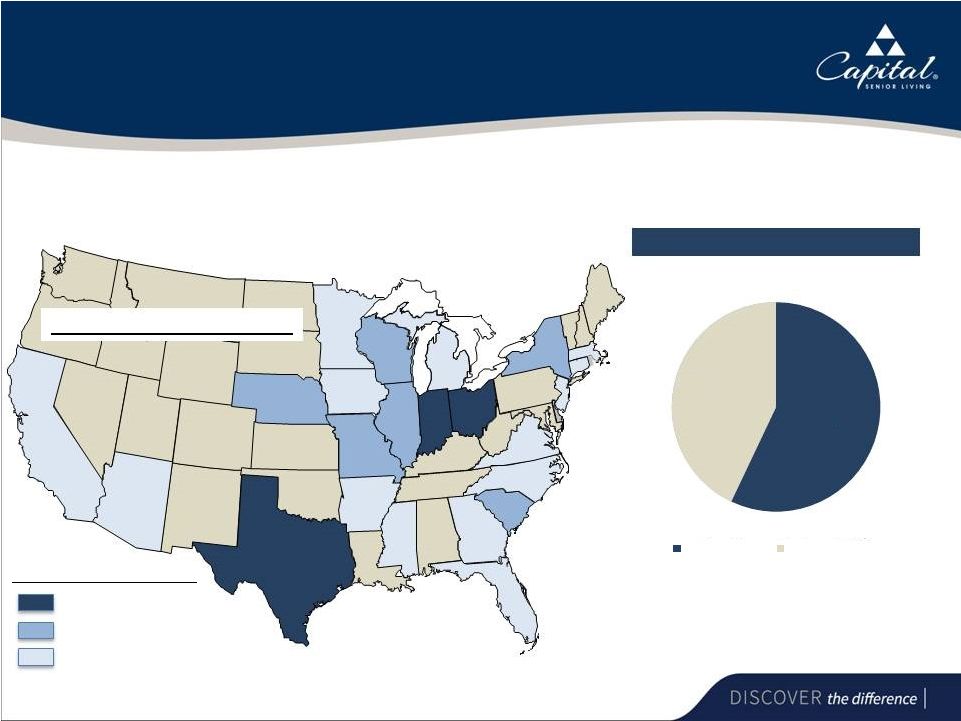
 5 • Attractively Positioned in the Highly Fragmented Senior Housing Market 1 1 |
 Assisting Living
Independent Living
Top-10 Operator and Pure-Play Senior Housing
Company Portfolio Mix (Average Units) As of November 3, 2016 (1) AR. 173 AZ. 18 9 CT. 178 FL. 429 IA. 122 IL. 770 IN. 2,381 MI. 244 MN. 173 MO. 662 MS. 143 NC. 432 SC. 669 NE. 668 NJ. 98 NY. 537 OH. 2,372 TX. 3,990 VA. 455 CA. 408 AZ. 189 Resident Capacity By State Capital Senior Living operates 129 communities in geographically concentrated regions with the capacity to serve 16,300 residents WI. 741 GA. 168 MA. 302 Number of residents by State Greater than 2,000 500 - 2,000 Less than 500 (1) 1 acquired community to close on November 3, 2016. 57.1% 42.9% 6 |
 7 One of the Largest Senior Housing Owners by Percentage of Ownership Ownership Evolution Advantages to Real Estate Ownership Ownership of 10 Largest US Senior Housing Operators Maximizes cash flow and real estate value by providing valuation support Stronger margin profile Eliminates lease escalators, driving sustainable cash flows Optimizes asset management and financial flexibility Ability to reposition communities Ability to increase loans based on the appreciated value to re-deploy the capital into growth initiatives 25 79 83 45 50 46 7 2010 Current Pro Forma Owned Leased Joint Venture Owned % 129 Total Properties 77 Total Properties 32.5% 32.5% 61.2% 61.2% 2016 Properties Owned 179 161 83 79 9 407 86 37 26 0 0 2016 Properties Operated 179 213 129 129 18 1,114 308 140 276 252 156 100.0% 75.6% 64.3% 61.2% 50.0% 36.5% 27.9% 26.4% 9.4% NM NM Enlivant Senior Lifestyle Capital Senior Living (PF) Capital Senior Living Erickson Living Brookdale Senior Living Holiday Retirement LCS Five Star Senior Living Sunrise Senior Living Atria Senior Living Source: ASHA 2016 Top 50, company filings and investor presentations. Note: Five Star Senior Living pro forma for property acquisitions and divestitures.
(1) As of November 3, 2016. (2) Primarily minority interest in joint ventures. (3) Pro forma for acquisitions of four communities which are expected to close in January 2017.
(2) 64.3% 64.3% 129 Total Properties (3) (1) (3) |
 8 Multi-Family Lodging Senior Housing Economy Population Growth / Demographic Mix Location Specific Demand/Supply Government Reimbursement × × × 12.0% 10.9% 11.9% 7.3% 13.2% 10.6% 10.4% 6.5% 16.1% 17.0% 15.2% 11.9% 0.0% 5.0% 10.0% 15.0% 20.0% 1-Year 3-Years 5-Years 10-Years Multi-Family Lodging Senior Housing CSU’s Pure-Play Private-Pay Senior Housing Model has Many Similarities to the Multi-Family and Lodging Sectors, While Historically Providing Investors with Higher Returns Key Housing Sector Drivers Benchmarking the Housing Sector Senior Housing Yields Consistent High Investment Returns NCREIF Annualized Total Investment Returns (1,3,5, 10-Year Periods, as of 12/31/15)
’16/’17 Average
M-RevPAF (1) Expected Actual & Momentum Source: Green Street Advisors and NIC MAP Data Service. (1) M-RevPAF is Market Revenue per Available Foot and represents the combined changes in occupancy (demand)
and rents (pricing). Strongest Weakest Lodging Senior Housing Multi-Family 2 4 6 |
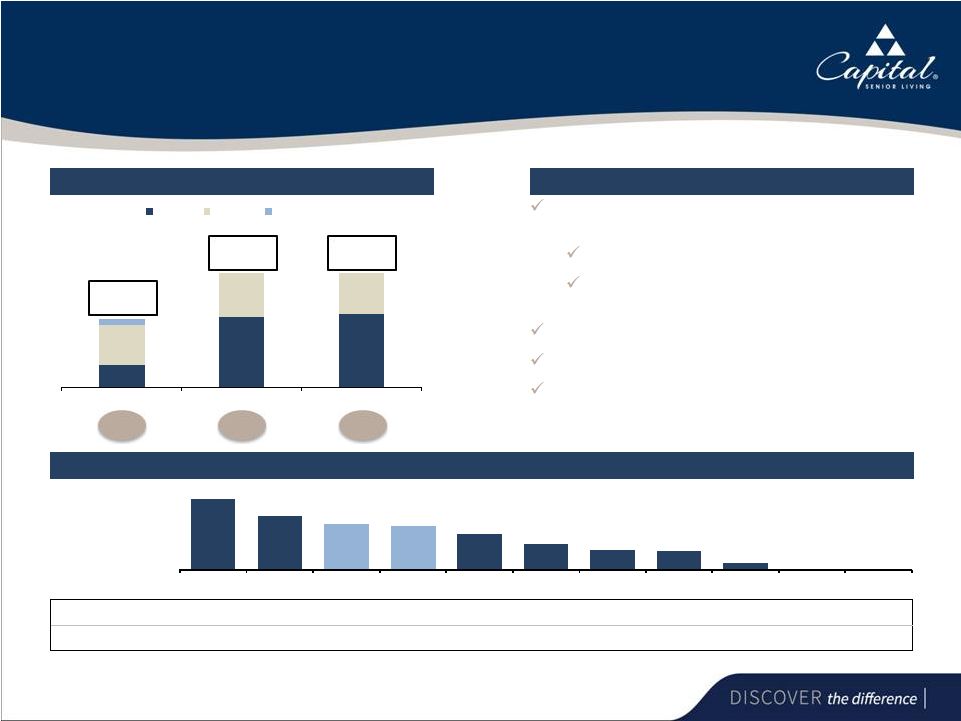
 The Senior
Living Market Offers Attractive Long Term Fundamentals...
• U.S. population 75+ years old is expected to increase from ~6% of total current population to 12% by 2030 • Current penetration rate implies demand growth of ~40K units per annum • 75% of the Independent Living market and 63% of the Assisted Living market is comprised of small players operating at a cost structure disadvantage 15,000 20,000 25,000 30,000 35,000 2010 2015 2020 2025 2030 Top 10 Remaining Market Top 25 Clear opportunity for scale players to capture a disproportionate share of growth through organic initiatives
and accretive acquisitions
Source: 2010 Consensus Summary File 1, U.S. Census Bureau, Population Division,
IBISWorld and Wall Street Research. U.S. Seniors Population Trends (75+
years old) Independent Living Companies
Assisted Living Companies
Top 10 20% Top 25 25% 75% Top 10 29% Top 25 37% 63% 9 |
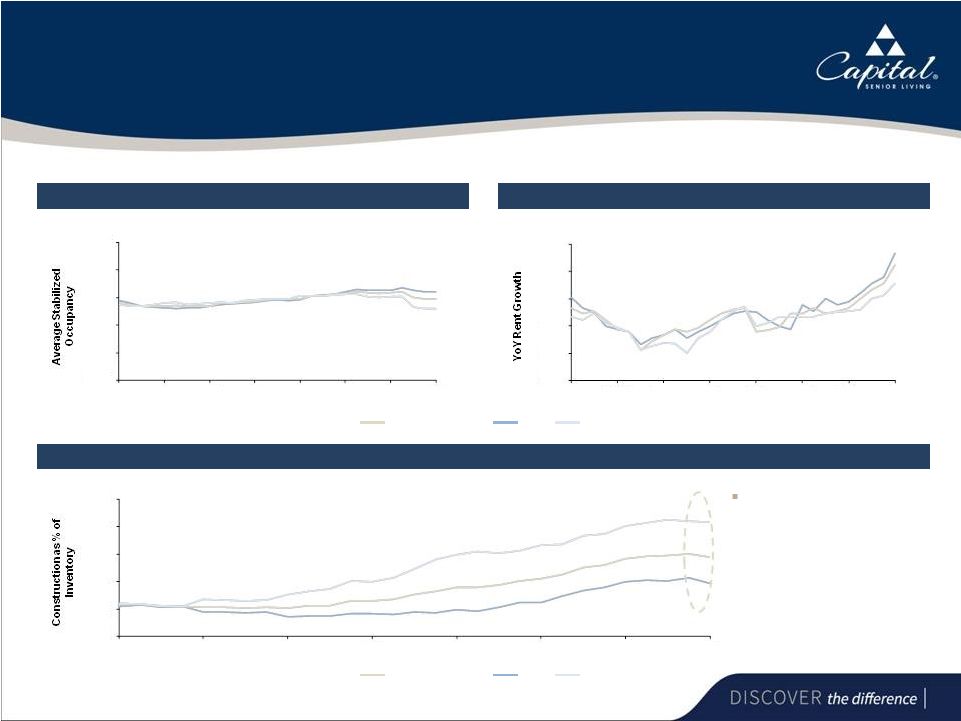 10 ...and a Highly Constructive Current Operating Environment Source: Wall Street research and NIC MAP data. Occupancy Stabilizing Across the Country Senior Housing Rent Growth at Seven Year Highs Senior Housing IL AL Industry Supply is Starting to Decline Across Both IL and AL Year-to-date, overall industry supply has tapered across Senior Housing as a whole Senior Housing IL AL 75.0% 80.0% 85.0% 90.0% 95.0% 100.0% 3Q09 3Q10 3Q11 3Q12 3Q13 3Q14 3Q15 3Q16 0.0% 0.9% 1.8% 2.7% 3.6% 4.5% 3Q09 3Q10 3Q11 3Q12 3Q13 3Q14 3Q15 3Q16 0.0% 2.0% 4.0% 6.0% 8.0% 10.0% 3Q09 3Q10 3Q11 3Q12 3Q13 3Q14 3Q15 3Q16 10 |
 CSU Has
Limited Exposure to the Top 10 MSAs with the Highest Levels of
Construction Source: NIC MAP® Data Service data as of
9/30/2016. Senior Housing Construction vs. Inventory Across the
U.S. Capital Senior Living Facility
Top 10 Highest Construction in MSAs
0 – 2% Construction vs. Inventory > 24% Total CSU units in top 10 highest construction MSAs (3% of total CSU units) Over 96% of CSU units are located outside of the top 10 highest construction MSAs
11 Metro Construction vs. Inventory CSU Units CSU Occupancy Baton Rouge, LA 28.4 % -- -- Charleston, SC 26.1 % -- -- Austin, TX 21.1 % -- -- New Orleans, LA 19.6 % -- -- Fort Myers, FL 18.9 % -- -- Columbus, OH 18.5 % 111 99% Salt Lake City, UT 18.2 % -- -- San Antonio, TX 15.0 % 238 96% Portland, ME 14.7 % -- -- Charlotte, NC 14.2 % 73 86% 422 |
 12 • Executing a Long-Term, Sustainable Growth Strategy with a Focus on Real Estate Ownership 2 2 |
 13 Executing a Long-Term, Sustainable Growth Strategy with a Focus on Real Estate Ownership Core Organic Growth Increasing Real Estate Ownership Accretive Acquisitions Conversions |
 14 Core Organic Growth Driven by Occupancy, Pricing Improvements and Cost Containment Occupancy improvement where opportunity exists Increasing average rents through increasing market and in-house rents and level of care charges
Proactive expense management
Cash flow enhancing renovations and refurbishments
Core Organic Growth Increasing Occupancy and Average Monthly Rent Trends 84% 86% 88% 90% $2,800 $3,000 $3,200 $3,400 $3,600 Average Rent Occupancy % |
 15 Strategic Accretive Acquisitions have Achieved 16% Average Cash-On-Cash Returns Year 1 Cash-On-Cash Returns With a strong reputation among sellers, CSU sources the majority of acquisitions off market and at attractive terms, and maintains
a robust pipeline of near-to medium-term targets
Pipeline allows for ~$150mm of highly accretive acquisitions annually over the
near-to medium term Acquisitions financed with attractive fixed rate
non-recourse mortgage loans Weighted average interest rate has
decreased 142bps since 2010 Total Purchase
Price ($mm)
$83.4
$181.3
$150.4
$160.2
$162.5
$138.4
Communities
7 17 11 8 9 8 Units 551 1,367 881 819 791 723 14.1% 17.6% 15.2% 16.5% 15.1% 15.8% 2011 2012 2013 2014 2015 2016 YTD |
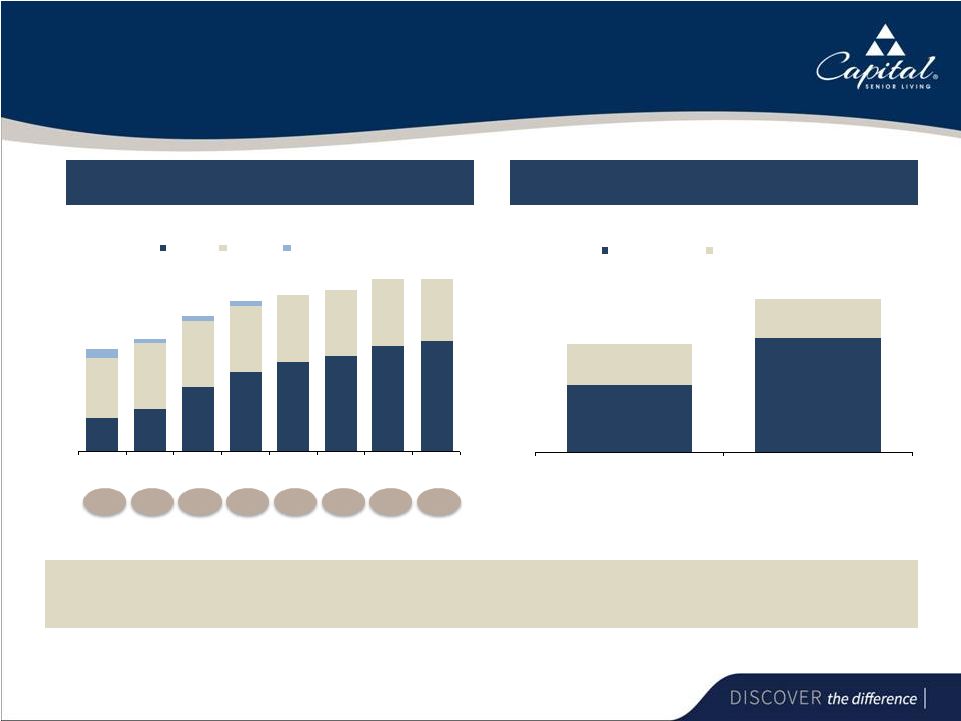 16 Increasing Owned Portfolio Provides Increased Financial Flexibility 25 32 48 59 67 71 79 83 45 49 50 50 50 50 50 46 7 3 3 3 77 84 101 112 117 121 129 129 2010 2011 2012 2013 2014 2015 Current Pro Forma Owned Leased Joint Venture Note: Ownership statistics as of 12/31 for 2010 – 2015. (1) As of November 3, 2016. (2) Pro forma for acquisitions of four communities which are expected to close in January 2017.
Owned % (2) (1) CSU has achieved on average a 43.9% increase in property value over a 3 year period at communities on which
it has executed supplemental loans in 2015 and 2016YTD, which has provided financial
flexibility through $50.7mm of proceeds for re-deployment to growth
initiatives Appreciated Value of Supplemental Loan Properties
Appreciated Value of Supplemental Loan Properties
$87.5 $148.6 $53.4 $50.3 $140.9 $198.9 2015 Supplemental Loan Properties 2016 YTD Supplemental Loan Properties Original Value Incremental Value Added Capital Senior Living’s Ownership History Capital Senior Living’s Ownership History 32.5% 38.1% 47.5% 57.3% 52.7% 52.7% 61.2% 64.3% |
 17 Conversions Drive Significant Improvements in Key Financial Metrics Revenue and NOI Growth – 3Q16 vs. 2Q14 (Period prior to Conversions) (1) Expected Completion of Units Currently Out of Service (2) 186 10 66 249 202 273 249 0 50 100 150 200 250 300 Completed Completed Q3 16 Completed October 2016 Q2 17 Q3 17 76 units were placed in service in September/October 2016 and ~708 total units remain out of service; when stabilized, the total 784 units are expected to contribute
approximately $31.0mm of Revenue, $11.0mm of EBITDAR and $7.5mm of CFFO on
an annual basis
Currently 9 Occupied 30 occupied and 10 additional scheduled move ins for 11/16 Three communities being repositioned or under significant renovation; all units are out of CSU non-GAAP statistical and financial measures and will be added back when the communities reach stabilization (1) Represents the 400 communities with conversions completed as of 2Q15. (2) Represents when the units are completed. Actual contributions of Revenue, EBITDAR and CFFO will depend on timing
of lease-up. 21.8% 19.3% 0.0% 5.0% 10.0% 15.0% 20.0% 25.0% 30.0% Revenue Growth NOI Growth |
 18 • Capital Plan Supports Long-Term Growth Initiatives 3 |
 19 Transaction Overview Overview of the Transaction 1. CSU will buy back four currently leased properties • Purchase Price: $85mm • CFFO accretion of $1.9mm in Year 1 Existing % of Owned Real Estate to PF % of Owned Real Estate 79 83 50 46 Current Pro Forma Owned Leased Owned % 129 Total Properties 129 Total Properties 61.2% 61.2% 64.3% 64.3% Benefits of the Transaction Maximizes cash flow and real estate value by providing valuation support Stronger margin profile Eliminates lease escalators, driving sustainable cash flows Optimizes asset management and financial flexibility Ability to reposition communities Ability to increase loans based on the appreciated value to re-deploy the capital into growth initiatives Increases owned portfolio from 61.2% to 64.3%, representing a 340bps increase (1) (1) As of November 3, 2016. (2) Pro forma for acquisitions of four communities which are expected to close in January 2017.
(2) |
 20 • Track Record of Strong Growth and Uniquely Positioned for Continued Success 4 |
 21 $197 $257 $305 $343 $384 $412 $305 $332 2010A 2011A 2012A 2013A 2014A 2015A 2015 Q3 YTD 2016 Q3 YTD $69 $92 $110 $120 $133 $144 $106 $114 2010A 2011A 2012A 2013A 2014A 2015A 2015 Q3 YTD 2016 Q3 YTD 32.4% 35.0% 35.4% 34.9% 35.9% 36.6% 36.5% 35.9% 2010A 2011A 2012A 2013A 2014A 2015A 2015 Q3 YTD 2016 Q3 YTD $17 $25 $30 $37 $41 $47 $34 $36 2010A 2011A 2012A 2013A 2014A 2015A 2015 Q3 YTD 2016 Q3 YTD Strategy and Execution Have Delivered Strong Growth Revenue (1) Adjusted EBITDAR Adjusted EBITDAR Margin Adjusted CFFO (2) Note: $ in millions. (1) Excludes community reimbursement revenue and management services revenue. (2) Excludes prepaid resident rent and tax savings related to cost segregation studies in 2012 and 2013.
($ In Millions) ($ In Millions) ($ In Millions) |
 22 Healthy Balance Sheet to Support Future Initiatives Assets Cash and Securities $ 43.1 Other Current Assets 30.8 Total Current Assets 73.9 Fixed Assets 1,005.0 Other Assets 29.6 Total Assets $ 1,108.5 Liabilities & Equity Current Liabilities $ 71.8 Long-Term Debt 849.8 Other Liabilities 63.6 Total Liabilities 985.2 Stockholders’ Equity 123.3 Total Liabilities & Equity $ 1,108.5 As of September 30, 2016 (in millions) |
 23 Debt Maturities • CSU has ample financial capacity to pursue all initiatives contemplated under its growth strategy • No near term debt maturities • Acquisitions financed with attractive fixed rate non-recourse mortgage loans $357,840 $262,652 $80,482 $100,829 $59,853 $11,800 $0 $50,000 $100,000 $150,000 $200,000 $250,000 $300,000 $350,000 $400,000 2025 & After 2024 2023 2022 2021 2020 2019 2018 2017 2016 Average duration of debt is 7.8 years, with approximately 99% of all debt maturing in 2021 and after (In thousands) Ample Financial Capacity to Pursue Growth Initiatives |
 24 Capital Senior Living Investment Rationale Attractively Positioned in the Highly Fragmented Senior Housing Market Executing a Long-Term, Sustainable Growth Strategy with a Focus on Real Estate Ownership Capital Plan Supports Long-Term Growth Initiatives Track Record of Strong Growth and Uniquely Positioned for Continued Success CSU has a clear and differentiated real-estate strategy to drive industry-leading growth
and superior shareholder value
CSU has a clear and differentiated real-estate strategy to drive
industry-leading growth and superior shareholder value
1 1 4 4 2 2 3 3 Conversions Accretive Acquisitions Core Organic Growth Increasing Real Estate Ownership |