Attached files
| file | filename |
|---|---|
| 8-K - 8-K - JANUS CAPITAL GROUP INC | a16-19360_38k.htm |
| EX-99.2 - EX-99.2 - JANUS CAPITAL GROUP INC | a16-19360_3ex99d2.htm |
| EX-10.2 - EX-10.2 - JANUS CAPITAL GROUP INC | a16-19360_3ex10d2.htm |
| EX-10.1 - EX-10.1 - JANUS CAPITAL GROUP INC | a16-19360_3ex10d1.htm |
| EX-2.1 - EX-2.1 - JANUS CAPITAL GROUP INC | a16-19360_3ex2d1.htm |
Exhibit 99.1
Janus Henderson Global Investors Janus Capital Group Inc. and Henderson Group plc Recommended Merger of Equals Monday 3 October 2016 Dick Weil Chief Executive Officer, Janus Capital Group Inc. Andrew Formica Chief Executive, Henderson Group plc Jennifer McPeek Chief Financial Officer, Janus Capital Group Inc.
Forward-looking statements – Janus Capital Group Inc. This communication contains “forward-looking statements” within the meaning of the federal securities laws, including Section 27A of the Securities Act of 1933, as amended, and Section 21E of the Securities Exchange Act of 1934, as amended. These forward-looking statements may include: management plans relating to the Transaction; the expected timing of the completion of the Transaction; the ability to complete the Transaction; the ability to obtain any required regulatory, shareholder or other approvals; any statements of the plans and objectives of management for future operations, products or services, including the execution of integration plans relating to the Transaction; any statements of expectation or belief; projections related to certain financial metrics; and any statements of assumptions underlying any of the foregoing. Forward-looking statements are typically identified by words such as “believe,” “expect,” “anticipate,” “intend,” “plan,” “seek,” “target,” “outlook,” “estimate,” “forecast,” “project” and other similar words and expressions, and variations or negatives of these words. Forward-looking statements by their nature address matters that are, to different degrees, subject to numerous assumptions, known and unknown risks and uncertainties, which change over time and are beyond our control. Forward-looking statements speak only as of the date they are made and investors and security holders are cautioned not to place undue reliance on any such forward-looking statements. Janus Capital Group Inc. (“Janus Capital Group”) does not assume any duty and does not undertake to update forward-looking statements, whether as a result of new information, future developments or otherwise, should circumstances change, nor does Janus Capital Group intend to do so, except as otherwise required by securities and other applicable laws. Because forward-looking statements are subject to assumptions and uncertainties, actual results or future events could differ, possibly materially, from those that Janus Capital Group anticipated in its forward-looking statements and future results could differ materially from historical performance. Factors that could cause or contribute to such differences include, but are not limited to, those included under Item 1A “Risk Factors” in Janus Capital Group’s Annual Report on Form 10-K and those disclosed in Janus Capital Group’s other periodic reports filed with the Securities and Exchange Commission (“SEC”), as well as the possibility: that expected benefits of the Transaction may not materialize in the timeframe expected or at all, or may be more costly to achieve; that the Transaction may not be timely completed, if at all; that prior to the completion of the Transaction or thereafter, Janus Capital Group’s businesses may not perform as expected due to transaction-related uncertainty or other factors; that the parties are unable to successfully implement integration strategies related to the Transaction; that required regulatory, shareholder or other approvals are not obtained or other customary closing conditions are not satisfied in a timely manner or at all; reputational risks and the reaction of the companies’ shareholders, customers, employees and other constituents to the Transaction; and diversion of management time on merger-related matters. All subsequent written and oral forward-looking statements concerning the proposed transaction or other matters attributable to Janus Capital Group or any other person acting on their behalf are expressly qualified in their entirety by the cautionary statements referenced above. For any forward-looking statements made in this communication or in any documents, Janus Capital Group claims the protection of the safe harbor for forward-looking statements contained in the Private Securities Litigation Reform Act of 1995. Annualized, pro forma, projected and estimated numbers are used for illustrative purposes only, are not forecasts and may not reflect actual results.
Additional information about this transaction This communication is being made in respect of the proposed Transaction involving Janus Capital Group and Henderson Group, plc (“Henderson Group”). This material is not a solicitation of any vote or approval of Janus Capital Group’s or Henderson Group’s shareholders and is not a substitute for the proxy statement or any other documents which Janus Capital Group and Henderson Group may send to their respective shareholders in connection with the proposed Transaction. This communication shall not constitute an offer to sell or the solicitation of an offer to buy any securities. In connection with the proposed Transaction, Henderson Group intends to file a registration statement containing a proxy statement of Janus Capital Group and other documents regarding the proposed Transaction with the SEC. Before making any voting or investment decision, the respective investors and shareholders of Janus Capital Group and Henderson Group are urged to carefully read the entire registration statement of Henderson Group, including the proxy statement of Janus Capital Group, when it becomes available and any other relevant documents filed by either company with the SEC, as well as any amendments or supplements to those documents, because they will contain important information about Janus Capital Group, Henderson Group and the proposed Transaction. Investors and security holders are also urged to carefully review and consider each of Janus Capital Group’s public filings with the SEC, including but not limited to its Annual Reports on Form 10-K, its proxy statements, its Current Reports on Form 8-K and its Quarterly Reports on Form 10-Q. When available, copies of the proxy statement will be mailed to the shareholders of Janus Capital Group. When available, copies of the proxy statement also may be obtained free of charge at the SEC’s web site at http://www.sec.gov, or by directing a request to Janus Capital Group, Inc. at 151 Detroit Street, Denver, Colorado 80206, c/o General Counsel and Secretary. Participants in the Solicitation Janus Capital Group, Henderson Group and certain of their respective directors and executive officers, under the SEC’s rules, may be deemed to be participants in the solicitation of proxies of Janus Capital Group’s shareholders in connection with the proposed Transaction. Information about the directors and executive officers of Janus Capital Group and their ownership of Janus Capital Group common stock is set forth in Janus Capital Group’s Annual Report on Form 10-K for the year ended December 31, 2015, which was filed with the SEC on February 24, 2016. Additional information regarding the interests of those participants and other persons who may be deemed participants in the solicitation of proxies of Janus Capital Group’s shareholders in connection with the proposed Transaction may be obtained by reading the proxy statement regarding the proposed Transaction when it becomes available. Once available, free copies of the proxy statement may be obtained as described in the preceding paragraph. No Offer or Solicitation This communication shall not constitute an offer to sell or the solicitation of an offer to sell or the solicitation of an offer to buy any securities, nor shall there be any sale of securities in any jurisdiction in which such offer, solicitation or sale would be unlawful prior to registration or qualification under the securities laws of any such jurisdiction. No offer of securities shall be made except by means of a prospectus meeting the requirements of Section 10 of the Securities Act of 1933, as amended, and otherwise in accordance with applicable law.
Today, Janus Capital Group and Henderson Group are announcing the recommended merger of equals with two highly complementary businesses that have similar cultures and a shared focus on delivering excellent investment performance and service to clients The transaction accelerates both businesses’ ambitions for growth, diversification, and globalization, creating a truly global active investment manager The resulting company, Janus Henderson Global Investors, will have a strong balance sheet, and is expected to deliver meaningful operational synergies, demonstrable cash flow generation and material value for shareholders Executive summary
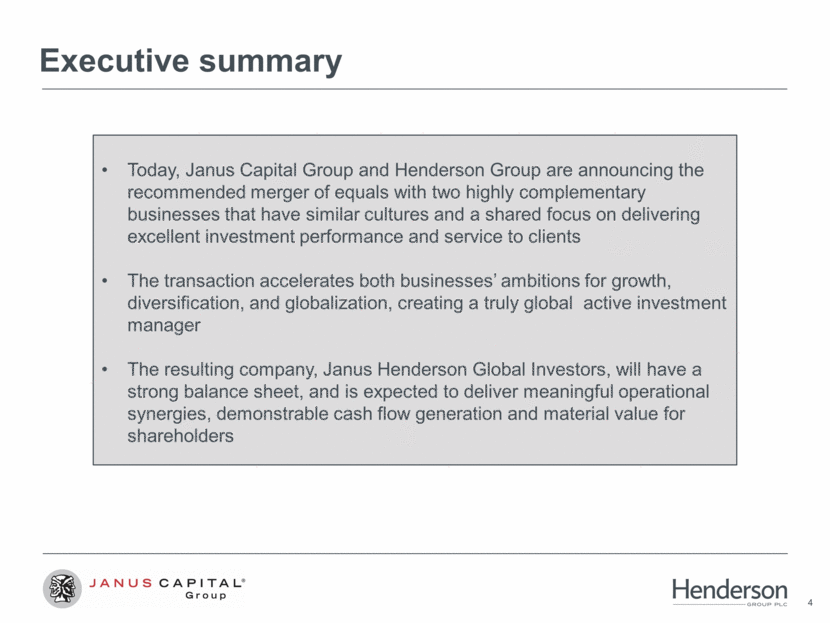
Enhanced talent Combining best talent creates a stronger organization Complementary nature of the businesses and expanded global footprint creates broader platform for professional development Shared client-centric values and minimal overlap of investment strategies and clients Expanded client facing team Deepen client relationships and increase growth opportunities across a wider range of investment products and geographies Client-centric, collaborative cultures Complementary brand and strengthened market position Diversified product and investment strategies Increased depth, breadth and connectivity of investment teams should support more consistent outcomes for clients Better able to address a broader range of contemporary client needs A comprehensive array of outperforming products Financial strength More diversified revenue mix across products, geographies and clients Improved economies of scale support financial flexibility and improved profitability Strong balance sheet creates greater financial stability through market cycles and allows for continued growth and investment in the business Compelling merger of equals
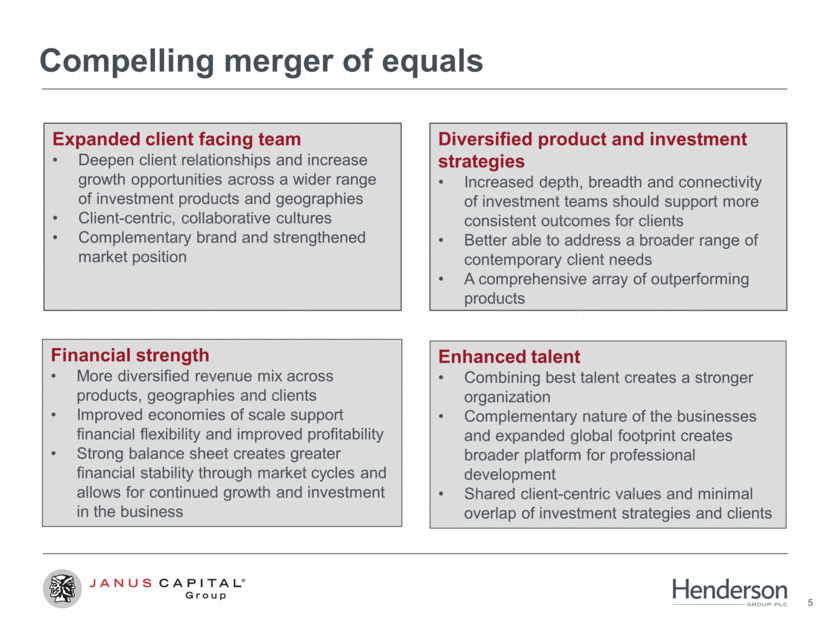
Recommended 100% stock merger Exchange of 4.7190 shares of Henderson for every Janus share Combined market capitalization of ~US$6bn Transaction overview Merger of equals Location and domicile Significant employee presence and executive roles in London and Denver, with Co-CEOs located in London Tax resident in the U.K.; registered in Jersey Company structure and management Combined entity to be known as Janus Henderson Global Investors, listed on NYSE and ASX Dick Weil and Andrew Formica to lead the company as Co-CEOs Board of Directors will be comprised of equal members of Janus and Henderson directors Pro-forma ownership ~57% Henderson and ~43% Janus The Dai-ichi Life Insurance Company, Janus’ largest shareholder, intends to further invest in the combined company to increase its ownership interest to at least 15% Value creation At least US$110m annual run rate net cost synergies, weighted towards the first 12 months and expected to be fully phased in 3 years post completion Ambition to deliver 2-3 percentage points of additional net new money following integration Key dates Closing expected in 2Q 2017, subject to shareholder and regulatory approvals
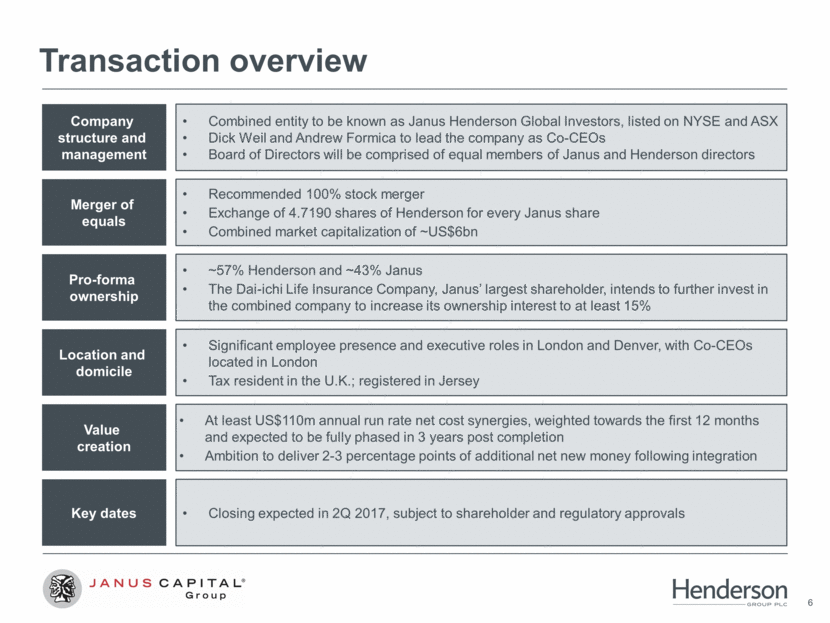
2013 – 2016: Growth and Globalization 32 mths to Aug 16: 3% pa Henderson’s story to date 1 Excludes AUM subject to Property transactions with TIAA-CREF and resultant TH Real Estate JV AUM but includes Henderson UK Property OEIC. 2 Source: Henderson Group plc company data. Percentage of funds, asset-weighted, that are outperforming based on the relevant metric: peer percentile ranking for Retail, positive for absolute return, positive versus benchmark for Institutional. Performance data quoted represents past performance and is no guarantee of future results. Current performance may be lower or higher than the performance data quoted. Investment return and principal value will fluctuate so that an investor’s shares, when redeemed, may be worth more or less than original cost. Retail and hedge fund performance is reported net of fees and Institutional performance is reported gross of fees. £63.7bn 32 mths to Aug 16: 6% pa £100.0bn 32 mths to Aug 16: 9% pa Consistently strong investment performance² 3 yr investment performance FY10 – 1H16 (%) Our vision A trusted global asset manager focused on delivering excellent performance and service to our clients Our philosophy Active fund management with our clients’ needs at the heart of everything we do Our guiding principles Collaboration Conviction Responsibility Our strategy of Growth and Globalization Above industry net new money growth Strong investment performance Carefully targeted investment Investment management capabilities Client relationships Global platforms Operational leverage Disciplined use of capital AUM FY13¹ Net new money Market/ FX Acquisitions AUM 31 Aug-16 50 60 70 80 90 100 FY10 FY11 FY12 FY13 FY14 FY15 1H16
Enhanced scale and market position Henderson US$127bn Janus Henderson¹ US$322bn Janus¹ US$195bn Retail² Institutional Combined firm will have significant presence in the largest global markets Top 50 Global Asset Manager Top 20 U.S. Mutual Fund company Top 10 U.K. Retail company US$16bn of AUM in Japan US$24bn of AUM in Australia Source: Global rankings are per 2016 I&PE Global AUM Survey. U.S. Mutual Fund ranking per Strategic Insight (“SimFund”). U.K. Retail ranking per The Investment Association. Note: Exchange rates used for translation from GBP to USD as at 30 Jun 2016: 1.34. 1 Includes $4 billion of Exchange-traded Product (“ETP”) assets, which Janus is not the named advisor or subadvisor and therefore does not earn a management fee on those assets. 2 Retail AUM includes both self-directed and intermediary channels. AUM by distribution channel As at 30 June 2016 (US$bn) 127 322 195 127 77 204 68 50 118
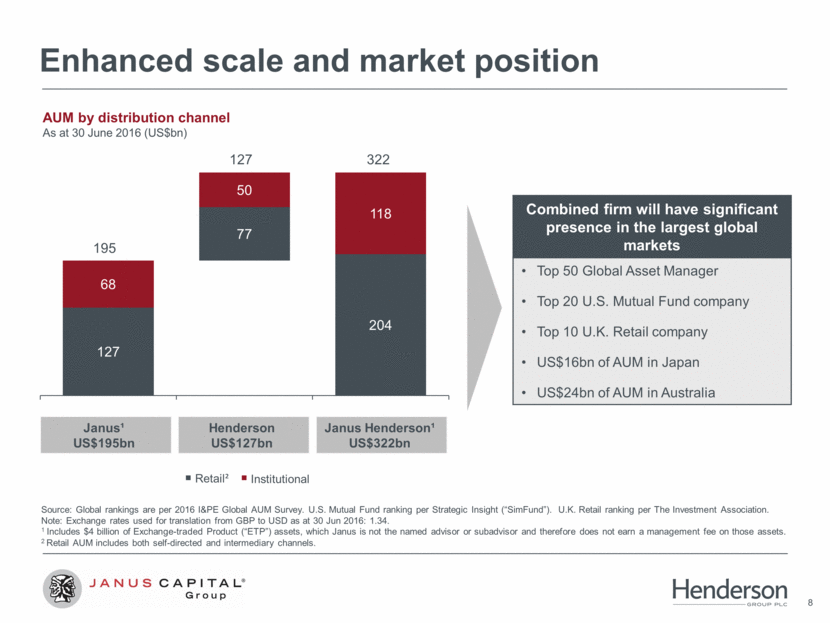
Complementary investment capabilities 2 54 49 70 10 26 24 20 Henderson US$127bn Janus Henderson¹ US$322bn Janus¹ US$195bn AUM by investment discipline As at 30 June 2016 (US$bn) 39 4 Henderson Janus 26 Note: Exchange rate used for translation from GBP to USD as at 30 Jun 2016: 1.34. 1 Includes $4 billion of ETP assets, which Janus is not the named advisor or subadvisor and therefore does not earn a management fee on those assets. 2 U.S. Equity includes Mathematical Equities. European Equities Global Equities U.S. Equity² Multi-Asset Alternatives Exchange-traded products Fixed Income 4% 27% 20% 29% 15% 5% 37% 17% 8% 23% 6% 8% 1% 58% 10% 20% 10% 2%
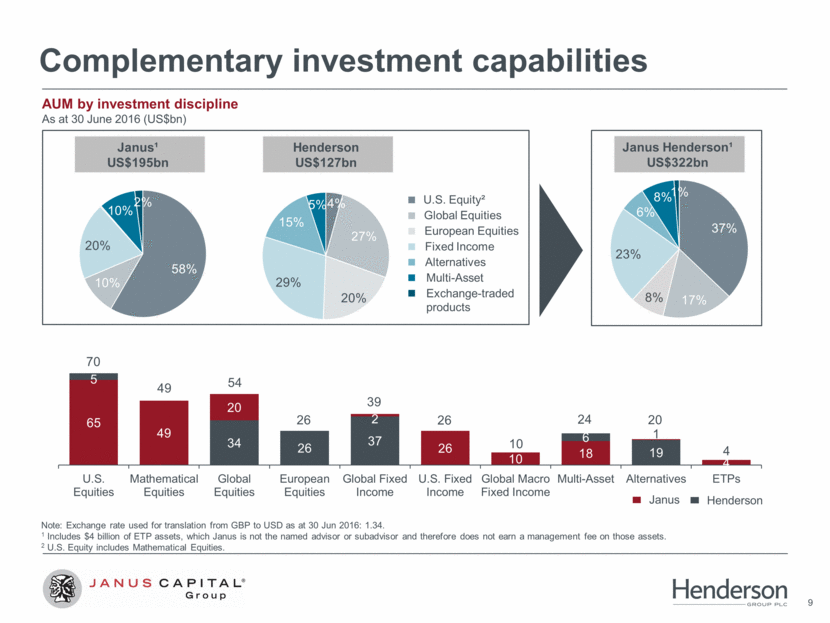
Combined global distribution strength North America Latin America Australia Asia UK and Continental Europe 128 Henderson Janus² Note: Exchange rate used for translation from GBP to USD as at 30 Jun 2016: 1.34. Numbers may not cast due to rounding. 1 Source: McKinsey Global Survey 2014. 2 Includes $4 billion of ETP assets, which Janus is not the named advisor or subadvisor and therefore does not earn a management fee on those assets. AUM by geography As at 30 June 2016 (US$bn) 116 12 33 7 40 3 3 Improved geographic diversification 69 3 66 32 7 25 9 16 24 12 12 7 16 2 Asia ex. Japan Japan 3 LatAm Australia U.K. Continental Europe U.S. Retail U.S. Institutional 18% 77% 54% 53% 71% 5% 31% 33% 11% 18% 15% 14% Henderson Janus² Janus Henderson² Industry¹ Americas EMEA Pan Asia
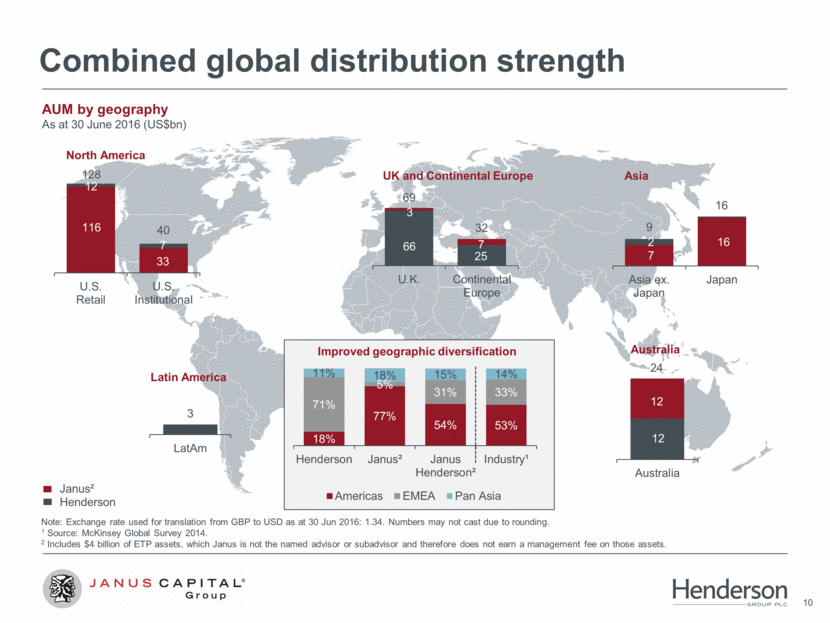
Strong, experienced executive team J H Henderson Janus Richard Weil Co-CEO Andrew Formica Co-CEO David Kowalski Chief Risk Officer Jennifer McPeek Chief Operating and Strategy Officer Enrique Chang Global Chief Investment Officer Rob Adams Head of Asia Pacific Roger Thompson Chief Financial Officer Jacqui Irvine Group General Counsel and Company Secretary Bruce Koepfgen Head of North America Phil Wagstaff Global Head of Distribution H J H H H J J J J H
Value creation At least US$110m annual run rate net cost synergies, weighted to 12 months following completion and expected to be fully realized 3 years post completion¹ Cost synergies largely expected from increased economies of scale, consolidation of overlapping functions and non-compensation expenses Implementation costs associated with delivering cost synergies are expected to be US$165m to US$185m, mostly expected to be incurred in the 12 month period following completion Double digit accretion to both companies’ EPS (excluding one-off costs) in the first 12 months following completion Ambition to deliver 2 to 3 percentage points of additional net new money from the combined business following completion of integration 1 The cost synergies have been reviewed independently by external accountants.
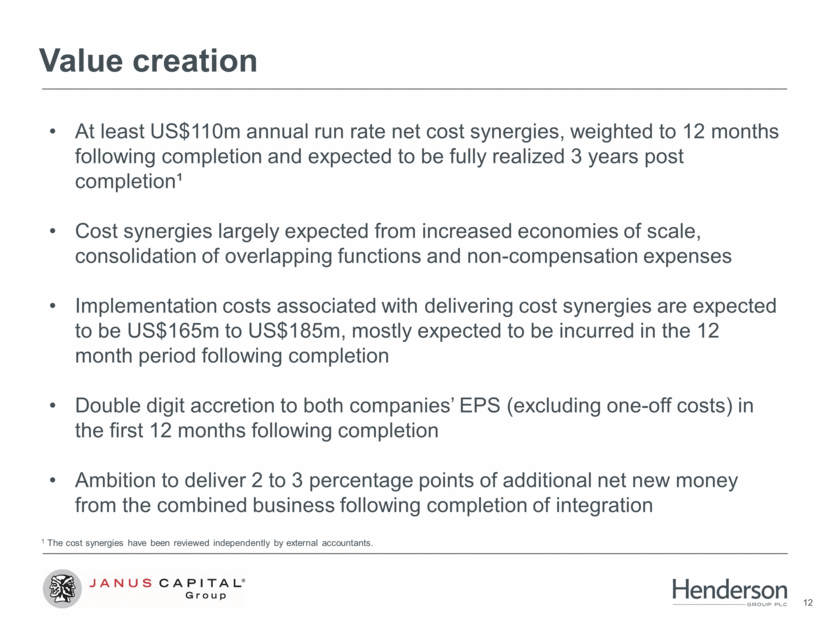
Improved financial strength and flexibility Janus Henderson³ Revenue US$1,076m US$1,155m US$2,231m Underlying EBITDA US$361m US$337m US$698m Dividend Payout Ratio4 43% 59% Intention for a progressive dividend policy and payout ratio in line with Henderson Credit Rating5 BBB / Baa3 / BBB n/a Committed to an Investment Grade Credit Rating Leverage Ratio6 1.2x n/a 0.6x Note: Exchange rate used for translation from GBP to USD for FY 2015: 1.53. 1 Based on FY 2015 results filed on form 10-K. See reconciliation to U.S. GAAP on slide 17. 2 Based on FY 2015 adjusted IFRS financial statements including presentational changes for ease of comparison with Janus U.S. GAAP financial statements. Historical activity reported using IFRS may change significantly upon conversion to U.S. GAAP. 3 Numbers reflect summation of standalone companies and do not represent forecasts or include synergies from the transaction. 4 Janus: Annual dividends per share divided by annual EPS. Henderson: FY 2015 Interim and Final dividend divided by underlying profit after tax. 5 S&P / Moody’s / Fitch. 6 Represents total principal amount of debt divided by underlying EBITDA for FY 2015. 1 2 Annual run rate net cost synergies of $110m represents 16% of combined underlying EBITDA
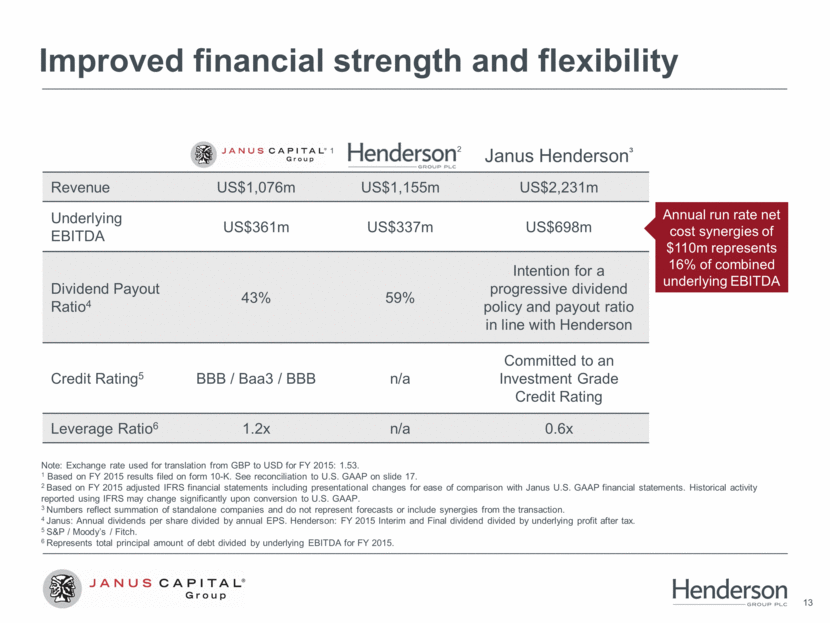
Aligned vision of success Become the leading, trusted global active investment manager A clear focus on our clients Commitment to delivering superior risk adjusted returns Passionate about best in class service to our clients Fostering the best employee talent in the industry A deeply collaborative culture
Q&A

Appendix
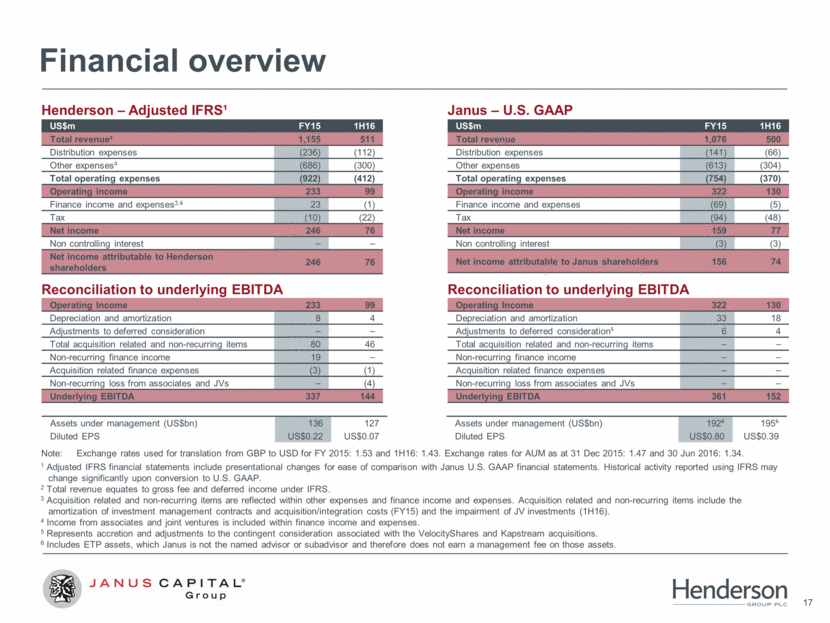
Financial overview US$m FY15 1H16 Total revenue² 1,155 511 Distribution expenses (236) (112) Other expenses³ (686) (300) Total operating expenses (922) (412) Operating income 233 99 Finance income and expenses3,4 23 (1) Tax (10) (22) Net income 246 76 Non controlling interest – – Net income attributable to Henderson shareholders 246 76 Henderson – Adjusted IFRS¹ Janus – U.S. GAAP Assets under management (US$bn) 136 127 Diluted EPS US$0.22 US$0.07 1 Adjusted IFRS financial statements include presentational changes for ease of comparison with Janus U.S. GAAP financial statements. Historical activity reported using IFRS may change significantly upon conversion to U.S. GAAP. 2 Total revenue equates to gross fee and deferred income under IFRS. 3 Acquisition related and non-recurring items are reflected within other expenses and finance income and expenses. Acquisition related and non-recurring items include the amortization of investment management contracts and acquisition/integration costs (FY15) and the impairment of JV investments (1H16). 4 Income from associates and joint ventures is included within finance income and expenses. 5 Represents accretion and adjustments to the contingent consideration associated with the VelocityShares and Kapstream acquisitions. 6 Includes ETP assets, which Janus is not the named advisor or subadvisor and therefore does not earn a management fee on those assets. Note: Exchange rates used for translation from GBP to USD for FY 2015: 1.53 and 1H16: 1.43. Exchange rates for AUM as at 31 Dec 2015: 1.47 and 30 Jun 2016: 1.34. Assets under management (US$bn) 192 195 Diluted EPS US$0.80 US$0.39 Reconciliation to underlying EBITDA Operating Income 233 99 Depreciation and amortization 8 4 Adjustments to deferred consideration – – Total acquisition related and non-recurring items 80 46 Non-recurring finance income 19 – Acquisition related finance expenses (3) (1) Non-recurring loss from associates and JVs – (4) Underlying EBITDA 337 144 Reconciliation to underlying EBITDA Operating Income 322 130 Depreciation and amortization 33 18 Adjustments to deferred consideration 6 4 Total acquisition related and non-recurring items – – Non-recurring finance income – – Acquisition related finance expenses – – Non-recurring loss from associates and JVs – – Underlying EBITDA 361 152 US$m FY15 1H16 Total revenue 1,076 500 Distribution expenses (141) (66) Other expenses (613) (304) Total operating expenses (754) (370) Operating income 322 130 Finance income and expenses (69) (5) Tax (94) (48) Net income 159 77 Non controlling interest (3) (3) Net income attributable to Janus shareholders 156 74
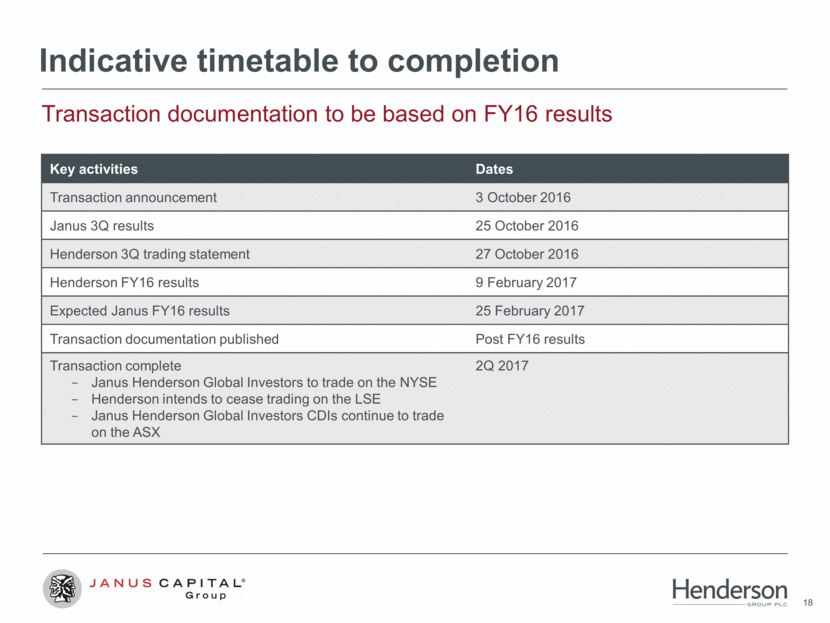
Indicative timetable to completion Key activities Dates Transaction announcement 3 October 2016 Janus 3Q results 25 October 2016 Henderson 3Q trading statement 27 October 2016 Henderson FY16 results 9 February 2017 Expected Janus FY16 results 25 February 2017 Transaction documentation published Post FY16 results Transaction complete Janus Henderson Global Investors to trade on the NYSE Henderson intends to cease trading on the LSE Janus Henderson Global Investors CDIs continue to trade on the ASX 2Q 2017 Transaction documentation to be based on FY16 results
Investor enquiries: Henderson Group plc Miriam McKay Head of Investor Relations +44 (0) 20 7818 2106 miriam.mckay@henderson.com investor.relations@henderson.com Media enquiries Angela Warburton Global Head of Communications +44 (0) 20 7818 3010 angela.warburton@henderson.com United Kingdom: FTI Consulting Andrew Walton +44 (0) 20 3727 1514 Australia: Honner Rebecca Piercy +61 2 8248 3740 Contacts Investor enquiries: Janus Capital Group Inc. John Groneman Head of Investor Relations +1 303-336-7466 john.groneman@janus.com or InvestorRelations@janus.com Media enquiries Erin Passan Head of Corporate Communications +1 303-394-7681 erin.passan@janus.com C-1016-4855 1-30-2017
