Attached files
| file | filename |
|---|---|
| EX-32 - EX-32 - CANTEL MEDICAL LLC | cmn-20160731xex32.htm |
| EX-31.2 - EX-31.2 - CANTEL MEDICAL LLC | cmn-20160731ex312483932.htm |
| EX-31.1 - EX-31.1 - CANTEL MEDICAL LLC | cmn-20160731ex311caa0ed.htm |
| EX-23 - EX-23 - CANTEL MEDICAL LLC | cmn-20160731xex23.htm |
| EX-21 - EX-21 - CANTEL MEDICAL LLC | cmn-20160731ex21306b402.htm |
| EX-10.(V) - EX-10.(V) - CANTEL MEDICAL LLC | cmn-20160731ex10v92b6d2.htm |
| EX-10.(U) - EX-10.(U) - CANTEL MEDICAL LLC | cmn-20160731ex10u077ff9.htm |
| EX-10.(T) - EX-10.(T) - CANTEL MEDICAL LLC | cmn-20160731ex10t56fe2b.htm |
| EX-10.(S) - EX-10.(S) - CANTEL MEDICAL LLC | cmn-20160731ex10sd94af0.htm |
| EX-10.(R) - EX-10.(R) - CANTEL MEDICAL LLC | cmn-20160731ex10r5df0ba.htm |
UNITED STATES
SECURITIES AND EXCHANGE COMMISSION
Washington, D.C. 20549
Form 10-K
|
☒ |
ANNUAL REPORT PURSUANT TO SECTION 13 OR 15(d) OF THE SECURITIES EXCHANGE ACT OF 1934 |
For the fiscal year ended July 31, 2016
Or
|
☐ |
TRANSITION REPORT PURSUANT TO SECTION 13 OR 15(d) OF THE SECURITIES EXCHANGE ACT OF 1934 |
For the transition period from to
Commission File No. 001-31337
CANTEL MEDICAL CORP.
(Exact name of registrant as specified in its charter)
|
Delaware |
|
22-1760285 |
|
(State or other jurisdiction of |
|
(I.R.S. employer |
|
incorporation or organization) |
|
identification no.) |
|
|
|
|
|
150 Clove Road, Little Falls, New Jersey |
|
07424 |
|
(Address of principal executive offices) |
|
(Zip code) |
Registrant’s telephone number, including area code: (973) 890-7220
Securities registered pursuant to Section 12(b) of the Act:
|
Name of each exchange |
||
|
Title of each class |
|
on which registered |
|
Common Stock, $0.10 par value |
|
New York Stock Exchange |
Securities registered pursuant to Section 12(g) of the Act: None
Indicate by check mark if the registrant is a well-known seasoned issuer, as defined in Rule 405 of the Securities Act. Yes ☐ No ☒
Indicate by check mark if the registrant is not required to file reports pursuant to Section 13 or Section 15(d) of the Act. Yes ☐ No ☒
Indicate by check mark whether the registrant (1) has filed all reports required to be filed by Section 13 or 15(d) of the Securities Exchange Act of 1934 during the preceding 12 months (or for such shorter period that the registrant was required to file such reports), and (2) has been subject to such filing requirements for the past 90 days. Yes ☒ No ☐
Indicate by check mark whether the registrant has submitted electronically and posted on its corporate Web site, if any, every Interactive Data File required to be submitted and posted pursuant to Rule 405 of Regulation S-T (§232.405 of this chapter) during the preceding 12 months (or for such shorter period that the registrant was required to submit and post such files). Yes ☒ No ☐
Indicate by check mark if disclosure of delinquent filers pursuant to Item 405 of Regulation S-K (§229.405 of this chapter) is not contained herein, and will not be contained, to the best of registrant’s knowledge, in definitive proxy or information statements incorporated by reference in Part III of this Form 10-K or any amendment to this Form 10-K. Yes ☐ No ☒
Indicate by check mark whether the registrant is a large accelerated filer, an accelerated filer, a non-accelerated filer, or a smaller reporting company. See the definitions of “large accelerated filer”, “accelerated filer” and “small reporting company” in Rule 12b-2 of the Exchange Act.
|
Large accelerated filer ☒ |
|
Accelerated filer ☐ |
|
Non-accelerated filer ☐ |
|
Smaller reporting company ☐ |
Indicate by check mark whether the registrant is a shell company (as defined in Rule 12b-2 of the Exchange Act). Yes ☐ No ☒
State the aggregate market value of the voting and non-voting common equity held by non-affiliates computed by reference to the price at which the common equity was last sold, or the average bid and asked price of such common equity, as of the last business day of the registrant’s most recently completed second fiscal quarter, as quoted by the New York Stock Exchange on that date: $2,103,808,663.
Indicate the number of shares outstanding of each of the registrant’s classes of common stock as of the close of business on August 31, 2016: 41,713,575.
Documents incorporated by reference: Portions of the definitive proxy statement to be filed pursuant to Regulation 14A promulgated under the Securities Exchange Act of 1934 in connection with the 2016 Annual Meeting of Stockholders of Registrant are hereby incorporated by reference into Part III of this Form 10-K and certain documents are incorporated by reference into Part IV.
PART I
Throughout this document, references to “Cantel,” “us,” “we,” “our,” and the “Company” are references to Cantel Medical Corp. and its subsidiaries, except where the context makes it clear the reference is to Cantel Medical Corp. itself and not its subsidiaries.
Forward Looking Statements
This Annual Report on Form 10-K contains “forward-looking statements” as that term is defined under the Private Securities Litigation Reform Act of 1995. These statements are based on current expectations, estimates, or forecasts about our businesses, the industries in which we operate, and the current beliefs and assumptions of management; they do not relate strictly to historical or current facts. Without limiting the foregoing, words or phrases such as “expect,” “anticipate,” “goal,” “will continue,” “project,” “intend,” “plan,” “believe,” “seek,” “may,” “could,” and variations of such words and similar expressions generally identify forward-looking statements. In addition, any statements that refer to predictions or projections of our future financial performance, anticipated growth and trends in our businesses, and other characterizations of future events or circumstances are forward-looking statements. Readers are cautioned that these forward-looking statements are only predictions about future events, activities or developments and are subject to numerous risks, uncertainties, and assumptions that are difficult to predict. We caution that undue reliance should not be placed on such forward-looking statements, which speak only as of the date made. Some of the factors which could cause results to differ from those expressed in any forward-looking statement are set forth under Item 1A of this Form 10-K, entitled Risk Factors. We expressly disclaim any obligation or undertaking to release publicly any updates or revisions to any forward-looking statements contained herein to reflect any change in our expectations with regard thereto or any change in events, conditions or circumstances on which any such statement is based.
Item 1.BUSINESS.
General
We are a leading provider of infection prevention products and services in the healthcare market, specializing in the following operating segments:
|
· |
Endoscopy: Medical device reprocessing systems, disinfectants, detergents and other supplies used to high-level disinfect rigid endoscopes, flexible endoscopes and other instrumentation and disposable infection control products intended to reduce the challenges associated with proper cleaning and high-level disinfection of numerous reusable components used in gastrointestinal (GI) endoscopy procedures. In September 2015, this segment commenced the sale of endoscope transport and storage systems, and a number of endoscopy consumable accessories. Additionally, this segment performs technical maintenance service on its products. |
|
· |
Water Purification and Filtration: Water purification equipment and services, filtration and separation products, and disinfectants, sterilization and decontamination products and services for the medical, pharmaceutical, biotech, beverage and commercial industrial markets. |
|
· |
Healthcare Disposables: Single-use, infection prevention healthcare products including face masks, sterilization pouches, towels and bibs, tray covers, saliva ejectors, plastic cups, germicidal wipes, and disinfectants, as well as products for maintaining safe dental unit waterlines. This segment also manufactures and sells biological and chemical indicators for sterility assurance monitoring services in the acute-care, alternate-care, dental and industrial (medical device, life science and other manufacturers) markets. In August 2016, this segment commenced the manufacture and sale of nitrous oxide conscious sedation equipment and related single-use disposable nasal masks. |
|
· |
Dialysis: Medical device reprocessing systems, sterilants/disinfectants, dialysate concentrates and other supplies for renal dialysis. |
2
Recent Acquisitions — Subsequent to July 31, 2016
Acquisition of Vantage Endoscopy Inc. (“Vantage”) Medivators® Endoscopy Business
On September 26, 2016, we acquired certain net assets of Vantage related to its distribution and sale of our Medivators endoscopy products in Canada (the “Vantage Business” or the “Vantage Acquisition”). Vantage was our exclusive distributor of Medivators capital equipment (e.g., automated endoscope reprocessors) and related consumables and accessories and had pre-acquisition adjusted annual revenues (unaudited) of approximately $11,000,000. The total consideration for the transaction, excluding acquisition-related costs, was $4,072,000, subject to net asset value adjustments. The Vantage Acquisition is included in our Endoscopy segment.
The principal reasons for the Vantage Acquisition were (i) to sell our Endoscopy products on a direct basis in Canada, one of our largest markets outside of the United States, (ii) the establishment of a platform in Canada where we can sell additional products on a direct basis such as our endoscopy procedure products and transport and storage systems and (iii) the expectation that the acquisition will be accretive to our earnings per share (“EPS”) in fiscal 2017 and beyond.
Acquisition of Accutron, Inc. (“Accutron”)
On August 1, 2016, we acquired all of the issued and outstanding stock of Accutron, a private company with pre-acquisition annual revenues (unaudited) of approximately $21,500,000 (the “Accutron Business” or the “Accutron Acquisition”). The Accutron Business designs, manufactures and sells nitrous oxide conscious sedation equipment and single use nasal masks for use in dental procedures. The total consideration for the transaction, excluding acquisition-related costs, was $52,500,000, subject to net asset value adjustments. The Accutron Acquisition is included in our Healthcare Disposables segment.
The principal reasons for the Accutron Acquisition were (i) to broaden our Healthcare Disposable segment’s product portfolio by adding conscious sedation equipment and single-use nasal masks, (ii) the opportunity to cross-sell our existing Healthcare Disposable products, (iii) the addition of a high margin, branded product portfolio with compelling infection prevention benefits and (iv) the expectation that the acquisition will be accretive to our EPS in fiscal 2017 and beyond.
Fiscal 2016 Acquisitions
Acquisition of North American Science Associates, Inc. (“NAMSA”) Sterility Assurance Monitoring Products
On March 1, 2016, we acquired certain net assets of NAMSA’s Sterility Assurance Monitoring Products division, a business with pre-acquisition adjusted annual revenues (unaudited) of approximately $5,700,000 (the “NAMSA Business” or the “NAMSA Acquisition”). The business manufactures a broad suite of high-quality biological and chemical indicators that are used to accurately monitor the effectiveness of sterilization processes primarily for manufacturers of medical device, life science and other products. The total consideration for the transaction, excluding acquisition-related costs, was $13,424,000, net of net asset value adjustments. The NAMSA Acquisition is included in our Healthcare Disposables segment.
The principal reasons for the NAMSA Acquisition were (i) to broaden our Healthcare Disposable segment’s presence into the industrial market, (ii) the opportunity to cross-sell our existing Healthcare Disposable products, (iii) the strategic benefit and cost savings to our overall sterility assurance monitoring business, (iv) to enhance our new product development and overall research and development capabilities and (v) the expectation that the acquisition will be accretive to our EPS in fiscal 2017 and beyond.
Acquisition of Medical Innovations Group Holdings Limited (“Medical Innovations”)
On September 14, 2015, we acquired all of the issued and outstanding stock of Medical Innovations, a private company with pre-acquisition annual revenues (unaudited) of approximately $28,500,000 providing specialized
3
endoscopy medical devices and products primarily in the United Kingdom (the “Medical Innovations Business” or the “Medical Innovations Acquisition”). Principal products of Medical Innovations include proprietary short-term and long-term endoscope transport and storage systems, a comprehensive range of endoscopic consumable accessories, OEM mobile medical carts, as well as specialized products for patient warming and patient transfer. With an employee base of approximately 100 individuals, including a complete sales organization and a manufacturing facility in Southend-on-Sea, England, the addition of the Medical Innovations product line complements our existing endoscopy business in the United States, the United Kingdom and other global markets. The Medical Innovations Business is included in our Endoscopy segment. Subsequent to its acquisition, we changed the name of Medical Innovations Group Holdings Limited to Cantel (UK) Limited. The total consideration for the transaction, excluding acquisition-related costs, was $79,597,000, net of net asset value adjustments.
The principal reasons for the Medical Innovations Acquisition were (i) to globally expand our infection prevention product offerings in Endoscopy, (ii) the opportunity to sell our existing endoscopy products to Medical Innovations’ installed base, (iii) the ability to combine the Medical Innovations sales force with our existing United Kingdom organization to create a synergistic UK sales force in endoscopy product sales and service, (iv) to achieve cost savings through various operating synergies, (v) the ability to leverage our direct sales force to accelerate the growth of Medical Innovations products in the U.S. and various international markets, and (vi) the expectation that the acquisition will be accretive to our EPS in fiscal 2017 and beyond.
Reporting Segments
The following table gives information as to the percentage of consolidated net sales accounted for by each of our reporting segments:
|
|
|
Year Ended July 31, |
|
||||
|
|
|
2016 |
|
2015 |
|
2014 |
|
|
|
|
% |
|
% |
|
% |
|
|
|
|
|
|
|
|
|
|
|
Endoscopy |
|
51.4 |
|
44.0 |
|
39.0 |
|
|
Water Purification and Filtration |
|
26.7 |
|
30.8 |
|
32.7 |
|
|
Healthcare Disposables |
|
17.0 |
|
18.9 |
|
20.8 |
|
|
Dialysis |
|
4.9 |
|
5.5 |
|
6.3 |
|
|
Other |
|
— |
|
0.8 |
|
1.2 |
|
|
|
|
100.0 |
|
100.0 |
|
100.0 |
|
For a presentation of net sales, operating income and total assets by reporting segment, see Note 18 to the Consolidated Financial Statements.
Endoscopy
General
Endoscopes are highly sophisticated and fragile medical instruments used for visual examination within a body cavity for diagnostic and therapeutic purposes, and typically contain one or more channels for the passage of smaller instruments such as forceps, snares, clips and retrieval devices. Endoscopes are reused from procedure to procedure and patient to patient, but only after undergoing a very arduous and controlled cleaning and disinfection process. A critical part of our endoscopy business is tied to such process. Our endoscopy products, most of which are proprietary medical devices subject to rigorous standards and regulations, contribute to the safe and effective use of endoscopes in healthcare facilities throughout the world and improve the quality of healthcare delivery by reducing the threat of nosocomial (hospital/healthcare facility acquired) infections. In addition, our disposable procedure products provide greater patient safety and infection prevention, through the replacement of reusable devices requiring disinfection with our single-use sterile products.
4
Our Endoscopy segment provides a full circle of infection prevention solutions through a comprehensive offering of MEDIVATORS® branded products and services in two critical areas — endoscope reprocessing and endoscopy procedure products. Our endoscope reprocessing products include a full range of endoscope reprocessing systems, high-level disinfectants and sterilants, detergents, leak testing and manual cleaning products, storage cabinets, endoscope reprocessing electronic tracking as well as related consumables, accessories and supplies. Our endoscopy procedure products include CO2 and water irrigation pumps and disposable procedure kits, sterile irrigation tubing and single-use valves designed to eliminate the challenges associated with proper cleaning and high-level disinfection of numerous reusable components used in GI endoscopy procedures. In addition, as a result of the Medical Innovations Acquisition, our product portfolio now includes short-term and long-term endoscope transport and storage systems, a comprehensive range of endoscopy consumable accessories, mobile medical carts, as well as other specialized medical and hospital products. In July 2016, we introduced the AmplifEYE™ endoscopic device, a disposable product designed to improve adenoma detection rates. We design, develop and manufacture most of our endoscopy products.
Endoscope Reprocessing Products and Services
General. Our Medivators endoscope reprocessing product portfolio represents a comprehensive global offering of capital equipment, chemistries, consumables and services that are used to pre-clean, leak test, clean, disinfect, store and electronically track flexible endoscopes from the point of removal from a patient through utilization in the next patient procedure. Our flagship products are proprietary automated endoscope reprocessors (AERs) and high-level disinfectant chemistries, which together disinfect endoscopes. The AER’s cycle continuously pumps disinfectant around the outside surface of the endoscope and also through all of its internal working channels. After the disinfection phase, all internal channels and external surfaces are thoroughly rinsed to completely remove any disinfectant residue. This automated process inhibits the buildup of biofilms in the working channels and renders the endoscope safe for the next patient use. The entire high-level disinfection process can be completed with minimal participation by the operator, thereby minimizing the risk of user error while freeing the operator for other tasks, reducing the exposure of personnel to the chemicals used in the disinfection process and reducing the risk of transmission of infectious diseases.
Products and Services. Our Medivators line of endoscope reprocessing systems includes a full and comprehensive range of AERs, designed to meet our customer needs in the global markets we serve.
Our top selling AERs are ADVANTAGE PLUS® reprocessing systems, which represent technologically advanced fully automated systems designed to be compliant with all global standards and to compete against other sophisticated systems currently available on a global basis. All of the Medivators AERs can be used on a broad variety of flexible, immersible endoscopes and soak-only devices and are programmable by the user. The ADVANTAGE PLUS AER system, a single-use chemistry reprocessor, has FDA and Health Canada clearance for use exclusively with our single-use RAPICIDE® PA chemistry.
We recently launched the ADVANTAGE PLUS Pass-Thru AER in markets outside the United States to address key market needs in separating the dirty and clean sides of the reprocessing area for maximum endoscope infection prevention. The ADVANTAGE PLUS Pass-Thru AER features pass-through capability and integrated smart technology for fast, asynchronous reprocessing utilizing touch-free operation and reduced scope handling. Featuring a quick disinfection cycle time, it allows the reprocessing of 4-5 endoscopes in just over one hour. Other key endoscope reprocessors include the RAPIDAER®, DSD EDGE®, DSD-201, SSD-102 and CER OPTIMA® reprocessing systems.
Our acquisitions of United Kingdom-based PuriCore International Limited (“PuriCore”) in June 2014 and Italy-based International Medical Service S.r.l. (“IMS”) in November 2014 provided us with two European technology and research and development centers focused on endoscope reprocessing and high-level disinfectant chemistries used in AERs and for manual disinfection. In addition to expanding our bases of operations, the products designed, manufactured and sold by us through those locations have significantly expanded our global product offerings within our endoscope reprocessing business. For example, the RAPIDAER “Pass-Thru” endoscope reprocessor was developed by PuriCore.
5
In addition to reprocessors, our Medivators endoscope reprocessing product line includes:
|
· |
Chemistries: Our chemistries such as glutaraldehyde-based RAPICIDE® high-level disinfectant and sterilant and peracetic acid-based RAPICIDE PA high-level disinfectants work in concert with our AERs. In November 2014, with the acquisition of IMS, we added an important peracetic acid-based chemistry to our global endoscopy product portfolio, the ADASPOR® high-level disinfectant. We believe that our FDA 510(k) clearances for claims, including those for high-level disinfection times (at specific temperatures) and superior rinsibility, provide a competitive market advantage. For example, the disinfection contact times for our RAPICIDE® glutaraldehyde and RAPICIDE PA high-level disinfectants are currently some of the fastest available of any high-level disinfection products sold in the United States. |
|
· |
Endoscope leak detection device: These devices provide customers with high accuracy, complete automation and comprehensive electronic record keeping. |
|
· |
Endoscope flushing device: These devices minimize the risk of worker repetitive motion injury associated with manual flushing of endoscopes, while increasing the consistency of cleaning results through standardization of the pre-cleaning process. |
|
· |
Detergents and wipes: Our detergents and wipes are designed to be used on endoscopes before high-level disinfection. |
|
· |
Storage and drying cabinets: Our EDC, ESC, and ENDODRYTM storage and drying systems are designed to ensure that endoscopes remain bacteria free after completion of high-level disinfection. |
|
· |
Endoscope tracking: Our ENDORA® tracking system tracks and documents every step of the endoscope reprocessing cycle and alerts the operator and facility management if there is a breach in the reprocessing workflow. ENDORA tracking system is an active software system that continuously monitors every step of the process for compliance, verifying completion of each required step. It is designed to help ensure that only a clean, patient-ready endoscope will be used in a procedure. |
Our Endoscopy segment offers various preventative maintenance programs, repair services and user training programs to support the effective operation of reprocessing systems over their lifetime. Our field service personnel and international third-party distributors install, maintain, upgrade and repair equipment.
Endoscopy Procedure Products and Transport
General. We manufacture, market and sell an innovative array of high quality disposable products designed to mitigate infection risks and improve procedural success rates in the endoscopy arena. These products evidence our commitment to deliver infection prevention solutions that reduce risks to caregivers and patients in GI endoscopy. Our Medivators line of “procedure” products are used in the endoscopy procedure room itself as opposed to our endoscope reprocessing products, which address infection prevention after a procedure is completed. These disposable products are intended to eliminate the challenges associated with proper cleaning and high-level disinfection of numerous reusable components used in gastrointestinal endoscopy procedures. As such, they reduce the risk of cross contamination while providing greater traceability than reusable products in the event of a hospital/healthcare facility acquired infection. With our most recent procedure product addition we also potentially increase the rate of detection of adenomas during a diagnostic colonoscopy procedure, thereby increasing the early detection of colon cancer precursors and benefitting patient outcomes.
Products. Our proprietary procedure products include sterile disposable air/water, suction and biopsy valves, CO2 and irrigation pumps, irrigation tubing, polyp traps, procedure kits, procedure room accessories and rinse and insufflation tubing products. Our lead products include DEFENDO® sterile disposable valves, ENDOGATOR® disposable GI endoscopy irrigation tubing and the ENDO SMARTCAP™ disposable sterile water bottle adaptor, all of which are utilized during flexible endoscopy procedures. The DEFENDO valves are designed to replace reusable air/water, suction and biopsy valves on an endoscope. While reusable endoscope valves are sophisticated devices that require multiple steps to clean in adherence to current manufacturer’s reprocessing instructions, our DEFENDO valves
6
are single use devices that get discarded after each procedure. This reduces the risk to patients of hospital-acquired infections. In addition, if a patient has acquired such an infection, our valves provide the benefit of improved traceability relative to reusable valves, since most hospitals cannot track reusable valves due to their lack of serial numbers.
The ENDOGATOR® tubing allows for 24-hour use without the need to repeatedly sterilize reusable irrigation tubing. The ENDO SMARTCAP™ adaptor provides a disposable sterile alternative to the reusable water bottle in GI endoscopy designed to minimize infection risks that are associated with manual cleaning and high-level disinfection of the water bottle and its associated connection to the endoscope. We also offer a product known as the ENDOGATOR hybrid tubing, which combines the ENDO SMARTCAP and ENDOGATOR products into one innovative system. Utilizing a single disposable water bottle both for irrigation and cleaning the lens of the scope, this system maintains the superior patient safety standards characterizing Medivators endoscopy procedure products.
For improved visualization, our disposable ENDOGATOR Tubing and ENDO SMARTCAP® tubing integrate with our ENDO STRATUS® irrigation pump for colonic rinsing and an ENDO STRATUS® CO2 insufflator that maximizes patient comfort during a colonoscopy. Our disposable line also offers accessibility to an all-in-one ENDO CARRY-ON® custom procedure kit, designed to meet the individual needs of our customer base and the particular procedures that they are performing. The kits combine our proprietary products such as DEFENDO™ single-use valves with procedure-related devices and is packed in one convenient bundle, always ready for each procedure.
Other Products; New Products. The AmplifEYE™ endoscopic device, a proprietary product designed to improve a physician’s ability to visualize and examine the mucosa during a colonoscopy procedure, is a new product in our procedure product portfolio. The AmplifEYE endoscopic device slips over the tip of an endoscope and during withdrawal, its flexible arms open the bowel for inspection, everting large mucosal folds providing clearer views of mucosa previously difficult to visualize. We achieved EU and US regulatory clearances in May 2016 and July 2016, respectively, and thereupon introduced this product to the market.
With the acquisition of Medical Innovations in September 2015, we now offer proprietary short-term and long-term endoscope transport and storage systems as well as mobile medical cart systems, specialized surgical products and a comprehensive range of endoscopy accessories. We have also added a range of endoscopy accessories that complement our existing consumable accessories. Principal products of Medical Innovations include the CLEANASCOPE™ short-term endoscope storage and transport system, the SURESTORE® long-term endoscope storage and transport system, a comprehensive range of endoscopy accessories, mobile medical carts, and other specialized medical and hospital products. While the largest markets for these products have been the United Kingdom and, to a lesser extent, the United States and France, we intend to expand the sales effort in the United States and worldwide.
Marketing and Sales
We sell and service our full line of endoscopy products through our own direct United States field sales and service organizations. In September 2016, due to the Vantage Acquisition in Canada, we now sell our endoscopy reprocessing products and service in Canada on a direct basis, and anticipate adding the endoscopy procedure products at the end of the first quarter of fiscal 2017 and the endoscope storage and transport products during the second quarter of fiscal 2017. Outside of the United States and Canada, our endoscopy products are sold through our own sales and service organizations in the United Kingdom, Italy, the Netherlands, Germany, France, Singapore and Malaysia and primarily through independent distribution partners elsewhere in Europe, Asia, Australia and Latin America. In China, we sell both direct and through distributors, but we continue to build an infrastructure designed to enable us to increase our direct sales. Over time, we may look to further reduce our reliance on third party distributors in other territories outside of the United States.
7
Water Purification and Filtration
General
We design, develop, manufacture, sell, install and service water purification systems and accessories for dialysis and other specific healthcare applications, research laboratories and pharmaceutical, beverage and commercial industrial customers. These systems always start with a public water source and provide total purification solutions specific to our customers’ needs and site conditions, ranging from low-volume, reverse osmosis (“RO”) and deionization systems, to high-volume, complete turnkey purification systems. We generally sell the equipment directly to our customers in the United States, Puerto Rico, and Canada and through various third-party distributors in other international markets.
Water purification systems can include combinations of proven treatment methods such as (i) RO, which is a filtration process that forces liquid through non-porous or semi-porous membranes to remove particles, microorganisms and dissolved minerals and organics, (ii) carbon filtration, which removes chlorine and dissolved organic contamination by adsorption, (iii) ultra-filtration, which removes bacteria, viruses and other ultrafine impurities from water using a membrane similar in design to a RO membrane, (iv) deionization, which is an ion exchange platform that requires resin regeneration (see “Service & Maintenance; Resin Regeneration” below), and (v) electro-deionization, which is a form of deionization that is based on the conductance of electrical charges. We have significant expertise in packaging these technologies to meet specific requirements of customers requiring high-purity water that is free of contamination.
We are the market leader in the supply of FDA 510(k) cleared water purification systems to the dialysis industry in North America. During fiscal 2016, a significant portion of our sales in this segment were derived from sales of products and service to dialysis clinics and hospitals in North America.
Our growth in the Water Purification and Filtration segment, particularly in the medical/dialysis arena, over the past several years has been driven principally from acquisitions as well as new product introductions such as heat sanitized water systems.
Water Purification Equipment
Our product line of water purification systems has been designed to produce biologically pure water targeted for use in the healthcare, life sciences, food and beverage, and commercial industrial markets. We have significant expertise in the design and manufacture of water treatment systems engineered to meet specific water requirements of these markets. Such expertise includes designing systems capable of delivering water for hemodialysis that meets the water quality standards and good manufacturing standards of the Association for the Advancement of Medical Instrumentation (“AAMI”) and all grades of United States Pharmacopeia (“USP”) water (i.e., water meeting the FDA enforced standards of the USP including “USP Purified Water,” which is a FDA requirement for the labeling of “purified” bottled water.) We also package these same technologies and expertise in industrial designs to meet the requirements for high-purity water in the commercial industrial markets, such as boiler feedwater production or high quality rinse water production.
Our equipment line for high purity water includes systems that utilize either chemical or heat disinfection to sanitize the equipment. Our HX product line provides total heat disinfection of the entire water purification system and water distribution loop. Heat disinfection is especially attractive to the life science marketplace, which requires the highest levels of biological purity. Heat sanitization is environmentally friendly and prevents the formation of dangerous biofilms. Heat disinfection has been used in the pharmaceutical industry for many years and has been gaining increased acceptance in the dialysis market.
Our standard line of water purification equipment with 510(k) clearances that are used for medical (dialysis) applications includes the 2200M, 4400M, and 23G RO systems, enhanced by our heat sanitizable systems: the BIOPURE HX2® central dialysis water system and the MILLENIUM HX® medical portable heat disinfection system.
These product lines are complemented in the United States by the product lines manufactured and sold by us under a perpetual, exclusive license from Gambro Renal Products, Inc. and Gambro Lundia AB (collectively, “Gambro”), including the WRO 300, WRO 300H, CWP 100, WRO 101-104 and 106H, a leading heat disinfecting
8
system. Included in our medical product portfolio are pretreatment equipment, a full range of service deionization tanks and specific equipment designed to support the life sciences and industrial markets, including peripheral equipment such as carts, bicarbonate and acid delivery systems with central and single mix distribution units, and concentrate systems with central concentrate holding tanks.
We also have a full line of equipment designed for the commercial USP purified water market, which includes our 2200L, and 4400L® integrated water systems, using conventional technologies integrated into a single system design. We also have several lines of heat disinfection systems designed for this market, integrating both RO and electro deionization technologies into a single system design, with the additional feature of heat disinfection. These product lines include the VPURE 4400H®, LSX and USPure platform systems.
Service & Maintenance; Resin Regeneration
We provide service and maintenance for water purification systems in the United States and Canada through an extensive network of regional offices in the United States and, to a smaller degree, in Canada. These service centers are generally staffed with sales and service personnel to support both scheduled and emergency customer requirements. We provide 24-hour emergency service for our customers through a fleet of stocked service vehicles. Seven of the offices (Toronto, Montreal, Philadelphia, Boston, San Antonio, Chicago and Atlanta) are equipped with resin regeneration plants (described below).
Resin regeneration (also known as service deionization and carbon exchange) is the process in which cylinders (pressure vessels with an inlet connection and an outlet connection) are assembled, sanitized, and filled with ion exchange resin, which is processed using hydrochloric acid and caustic soda. These cylinders are connected to a customer’s water supply. As the water passes through the ion exchange resin beads, minerals carrying an electrical charge bind to the resin beads and are removed from the water. When the electrical charge that is placed on the resin beads during the regeneration process is exhausted, the cylinders are exchanged for identical cylinders with regenerated resin. The cylinders with exhausted resin are returned by service personnel to one of our regeneration plants, and the resin is regenerated for use by the same or another customer. Customers are charged for each cylinder replacement.
Filtration - Water
We offer a full line of proprietary and third party filters utilizing hollow fiber membrane technology. Our proprietary filters, sold under the FIBERFLO® capsule filters and FIBERFLO cartridge filters names, are utilized to remove impurities from liquid streams for a wide range of applications. We also offer the POSICLEAR® 1 pleated proprietary filter, another FDA 510(k) cleared product for hemodialysis water filtration. Such applications include the filtering of ultrapure water to remove bacteria and other contaminants in medical environments to provide protection for patients undergoing treatments that use ultrapure water. Our cartridge filters are validated to remove endotoxins in dialysis water, which is included in our registration of the filters as medical devices under FDA 510(k) regulations. The filters are also used in medical device reprocessing systems to help meet reprocessing water quality guidelines outlined by the AAMI. In industrial applications, the filters are used to protect systems from contamination from particulates and microorganisms.
Our FIBERFLO filters are also used in a variety of industries including pharmaceutical manufacturing, food and beverage processing, cosmetic manufacturing and electronics manufacturing. The filters are used increasingly for the removal of bacteria and other contaminants from aqueous solutions. These filters are engineered for point-of-use applications that require very fine filtration. Their hollow fiber design provides a surface area that is up to four times larger than traditional pleated filters that are used in the same markets. The large surface area provides greater capacity and longer filter life for the customer. FIBERFLO capsule filters and cartridge filters are available in a variety of styles, sizes and configurations to meet a comprehensive range of customer needs and applications.
Other products include microfiber and flat sheet membrane prefiltration products designed to protect the FIBERFLO filter products and prolong their life in their intended applications.
FIBERFLO filter products are sold directly and through various third-party distributors in the United States, Puerto Rico, Canada and other international markets.
1 POSICLEAR is a trademark owned by Gambro that is exclusively licensed to us for use in the United States.
9
Filtration - Therapeutic
Our therapeutic filtration products are extracorporeal filters that utilize our proprietary hollow fiber membrane technology. These filters include hemoconcentrators, hemofilters and specialty filters utilized for therapeutic medical applications.
We offer a comprehensive line of hemoconcentrators. A hemoconcentrator is a device used by a perfusionist (a healthcare professional who operates heart-lung bypass equipment) to concentrate red blood cells and remove excess fluid from the bloodstream during open-heart surgery. Because the entire blood volume of the patient passes through the hemoconcentrator during an open-heart procedure, the biocompatibility of the blood-contact components of the device is critical.
Our hemoconcentrators are designed to meet the clinical requirements of neonatal through adult patients. Our principal products are the HEMOCOR HPH® hemoconcentrators, which contain our proprietary polysulfone hollow fiber and also feature a unique “no-rinse” design that allows it to be quickly and efficiently inserted into the bypass circuit at any time during an open-heart procedure.
We also offer a line of RENAFLO® II hemofilters. A hemofilter is a device that performs hemofiltration in a slow, continuous blood filtration therapy used to control fluid overload and acute renal failure in unstable, critically ill patients who cannot tolerate the rapid filtration rates of conventional hemodialysis. The hemofilter removes water, waste products and toxins from the circulating blood of patients while conserving the cellular and protein content of the patient’s blood. Our hemofilter line features no-rinse, polysulfone hollow fiber filters that require minimal set-up time for healthcare professionals. The hemofilter is available in six different models to meet the clinical needs of neonatal through adult patients.
Our proprietary hollow fiber membranes and therapeutic products are sold to biotechnology manufacturers that integrate the filters into their own proprietary systems and through third-party distributors.
Sterilants
MINNCARE® cold sterilant is a liquid sterilant product used to sanitize and disinfect high-purity water systems. MINNCARE cold sterilant is based on our proprietary peracetic acid sterilant technology and is engineered to clean and disinfect RO membranes and associated water distribution systems. MINNCARE cold sterilant is widely used in the dialysis, medical, pharmaceutical and other industries to disinfect ultrapure water systems as part of overall procedures to control the contamination of systems by microorganisms and spores. ACTRIL® cold sterilant is a ready-to-use formulation of our proprietary peracetic acid-based sterilant technology. It is used for surface disinfection in a variety of industries, including the medical and pharmaceutical industries. The sporicidal capabilities of ACTRIL cold sterilant make it an appropriate selection for sterile manufacturing facilities that require such sporicidal disinfection on a monthly basis.
Our “Dry Fog” equipment dispenses our cold sterilant products in a mist form into rooms and certain structures with complex geometries in order to achieve validated surface disinfection. These systems currently are sold principally for clean room applications and sterile manufacturing markets in Europe and the United States.
Industrial Sterilization
Our REVOX® sterilization solutions business offers what we believe is the only true room-temperature vapor sterilization (18 - 30°C) method for the medical device, pharmaceutical, and biomedical industries and is the first novel sterilization method since 1993 utilized for FDA 510(k) clearance of a class II implantable medical device. The technology, based upon a variation of one of our peracetic acid-based products, allows heat-sensitive products to be sterilized without compromising product quality or integrity. It provides companies the capability to sterilize their products at room temperature, through either contract service or on-site agreements, while reducing overall processing times and inventory and capital requirements associated with other industrial sterilization methods.
10
Healthcare Disposables
We are a leading manufacturer and reseller of single-use, infection prevention healthcare products. We offer a broad selection of core disposable products, comprising numerous categories of merchandise, including face masks, sterilization pouches, biological monitoring systems and integrators/indicators, towels and bibs, tray covers, saliva ejectors and evacuators, germicidal wipes, plastic cups, surface barriers, disinfectants and cleaners, hand care products, gloves, prophy angles and prophy pastes, cotton products, needles and syringes, scalpels and blades, fluoride trays and gels and filter cartridge systems for waterlines.
We maintain a leading market position in the United States for face masks and several of our other products used in the dental market. Our strategy includes the continued development, licensing and/or acquisition of innovative branded products with unique and value-added selling propositions. One of our newer unique and innovative products is an earloop face mask sold under the SECURE FIT® face mask name. This product incorporates an aluminum strip on the top and bottom of the mask, allowing the wearer to adjust and conform the fit of the mask to the contour of their face, significantly minimizing the gapping that often occurs when wearing traditional earloop face masks. This feature is available in all three of our United States-manufactured American Society for Testing and Materials (ASTM) product performance classification face masks — Level 1 (ISOFLUID® masks), Level 2 (Procedural) and Level 3 (ULTRA® masks).
Our sterility assurance business offers both mail-in services and in-office biological monitoring (spore test) systems enabling healthcare professionals to verify the performance of their sterilizers in accordance with the United States Centers for Disease Control and Prevention (“CDC”) and industry guidelines for daily or weekly testing. Through strategic acquisitions, we have strengthened our position in the acute-care and alternate-care markets while broadening our sterility assurance product portfolio. We offer a wide-array of products and services that enable hospitals, surgical centers, office-based practitioners and dental facilities to safely and accurately monitor and verify their sterilization practices and protocols.
Through our Endoscopy and Healthcare Disposables sales teams, we sell RAPICIDE® OPA/28, an ortho-phthalaldehyde (OPA)-based high-level disinfectant for the reprocessing of semi-critical devices. RAPICIDE OPA/28 is a FDA 510(k) cleared high-level disinfectant that has a reuse period of 28 days, twice the reuse life of all other OPA-based high-level disinfectants available on the market with the fastest disinfection time — 10 minutes at room temperature. OPA/28 is our first reprocessing chemical that can be used in manual soak applications as well as a high-level disinfectant in endoscope reprocessing machines.
Other important healthcare disposable products include our SURE-CHECK® sterilization pouches and COMFORT PLUS® saliva ejectors. SURE-CHECK sterilization pouches are self-sealing pouches with a multi-variable (parameter) chemical indicator ink printed on the pouch both internally and externally. This multi-variable chemical indicator is a sterility assurance monitoring device providing the user with a reliable visual indication that the conditions for sterilization occurred without having to insert a separate chemical indicator into the pouch itself. The chemical indicators on the pouch undergo a color change reaction when all three key sterilization parameters - time, temperature and presence of steam - have occurred. The COMFORT PLUS saliva ejector uses a patented design featuring rounded edges, smooth surfaces and strategically placed suction ports that help to enhance patient comfort while protecting delicate mucosal tissue.
During fiscal 2015 we acquired and now sell the DentaPure® iodinated resin filter cartridge system used by dentists to maintain safe water quality in dental unit waterlines. It is designed to ensure that the water is free of bacteria, viruses and any other harmful organisms. The filter system eliminates the need to use tablets or mix chemicals and thus has no risk of leaving caustic chemicals in the waterlines.
We believe that the continued concern generated over respiratory viruses such as Middle East Respiratory Syndrome (“MERS”) and the novel H1N1 flu pandemic during fiscals 2010 and 2009, have resulted in widespread awareness of the need for prevention measures to address these infectious diseases. Additionally, there is increasing demand for United States-manufactured face masks in China and other Far East countries as a result of the pollution crisis in those areas. We believe we are well qualified to address the global need for face masks, disinfectants and other products relating to infection prevention, including pandemic influenza preparedness as well as for pollution related
11
protection. Based on our significant face mask manufacturing capabilities, we are well positioned to increase production of face masks should the need arise due to a recurrence of another pandemic influenza outbreak or other outbreaks of infectious disease(s) or for pollution related protection.
Our healthcare disposable products are sold globally to approximately 350 wholesale customers in over 100 countries, with a significant majority located in the United States. Our distribution partners generally include major healthcare distributors, group purchasing organizations and buying co-operatives that sell our products to dental practices, medical facilities, veterinary clinics, and government and educational institutions. The majority of our healthcare disposable products are sold under the Crosstex brand name. We also produce private label products for several of our distribution partners.
Dialysis
General
We design, develop, manufacture and sell reprocessing systems and sterilants for dialyzers (a device serving as an artificial kidney), as well as dialysate concentrates and supplies utilized for renal dialysis. Our products are sold in the United States and, to a significantly lesser extent, throughout the world. Our customer base is comprised of large and small dialysis chains as well as independent dialysis clinics. We sell products in the United States primarily through our own direct distribution network, and in many international markets either directly or under various third-party distribution agreements.
Dialyzer Reprocessing Products and Services
During dialysis, a dialyzer is used to filter fluids and wastes from a dialysis patient’s blood. Our dialyzer reprocessing products are limited to use by centers that choose to clean, disinfect and reuse dialyzers for the same patient, known as “dialyzer reuse,” rather than discard the dialyzers after a single use. Our products meet rigorous sterility assurance standards and regulations, thereby providing for the safe and effective reuse of dialyzers used in dialysis clinics.
We believe that dialysis centers in the United States that reuse dialyzers generally derive an economic benefit since the per-procedure cost is less when utilizing the dialyzer multiple times for the same patient rather than the wasteful and less environmentally friendly practice of using a dialyzer only one time per treatment. Additionally, dialyzer reuse significantly reduces the negative environmental consequences of single-use dialyzers by dramatically decreasing the amount of bio-hazardous medical waste in landfills. Although public information is not available to accurately quantify the number of dialysis centers currently employing dialyzer reuse versus single-use, it is apparent that, despite the cost effectiveness and environmental advantages of dialyzer reuse, there has been a significant market shift to single-use dialyzers during the past decade.
Since 2001, there has been a significant decline in dialyzer reuse. Today, we believe that less than 12% of all dialysis procedures in the United States reuse dialyzers, although there is no independent information available to verify that approximation. The shift from reusable to single-use dialyzers during the past decade is principally due to the decreasing cost of single-use dialyzers, the ease of using a dialyzer one time, and the conversion of reuse facilities to single-use facilities by the largest dialysis provider chains in the United States. As a result, the downward trend in reuse dialyzers in the United States accelerated during fiscal 2016 and may continue during fiscal 2017 and thereafter. Although the reduction of our dialysis reuse business had a significant adverse effect on our dialysis segment business during fiscal 2016, this was mitigated by increased sales of dialysate concentrate, discussed below. Likewise, we are expanding marketing efforts of reuse products in emerging markets in Asia, South America and elsewhere. See “Risk Factors” and “Management’s Discussion and Analysis of Financial Condition and Results of Operations.”
Our dialyzer reprocessing products include the RENATRON® II automated dialyzer reprocessing system (“RENATRON system”), the RENALOG® RM data management system and RENALIN® 100 cold sterilant, a peracetic acid-based sterilant.
12
The RENATRON system provides an automated method of rinsing, cleaning, testing and sterilizing dialyzers for reuse. The RENATRON system includes a bar-code reader, a computer and the RENALOG RM data management system, a software accessory that provides dialysis centers with automated record keeping and data analysis capabilities. We believe our RENATRON systems are more dependable, easier to use and more efficient than competitive automated systems. We also believe that the RENATRON systems are the top selling automated dialyzer reprocessing systems in the world.
Our RENALIN 100 cold sterilant is a proprietary peracetic acid-based formula that, when used with our RENATRON system, effectively cleans, disinfects and sterilizes dialyzers. RENALIN 100 cold sterilant is the leading dialyzer reprocessing solution in the United States.
We also manufacture a comprehensive product line of test strips to measure concentration levels of the peracetic acid chemistries we produce. These test strips ensure that the appropriate concentration of sterilant is maintained throughout the required contact period, in addition to verifying that all sterilant has been removed from the dialyzer prior to patient use. We also sell a variety of dialysis supplies manufactured by third parties.
Our Dialysis segment offers various preventative maintenance programs and repair services to support the effective operation of reprocessing systems over their lifetime. Our field service personnel, dialysis center technicians and international third-party distributors install, maintain, upgrade, repair and troubleshoot equipment.
Dialysate Concentrates
Our renal dialysis treatment products include a line of acid and bicarbonate concentrates, referred to as dialysate concentrates, used by kidney dialysis centers to prepare dialysate, a chemical solution that draws waste products from the patient’s blood through a dialyzer membrane during the hemodialysis treatment. Dialysate concentrates are used in the dialysis process, whether single-use or reuse dialyzers are being utilized. These concentrates are freight sensitive and, due to the competitive landscape, carry overall lower gross margins in our product portfolio.
Government Regulation
Many of our products are subject to regulation by the FDA, which regulates the testing, manufacturing, packaging, distribution and marketing of our medical devices and water purification devices in the United States. Delays in FDA review can significantly delay new product introduction and may result in a product becoming “dated” or losing its market opportunity before it can be introduced. Certain of our products may also be regulated by other governmental or private agencies, including the Environmental Protection Agency (“EPA”), Underwriters Lab, Inc. (“UL”), and comparable agencies in certain foreign countries. The FDA and other agency clearances generally are required before we can market such new or significantly changed existing products in the United States or internationally. The FDA and certain international governmental agencies also have the authority to require a recall or modification of products in the event of a defect or other issues.
Both before and after a product is commercially released, we have ongoing responsibilities under FDA and other governmental regulations. The Food, Drug and Cosmetic Act of 1938 and Safe Medical Device Act of 1990 require compliance with specific manufacturing and quality assurance standards for certain of our products. The FDA reviews design and manufacturing practices, labeling and record keeping, and manufacturers’ required reports of adverse experiences and other information to identify potential problems with marketed medical devices. The regulations also require manufacturers to establish a quality assurance program to monitor the design and manufacturing process and maintain records that show compliance with FDA regulations and the manufacturer’s written specifications and procedures relating to its medical devices. The FDA inspects medical device manufacturers for compliance with the current Quality Systems Regulations (“QSRs”), which govern the methods used in, and the facilities and controls used for, the design, manufacture, packaging, and servicing of all finished medical devices intended for human use. In addition, the FDA and other U.S. regulatory bodies monitor the manner in which we promote and advertise our products.
If we fail to meet the QSRs or violate applicable FDA, EPA or other laws or regulations or if any of our medical devices are found to be ineffective or pose an unreasonable health risk, we could be subject to reports or
13
warning letters, citations and fines as well as additional regulatory action including an order to recall, replace, repair, or refund non-compliant medical devices. Further, the FDA could detain or seize adulterated or misbranded medical devices, or ban such medical devices. The FDA may also impose operating restrictions, enjoin and/or restrain certain conduct resulting in violations of applicable law pertaining to medical devices, including a hold on approving new devices until issues are resolved to its satisfaction, and assess civil or criminal penalties against our officers, employees, or us. The FDA may also recommend prosecution to the Department of Justice (“DOJ”).
In addition, many of our infection prevention products sold in Canada, Europe, Japan and China are subject to comparable regulations and requirements as those described above. International regulatory bodies often establish varying regulations governing product standards, packaging requirements, labeling requirements, import restrictions, tariff regulations, duties and tax requirements. For example, since we sell our products in Europe, we were required to be certified as having a Quality System that meets the ISO 13485-2003 standard.
Many of our products must also meet the requirements of the European Medical Device Directive (“MDD”) for their sale into the European Union. This certification allows us, upon completion of a comprehensive technical file, to affix the CE mark to our products and to freely distribute such products throughout the European Union. Failure to maintain CE mark certification could have a material adverse effect on our business.
Our endoscope and dialyzer reprocessing products, as well as our Canadian water purification equipment manufacturing facility and many of our products manufactured in Canada, are subject to regulation by Health Canada — Therapeutic Products Directorate (“TPD”), which regulates the distribution and marketing of medical devices in Canada. Certain of such products may be regulated by other governmental or private agencies, including Canadian Standards Agency (“CSA”). TPD and other agency clearances generally are required before we can market new medical products in Canada. The Health Products and Food Branch Inspectorate (“HPFBI”) governs problem reporting, modifications and recalls. HPFBI also has the authority to require a recall or modification in the event of defect. In order to market our medical products in Canada, we hold the requisite Canadian recognized ISO 13485-2003 certification, as well as certain medical device licenses by product, as provided by HPFBI.
Federal, state and foreign regulations regarding the manufacture and sale of our products as well as the enforcement criteria and procedures used by governmental and private agencies are subject to change. We cannot predict what impact, if any, such changes might have on our products and business.
Sources and Availability of Raw Materials
We purchase raw materials, sub-assemblies, components and other supplies essential to our operations from numerous suppliers in the United States and abroad. The principal raw materials that we use to conduct operations include chemicals, paper, resin, stainless steel and plastic components. These raw materials are obtainable from several sources and are generally available within the lead times specified to vendors.
From time to time we experience price increases for raw materials, with no guarantee that such increases can be passed along to our customers. Although we do not currently foresee extraordinary difficulty in obtaining the materials, sub-assemblies, components, or other supplies necessary for our business operations, we cannot predict whether we will encounter difficulties or incur substantial price increases in the future that adversely affect our business.
Pursuant to the Dodd-Frank Wall Street Reform and Consumer Protection Act (Dodd-Frank), the SEC has implemented reporting and disclosure requirements related to public companies that use certain minerals and metals, known as “conflict minerals”, in their products. The rules require us to undertake measures to understand the origin and, as need be, source of conflict minerals within our supply chain and to report those measures and whether or not any such conflict minerals originated from the Democratic Republic of the Congo and adjoining countries. As such, the implementation of these rules could adversely affect the sourcing, availability, and pricing of materials used in our products if they are found to be sourced from that region.
14
Intellectual Property
We protect our technology and products by, among other means, filing United States and foreign patent applications. There can be no assurance, however, that any patent will provide adequate protection for the technology, system, product, service or process it covers. In addition, the process of obtaining and protecting patents can be long and expensive. We also rely upon trade secrets, technical know-how and continuing technological innovation to develop and maintain our proprietary position.
As of August 31, 2016, we held 55 United States patents and 167 foreign patents, and had 38 United States patents pending and 82 foreign patents pending. The majority of our United States and foreign patents, for individual products, are effective for twenty years from the filing date. The actual protection afforded by a patent, which can vary from country to country, depends upon the type of patent, the scope of its coverage and the availability of legal remedies in the country. In addition, we license from independent third parties under certain patents, trade secrets and other intellectual property, the right to manufacture and sell our sterilants and RAPICIDE disinfectant (see “—Reporting Segments-Endoscopy”) and water purification equipment using Gambro technology (see “—Reporting Segments-Water Purification and Filtration”). In the aggregate, these intellectual property assets and licenses (each of which is long-term) are of material importance to our business.
Our products and services are sold around the world under various trade names, trademarks and brand names. We consider our trade names, trademarks and brand names to be valuable in the marketing of our products in each segment. As of August 31, 2016, we had a total of 1,941 trademark registrations in the United States and in various foreign countries in which we conduct business, as well as 151 trademark applications pending worldwide.
Seasonality
Our businesses generally are not seasonal in nature.
Principal Customers
None of our customers accounted for 10% or more of our consolidated net sales during fiscals 2016 and 2015.
Except as described below, none of our segments are reliant upon a single customer, or a few customers, the loss of any one or more of which could have a material adverse effect on the segment.
In our Water Purification and Filtration segment, Fresenius Medical Care (“Fresenius”) and DaVita Inc. (“DaVita”) collectively accounted for approximately 43.7% of our segment net sales during fiscal 2016. The loss of a significant amount of business from Fresenius or DaVita could have a material adverse effect on our Water Purification and Filtration segment.
Our Healthcare Disposables segment is reliant on four customers who collectively accounted for approximately 49.1% of our Healthcare Disposables segment net sales during fiscal 2016. The loss of a significant amount of business from any of these four customers or a further consolidation of such customers could have a material adverse effect on our Healthcare Disposables segment.
During fiscal 2016, two customers, Fresenius and DaVita, collectively accounted for approximately 42.6% of our Dialysis segment net sales. The loss of a significant amount of business from Fresenius or DaVita would have a material adverse effect on our Dialysis segment, as further explained in “—Reporting Segments—Dialysis,” “Risk Factors” and “Management’s Discussion and Analysis of Financial Condition and Results of Operations.”
Backlog
On August 31, 2016, our consolidated backlog was approximately $72,415,000 compared with approximately $66,870,000 on August 31, 2015. The majority of the backlog was in our Water Purification and Filtration segment
15
which had backlog of $52,248,000 and $47,519,000 at August 31, 2016 and August 31, 2015, respectively. The entire backlog is expected to be recognized as revenue within one year of such date.
Competition
General
The markets in which our business is conducted are highly competitive. Competition is intense in all of our business segments and includes many large and small competitors. Important competitive factors generally include product design and quality, safety, ease of use, product service, and price. We believe that the long-term competitive position for all of our segments depends principally on our success in developing, manufacturing and marketing innovative, cost-effective products and services.
Many of our competitors have greater financial, technical, and human resources than we do, are well-established with reputations for success in the sale and service of their products, and may have certain other competitive advantages over us. However, we believe that the worldwide reputation for the quality and innovation of our products among customers and our reputation for providing quality product service give us a competitive advantage with respect to many of our products.
In addition, certain companies have developed, or may be expected to develop, new technologies or products that directly or indirectly compete with our products. We anticipate that we may face increased competition in the future as new infection prevention products and services enter the market. Numerous organizations are believed to be working with a variety of technologies and sterilizing agents. In addition, a number of companies have developed or are developing disposable medical instruments and other devices designed to address the risks of infection and contamination. There can be no assurance that new products or services developed by our competitors will not be more commercially successful than those provided or developed by us in the future.
Segments
Information with respect to competition within our individual segments is as follows:
In our Endoscopy segment, our principal competitors are Steris, Olympus, ASP division of Johnson & Johnson, Metrex, Ruhof, Ecolab, Endo Choice, ERBE, Getinge and Wassenburg. We believe that our principal competitive advantages include the strength of our dedicated sales team in the United States, our comprehensive product line of automated endoscope reprocessors, disposable procedure products, and proprietary chemistries, the advanced features and product innovation of our automated endoscope reprocessors and other endoscopy products, our reputation for providing high-quality and reliable products, and our highly responsive clinical support and service teams focused on endoscopy.
We believe that the ability of our Water Purification and Filtration segment to successfully compete in the water purification, filtration and disinfectant market derives from our expertise in a FDA regulated environment, our broad product offerings and the high value and quality of our products and services. We are the market leader in the supply of FDA 510(k) cleared water purification systems to the dialysis industry in North America. Our numerous acquisitions of both large and small companies in the medical water purification field have given us a competitive advantage due to our expanded product offerings and our national service coverage. We believe that by focusing our efforts principally on the dialysis, pharmaceutical, biotechnology, medical and commercial industrial markets, providing a high-level of customer service and making selective acquisitions, we can continue to grow this segment.
However, outside of the United States, we believe there is a trend in formal or informal bundling partnerships and arrangements between kidney dialysis machine suppliers and companies offering medical water purification systems that compete with our systems. The ability to bundle these products offers a competitive advantage to such suppliers, which include Baxter (dialysis machine)/Gambro (water system), B. Braun (dialysis machine)/Lauer (water system), and Fresenius (dialysis machine)/Vivonic (water system). The bundling approach is now being used in the United States by B. Braun/Lauer and represents a competitive threat to our dialysis water business. See “Risk Factors.”
16
In our Healthcare Disposables segment, our principal competitors vary by product type but principally encompass bigger companies, several of which serve a broader range of markets. Such competitors include Halyard Health, 3M, Steris, Danaher/Sybron, Dentsply/Sultan Healthcare, Amcor and more generically less expensive imported products from Asia and other lower cost locations. We believe that our long-standing Crosstex brand reputation in the dental market and SPS Medical brand in the medical market, product quality, superior customer service and breadth of product line are competitive advantages and are the basis for our success in this segment.
In our Dialysis segment, our most significant competition comes from manufacturers of single-use dialyzers, particularly Fresenius, the largest dialysis chain in the United States and a manufacturer of single-use dialyzers. All or substantially all Fresenius dialysis clinics exclusively use single-use dialyzers and therefore have no need for dialyzer reprocessing equipment. See “—Reporting Segments—Dialysis,” “Risk Factors” and “Management’s Discussion and Analysis of Financial Condition and Results of Operations.”
Research and Development
Research and development expenses (which include continuing engineering costs) increased by $1,388,000 to $15,410,000 in fiscal 2016 from $14,022,000 in fiscal 2015. Our research and development expenses primarily relate to development work on new products in our three largest segments, Endoscopy, Water Purification and Filtration and Healthcare Disposables, as well as continuing engineering costs primarily related to endoscopy products.
Environmental Matters
We anticipate that our compliance with federal, state, and local laws and regulations, relating to the discharge of materials into the environment, or otherwise relating to the protection of the environment, will not have any material effect on our capital expenditures, earnings or competitive position.
Employees
As of August 31, 2016, we employed 2,000 persons, of whom 1,493 are located in the United States, 364 are located in Europe, Africa and the Middle East, 89 are located in Southeast Asia and 54 are located in Canada. None of our employees are represented by labor unions. We consider our relations with our employees to be satisfactory.
Financial Information about Geographic Areas
We have operations in Canada, Europe, Asia and other areas outside of the United States. These operations involve the same business segments as our domestic operations. For a geographic presentation of revenues and other financial data for the three years ended July 31, 2016, see Note 18 to the Consolidated Financial Statements.
Our foreign operations are subject, in varying degrees, to a number of inherent risks. These risks include, among other items, foreign currency exchange rate fluctuations, changes in local economic conditions and tax regulations, unsettled political, regulatory or business conditions, and government-sponsored boycotts and tariffs on our products or services.
We ship certain of our products to Iran, and conduct related activities, in accordance with general or specific licenses issued by the Office of Foreign Assets Control (OFAC) of the U.S. Department of the Treasury. The Iranian sales were generally conducted through distributors, some of whose customers may include public hospitals owned or controlled directly or indirectly by the Iranian government.
Depending on the direction of change relative to the U.S. dollar, foreign currency exchange rate fluctuations can increase or reduce the reported dollar amounts of the Company’s net assets and results of operations. Overall, foreign currency movements relative to the U.S. dollar did not have a significant impact on net income during fiscal 2016. We cannot predict future changes in foreign currency exchange rates or the effect they will have on our operations. See “Risk Factors.”
17
Available Information
We make available to the public, free of charge, on or through the Investor Relations section of our internet website, copies of our annual reports on Form 10-K, quarterly reports on Form 10-Q, current reports on Form 8-K and amendments to those reports as soon as reasonably practicable after we electronically file such materials with the SEC. We also similarly make available, free of charge on our internet website, the reports filed with the SEC by our executive officers, directors and 10% stockholders pursuant to Section 16 under the Securities Exchange Act of 1934, as amended, as soon as reasonably practicable after copies of those filings are provided to us by those persons. Our filings are available to the public from commercial document retrieval services, our website and at the SEC’s website at www.sec.gov. Our website address is www.cantelmedical.com. Also available on our website are our Corporate Governance Guidelines, Charters of the Nominating and Governance Committee, Compensation Committee and Audit Committee, and Code of Business Conduct and Ethics. Information contained on our website is not incorporated by reference into this Report.
Item 1A.RISK FACTORS.
We are subject to various risks and uncertainties relating to or arising out of the nature of our businesses and general business, economic, financing, legal and other factors or conditions that may affect us. We provide the following cautionary discussion of risks and uncertainties relevant to our businesses, which we believe are factors that, individually or in the aggregate, could have a material and adverse impact on our business, results of operations and financial condition, or could cause our actual results to differ materially from expected or historical results. We note these factors for investors as permitted by the Private Securities Litigation Reform Act of 1995. You should understand that it is not possible to predict or identify all such factors. Consequently, you should not consider the following to be a complete discussion of all potential risks or uncertainties.
We face intense competition and may not be able to keep pace with the rapid technological changes in the medical device industry, which could have a material adverse effect on our business, financial condition or results of operations.
The medical device markets in which we primarily participate are highly competitive. We encounter significant competition across our product lines and in each market in which our products are sold from various medical device companies, many of which may have greater financial, technical and marketing resources than we do and are well-established. Some competitors have developed or may be expected to develop technologies or products that could compete with our products or that would render our products obsolete or noncompetitive. In addition, our competitors may achieve patent protection, regulatory approval or product commercialization that would limit our ability to compete with them. See “Business — Competition.”
Additionally, the medical device markets in which we primarily participate are characterized by extensive research and development, new product introductions and product enhancements, rapid technological change and evolving industry standards. Developments by other companies of new or improved products, processes or technologies may make our products or proposed products obsolete or less competitive and may negatively impact our net sales. Accordingly, our ability to compete is in part dependent on our ability to continually offer enhanced and improved products that meet the changing requirements of our customers. As such, we are required to devote continued efforts and financial resources to develop or acquire scientifically advanced technologies and products, apply our technologies cost-effectively across product lines and markets, obtain patent and other protection for our technologies and products, obtain required regulatory and reimbursement approvals and successfully manufacture and market our products consistent with our quality standards. If we fail to develop new products or enhance existing products, it could have a material adverse effect on our business, financial condition or results of operations.
18
We face increased competition in the water purification system market due to the alliance of kidney dialysis machine suppliers and water purification system suppliers.
Outside of the United States, we believe there is a trend in formal or informal bundling partnerships and arrangements between kidney dialysis machine suppliers and companies offering medical water purification systems that compete with our systems. The ability to bundle these products offers a competitive advantage to such suppliers, which include Baxter (dialysis machine)/Gambro (water system), B. Braun (dialysis machine)/Lauer (water system), and Fresenius (dialysis machine)/Vivonic (water system). The bundling approach is now being used in the United States by B. Braun/Lauer and represents a competitive threat to our dialysis water business.
The market for our dialysis reprocessing products is limited to dialysis centers that reuse dialyzers. The decrease in the reuse portion of the dialysis market in the United States accelerated significantly during fiscal 2016 and such decrease is expected to continue.
Our dialyzer reprocessing products are limited to use by centers that choose to clean, sterilize and reuse dialyzers, rather than discard the dialyzers after a single-use. We believe dialysis centers in the United States that reuse dialyzers derive an economic benefit since the per-procedure cost is less when utilizing dialyzer reuse compared with single-use and such dialysis clinics generally receive a capitated payment for providing hemodialysis treatment. Although current public information is not available to accurately quantify the number of dialysis centers currently employing dialyzer reuse versus single-use, it is apparent that the market share of single-use dialyzers has been increasing since 2001 relative to reuse dialyzers. We believe that less than 12% of all dialysis procedures in the United States currently reuse dialyzers, although there is no independent information available to verify that approximation.
Since 2001, there has been a continuing shift from reusable to single-use dialyzers, principally due to the decreasing cost of single-use dialyzers, the ease of using a dialyzer one time, and the conversion of reuse facilities to single-use facilities by the largest dialysis provider chains in the United States. Most recently, DaVita, the second largest dialysis provider chain has been converting a growing number of clinics from reuse to single-use and opening new clinics as single-use clinics. As a result, the downward trend in reuse dialyzers in the United States accelerated during fiscal 2016 and may continue during fiscal 2017 and thereafter.
The reduction of our dialysis reuse business has had an adverse effect on our dialysis segment business and reduced our margins and net income in that segment. However, such effect was significantly mitigated by increased sales in our dialysate concentrate sales during fiscal 2016, which sales are anticipated to remain relatively strong during fiscal 2017.
Net sales of our Dialysis segment accounted for 4.9% of our total net sales in fiscal 2016 compared with 5.5% of net sales in fiscal 2015 and 6.3% of net sales in fiscal 2014. Our Dialysis segment accounted for 6.4%, 6.8%, and 8.7% of our total reporting segments’ operating income (before general corporate expenses and interest expense) in fiscals 2016, 2015 and 2014, respectively. This reduction in percentage of total sales is expected to continue during fiscal 2017 and thereafter primarily due to reduced purchases of dialysis reuse products combined with the organic growth of our segments other than Dialysis and the effect on our future results of operations from acquisitions. See “Business - Principal Customers,” “Business - Competition” and “Management’s Discussion and Analysis of Financial Condition and Results of Operations—Results of Operations.”
We face significant challenges in growing our dialysate concentrate sales.
Although prior to fiscal 2014, sales of dialysate concentrate generally declined from year to year, such trend stopped toward the end of fiscal 2015 when we began manufacturing concentrate for a large national distributor of these products. As a result of sales to this distributor, dialysate concentrate sales increased in fiscal 2015 and again in fiscal 2016. We anticipate that relatively strong sales of these products will continue during fiscal 2017 and mitigate to some extent the anticipated decrease in sales of dialysis reuse products. However, no assurance can be given that we will succeed at increasing sales in the near or long term. Fresenius manufactures dialysate concentrate itself and therefore provides dialysate concentrate to its own dialysis clinics. DaVita and certain international customers have also continued their reduction of dialysate concentrate purchases from us as a result of the highly competitive and price sensitive market
19
for such product. In addition, there is increased demand in the market for powdered dialysate products, which we do not manufacture, principally due to the lower freight costs associated with the powdered products.
Because a significant portion of our Water Purification and Filtration, Dialysis and Healthcare Disposables segments net sales comes from a few large customers, any significant decrease in sales to these customers, due to industry consolidation or otherwise, could harm our operating results.
In our Water Purification and Filtration segment, two customers, Fresenius and DaVita, collectively accounted for 43.7% of our fiscal 2016 net sales for this segment. The loss of a significant amount of business from either of these two customers would have a material adverse effect on our Water Purification and Filtration segment.
During fiscal 2016, Fresenius and DaVita accounted for 42.6% of the Dialysis segment net sales. We are highly dependent on Fresenius and DaVita and any material shift by these customers away from reuse would have a material adverse effect on our Dialysis segment net sales except to the extent we successfully mitigate the loss of U.S. reuse business with increased foreign business, the successful commercialization of new or acquired products and increased sales of dialysate.
The distribution network in the United States dental industry is concentrated, with relatively few distributors of consumable products accounting for a significant share of the sales volume to dentists. Accordingly, net sales and profitability of our Healthcare Disposables segment are highly dependent on our relationships with a limited number of large distributors. During fiscal 2016, the top four customers of our Healthcare Disposables segment accounted for 49.1% of its net sales. The loss or a significant reduction of business from any of the major customers of the Healthcare Disposables segment could adversely affect our results of operations. In addition, because our Healthcare Disposables segment products are primarily sold through third-party distributors and not directly to end users, we cannot control the amount and timing of resources that our distributors devote to our products.
There can be no assurance that there will not be a loss or reduction in business from one or more of our major customers. In addition, we cannot assure that net sales from customers that have accounted for significant net sales in the past, either individually or as a group, will reach or exceed historical levels in any future period.
Our industry is experiencing significant scrutiny and regulation by governmental authorities, which may lead to greater regulation in the future.
Our medical devices and our business activities are subject to rigorous regulation, including by the FDA, DOJ, and numerous other federal, state, and foreign governmental authorities. These authorities and members of Congress have been increasing their scrutiny of our industry. In addition, certain state governments and the federal government have enacted legislation aimed at increasing transparency of our interactions with healthcare providers. As a result, we are required by law to disclose payments and other transfers of value to healthcare providers licensed by certain states and to all U.S. physicians and U.S. teaching hospitals at the federal level. Any failure to comply with these legal and regulatory requirements could adversely impact our business. In addition, we may continue to devote substantial additional time and financial resources to further develop and implement policies, systems, and processes to comply with enhanced legal and regulatory requirements, which may also impact our business. We anticipate that governmental authorities will continue to scrutinize our industry closely, and that additional regulation may increase compliance and legal costs, exposure to litigation, and other adverse effects to our operations.
Moreover, as directed by the Dodd-Frank Wall Street Reform and Consumer Protection Act (Dodd-Frank), the SEC has implemented reporting and disclosure requirements related to the use of certain minerals, known as “conflict minerals” (specifically, tantalum, tin, tungsten (or their ores), and gold) which are mined from the Democratic Republic of the Congo and adjoining countries. Pursuant to these requirements, we are required to publicly report on Form SD the procedures we employ to determine the sourcing of such minerals and metals produced from those minerals and whether we can determine if conflict minerals are used in products that we manufacture. There are costs associated with complying with these disclosure requirements, including for diligence in regards to the sources of any conflict minerals used in our products, in addition to the cost of remediation and other changes to products, processes, or sources of supply as a consequence of such verification activities, if appropriate. In addition, the implementation of these rules could
20
adversely affect the sourcing, supply, and pricing of materials used in our products. As of the date of our conflict minerals report for the 2015 calendar year, although we fully complied with the regulation, we were unable to obtain the necessary information on conflict minerals from all of our suppliers and were unable to determine that all of our products are conflict free. We may continue to face difficulties in gathering this information in the future. We may face reputational challenges if we determine that certain of our products contain minerals not determined to be conflict free or if we are unable to sufficiently verify the origins for all conflict minerals used in our products through the procedures we implement.
Our businesses are heavily reliant on certain raw materials and can be adversely impacted by rising prices.
We purchase raw materials, sub-assemblies, components and other supplies essential to our operations from numerous suppliers in the United States and abroad. The principal raw materials that we use to conduct operations include chemicals, paper, resin, stainless steel and plastic components.
From time to time we experience price increases for raw materials, with no guarantee that such increases can be passed along to our customers. During fiscal 2008, for example, we experienced unprecedented price increases in certain raw materials due in large part to the rising price of fuel and oil, including chemicals, paper and plastics (resins and bottles) which had a significant adverse impact on our gross margins. In addition, we experienced significant difficulty in obtaining certain chemicals in fiscal 2008 due to apparent shortages by certain suppliers. Although we do not currently foresee extraordinary difficulty in obtaining the materials, sub-assemblies, components or other supplies necessary for our business operations, we cannot predict if similar difficulties as those experienced in the past will occur again in the future, including further price increases, that may adversely affect our business.
In addition, although fuel and oil prices have been at relatively low levels, an increase in prices can also have a significant adverse impact on transportation costs related to both the purchasing and delivery of products and services. If costs materially increase in the future, we may not be able to implement price increases to our customers, which would adversely impact our gross margins.
The acquisition of new businesses and product lines, which has inherent risks, is an important part of our growth strategy.
We intend to grow, in part, by acquiring products and businesses. The success of this strategy depends upon several factors, including our ability to:
|
· |
identify and acquire appropriate products and businesses; |
|
· |
obtain financing for acquisitions on terms that are favorable or acceptable; |
|
· |
integrate acquired operations, personnel, products, technologies and regulatory procedures into our organization effectively; |
|
· |
retain and motivate key personnel and retain the customers and suppliers of acquired companies; |
|
· |
realize perceived synergies; and |
|
· |
successfully promote and increase sales and profits of acquired product lines. |
Even if acceptable financing is obtained, such financing may result in charges associated with the potential write-off of existing deferred financing costs. We also may not be able to sustain the rates of growth that we have experienced in the past, whether by acquiring businesses or otherwise. In addition, we often experience competition from third parties interested in the same acquisition candidate. This may result in increases in the price paid for acquisition candidates.
Other risks and uncertainties related to acquisitions include:
|
· |
delays in realizing the benefits of the transactions, including achievement of anticipated operating efficiencies and synergies and other transaction benefits as well as forecasted sales and earnings; |
|
· |
diversion of management’s time and attention; |
|
· |
difficulties in implementing and maintaining uniform standards, controls, procedures and policies; and |
21
|
· |
risks associated with the assumption of contingent or undisclosed liabilities of acquired companies. |
We are subject to Accounting Standards Codification (“ASC”) 805, “Business Combinations,” (“ASC 805”), which establishes principles and requirements for how an acquirer recognizes and measures in its financial statements the identifiable assets acquired, the liabilities assumed, contingent future consideration, any non-controlling interest in the acquiree and the goodwill acquired. The provisions of ASC 805 relating to contingent future consideration, or earn-outs, require us to record the fair value of such estimated amounts at the date of acquisition and continually remeasure the liability at each balance sheet date, which has the potential for creating significant earnings volatility.
In particular, on November 5, 2013 we recorded a $2,490,000 liability for the estimated fair value of contingent consideration and a $1,720,000 liability for the estimated fair value of an assumed contingent obligation payable to the Israeli Government relating to the Jet Prep Acquisition, as further described in Note 3 to the Consolidated Financial Statements. These two liabilities are adjusted periodically by recording changes in the fair value through our Consolidated Statements of Income driven by the time value of money and changes in the assumptions that were initially used in the valuations. The actual contingent consideration and assumed contingent obligation have the potential of being between zero and a percentage of unlimited sales that could occur until the completion of the seven year period with respect to the contingent consideration liability and until the assumed contingent obligation is satisfied in full, or until the sales of the Jet Prep Ltd. products no longer exist. The initial fair values of these two contingent liabilities of $2,490,000 and $1,720,000 decreased to zero and $1,138,000, respectively, at July 31, 2016 primarily due to commercialization delays, changes in probability factors and future sales projections based on recently completed market research, product modification plans and the passage of time. Such fair value amounts would have been higher or lower if we had used different probability factors, future sales projections or discount factors. Given the subjective nature of the assumptions used in the determinations of fair value, we may potentially have further earnings volatility in our future results of operations related to these Jet Prep obligations.
Furthermore in connection with the acquisition of PuriCore, we acquired certain ordinary course business assets and liabilities, which included a contingent guaranteed obligation to reimburse an endoscope service company for endoscope repair costs it incurs when servicing its customers’ endoscopes that are damaged by one of PuriCore’s discontinued endoscope reprocessing machine models. Although the terms of the guarantee provide for no limit to the maximum potential future payments, we have estimated the present value of the liability on the date of the acquisition to be approximately $1,414,000. The determination of the fair value of this contingent guarantee obligation is subjective in nature and can be impacted by significant changes in third party service repair rates, the frequency of claims and a change in the expected life of these discontinued machines. This liability will be adjusted periodically by recording changes in the fair value through our Consolidated Statements of Income driven by the time value of money and changes in the assumptions that were initially used in the valuation.
Given the subjective nature of the assumptions used in the determination of fair value calculations, we may potentially have significant earnings volatility in our future results of operations.
In addition, we have occasionally used our stock as partial consideration for acquisitions. Our common stock may not remain at a price at which it can be used as consideration for acquisitions without diluting our existing stockholders, and potential acquisition candidates may not view our stock attractively.
We have a significant amount of goodwill and intangible assets on our balance sheet related to acquisitions. If future operating results of the acquired businesses are significantly less than the results anticipated at the time of the acquisitions, we may be required to incur impairment charges. However, the average fair value of all of our reporting units exceeded book value by substantial amounts at July 31, 2016.
Assumptions regarding the growth of businesses we acquire may differ from actual results.
The indemnification provisions of acquisition agreements by which we have acquired companies may not fully protect us and as a result we may face unexpected liabilities.
Certain of the acquisition agreements by which we have acquired companies require the former owners to indemnify us against certain liabilities related to the operation of the company before we acquired it. In most of these agreements, however, the liability of the former owners is limited and certain former owners may be unable to meet their
22
indemnification responsibilities. We cannot assure you that these indemnification provisions will protect us fully or at all, and as a result we may face unexpected liabilities that adversely affect our financial condition or results of operations.
Our limited operating experience and market recognition in new international markets may limit our international expansion strategy and cause our international return on investments and growth to suffer.
Our future growth depends in part on our international expansion efforts, including efforts in emerging markets such as China. We have limited experience with regulatory environments and market practices internationally, and we may not be able to penetrate or successfully operate in locations and environments unfamiliar to us. Additionally, global operations are subject to risks and uncertainties, including political and economic instability, general economic conditions, imposition of government controls, the need to comply with a wide variety of foreign and United States export laws and trade restrictions. In connection with our expansion efforts we may encounter obstacles we did not face in North America, including cultural and linguistic differences, differences in regulatory environments, labor and market practices, difficulties in keeping abreast of market, business and technical developments, foreign customers’ requirements and preferences, and the difficulty of administering business overseas. Further, sales practices in certain international markets may be inconsistent with our desired business practices and U.S. and other legal requirements, which may impact our ability to expand as planned. We may also encounter difficulty expanding in new international markets because of competitors already entrenched in the market, and our limited brand recognition leading to delayed acceptance of our products in these new international markets. Our failure to develop new markets or disappointing growth outside of existing markets may negatively affect our return on investments relating to our international expansion efforts.
On June 23, 2016, the UK held a referendum in which voters approved an exit from the European Union (“E.U.”), commonly referred to as “Brexit”. As a result of the referendum, it is expected that the British government will begin negotiating the terms of the UK’s future relationship with the E.U. Although it is unknown what those terms will be, it is possible that there will be greater restrictions on imports and exports between the UK and E.U. countries and increased regulatory complexities. These changes may adversely affect our operations and financial results since we have a significant presence in the UK
During fiscal 2016, we continued to invest significantly in infrastructure in China so that we can more readily import and sell our products. However, risks and uncertainties related to political and economic conditions in China, traditional business practices, foreign currency fluctuations, interest rate fluctuations, regulatory and reimbursement approvals, competitive offerings, infrastructure development complications and intellectual property protection may adversely impact our ability to implement our business strategy in this market and, as a result, our sales growth and operating profits from our international operations may be adversely affected.
Further, international markets are increasingly being affected by economic pressure to contain reimbursement levels and healthcare costs, and certain international markets may also be impacted by foreign government efforts to understand healthcare practices and pricing in other countries, which could result in increased pricing transparency across geographies and pressure to harmonize reimbursement and ultimately reduce the selling prices of our products.
Most international jurisdictions have regulatory approval and periodic renewal requirements for medical devices, and countries that previously did not have regulatory requirements for medical devices may adopt such requirements; we must comply with these requirements in order to market our products in these jurisdictions. In addition, the trend in countries around the world toward more stringent regulatory requirements for product clearance, changing reimbursement models, and more rigorous inspection and enforcement activities has generally caused or may cause us and other medical device manufacturers to experience more uncertainty, delay, risk, and expense. We expect that the international regulatory environment will continue to evolve, which could impact our ability to obtain approvals for our products in those jurisdictions, which may have a material impact on our business.
Further, any significant changes in the competitive, political, legal, regulatory, reimbursement or economic environment where we conduct international operations may have a material impact on our business, financial condition or results of operations.
23
Health care policy changes on both the federal and state levels may have a material adverse effect on us.
In response to perceived increases in health care costs in recent years, there have been and continue to be proposals by the federal government, state governments, regulators, and third-party payers to control these costs and, more generally, to reform the U.S. health care system. Certain of these proposals could limit the prices we are able to charge for our products or the amounts of reimbursement available for our products and could limit the acceptance and availability of our products. The adoption of some or all of these proposals could have a material adverse effect on our financial position and results of operations.
In addition, the U.S. Patient Protection and Affordable Care Act, as amended by the Health Care and Education Affordability Reconciliation Act, contains provisions that could have a material impact on our business. Among other provisions, this legislation imposes a 2.3% excise tax on all U.S. medical device sales. Late in 2015, Congress enacted legislation that suspended the excise tax for calendar years 2016 and 2017. During fiscals 2016 and 2015, our total excise tax incurred was $2,035,000 and $4,369,000, respectively, which decreased our gross profit by such amounts. Furthermore, we have been required to commit significant resources to “Sunshine Act” compliance. In addition, various healthcare reform proposals have also emerged at the state level. We cannot predict with certainty what healthcare initiatives, if any, will be implemented at the state level, or what the ultimate effect of federal healthcare reform or any future legislation or regulation may have on us or on our customers’ purchasing decisions regarding our products and services.
Our stock price and trading volume has been volatile from time to time and has experienced significant fluctuations over the past several months and years as a result of various market factors. We may experience continued fluctuations in price and volume in the future that could negatively impact the value of our outstanding shares.
The market for our common stock has, from time to time, experienced significant price and volume fluctuations that may have been unrelated to our operating performance. Factors such as announcements of our quarterly financial results, new business developments and factors and events described in the Risk Factors section of this Annual Report on Form 10-K, many of which are beyond our control, could cause the market price and trading volume of our common stock to fluctuate significantly. As a result, an investment in our stock could fluctuate significantly and/or decline in value.
In addition, the trading market for our common stock relies in part on the research and reports that industry and other financial analysts publish about us, our business and our industry. We do not control these or any other analysts, nor do we control their respective reports. Our future operating results are subject to substantial uncertainty, and our stock price could decline significantly if we fail to meet or exceed analysts’ forecasts and expectations. If any of the analysts who cover us downgrade our stock, lower their price target or issue commentary or observations about us or our stock that are perceived by the market as negative, our stock price would likely decline rapidly. In addition, there are many other large, well-established, publicly traded companies active in our industry and market, which may cause our company to garner less attention from industry analysts. If these analysts decrease coverage or otherwise cease to cover our company, we could lose visibility in the market, which in turn could cause our stock price to decline.
Competition from lower cost manufacturing facilities such as those located in China, Southeast Asia and certain locations within North America could result in a reduction in our net sales of healthcare disposable products due to reduced average selling prices or our customers no longer purchasing certain products from us.
Despite expensive shipping costs, quality concerns, sustainability issues and other matters, some of our competitors manufacture certain healthcare disposable products in lower cost locations such as China, Southeast Asia and certain locations within North America. Although we believe the quality of our healthcare disposable products, which are generally produced in the United States, are superior, our sales in the future may be adversely affected by either loss of sales or reductions in the prices of our products as a result of this lower cost competition. Price erosion resulting from lower cost competition did not have a material adverse impact on our business during fiscal year 2016, but no assurance can be given that we will not face increased competition in the future.
24
We are subject to extensive government regulation, which may delay or prevent new product introduction.
Our operations are subject to extensive regulation by governmental and private agencies in both the United States and in other countries where we do business. In the United States, our products and services are regulated by the FDA and other regulatory authorities. In many foreign countries, sales of our products are subject to extensive regulations that may or may not be comparable to those of the FDA. In Europe, our products are regulated primarily by country and community regulations of those countries within the European Economic Area and must conform to the requirements of those authorities.
The regulatory agencies regulate the testing, manufacturing, recordkeeping, storage, packaging, labeling, marketing, distribution, marketing, reporting, safety and import and export of medical supplies and devices. Certain international regulatory bodies also impose import restrictions, tariff regulations, duties and tax requirements. In general, unless an exemption applies, a medical device or product or service must receive regulatory approval or clearance before it can be marketed or sold. Delays in agency review can significantly delay new product introduction and may result in a product becoming “dated” or losing its market opportunity before it can be introduced. In addition, the FDA and other agency clearances generally are required before we can make significant modifications to existing products or market new claims or uses for existing products.
The FDA also has the authority to require a recall or modification of products in the event of a defect or other issues. The process of obtaining marketing clearances and approvals from regulatory agencies for new products (or modifications to, or additional claims or uses for, existing products) can be time consuming and expensive. There is no assurance that clearances or approvals will be granted or that agency review will not involve delays that would adversely affect our ability to commercialize our products.
During the past several years, the FDA, in accordance with its standard practice, has conducted a number of inspections of our manufacturing facilities to ensure compliance with regulatory standards relating to our testing, manufacturing, storage and packaging of products. On occasion, following an inspection, the FDA has called our attention to certain “Good Manufacturing Practices” compliance deficiencies.
If we fail to meet QSRs or violate applicable FDA, EPA or other laws or regulations or if any of our medical devices are found to be ineffective or pose an unreasonable health risk, or if we fail to adequately correct violations or comply with requests by regulatory agencies, we could be subject to reports or warning letters, citations and fines as well as additional regulatory action including an order to recall, replace, repair, or refund non-compliant medical devices. Further, regulatory agencies could detain or seize adulterated or misbranded medical devices, or ban such medical devices. The regulatory agencies may also impose operating restrictions, enjoin and/or restrain certain conduct resulting in violations of applicable law pertaining to medical devices, including a hold on approving new devices until issues are resolved to its satisfaction, and assess civil or criminal penalties against our officers, employees, or us. The regulatory agencies may also recommend prosecution to the DOJ.
Federal, state and foreign regulations regarding the manufacture and sale of our products are subject to change. We cannot predict what impact, if any, such changes might have on our business. In addition, there can be no assurance that regulation of our products will not become more restrictive in the future and that any such development would not have a material adverse effect on our business. For a more detailed discussion on government regulation and related risks, see “Business - Government Regulation.”
Our operations, products and services expose us to the risk of environmental, health and safety liabilities, costs and violations that could adversely affect our reputation and financial results.
Our operations, products and services are subject to environmental laws and regulations, which impose limitations on the discharge of pollutants into the environment and establish standards for the use, generation, treatment, storage and disposal of hazardous and non-hazardous wastes. We must also comply with various health and safety regulations in the United States and abroad in connection with our operations. We can give no assurance that our environmental, health and safety compliance programs have been or will at all times be effective. Failure to comply with any of these laws and regulations could result in civil and criminal, monetary and non-monetary penalties and damage to
25
our reputation. In addition, we cannot provide assurance that our costs of complying with current or future environmental protection and health and safety laws and regulations will not exceed our estimates or adversely affect our financial condition or results of operations.
In addition, we may incur costs related to remedial efforts or alleged environmental damage associated with past or current waste disposal practices or other hazardous materials handling practices. We are also from time to time party to personal injury or other claims brought by private parties alleging injury due to the presence of or exposure to hazardous substances. We may also become subject to additional remedial, compliance or personal injury costs due to future events such as changes in existing laws or regulations, changes in agency direction or enforcement policies, developments in remediation technologies, changes in the conduct of our operations and changes in accounting rules. We cannot assure you that any liabilities arising from past or future releases of, or exposures to, hazardous substances will not adversely affect our reputation or adversely affect our financial condition or results of operations.
Healthcare cost containment pressures and legislative or administrative reforms resulting in restrictive reimbursement practices of third-party payors or preferences for alternate therapies could decrease the demand for our products, the prices which customers are willing to pay for those products and the number of procedures performed using our devices, which could have an adverse effect on our business, financial condition or results of operations.
Many of our products are purchased by hospitals, physicians and other healthcare providers that typically bill various third-party payors, including governmental programs (e.g., Medicare and Medicaid), private insurance plans and managed care programs, for the healthcare services provided to their patients. The ability of customers to obtain appropriate reimbursement for their products and services from private and governmental third-party payors is critical to the success of medical device companies. The availability of reimbursement affects which products customers purchase and the prices they are willing to pay. Reimbursement varies from country to country and can significantly impact the acceptance of new products and services. Even if we offer a promising new product, we may find limited demand for the product unless reimbursement approval is obtained from private and governmental third-party payors. Further legislative or administrative reforms to the reimbursement systems in the U.S. and foreign countries in a manner that significantly reduces reimbursement for procedures using our medical devices or denies coverage for those procedures, including price regulation, competitive pricing, coverage and payment policies, comparative effectiveness of therapies, technology assessments and managed-care arrangements, could have a material adverse effect on our business, financial condition or results of operations.
Increases in interest rates may adversely affect our future results of operations.
At September 29, 2016, we had total outstanding borrowings of $171,000,000 under our existing credit facility that bore interest at rates that ranged from 2.02% to 2.83%. Interest rates on outstanding borrowings are variable and substantially all of our outstanding borrowings are typically under LIBOR contracts. Therefore, our future results of operations may be adversely affected if LIBOR interest rates on our outstanding balance were to increase substantially, as more fully explained in “Management’s Discussion and Analysis of Financial Condition and Results of Operations.”
Currency fluctuations and trade barriers could adversely affect our results of operations.
A portion of our products in all of our business segments are exported to and imported from a variety of geographic locations, and our business could be materially and adversely affected by the imposition of trade barriers, fluctuations in the rates of exchange of various currencies, tariff increases and import and export restrictions, affecting all of such geographies including but not limited to the United States, Canada, the European Union, the United Kingdom, Australia, and the Far East.
Changes in the value of the Euro, British Pound, Canadian dollar, Singapore dollar and Chinese Renminbi against the United States dollar affect our results of operations because certain cash bank accounts, accounts receivable and liabilities of Cantel and its subsidiaries are denominated and ultimately settled in United States dollars, Euros, British Pounds, Canadian dollars, Singapore dollars or Chinese Renminbi but must be converted into each entity’s functional currency. Furthermore, the financial statements of our Italy, the Netherlands, United Kingdom, Canada and
26
China subsidiaries are translated using the accounting policies described in Note 2 to the Consolidated Financial Statements and therefore are impacted by changes in the Euro, British Pound, Canadian dollar and Chinese Renminbi exchange rates relative to the United States dollar.
We may be exposed to product liability claims resulting from the use of products we sell and distribute.
We may be exposed to product liability claims resulting from the products we sell and distribute. We maintain product liability insurance, which we believe is adequate for our businesses. However, there can be no assurance that insurance coverage for these risks will continue to be available or, if available, that it will be sufficient to cover potential claims or that the present level of coverage will continue to be available at a reasonable cost. A partially or completely uninsured successful claim against us could have a material adverse effect on us.
We use chemicals and other regulated substances in the manufacturing of our products.
In the ordinary course of certain of our manufacturing processes, we use various chemicals and other regulated substances. Although we are not aware of any material claims involving violation of environmental or occupational health and safety laws or regulations, there can be no assurance that such a claim may not arise in the future, which could have a material adverse effect on us.
We rely on intellectual property and proprietary rights to maintain our competitive position.
We rely heavily on proprietary technology that we protect primarily through licensing arrangements, patents, trade secrets and proprietary know-how. There can be no assurance that any pending or future patent applications will be granted or that any current or future patents, regardless of whether we are an owner or a licensee of the patent, will not be challenged, rendered unenforceable, invalidated or circumvented or that the rights will provide a competitive advantage to us. There can also be no assurance that our trade secrets or non-disclosure agreements will provide meaningful protection of our proprietary information. There can also be no assurance that others will not independently develop similar technologies or duplicate any technology developed by us or that our technology will not infringe upon patents or other rights owned by others.
Breaches of our information technology systems could have a material adverse effect on our operations.
We rely on information technology systems to process, transmit, and store electronic information in our day-to-day operations. Our information technology systems have been subjected to computer viruses, or other malicious codes, and cyber or phishing attacks. Although past attacks did not have a significant adverse impact on our business, these types of attacks could result in our intellectual property and other confidential information being lost or stolen, disruption of our operations, or other negative consequences, such as increased costs for security measures or remediation costs, diversion of management attention and adverse impact on our relationships with vendors and customers. While we will continue to implement additional protective measures to reduce the risk of future cyber incidents, cyber attacks are becoming more sophisticated and frequent and the techniques used in such attacks change rapidly. There can be no assurances that our protective measures will prevent future attacks that could have a significant impact on our business.
If we are unable to retain key personnel, our business could be adversely affected.
Our success is dependent to a significant degree upon the efforts of key members of our management. Although none of our key executives has an employment agreement with the Company, each executive, including division CEOs, is party to a severance agreement with the Company. In addition, we have short and long term incentive plans for our key executives that are designed in part to have a retentive effect on the executives. However, there can be no assurance that the terms of the severance agreements or incentive plans will have such an effect. We believe the loss or unavailability of any such individuals could have a material adverse effect on our business. In addition, our success depends in large part on our ability to attract and retain highly qualified scientific, technical, sales, marketing and other personnel. Competition for such personnel is intense and there can be no assurance that we will be able to attract and retain the personnel necessary for the development and operation of our businesses.
27
Item 1B.UNRESOLVED STAFF COMMENTS.
None.
Item 2.PROPERTIES.
Owned Facilities
Our principal owned facilities include the following:
|
|
|
|
|
|
|
Principal Operating |
|
Location |
|
Purpose |
|
Square Footage |
|
Segment |
|
Plymouth, MN |
|
Executive, administrative and sales staff, research operations, manufacturing and warehousing |
|
110,000 |
|
Endoscopy, Dialysis, Water Purification and Filtration |
|
Plymouth, MN |
|
Manufacturing, warehousing and vacant land |
|
65,000 |
|
Endoscopy, Dialysis, Water Purification and Filtration |
|
Plymouth, MN |
|
Manufacturing, warehousing, administrative and sales staff |
|
43,000 |
|
Water Purification and Filtration |
|
Hauppauge, NY |
|
Executive, administrative and sales staff, manufacturing and warehousing |
|
65,000 |
|
Healthcare Disposables |
|
Buena Park, CA |
|
Warehousing and regeneration plan |
|
14,000 |
|
Water Purification and Filtration |
|
Conroe, TX |
|
Manufacturing, warehousing and administrative, sales and other staff |
|
60,000 |
|
Endoscopy |
|
Conroe, TX |
|
Manufacturing and vacant land |
|
12,000 |
|
Endoscopy |
|
Rush, NY |
|
Manufacturing, warehousing and administrative, sales and other staff |
|
38,000 |
|
Healthcare Disposables |
|
Pomezia, Italy |
|
Manufacturing, warehousing and administrative offices |
|
48,000 |
|
Endoscopy |
|
Southend-on-Sea, United Kingdom |
|
Manufacturing, warehousing and administrative offices |
|
49,500 |
|
Endoscopy |
28
Leased Facilities
Our principal leased facilities include the following:
|
|
|
|
|
|
|
Principal Operating |
|
Location |
|
Purpose |
|
Square Footage |
|
Segment |
|
Plymouth, MN |
|
Warehousing |
|
44,000 |
|
Various |
|
Hauppauge, NY |
|
Warehousing |
|
52,000 |
|
Healthcare Disposables |
|
Sharon, PA |
|
Manufacturing and warehousing |
|
50,000 |
|
Healthcare Disposables |
|
Santa Fe Springs, CA |
|
Manufacturing and warehousing |
|
32,000 |
|
Healthcare Disposables |
|
Lawrenceville, GA |
|
Manufacturing and warehousing |
|
41,000 |
|
Healthcare Disposables |
|
Cuba, NY |
|
Administrative offices, manufacturing, warehousing and laboratory |
|
19,000 |
|
Healthcare Disposables |
|
Burlington, Ontario |
|
Sales and administrative offices, research and engineering, manufacturing and warehousing |
|
22,000 |
|
Water Purification and Filtration |
|
Skippack, PA |
|
Sales and administrative offices, manufacturing, warehousing and regeneration plant |
|
23,000 |
|
Water Purification and Filtration |
|
Heerlen, the Netherlands |
|
Sales and service offices, warehouse and distribution hub |
|
26,000 |
|
Various |
|
Lowell, MA |
|
Sales and administrative offices, manufacturing, warehousing and regeneration plant |
|
26,000 |
|
Water Purification and Filtration |
|
Clevedon, United Kingdom |
|
Administrative offices, manufacturing and warehousing |
|
20,000 |
|
Endoscopy |
|
Conroe, TX |
|
Executive, sales and finance offices, research and development, training |
|
18,000 |
|
Endoscopy |
|
Mebane, NC |
|
Administrative offices and warehousing |
|
16,000 |
|
Water Purification and Filtration |
|
Phoenix, AZ |
|
Administrative offices and warehousing |
|
37,000 |
|
Healthcare Disposables |
|
Little Falls, NJ |
|
Corporate executive offices |
|
13,000 |
|
Cantel Medical Corp. |
In addition, we lease office and sales space in Singapore; Beijing, Shanghai and Guangzhou, China; Dubai, United Arab Emirates; Markham, Canada; and Hong Kong that is used for all of our operating segments.
We lease additional space for our Water Purification and Filtration segment in Concord, California; Golden, Colorado; Lakeland, Florida; Norcross, Georgia; Downers Grove, Illinois; Indianapolis, Indiana; Port Allen, Louisiana; Auburn Hills, Michigan; Ridgeland, Mississippi; Fairfield, New Jersey; Indian Trail, North Carolina; Raleigh, North Carolina; North Royalton, Ohio; Claremore, Oklahoma; Columbia, South Carolina; Memphis, Tennessee; Murfreesboro, Tennessee; Carrollton, Texas; San Antonio, Texas; South Houston, Texas; Mount Jackson, Virginia; South Kent, Washington; Toronto, Ontario; Montreal, Quebec; and Beirut, Lebanon. The Downers Grove, Norcross, Toronto and Montreal facilities serve as warehouses and regeneration plants, while the other locations are small storage facilities supporting local service operations.
29
We lease additional space for our Endoscopy segment in Stafford, United Kingdom; Forli, Italy; and Toulouse, France. The Stafford, United Kingdom facility is used for administrative offices, training, technical service and microbiology services, while the other locations provide warehousing and administrative offices.
We also lease additional space for our Healthcare Disposables segment in Englewood, Colorado that is used for administrative offices and laboratory services, and in Maumee, Ohio that is used for administrative offices.
Net rentals for leased space for fiscal 2016 aggregated $4,733,000 compared with $4,380,000 in fiscal 2015.
Item 3.LEGAL PROCEEDINGS.
In the normal course of business, we are subject to pending and threatened legal actions. It is our policy to accrue for amounts related to these legal matters if it is probable that a liability has been incurred and an amount of anticipated exposure can be reasonably estimated. We do not believe that any of these pending claims or legal actions will have a material effect on our business, financial condition, results of operations or cash flows.
Item 4.MINE SAFETY DISCLOSURES.
Not applicable.
30
PART II
Item 5.MARKET FOR REGISTRANT’S COMMON EQUITY, RELATED STOCKHOLDER MATTERS AND ISSUER PURCHASES OF EQUITY SECURITIES.
Our common stock trades on the New York Stock Exchange (NYSE) under the symbol “CMN.”
The following table sets forth, for the periods indicated, the high and low sales prices for the common stock as reported by the NYSE.
|
|
|
HIGH |
|
LOW |
|
||
|
|
|
|
|
|
|
|
|
|
Fiscal Year Ended July 31, 2016 |
|
|
|
|
|
|
|
|
First Quarter |
|
$ |
59.72 |
|
$ |
48.38 |
|
|
Second Quarter |
|
|
66.45 |
|
|
56.18 |
|
|
Third Quarter |
|
|
72.21 |
|
|
57.33 |
|
|
Fourth Quarter |
|
|
73.88 |
|
|
64.55 |
|
|
|
|
|
|
|
|
|
|
|
Fiscal Year Ended July 31, 2015 |
|
|
|
|
|
|
|
|
First Quarter |
|
$ |
42.40 |
|
$ |
33.81 |
|
|
Second Quarter |
|
|
45.02 |
|
|
40.57 |
|
|
Third Quarter |
|
|
49.35 |
|
|
41.38 |
|
|
Fourth Quarter |
|
|
55.68 |
|
|
44.73 |
|
During fiscal 2016, we paid semi-annual cash dividends totaling $0.12 per outstanding share of common stock, of which $0.06 per share was paid on each of January 29, 2016 and July 29, 2016. During fiscal 2015, we paid semi-annual cash dividends totaling $0.10 per outstanding share of common stock, of which $0.05 per share was paid on each of January 30, 2015 and July 31, 2015. Future declaration of dividends and the establishment of future record and payment dates are subject to the final determination of the Company’s Board of Directors. However, it is our current expectation that semi-annual cash dividends of at least $0.06 per common share will continue to be paid in the foreseeable future.
On August 31, 2016, the closing price of our common stock was $75.61 as reported by the NYSE and we had 396 record holders of common stock. A number of such holders of record are brokers and other institutions holding shares of common stock in “street name” for more than one beneficial owner.
The following table represents information with respect to purchases of common stock made by the Company during the fourth quarter of fiscal 2016:
|
|
|
|
|
|
|
|
Total number of shares |
|
Maximum number of |
|
|
Month |
|
|
|
|
|
|
purchased as part of |
|
shares that may yet |
|
|
of |
|
Total number of |
|
Average price |
|
publicly announced |
|
be purchased under |
|
|
|
Purchase |
|
shares purchased |
|
paid per share |
|
plans or programs |
|
the program |
|
|
|
|
|
|
|
|
|
|
|
|
|
|
|
May |
|
2,085 |
|
$ |
66.26 |
|
— |
|
— |
|
|
June |
|
98 |
|
|
72.29 |
|
— |
|
— |
|
|
July |
|
528 |
|
|
67.44 |
|
— |
|
— |
|
|
|
|
2,711 |
|
$ |
66.71 |
|
— |
|
— |
|
The Company does not currently have a repurchase program. All of the shares purchased during the fourth quarter of fiscal 2016 represent shares surrendered to the Company to pay employee withholding taxes due upon the vesting of restricted stock.
31
Stock Performance Graph
The following graph compares the cumulative total stockholder return on our common stock for the last five fiscal years with the cumulative total returns of the Russell 2000 index and the Dow Jones US Health Care Equipment & Services index over the same period (assuming an investment of $100 in our common stock and in each of the indexes on July 31, 2011, and where applicable, the reinvestment of all dividends).
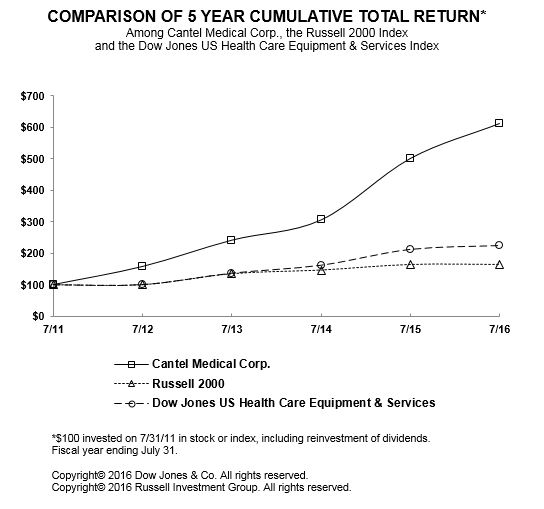
32
Item 6.SELECTED CONSOLIDATED FINANCIAL DATA.
The following selected financial data are derived from the financial statements of Cantel Medical Corp., which have been audited by Ernst & Young LLP, independent registered public accounting firm. The financial data in the following table is qualified in its entirety by, and should be read in conjunction with, the financial statements and notes thereto and other information incorporated by reference in this Form 10-K.
Consolidated Statements of Income Data
(Amounts in thousands, except per share data)
|
|
|
Year Ended July 31, |
|
|||||||||||||
|
|
|
2016 |
|
2015 |
|
2014 |
|
2013 |
|
2012 |
|
|||||
|
|
|
|
|
|
|
|
|
|
|
|
|
|
|
|
|
|
|
Net sales |
|
$ |
664,755 |
|
$ |
565,004 |
|
$ |
488,749 |
|
$ |
425,026 |
|
$ |
386,490 |
|
|
Cost of sales |
|
|
355,569 |
|
|
311,537 |
|
|
275,450 |
|
|
241,550 |
|
|
222,323 |
|
|
Gross profit |
|
|
309,186 |
|
|
253,467 |
|
|
213,299 |
|
|
183,476 |
|
|
164,167 |
|
|
|
|
|
|
|
|
|
|
|
|
|
|
|
|
|
|
|
|
Income from operations |
|
|
97,251 |
|
|
80,761 |
|
|
70,928 |
|
|
63,188 |
|
|
52,124 |
|
|
Interest expense, net |
|
|
3,320 |
|
|
2,364 |
|
|
2,317 |
|
|
2,834 |
|
|
3,650 |
|
|
Other expense |
|
|
— |
|
|
2,206 |
|
|
— |
|
|
— |
|
|
605 |
|
|
Income before income taxes |
|
|
93,931 |
|
|
76,191 |
|
|
68,611 |
|
|
60,354 |
|
|
47,869 |
|
|
Income taxes |
|
|
33,978 |
|
|
28,238 |
|
|
25,346 |
|
|
21,115 |
|
|
16,532 |
|
|
Net income |
|
$ |
59,953 |
|
$ |
47,953 |
|
$ |
43,265 |
|
$ |
39,239 |
|
$ |
31,337 |
|
|
|
|
|
|
|
|
|
|
|
|
|
|
|
|
|
|
|
|
Earnings per common share: |
|
|
|
|
|
|
|
|
|
|
|
|
|
|
|
|
|
Basic |
|
$ |
1.44 |
|
$ |
1.16 |
|
$ |
1.05 |
|
$ |
0.96 |
|
$ |
0.78 |
|
|
Diluted |
|
$ |
1.44 |
|
$ |
1.15 |
|
$ |
1.04 |
|
$ |
0.95 |
|
$ |
0.77 |
|
|
|
|
|
|
|
|
|
|
|
|
|
|
|
|
|
|
|
|
Dividends per common share |
|
$ |
0.12 |
|
$ |
0.10 |
|
$ |
0.09 |
|
$ |
0.07 |
|
$ |
0.06 |
|
|
|
|
|
|
|
|
|
|
|
|
|
|
|
|
|
|
|
|
Weighted average number of shares and common stock equivalents attributable to both common stock and participating securities |
|
|
|
|
|
|
|
|
|
|
|
|
|
|
|
|
|
Basic |
|
|
41,684 |
|
|
41,518 |
|
|
41,310 |
|
|
40,908 |
|
|
40,338 |
|
|
Diluted |
|
|
41,731 |
|
|
41,581 |
|
|
41,470 |
|
|
41,197 |
|
|
40,777 |
|
Consolidated Balance Sheets Data
(Amounts in thousands, except per share data)
|
|
|
July 31, |
|
|||||||||||||
|
|
|
2016 |
|
2015 |
|
2014 |
|
2013 |
|
2012 |
|
|||||
|
|
|
|
|
|
|
|
|
|
|
|
|
|
|
|
|
|
|
Total assets |
|
$ |
694,532 |
|
$ |
584,031 |
|
$ |
536,145 |
|
$ |
487,671 |
|
$ |
434,812 |
|
|
Current assets |
|
|
222,742 |
|
|
188,361 |
|
|
163,909 |
|
|
150,660 |
|
|
133,892 |
|
|
Current liabilities |
|
|
96,335 |
|
|
70,624 |
|
|
66,499 |
|
|
59,151 |
|
|
55,141 |
|
|
Working capital |
|
|
126,407 |
|
|
117,737 |
|
|
97,410 |
|
|
91,509 |
|
|
78,751 |
|
|
Long-term debt |
|
|
116,000 |
|
|
78,500 |
|
|
80,500 |
|
|
85,000 |
|
|
80,000 |
|
|
Stockholders’ equity |
|
|
454,370 |
|
|
406,633 |
|
|
365,246 |
|
|
321,132 |
|
|
275,936 |
|
|
Book value per outstanding common share |
|
$ |
10.89 |
|
$ |
9.77 |
|
$ |
8.81 |
|
$ |
7.81 |
|
$ |
6.79 |
|
|
Common shares outstanding |
|
|
41,708 |
|
|
41,604 |
|
|
41,442 |
|
|
41,138 |
|
|
40,651 |
|
33
Item 7.MANAGEMENT’S DISCUSSION AND ANALYSIS OF FINANCIAL CONDITION AND RESULTS OF OPERATIONS.
The following Management’s Discussion and Analysis of Financial Condition and Results of Operations (“MD&A”) is intended to help you understand Cantel Medical Corp. (“Cantel”). The MD&A is provided as a supplement to and should be read in conjunction with our financial statements and the accompanying notes. Our MD&A includes the following sections:
Overview provides a brief description of our business and a summary of significant activity that has affected or may affect our results of operations and financial condition.
Results of Operations provides a discussion of the consolidated results of operations for fiscal 2016 compared with fiscal 2015, and fiscal 2015 compared with fiscal 2014.
Liquidity and Capital Resources provides an overview of our working capital, cash flows, contractual obligations, financing and foreign currency activities.
Critical Accounting Policies provides a discussion of our accounting policies that require critical judgments, assumptions and estimates.
Overview
Cantel is a leading provider of infection prevention products and services in the healthcare market, specializing in the following operating segments:
|
· |
Endoscopy: Medical device reprocessing systems, disinfectants, detergents and other supplies used to high-level disinfect rigid endoscopes, flexible endoscopes and other instrumentation and disposable infection control products intended to reduce the challenges associated with proper cleaning and high-level disinfection of numerous reusable components used in gastrointestinal (“GI”) endoscopy procedures, pulmonary endoscopy and other procedures that require the reprocessing of medical equipment. In September 2015, this segment commenced the sale of endoscope transport and storage systems, and a number of endoscopy consumable accessories. Additionally, this segment includes technical maintenance service on its products. |
|
· |
Water Purification and Filtration: Water purification equipment and services, filtration and separation products, and disinfectant, sterilization and decontamination products and services for the medical, pharmaceutical, biotech, beverage and commercial industrial markets. |
|
· |
Healthcare Disposables: Single-use, infection prevention and control healthcare products including face masks, sterilization pouches, towels and bibs, tray covers, saliva ejectors, plastic cups, germicidal wipes and disinfectants, as well as a product for maintaining safe dental unit waterlines. This segment also manufactures and sells biological and chemical indicators for sterility assurance monitoring services in the acute-care, alternate-care, dental and industrial (medical device, life science and other manufacturers) markets. In August 2016, this segment commenced the manufacture and sale of nitrous oxide conscious sedation equipment and related single-use disposables. |
|
· |
Dialysis: Medical device reprocessing systems, sterilants/disinfectants, dialysate concentrates and other supplies for renal dialysis. |
In addition, we had another operating segment that was divested on April 7, 2015, known as Specialty Packaging, which comprised the Other reporting segment for financial reporting purposes, as further described in Note 19 to the Consolidated Financial Statements. Since the operating results of the Specialty Packaging segment were not significant in relation to our overall consolidated operating results, the divestiture of the business did not have a major effect on our operations and financial results, and accordingly, has not been classified as a discontinued operation for any of the periods presented.
34
Most of our equipment, consumables and supplies are used to help prevent the occurrence or spread of infections.
Significant Activity
|
(i) |
Some of our key financial results for fiscal 2016 compared with fiscal 2015 were as follows: |
|
· |
Net sales increased by 17.7% to $664,755,000 from $565,004,000; organic sales (i.e. excluding acquisitions, a divestiture and foreign currency translation) increased by 12.7%. |
|
· |
Gross profit as a percentage of net sales increased to 46.5% from 44.9%. |
|
· |
Net income under United States generally accepted accounting principles (“GAAP”) increased by 25.0% to $59,953,000 from $47,953,000. |
|
· |
After adjusting net income for amortization expense and atypical items, non-GAAP net income increased by 21.5% to $72,938,000 from $60,039,000, as further described and reconciled to net income in “Non-GAAP Financial Measures” in this MD&A. |
|
· |
Diluted Earnings Per Share (“EPS”) increased by 25.2% to $1.44 from $1.15. |
|
· |
Non-GAAP diluted EPS increased by 21.5% to $1.75 from $1.44, as further described and reconciled to diluted EPS in “Non-GAAP Financial Measures” in this MD&A. |
|
· |
Adjusted earnings before interest, taxes, depreciation, amortization and stock-based compensation expense (“Adjusted EBITDAS”) increased by 21.2% to $137,949,000 from $113,811,000, as further described and reconciled to net income in “Non-GAAP Financial Measures” in this MD&A. |
We continue to benefit from having a broad portfolio of infection prevention products and services sold into diverse business segments, where approximately 73% of our net sales are attributable to consumable products and service. The primary factors that contributed to this financial performance, as further described elsewhere in this MD&A, were as follows:
|
· |
significantly higher sales and profitability in our Endoscopy segment principally due to (i) increases in demand for endoscope reprocessing equipment, higher margin products such as disposable infection control products used in GI endoscopy procedures, and endoscope reprocessing disinfectants and service as a result of the increased field population of equipment and (ii) the inclusion of sales of recent acquisitions, |
|
· |
enhanced profitability in our Healthcare Disposables segment mainly due to (i) increased sales of higher margin products such as sterility assurance and waterline disinfection products, (ii) lower manufacturing costs and (iii) lower amortization expense, partially offset by elevated demand of our face masks and sterility assurance products in the first half of the prior year as a result of (a) customers buying products in advance of certain sales price increases and (b) customer response to the Ebola virus, |
|
· |
higher sales and improved profitability in our Dialysis segment primarily due to an increase in demand for our lower margin concentrate product, |
|
· |
the prior year loss on sale relating to the divestiture of our specialty packaging business, and |
|
· |
a lower effective tax rate due to the recording of certain atypical tax items, as further described within Non-GAAP Financial Measures elsewhere in this MD&A. |
35
The above factors were partially offset by:
|
· |
our strategic decision to invest in various growth initiatives designed to expand into new markets and gain or maintain market share in our three largest segments, |
|
· |
the impact of atypical items relating to acquisitions and costs associated with the retirement of our Chief Executive Officer, partially offset by the prior year atypical items, as further described within Non-GAAP Financial Measures elsewhere in this MD&A, and |
|
· |
an increase in interest expense due to the funding of acquisitions. |
|
(ii) |
We sell our dialysis products to a concentrated number of customers. Sales in our Dialysis segment have been adversely impacted in recent years by the decrease in demand for our products that are used by dialysis centers that reuse dialyzers, such as our sterilant products and RENATRON® reprocessing equipment. With the exception of the current year that had increased sales of low margin concentrate products, which are products not used in dialyzer reprocessing, this reduction in dialysis sales has reduced overall profitability in this segment relative to prior years. Our market for Dialysis reprocessing products is limited to dialysis centers that reuse dialyzers, which market has been decreasing in the United States despite the environmental advantages and our belief that the per-procedure cost of reuse dialyzers is more economical than single-use dialyzers. Based on discussions with customers, we expect the downward trend in reuse dialyzers in the United States will continue during fiscal 2017 and thereafter. A substantial reduction of our dialysis reuse business will likely have a significant adverse effect on our Dialysis segment and reduce our margins and net income in that segment as well as result in potential future impairments of long-lived assets. Such reduction would also adversely affect our consolidated results of operations. See “Risk Factors” elsewhere in this Form 10-K. |
|
(iii) |
In our current fiscal year, we acquired (i) all of the issued and outstanding stock of Medical Innovations Group Holdings Limited and certain affiliated companies (collectively, “MI”) on September 14, 2015 (the “MI Acquisition”) and (ii) certain net assets of North American Science Associates, Inc.’s Sterility Assurance Monitoring Products division (“NAMSA”) on March 1, 2016 (the “NAMSA Acquisition”), as more fully described in Note 3 to the Consolidated Financial Statements. Accordingly, the results of operations of MI and NAMSA are included in our consolidated results of operations for the portions of fiscal 2016 subsequent to their acquisition dates. The businesses of MI (the “MI Business”) and NAMSA (the “NAMSA Business”) are not included in our results of operations in fiscals 2015 and 2014. However, with the exception of acquisition related costs as more fully described in the Non-GAAP Financial Measures section below, their results of operations did not have a significant effect on our consolidated results of operations in fiscal 2016 due to the size of the businesses in relation to our overall consolidated results of operations. The MI Business is included in our Endoscopy segment and NAMSA Business is included in the Healthcare Disposables segment. Subsequent to the MI Acquisition, we changed the name of Medical Innovations Group Holdings Limited to Cantel (UK) Limited. |
|
(iv) |
In our prior fiscal year, we acquired (i) all of the issued and outstanding stock of MRLB International, Inc. (“MRLB”) on February 20, 2015 (the “DentaPure Acquisition”), (ii) certain net assets of Pure Water Solutions, Inc. (“PWS”) on January 1, 2015 (the “PWS Acquisition”) and (iii) all of the issued and outstanding stock of International Medical Service S.r.l. (“IMS”) on November 3, 2014 (the “IMS Acquisition”), as more fully described in Note 3 to the Consolidated Financial Statements. Accordingly, the results of operations of MRLB, PWS and IMS are included in our consolidated results of operations in fiscal 2016 and the portions of fiscal 2015 subsequent to their respective acquisition dates. Their results of operations are not included in our results in fiscal 2014. The businesses of MRLB (the “DentaPure Business”), PWS (the “PWS Business”) and IMS (the “IMS Business”) did not have a significant effect on our consolidated results of operations due to the size of the businesses in relation to our overall consolidated results of operations. The DentaPure Business is included in our Healthcare Disposables segment, the PWS Business is included in our Water Purification and Filtration segment and the IMS Business is included in our Endoscopy segment. Subsequent to the IMS Acquisition, we changed the name of International Medical Service S.r.l. to Cantel Medical (Italy) S.r.l. |
36
|
(v) |
In December 2015, a law was enacted that included a two-year moratorium on the medical device excise tax, which favorably impacts our gross profit, as more fully described elsewhere in this MD&A. |
|
(vi) |
On October 16, 2015, our Board of Directors approved a 20% increase in the semi-annual cash dividend to $0.06 per share of outstanding common stock, which was paid on each of January 29, 2016 and July 29, 2016, as more fully described elsewhere in this MD&A. |
Results of Operations
The results of operations described below reflect the operating results of Cantel and its wholly-owned subsidiaries.
The following table gives information as to the net sales by reporting segment and geography (which represents the geographic area from which the Company derives its net sales from external customers), as well as the related percentage of such sales to the total net sales.
|
|
|
|
|
|
|
|
|
|
|
|
|
|
|
|
|
Year Ended July 31, |
||||||||||
|
|
|
2016 |
|
2015 |
|
2014 |
||||||
|
|
|
(Dollar amounts in thousands) |
||||||||||
|
|
|
$ |
|
% |
|
$ |
|
% |
|
$ |
|
% |
|
Net Sales by Segment |
|
|
|
|
|
|
|
|
|
|
|
|
|
Endoscopy |
|
341,752 |
|
51.4 |
|
248,654 |
|
44.0 |
|
190,440 |
|
39.0 |
|
Water Purification and Filtration |
|
177,669 |
|
26.7 |
|
173,834 |
|
30.8 |
|
159,505 |
|
32.7 |
|
Healthcare Disposables |
|
112,584 |
|
17.0 |
|
106,920 |
|
18.9 |
|
101,809 |
|
20.8 |
|
Dialysis |
|
32,750 |
|
4.9 |
|
31,240 |
|
5.5 |
|
30,926 |
|
6.3 |
|
Other |
|
— |
|
— |
|
4,356 |
|
0.8 |
|
6,069 |
|
1.2 |
|
Total net sales |
|
664,755 |
|
100.0 |
|
565,004 |
|
100.0 |
|
488,749 |
|
100.0 |
|
|
|
|
|
|
|
|
|
|
|
|
|
|
|
Net Sales by Geography |
|
|
|
|
|
|
|
|
|
|
|
|
|
United States |
|
515,055 |
|
77.5 |
|
447,848 |
|
79.3 |
|
403,892 |
|
82.6 |
|
International |
|
149,700 |
|
22.5 |
|
117,156 |
|
20.7 |
|
84,857 |
|
17.4 |
|
Total net sales |
|
664,755 |
|
100.0 |
|
565,004 |
|
100.0 |
|
488,749 |
|
100.0 |
The following table gives information as to the amount of operating income, as well as operating income as a percentage of net sales, for each of our reporting segments.
|
|
|
Year Ended July 31, |
|
|||||||||||||
|
|
|
|
|
|
|
|
|
|
|
|
|
|
|
|
|
|
|
|
|
2016 |
|
2015 |
|
2014 |
|
|||||||||
|
|
|
(Dollar amounts in thousands) |
|
|||||||||||||
|
|
|
Operating |
|
% of |
|
Operating |
|
% of |
|
Operating |
|
% of |
|
|||
|
|
|
Income |
|
Net sales |
|
Income |
|
Net sales |
|
Income |
|
Net sales |
|
|||
|
|
|
|
|
|
|
|
|
|
|
|
|
|
|
|
|
|
|
Endoscopy |
|
$ |
61,021 |
|
17.9 |
% |
$ |
40,863 |
|
16.4 |
% |
$ |
34,194 |
|
18.0 |
% |
|
Water Purification and Filtration |
|
|
30,620 |
|
17.2 |
% |
|
30,606 |
|
17.6 |
% |
|
25,750 |
|
16.1 |
% |
|
Healthcare Disposables |
|
|
24,486 |
|
21.8 |
% |
|
19,904 |
|
18.6 |
% |
|
18,720 |
|
18.4 |
% |
|
Dialysis |
|
|
7,907 |
|
24.2 |
% |
|
6,749 |
|
21.6 |
% |
|
7,547 |
|
24.4 |
% |
|
Other |
|
|
— |
|
— |
% |
|
1,118 |
|
25.7 |
% |
|
815 |
|
13.4 |
% |
|
Operating income by segment |
|
|
124,034 |
|
18.7 |
% |
|
99,240 |
|
17.6 |
% |
|
87,026 |
|
17.8 |
% |
|
General corporate expenses |
|
|
(26,783) |
|
|
|
|
(18,479) |
|
|
|
|
(16,098) |
|
|
|
|
Income from operations |
|
$ |
97,251 |
|
14.6 |
% |
$ |
80,761 |
|
14.3 |
% |
$ |
70,928 |
|
14.5 |
% |
37
Fiscal 2016 compared with Fiscal 2015
Consolidated Results of Operations
Net Sales
Total net sales increased by $99,751,000 or 17.7%, to $664,755,000 in fiscal 2016 from $565,004,000 in fiscal 2015. The 17.7% increase in net sales for fiscal 2016 includes (i) an increase of 12.7% in organic sales, (ii) an increase of 5.5% in sales due to acquisitions, partially offset by the divestiture of our specialty packaging business, and (iii) a decrease of 0.5% in net sales due to foreign currency translation.
International net sales increased by $32,544,000, or 27.8%, to $149,700,000 in fiscal 2016 from $117,156,000 in fiscal 2015. The 27.8% increase in net sales consist of (i) an increase of 12.5% in organic sales, (ii) an increase of 17.5% in net sales due to acquisitions, and (iii) a decrease of 2.2% in net sales due to foreign currency translation.
The increase in both domestic and international organic net sales for fiscal 2016 was primarily attributable to increases in net sales of our endoscopy products and services due to increases in demand for (i) endoscope reprocessing equipment, (ii) higher margin products such as disposable infection control products used in GI endoscopy procedures, and (iii) endoscope reprocessing disinfectants and service as a result of the increased field population of equipment, as further described below in “Endoscopy Segment.”
Gross Profit
Gross profit increased by $55,719,000 or 22.0%, to $309,186,000 in fiscal 2016 from $253,467,000 in fiscal 2015. Gross profit as a percentage of net sales in fiscals 2016 and 2015 was 46.5% and 44.9%, respectively. Excluding the impact of acquisition accounting charges, gross profit as a percentage of net sales in fiscals 2016 and 2015 was 46.7% and 45.2%, respectively.
The higher gross profit as a percentage of net sales in fiscals 2016 and 2015 was primarily attributable to (i) more favorable sales mix due to increases in sales volume of certain products that carry higher gross margin percentages such as our procedure room products and disinfectants in our Endoscopy segment, sterility assurance and waterline disinfection products in our Healthcare Disposables segment and sterilants and filters in our Water Purification and Filtration segment, (ii) the inclusion of higher margin sales in our Endoscopy and Healthcare Disposables segments as a result of the MI and NAMSA Acquisitions, respectively, (iii) lower manufacturing costs and (iv) decrease of $2,334,000 in medical device excise tax due to the recent moratorium, as further explained below, partially offset by an increase in net sales of lower margin capital equipment primarily in our Endoscopy segment and higher charges for warranty primarily relating to our water purification equipment.
We cannot provide assurances that our gross profit percentage will not be adversely affected in the future (i) by uncertainties associated with our product mix, (ii) by price competition, or (iii) if raw materials and distribution costs increase and we are unable to implement offsetting price increases.
In December 2015, the Consolidated Appropriations Act of 2016 was signed into law and included a two-year moratorium effective January 1, 2016 on the medical device excise tax, which was a tax on medical device manufacturers in the form of a 2.3% excise tax on all U.S. medical device sales. A significant portion of our net sales are considered U.S. medical device sales and therefore our gross profit percentage will continue to be favorably impacted by this moratorium until the two-year moratorium expires. However, we are investing a significant portion of the savings from this moratorium into sales and marketing and product development initiatives.
Operating Expenses
Selling expenses increased by $18,275,000, or 22.6%, to $99,062,000 in fiscal 2016 from $80,787,000 in fiscal 2015. In fiscal 2016, selling expenses increased primarily due to (i) higher commission expense relating to increased net sales in our Endoscopy segment, (ii) increased sales and marketing initiatives to expand into new markets, including
38
international markets, and to gain or maintain market share by hiring and training additional sales and marketing personnel and increasing travel budgets in our Endoscopy, Water Purification and Filtration and Healthcare Disposables segments, (iii) the inclusion of selling and marketing expenses of acquisitions, and (iv) increases in annual salaries. These increases were partially offset by a decrease of $884,000 in selling expense for fiscal 2016 relating to our specialty packaging business divested in April 2015.
Selling expenses as a percentage of net sales were 14.9% in fiscal 2016 compared with 14.3% in fiscal 2015.
General and administrative expenses increased by $19,566,000, or 25.1%, to $97,463,000 in fiscal 2016 from $77,897,000 in fiscal 2015. General and administrative expenses increased primarily due to (i) the inclusion of general and administrative expenses of our acquisitions, (ii) the impact of atypical items relating to acquisitions and costs associated with the retirement of our Chief Executive Officer, partially offset by the prior year impairment of an acquired license, as further described below and within Non-GAAP Financial Measures elsewhere in this MD&A, and (iii) increases in annual salaries and incentive compensation including stock-based compensation.
Excluding (i) current and prior year amortization expense, (ii) current and prior year acquisition related items such as transaction and integration charges and fair value adjustments, (iii) current year costs associated with the retirement of our Chief Executive Officer and (iv) the prior year impairment of an acquired license, as further described within Non-GAAP Financial Measures elsewhere in this MD&A, general and administrative expenses increased by $14,880,000, or 23.3%, to $78,627,000 in fiscal 2016. Approximately a third of these increases are attributable to the inclusion of general and administrative expenses of our acquisitions.
General and administrative expenses as a percentage of net sales were 14.7% in fiscal 2016 compared with 13.8% in fiscal 2015.
Research and development expenses (which include continuing engineering costs) increased by $1,388,000, or 9.9%, to $15,410,000 in fiscal 2016 from $14,022,000 in fiscal 2015. The increase was primarily due to additional product development initiatives primarily in our Endoscopy segment, including the inclusion of projects relating to recent acquisitions.
Research and development expense as a percentage of net sales were 2.3% and 2.5% in fiscals 2016 and 2015, respectively.
Interest
Interest expense increased by $976,000 to $3,408,000 in fiscal 2016 from $2,432,000 in fiscal 2015, as a result of an increase in the average outstanding borrowings due to the funding of the MI and NAMSA Acquisitions in September 2015 and March 2016, respectively.
Interest income increased by $20,000 to $88,000 in fiscal 2016 from $68,000 in fiscal 2015.
39
Income Taxes
The decrease in the consolidated effective tax rate in fiscal 2016, compared with fiscal 2015, was due to the (i) adverse impact of the divesture of our specialty packaging business in the prior year and (ii) the favorable impact in the current year from the enactment of tax legislation in the United States and internationally, partially offset by higher non-deductible acquisition related items in fiscal 2016, as further described within Non-GAAP Financial Measures elsewhere in this MD&A. Additionally, the current year consolidated effective tax rate was favorably impacted by improved operating results of our international operations, which are located in lower tax rate jurisdictions. A reconciliation of the consolidated effective income rate for fiscals 2016 and 2015 is as follows:
|
|
|
Consolidated |
|
|
|
|
Effective |
|
|
|
|
Income Tax Rate |
|
|
Fiscal 2015 |
|
37.1 |
% |
|
Differential attributable to: |
|
|
|
|
Acquisition related items, net |
|
1.6 |
% |
|
Loss on sale of business |
|
(1.1) |
% |
|
New tax legislation |
|
(0.7) |
% |
|
International operations |
|
(0.6) |
% |
|
Other |
|
(0.1) |
% |
|
Fiscal 2016 |
|
36.2 |
% |
Endoscopy Segment
Net sales of endoscopy products and services increased by $93,098,000, or 37.4%, in fiscal 2016 compared with fiscal 2015. The 37.4% increase in net sales consist of (i) an increase of 28.0% in organic net sales, (ii) an increase of 10.2% in net sales due to acquisitions and (iii) decrease of 0.8% in net sales due to foreign currency translation. The increase in organic net sales was primarily due to increases in demand in the United States and internationally for our (i) procedure room products (disposable infection control products used in GI endoscopy procedures) due to sales and marketing efforts, (ii) endoscope reprocessing equipment due to our sales and marketing programs and (iii) disinfectants and service due to the increase in the installed base of endoscope reprocessing equipment. We expect sales of disinfectants, service, filters and equipment accessories, most of which carry higher margins, to continue to benefit as we increase the installed base of endoscope reprocessing equipment. These increases were partially offset by overall lower selling prices principally related to endoscopy reprocessing equipment and procedure room products as a result of our strategic growth plan and increased competition.
The Endoscopy segment’s operating income increased by $20,158,000, or 49.3%, in fiscal 2016 compared with fiscal 2015, primarily due to increases in sales in the United States and internationally for our endoscopy products and services, as further explained above, and to a much lesser extent, the inclusion of operating income from acquisitions. These items were partially offset by (i) higher commission expense and other incentive compensation, (ii) increased investment in our sales team and other selling initiatives, (iii) a net unfavorable impact from atypical items, as further described below and within Non-GAAP Financial Measures elsewhere in this MD&A and (iv) an increase in annual salaries. Excluding amortization expense as well as atypical items relating to current and prior year acquisition related items and a prior year license impairment, as further described within Non-GAAP Financial Measures elsewhere in this MD&A, the Endoscopy segment’s operating income increased by $21,746,000, or 44.4% in fiscal 2016 compared with fiscal 2015.
Water Purification and Filtration Segment
Net sales of water purification and filtration products and services increased by $3,835,000, or 2.2%, in fiscal 2016 compared with fiscal 2015. The 2.2% increase in net sales consist of (i) an increase of 1.0% in organic net sales, (ii) an increase of 1.6% in net sales due to acquisitions and (iii) decrease of 0.4% in net sales due to foreign currency translation. The increase in organic net sales was primarily due to an increase in demand for our (i) sterilants products, (ii) service and (iii) water purification equipment used for commercial and industrial (large capital) applications.
40
The Water Purification and Filtration segment’s operating income increased by $14,000, in fiscal 2016 compared with fiscal 2015, primarily as a result of higher sales, partially offset by increases in annual salaries, the hiring of additional sales personnel, increased travel budgets and higher charges for warranty related to our water purification equipment.
Healthcare Disposables Segment
Net sales of healthcare disposables products increased by $5,664,000, or 5.3%, in fiscal 2016 when compared with fiscal 2015. The 5.3% increase in net sales consist of (i) increase of 0.3% in organic net sales and (ii) increase of 5.0% in net sales due to acquisitions. Organic net sales for fiscal 2016 were similar to fiscal 2015 as the increase in sales of sterility assurance and waterline disinfection products in the current year were offset by the elevated demand during the first half of the prior year for our face masks and certain sterilization products as a result of (i) customers buying products in advance of certain sales price increases and (ii) customer response to the Ebola virus.
The Healthcare Disposables segment’s operating income increased by $4,582,000, or 23.0%, in fiscal 2016 compared with fiscal 2015, primarily due to (i) the inclusion of sales relating to acquisitions, (ii) less amortization expense and (iii) lower manufacturing costs, partially offset by increases to annual salaries and the hiring of additional sales personnel. Excluding amortization expense, and to a much lesser extent acquisition related items, as further described within Non-GAAP Financial Measures elsewhere in this MD&A, the Healthcare Disposables segment’s operating income increased by $2,857,000, or 11.6% in fiscal 2016 compared with fiscal 2015.
Dialysis Segment
Net sales of dialysis products and services increased by $1,510,000, or 4.8% in fiscal 2016 when compared with fiscal 2015, principally due to (i) an increase in demand for our concentrate product by a single customer, which demand is expected to decline in fiscal 2017, partially offset by a decrease in demand for our sterilant products and RENATRON® reprocessing equipment due to the market shift from reusable to single-use dialyzers, as further described below.
The Dialysis segment’s operating income increased by $1,158,000, or 17.2% in fiscal 2016 compared with fiscal 2015, primarily due to (i) an increase in sales for our low margin concentrate product to a single customer and (ii) successful cost control initiatives, partially offset by a decrease in demand for our higher margin sterilant products and RENATRON® reprocessing equipment.
With the exception of fiscal 2016 that had increased sales of low margin concentrate products, which is a product not used in dialyzer reprocessing, sales in our Dialysis segment in recent years have been adversely impacted by the decrease in demand for our sterilants and RENATRON® reprocessing equipment principally due to the shift from reusable to single-use dialyzers as a result of the declining cost of single-use dialyzers, the ease of using a dialyzer one time, and the commitment of Fresenius Medical Care, the largest dialysis provider chain in the United States and a manufacturer of single-use dialyzers, to convert dialysis clinics performing reuse to single-use facilities. In addition, DaVita, a customer who accounted for approximately 18.0% of net sales in this segment, has converted certain clinics from reuse to single-use and in many cases utilizes single-use when opening new clinics. Based on discussions with customers, we expect the downward trend in reuse dialyzers in the United States to continue during fiscal 2017 and thereafter. A substantial decrease in the market for reprocessing products is likely to result in a significant loss of net sales and a lower level of profitability and operating cash flow in this segment in the future as well as potential future impairments of long-lived assets. Such reduction would also adversely affect our consolidated results of operations. See “Risk Factors” elsewhere in this Form 10-K.
General Corporate Expenses
General corporate expenses relate to unallocated corporate costs primarily related to executive management personnel as well as costs associated with certain facets of our acquisition program and being a publicly traded company. Such expenses increased by $8,304,000, or 44.9% in fiscal 2016 compared with fiscal 2015, primarily due to (i) $3,487,000 of costs recorded in the second half of fiscal 2016 associated with the retirement of our Chief Executive
41
Officer, (ii) the addition of internal and external resources to address various growth initiatives and compliance requirements, (iii) increases in costs associated with our acquisition program and (iv) increases in annual salaries and incentive compensation, including stock-based compensation expense.
Fiscal 2015 compared with Fiscal 2014
Consolidated Results of Operations
Net Sales
Total net sales increased by $76,255,000, or 15.6%, to $565,004,000 in fiscal 2015 from $488,749,000 in fiscal 2014. Excluding the impact of recent acquisitions and the business divestiture, total organic sales increased by $44,179,000, or 9.2%. The increase in organic net sales for fiscal 2015 was primarily attributable to increases in net sales of our endoscopy and water purification and filtration products and services and healthcare disposables products, as further described below in “Endoscopy Segment,” “Water Purification and Filtration Segment” and “Healthcare Disposables Segment.”
International net sales increased by $32,299,000, or 38.1%, to $117,156,000 in fiscal 2015 from $84,857,000 in fiscal 2014. The increase in international net sales was primarily due to increases in net sales of endoscopy products and services in the United Kingdom and Italy as a result of the acquisitions of PuriCore and IMS. A significant portion of the net sales of the acquired United Kingdom business relates to product service, and therefore the acquisition was a significant reason for our worldwide product service net sales to increase by $17,130,000, or 31.6%, to $71,348,000 in fiscal 2015 from $54,218,000 in fiscal 2014.
Gross Profit
Gross profit increased by $40,168,000, or 18.8%, to $253,467,000 in fiscal 2015 from $213,299,000 in fiscal 2014. Gross profit as a percentage of net sales in fiscals 2015 and 2014 was 44.9% and 43.6%, respectively.
The higher gross profit as a percentage of net sales in fiscals 2015 and 2014, was primarily attributable to more favorable sales mix due to increases in sales volume of certain products that carry higher gross margin percentages such as our (i) sterilants, filters and procedure products in our Endoscopy segment, (ii) sterilants, filters and certain equipment products in our Water Purification and Filtration segment, and (iii) face masks, disinfectants, sterility assurance products and our acquired DentaPure products in our Healthcare Disposables segment. These items were partially offset by (i) acquisition accounting charges for fiscal 2015 of $1,981,000, relating to fair value adjustments of inventory and deferred revenue acquired in the acquisitions of DentaPure, IMS and PuriCore and (ii) the inclusion in our Endoscopy segment of the PuriCore Acquisition, which had a lower gross profit as a percentage of net sales. Excluding the impact of acquisition accounting charges, gross profit as a percentage of net sales in fiscals 2015 and 2014 were 45.2% and 43.6%, respectively.
Operating Expenses
Selling expenses increased by $14,268,000, or 21.5%, to $80,787,000 in fiscal 2015 from $66,519,000 in fiscal 2014 primarily due to (i) increased sales and marketing initiatives to expand into new markets, including international markets, and gain or maintain market share by hiring and training additional sales and marketing personnel and increasing travel budgets in our Endoscopy and Water Purification and Filtration segments and to a lesser extent, our Healthcare Disposables segment, (ii) the inclusion of selling and marketing expenses of DentaPure, PWS, IMS and PuriCore in fiscal 2015, (iii) higher commission expense principally in our Endoscopy segment as a result of higher sales and (iv) increases in annual salaries.
Selling expenses as a percentage of net sales were 14.3% in fiscal 2015 compared with 13.6% in fiscal 2014.
General and administrative expenses increased by $12,858,000, or 19.8%, to $77,897,000 in fiscal 2015 from $65,039,000 in fiscal 2014 primarily due to (i) the inclusion of general and administrative expenses of DentaPure, PWS
42
and IMS for the portion of fiscal 2015 subsequent to their acquisition dates, (ii) the inclusion of general and administrative expenses of Jet Prep, Sterilator and PuriCore for the portion of fiscal 2014 subsequent to their fiscal 2014 acquisition dates compared with twelve months of such expenses in fiscal 2015, (iii) an increase of $2,624,000 in intangible amortization as a result of acquisitions, (iv) an increase of $1,308,000 in acquisition related charges primarily in our Endoscopy segment, (v) a $1,287,000 asset impairment charge in fiscal 2015 relating to an acquired license in our Endoscopy segment, and (vi) increases in annual salaries and incentive compensation including stock-based compensation. These items were partially offset by a favorable net change of $2,804,000 in fiscal 2015 compared with fiscal 2014 for fair value adjustments of contingent liabilities primarily associated with the Jet Prep Acquisition in our Endoscopy segment, as further described elsewhere in this MD&A and in Notes 3 and 6 to the Consolidated Financial Statements, as well as fiscal 2014 costs associated with the retirement of our Chief Financial Officer. Excluding (i) current and prior year amortization expense, (ii) current and prior year significant acquisition related items such as transaction and integration charges and fair value adjustments, (iii) the current year impairment of an acquired license, and (iv) prior year costs associated with the retirement of our Chief Financial Officer, as further described within Non-GAAP Financial Measures elsewhere in this MD&A, general and administrative expenses increased by $11,087,000, or 21.1%, to $63,747,000 in fiscal 2015 from $52,660,000 in fiscal 2014.
General and administrative expenses as a percentage of net sales were 13.8% in fiscal 2015 compared with 13.3% in fiscal 2014.
Research and development expenses (which include continuing engineering costs) increased by $3,209,000, or 29.7%, to $14,022,000 in fiscal 2015 from $10,813,000 in fiscal 2014 primarily due to additional product development initiatives primarily in our Endoscopy segment, including the inclusion of projects relating to the acquired PuriCore and IMS businesses.
Research and development expense as a percentage of net sales were 2.5% and 2.2% in fiscals 2015 and 2014, respectively.
Interest
Interest expense increased by $52,000 to $2,432,000 from $2,380,000 in fiscal 2015, compared with fiscal 2014, as a result of an increase in the average outstanding borrowings due to the funding of acquisitions, partially offset by the recording of an $113,000 charge in fiscal 2014 for the ineffective hedge on our term credit facility and an $84,000 charge in fiscal 2014 to expense the remaining debt issuance costs on our term credit facility, as further explained in Note 5 to the Consolidated Financial Statements.
Interest income increased by $5,000 to $68,000 in fiscal 2015 from $63,000 in fiscal 2014.
Loss on Sale of Business
In fiscal 2015, we conducted a strategic review of our Specialty Packaging business and evaluated its potential value in the marketplace relative to the business’s historic and expected returns and concluded that the business was not part of our core strategy and could return a higher value to stockholders by its divestiture. Accordingly, our Specialty Packaging business (reported in the Other reporting segment) was classified as held-for-sale within our Condensed Consolidated Balance Sheet beginning October 31, 2014. Since the operating results of the Specialty Packaging segment, as shown in Note 18 to the Consolidated Financial Statements, were not significant in relation to our overall consolidated operating results, the lack of operating results from this business due to its divestiture did not have a major effect on our operations and financial results, and accordingly, has not been classified as a discontinued operation for any of the periods presented.
On April 7, 2015, we completed the sale of our Specialty Packaging business to a global packaging and service company by selling all the issued and outstanding stock of our Specialty Packaging subsidiary in exchange for $7,531,000 in cash proceeds, of which $660,000 is held in escrow for indemnity obligations, if any, until October 7, 2016 and is recorded in prepaid expenses and other current assets in our Consolidated Balance Sheet. In addition, we
43
incurred approximately $1,128,000 in costs associated with the disposition of this business including bonuses associated with the sale, accelerated stock-based compensation and to a lesser extent certain advisory fees. Furthermore as a result of this disposition, we recognized a foreign currency translation gain of $1,264,000 in our Consolidated Statement of Income, which was recorded in stockholders’ equity immediately preceding the disposition. Such foreign currency translation gain was a result of the monthly translation of the Specialty Packaging segment’s balance sheets beginning in 2004, when the business was acquired. In addition, due to the inability to currently deduct a capital loss and the uncertainty of utilizing a capital loss tax benefit in the future, a tax benefit was not recognized on a portion of the recorded loss on sale of the business. Overall, this transaction, including costs associated with the disposition and the recognition of a foreign currency translation gain, resulted in a $2,206,000 loss, or $0.04 in diluted earnings per share, which was recorded in loss on sale of business in our Consolidated Statements of Income for fiscal 2015. Such amount is subject to further adjustments for indemnity obligations, if any.
Income Taxes
A reconciliation of the consolidated effective income tax rate for fiscals 2015 and 2014 is as follows:
|
|
|
Consolidated |
|
|
|
|
Effective |
|
|
|
|
Income Tax Rate |
|
|
Fiscal 2014 |
|
36.9 |
% |
|
Differential attributable to: |
|
|
|
|
Loss on sale of business |
|
1.1 |
% |
|
Acquisition related items, net |
|
(2.3) |
% |
|
International operations |
|
1.2 |
|
|
Other |
|
0.2 |
% |
|
Fiscal 2015 |
|
37.1 |
% |
The consolidated effective tax rate in fiscal 2015 was adversely affected by initial operating losses of our international operations located in lower tax rate jurisdictions, as well as the $2,206,000 loss on sale of our Specialty Packaging business, as further described elsewhere in this MD&A and in Note 19 to the Consolidated Financial Statements. Due to the inability to currently deduct a capital loss and the uncertainty of utilizing a capital loss tax benefit in the future, a tax benefit was not recognized on a portion of the loss on sale of the Specialty Packaging business, thereby increasing our consolidated effective tax rate.
These unfavorable items were offset by the impact of recording acquisition related items consisting of net favorable acquisition related fair value adjustments recorded in general and administrative expenses relating to the Jet Prep Acquisition that were not tax effected due to the structure of the acquisition, partially offset by non-deductible acquisition related charges.
Endoscopy Segment
Net sales of endoscopy products and services increased by $58,214,000, or 30.6%, in fiscal 2015 compared with fiscal 2014, primarily due to increases in demand in the United States and internationally for our (i) disinfectants, service, equipment accessories and filters due to the increase in the installed base of endoscope reprocessing equipment, (ii) procedure room products (disposable infection control products used in GI endoscopy procedures) and (iii) endoscope reprocessing equipment. Additionally, the increase in fiscal 2015 was attributable to the inclusion of net sales generated in the United Kingdom and Italy as a result of acquiring PuriCore on June 30, 2014 and IMS on November 3, 2014. Excluding the incremental net sales provided by these acquisitions, organic net sales in our Endoscopy segment increased by 15.5% for fiscal 2015. These increases were partially offset by overall lower selling prices in most endoscopy product offerings totaling approximately $4,100,000 as a result of strategic growth programs and increased competition, as well as the adverse impact on international sales of a stronger dollar relative to the euro, which accounted for approximately a third of the lower selling prices.
44
The Endoscopy segment’s operating income increased by $6,669,000, or 19.5%, in fiscal 2015 compared with fiscal 2014 primarily due to increases in demand in the United States and internationally for our endoscopy products and services, as further explained above, and a favorable net change of $2,804,000 in general and administrative expenses relating to fair value contingent liabilities adjustments that were favorable in fiscal 2015 compared to moderately unfavorable in fiscal 2014, as further described Note 6 to the Consolidated Financial Statements. These items were partially offset by (i) increased investment in our sales team and other selling initiatives, (ii) lower selling prices of certain endoscopy products, (iii) an increase in acquisition related charges, (iv) increased research and development expenses due to additional product development initiatives, (v) increased intangible amortization as a result of acquisitions, (vi) a $1,287,000 asset impairment charge in fiscal 2015 relating to an acquired license, and (vii) increases in annual salaries and incentive compensation. Excluding the fair value adjustments, acquisition related charges and the asset impairment stated above and further described within Non-GAAP Financial Measures elsewhere in this MD&A, the Endoscopy segment’s operating income increased by $7,922,000, or 22.5% in fiscal 2015 compared with fiscal 2014.
Water Purification and Filtration Segment
Net sales of water purification and filtration products and services increased by $14,329,000, or 8.9%, in fiscal 2015 compared with fiscal 2014 primarily attributable to (i) higher sales of our capital equipment, consumables and service in the dialysis industry mainly attributable to our expanding service network as well as the increased overall demand driven by the growing number of dialysis patients and clinics in the United States and the increasing market acceptance of the disinfection efficacy and cost benefits of our heat sanitized water purification systems, which carry higher average selling prices than the systems with the traditional non-heated sanitization and to a much lesser extent (ii) the inclusion of net sales generated by the PWS Acquisition. Excluding net sales relating to the PWS Acquisition, organic net sales in our Water Purification and Filtration segment increased by 6.8% for fiscal 2015.
The Water Purification and Filtration segment’s operating income increased by $4,856,000, or 18.9%, in fiscal 2015 compared with fiscal 2014 primarily as a result of higher sales and improved gross profit percentage, as further explained above, partially offset by increases in annual salaries and the hiring of additional sales personnel.
Healthcare Disposables Segment
Net sales of healthcare disposables products increased by $5,111,000, or 5.0%, in fiscal 2015 compared with fiscal 2014 principally due to increases in customer demand in the United States for our face masks, ortho-phthalaldehyde (OPA)-based high-level disinfectant and sterility assurance products as well as the inclusion of net sales generated by the DentaPure Acquisition, which was completed on February 20, 2015. Excluding net sales relating to the DentaPure Acquisition, organic net sales in our Healthcare Disposables segment increased by 3.7% for fiscal 2015.
The Healthcare Disposables segment’s operating income increased by $1,184,000, or 6.3% in fiscal 2015 compared with fiscal 2014 primarily due to an increase in net sales, as further explained above, partially offset by (i) an increase of $280,000 of acquisition related charges primarily relating to the fair value adjustment of DentaPure’s inventory, (ii) the hiring of additional sales personnel, and (iii) annual salary raises. Excluding acquisition related charges further described within Non-GAAP Financial Measures elsewhere in this MD&A, the Healthcare Disposables segment’s operating income increased by $1,464,000, or 7.8% in fiscal 2015 compared with fiscal 2014.
Dialysis Segment
The Dialysis segment’s operating income decreased by $798,000, or 10.6%, in fiscal 2015 compared with fiscal 2014 primarily due to a decrease in demand for our sterilant product and RENATRON® dialyzer reprocessing equipment, partially offset by an increase in demand for our low margin concentrate product. See “Risk Factors” elsewhere in this form 10-K.
45
Specialty Packaging
The operating income of our Specialty Packaging business, which was reported in the Other reporting segment and divested on April 7, 2015, as further described elsewhere in this MD&A and in Note 19 to the Consolidated Financial Statements, increased by $303,000 for the portion of fiscal 2015 prior to its divestiture compared with fiscal 2014 primarily due to an increase in demand for our specialty packaging products resulting from the Ebola virus as well as recording foreign exchange gains associated with translating certain United States dollar denominated assets into our subsidiary’s functional currency, the Canadian dollar.
General Corporate Expenses
General corporate expenses relate to unallocated corporate costs primarily related to executive management personnel, costs associated with certain facets of our acquisition program and being a publicly traded company. Such expenses increased by $2,381,000, or 14.8%, in fiscal 2015 compared with fiscal 2014 primarily due to (i) the addition of internal and external resources to address various growth initiatives and compliance requirements, (ii) costs associated with the retirement of our Chief Financial Officer and recruiting of executive personnel, (iii) increases in costs associated with our acquisition program, and (iv) increases in annual salaries and stock-based compensation.
Non-GAAP Financial Measures
In evaluating our operating performance, we supplement the reporting of our financial information determined under accounting principles generally accepted in the United States (“GAAP”) with certain internally driven non-GAAP financial measures, namely (i) non-GAAP net income, (ii) non-GAAP diluted earnings per share (“EPS”), (iii) income before interest, taxes, depreciation, amortization and stock-based compensation expense (“EBITDAS”), (iv) EBITDAS adjusted for atypical items (“Adjusted EBITDAS”), (v) net debt and (vi) organic sales. These non-GAAP financial measures are indicators of the Company’s performance that are not required by, or presented in accordance with, GAAP. They are presented with the intent of providing greater transparency to financial information used by us in our financial analysis and operational decision-making. We believe that these non-GAAP measures provide meaningful information to assist investors, shareholders and other readers of our Consolidated Financial Statements in making comparisons to our historical operating results and analyzing the underlying performance of our results of operations. These non-GAAP financial measures are not intended to be, and should not be, considered separately from, or as an alternative to, the most directly comparable GAAP financial measures.
We define non-GAAP net income and non-GAAP diluted EPS as net income and diluted EPS, respectively, adjusted to exclude amortization, acquisition related items, significant reorganization and restructuring charges, major tax events and other significant items management deems atypical or non-operating in nature.
For fiscal 2016, we made adjustments to net income and diluted EPS to exclude (i) amortization expense, (ii) significant acquisition related items impacting current operating performance including transaction and integration charges and ongoing fair value adjustments, (iii) costs associated with the retirement of our Chief Executive Officer and (iv) the impact of favorable tax legislation to arrive at our non-GAAP financial measures, non-GAAP net income and non-GAAP diluted EPS.
For fiscal 2015, we made adjustments to net income and diluted EPS to exclude (i) amortization expense, (ii) significant acquisition related items impacting current operating performance including transaction and integration charges and ongoing fair value adjustments, (iii) the loss on sale of our Specialty Packaging business and (iv) the impairment of an acquired license to arrive at our non-GAAP financial measures, non-GAAP net income and non-GAAP diluted EPS.
For fiscal 2014, we made adjustments to net income and diluted EPS to exclude (i) amortization expense, (ii) significant acquisition related items impacting current operating performance primarily relating to transaction charges and ongoing fair value adjustments, and (iii) costs associated with the retirement of our Chief Financial Officer to arrive at our non-GAAP financial measures.
46
Amortization expense is a non-cash expense related to intangibles that were primarily the result of business acquisitions. Our history of acquiring businesses has resulted in significant increases in amortization of intangible assets that reduced the Company’s net income. The removal of amortization from our overall operating performance helps in assessing our cash generated from operations including our return on invested capital, which we believe is an important analysis for measuring our ability to generate cash and invest in our continued growth.
Acquisition related items consist of (i) fair value adjustments to contingent consideration and other contingent liabilities resulting from acquisitions, (ii) due diligence, integration, legal fees and other transaction costs associated with our acquisition program and (iii) acquisition accounting charges for the amortization of the initial fair value adjustments of acquired inventory and deferred revenue. The adjustments of contingent consideration and other contingent liabilities are periodic adjustments to record such amounts at fair value at each balance sheet date. Given the subjective nature of the assumptions used in the determination of fair value calculations, fair value adjustments may potentially cause significant earnings volatility that are not representative of our operating results. Similarly, due diligence, integration, legal and other acquisition costs associated with our acquisition program, including acquisition accounting charges relating to recording acquired inventory and deferred revenue at fair market value, can be significant and also adversely impact our effective tax rate as certain costs are often not tax-deductible. Since all of these acquisition related items are atypical and often mask underlying operating performance, we excluded these amounts for purposes of calculating these non-GAAP financial measures to facilitate an evaluation of our current operating performance and a comparison to past operating performance.
In fiscal 2016, we announced the retirement plans of our Chief Executive Officer and recorded the majority of the costs associated with his retirement in our Consolidated Financial Statements. Since these costs are atypical and masks our underlying operating performance, we made an adjustment to our net income and EPS for fiscal 2016 to exclude such costs to arrive at our non-GAAP financial measures.
Tax legislation was enacted in the United States and internationally that enabled us to record favorable tax benefits in our second quarter of fiscal 2016 relating to the entire calendar 2015. Since these favorable tax benefits are largely unrelated to our current year’s income before taxes and is unrepresentative of our normal effective tax rate, we excluded its impact on net income and EPS for fiscal 2016 for purposes of calculating these non-GAAP financial measures to facilitate an evaluation of our current performance and a comparison to past performance.
On April 7, 2015, we completed the sale of our Specialty Packaging business to a global packaging and service company, as further described elsewhere in this MD&A and in Note 19 to the Consolidated Financial Statements. Overall, this transaction, including costs associated with the disposition and the recognition of a foreign currency translation gain, resulted in a $2,206,000 loss, or $0.04 in diluted earnings per share, which was recorded in loss on sale of business in our Consolidated Statements of Income. Since the divestiture of a business is atypical and non-operating in nature and the loss on sale masks our underlying operating performance, we excluded the loss on sale of business for purposes of calculating these non-GAAP financial measures for fiscal 2015.
In September 2013, we acquired a license from a third party granting us the exclusive right to manufacture, commercialize, distribute and sell an endoscopy product in its beginning stage of commercialization in exchange for a series of payments, which totaled $1,000,000 by our second quarter of fiscal 2015 and was recorded in other assets in our Consolidated Balance Sheets. We evaluated this long-lived asset in fiscal 2015 for potential impairment and determined that the future use of this acquired license was unlikely based on a recent product analysis. Accordingly, we deemed the acquired license, together with related fixed assets of $287,000 to be fully impaired and recorded a loss of $1,287,000 during fiscal 2015, which was recorded in general and administrative expenses and as reductions in other assets and property and equipment in the Consolidated Financial Statements. Since the acquisition of the license and subsequent impairment were outside our standard endoscopy business operations, we excluded the impairment of the acquired license for purposes of calculating these non-GAAP financial measures to facilitate an evaluation of our current operating performance and a comparison to past operating performance.
47
The reconciliations of net income to non-GAAP net income were calculated as follows:
|
|
|
July 31, |
|
|||||||
|
(Amounts in Thousands) |
|
2016 |
|
2015 |
|
2014 |
|
|||
|
|
|
|
|
|
|
|
|
|
|
|
|
Net income, as reported |
|
$ |
59,953 |
|
$ |
47,953 |
|
$ |
43,265 |
|
|
Intangible amortization (1) |
|
|
13,095 |
|
|
13,265 |
|
|
10,641 |
|
|
Acquisition related items (2) |
|
|
3,213 |
|
|
1,579 |
|
|
1,150 |
|
|
CEO retirement costs (1) |
|
|
3,487 |
|
|
— |
|
|
— |
|
|
CFO retirement costs (1) |
|
|
— |
|
|
— |
|
|
589 |
|
|
Loss on sale of business |
|
|
— |
|
|
2,206 |
|
|
— |
|
|
Impairment of acquired license (1) |
|
|
— |
|
|
1,287 |
|
|
— |
|
|
Income tax benefit on above adjustments (3) |
|
|
(6,010) |
|
|
(6,251) |
|
|
(4,261) |
|
|
Tax legislative changes (3) |
|
|
(800) |
|
|
— |
|
|
— |
|
|
Non-GAAP net income |
|
$ |
72,938 |
|
$ |
60,039 |
|
$ |
51,384 |
|
|
(1) |
Amounts are recorded in general and administrative expenses. |
|
(2) |
In fiscal 2016, acquisition related items of $959 and $2,254 were recorded in cost of sales and general administrative expenses, respectively. In fiscal 2015, acquisition related items of $1,981 and ($402) were recorded in cost of sales and general administrative expenses, respectively. In fiscal 2014, all acquisition related items were recorded in general and administrative expenses. |
|
(3) |
Amounts are recorded in income taxes. |
The reconciliations of diluted EPS to adjusted diluted EPS were calculated as follows:
|
|
|
July 31, |
|
|||||||
|
|
|
2016 |
|
2015 |
|
2014 |
|
|||
|
|
|
|
|
|
|
|
|
|
|
|
|
Diluted EPS, as reported |
|
$ |
1.44 |
|
$ |
1.15 |
|
$ |
1.04 |
|
|
Intangible amortization, net of tax |
|
|
0.22 |
|
|
0.21 |
|
|
0.16 |
|
|
Acquisition related items, net of tax |
|
|
0.06 |
|
|
0.02 |
|
|
0.02 |
|
|
CEO retirement costs, net of tax |
|
|
0.05 |
|
|
— |
|
|
— |
|
|
CFO retirement costs, net of tax |
|
|
— |
|
|
— |
|
|
0.01 |
|
|
Loss on sale of business, net of tax |
|
|
— |
|
|
0.04 |
|
|
— |
|
|
Impairment of acquired license, net of tax |
|
|
— |
|
|
0.02 |
|
|
— |
|
|
Tax legislative changes |
|
|
(0.02) |
|
|
— |
|
|
— |
|
|
Adjusted diluted EPS |
|
$ |
1.75 |
|
$ |
1.44 |
|
$ |
1.24 |
(1) |
|
(1) |
The summation of each diluted EPS does not equal the adjusted diluted EPS due to rounding. |
We believe EBITDAS is an important valuation measurement for management and investors given the increasing effect that non-cash charges, such as stock-based compensation, amortization related to acquisitions and depreciation of capital equipment, has on the Company’s net income. In particular, acquisitions have historically resulted in significant increases in amortization of intangible assets that reduce the Company’s net income. Additionally, we regard EBITDAS as a useful measure of operating performance and cash flow before the effect of interest expense and is a complement to operating income, net income and other GAAP financial performance measures.
We define Adjusted EBITDAS as EBITDAS excluding the same atypical items as previously described as adjustments to net income. We use Adjusted EBITDAS when evaluating the operating performance of the Company because we believe the exclusion of such atypical items, of which a significant portion are non-cash items, is necessary to provide the most accurate measure of on-going core operating results and to evaluate comparative results period over period.
48
The reconciliations of net income to EBITDAS and Adjusted EBITDAS were calculated as follows:
|
|
|
|
|
|
|
||||
|
|
|
July 31, |
|||||||
|
(Amounts in Thousands) |
|
2016 |
|
2015 |
|
2014 |
|||
|
|
|
|
|
|
|
|
|
|
|
|
Net income, as reported |
|
$ |
59,953 |
|
$ |
47,953 |
|
$ |
43,265 |
|
|
|
|
|
|
|
|
|
|
|
|
Interest expense, net |
|
|
3,320 |
|
|
2,364 |
|
|
2,317 |
|
Income taxes |
|
|
33,978 |
|
|
28,238 |
|
|
25,346 |
|
Depreciation |
|
|
11,989 |
|
|
10,692 |
|
|
8,245 |
|
Amortization |
|
|
13,095 |
|
|
13,265 |
|
|
10,641 |
|
Loss on disposal of fixed assets |
|
|
553 |
|
|
360 |
|
|
501 |
|
Stock-based compensation expense |
|
|
8,361 |
|
|
5,867 |
|
|
5,409 |
|
|
|
|
|
|
|
|
|
|
|
|
EBITDAS |
|
|
131,249 |
|
|
108,739 |
|
|
95,724 |
|
|
|
|
|
|
|
|
|
|
|
|
Acquisition related items |
|
|
3,213 |
|
|
1,579 |
|
|
1,150 |
|
CEO retirement costs |
|
|
3,487 |
|
|
— |
|
|
— |
|
CFO retirement costs |
|
|
— |
|
|
— |
|
|
589 |
|
Loss on sale of business |
|
|
— |
|
|
2,206 |
|
|
— |
|
Impairment of acquired license |
|
|
— |
|
|
1,287 |
|
|
— |
|
|
|
|
|
|
|
|
|
|
|
|
Adjusted EBITDAS |
|
$ |
137,949 |
|
$ |
113,811 |
|
$ |
97,463 |
We define net debt as long-term debt less cash and cash equivalents. Each of the components of net debt appears in the Consolidated Balance Sheets. We believe that the presentation of net debt provides useful information to investors because we review net debt as part of our management of our overall liquidity, financial flexibility, capital structure and leverage.
The reconciliations of debt to net debt were calculated as follows:
|
|
|
July 31, |
|||||||
|
(Amounts in Thousands) |
|
2016 |
|
2015 |
|
2014 |
|||
|
|
|
|
|
|
|
|
|
|
|
|
Long-term debt |
|
$ |
116,000 |
|
$ |
78,500 |
|
$ |
80,500 |
|
Less cash and cash equivalents |
|
|
(28,367) |
|
|
(31,720) |
|
|
(31,781) |
|
Net debt |
|
$ |
87,633 |
|
$ |
46,780 |
|
$ |
48,719 |
The increase in net debt was the result of an increase in the average outstanding borrowings due to the funding of the MI Acquisition in September 2015 and the NAMSA Acquisition in March 2016, partially offset by repayments.
We define organic sales as net sales, calculated according to United States GAAP, less (i) the impact of foreign currency translation and (ii) net sales related to acquired businesses during the first twelve months of ownership and divestures during the periods being compared. We believe that reporting organic sales provides useful information to investors by helping identify underlying growth trends in our business and facilitating easier comparisons of our revenue performance with prior periods. We exclude the effect of foreign currency translation from organic sales because foreign currency translation is not under management’s control, is subject to volatility and can obscure underlying business trends. We exclude the effect of acquisitions because the nature, size, and number of acquisitions can vary dramatically from period to period and can obscure underlying business trends and make comparisons of financial performance difficult. The reconciliation of net sales to organic sales can be found elsewhere in this MD&A in “Fiscal 2016 compared with Fiscal 2015.”
49
Liquidity and Capital Resources
Working Capital
At July 31, 2016, our working capital was $126,407,000, compared with $117,737,000 at July 31, 2015. The increase was primarily due to the impact of the MI and NAMSA Acquisitions as well as the sale of our Specialty Packaging business.
Cash Flows from Operating, Investing and Financing Activities
The following table shows significant components of our cash flows for fiscals 2016, 2015 and 2014.
|
|
|
|
|
|
|
|
|
|
|
|
|
|
|
July 31, |
|
|||||||
|
(Amounts in Thousands) |
|
2016 |
|
2015 |
|
2014 |
|
|||
|
|
|
|
|
|
|
|
|
|
|
|
|
Net cash provided by operating activities |
|
$ |
80,268 |
|
$ |
59,070 |
|
$ |
64,272 |
|
|
Net cash used in investing activities |
|
$ |
(112,982) |
|
$ |
(52,294) |
|
$ |
(47,432) |
|
|
Net cash provided by (used in) financing activities |
|
$ |
29,942 |
|
$ |
(6,105) |
|
$ |
(18,949) |
|
Cash Flows from Operating Activities
Net cash provided by operating activities increased by $21,198,000, or 35.9%, in fiscal 2016 compared with fiscal 2015, primarily due to the increase in net income (after adjusting for depreciation, amortization, stock-based compensation expense, fair value adjustments of acquisition related liabilities, loss on sale of business, impairment of assets and deferred income taxes) and increases in accounts payable and other current liabilities (due to the timing of payments), partially offset by increases in inventories (due to planned strategic increases in stock levels of certain products primarily in our Endoscopy segment) and accounts receivables (due to strong sales of endoscopy products and services).
Net cash provided by operating activities decreased by $5,202,000, or 8.1%, in fiscal 2015 compared with fiscal 2014 primarily due to planned strategic increases in stock levels of certain products maintained in inventory primarily in our Endoscopy segment and the repayment of liabilities acquired in conjunction with the IMS Acquisition, partially offset by the increase in net income (after adjusting for depreciation, amortization, stock-based compensation expense, loss on sale of business, impairment of assets, fair value adjustments of acquisition related liabilities and deferred income taxes).
Cash Flows from Investing Activities
Net cash used in investing activities increased by $60,688,000, or 116.1%, in fiscal 2016 compared with fiscal 2015 primarily due to an increase in cash consideration paid for acquisitions.
Net cash used in investing activities increased by $4,862,000, or 10.3%, in fiscal 2015 compared with fiscal 2014 primarily due to an increase in cash consideration paid for acquisitions.
Cash Flows from Financing Activities
In fiscal 2016, net cash provided by financing activities was $29,942,000, compared with $6,105,000 used in financing activities in fiscal 2015. The fiscal 2016 net cash provided by financing activities was primarily due to borrowings under our revolving credit facility to fund the MI and NAMSA Acquisitions, partially offset by repayments under our credit facility.
In fiscal 2015, net cash used in financing activities was primarily due to repayments under our credit facility, partially offset by borrowings under our revolving credit facility to fund the acquisitions of IMS, PWS and DentaPure acquisitions.
50
In fiscal 2014, net cash used in financing activities was primarily due to repayments under our credit facilities, partially offset by borrowings under our revolving credit facility for the PuriCore Acquisition.
Cash Dividends
In fiscal 2016, our Board of Directors approved a 20% increase in the semi-annual cash dividend to $0.06 per share of outstanding common stock, which was paid on each of January 29, 2016 and July 29, 2016 and totaled $5,005,000.
In fiscal 2015, our Board of Directors approved an 11.1% increase in the semi-annual cash dividend to $0.05 per share of outstanding common stock, which was paid on each of January 30, 2015 and July 31, 2015 and totaled $4,154,000.
In fiscal 2014, our Board of Directors approved a 22.0% increase in the semi-annual cash dividend to $0.045 per share of outstanding common stock, which was paid on each of January 31, 2014 and July 31, 2014 and totaled $3,721,000.
Future declaration of dividends and the establishment of future record and payment dates are subject to the final determination of the Company’s Board of Directors.
Long-Term Contractual Obligations
As of July 31, 2016, aggregate annual required payments over the next five years and thereafter under our contractual obligations that have long-term components are as follows:
|
|
|
Year Ended July 31, |
|
||||||||||||||||||
|
|
|
(Amounts in thousands) |
|
||||||||||||||||||
|
|
|
2017 |
|
2018 |
|
2019 |
|
2020 |
|
2021 |
|
Thereafter |
|
Total |
|
||||||
|
|
|
|
|
|
|
|
|
|
|
|
|
|
|
|
|
|
|
|
|
|
|
|
Maturity of the credit facility |
$ |
— |
|
$ |
— |
|
$ |
116,000 |
|
$ |
— |
|
$ |
— |
|
$ |
— |
|
$ |
116,000 |
|
|
Expected interest payments under the credit facility (1) |
|
2,598 |
|
|
2,599 |
|
|
1,516 |
|
|
— |
|
|
— |
|
|
— |
|
|
6,713 |
|
|
Minimum commitments under noncancelable operating leases |
|
6,139 |
|
|
5,241 |
|
|
4,211 |
|
|
2,989 |
|
|
2,180 |
|
|
3,408 |
|
|
24,168 |
|
|
Compensation agreements (2) |
|
10,470 |
|
|
2,519 |
|
|
498 |
|
|
498 |
|
|
377 |
|
|
583 |
|
|
14,945 |
|
|
Assumed contingent liability (3) |
|
19 |
|
|
93 |
|
|
188 |
|
|
246 |
|
|
280 |
|
|
439 |
|
|
1,265 |
|
|
Contingent guaranteed obligation (4) |
|
186 |
|
|
133 |
|
|
122 |
|
|
— |
|
|
— |
|
|
— |
|
|
441 |
|
|
Other long-term obligations |
|
228 |
|
|
200 |
|
|
96 |
|
|
12 |
|
|
3 |
|
|
— |
|
|
539 |
|
|
Total contractual obligations |
$ |
19,640 |
|
$ |
10,785 |
|
$ |
122,631 |
|
$ |
3,745 |
|
$ |
2,840 |
|
$ |
4,430 |
|
$ |
164,071 |
|
|
(1) |
Primarily to fund the cash consideration paid and the costs associated with the Accutron and Vantage Acquisitions, we borrowed $55,000,000 in August 2016 and $6,000,000 in September 2016, respectively, under our revolving credit facility, and repaid $6,000,000, therefore increasing the 2019 maturities of the credit facility from $116,000,000 at July 31, 2016 to $171,000,000 at September 29, 2016. Accordingly, the expected interest payments under the credit facility will be approximately $1,232,000 higher on an annualized basis as of September 29, 2016 than the amounts shown herein. The expected interest payments under our credit facility reflect an interest rate of 2.24%, which was our weighted average interest rate on outstanding borrowings at July 31, 2016. |
|
(2) |
Amounts include $4,500,000, of which $3,823,000 is payable in fiscal 2017, due to the planned retirement of our former CEO. Effective August 1, 2016 in conjunction with the Accutron Acquisition, we entered into additional compensation agreements which would increase fiscal years 2017 and 2018 by $400,000 each compared to amounts shown herein. |
51
|
(3) |
These future potential payments of an assumed contingent liability relate to the Jet Prep Acquisition, as further explained below, and are reflected in the July 31, 2016 Consolidated Balance Sheet at its net present value of $1,138,000 using a discount rate of 2.5%. |
|
(4) |
These future potential payments of a contingent guaranteed obligation relate to Cantel Medical (UK), as further explained below. |
Credit Facility and Interest Rate Market Risk
On March 4, 2014, we entered into a $250,000,000 Third Amended and Restated Credit Agreement (the “2014 Credit Agreement”). The 2014 Credit Agreement includes a five-year $250,000,000 senior secured revolving facility with sublimits of up to $100,000,000 for borrowings in foreign currencies, $30,000,000 for letters of credit and $10,000,000 for swing line loans (the “2014 Revolving Credit Facility”). Subject to the satisfaction of certain conditions precedent including the consent of the lenders, the Company may from time to time increase the 2014 Revolving Credit Facility by an aggregate amount not to exceed $100,000,000. The senior lenders include Bank of America N.A. (the lead bank and administrative agent), PNC Bank, National Association, and Wells Fargo Bank, National Association. The 2014 Credit Agreement expires on March 4, 2019. Additionally, subject to certain restrictions and conditions (i) any of our domestic or foreign subsidiaries may become borrowers and (ii) borrowings may occur in multi-currencies.
Borrowings under the 2014 Credit Agreement bear interest at rates ranging from 0.25% to 1.25% above the lender’s base rate, or at rates ranging from 1.25% to 2.25% above the London Interbank Offered Rate (“LIBOR”), depending upon the Company’s “Consolidated Leverage Ratio,” which is defined as the consolidated ratio of total funded debt to earnings before interest, taxes, depreciation and amortization, and as further adjusted under the terms of the 2014 Credit Agreement (“Consolidated EBITDA”). At September 29, 2016, the lender’s base rate was 3.50% and the LIBOR rates ranged from 0.52% to 1.33%. The margins applicable to our outstanding borrowings were 0.50% above the lender’s base rate or 1.50% above LIBOR. All of our outstanding borrowings were under LIBOR contracts at September 29, 2016. The 2014 Credit Agreement also provides for fees on the unused portion of our facility at rates ranging from 0.20% to 0.40%, depending upon our Consolidated Leverage Ratio; such rate was 0.25% at September 29, 2016.
The 2014 Credit Agreement contains affirmative and negative covenants reasonably customary for similar credit facilities and is secured by (i) substantially all assets of Cantel and its United States-based subsidiaries, (ii) a pledge by Cantel of all of the outstanding shares of its United States-based subsidiaries and 65% of the outstanding shares of certain of Cantel’s foreign-based subsidiaries, and (iii) a guaranty by Cantel’s domestic subsidiaries. We are in compliance with all financial and other covenants under the 2014 Credit Agreement.
On July 31, 2016, we had $116,000,000 of outstanding borrowings under the 2014 Credit Agreement. Subsequent to July 31, 2016, we borrowed $61,000,000 to fund the purchase price and transaction costs of the Accutron and Vantage acquisitions and repaid $6,000,000 resulting in total outstanding borrowings of $171,000,000 at September 29, 2016, none of which is required to be repaid until March 2019.
With respect to interest rate risk, since our credit facility consists of outstanding debt at prevailing market rates of interest, principally under LIBOR contracts ranging from one to twelve months, our market risk with respect to such debt is the increase in interest expense which would result from higher interest rates associated with LIBOR. Our outstanding debt of $171,000,000 at September 29, 2016 has expected annual interest payments of approximately $3,830,000 using an effective interest rate of 2.24% as described above. Therefore, a 100 basis-point increase in average LIBOR interest rates would result in incremental interest expense of approximately $1,710,000. We monitor our interest rate risk, but presently do not utilize any interest rate derivatives that would mitigate our interest rate exposure. However, all of our outstanding borrowings were under LIBOR contracts at September 29, 2016 that have expiration dates ranging from one to twelve months at fixed interest rates for the contract periods; therefore, we are substantially protected throughout the majority of fiscal 2017 from any significant exposure associated with increasing LIBOR rates, assuming we do not increase our outstanding debt. Additionally, we maintained a cash balance of $28,367,000 at July 31, 2016 which is maintained in cash or invested in low risk and low return cash equivalents such as United States money market funds with leading banking institutions. An increase in interest rates would generate additional interest
52
income for us from these low risk cash equivalents, which would partially offset the adverse impact of the additional interest expense. Our other long-term liabilities would not be materially affected by an increase in interest rates.
Operating Leases
Minimum commitments under operating leases include minimum rental commitments for our leased manufacturing facilities, warehouses, office space and equipment.
Rent expense related to operating leases for fiscal 2016 was recorded on a straight-line basis and aggregated $6,675,000, compared with $6,025,000 and $4,409,000 for fiscals 2015 and 2014, respectively.
Assumed Contingent Liabilities
In relation to the Jet Prep Acquisition, we have recorded at July 31, 2016 a $1,138,000 liability for the estimated fair value of an assumed contingent obligation payable to the Israeli Government, as further described in Note 6 to the Consolidated Financial Statements, which will be payable based on future sales of the Jet Prep Business. Additionally, in connection with the PuriCore Acquisition, we assumed a contingent guaranteed obligation to reimburse an endoscope service company for endoscope repair costs it incurs when servicing its customers’ endoscopes that are damaged by one of PuriCore’s discontinued endoscope reprocessing machine models, as further described in Note 6 to the Consolidated Financial Statements. As such, the estimates of the annual required payments as well as the fair value of these contingent liabilities are subjective in nature and highly dependent on future sales projections. Additionally, since we will be continually re-measuring these liabilities at each balance sheet date and recording changes in the respective fair values through our Consolidated Statements of Income, we may potentially have earnings volatility in our future results of operations until the assumed contingent obligation and contingent guaranteed obligation are satisfied, or until the sales of the Jet Prep products no longer exist.
Compensation Agreements
We have previously entered into various severance contracts with executives of the Company, including our corporate executive officers and certain of our subsidiary Chief Executive Officers, which define certain compensation arrangements relating to various employment termination scenarios, and multi-year employment agreements with certain executive officers of businesses we have acquired. Additionally, in March 2016 we entered into a succession plan agreement due to the planned retirement of our Chief Executive Officer who was succeeded on July 31, 2016, but remains employed as a Senior Advisor until October 15, 2016. This succession plan agreement requires future payments to our former Chief Executive Officer beginning in fiscal 2017 for transition-related services. The majority of those future payments are being recorded in general and administrative expenses from March 17, 2016 through his October 15, 2016 retirement date.
Other Long-Term Obligation
In relation to the IMS Acquisition on November 3, 2014, we assumed an $843,000 liability to the central bank of Italy as part of funding provided by an Italian government agency, of which $187,000 and $656,000 were recorded in accrued expenses and other long-term liabilities, respectively. Such amount was a portion of the financial support obtained from the Italian government’s Ministry of Education, Universities and Research to fund research and development activity relating to IMS’s automated endoscope reprocessors. The liability is payable in semi-annual installments, bears interest at 0.25% per annum and has a maturity date of January 1, 2019. At July 31, 2016, $415,000 is outstanding, of which $165,000 is recorded in accrued expense and $250,000 is recorded in other long-term liabilities.
Additionally, other long-term obligations include deferred compensation arrangements for certain former Medivators directors and officers and is recorded in other long-term liabilities.
53
Financing Needs
Our operating segments generate significant cash from operations. At July 31, 2016, we had a cash balance of $28,367,000, of which $9,804,000 was held by foreign subsidiaries. Our foreign cash is needed by our foreign subsidiaries for working capital purposes as well as for current international growth initiatives. Accordingly, our foreign unremitted earnings are considered permanently reinvested and unavailable for repatriation.
We believe that our current cash position, anticipated cash flows from operations and the funds available under our 2014 Credit Agreement will be sufficient to satisfy our worldwide cash operating requirements for the foreseeable future based upon our existing operations, particularly given that we historically have not needed to borrow for working capital purposes. At September 29, 2016, $79,000,000 was available under our 2014 Credit Agreement.
Foreign Currency Market Risk
Changes in the value of the Euro, British Pound, Singapore dollar, Canadian dollar and the Chinese Renminbi against the United States dollar affect our results of operations because certain cash bank accounts, accounts receivable and liabilities of Cantel and its subsidiaries are denominated and ultimately settled in United States dollars or these foreign currencies, but must be converted into each entity’s functional currency. Furthermore, the financial statements of most of our international subsidiaries are translated using the accounting policies described in Note 2 to the Consolidated Financial Statements and therefore are impacted by changes in the international entities’ functional currency relative to the United States dollar.
We use a sensitivity analysis to assess the market risk associated with our foreign currency transactions. Market risk is defined here as the potential change in fair value resulting from an adverse movement in foreign currency exchange rates. Overall for fiscals 2016 and 2015, a uniform 15% adverse movement in foreign currency rates would have resulted in realized losses (after tax) of approximately $1,680,000 and $1,371,000, respectively. Conversely, for fiscals 2016 and 2015, a uniform 15% favorable movement in foreign currency rates would have resulted in realized gains (after tax) of approximately $1,680,000 and $1,371,000, respectively.
For fiscals 2016 and 2015, the realized losses (after tax) would have resulted primarily from (i) increases in the values of the Euro and Canadian dollar relative to the United States dollar and (ii) decreases in the values of the British Pound and Singapore dollar relative to the United States dollar due to the composition of our assets and liabilities denominated in foreign currencies and the translation of our foreign subsidiaries’ financials. However, the use of foreign currency forward contracts would partially offset such realized losses.
In order to hedge against the impact of fluctuations in the value of the Euro, British Pound and Singapore dollar relative to the United States dollar on the conversion of such net assets into the functional currencies, we enter into short-term contracts to purchase Euros, British Pounds and Singapore dollars forward, which contracts are one-month in duration. These short-term contracts are designated as fair value hedge instruments. There were four foreign currency forward contracts with an aggregate value of $7,039,000 at August 31, 2016, which covered certain assets and liabilities that were denominated in currencies other than each entity’s functional currency. Such contracts expire on September 30, 2016. These foreign currency forward contracts are continually replaced with new one-month contracts as long as we have significant net assets that are denominated and ultimately settled in currencies other than each entity’s functional currency. Gains and losses related to these hedging contracts to buy Euros, British Pounds and Singapore dollars forward are immediately realized within general and administrative expenses due to the short-term nature of such contracts. For fiscal 2016, such forward contracts partially offset the impact on operations related to certain assets and liabilities that are denominated in currencies other than each entity’s functional currency. We do not currently hedge against the impact of fluctuations in the value of the Canadian dollar and Chinese Renminbi relative to the United States dollar because the overall foreign currency exposures relating to those currencies are currently not deemed significant. Additionally, we do not hedge transactions associated with the funding of international acquisitions due to the short-term nature of the foreign currency exposure.
Overall, fluctuations in the rates of currency exchange had an insignificant impact upon our net income in fiscal 2016 compared with fiscal 2015.
54
For purposes of translating the balance sheet at July 31, 2016 compared with July 31, 2015, the total of the foreign currency movements resulted in a foreign currency translation loss of $13,019,000 for fiscal 2016, primarily due to the increase in the value of the United States dollar relative to the Euro, Canadian dollar and British Pound, thereby decreasing stockholders’ equity.
Inflation
Although overall inflation did not have a significant effect on our business, an increase in commodity prices can adversely affect our gross margins. Specifically, our businesses can be adversely impacted by rising fuel and oil prices and are heavily reliant on certain raw materials, such as chemicals, paper, resin, stainless steel and plastic components. From time to time, we experience price increases for raw materials. If we are unable to implement price increases to our customers, our gross margins could be adversely affected.
Critical Accounting Policies
Our discussion and analysis of our financial condition and results of operations are based upon our Consolidated Financial Statements, which have been prepared in accordance with accounting principles generally accepted in the United States. The preparation of these financial statements requires us to make estimates and judgments that affect the reported amounts of assets, liabilities, revenues and expenses, and related disclosures of contingent assets and liabilities. On an ongoing basis, we continually evaluate our estimates. We base our estimates on historical experience and on various other assumptions that are believed to be reasonable under the circumstances, the results of which form the basis for making judgments about the carrying values of assets and liabilities that are not readily apparent from other sources. Actual results may differ from these estimates.
We believe the following critical accounting policies affect our more significant judgments and estimates used in the preparation of our Consolidated Financial Statements.
Revenue Recognition
Revenue on product sales is recognized as products are shipped to customers and title passes. The passing of title is determined based upon the FOB terms specified for each shipment. With respect to endoscopy and dialysis products, shipment terms are generally FOB origin for common carrier and when our distribution fleet is utilized (except for one large customer in dialysis and several endoscopy customers whereby all products are shipped FOB destination). With respect to water purification and filtration and healthcare disposable products, shipment terms may be either FOB origin or destination. Customer acceptance for the majority of our product sales occurs at the time of delivery. With respect to a portion of water purification and filtration and endoscopy product sales, equipment is sold as part of a system for which the equipment is functionally interdependent or the customer’s purchase order specifies “ship-complete” as a condition of delivery; revenue recognition on such sales is deferred until all equipment has been delivered, or post-delivery obligations such as installation have been substantially fulfilled such that the products are deemed functional by the end-user. All shipping and handling fees invoiced to customers, such as freight, are recorded as revenue (and related costs are included within cost of sales) at the time the sale is recognized.
A portion of our endoscopy, water purification and filtration and dialysis sales are recognized as multiple element arrangements, whereby revenue is allocated to the equipment, installation and consumable components based upon vendor specific objective evidence, which includes comparable historical transactions of similar equipment, installation and consumables sold as stand-alone components. If vendor-specific objective evidence of selling price is not available, we allocate revenue to the elements of the bundled arrangement using the estimated selling price method in order to qualify the components as separate units of accounting. Revenue on the equipment and consumables components are recognized as the equipment or consumable is shipped to customers and title passes. Revenue on the installation component is recognized when the installation is complete.
A portion of our healthcare disposables sales relating to the mail-in spore test kit is recorded as deferred revenue when initially sold. We recognize the revenue on these test kits using an estimate based on historical experience
55
of the amount of time that elapses from the point of sale to when the kit is returned to us and we communicate to the customer the results of the required laboratory test. The related cost of the kits is recorded in inventory and recognized in cost of sales as the revenue is earned.
Revenue on service sales is recognized when repairs are completed at the customer’s location or when repairs are completed at our facilities and the products are shipped to customers. With respect to certain service contracts in our Endoscopy and Water Purification and Filtration operating segments, service revenue is recognized on a straight-line basis over the contractual term of the arrangement.
None of our sales contain right-of-return provisions. Customer claims for credit or return due to damage, defect, shortage or other reason must be pre-approved by us before credit is issued or such product is accepted for return. No cash discounts for early payment are offered except with respect to a small portion of our product sales in each segment. We do not offer price protection, although advance pricing contracts or required notice periods prior to implementation of price increases exist for certain customers with respect to many of our products. With respect to certain of our dialysis, healthcare disposables, water purification and filtration and endoscopy customers, rebates are provided; such rebates, which consist primarily of volume rebates, are provided for as a reduction of sales at the time of revenue recognition and amounted to $5,944,000, $5,597,000, and $4,498,000 in fiscals 2016, 2015, and 2014, respectively. Such allowances are determined based on estimated projections of sales volume for the entire rebate periods. If it becomes known that sales volume to customers will deviate from original projections, the rebate provisions originally established would be adjusted accordingly.
Our endoscopy products and services are sold directly to hospitals and other end-users in the United States and primarily to distributors internationally except for the United Kingdom, Italy, Netherlands, Singapore, China and Germany where we sell directly to hospitals and other end-users; water purification and filtration products and services are sold directly to hospitals, dialysis clinics, pharmaceutical and biotechnology companies, laboratories, medical products and service companies and other end-users as well as through third-party distributors; the majority of our healthcare disposable products are sold to third party distributors and with respect to some of our sterility assurance products, to hospitals, surgery centers, physician and dental offices, dental schools, medical research companies, laboratories and other end-users; and the majority of our dialysis products are sold to dialysis clinics and hospitals. Sales to all of these customers follow our revenue recognition policies.
Accounts Receivable and Allowance for Doubtful Accounts
Accounts receivable consist of amounts due to us from normal business activities. Allowances for doubtful accounts are reserves for the estimated loss from the inability of customers to make required payments. We use historical experience as well as current market information in determining the estimate. While actual losses have historically been within management’s expectations and provisions established, if the financial condition of our customers were to deteriorate, resulting in an impairment of their ability to make payments, additional allowances may be required. Alternatively, if certain customers paid their delinquent receivables, reductions in allowances may be required.
Inventories
Inventories consist of raw materials, work-in-process and finished products which are sold in the ordinary course of our business and are stated at the lower of cost (first-in, first-out) or market. In assessing the value of inventories, we must make estimates and judgments regarding reserves required for product obsolescence, aging of inventories and other issues potentially affecting the saleable condition of products. In performing such evaluations, we use historical experience as well as current market information. With few exceptions, the saleable value of our inventories has historically been within management’s expectation and provisions established, however, rapid changes in the market due to competition, technology and various other factors could have an adverse effect on the saleable value of our inventories, resulting in the need for additional reserves.
56
Goodwill and Intangible Assets
Certain of our identifiable intangible assets, including customer relationships, technology, brand names, non-compete agreements and patents, are amortized using the straight-line method over their estimated useful lives which range from 3 to 20 years. Additionally, we have recorded goodwill and trademarks and trade names, all of which have indefinite useful lives and are therefore not amortized. All of our intangible assets and goodwill are reviewed for impairment whenever events or changes in circumstances indicate that the carrying amount of an asset may not be recoverable, and goodwill and intangible assets with indefinite lives are reviewed for impairment at least annually. Our management is responsible for determining if impairment exists and considers a number of factors, including third-party valuations, when making these determinations.
We first assess qualitative factors to determine whether it is more likely than not that the fair value of the reporting unit is less than the carrying amount before proceeding to step one of the two-step quantitative goodwill impairment test, if necessary. Such qualitative factors that are assessed include evaluating a segment’s financial performance, industry and market conditions, macroeconomic conditions and specific issues that can directly affect the segment such as changes in business strategies, competition, supplier relationships, operating costs, regulatory matters, litigation and the composition of the segment’s assets due to acquisitions or other events. At July 31, 2016, because we determined through qualitative factors that the fair values of our Endoscopy, Water Purification and Filtration and Healthcare Disposables segments were unlikely to be less than the carrying value, we did not proceed to step one of the two-step quantitative goodwill impairment test for those three segments. We performed step one of the two-step quantitative goodwill impairment test for Dialysis due to the continuing shift by our customers from reusable to single-use dialyzers, which is having an adverse impact on our business and is expected to continue, as further described in “Risk Factors” and elsewhere in this MD&A. In performing a detailed quantitative review for goodwill impairment, management uses a two-step process that begins with an estimation of the fair value of the related operating segments by using weighted fair value results of the discounted cash flow methodology, as well as the market multiple and comparable transaction methodologies, where applicable. The first step is a review for potential impairment, and the second step measures the amount of impairment, if any.
We perform our annual impairment review for indefinite lived intangibles by first assessing qualitative factors, such as those described above, to determine whether it is more likely than not that the fair value of such assets is less than the carrying values, and if necessary, we perform a quantitative analysis comparing the current fair value of our indefinite lived intangibles assets to their carrying values. At July 31, 2016, because we determined through qualitative factors that the fair values of all of our indefinite lived intangible assets were unlikely to be less than the carrying value, we did not perform a quantitative analysis for those assets. With respect to amortizable intangible assets when impairment indicators are present, management would determine whether expected future non-discounted cash flows would be sufficient to recover the carrying value of the assets; if not, the carrying value of the assets would be adjusted to their fair value.
Management concluded that none of our intangible assets or goodwill was impaired as of July 31, 2016.
While the results of these annual reviews have historically not indicated impairment, impairment reviews are highly dependent on management’s projections of our future operating results and cash flows (which management believes to be reasonable), discount rates based on the Company’s weighted average cost of capital and appropriate benchmark peer companies. Assumptions used in determining future operating results and cash flows include current and expected market conditions and future sales and earnings forecasts. Subsequent changes in these assumptions and estimates could result in future impairment. Although we consistently use the same methods in developing the assumptions and estimates underlying the fair value calculations, such estimates are uncertain by nature and can vary from actual results. At July 31, 2016, the fair value of all of our reporting units exceeded book value by substantial amounts. However, we believe the most significant assumptions impacting the impairment assessment of Dialysis relate to the assumed rate in which annual sales will decline as well as the expected future operating efficiencies included in our projections of future operating results and cash flows of this segment. If future operating results and cash flows are substantially less than our projections, future impairment charges may be recorded.
57
Long-Lived Assets
We evaluate the carrying value of long-lived assets including property, equipment and other assets whenever events or changes in circumstances indicate that the carrying value may not be recoverable. An assessment is made to determine if the sum of the expected future non-discounted cash flows from the use of the assets and eventual disposition is less than the carrying value. If the sum of the expected non-discounted cash flows is less than the carrying value, an impairment loss is recognized based on fair value. With the exception of the impairment on an acquired license as further described in Note 6 to the Consolidated Financial Statements, our historical assessments of our long-lived assets have not differed significantly from the actual amounts realized. However, the determination of fair value requires us to make certain assumptions and estimates and is highly subjective. On July 31, 2016, management concluded that no other events or changes in circumstances have occurred that would indicate that the carrying amount of our long-lived assets may not be recoverable.
Warranties
We provide for estimated costs that may be incurred to remedy deficiencies of quality or performance of our products at the time of revenue recognition. Most of our products have a one year warranty, although certain endoscopy and water purification and filtration products that require installation may carry a warranty period of up to twenty-four months. Additionally, many of our consumables, accessories and parts have a 90 day warranty. We record provisions for product warranties as a component of cost of sales based upon an estimate of the amounts necessary to settle existing and future claims on products sold. The historical relationship of warranty costs to products sold is the primary basis for the estimate. A significant increase in third party service repair rates, the cost and availability of parts or the frequency of claims could have a material adverse impact on our results for the period or periods in which such claims or additional costs materialize. Management reviews its warranty exposure periodically and believes that the warranty reserves are adequate; however, actual claims incurred could differ from original estimates, requiring adjustments to the reserves.
Stock-Based Compensation
Stock compensation expense is recognized for any option or stock award grant based upon the award’s fair value. All of our stock options and stock awards (which consist only of restricted stock) are subject to graded vesting in which portions of the award vest at different times during the vesting period, as opposed to awards that vest at the end of the vesting period. We recognize compensation expense for awards subject to graded vesting using the straight-line basis, reduced by estimated forfeitures. Forfeitures are estimated at the time of grant and revised, if necessary, in subsequent periods if actual forfeitures differ from those estimates. Forfeitures are estimated based on historical experience.
The stock-based compensation expense recorded in our Consolidated Financial Statements may not be representative of the effect of stock-based compensation expense in future periods due to the level of awards issued in past years (which level may not be similar in the future), modifications to existing awards, accelerated vesting related to certain employment terminations and assumptions used in determining fair value, expected lives and estimated forfeitures. We determine the fair value of each stock award using the closing market price of our common stock on the date of grant. We estimate the fair value of each option grant on the date of grant using the Black-Scholes option valuation model. The determination of fair value using an option-pricing model is affected by our stock price as well as assumptions regarding a number of subjective variables. These variables include, but are not limited to, the expected stock price volatility over the term of the expected option life (which is determined by using the historical closing prices of our common stock), the expected dividend yield (which is approximately 0.2%), and the expected option life (which is based on historical exercise behavior).
Income Taxes
Our provision for income taxes is based on our current period income, changes in deferred income tax assets and liabilities, statutory income tax rates, changes in uncertain tax benefits and the deductibility of expenses or availability of tax credits in various taxing jurisdictions. Tax laws are complex, subject to different interpretations by the taxpayer and the respective governmental taxing authorities and are subject to future modification, expiration or repeal
58
by government legislative bodies. We use significant judgment on a quarterly basis in determining our annual effective income tax rate and evaluating our tax positions.
We recognize deferred tax assets and liabilities based on differences between the financial statement carrying amounts and the tax basis of assets and liabilities. Deferred tax assets and liabilities also include items recorded in conjunction with the purchase accounting for business acquisitions as well as net operating loss carryforwards. We regularly review our deferred tax assets for recoverability and establish a valuation allowance, if necessary, based on historical taxable income, projected future taxable income, and the expected timing of the reversals of existing temporary differences. Although realization is not assured, management believes it is more likely than not that the recorded deferred tax assets, as adjusted for valuation allowances, will be realized. Additionally, deferred tax liabilities are regularly reviewed to confirm that such amounts are appropriately stated. A review of our deferred tax items considers known future changes in various income tax rates, principally in the United States. If income tax rates were to change in the future, particularly in the United States and to a lesser extent Canada, the United Kingdom and Italy, our items of deferred tax could be materially affected. All of such evaluations require significant management judgments.
We record liabilities for an unrecognized tax benefit when a tax benefit for an uncertain tax position is taken or expected to be taken on a tax return, but is not recognized in our Consolidated Financial Statements because it does not meet the more-likely-than-not recognition threshold that the uncertain tax position would be sustained upon examination by the applicable taxing authority. Any adjustments upon resolution of income tax uncertainties are recognized in our results of operations. Unrecognized tax benefits are analyzed periodically and adjustments are made as events occur to warrant adjustment to the related liability. Historically, we have not had significant unrecognized tax benefits.
Business Combinations
Acquisitions require significant estimates and judgments related to the fair value of assets acquired and liabilities assumed. We determine fair value based on the estimated price that would be received to sell an asset or paid to transfer a liability in an orderly transaction between market participants at the measurement date. Such initial fair value amounts as well as other acquired assets and liabilities, including deferred tax assets and liabilities, are sometimes refined requiring subsequent adjustments.
Certain liabilities and reserves are subjective in nature. We reflect such liabilities and reserves based upon the most recent information available. In conjunction with our acquisitions, such subjective liabilities and reserves principally include contingent consideration, certain deferred income tax liabilities, income tax and sales and use tax exposures, including tax liabilities related to our foreign subsidiaries, as well as reserves for accounts receivable, inventories, warranties and contingent obligations. We account for contingent consideration relating to business combinations as a liability and an increase to goodwill at the date of the acquisition and continually re-measure the liability at each balance sheet date by recording changes in the fair value through our Consolidated Statements of Income. We determine the fair value of contingent consideration based on future operating projections under various potential scenarios and weight the probability of these outcomes. Similarly, other acquisition related liabilities can be required to be recorded at fair value at the date of the acquisition and continually re-measured at each balance sheet date, such as the assumed contingent obligation relating to the Jet Prep Acquisition and the contingent guaranteed obligation relating to the PuriCore Acquisition, as further described in Note 6 to the Consolidated Financial Statements. The ultimate settlement of liabilities relating to business combinations may be for amounts which are materially different from the amounts initially recorded and may cause volatility in our results of operations.
Other Matters
We do not have any off balance sheet financial arrangements, other than future commitments under operating leases and executive severance and license agreements.
New Accounting Pronouncements
Refer to Note 2 to the Consolidated Financial Statements for recently adopted accounting pronouncements and recently issued accounting pronouncements not yet adopted as of July 31, 2016.
59
Item 7A. QUANTITATIVE AND QUALITATIVE DISCLOSURES ABOUT MARKET RISK.
We are exposed to market risks arising principally from adverse changes in interest rates and foreign currency.
The information required by this item is included in Item 7, Management’s Discussion and Analysis of Financial Condition and Results of Operations, and is incorporated herein by reference.
Item 8. FINANCIAL STATEMENTS AND SUPPLEMENTARY DATA.
See Index to Consolidated Financial Statements, which is Item 15(a), and the Consolidated Financial Statements and schedule included in this Report.
Item 9. CHANGES IN AND DISAGREEMENTS WITH ACCOUNTANTS ON ACCOUNTING AND FINANCIAL DISCLOSURE.
Not applicable.
60
Item 9A. CONTROLS AND PROCEDURES.
Under the supervision and with the participation of our Chief Executive Officer and our Chief Financial Officer, we conducted an evaluation of the effectiveness of the design and operation of our disclosure controls and procedures (as defined in Rules 13a-15(e) and 15d-15(e) under the Exchange Act) as of July 31, 2016. Based on this evaluation, our Chief Executive Officer and Chief Financial Officer each concluded that the design and operation of these disclosure controls and procedures were, as of the end of the period covered by this report, effective and designed to ensure that material information relating to the Company, including our consolidated subsidiaries, required to be disclosed in our SEC reports is (i) recorded, processed, summarized and reported within the time periods specified by the SEC and (ii) accumulated and communicated to the Company’s management, including the Chief Executive Officer and the Chief Financial Officer, as appropriate to allow timely decisions regarding disclosure.
Management’s Report on Internal Control over Financial Reporting
The management of Cantel Medical Corp. is responsible for establishing and maintaining adequate internal control over financial reporting for the Company. The Company’s internal control over financial reporting is designed to provide reasonable assurance regarding the reliability of financial reporting and the preparation of financial statements for external purposes in accordance with United States generally accepted accounting principles. The Company’s internal control over financial reporting includes those policies and procedures that:
(i) pertain to the maintenance of records that, in reasonable detail, accurately and fairly reflect the transactions and dispositions of the assets of the Company,
(ii) provide reasonable assurance that transactions are recorded as necessary to permit preparation of financial statements in accordance with generally accepted accounting principles, and that receipts and expenditures of the Company are being made only in accordance with authorizations of management and directors of the Company, and
(iii) provide reasonable assurance regarding prevention or timely detection of unauthorized acquisition, use or disposition of the Company’s assets that could have a material effect on the financial statements.
Because of its inherent limitations, internal control over financial reporting may not prevent or detect misstatements. Also, projections of any evaluation of the effectiveness to future periods are subject to the risk that controls may become inadequate because of changes in condition, or that the degree of compliance with the policies and procedures included in such controls may deteriorate.
We, under the supervision and with the participation of our Chief Executive Officer and our Chief Financial Officer, carried out an evaluation of the effectiveness of our internal controls over financial reporting based on the framework and criteria established in “Internal Control — Integrated Framework (2013 framework),” issued by the Committee of Sponsoring Organizations of the Treadway Commission (“COSO”). Based on that evaluation, the Chief Executive Officer and the Chief Financial Officer each concluded that our internal control over financial reporting was effective as of July 31, 2016.
Our independent auditors, Ernst & Young LLP, have issued an attestation report on our internal control over financial reporting, which is included below.
Changes in Internal Control
We have evaluated our internal controls over financial reporting and determined that no changes occurred during the period covered by this report that have materially affected, or are reasonably likely to materially affect, our internal controls over financial reporting, except as described below.
On September 14, 2015 we acquired MI, as more fully described in Note 3 to the Consolidated Financial Statements. The MI Business is included in our 2016 consolidated financial statements and constituted 10% and 13% of total assets and net assets, respectively, as of July 31, 2016 and 3% of revenues and net income for the year then ended. During the initial transition period following the acquisition, we enhanced our internal control process to ensure that all
61
financial information related to this acquisition was properly reflected in our Consolidated Financial Statements. However, since the MI Business was acquired on September 14, 2015, a complete integration of the internal controls relating to the acquired businesses was not practical for purposes of inclusion in our evaluation of the effectiveness of our internal controls over financial reporting. We expect that all aspects of the MI Business will be fully integrated into our existing internal control structure in fiscal 2017.
62
Attestation Report of Independent Registered Public Accounting Firm
Report of Independent Registered Public Accounting Firm
The Board of Directors and Stockholders
Cantel Medical Corp.
We have audited Cantel Medical Corp.’s internal control over financial reporting as of July 31, 2016, based on criteria established in Internal Control—Integrated Framework issued by the Committee of Sponsoring Organizations of the Treadway Commission (2013 framework) (the COSO criteria). Cantel Medical Corp.’s management is responsible for maintaining effective internal control over financial reporting, and for its assessment of the effectiveness of internal control over financial reporting included in the accompanying Management’s Report on Internal Control over Financial Reporting. Our responsibility is to express an opinion on the company’s internal control over financial reporting based on our audit.
We conducted our audit in accordance with the standards of the Public Company Accounting Oversight Board (United States). Those standards require that we plan and perform the audit to obtain reasonable assurance about whether effective internal control over financial reporting was maintained in all material respects. Our audit included obtaining an understanding of internal control over financial reporting, assessing the risk that a material weakness exists, testing and evaluating the design and operating effectiveness of internal control based on the assessed risk, and performing such other procedures as we considered necessary in the circumstances. We believe that our audit provides a reasonable basis for our opinion.
A company’s internal control over financial reporting is a process designed to provide reasonable assurance regarding the reliability of financial reporting and the preparation of financial statements for external purposes in accordance with generally accepted accounting principles. A company’s internal control over financial reporting includes those policies and procedures that (1) pertain to the maintenance of records that, in reasonable detail, accurately and fairly reflect the transactions and dispositions of the assets of the company; (2) provide reasonable assurance that transactions are recorded as necessary to permit preparation of financial statements in accordance with generally accepted accounting principles, and that receipts and expenditures of the company are being made only in accordance with authorizations of management and directors of the company; and (3) provide reasonable assurance regarding prevention or timely detection of unauthorized acquisition, use or disposition of the company’s assets that could have a material effect on the financial statements.
Because of its inherent limitations, internal control over financial reporting may not prevent or detect misstatements. Also, projections of any evaluation of effectiveness to future periods are subject to the risk that controls may become inadequate because of changes in conditions, or that the degree of compliance with the policies or procedures may deteriorate.
As indicated in the accompanying Management’s Report on Internal Control over Financial Reporting, management’s assessment of and conclusion on the effectiveness of internal control over financial reporting did not include the internal controls of Cantel (UK) Limited (formerly known as Medical Innovations Group Holdings Limited), which is included in the 2016 consolidated financial statements of Cantel Medical Corp. and constituted 10% and 13% of total and net assets, respectively, as of July 31, 2016 and 3% of revenues and net income for the year then ended. Our audit of internal control over financial reporting of Cantel Medical Corp. also did not include an evaluation of the internal control over financial reporting of Cantel (UK) Limited.
In our opinion, Cantel Medical Corp. maintained, in all material respects, effective internal control over financial reporting as of July 31, 2016, based on the COSO criteria.
We also have audited, in accordance with the standards of the Public Company Accounting Oversight Board (United States), the consolidated balance sheets of Cantel Medical Corp. as of July 31, 2016 and 2015 and the related consolidated statements of income, comprehensive income, changes in stockholders’ equity and cash flows for each of the three years in the period ended July 31, 2016 of Cantel Medical Corp. and our report dated September 29, 2016 expressed an unqualified opinion thereon.
|
|
/s/ Ernst & Young LLP |
New York, New York
September 29, 2016
63
Item 9B.OTHER INFORMATION.
None.
64
PART III
Item 10.DIRECTORS, EXECUTIVE OFFICERS AND CORPORATE GOVERNANCE.
Information required to be disclosed by this Item with respect to our executive officers is incorporated in this Annual Report on Form 10-K by reference from the section entitled “Executive Officers of Cantel” contained in our definitive proxy statement for our 2016 annual meeting of stockholders, which we intend to file within 120 days of the end of our fiscal year.
Information required to be disclosed by this Item with respect to our board of directors is incorporated in this Annual Report on Form 10-K by reference from the section entitled “Election of Directors” contained in our definitive proxy statement for our 2016 annual meeting of stockholders, which we intend to file within 120 days of the end of our fiscal year.
Information required to be disclosed by this Item with respect to the Section 16(a) compliance of our directors and executive officers is incorporated in this Annual Report on Form 10-K by reference from the section entitled “Section 16(a) Beneficial Ownership Reporting Compliance” contained in our definitive proxy statement for our 2016 annual meeting of stockholders, which we intend to file within 120 days of the end of our fiscal year.
Information required to be disclosed by this Item with respect to the audit committee of our board of directors, our audit committee financial expert, and other board of directors and corporate governance matters is incorporated in this Annual Report on Form 10-K by reference from the sections entitled “Board Matters; Committees” and “Corporate Governance Matters” contained in our definitive proxy statement related to our 2016 annual meeting of stockholders, which we intend to file within 120 days of the end of our fiscal year.
We have adopted a Code of Ethics for the Chief Executive Officer, the Chief Financial Officer and other officers and management personnel that is posted on our website, www.cantelmedical.com. We intend to satisfy the disclosure requirement regarding any amendment to, or a waiver of, a provision of the Code of Ethics for the Chief Executive Officer, Chief Financial Officer and other officers and management personnel by posting such information on our website.
Item 11.EXECUTIVE COMPENSATION.
Information required to be disclosed by this Item is incorporated in this Annual Report on Form 10-K by reference from the sections entitled “Board Matters; Committees,” “Compensation Committee Report” and “Executive Compensation” contained in our definitive proxy statement for our 2016 annual meeting of stockholders, which we intend to file within 120 days of the end of our fiscal year.
65
Item 12.SECURITY OWNERSHIP OF CERTAIN BENEFICIAL OWNERS AND MANAGEMENT AND RELATED STOCKHOLDER MATTERS.
The following sets forth certain information as of July 31, 2016 with respect to our equity compensation plans under which our securities may be issued:
|
|
|
Number of securities |
|
|
|
|
Number of securities remaining |
|
|
|
|
to be issued |
|
Weighted-average |
|
available for future issuance |
|
|
|
|
|
upon exercise of |
|
exercise price of |
|
under compensation plans |
|
|
|
|
|
outstanding options |
|
outstanding options |
|
(excluding securities reflected in (a)) |
|
|
|
Plan Category |
|
(a) |
|
(b) |
|
(c) |
|
|
|
|
|
|
|
|
|
|
|
|
|
Equity compensation plans approved by security holders |
|
122,500 |
|
$ |
29.36 |
|
1,194,054 |
(1) |
|
Equity compensation plans not approved by security holders |
|
— |
|
$ |
— |
|
— |
|
|
Total |
|
122,500 |
|
$ |
29.36 |
|
1,194,054 |
(1) |
(1) Collectively consists of stock option and SARs awards and restricted stock and performance awards available for grant under the Plan.
Other Information required to be disclosed by this Item is incorporated in this Annual Report on Form 10-K by reference from the section entitled “Security Ownership of Principal Stockholders and Management” contained in our definitive proxy statement for our 2016 annual meeting of stockholders, which we intend to file within 120 days of the end of our fiscal year.
Item 13.CERTAIN RELATIONSHIPS AND RELATED TRANSACTIONS AND DIRECTOR INDEPENDENCE.
The information required to be disclosed by this Item is incorporated in this Annual Report on Form 10-K by reference from the sections entitled “Corporate Governance,” “Election of Directors,” and “Board Matters; Committees” contained in our definitive proxy statement for our 2016 annual meeting of stockholders, which we intend to file within 120 days of the end of our fiscal year.
Item 14.PRINCIPAL ACCOUNTING FEES AND SERVICES.
The information required to be disclosed by this Item is incorporated in this Annual Report on Form 10-K by reference from the section entitled “Ratification of Appointment of Independent Registered Public Accounting Firm” contained in our definitive proxy statement for our 2016 annual meeting of stockholders, which we intend to file within 120 days of the end of our fiscal year.
66
PART IV
Item 15.EXHIBITS, FINANCIAL STATEMENT SCHEDULES.
|
(a) |
The following documents are filed as part of this Annual Report on Form 10-K for the fiscal year ended July 31, 2016. |
|
1. |
Consolidated Financial Statements: |
|
(i) |
Report of Independent Registered Public Accounting Firm. |
|
(ii) |
Consolidated Balance Sheets as of July 31, 2016 and 2015. |
|
(iii) |
Consolidated Statements of Income for the years ended July 31, 2016, 2015 and 2014. |
|
(iv) |
Consolidated Statements of Comprehensive Income for the years ended July 31, 2016, 2015 and 2014. |
|
(v) |
Consolidated Statements of Changes in Stockholders’ Equity for the years ended July 31, 2016, 2015 and 2014. |
|
(vi) |
Consolidated Statements of Cash Flows for the years ended July 31, 2016, 2015 and 2014. |
|
(vii) |
Notes to Consolidated Financial Statements. |
|
2. |
Consolidated Financial Statement Schedules: |
|
(i) |
Schedule II - Valuation and Qualifying Accounts for the years ended July 31, 2016, 2015 and 2014. |
All other financial statement schedules are omitted since they are not required, not applicable, or the information has been included in the Consolidated Financial Statements or Notes thereto.
|
3. |
Exhibits: |
3(a) - Registrant’s Restated Certificate of Incorporation, dated July 20, 1978. (Incorporated herein by reference to Exhibit 3(a) to Registrant’s 1981 Annual Report on Form 10-K.)
3(b) - Certificate of Amendment of Certificate of Incorporation of Registrant, filed on February 16, 1982. (Incorporated herein by reference to Exhibit 3(b) to Registrant’s 1982 Annual Report on Form 10-K.)
3(c) - Certificate of Amendment of Certificate of Incorporation of Registrant, filed on May 4, 1984. (Incorporated herein by reference to Exhibit 3(c) to Registrant’s Quarterly Report on Form 10-Q for the quarter ended April 30, 1984.)
3(d) - Certificate of Amendment of Certificate of Incorporation of Registrant, filed on August 19, 1986. (Incorporated herein by reference to Exhibit 3(d) to Registrant’s 1986 Annual Report on Form 10-K.)
3(e) - Certificate of Amendment of Certificate of Incorporation of Registrant, filed on December 12, 1986. (Incorporated herein by reference to Exhibit 3(e) to Registrant’s 1987 Annual Report on Form 10-K [the “1987 10-K”].)
3(f) - Certificate of Amendment of Certificate of Incorporation of Registrant, filed on April 3, 1987. (Incorporated herein by reference to Exhibit 3(f) to Registrant’s 1987 10-K.)
67
3(g) - Certificate of Change of Registrant, filed on July 12, 1988. (Incorporated herein by reference to Exhibit 3(g) to Registrant’s 1988 Annual Report on Form 10-K, File No. 001-31337.)
3(h) - Certificate of Amendment of Certificate of Incorporation of Registrant, filed on April 17, 1989. (Incorporated herein by reference to Exhibit 3(h) to Registrant’s 1989 Annual Report on Form 10-K, File No. 001-31337.)
3(i) - Certificate of Amendment of Certificate of Incorporation of Registrant, filed on May 10, 1999. (Incorporated herein by reference to Exhibit 3(i) to Registrant’s 2000 Annual Report on Form 10-K, File No. 001-31337 [the “2000 10-K”].)
3(j) - Certificate of Amendment of Certificate of Incorporation of Registrant, filed on April 5, 2000. (Incorporated herein by reference to Exhibit 3(j) to Registrant’s 2000 10-K.)
3(k) - Certificate of Amendment of Certificate of Incorporation of Registrant, filed on September 6, 2001. (Incorporated herein by reference to Exhibit 3(k) to Registrant’s 2001 Annual Report on Form 10-K, File No. 001-31337.)
3(l) - Certificate of Amendment of Certificate of Incorporation of Registrant, filed on June 7, 2002. (Incorporated herein by reference to Exhibit 3(l) to Registrant’s 2002 Annual Report on Form 10-K, File No. 001-31337.)
3(m) - Certificate of Amendment of Certificate of Incorporation of Registrant, filed on December 22, 2005. (Incorporated herein by reference to Exhibit 3(m) to Registrant’s 2006 Annual Report on Form 10-K, File No. 001-31337.)
3(n) — Certificate of Amendment of Certificate of Incorporation of Registrant filed on January 14, 2013. (Incorporated herein by reference to Exhibit 3(n) to Registrant’s 2013 Annual Report on Form 10-K, File No. 001-31337.)
3(o)- Registrant’s By-Laws, as amended through November 1, 2013. (Incorporated herein by reference to Exhibit 3.1 to Registrant’s Current Report on Form 8-K filed on November 7, 2013, File No. 001-31337.)
10(a) - 2006 Equity Incentive Plan, as amended. (Incorporated herein by reference to Exhibit 10(a) to Registrant’s Quarterly Report on Form 10-Q for the quarter ended October 31, 2013, File No. 001-31337.)*
10(b) - Form of Stock Option Agreement for option grants to directors and executive officers under Registrant’s 2006 Equity Incentive Plan. (Incorporated herein by reference to Exhibit 10.4 to Registrant’s Current Report on Form 8-K filed on October 27, 2011, File No. 001-31337 [the “October 2011 8-K”].)*
10(c) - Form of Restricted Stock Agreement under Registrant’s 2006 Equity Incentive Plan for grants to executive officers. (Incorporated herein by reference to Exhibit 10.5 to Registrant’s October 2011 8-K.)*
10(d) - Form of Restricted Stock Agreement under Registrant’s 2006 Equity Incentive Plan for grants to directors. (Incorporated herein by reference to Exhibit 10.6 to Registrant’s October 2011 8-K.)*
10(e) - Third Amended and Restated Credit Agreement dated as of March 4, 2014 among Registrant, Bank of America N.A., PNC Bank, National Association, and Wells Fargo Bank, National Association. (Incorporated herein by reference to Exhibit 10.1 to Registrant’s Current Report on Form 8-K filed on March 10, 2014, File No. 001-31337.)
68
10(f) – Succession Plan Agreement dated as of March 17, 2016 between Registrant and Andrew A. Krakauer. (Incorporated herein by reference to Exhibit 10.1 of Registrant’s Current Report on Form 8-K filed on March 17, 2016, File No. 001-31337.)*
10(g) - Amended and Restated Executive Severance Agreement dated as of August 1, 2016 between Registrant and Jorgen B. Hansen. (Incorporated herein by reference to Exhibit 10.1 of Registrant’s Current Report on Form 8-K filed on August 1, 2016, File No. 001-31337.)*
10(h) - Amended and Restated Executive Severance Agreement dated as of November 17, 2014 between Registrant and Eric W. Nodiff (Incorporated herein by reference to Exhibit 10.3 of Registrant’s Current Report on Form 8-K filed on November 19, 2014, File No. 001-31337.)*
10(i) - Executive Severance Agreement dated as of March 23, 2015 between Registrant and Peter Clifford (Incorporated herein by reference to Exhibit 10.1 of Registrant’s Current Report on Form 8-K filed on March 25, 2015, File No. 001-31337 [the “March 2015 8-K”].)*
10(j) - Confidentiality and Non-Competition Agreement dated as of January 1, 2010 between Registrant and Andrew A. Krakauer (Incorporated herein by reference to Exhibit 10.6 of Registrant’s Current Report on Form 8-K filed on February 12, 2010, File No. 001-31337 [the “February 2010 8-K”].)*
10(k) - Confidentiality and Non-Competition Agreement dated as of November 15, 2012 between Registrant and Jorgen B. Hansen (Incorporated herein by reference to Exhibit 10(m) of Registrant’s Annual Report on Form 10-K for the fiscal year ended July 31, 2012, File No. 001-31337.)*
10(l) - Confidentiality and Non-Competition Agreement dated as of January 1, 2010 between Registrant and Eric W. Nodiff (Incorporated herein by reference to Exhibit 10.9 of Registrant’s February 2010 8-K.)*
10(m) - Confidentiality and Non-Competition Agreement dated as of March 23, 2015 between Registrant and Peter Clifford (Incorporated herein by reference to Exhibit 10.2 of Registrant’s March 2015 8-K.)*
10(n) — Letter Agreement between Registrant and Craig A. Sheldon dated as of April 15, 2014 (Incorporated herein by reference to Exhibit 10.1 of the Registrant’s Current Report on Form 8-K filed on April 17, 2014, File No. 001-31337.)*
10(o) - Cantel Medical Corp. Annual Incentive Compensation Plan (Incorporated herein by reference to Exhibit 10.2 of the Registrant’s October 2011 8-K.)*
10(p) - Cantel Medical Corp. Long Term Incentive Compensation Plan (Incorporated herein by reference to Exhibit 10.3 of the Registrant’s October 2011 8-K.)*
10(q) – Cantel Medical Corp. 2016 Equity Incentive Plan (Incorporated herein by reference to Annex A of Registrant’s Proxy Statement for the 2015 Annual Meeting of Stockholders, filed with the SEC on November 30, 2015, File No. 001-31337.)*
10(r) - Form of Restricted Stock Agreement (Time-Based Grants) under Cantel Medical Corp. 2016 Equity Incentive Plan for grants to executive officers.*
10(s) - Form of Restricted Stock Agreement (Time-Based Grants) under Cantel Medical Corp. 2016 Equity Incentive Plan for grants to directors.*
10(t) - Form of Restricted Stock Agreement (Performance-Based Grants – Revenue Based) under Cantel Medical Corp. 2016 Equity Incentive Plan for grants to executive officers.*
69
10(u) - Form of Restricted Stock Agreement (Performance-Based Grants – TSR Based) under Cantel Medical Corp. 2016 Equity Incentive Plan for grants to executive officers.*
10(v) - Form of Restricted Stock Agreement (Time-Based) under Cantel Medical Corp. 2016 Equity Incentive Plan for annual grants to directors.
21 - Subsidiaries of Registrant.
23 - Consent of Ernst & Young LLP.
31.1 - Certification of Principal Executive Officer.
31.2 - Certification of Principal Financial Officer.
32 - Certification of Chief Executive Officer and Chief Financial Officer pursuant to 18 U.S.C. Section 1350, as adopted pursuant to Section 906 of the Sarbanes-Oxley Act of 2002.
101 The following materials from Cantel Medical Corp.’s Form 10-K for the fiscal year ended July 31, 2016, formatted in Extensible Business Reporting Language (XBRL): (i) Consolidated Balance Sheets at July 31, 2016 and 2015, (ii) Consolidated Statements of Income for each of the three years in the period ended July 31, 2016, (iii) Consolidated Statements of Comprehensive Income for each of the three years in the period ended July 31, 2016, (iv) Consolidated Statements of Changes in Stockholders’ Equity for each of the three years in the period ended July 31, 2016, (v) Consolidated Statements of Cash Flows for each of the three years in the period ended July 31, 2016 and (vi) Notes to Consolidated Financial Statements.
*Management contract or compensatory plan or arrangement of the Company required to be filed as an exhibit.
70
SIGNATURES
Pursuant to the requirements of Section 13 or 15(d) of the Securities Exchange Act of 1934, the registrant has duly caused this report to be signed on its behalf by the undersigned, thereunto duly authorized.
|
|
CANTEL MEDICAL CORP. |
||
|
|
|
||
|
Date: September 29, 2016 |
By: |
/s/ Jorgen B. Hansen |
|
|
|
Jorgen B. Hansen, President and Chief Executive |
||
|
|
Officer (Principal Executive Officer) |
||
|
|
|
||
|
|
By: |
/s/ Peter G. Clifford |
|
|
|
Peter G. Clifford, Executive Vice President, |
||
|
|
Chief Financial Officer |
||
|
|
(Principal Financial Officer) |
||
|
|
|
||
|
|
By: |
/s/ Steven C. Anaya |
|
|
|
Steven C. Anaya, Senior Vice President and Chief |
||
|
|
Accounting Officer |
||
|
|
(Principal Accounting Officer) |
||
Pursuant to the requirements of the Securities Exchange Act of 1934, this report has been signed below by the following persons on behalf of the registrant and in the capacities and on the dates indicated:
|
/s/ Charles M. Diker |
|
Date: |
|
September 29, 2016 |
|
Charles M. Diker, a Director and Chairman of the Board |
|
|
|
|
|
|
|
|
|
|
|
/s/ George L. Fotiades |
|
Date: |
|
September 29, 2016 |
|
George L. Fotiades, a Director |
|
|
|
|
|
and Vice Chairman of the Board |
|
|
|
|
|
|
|
|
|
|
|
/s/ Alan. R. Batkin |
|
Date: |
|
September 29, 2016 |
|
Alan R. Batkin, a Director |
|
|
|
|
|
|
|
|
|
|
|
/s/ Ann E. Berman |
|
Date: |
|
September 29, 2016 |
|
Ann E. Berman, a Director |
|
|
|
|
|
|
|
|
|
|
|
/s/ Joseph M. Cohen |
|
Date: |
|
September 29, 2016 |
|
Joseph M. Cohen, a Director |
|
|
|
|
|
|
|
|
|
|
|
/s/ Mark N. Diker |
|
Date: |
|
September 29, 2016 |
|
Mark N. Diker, a Director |
|
|
|
|
|
|
|
|
|
|
|
/s/ Laura L. Forese |
|
Date: |
|
September 29, 2016 |
|
Laura L. Forese, a Director |
|
|
|
|
|
|
|
|
|
|
|
/s/ Jorgen B. Hansen |
|
Date: |
|
September 29, 2016 |
|
Jorgen B. Hansen, a Director, President and CEO |
|
|
|
|
|
|
|
|
|
|
|
/s/ Bruce Slovin |
|
Date: |
|
September 29, 2016 |
|
Bruce Slovin, a Director |
|
|
|
|
|
|
|
|
|
|
|
/s/ Ronnie Myers |
|
Date |
|
September 29, 2016 |
|
Ronnie Myers, a Director |
|
|
|
|
71
CANTEL MEDICAL CORP.
CONSOLIDATED FINANCIAL STATEMENTS
JULY 31, 2016
CONTENTS
|
|
1 | |
|
|
|
|
|
Financial Statements |
|
|
|
|
|
|
|
|
2 | |
|
|
3 | |
|
|
4 | |
|
|
5 | |
|
|
6 | |
|
|
7 |
Report of Independent Registered Public Accounting Firm
The Board of Directors and Stockholders
Cantel Medical Corp.
We have audited the accompanying consolidated balance sheets of Cantel Medical Corp. as of July 31, 2016 and 2015, and the related consolidated statements of income, comprehensive income, changes in stockholders’ equity and cash flows for each of the three years in the period ended July 31, 2016. Our audits also included the financial statement schedule included in the Index at Item 15(a). These financial statements and schedule are the responsibility of the Company’s management. Our responsibility is to express an opinion on these financial statements and schedule based on our audits.
We conducted our audits in accordance with the standards of the Public Company Accounting Oversight Board (United States). Those standards require that we plan and perform the audit to obtain reasonable assurance about whether the financial statements are free of material misstatement. An audit includes examining, on a test basis, evidence supporting the amounts and disclosures in the financial statements. An audit also includes assessing the accounting principles used and significant estimates made by management, as well as evaluating the overall financial statement presentation. We believe that our audits provide a reasonable basis for our opinion.
In our opinion, the financial statements referred to above present fairly, in all material respects, the consolidated financial position of Cantel Medical Corp. at July 31, 2016 and 2015, and the consolidated results of its operations and its cash flows for each of the three years in the period ended July 31, 2016, in conformity with U.S. generally accepted accounting principles. Also, in our opinion, the related financial statement schedule, when considered in relation to the basic financial statements taken as a whole, presents fairly in all material respects the information set forth therein.
We also have audited, in accordance with the standards of the Public Company Accounting Oversight Board (United States), Cantel Medical Corp.’s internal control over financial reporting as of July 31, 2016, based on criteria established in Internal Control-Integrated Framework issued by the Committee of Sponsoring Organizations of the Treadway Commission (2013 framework) and our report dated September 29, 2016 expressed an unqualified opinion thereon.
|
|
/s/ Ernst & Young LLP |
New York, New York
September 29, 2016
1
CANTEL MEDICAL CORP.
(Dollar Amounts in Thousands, Except Share Data)
|
|
|
July 31, |
|
||||
|
|
|
2016 |
|
2015 |
|
||
|
Assets |
|
|
|
|
|
|
|
|
Current assets: |
|
|
|
|
|
|
|
|
Cash and cash equivalents |
|
$ |
28,367 |
|
$ |
31,720 |
|
|
Accounts receivable, net of allowance for doubtful accounts of $1,850 in 2016 and $2,092 in 2015 |
|
|
93,332 |
|
|
69,805 |
|
|
Inventories, net |
|
|
91,486 |
|
|
72,078 |
|
|
Deferred income taxes |
|
|
— |
|
|
6,233 |
|
|
Prepaid expenses and other current assets |
|
|
9,557 |
|
|
8,525 |
|
|
Total current assets |
|
|
222,742 |
|
|
188,361 |
|
|
Property and equipment, at cost: |
|
|
|
|
|
|
|
|
Land, buildings and improvements |
|
|
44,387 |
|
|
38,224 |
|
|
Furniture and equipment |
|
|
95,033 |
|
|
81,585 |
|
|
Leasehold improvements |
|
|
6,048 |
|
|
4,786 |
|
|
|
|
|
145,468 |
|
|
124,595 |
|
|
Less accumulated depreciation and amortization |
|
|
(70,864) |
|
|
(62,054) |
|
|
|
|
|
74,604 |
|
|
62,541 |
|
|
Intangible assets, net |
|
|
111,719 |
|
|
85,836 |
|
|
Goodwill |
|
|
280,318 |
|
|
241,951 |
|
|
Other assets |
|
|
5,149 |
|
|
5,342 |
|
|
|
|
$ |
694,532 |
|
$ |
584,031 |
|
|
Liabilities and stockholders’ equity |
|
|
|
|
|
|
|
|
Current liabilities: |
|
|
|
|
|
|
|
|
Accounts payable |
|
$ |
26,263 |
|
$ |
16,184 |
|
|
Compensation payable |
|
|
25,555 |
|
|
18,557 |
|
|
Accrued expenses |
|
|
20,283 |
|
|
15,092 |
|
|
Deferred revenue |
|
|
20,173 |
|
|
18,323 |
|
|
Income taxes payable |
|
|
4,061 |
|
|
2,468 |
|
|
Total current liabilities |
|
|
96,335 |
|
|
70,624 |
|
|
|
|
|
|
|
|
|
|
|
Long-term debt |
|
|
116,000 |
|
|
78,500 |
|
|
Deferred income taxes |
|
|
23,579 |
|
|
23,722 |
|
|
Contingent consideration |
|
|
— |
|
|
751 |
|
|
Other long-term liabilities |
|
|
4,248 |
|
|
3,801 |
|
|
|
|
|
|
|
|
|
|
|
Commitments and contingencies |
|
|
— |
|
|
— |
|
|
|
|
|
|
|
|
|
|
|
Stockholders’ equity: |
|
|
|
|
|
|
|
|
Preferred Stock, par value $1.00 per share; authorized 1,000,000 shares; none issued |
|
|
— |
|
|
— |
|
|
Common Stock, par value $.10 per share; authorized 75,000,000 shares; issued 2016 - 46,084,047 shares, outstanding 2016 - 41,708,214 shares; issued 2015 - 45,913,154 shares, outstanding 2015 - 41,604,359 shares |
|
|
4,608 |
|
|
4,591 |
|
|
Additional paid-in capital |
|
|
165,573 |
|
|
156,050 |
|
|
Retained earnings |
|
|
342,053 |
|
|
287,105 |
|
|
Accumulated other comprehensive (loss) income |
|
|
(11,795) |
|
|
1,224 |
|
|
Treasury Stock, at cost; 2016 - 4,375,833 shares at cost; 2015 - 4,308,795 shares at cost |
|
|
(46,069) |
|
|
(42,337) |
|
|
Total stockholders’ equity |
|
|
454,370 |
|
|
406,633 |
|
|
|
|
$ |
694,532 |
|
$ |
584,031 |
|
See accompanying notes.
2
CANTEL MEDICAL CORP.
CONSOLIDATED STATEMENTS OF INCOME
(Dollar Amounts in Thousands, Except Per Share Data)
|
|
|
|
|
|
|
|
|
|
|
|
|
|
|
Year Ended July 31, |
|
|||||||
|
|
|
2016 |
|
2015 |
|
2014 |
|
|||
|
Net sales |
|
|
|
|
|
|
|
|
|
|
|
Product sales |
|
$ |
584,750 |
|
$ |
493,656 |
|
$ |
434,531 |
|
|
Product service |
|
|
80,005 |
|
|
71,348 |
|
|
54,218 |
|
|
Total net sales |
|
|
664,755 |
|
|
565,004 |
|
|
488,749 |
|
|
|
|
|
|
|
|
|
|
|
|
|
|
Cost of sales |
|
|
|
|
|
|
|
|
|
|
|
Product sales |
|
|
300,704 |
|
|
260,903 |
|
|
236,429 |
|
|
Product service |
|
|
54,865 |
|
|
50,634 |
|
|
39,021 |
|
|
Total cost of sales |
|
|
355,569 |
|
|
311,537 |
|
|
275,450 |
|
|
|
|
|
|
|
|
|
|
|
|
|
|
Gross profit |
|
|
309,186 |
|
|
253,467 |
|
|
213,299 |
|
|
|
|
|
|
|
|
|
|
|
|
|
|
Expenses: |
|
|
|
|
|
|
|
|
|
|
|
Selling |
|
|
99,062 |
|
|
80,787 |
|
|
66,519 |
|
|
General and administrative |
|
|
97,463 |
|
|
77,897 |
|
|
65,039 |
|
|
Research and development |
|
|
15,410 |
|
|
14,022 |
|
|
10,813 |
|
|
Total operating expenses |
|
|
211,935 |
|
|
172,706 |
|
|
142,371 |
|
|
|
|
|
|
|
|
|
|
|
|
|
|
Income from operations |
|
|
97,251 |
|
|
80,761 |
|
|
70,928 |
|
|
|
|
|
|
|
|
|
|
|
|
|
|
Interest expense |
|
|
3,408 |
|
|
2,432 |
|
|
2,380 |
|
|
Interest income |
|
|
(88) |
|
|
(68) |
|
|
(63) |
|
|
Loss on sale of business |
|
|
— |
|
|
2,206 |
|
|
— |
|
|
|
|
|
|
|
|
|
|
|
|
|
|
Income before income taxes |
|
|
93,931 |
|
|
76,191 |
|
|
68,611 |
|
|
|
|
|
|
|
|
|
|
|
|
|
|
Income taxes |
|
|
33,978 |
|
|
28,238 |
|
|
25,346 |
|
|
|
|
|
|
|
|
|
|
|
|
|
|
Net income |
|
$ |
59,953 |
|
$ |
47,953 |
|
$ |
43,265 |
|
|
|
|
|
|
|
|
|
|
|
|
|
|
Earnings per common share: |
|
|
|
|
|
|
|
|
|
|
|
Basic |
|
$ |
1.44 |
|
$ |
1.16 |
|
$ |
1.05 |
|
|
Diluted |
|
$ |
1.44 |
|
$ |
1.15 |
|
$ |
1.04 |
|
|
Dividends per common share |
|
$ |
0.12 |
|
$ |
0.10 |
|
$ |
0.09 |
|
See accompanying notes.
3
CANTEL MEDICAL CORP.
CONSOLIDATED STATEMENTS OF COMPREHENSIVE INCOME
(Dollar Amounts in Thousands)
|
|
|
|
|
|
|
|
|
|
|
|
|
|
|
Year Ended July 31, |
|
|||||||
|
|
|
2016 |
|
2015 |
|
2014 |
|
|||
|
|
|
|
|
|
|
|
|
|
|
|
|
Net income |
|
$ |
59,953 |
|
$ |
47,953 |
|
$ |
43,265 |
|
|
|
|
|
|
|
|
|
|
|
|
|
|
Other comprehensive loss: |
|
|
|
|
|
|
|
|
|
|
|
Foreign currency translation |
|
|
(13,019) |
|
|
(7,064) |
|
|
(1,528) |
|
|
Reclassification adjustment to loss on sale of business for foreign currency translation gain included in net income during the year |
|
|
— |
|
|
(1,264) |
|
|
— |
|
|
Unrealized holding losses on interest rate swaps arising during the year, net of tax |
|
|
— |
|
|
— |
|
|
(30) |
|
|
Reclassification adjustment to interest expense for losses on interest rate swaps included in net income during the year, net of tax |
|
|
— |
|
|
— |
|
|
60 |
|
|
Reclassification adjustment to interest expense for ineffective hedge on interest rate swap included in net income during the year, net of tax |
|
|
— |
|
|
— |
|
|
73 |
|
|
Total other comprehensive loss |
|
|
(13,019) |
|
|
(8,328) |
|
|
(1,425) |
|
|
|
|
|
|
|
|
|
|
|
|
|
|
Comprehensive income |
|
$ |
46,934 |
|
$ |
39,625 |
|
$ |
41,840 |
|
See accompanying notes.
4
CANTEL MEDICAL CORP.
CONSOLIDATED STATEMENTS OF CHANGES IN STOCKHOLDERS’ EQUITY
(Dollar amounts in Thousands, Except Share Data)
Years Ended July 31, 2016, 2015 and 2014
|
|
|
Common Stock |
|
|
|
|
|
|
|
Accumulated |
|
|
|
|
Total |
|
|||||
|
|
|
Number of |
|
|
|
|
Additional |
|
|
|
|
Other |
|
Treasury |
|
Stock- |
|
||||
|
|
|
Shares |
|
|
|
|
Paid-in |
|
Retained |
|
Comprehensive |
|
Stock, |
|
holders’ |
|
|||||
|
|
|
Outstanding |
|
Amount |
|
Capital |
|
Earnings |
|
Income |
|
at Cost |
|
Equity |
|
||||||
|
|
|
|
|
|
|
|
|
|
|
|
|
|
|
|
|
|
|
|
|
|
|
|
Balance, July 31, 2013 |
|
41,138,121 |
|
$ |
4,518 |
|
$ |
134,853 |
|
$ |
203,762 |
|
$ |
10,977 |
|
$ |
(32,978) |
|
$ |
321,132 |
|
|
|
|
|
|
|
|
|
|
|
|
|
|
|
|
|
|
|
|
|
|
|
|
|
Exercises of options |
|
187,468 |
|
|
21 |
|
|
1,420 |
|
|
— |
|
|
— |
|
|
(807) |
|
|
634 |
|
|
Repurchases of shares |
|
(132,023) |
|
|
— |
|
|
— |
|
|
— |
|
|
— |
|
|
(4,439) |
|
|
(4,439) |
|
|
Stock-based compensation |
|
— |
|
|
— |
|
|
5,409 |
|
|
— |
|
|
— |
|
|
— |
|
|
5,409 |
|
|
Issuance of restricted stock |
|
258,760 |
|
|
26 |
|
|
(26) |
|
|
— |
|
|
— |
|
|
— |
|
|
— |
|
|
Cancellations of restricted stock |
|
(10,066) |
|
|
(1) |
|
|
1 |
|
|
— |
|
|
— |
|
|
— |
|
|
— |
|
|
Excess tax benefit from exercises of stock options and vesting of restricted stock |
|
— |
|
|
— |
|
|
4,391 |
|
|
— |
|
|
— |
|
|
— |
|
|
4,391 |
|
|
Dividends on common stock |
|
— |
|
|
— |
|
|
— |
|
|
(3,721) |
|
|
— |
|
|
— |
|
|
(3,721) |
|
|
Net income |
|
— |
|
|
— |
|
|
— |
|
|
43,265 |
|
|
— |
|
|
— |
|
|
43,265 |
|
|
Other comprehensive income |
|
— |
|
|
— |
|
|
— |
|
|
— |
|
|
(1,425) |
|
|
— |
|
|
(1,425) |
|
|
Balance, July 31, 2014 |
|
41,442,260 |
|
|
4,564 |
|
|
146,048 |
|
|
243,306 |
|
|
9,552 |
|
|
(38,224) |
|
|
365,246 |
|
|
|
|
|
|
|
|
|
|
|
|
|
|
|
|
|
|
|
|
|
|
|
|
|
Exercises of options |
|
130,911 |
|
|
13 |
|
|
981 |
|
|
— |
|
|
— |
|
|
(386) |
|
|
608 |
|
|
Repurchases of shares |
|
(100,286) |
|
|
— |
|
|
— |
|
|
— |
|
|
— |
|
|
(3,727) |
|
|
(3,727) |
|
|
Stock-based compensation |
|
— |
|
|
— |
|
|
5,867 |
|
|
— |
|
|
— |
|
|
— |
|
|
5,867 |
|
|
Issuance of restricted stock |
|
144,278 |
|
|
15 |
|
|
(15) |
|
|
— |
|
|
— |
|
|
— |
|
|
— |
|
|
Cancellations of restricted stock |
|
(12,804) |
|
|
(1) |
|
|
1 |
|
|
— |
|
|
— |
|
|
— |
|
|
— |
|
|
Excess tax benefit from exercises of stock options and vesting of restricted stock |
|
— |
|
|
— |
|
|
3,168 |
|
|
— |
|
|
— |
|
|
— |
|
|
3,168 |
|
|
Dividends on common stock |
|
— |
|
|
— |
|
|
— |
|
|
(4,154) |
|
|
— |
|
|
— |
|
|
(4,154) |
|
|
Net income |
|
— |
|
|
— |
|
|
— |
|
|
47,953 |
|
|
— |
|
|
— |
|
|
47,953 |
|
|
Other comprehensive income |
|
— |
|
|
— |
|
|
— |
|
|
— |
|
|
(8,328) |
|
|
— |
|
|
(8,328) |
|
|
Balance, July 31, 2015 |
|
41,604,359 |
|
|
4,591 |
|
|
156,050 |
|
|
287,105 |
|
|
1,224 |
|
|
(42,337) |
|
|
406,633 |
|
|
|
|
|
|
|
|
|
|
|
|
|
|
|
|
|
|
|
|
|
|
|
|
|
Repurchases of shares |
|
(67,038) |
|
|
— |
|
|
— |
|
|
— |
|
|
— |
|
|
(3,732) |
|
|
(3,732) |
|
|
Stock-based compensation |
|
— |
|
|
— |
|
|
8,361 |
|
|
— |
|
|
— |
|
|
— |
|
|
8,361 |
|
|
Issuance of restricted stock |
|
175,700 |
|
|
17 |
|
|
(17) |
|
|
— |
|
|
— |
|
|
— |
|
|
— |
|
|
Cancellations of restricted stock |
|
(4,807) |
|
|
— |
|
|
— |
|
|
— |
|
|
— |
|
|
— |
|
|
— |
|
|
Excess tax benefit from exercises of stock options and vesting of restricted stock |
|
— |
|
|
— |
|
|
1,179 |
|
|
— |
|
|
— |
|
|
— |
|
|
1,179 |
|
|
Dividends on common stock |
|
— |
|
|
— |
|
|
— |
|
|
(5,005) |
|
|
— |
|
|
— |
|
|
(5,005) |
|
|
Net income |
|
— |
|
|
— |
|
|
— |
|
|
59,953 |
|
|
— |
|
|
— |
|
|
59,953 |
|
|
Other comprehensive income |
|
— |
|
|
— |
|
|
— |
|
|
— |
|
|
(13,019) |
|
|
— |
|
|
(13,019) |
|
|
Balance, July 31, 2016 |
|
41,708,214 |
|
$ |
4,608 |
|
$ |
165,573 |
|
$ |
342,053 |
|
$ |
(11,795) |
|
$ |
(46,069) |
|
$ |
454,370 |
|
See accompanying notes.
5
CANTEL MEDICAL CORP.
CONSOLIDATED STATEMENTS OF CASH FLOWS
(Dollar Amounts in Thousands)
|
|
|
|
|
|
|
|
|
|
|
|
|
|
|
Year Ended July 31, |
|
|||||||
|
|
|
2016 |
|
2015 |
|
2014 |
|
|||
|
Cash flows from operating activities |
|
|
|
|
|
|
|
|
|
|
|
Net income |
|
$ |
59,953 |
|
$ |
47,953 |
|
$ |
43,265 |
|
|
Adjustments to reconcile net income to net cash provided by operating activities: |
|
|
|
|
|
|
|
|
|
|
|
Depreciation |
|
|
11,989 |
|
|
10,692 |
|
|
8,245 |
|
|
Amortization |
|
|
13,095 |
|
|
13,265 |
|
|
10,641 |
|
|
Stock-based compensation expense |
|
|
8,361 |
|
|
5,867 |
|
|
5,409 |
|
|
Amortization of debt issuance costs |
|
|
401 |
|
|
401 |
|
|
440 |
|
|
Loss on disposal of fixed assets |
|
|
553 |
|
|
360 |
|
|
501 |
|
|
Loss on sale of business |
|
|
— |
|
|
2,206 |
|
|
— |
|
|
Impairment of assets |
|
|
— |
|
|
1,287 |
|
|
— |
|
|
Fair value adjustments to acquisition related liabilities |
|
|
(687) |
|
|
(2,585) |
|
|
219 |
|
|
Deferred income taxes |
|
|
(1,710) |
|
|
(1,449) |
|
|
(1,218) |
|
|
Excess tax benefits from stock-based compensation |
|
|
(1,179) |
|
|
(3,168) |
|
|
(4,391) |
|
|
Changes in assets and liabilities, net of effects of business acquisitions/divestiture: |
|
|
|
|
|
|
|
|
|
|
|
Accounts receivable |
|
|
(12,729) |
|
|
(3,905) |
|
|
(6,149) |
|
|
Inventories |
|
|
(15,558) |
|
|
(10,075) |
|
|
(2,658) |
|
|
Prepaid expenses and other current assets |
|
|
(2,850) |
|
|
(2,996) |
|
|
(2,388) |
|
|
Accounts payable and other current liabilities |
|
|
17,657 |
|
|
(3,347) |
|
|
6,205 |
|
|
Income taxes |
|
|
2,972 |
|
|
4,564 |
|
|
6,151 |
|
|
Net cash provided by operating activities |
|
|
80,268 |
|
|
59,070 |
|
|
64,272 |
|
|
|
|
|
|
|
|
|
|
|
|
|
|
Cash flows from investing activities |
|
|
|
|
|
|
|
|
|
|
|
Capital expenditures |
|
|
(18,889) |
|
|
(12,760) |
|
|
(13,541) |
|
|
Proceeds from disposal of fixed assets |
|
|
96 |
|
|
25 |
|
|
14 |
|
|
Proceeds from sale of business, net of cash retained and disposal costs |
|
|
— |
|
|
3,767 |
|
|
— |
|
|
Acquisition of businesses, net of cash acquired |
|
|
(94,528) |
|
|
(43,567) |
|
|
(33,547) |
|
|
Other, net |
|
|
339 |
|
|
241 |
|
|
(358) |
|
|
Net cash used in investing activities |
|
|
(112,982) |
|
|
(52,294) |
|
|
(47,432) |
|
|
|
|
|
|
|
|
|
|
|
|
|
|
Cash flows from financing activities |
|
|
|
|
|
|
|
|
|
|
|
Borrowings under revolving credit facility |
|
|
96,500 |
|
|
47,000 |
|
|
28,000 |
|
|
Repayments under term loan facility |
|
|
— |
|
|
— |
|
|
(5,000) |
|
|
Repayments under revolving credit facility |
|
|
(59,000) |
|
|
(49,000) |
|
|
(37,500) |
|
|
Debt modification costs |
|
|
— |
|
|
— |
|
|
(1,314) |
|
|
Proceeds from exercises of stock options |
|
|
— |
|
|
608 |
|
|
634 |
|
|
Dividends paid |
|
|
(5,005) |
|
|
(4,154) |
|
|
(3,721) |
|
|
Excess tax benefits from stock-based compensation |
|
|
1,179 |
|
|
3,168 |
|
|
4,391 |
|
|
Purchases of treasury stock |
|
|
(3,732) |
|
|
(3,727) |
|
|
(4,439) |
|
|
Net cash provided by (used in) financing activities |
|
|
29,942 |
|
|
(6,105) |
|
|
(18,949) |
|
|
|
|
|
|
|
|
|
|
|
|
|
|
Effect of exchange rate changes on cash and cash equivalents |
|
|
(581) |
|
|
(732) |
|
|
(186) |
|
|
|
|
|
|
|
|
|
|
|
|
|
|
Decrease in cash and cash equivalents |
|
|
(3,353) |
|
|
(61) |
|
|
(2,295) |
|
|
Cash and cash equivalents at beginning of period |
|
|
31,720 |
|
|
31,781 |
|
|
34,076 |
|
|
Cash and cash equivalents at end of period |
|
$ |
28,367 |
|
$ |
31,720 |
|
$ |
31,781 |
|
See accompanying notes.
6
CANTEL MEDICAL CORP.
NOTES TO CONSOLIDATED FINANCIAL STATEMENTS
Years Ended July 31, 2016, 2015 and 2014
1.Business Description
Cantel Medical Corp. (“Cantel”) is a leading provider of infection prevention products and services in the healthcare market, specializing in the following operating segments:
|
· |
Endoscopy: Medical device reprocessing systems, disinfectants, detergents and other supplies used to high-level disinfect rigid endoscopes, flexible endoscopes and other instrumentation and disposable infection control products intended to reduce the challenges associated with proper cleaning and high-level disinfection of numerous reusable components used in gastrointestinal (GI) endoscopy procedures. In September 2015, this segment commenced the sale of endoscope transport and storage systems, and a number of endoscopy consumable accessories. Additionally, this segment performs technical maintenance service on its products. |
|
· |
Water Purification and Filtration: Water purification equipment and services, filtration and separation products and disinfectant, sterilization and decontamination products and services for the medical, pharmaceutical, biotech, beverage and commercial industrial markets. |
|
· |
Healthcare Disposables: Single-use, infection prevention healthcare products including face masks, sterilization pouches, towels and bibs, tray covers, saliva ejectors, plastic cups, germicidal wipes and disinfectants, as well as products for maintaining safe dental unit waterlines. This segment also manufactures and sells biological and chemical indicators for sterility assurance monitoring services in the acute-care, alternate-care, dental and industrial (medical device, life science and other manufacturers) markets. In August 2016, this segment commenced the manufacture and sale of nitrous oxide conscious sedation equipment and related single-use disposable nasal masks. |
|
· |
Dialysis: Medical device reprocessing systems, sterilants/disinfectants, dialysate concentrates and other supplies for renal dialysis. |
In addition, through April 7, 2015, we had another operating segment, known as Specialty Packaging. This segment included specialty packaging and thermal control products, as well as related compliance training, for the transport of infectious and biological specimens and thermally sensitive pharmaceutical, medical and other products. The Specialty Packaging operating segment, which comprised the Other reporting segment for financial reporting purposes, was divested on April 7, 2015 as further described in Note 19 to the Consolidated Financial Statements.
Most of our equipment, consumables and supplies are used to help prevent the occurrence or spread of infections.
We operate our four operating segments through wholly-owned subsidiaries in the United States and internationally. Our principal operating subsidiaries in the United States are Medivators Inc., Mar Cor Purification, Inc., Crosstex International, Inc. and SPS Medical Supply Corp. Internationally, our primary operating subsidiaries include Cantel Medical (UK) Limited, Cantel Medical Asia/Pacific Pte. Ltd., Cantel Medical Devices (China) Co., Ltd., Biolab Equipment Ltd., Medivators B.V., and Cantel Medical (Italy) S.r.l. and effective September 14, 2015, Medical Innovations Group Holdings Limited. Subsequent to its acquisition, we changed the name of Medical Innovations Group Holdings Limited to Cantel (UK) Limited.
In fiscal 2016, we acquired (i) all of the issued and outstanding stock of Medical Innovations Group Holdings Limited and certain affiliated companies (collectively, “MI”) on September 14, 2015 (the “MI Acquisition”) and (ii) certain net assets of North American Science Associates, Inc.’s Sterility Assurance Monitoring Products division (“NAMSA”), on March 1, 2016 (the “NAMSA Acquisition”), as more fully described in Note 3 to the Consolidated Financial Statements. With the exception of acquisition costs primarily related to the MI Acquisition, the businesses of MI (the “MI Business”)
7
and NAMSA (the “NAMSA Business”) did not have a significant effect on our consolidated results of operations in fiscal 2016 due to the size of the business in relation to our overall consolidated results of operations and are not reflected in our consolidated results of operations in fiscals 2015 and 2014. The MI Acquisition is included in our Endoscopy segment. The NAMSA Acquisition is included in our Healthcare Disposables segment.
In fiscal 2015, we acquired (i) all of the issued and outstanding stock of MRLB International, Inc. (“MRLB”) on February 20, 2015 (the “DentaPure Acquisition”), (ii) certain net assets of Pure Water Solutions, Inc. (“PWS”) on January 1, 2015 (the “PWS Acquisition”) and (iii) all of the issued and outstanding stock of International Medical Service S.r.l. (“IMS”) on November 3, 2014 (the “IMS Acquisition”), as more fully described in Note 3 to the Consolidated Financial Statements. With the exception of acquisition related costs primarily related to the IMS Acquisition, the businesses of MRLB (the “DentaPure Business”), PWS (the “PWS Business”) and IMS (the “IMS Business”) did not have a significant effect on our consolidated results of operations in fiscals 2016 and 2015 due to the size of the businesses in relation to our overall consolidated results of operations and are not reflected in our consolidated results of operations in fiscal 2014. The DentaPure Business is included in our Healthcare Disposables segment. The PWS Business is included in our Water Purification and Filtration segment and the IMS Business is included in our Endoscopy segment. Subsequent to its acquisition, we changed the name of International Medical Service S.r.l. to Cantel Medical (Italy) S.r.l.
In fiscal 2014, we acquired all the issued and outstanding capital stock of (i) PuriCore International Limited (“PuriCore”) on June 30, 2014 (the “PuriCore Acquisition”), (ii) Sterilator Company, Inc. (“Sterilator”) on January 7, 2014 (the “Sterilator Acquisition”) and (iii) Jet Prep Ltd. (“Jet Prep”) on November 5, 2013 (the “Jet Prep Acquisition”), as more fully described in Note 3 to the Consolidated Financial Statements. With the exception of acquisition related costs related to the PuriCore Acquisition and acquisition related fair value adjustments related to the Jet Prep Business, the businesses of Sterilator (the “Sterilator Business”), Jet Prep (the “Jet Prep Business”) and PuriCore (the “PuriCore Business”) did not have a significant effect on our consolidated results of operations in fiscals 2016, 2015 and 2014 due to the size of the acquisitions in relation to our overall consolidated results of operations. The PuriCore and Jet Prep Businesses are included in our Endoscopy segment and the Sterilator Business is included in our Healthcare Disposables segment. Subsequent to its acquisition, we changed the name of PuriCore to Cantel Medical (UK) Limited.
Throughout this document, references to “Cantel,” “us,” “we,” “our,” and the “Company” are references to Cantel Medical Corp. and its subsidiaries, except where the context makes it clear the reference is to Cantel itself and not its subsidiaries.
Subsequent Events
On August 1, 2016, we acquired all of the issued and outstanding stock of Accutron, Inc. (“Accutron”), as more fully described in Note 3 to the Consolidated Financial Statements. The acquisition of Accutron will be included in our Healthcare Disposables segment.
On September 26, 2016, we acquired certain net assets of Vantage Endoscopy Inc. (“Vantage”) related to the distribution and sale of our Medivators endoscopy products in Canada, as more fully described in Note 3 to the Consolidated Financial Statements. The acquisition of Vantage will be included in our Endoscopy segment.
Primarily to fund the cash considerations paid and the costs associated with the acquisitions of Vantage and Accutron, we borrowed $61,000,000 subsequent to July 31, 2016 under our revolving credit facility, as more fully described in Notes 9 and 11 to the Consolidated Financial Statements. Since these two acquisitions occurred after July 31, 2016, their results of operations are not included in any periods presented.
We performed a review of events subsequent to July 31, 2016. Based upon that review, no other subsequent events occurred that required updating to our Consolidated Financial Statements or disclosures.
8
2.Summary of Significant Accounting Policies
The following is a summary of our significant accounting policies used to prepare our Consolidated Financial Statements.
Principles of Consolidation
The Consolidated Financial Statements include the accounts of Cantel and its wholly-owned subsidiaries. All intercompany transactions and balances have been eliminated in consolidation.
Revenue Recognition
Revenue on product sales is recognized as products are shipped to customers and title passes. The passing of title is determined based upon the FOB terms specified for each shipment. With respect to endoscopy and dialysis products, shipment terms are generally FOB origin for common carrier and when our distribution fleet is utilized (except for one large customer in dialysis and several endoscopy customers whereby all products are shipped FOB destination). With respect to water purification and filtration and healthcare disposable products, shipment terms may be either FOB origin or destination. Customer acceptance for the majority of our product sales occurs at the time of delivery. With respect to a portion of water purification and filtration and endoscopy product sales, equipment is sold as part of a system for which the equipment is functionally interdependent or the customer’s purchase order specifies “ship-complete” as a condition of delivery; revenue recognition on such sales is deferred until all equipment has been delivered, or post-delivery obligations such as installation have been substantially fulfilled such that the products are deemed functional by the end-user. All shipping and handling fees invoiced to customers, such as freight, are recorded as revenue (and related costs are included within cost of sales) at the time the sale is recognized.
A portion of our endoscopy, water purification and filtration and dialysis sales are recognized as multiple element arrangements, whereby revenue is allocated to the equipment, installation and consumable components based upon vendor specific objective evidence, which includes comparable historical transactions of similar equipment, installation and consumables sold as stand-alone components. If vendor-specific objective evidence of selling price is not available, we allocate revenue to the elements of the bundled arrangement using the estimated selling price method in order to qualify the components as separate units of accounting. Revenue on the equipment and consumables components are recognized as the equipment or consumable is shipped to customers and title passes. Revenue on the installation component is recognized when the installation is complete.
A portion of our healthcare disposables sales relating to the mail-in spore test kit is recorded as deferred revenue when initially sold. We recognize the revenue on these test kits using an estimate based on historical experience of the amount of time that elapses from the point of sale to when the kit is returned to us and we communicate to the customer the results of the required laboratory test. The related cost of the kits is recorded in inventory and recognized in cost of sales as the revenue is earned.
Revenue on service sales is recognized when repairs are completed at the customer’s location or when repairs are completed at our facilities and the products are shipped to customers. With respect to certain service contracts in our Endoscopy and Water Purification and Filtration operating segments, service revenue is recognized on a straight-line basis over the contractual term of the arrangement.
None of our sales contain right-of-return provisions. Customer claims for credit or return due to damage, defect, shortage or other reason must be pre-approved by us before credit is issued or such product is accepted for return. No cash discounts for early payment are offered except with respect to a small portion of our product sales in each segment. We do not offer price protection, although advance pricing contracts or required notice periods prior to implementation of price increases exist for certain customers with respect to many of our products. With respect to certain of our dialysis, healthcare disposables, water purification and filtration and endoscopy customers, rebates are provided; such rebates, which consist primarily of volume rebates, are provided for as a reduction of sales at the time of revenue recognition and amounted to $5,944,000, $5,597,000, and $4,498,000 in fiscals 2016, 2015, and 2014, respectively. Such allowances are determined based on estimated projections of sales volume for the entire rebate periods. If it becomes known that sales
9
volume to customers will deviate from original projections, the rebate provisions originally established would be adjusted accordingly.
Our endoscopy products and services are sold directly to hospitals and other end-users in the United States and primarily to distributors internationally except for the United Kingdom, Italy, Netherlands, Singapore, China and Germany where we sell directly to hospitals and other end-users; water purification and filtration products and services are sold directly to hospitals, dialysis clinics, pharmaceutical and biotechnology companies, laboratories, medical products and service companies and other end-users as well as through third-party distributors; the majority of our healthcare disposable products are sold to third party distributors and with respect to some of our sterility assurance products, to hospitals, surgery centers, physician and dental offices, dental schools, medical research companies, laboratories and other end-users; and the majority of our dialysis products are sold to dialysis clinics and hospitals. Sales to all of these customers follow our revenue recognition policies.
Translation of Foreign Currency Financial Statements
Assets and liabilities of our foreign subsidiaries are translated into United States dollars at year-end exchange rates; sales and expenses are translated using average exchange rates during the year. The cumulative effect of the translation of the accounts of the foreign subsidiaries is presented as a component of accumulated other comprehensive income or loss. Foreign exchange gains and losses related to the purchase of inventories denominated in foreign currencies are included in cost of sales and foreign exchange gains and losses related to the incurrence of operating costs denominated in foreign currencies and the conversion of foreign assets and liabilities into functional currencies are included in general and administrative expenses.
Cash and Cash Equivalents
We consider all highly liquid investments with maturities of three months or less when purchased to be cash equivalents.
Accounts Receivable and Allowance for Doubtful Accounts
Accounts receivable consist of amounts due to us from normal business activities. Allowances for doubtful accounts are reserves for the estimated loss from the inability of customers to make required payments. We use historical experience as well as current market information in determining the estimate. While actual losses have historically been within management’s expectations and provisions established, if the financial condition of our customers were to deteriorate, resulting in an impairment of their ability to make payments, additional allowances may be required. Alternatively, if certain customers paid their delinquent receivables, reductions in allowances may be required.
Inventories
Inventories consist of raw materials, work-in-process and finished products which are sold in the ordinary course of our business and are stated at the lower of cost (first-in, first-out) or market. In assessing the value of inventories, we must make estimates and judgments regarding reserves required for product obsolescence, aging of inventories and other issues potentially affecting the saleable condition of products. In performing such evaluations, we use historical experience as well as current market information. With few exceptions, the saleable value of our inventories has historically been within management’s expectation and provisions established, however, rapid changes in the market due to competition, technology and various other factors could have an adverse effect on the saleable value of our inventories, resulting in the need for additional reserves.
Property and Equipment
Property and equipment are stated at cost. Additions and improvements are capitalized, while maintenance and repair costs are expensed. When assets are retired or otherwise disposed, the cost and related accumulated depreciation or amortization is removed from the respective accounts and any resulting gain or loss is included in income. Depreciation and amortization is provided on the straight-line method over the estimated useful lives of the assets which generally range from 2-15 years for furniture and equipment, 5-32 years for buildings and improvements and the shorter of the life
10
of the asset or the life of the lease for leasehold improvements. Depreciation and amortization expense related to property and equipment in fiscals 2016, 2015 and 2014 was $11,989,000, $10,692,000 and $8,245,000, respectively.
Goodwill and Intangible Assets
Certain of our identifiable intangible assets, including customer relationships, technology, brand names, non-compete agreements and patents, are amortized using the straight-line method over their estimated useful lives which range from 3 to 20 years. Additionally, we have recorded goodwill and trademarks and trade names, all of which have indefinite useful lives and are therefore not amortized. All of our intangible assets and goodwill are reviewed for impairment whenever events or changes in circumstances indicate that the carrying amount of an asset may not be recoverable, and goodwill and intangible assets with indefinite lives are reviewed for impairment at least annually. Our management is responsible for determining if impairment exists and considers a number of factors, including third-party valuations, when making these determinations.
We first assess qualitative factors to determine whether it is more likely than not that the fair value of the reporting unit is less than the carrying amount before proceeding to step one of the two-step quantitative goodwill impairment test, if necessary. Such qualitative factors that are assessed include evaluating a segment’s financial performance, industry and market conditions, macroeconomic conditions and specific issues that can directly affect the segment such as changes in business strategies, competition, supplier relationships, operating costs, regulatory matters, litigation and the composition of the segment’s assets due to acquisitions or other events. At July 31, 2016, because we determined through qualitative factors that the fair values of our Endoscopy, Water Purification and Filtration and Healthcare Disposables segments were unlikely to be less than the carrying value, we did not proceed to step one of the two-step quantitative goodwill impairment test for those three segments. We performed step one of the two-step quantitative goodwill impairment test for Dialysis due to the continuing shift by our customers from reusable to single-use dialyzers, which is having an adverse impact on our business and is expected to continue, as further described in “Risk Factors”. In performing a detailed quantitative review for goodwill impairment, management uses a two-step process that begins with an estimation of the fair value of the related operating segments by using weighted fair value results of the discounted cash flow methodology, as well as the market multiple and comparable transaction methodologies, where applicable. The first step is a review for potential impairment, and the second step measures the amount of impairment, if any.
We perform our annual impairment review for indefinite lived intangibles by first assessing qualitative factors, such as those described above, to determine whether it is more likely than not that the fair value of such assets is less than the carrying values, and if necessary, we perform a quantitative analysis comparing the current fair value of our indefinite lived intangibles assets to their carrying values. At July 31, 2016, because we determined through qualitative factors that the fair values of all of our indefinite lived intangible assets were unlikely to be less than the carrying value, we did not perform a quantitative analysis for those assets. With respect to amortizable intangible assets when impairment indicators are present, management would determine whether expected future non-discounted cash flows would be sufficient to recover the carrying value of the assets; if not, the carrying value of the assets would be adjusted to their fair value.
Management concluded that none of our intangible assets or goodwill was impaired as of July 31, 2016.
While the results of these annual reviews have historically not indicated impairment, impairment reviews are highly dependent on management’s projections of our future operating results and cash flows (which management believes to be reasonable), discount rates based on the Company’s weighted average cost of capital and appropriate benchmark peer companies. Assumptions used in determining future operating results and cash flows include current and expected market conditions and future sales and earnings forecasts. Subsequent changes in these assumptions and estimates could result in future impairment. Although we consistently use the same methods in developing the assumptions and estimates underlying the fair value calculations, such estimates are uncertain by nature and can vary from actual results. At July 31, 2016, the fair value of all of our reporting units exceeded book value by substantial amounts.
11
Long-Lived Assets
We evaluate the carrying value of long-lived assets including property, equipment and other assets whenever events or changes in circumstances indicate that the carrying value may not be recoverable. An assessment is made to determine if the sum of the expected future non-discounted cash flows from the use of the assets and eventual disposition is less than the carrying value. If the sum of the expected non-discounted cash flows is less than the carrying value, an impairment loss is recognized based on fair value. With the exception of the impairment on an acquired license as further described in Note 6 to the Consolidated Financial Statements, our historical assessments of our long-lived assets have not differed significantly from the actual amounts realized. However, the determination of fair value requires us to make certain assumptions and estimates and is highly subjective. On July 31, 2016, management concluded that no other events or changes in circumstances have occurred that would indicate that the carrying amount of our long-lived assets may not be recoverable.
Other Assets
Debt issuance costs associated with our credit facilities are amortized to interest expense over the life of the credit facilities. As of July 31, 2016 and 2015, such debt issuance costs, net of related amortization, were included in other assets and amounted to $946,000 and $1,312,000, respectively.
Warranties
We provide for estimated costs that may be incurred to remedy deficiencies of quality or performance of our products at the time of revenue recognition. Most of our products have a one year warranty, although certain endoscopy and water purification and filtration products that require installation may carry a warranty period of up to fifteen months. Additionally, many of our consumables, accessories and parts have a 90 day warranty. We record provisions for product warranties as a component of cost of sales based upon an estimate of the amounts necessary to settle existing and future claims on products sold. The historical relationship of warranty costs to products sold is the primary basis for the estimate. A significant increase in third party service repair rates, the cost and availability of parts or the frequency of claims could have a material adverse impact on our results for the period or periods in which such claims or additional costs materialize.
Management reviews its warranty exposure periodically and believes that the warranty reserves are adequate; however, actual claims incurred could differ from original estimates, requiring adjustments to the reserves.
Stock-Based Compensation
Stock compensation expense is recognized for any option or stock award grant based upon the award’s fair value. All of our stock options and stock awards (which consist only of restricted stock) are subject to graded vesting in which portions of the award vest at different times during the vesting period, as opposed to awards that vest at the end of the vesting period. We recognize compensation expense for awards subject to graded vesting using the straight-line basis, reduced by estimated forfeitures. Forfeitures are estimated at the time of grant and revised, if necessary, in subsequent periods if actual forfeitures differ from those estimates. Forfeitures are estimated based on historical experience.
The stock-based compensation expense recorded in our Consolidated Financial Statements may not be representative of the effect of stock-based compensation expense in future periods due to the level of awards issued in past years (which level may not be similar in the future), modifications to existing awards, accelerated vesting related to certain employment terminations and assumptions used in determining fair value, expected lives and estimated forfeitures. We determine the fair value of each stock award using the closing market price of our common stock on the date of grant. We estimate the fair value of each option grant on the date of grant using the Black-Scholes option valuation model. The determination of fair value using an option-pricing model is affected by our stock price as well as assumptions regarding a number of subjective variables. These variables include, but are not limited to, the expected stock price volatility over the term of the expected option life (which is determined by using the historical closing prices of our common stock), the expected dividend yield (which is approximately 0.2%), and the expected option life (which is based on historical exercise behavior).
12
Legal Proceedings
In the normal course of business, we are subject to pending and threatened legal actions. It is our policy to accrue for amounts related to these legal matters if it is probable that a liability has been incurred and an amount of anticipated exposure can be reasonably estimated. We do not believe that any of these pending claims or legal actions will have a material adverse effect on our business, financial condition, results of operations or cash flows.
Costs Associated with Exit or Disposal Activities
We recognize costs associated with exit or disposal activities, such as costs to terminate a contract, the exit or disposal of a business, or the early termination of a leased property, by recognizing the liability at fair value when incurred, except for certain one-time termination benefits, such as severance costs, for which the period of recognition begins when a severance plan is communicated to effected employees.
Inherent in the calculation of liabilities relating to exit and disposal activities are significant management judgments and estimates, including estimates of termination costs, employee attrition and the interest rate used to discount certain expected net cash payments. Such judgments and estimates are reviewed by us on a regular basis. The cumulative effect of a change to a liability resulting from a revision to either timing or the amount of estimated cash flows is recognized by us as an adjustment to the liability in the period of the change.
Earnings Per Common Share
Basic EPS is computed based upon the weighted average number of common shares outstanding for the year. Diluted EPS is computed based upon the weighted average number of common shares outstanding for the year plus the dilutive effect of common stock equivalents using the treasury stock method and the average market price of our common stock for the year. We include participating securities (unvested share-based payment awards that contain non-forfeitable rights to dividends or dividend equivalents) in the computation of EPS pursuant to the two-class method. Our participating securities consist solely of unvested restricted stock awards, which have contractual participation rights equivalent to those of stockholders of unrestricted common stock. The two-class method of computing earnings per share is an allocation method that calculates earnings per share for common stock and participating securities.
Advertising Costs
Our policy is to expense advertising costs as they are incurred. Advertising costs charged to expense were $3,349,000, $3,333,000 and $2,656,000 in fiscals 2016, 2015 and 2014, respectively.
Income Taxes
Our provision for income taxes is based on our current period income, changes in deferred income tax assets and liabilities, statutory income tax rates, changes in uncertain tax benefits and the deductibility of expenses or availability of tax credits in various taxing jurisdictions. Tax laws are complex, subject to different interpretations by the taxpayer and the respective governmental taxing authorities and are subject to future modification, expiration or repeal by government legislative bodies. We use significant judgment on a quarterly basis in determining our annual effective income tax rate and evaluating our tax positions.
We recognize deferred tax assets and liabilities based on differences between the financial statement carrying amounts and the tax basis of assets and liabilities. Deferred tax assets and liabilities also include items recorded in conjunction with the purchase accounting for business acquisitions as well as net operating loss carryforwards. We regularly review our deferred tax assets for recoverability and establish a valuation allowance, if necessary, based on historical taxable income, projected future taxable income, and the expected timing of the reversals of existing temporary differences. Although realization is not assured, management believes it is more likely than not that the recorded deferred tax assets, as adjusted for valuation allowances, will be realized. Additionally, deferred tax liabilities are regularly reviewed to confirm that such amounts are appropriately stated. A review of our deferred tax items considers known future changes
13
in various income tax rates, principally in the United States. If income tax rates were to change in the future, particularly in the United States and to a lesser extent Canada, the UK and Italy, our items of deferred tax could be materially affected. All of such evaluations require significant management judgments.
We record liabilities for an unrecognized tax benefit when a tax benefit for an uncertain tax position is taken or expected to be taken on a tax return, but is not recognized in our Consolidated Financial Statements because it does not meet the more-likely-than-not recognition threshold that the uncertain tax position would be sustained upon examination by the applicable taxing authority. Any adjustments upon resolution of income tax uncertainties are recognized in our results of operations. Unrecognized tax benefits are analyzed periodically and adjustments are made as events occur to warrant adjustment to the related liability. Historically, we have not had significant unrecognized tax benefits.
Business Combinations
Acquisitions require significant estimates and judgments related to the fair value of assets acquired and liabilities assumed. We determine fair value based on the estimated price that would be received to sell an asset or paid to transfer a liability in an orderly transaction between market participants at the measurement date. Such initial fair value amounts as well as other acquired assets and liabilities, including deferred tax assets and liabilities, are sometimes refined requiring subsequent adjustments.
Certain liabilities and reserves are subjective in nature. We reflect such liabilities and reserves based upon the most recent information available. In conjunction with our acquisitions, such subjective liabilities and reserves principally include contingent consideration, certain deferred income tax liabilities, income tax and sales and use tax exposures, including tax liabilities related to our foreign subsidiaries, as well as reserves for accounts receivable, inventories, warranties and contingent obligations. We account for contingent consideration relating to business combinations as a liability and an increase to goodwill at the date of the acquisition and continually re-measure the liability at each balance sheet date by recording changes in the fair value through our Consolidated Statements of Income. We determine the fair value of contingent consideration based on future operating projections under various potential scenarios and weight the probability of these outcomes. Similarly, other acquisition related liabilities can be required to be recorded at fair value at the date of the acquisition and continually re-measured at each balance sheet date, such as the assumed contingent obligation relating to the Jet Prep Acquisition and the contingent guaranteed obligation relating to the PuriCore Acquisition, as further described in Note 6 to the Consolidated Financial Statements. The ultimate settlement of liabilities relating to business combinations may be for amounts which are materially different from the amounts initially recorded and may cause volatility in our results of operations.
Use of Estimates
The preparation of financial statements in conformity with accounting principles generally accepted in the United States requires us to make estimates and assumptions that affect the amounts reported in the financial statements and accompanying notes. Actual results could differ from those estimates. On an ongoing basis, we evaluate the adequacy of our reserves and the estimates used in calculations of reserves as well as other judgmental financial statement items, including, but not limited to: collectability of accounts receivable, volume rebates and trade-in allowances, inventory values and obsolescence reserves, warranty reserves, contingent consideration, contingent guaranteed obligations, depreciation and amortization periods, deferred income taxes, goodwill and intangible assets, impairment of long-lived assets, unrecognized tax benefits for uncertain tax positions, reserves for legal exposure, stock-based compensation and expense accruals. Such estimates and assumptions are subjective in nature. We reflect such amounts based upon the most recent information available.
Recent Accounting Pronouncements
In August 2016, the Financial Account Standards Board (“FASB”) issued Accounting Standards Update (“ASU”) 2016-15, “Statement of Cash Flows” (“ASU 2016-15). This new guidance will make eight targeted changes to how cash receipts and cash payments are presented and classified in the statement of cash flows. ASU 2016-15 is effective for fiscal years beginning after December 15, 2017 (our fiscal year 2019). ASU 2016-15 will require adoption on a retrospective basis unless it is impracticable to apply, in which case we would be required to apply the amendments
14
prospectively as of the earliest date practicable. We are currently in the process of evaluating the impact of ASU 2016-15 on our financial position and result of operations.
In March 2016, the FASB issued ASU 2016-09, “Improvements to Employee Share-Based Payment Accounting” (“ASU 2016-09”), which simplifies the accounting for employee share-based payment transactions, including the accounting for income taxes, forfeitures and statutory tax withholding requirements. The new guidance also requires that all tax-related cash flows resulting from share-based payments to be reported as operating activities in the Consolidated Statements of Cash Flows. ASU 2016-09 is effective for fiscal years beginning after December 15, 2016 (our fiscal year 2018), including interim periods within that reporting period. Early adoption is permitted as of the beginning of an interim or annual period. As such, we early adopted ASU 2016-09 on August 1, 2016. The adoption of ASU 2016-09 is expected to impact the recording of income taxes in our financial position and results of operations, as well as our operating and financing cash flows on our Consolidated Statements of Cash Flows. The magnitude of such impacts are dependent upon the Company’s future grants of stock-based compensation, the Company’s future stock price in relation to the fair value of awards on grant date and the exercise behavior of the Company’s option holders.
In February 2016, FASB issued ASU 2016-02, “Leases (Topic 842)” (“ASU 2016-02”). The new guidance requires the recording of assets and liabilities arising from leases on the balance sheet accompanied by enhanced qualitative and quantitative disclosures in the notes to the financial statements. The new guidance is expected to provide transparency of information and comparability among organizations. ASU 2016-02 is effective for fiscal years beginning after December 31, 2018 (our fiscal year 2019), including interim periods within that reporting period. Early adoption is permitted as of the beginning of an interim or annual period. We are currently in the process of evaluating the impact of ASU 2016-02 on our financial position and results of operations.
In November 2015, the FASB issued ASU 2015-17, “Balance Sheet Classification of Deferred Taxes (Topic 740)” (“ASU 2015-17”), which eliminates the current requirement for companies to present deferred tax liabilities and assets as current and non-current in a classified balance sheet. To simplify the presentation of deferred income taxes, ASU 2015-17 requires that deferred tax liabilities and assets be classified as non-current in a classified statement of financial position. ASU 2015-17 is effective for fiscal years beginning after December 15, 2016 (our fiscal year 2018), including interim periods within that reporting period. Early adoption is permitted as of the beginning of an interim or annual period. On July 31, 2016, we early adopted ASU 2015-17 on a prospective basis, as more fully described in Note 10 to the Consolidated Financial Statements.
In September 2015, the FASB issued ASU 2015-16, “Simplifying the Accounting for Measurement-Period Adjustments (Topic 805)” (“ASU 2015-16”). The new guidance requires an acquirer in a business combination to recognize a measurement-period adjustment during the period in which it determines the amount, and eliminates the requirement for an acquirer to account for measurement-period adjustments retrospectively. The acquirer must also disclose the amounts and reasons for adjustments to the provisional amounts. ASU 2015-16 is effective for fiscal years beginning after December 15, 2016 (our fiscal year 2018), including interim periods within that reporting period. Accordingly, we will adopt ASU 2015-06 in our first quarter of fiscal 2018. The adoption of ASU 2015-06 is not expected to have a significant impact upon on our financial position and results of operations.
In July 2015, the Financial Accounting Standards Board (“FASB”) issued Accounting Standards Update (“ASU”) 2015-11, “Inventory (Topic 330) Simplifying the Measurement of Inventory,” (“ASU 2015-11”). The new guidance more closely aligns the measurement of inventory in U.S. GAAP with the measurement of inventory in International Financial Reporting Standards by requiring companies using the first-in, first-out and average costs methods to measure inventory using the lower of cost and net realizable value, where net realizable value is the estimated selling prices in the ordinary course of business, less reasonably predictable costs of completion, disposal and transportation. ASU 2015-11 is effective for fiscal years beginning after December 15, 2016 (our fiscal year 2018), including interim periods within that reporting period. We are currently in the process of evaluating the impact of ASU 2015-11 on our financial position and results of operations.
In April 2015, the FASB issued ASU 2015-03, “Simplifying the Presentation of Debt Issuance Costs (Topic 835),” (“ASU 2015-03”). Under the new guidance, debt issuance costs are presented in the balance sheet as a direct deduction from the carrying amount of that debt liability and not recorded as a separate asset. In August 2015, the FASB issued
15
2015-15, “Interest-Imputation of Interest (Subtopic 835-30),” (“ASU 2015-15”), which clarifies ASU 2015-03 with respect to lines-of-credit, allowing the recording of debt issuance costs as an asset and subsequently amortizing the asset over the term of the line-of-credit arrangement. ASU 2015-03 is effective for fiscal years beginning after December 15, 2015 (our fiscal year 2017), including interim periods within that reporting period. As a result of the clarification provided by ASU 2015-15, the August 1, 2016 adoption of ASU 2015-03 will not have an impact upon our financial position and results of operations.
In May 2014, the FASB issued ASU 2014-09, “Revenue from Contracts with Customers (Topic 606),” (“ASU 2014-09”), which will supersede the revenue recognition requirements in Accounting Standards Codification 605, “Revenue Recognition.” ASU 2014-09 is based on the principle that revenue is recognized to depict the transfer of goods or services to customers in an amount that reflects the consideration to which the entity expects to be entitled in exchange for those goods or services. It also requires additional disclosure about the nature, amount, timing and uncertainty of revenue and cash flows arising from customer contracts, significant judgments and changes in judgments, and assets recognized from costs incurred to obtain or fulfill a contract. In August 2015, the FASB issued ASU 2015-14, “Revenue from Contracts with Customers (Topic 606),” which defers the effective date of ASU 2014-09 by one year to fiscal years beginning after December 15, 2017 (our fiscal year 2019), including interim periods within that reporting period. In May 2016, the FASB issued ASU 2016-12, “Revenue from Contracts with Customers (Topic 606),” (ASU 2016-12), which provided narrow scope improvements and practical expedients relating to ASU 2014-09. We are currently in the process of evaluating the impact of ASU 2014-09 and ASU 2016-12 on our financial position and results of operations.
3.Acquisitions
Post-Fiscal 2016
Vantage Endoscopy Inc.’s Medivators® Endoscopy Business
On September 26, 2016, we acquired certain net assets of Vantage related to its distribution and sale of our Medivators endoscopy products in Canada (the “Vantage Business” or the “Vantage Acquisition”). Vantage was our exclusive distributor of Medivators capital equipment (e.g., automated endoscope reprocessors) and related consumables and accessories and had pre-acquisition adjusted annual revenues (unaudited) of approximately $11,000,000. The total consideration for the transaction, excluding acquisition-related costs, was $4,072,000, subject to net asset value adjustments. The Vantage Acquisition is included in our Endoscopy segment.
The principal reasons for the Vantage Acquisition were (i) to sell our Endoscopy products on a direct basis in Canada, one of our largest markets outside of the United States, (ii) the establishment of a platform in Canada where we can sell additional products on a direct basis such as our endoscopy procedure products and transport and storage systems and (iii) the expectation that the acquisition will be accretive to our EPS in fiscal 2017 and beyond. The Vantage Acquisition is not included in our results of operations for any portion of fiscal 2016 or any prior period.
Accutron, Inc.
On August 1, 2016, we acquired all of the issued and outstanding stock of Accutron, a private company with pre-acquisition annual revenues (unaudited) of approximately $21,500,000 (the “Accutron Business” or the “Accutron Acquisition”). The Accutron Business designs, manufactures and sells nitrous oxide conscious sedation equipment and single use nasal masks for use in dental procedures. The total consideration for the transaction, excluding acquisition-related costs, was $52,500,000, subject to net asset value adjustments. The Accutron Acquisition is included in our Healthcare Disposables segment.
The principal reasons for the Accutron Acquisition were (i) to broaden our Healthcare Disposable segment’s product portfolio by adding conscious sedation equipment and single-use nasal masks, (ii) the opportunity to cross-sell our existing Healthcare Disposable products, (iii) the addition of a high margin, branded product portfolio with compelling infection prevention benefits and (iv) the expectation that the acquisition will be accretive to our EPS in fiscal 2017 and beyond. The Accutron Acquisition is not included in our results of operations for any portion of fiscal 2016 or any prior period.
16
Fiscal 2016
North American Science Associates, Inc.
On March 1, 2016, we acquired certain net assets of North American Science Associates, Inc.’s Sterility Assurance Monitoring Products division, a business with pre-acquisition adjusted annual revenues (unaudited) of approximately $5,700,000 (the “NAMSA Business”). The business manufactures a broad suite of high-quality biological and chemical indicators which are used to accurately monitor the effectiveness of sterilization processes primarily for manufacturers of medical device, life science and other products. The total consideration for the transaction, excluding acquisition-related costs, was $13,424,000. The NAMSA Acquisition is included in our Healthcare Disposables segment.
The purchase price was allocated to the assets acquired and assumed liabilities based on estimated fair values as follows:
|
|
|
Final |
|
|
|
Net Assets |
|
Allocation |
|
|
|
Current assets |
|
$ |
2,283,000 |
|
|
Property, plant and equipment |
|
|
437,000 |
|
|
Amortizable intangible assets (10- year weighted average life): |
|
|
|
|
|
Customer relationships (10- year life) |
|
|
5,820,000 |
|
|
Technology (8- year life) |
|
|
1,320,000 |
|
|
Current liabilities |
|
|
(123,000) |
|
|
Net assets acquired |
|
$ |
9,737,000 |
|
There were no in-process research and development projects acquired in connection with the acquisition. The excess purchase price of $3,687,000 was assigned to goodwill. Such goodwill, all of which is deductible for income tax purposes, is included in our Healthcare Disposables segment.
The principal reasons for the NAMSA Acquisition were (i) the ability to broaden our Healthcare Disposable segment’s presence into the industrial market, (ii) the opportunity to cross-sell our existing Healthcare Disposable products, (iii) the strategic benefit and cost savings to our overall sterility assurance monitoring business, (iv) to enhance our new product development and overall research and development capabilities and (v) the expectation that the acquisition will be accretive to our EPS in fiscal 2017 and beyond.
The NAMSA Business is included in our results of operations for the portion of fiscal 2016 subsequent to its acquisition date and is not included in fiscals 2015 and 2014. This acquisition did not have a significant effect on our consolidated results of operations in fiscal 2016 due to the size of the acquisition in relation to our overall consolidated results of operations.
Medical Innovations Group Holdings Limited
On September 14, 2015, we acquired all of the issued and outstanding stock of MI, a private company with pre-acquisition annual revenues (unaudited) of approximately $28,500,000 providing specialized endoscopy medical devices and products primarily in the United Kingdom (the “MI Business”). Principal products of MI include proprietary short-term and long-term endoscope transport and storage systems, a comprehensive range of endoscopic consumable accessories, OEM mobile medical carts, as well as specialized products for patient warming and patient transfer. With an employee base of approximately 100 individuals, including a complete sales organization and a manufacturing facility in Southend-on-Sea, England, the addition of MI complements our existing endoscopy business in the United States, the United Kingdom and other global markets. The MI Business is included in our Endoscopy segment. The total consideration for the transaction, excluding acquisition-related costs, was $79,597,000, net of a $212,000 net asset value adjustment to be paid by the sellers.
17
The purchase price was allocated to the assets acquired and assumed liabilities based on estimated fair values as follows:
|
|
|
Final |
|
|
|
Net Assets |
|
Allocation |
|
|
|
Current assets |
|
$ |
7,060,000 |
|
|
Property, plant and equipment |
|
|
6,464,000 |
|
|
Amortizable intangible assets (15- year weighted average life): |
|
|
|
|
|
Customer relationships (17- year life) |
|
|
24,430,000 |
|
|
Technology (10- year life) |
|
|
10,930,000 |
|
|
Brand names (12- year life) |
|
|
2,030,000 |
|
|
Current liabilities |
|
|
(2,640,000) |
|
|
Deferred income tax liabilities |
|
|
(8,683,000) |
|
|
Net assets acquired |
|
$ |
39,591,000 |
|
There were no in-process research and development projects acquired in connection with the acquisition. The excess purchase price of $40,006,000 was assigned to goodwill. Such goodwill, none of which is deductible for income tax purposes, is included in our Endoscopy segment.
The principal reasons for the MI Acquisition were (i) the global expansion of our infection prevention product offerings in Endoscopy, (ii) the opportunity to sell our existing endoscopy products to MI’s installed base, (iii) the ability to combine the MI sales force with our existing United Kingdom organization to create what we believe will be a dominant UK sales force in endoscopy product sales and service, (iv) to achieve cost savings through various operating synergies, (v) the ability to leverage our direct sales force to accelerate the growth of MI products in the U.S. and various international markets, and (vi) the expectation that the acquisition will be accretive to our EPS in fiscal 2017 and beyond. Such reasons constitute the significant factors that contributed to a purchase price that resulted in recognition of goodwill.
The MI Acquisition is included in our results of operations in the portion of fiscal 2016 subsequent to its acquisition date, and is not reflected in fiscals 2015 and 2014.
Fiscal 2015
DentaPure
On February 20, 2015, we purchased all of the issued and outstanding stock of MRLB, a private company with pre-acquisition annual revenues (unaudited) of approximately $2,300,000, to obtain the DentaPure® product line. The DentaPure product line is a proprietary, iodinated resin filter cartridge system used by dentists to maintain safe water quality in dental unit waterlines. It has been integrated into our Crosstex product portfolio. The DentaPure Business is included in our Healthcare Disposables segment. The total consideration for the transaction was $9,980,000, excluding acquisition-related costs.
18
The purchase price was allocated to the assets acquired and assumed liabilities based on estimated fair values as follows:
|
|
|
Final |
|
|
|
Net Assets |
|
Allocation |
|
|
|
Current assets |
|
$ |
566,000 |
|
|
Property, plant and equipment |
|
|
50,000 |
|
|
Amortizable intangible assets (10- year weighted average life): |
|
|
|
|
|
Customer relationships (10- year life) |
|
|
4,640,000 |
|
|
Technology (10- year life) |
|
|
780,000 |
|
|
Brand names (10- year life) |
|
|
260,000 |
|
|
Current liabilities |
|
|
(248,000) |
|
|
Deferred income tax liabilities |
|
|
(2,172,000) |
|
|
Net assets acquired |
|
$ |
3,876,000 |
|
There were no in-process research and development projects acquired in connection with the acquisition. The excess purchase price of $6,104,000 was assigned to goodwill. Such goodwill, none of which is deductible for income tax purposes, is included in our Healthcare Disposables segment.
The principal reasons for the DentaPure Acquisition were to (i) leverage the sales and marketing infrastructure of Crosstex by adding a branded, technologically differentiated, proprietary product line, (ii) strengthen our leadership position in a rapidly growing area of infection prevention, (iii) add a new product line that will provide for opportunities to cross-sell to biological monitoring customers and expand our waterline disinfection products and (iv) the expectation that the acquisition will be accretive to our EPS in fiscal 2017 and beyond. Such reasons constitute the significant factors that contributed to a purchase price that resulted in recognition of goodwill.
The DentaPure Business is included in our results of operations for fiscal 2016 and the portion of fiscal 2015 subsequent to its acquisition date, and is not included in fiscal 2014. This acquisition did not have a significant effect on our consolidated results of operations in fiscals 2016 and 2015 due to the size of the business in relation to our overall consolidated results of operations.
Pure Water Solutions, Inc.
On January 1, 2015, we purchased substantially all of the net assets of PWS, a private company based out of Ridgeland, Mississippi with pre-acquisition annual revenues (unaudited) of approximately $8,000,000 that provides water treatment services for commercial and industrial, laboratory and medical customers. The PWS Business is included in our Water Purification and Filtration segment. The total consideration for the transaction, excluding acquisition-related costs, was $11,835,000.
The purchase price was allocated to the assets acquired and assumed liabilities based on estimated fair values as follows:
|
|
|
Final |
|
|
|
Net Assets |
|
Allocation |
|
|
|
Current assets |
|
$ |
1,417,000 |
|
|
Property, plant and equipment |
|
|
1,966,000 |
|
|
Amortizable intangible assets (12- year weighted average life): |
|
|
|
|
|
Customer relationships (12- year life) |
|
|
5,940,000 |
|
|
Brand names (1- year life) |
|
|
30,000 |
|
|
Other assets |
|
|
20,000 |
|
|
Current liabilities |
|
|
(503,000) |
|
|
Net assets acquired |
|
$ |
8,870,000 |
|
There were no in-process research and development projects acquired in connection with the acquisition. The excess purchase price of $2,965,000 was assigned to goodwill. Such goodwill, all of which is deductible for income tax purposes, is included in our Water Purification and Filtration segment.
19
The principal reasons for the PWS Acquisition were (i) to strengthen our sales and service business by adding PWS’s strategic southeastern United States market presence to enable us to better serve our national customers, (ii) to further expand our business into the commercial, laboratory and research segments and (iii) the expectation that the acquisition will be accretive to our EPS in fiscal 2016 and beyond. Such reasons constitute the significant factors that contributed to a purchase price that resulted in recognition of goodwill.
The PWS Business is included in our results of operations in fiscal 2016 and the portion of fiscal 2015 subsequent to its acquisition date, and is not included in fiscal 2014. This acquisition did not have a significant effect on our consolidated results of operations in fiscals 2016 and 2015 due to the size of the business in relation to our overall consolidated results of operations.
International Medical Service S.r.l.
On November 3, 2014, we acquired all of the issued and outstanding stock of IMS, a privately owned company in Italy with pre-acquisition annual revenues (unaudited) of approximately $13,500,000 that manufactures and sells automated endoscope reprocessors (“AERs”), high-level disinfectant chemistries used in AERs, other infection prevention chemistries used in healthcare and dental markets, as well as technical service. The IMS Business is included in our Endoscopy segment. The total consideration for the transaction, excluding acquisition-related costs, was $24,610,000, which includes assumed debt of $2,498,000 which was subsequently repaid.
The purchase price was allocated to the assets acquired and assumed liabilities based on estimated fair values as follows:
|
|
|
Final |
|
|
|
Net Assets |
|
Allocation |
|
|
|
Current assets |
|
$ |
8,111,000 |
|
|
Property, plant and equipment |
|
|
7,922,000 |
|
|
Amortizable intangible assets (9- year weighted average life): |
|
|
|
|
|
Customer relationships (9- year life) |
|
|
5,669,000 |
|
|
Technology (9- year life) |
|
|
1,381,000 |
|
|
Other assets |
|
|
177,000 |
|
|
Current liabilities |
|
|
(5,735,000) |
|
|
Deferred income tax liabilities |
|
|
(3,028,000) |
|
|
Other long-term liabilities |
|
|
(1,020,000) |
|
|
Net assets acquired |
|
$ |
13,477,000 |
|
There were no in-process research and development projects acquired in connection with the acquisition. The excess purchase price of $11,133,000 was assigned to goodwill. Such goodwill, none of which is deductible for income tax purposes, is included in our Endoscopy segment. Following the acquisition, we changed the name of IMS to Cantel Medical (Italy) S.r.l.
The principal reasons for the IMS Acquisition were: (i) to add a high quality manufacturing facility in Europe, (ii) the expansion of our product offerings with a broader range of advanced endoscope reprocessing equipment suitable for various international markets, (iii) the opportunity to transition our existing Italy business from a distribution model to a direct sales model, (iv) the opportunity to leverage IMS’s chemistry manufacturing capabilities to enhance and expand our existing product portfolio while reducing freight and logistics expenses related to the export of chemistries from the United States, (v) the ability to expand our footprint and infrastructure in Europe and (vi) the expectation that the acquisition will be accretive to our EPS in fiscal 2016 and beyond. Such reasons constitute the significant factors that contributed to a purchase price that resulted in recognition of goodwill.
The IMS Business is included in our results of operations in fiscal 2016 and the portion of fiscal 2015 subsequent to its acquisition date, and is not included in fiscal 2014. The IMS Business did not have a significant effect on our consolidated results of operations in fiscals 2016 and 2015 due to the size of the business in relation to our overall consolidated results of operations.
20
Fiscal 2014
PuriCore International Limited
On June 30, 2014, we acquired from PuriCore plc, a publicly traded company in the United Kingdom (“UK”), all the issued and outstanding stock of its subsidiary PuriCore International Limited, a company located in the UK with pre-acquisition annual revenues (unaudited) of approximately $25,000,000 that sells automated endoscope reprocessors, endoscope drying and storage cabinets, chemistry and consumables, as well as comprehensive maintenance and validation services, primarily in the UK. The total consideration for the transaction, excluding acquisition-related costs, was $27,675,000, net of a $337,000 net asset value adjustment paid by the seller in August 2014. The PuriCore Business is included in our Endoscopy segment.
The purchase price was allocated to the assets acquired and assumed liabilities based on estimated fair values as follows:
|
|
|
Final |
|
|
|
Net Assets |
|
Allocation |
|
|
|
Current assets |
|
$ |
8,982,000 |
|
|
Property, plant and equipment |
|
|
972,000 |
|
|
Amortizable intangible assets (9- year weighted average life): |
|
|
|
|
|
Customer relationships (10- year life) |
|
|
11,340,000 |
|
|
Technology (6- year life) |
|
|
1,760,000 |
|
|
Other (3- year life) |
|
|
93,000 |
|
|
Non-current deferred income tax assets, net |
|
|
1,924,000 |
|
|
Current liabilities |
|
|
(10,085,000) |
|
|
Other long-term liabilities |
|
|
(753,000) |
|
|
Net assets acquired |
|
$ |
14,233,000 |
|
There were no in-process research and development projects acquired in connection with the acquisition. The excess purchase price of $13,442,000 was assigned to goodwill. Such goodwill, none of which is deductible for income tax purposes, has been included in our Endoscopy segment. Following the acquisition, we changed the name of PuriCore to Cantel Medical (UK) Limited.
In connection with the acquisition, we acquired certain ordinary course business assets and liabilities which included a contingent guaranteed obligation to reimburse an endoscope service company for endoscope repair costs it incurs when servicing its customers’ endoscopes that are damaged by one of PuriCore’s discontinued endoscope reprocessing machine models. Although the terms of the guarantee provide for no limit to the maximum potential future payments, we have estimated the fair value of the liability on the date of the acquisition to be approximately $1,414,000, of which $693,000 was recorded in current liabilities and $721,000 was recorded in other long-term liabilities at June 30, 2014. This contingent guaranteed obligation increased goodwill on the date of the acquisition and is continually re-measured at each balance sheet date by recording changes in the fair value of the liability to general administrative expenses in our Consolidated Statements of Income, as further explained in Note 6 of the Consolidated Financial Statements. At July 31, 2016, such liability was $441,000 of which $75,000 was recorded in current liabilities and $366,000 was recorded in other long-term liabilities.
Since we are continually re-measuring the contingent guaranteed obligation at each balance sheet date and recording changes in the fair value through our Consolidated Statements of Income, we may potentially have earnings volatility in our future results of operations until the discontinued endoscope reprocessing machine model is no longer used in the marketplace.
The principal reasons for the acquisition are as follows: (i) the expansion of our product offerings with a broader range of advanced endoscope reprocessing equipment suitable for various international markets, (ii) the opportunity to sell our chemistries and other products to PuriCore’s installed base through a direct sales force, (iii) the opportunity to transition our existing UK business from a distribution model to a direct sales model, (iv) the ability to expand our footprint and
21
infrastructure in Europe and (v) the expectation that the acquisition will be accretive to our earnings per share in fiscal 2015 and beyond. Such reasons constitute the significant factors that contributed to a purchase price that resulted in recognition of goodwill.
The PuriCore Business is included in our results of operations in fiscal 2016, fiscal 2015 and the portion of fiscal 2014 subsequent to its acquisition date.
Sterilator Company, Inc.
On January 7, 2014, we acquired all the issued and outstanding stock of Sterilator, a private company based in Cuba, New York that manufactures biological indicators and supplies for sterility assurance products, which are used to accurately monitor the effectiveness of sterilization processes. The total consideration for the transaction was $3,349,000, excluding transaction costs.
The purchase price was allocated to the assets acquired and assumed liabilities based on estimated fair values as follows:
|
|
|
Final |
|
|
|
Net Assets |
|
Allocation |
|
|
|
Current assets |
|
$ |
1,058,000 |
|
|
Property, plant and equipment |
|
|
521,000 |
|
|
Amortizable intangible assets (9- year weighted average life): |
|
|
|
|
|
Customer relationships (11- year life) |
130,000 | |||
|
Technology (8- year life) |
|
|
510,000 |
|
|
Current liabilities |
|
|
(321,000) |
|
|
Deferred income tax liabilities |
|
|
(276,000) |
|
|
Net assets acquired |
|
$ |
1,622,000 |
|
There were no in-process research and development projects acquired in connection with the acquisition. The excess purchase price of $1,727,000 was assigned to goodwill. Such goodwill, none of which is deductible for income tax purposes, has been included in our Healthcare Disposables segment.
The principal reasons for this vertical acquisition were to (i) add one of our key long-standing suppliers of biological indicators to our portfolio providing a strategic benefit and cost savings to our overall sterility assurance monitoring business and (ii) strengthen our new product development and overall research and development capabilities. Such reasons constitute the significant factors that contributed to a purchase price that resulted in recognition of goodwill.
The Sterilator Business is included in our results of operations in fiscal 2016, fiscal 2015 and the portion of fiscal 2014 subsequent to its acquisition date.
Jet Prep Ltd.
On November 5, 2013, we acquired all the issued and outstanding capital stock of Jet Prep, a private Israeli company that developed the Jet PrepTM Endoscopic Flushing Device, a novel single-use irrigation and aspiration catheter to improve visualization during colonoscopy procedures. The device has FDA 510(k) and CE Mark clearances and is in the beginning phase of commercialization by our global endoscopy sales force. Total consideration for the transaction, excluding transaction costs, was $5,350,000 plus preliminarily estimated contingent consideration of $2,490,000 based on a percentage of sales above a minimum threshold over a seven year period, as further explained below. The Jet Prep Acquisition is included in our Endoscopy segment.
We account for contingent consideration by recording the fair value of contingent consideration as a liability and an increase in goodwill on the date of the acquisition and continually re-measure the liability at each balance sheet date by recording changes in the fair value through our Consolidated Statements of Income. Accordingly, on November 5, 2013 we increased contingent consideration and goodwill by $2,490,000 to record our initial estimated fair value of the contingent consideration that would be earned over the seven year period ending November 4, 2020. On a quarterly basis
22
subsequent to November 5, 2013, we re-measured the fair value of the contingent consideration and recorded the changes in fair value by increasing both contingent consideration and general administrative expenses, as further explained in Note 6 of the Consolidated Financial Statements. At July 31, 2016, the estimated fair value was zero.
In connection with the acquisition, we acquired certain ordinary course business assets and liabilities as well as an obligation to repay the Israeli Government for $810,000 of seed funding that was previously granted to Jet Prep. In accordance with the seed funding agreement, the Israeli Government is entitled to a return on their investment that can range from one to nine times their total grant based upon specific conditions set forth in the seed funding agreement and applicable Israeli law, including the acceleration of payments if we transfer certain operations of the company or intellectual property outside of Israel. We account for this assumed contingent obligation to the Israeli Government by recording the fair value as a liability and an increase in goodwill on the date of the acquisition and continually re-measure the liability at each balance sheet date by recording changes in the fair value through our Consolidated Statements of Income. Accordingly, on November 5, 2013 we increased accrued expenses by $4,000, other long-term liabilities by $1,716,000 and goodwill by $1,720,000 to record our initial estimated fair value of the assumed contingent obligation to the Israeli Government that would be earned on a percentage of sales over a forecasted period. On a quarterly basis subsequent to November 5, 2013, we re-measured the fair value of the assumed contingent liability and recorded the changes in fair value by increasing both other long-term liabilities and general administrative expenses, as further explained in Note 6 of the Consolidated Financial Statements. At July 31, 2016, the estimated fair value was $1,138,000, of which $12,000 was recorded in accrued expenses and $1,126,000 was recorded in other long-term liabilities.
Since we are continually re-measuring the contingent consideration liability and the assumed contingent obligation at each balance sheet date and recording changes in the respective fair values through our Consolidated Statements of Income, we may potentially have significant earnings volatility in our future results of operations until the completion of the seven year period with respect to the contingent consideration and until the assumed contingent obligation is satisfied or until sales of the Jet Prep Ltd. products no longer exist.
The purchase price was allocated to the assets acquired and assumed liabilities based on estimated fair values as follows:
|
|
|
Final |
|
|
|
Net Assets |
|
Allocation |
|
|
|
Current assets |
|
$ |
82,000 |
|
|
Property, plant and equipment |
|
|
65,000 |
|
|
Amortizable intangible asset: |
|
|
|
|
|
Technology (7- year life) |
|
|
3,730,000 |
|
|
Current liabilities |
|
|
(104,000) |
|
|
Other long-term liabilities |
|
|
(1,716,000) |
|
|
Net assets acquired |
|
$ |
2,057,000 |
|
There were no in-process research and development projects acquired in connection with the acquisition. The excess purchase price of $5,783,000 was assigned to goodwill. Such goodwill, none of which is deductible for income tax purposes, has been included in our Endoscopy segment.
The principal reasons for the acquisition were (i) to address a market need for an effective technology that improves colonoscopy visualization through the use of irrigation and suction, (ii) to expand our endoscopy product portfolio further bolstering the Medivators brand in the gastrointestinal (“GI”) suite, (iii) to further expand our research and development capability by adding accomplished engineers to our existing research and development team and (iv) the expectation that the acquisition will be accretive to our earnings per share in the future. Such reasons constitute the significant factors that contributed to a purchase price that resulted in recognition of goodwill.
The Jet Prep Business is included in our results of operations in fiscal 2016, fiscal 2015 and the portion of fiscal 2014 subsequent to its acquisition date. Since the full commercialization of the Jet Prep Endoscopic Flushing Device has been delayed, this acquisition has not yet generated any sales and did not have a significant impact on our results of operations, except for recording the changes in fair values of the contingent consideration liability and the assumed
23
contingent obligation through our Consolidated Statements of Income, as further explained in Note 6 to the Consolidated Financial Statements.
4.Inventories, Net
A summary of inventories is as follows:
|
|
|
July 31, |
|
||||
|
|
|
2016 |
|
2015 |
|
||
|
|
|
|
|
|
|
|
|
|
Raw materials and parts |
|
$ |
45,867,000 |
|
$ |
36,585,000 |
|
|
Work-in-process |
|
|
13,178,000 |
|
|
10,017,000 |
|
|
Finished goods |
|
|
37,831,000 |
|
|
29,371,000 |
|
|
Reserve for excess and obsolete inventory |
|
|
(5,390,000) |
|
|
(3,895,000) |
|
|
Total |
|
$ |
91,486,000 |
|
$ |
72,078,000 |
|
5.Derivatives
We recognize all derivatives on the balance sheet at fair value. Derivatives that are not designated as hedges must be adjusted to fair value through earnings. If the derivative is designated as a hedge, depending on the nature of the hedge, changes in the fair value of the derivative will either be offset against the change in the fair value of the hedged assets, liabilities or firm commitments through earnings or recognized in other comprehensive income until the hedged item is recognized in earnings. The ineffective portion of the change in fair value of a derivative that is designated as a hedge will be recognized immediately in earnings. As of July 31, 2016, all of our derivatives were designated as hedges. We do not hold any derivative financial instruments for speculative or trading purposes.
Changes in the value of the Euro, British Pound, Singapore dollar, Canadian dollar and the Chinese Renminbi against the United States dollar affect our results of operations because certain cash bank accounts, accounts receivable, and liabilities of Cantel and its subsidiaries are denominated and ultimately settled in United States dollars or these foreign currencies, but must be converted into each entity’s functional currency.
In order to hedge against the impact of fluctuations in the value of the Euro, British Pound and Singapore dollar relative to the United States dollar on the conversion of such net assets into the functional currencies, we enter into short-term contracts to purchase Euros, British Pounds and Singapore dollars forward, which contracts are one-month in duration. These short-term contracts are designated as fair value hedge instruments. There were four foreign currency forward contracts with an aggregate value of $8,942,000 at July 31, 2016, which covered certain assets and liabilities that were denominated in currencies other than each entity’s functional currency. Such contracts expired on August 31, 2016. These foreign currency forward contracts are continually replaced with new one-month contracts as long as we have significant net assets that are denominated and ultimately settled in currencies other than each entity’s functional currency. For the fiscal year ended July 31, 2016, such forward contracts partially offset the impact on operations relating to certain assets and liabilities that were denominated in currencies other than each entity’s functional currency resulting in net currency conversion loss, net of tax, of $438,000 on the items hedged. Gains and losses related to hedging contracts to buy Euros, British Pounds and Singapore dollars forward are immediately realized within general and administrative expenses due to the short-term nature of such contracts. We do not currently hedge against the impact of fluctuations in the value of the Canadian dollar or Chinese Renminbi relative to the United States dollar because the overall foreign currency exposures relating to those currencies are currently not deemed significant. Additionally, we do not hedge transactions associated with the funding of international acquisitions due to the short-term nature of the foreign currency exposure.
24
6.Fair Value Measurements
Fair Value Hierarchy
We apply the provisions of Accounting Standards Codification (“ASC”) 820, “Fair Value Measurements and Disclosures,” (“ASC 820”), for our financial assets and liabilities that are re-measured and reported at fair value each reporting period and our nonfinancial assets and liabilities that are re-measured and reported at fair value on a non-recurring basis. We define fair value as the price that would be received to sell an asset or paid to transfer a liability in an orderly transaction between market participants at the measurement date. ASC 820 establishes a three level fair value hierarchy to prioritize the inputs used in valuations, as defined below:
Level 1: Observable inputs that reflect unadjusted quoted prices for identical assets or liabilities in active markets.
Level 2: Inputs other than quoted prices included within Level 1 that are observable for the asset or liability, either directly or indirectly.
Level 3: Unobservable inputs for the asset or liability.
Assets and Liabilities Measured and Recorded at Fair Value on a Recurring Basis
Our financial assets that are re-measured at fair value on a recurring basis include money market funds that are classified as cash and cash equivalents in the Consolidated Balance Sheets. These money market funds are classified within Level 1 of the fair value hierarchy and are valued using quoted market prices for identical assets.
In connection with our June 2014 acquisition of a UK endoscopy company (“Cantel Medical (UK)”), we acquired a contingent guaranteed obligation to reimburse an endoscope service company for endoscope repair costs it incurs when servicing its customers’ endoscopes that are damaged by one of Cantel Medical (UK)’s discontinued endoscope reprocessing machine models. Although the terms of the guarantee provide for no limit to the maximum potential future payments, we estimated the fair value of the liability on the date of the acquisition to be approximately $1,414,000. This fair value measurement was based on significant inputs not observed in the market and thus represents a Level 3 measurement. The fair value of the contingent guaranteed obligation was based on the estimated cost to repair endoscopes that may be damaged by one of Cantel Medical (UK)’s discontinued endoscope reprocessing machine models that remain in the marketplace, the historical frequency of claims and the likely timeframe that each machine will continue to be used. As such, the determination of the fair value of this contingent guaranteed obligation is subjective in nature and can be impacted by significant changes in third party service repair rates, the frequency of claims and a change in the expected life of these discontinued machines. At the date of the acquisition, the cash flow projection relating to this contingent guaranteed obligation was discounted using a rate of 10.1%, which was based on the weighted average cost of capital of the acquired business plus a credit risk premium for non-performance risk. This liability is adjusted periodically by the reimbursement of repair costs, as well as recording changes in the fair value through our Consolidated Statements of Income driven by the time value of money and changes in the assumptions that were initially used in the valuation. Given the subjective nature of the assumptions used in the determination of fair value, we may potentially have earnings volatility in our future results of operations. However, the largest factor for the decrease in the initial fair value from $1,414,000 at June 30, 2014 to $441,000 at July 31, 2016 was the reimbursement of repair costs.
On November 5, 2013, we recorded a $2,490,000 liability for the estimated fair value of contingent consideration and a $1,720,000 liability for the estimated fair value of an assumed contingent obligation payable to the Israeli Government relating to the Jet Prep Acquisition, as further described in Note 3 to the Consolidated Financial Statements. These fair value measurements were based on significant inputs not observed in the market and thus represent Level 3 measurements.
The fair values of the contingent consideration liability and assumed contingent obligation were based on percentages of future sales projections of the Jet Prep Business, above a minimum threshold with respect to the contingent consideration, under various potential scenarios over a seven year period ending November 4, 2020 and weighting the probability of these outcomes. As such, the determinations of fair values of these contingent liabilities are subjective in
25
nature and highly dependent on future sales projections. At the date of the acquisition, the cash flow projections relating to the contingent consideration and assumed contingent obligation were discounted using rates of 12.6% and 2.5%, respectively. The discount rate relating to the contingent consideration was based on the weighted average cost of capital of the acquired business plus a credit risk premium for non-performance risk. Since payment of the assumed contingent obligation to the Israeli Government is highly probable, the discount rate relating to this government obligation was based on a risk free rate plus a premium for non-performance risk. These two liabilities will be adjusted periodically by recording changes in the fair value through our Consolidated Statements of Income driven by the time value of money and changes in the assumptions that were initially used in the valuations. Due to the structure of the acquisition, any such adjustments through our Consolidated Statements of Income will not be tax effected, except for amounts in excess of $810,000 with respect to the assumed contingent obligation, therefore impacting our effective tax rate.
The actual contingent consideration and assumed contingent obligation have the potential of being between zero and a percentage of unlimited sales that could occur until the completion of the seven year period with respect to the contingent consideration liability and until the assumed contingent obligation is satisfied in full, or until the sales of the Jet Prep products no longer exist. However, with respect to the contingent consideration, the different likely scenarios of future sales projections used in our fair value determination at July 31, 2016 resulted in total potential contingent consideration payments to be zero. The decrease in the initial fair value from $2,490,000 at November 5, 2013 to zero at July 31, 2016 was primarily due to the delay in commercialization, changes in probability factors and future sales projections based on the results of several market research analyses, product modification plans, updated pricing models and the remaining years in the seven year measurement period. With respect to the assumed contingent obligation, the different likely scenarios of future sales projections used in our fair value determination at July 31, 2016 along with the requirement to repay at least the original seed funding with interest to the Israeli Government resulted in a fair value of $1,138,000 at July 31, 2016. Given the subjective nature of the assumptions used in the determinations of fair value, we may potentially have further earnings volatility in our future results of operations related to these Jet Prep obligations.
26
The fair values of the Company’s financial instruments measured on a recurring basis were categorized as follows:
|
|
|
July 31, 2016 |
|
||||||||||
|
|
|
Level 1 |
|
Level 2 |
|
Level 3 |
|
Total |
|
||||
|
Assets: |
|
|
|
|
|
|
|
|
|
|
|
|
|
|
Cash and cash equivalents: |
|
|
|
|
|
|
|
|
|
|
|
|
|
|
Money markets |
|
$ |
740,000 |
|
$ |
— |
|
$ |
— |
|
$ |
740,000 |
|
|
Total assets |
|
$ |
740,000 |
|
$ |
— |
|
$ |
— |
|
$ |
740,000 |
|
|
|
|
|
|
|
|
|
|
|
|
|
|
|
|
|
Liabilities: |
|
|
|
|
|
|
|
|
|
|
|
|
|
|
Accrued expenses: |
|
|
|
|
|
|
|
|
|
|
|
|
|
|
Assumed contingent obligation |
|
$ |
— |
|
$ |
— |
|
$ |
12,000 |
|
$ |
12,000 |
|
|
Contingent guaranteed obligation |
|
|
— |
|
|
— |
|
|
366,000 |
|
|
366,000 |
|
|
Total accrued expenses |
|
|
— |
|
|
— |
|
|
378,000 |
|
|
378,000 |
|
|
Other long-term liabilities: |
|
|
|
|
|
|
|
|
|
|
|
|
|
|
Assumed contingent obligation |
|
|
— |
|
|
— |
|
|
1,126,000 |
|
|
1,126,000 |
|
|
Contingent guaranteed obligation |
|
|
— |
|
|
— |
|
|
75,000 |
|
|
75,000 |
|
|
Total other long-term liabilities: |
|
|
— |
|
|
— |
|
|
1,201,000 |
|
|
1,201,000 |
|
|
Total liabilities |
|
$ |
— |
|
$ |
— |
|
$ |
1,579,000 |
|
$ |
1,579,000 |
|
|
|
|
July 31, 2015 |
|
||||||||||
|
|
|
Level 1 |
|
Level 2 |
|
Level 3 |
|
Total |
|
||||
|
Assets: |
|
|
|
|
|
|
|
|
|
|
|
|
|
|
Cash and cash equivalents: |
|
|
|
|
|
|
|
|
|
|
|
|
|
|
Money markets |
|
$ |
1,680,000 |
|
$ |
— |
|
$ |
— |
|
$ |
1,680,000 |
|
|
Total assets |
|
$ |
1,680,000 |
|
$ |
— |
|
$ |
— |
|
$ |
1,680,000 |
|
|
|
|
|
|
|
|
|
|
|
|
|
|
|
|
|
Liabilities: |
|
|
|
|
|
|
|
|
|
|
|
|
|
|
Accrued expenses: |
|
|
|
|
|
|
|
|
|
|
|
|
|
|
Assumed contingent obligation |
|
$ |
— |
|
$ |
— |
|
$ |
12,000 |
|
$ |
12,000 |
|
|
Contingent guaranteed obligation |
|
|
— |
|
|
— |
|
|
566,000 |
|
|
566,000 |
|
|
Total accrued expenses |
|
|
— |
|
|
— |
|
|
578,000 |
|
|
578,000 |
|
|
Other long-term liabilities: |
|
|
|
|
|
|
|
|
|
|
|
|
|
|
Contingent consideration |
|
|
— |
|
|
— |
|
|
751,000 |
|
|
751,000 |
|
|
Assumed contingent obligation |
|
|
— |
|
|
— |
|
|
1,126,000 |
|
|
1,126,000 |
|
|
Contingent guaranteed obligation |
|
|
— |
|
|
— |
|
|
322,000 |
|
|
322,000 |
|
|
Total other long-term liabilities: |
|
|
— |
|
|
— |
|
|
2,199,000 |
|
|
2,199,000 |
|
|
Total liabilities |
|
$ |
— |
|
$ |
— |
|
$ |
2,777,000 |
|
$ |
2,777,000 |
|
27
A reconciliation of our liabilities that are measured and recorded at fair value on a recurring basis using significant unobservable inputs (Level 3) for fiscals 2016, 2015 and 2014 is as follows:
|
|
|
|
|
|
|
|
|
Jet Prep |
|
Cantel Medical (UK) |
|
|
|
|
||
|
|
|
Byrne |
|
Jet Prep |
|
Assumed |
|
Contingent |
|
|
|
|
||||
|
|
|
Price |
|
Contingent |
|
Contingent |
|
Guaranteed |
|
|
|
|
||||
|
|
|
Floor |
|
Consideration |
|
Obligation |
|
Obligation |
|
Total |
|
|||||
|
Balance, July 31, 2013 |
|
$ |
45,000 |
|
$ |
— |
|
$ |
— |
|
$ |
— |
|
$ |
45,000 |
|
|
Total net unrealized (gains) losses included in general and administrative expense in earnings |
|
|
(45,000) |
|
|
232,000 |
|
|
32,000 |
|
|
— |
|
|
219,000 |
|
|
Net purchases, issuances, sales and settlements |
|
|
— |
|
|
2,490,000 |
|
|
1,720,000 |
|
|
1,395,000 |
|
|
5,605,000 |
|
|
Balance, July 31, 2014 |
|
|
— |
|
|
2,722,000 |
|
|
1,752,000 |
|
|
1,395,000 |
|
|
5,869,000 |
|
|
Total net unrealized gains included in general and administrative expense in earnings |
|
|
— |
|
|
(1,971,000) |
|
|
(614,000) |
|
|
— |
|
|
(2,585,000) |
|
|
Net purchases, issuances, sales and settlements |
|
|
— |
|
|
— |
|
|
— |
|
|
(507,000) |
|
|
(507,000) |
|
|
Balance, July 31, 2015 |
|
|
— |
|
|
751,000 |
|
|
1,138,000 |
|
|
888,000 |
|
|
2,777,000 |
|
|
Total net unrealized (gains) losses included in general and administrative expense in earnings |
|
|
— |
|
|
(751,000) |
|
|
— |
|
|
64,000 |
|
|
(687,000) |
|
|
Net purchases, issuances, sales and settlements |
|
|
— |
|
|
— |
|
|
— |
|
|
(511,000) |
|
|
(511,000) |
|
|
Balance, July 31, 2016 |
|
$ |
— |
|
$ |
— |
|
$ |
1,138,000 |
|
$ |
441,000 |
|
$ |
1,579,000 |
|
Assets Measured and Recorded at Fair Value on a Nonrecurring Basis
We re-measure the fair value of certain assets, such as intangible assets, goodwill and long-lived assets, including property, equipment and other assets, whenever events or changes in circumstances indicate that the carrying amount of an asset may not be recoverable, and goodwill and intangible assets with indefinite lives are reviewed for impairment at least annually, as further described in Notes 2 and 7 to the Consolidated Financial Statements. As the inputs utilized for our periodic impairment assessments are not based on observable market data, but are based on management’s assumptions and estimates, our goodwill, intangibles and long-lived assets are classified within Level 3 of the fair value hierarchy on a non-recurring basis.
In September 2013, we acquired a license from a third party granting us the exclusive right to manufacture, commercialize, distribute and sell an endoscopy product in exchange for a series of payments, which totaled $1,000,000 at January 31, 2015 and was recorded in other assets in our Consolidated Balance Sheets. We evaluated this long-lived asset for potential impairment and determined that the future use of this acquired license was unlikely based on a recent product analysis. Accordingly, we deemed the acquired license, together with related fixed assets of $287,000, to be fully impaired and recorded a loss of $1,287,000 during fiscal 2015 based on expected cash flows of the related endoscopy product, which was recorded in general and administrative expenses and as reductions in other assets and property and equipment in the Consolidated Financial Statements.
Management concluded on July 31, 2016 that none of our long-lived assets, including goodwill and intangibles with indefinite-lives, were impaired and no events or changes in circumstances have occurred during fiscal 2016 that would indicate that the carrying amount of our long-lived assets may not be recoverable.
Disclosure of Fair Value of Financial Instruments
As of July 31, 2016 and 2015, the carrying amounts for cash and cash equivalents (excluding money markets), accounts receivable and accounts payable approximated fair value due to the short maturity of these instruments. We believe that
28
as of July 31, 2016 and 2015, the fair value of our outstanding borrowings under our credit facility approximated the carrying value of those obligations since the borrowing rates were at prevailing market interest rates.
7.Intangibles and Goodwill
Our intangible assets with definite lives consist primarily of customer relationships, technology, brand names, non-compete agreements and patents. These intangible assets are being amortized on the straight-line method over the estimated useful lives of the assets ranging from 3-20 years and have a weighted average amortization period of 12 years. Amortization expense related to intangible assets was $13,095,000, $13,265,000 and $10,641,000 for fiscals 2016, 2015 and 2014, respectively. Our intangible assets that have indefinite useful lives, and therefore are not amortized, consist of trademarks and trade names.
The Company’s intangible assets consist of the following:
|
|
|
July 31, 2016 |
|
|||||||
|
|
|
|
|
|
Accumulated |
|
|
|
|
|
|
|
|
Gross |
|
Amortization |
|
Net |
|
|||
|
Intangible assets with finite lives: |
|
|
|
|
|
|
|
|
|
|
|
Customer relationships |
|
$ |
100,649,000 |
|
$ |
(24,689,000) |
|
$ |
75,960,000 |
|
|
Technology |
|
|
32,767,000 |
|
|
(11,813,000) |
|
|
20,954,000 |
|
|
Brand names |
|
|
6,194,000 |
|
|
(2,394,000) |
|
|
3,800,000 |
|
|
Non-compete agreements |
|
|
3,092,000 |
|
|
(1,193,000) |
|
|
1,899,000 |
|
|
Patents and other registrations |
|
|
2,508,000 |
|
|
(913,000) |
|
|
1,595,000 |
|
|
|
|
|
145,210,000 |
|
|
(41,002,000) |
|
|
104,208,000 |
|
|
Trademarks and tradenames |
|
|
7,511,000 |
|
|
— |
|
|
7,511,000 |
|
|
Total intangible assets |
|
$ |
152,721,000 |
|
$ |
(41,002,000) |
|
$ |
111,719,000 |
|
|
|
|
July 31, 2015 |
|
|||||||
|
|
|
|
|
|
Accumulated |
|
|
|
|
|
|
|
|
Gross |
|
Amortization |
|
Net |
|
|||
|
Intangible assets with finite lives: |
|
|
|
|
|
|
|
|
|
|
|
Customer relationships |
|
$ |
97,697,000 |
|
$ |
(39,549,000) |
|
$ |
58,148,000 |
|
|
Technology |
|
|
26,508,000 |
|
|
(12,656,000) |
|
|
13,852,000 |
|
|
Brand names |
|
|
12,970,000 |
|
|
(10,865,000) |
|
|
2,105,000 |
|
|
Non-compete agreements |
|
|
3,129,000 |
|
|
(997,000) |
|
|
2,132,000 |
|
|
Patents and other registrations |
|
|
2,235,000 |
|
|
(788,000) |
|
|
1,447,000 |
|
|
|
|
|
142,539,000 |
|
|
(64,855,000) |
|
|
77,684,000 |
|
|
Trademarks and tradenames |
|
|
8,152,000 |
|
|
— |
|
|
8,152,000 |
|
|
Total intangible assets |
|
$ |
150,691,000 |
|
$ |
(64,855,000) |
|
$ |
85,836,000 |
|
29
Estimated annual amortization expense of our intangible assets for the next five years is as follows:
|
Year Ending July 31, |
|
|
|
|
|
2017 |
|
$ |
13,086,000 |
|
|
2018 |
|
|
12,787,000 |
|
|
2019 |
|
|
12,464,000 |
|
|
2020 |
|
|
10,710,000 |
|
|
2021 |
|
|
10,375,000 |
|
Goodwill changed during fiscals 2016 and 2015 as follows:
|
|
|
|
|
|
Water |
|
|
|
|
|
|
|
|
|
|
|
|
|
|
|
|
|
|
|
|
Purification |
|
Healthcare |
|
|
|
|
|
|
|
Total |
|
|||
|
|
|
Endoscopy |
|
and Filtration |
|
Disposables |
|
Dialysis |
|
Other |
|
Goodwill |
|
||||||
|
|
|
|
|
|
|
|
|
|
|
|
|
|
|
|
|
|
|
|
|
|
Balance, July 31, 2014 |
|
$ |
78,274,000 |
|
$ |
56,838,000 |
|
$ |
81,835,000 |
|
$ |
8,133,000 |
|
$ |
6,567,000 |
|
$ |
231,647,000 |
|
|
Acquisitions |
|
|
11,093,000 |
|
|
2,965,000 |
|
|
6,104,000 |
|
|
— |
|
|
— |
|
|
20,162,000 |
|
|
Foreign currency translation |
|
|
(2,360,000) |
|
|
(931,000) |
|
|
— |
|
|
— |
|
|
(827,000) |
|
|
(4,118,000) |
|
|
Sale of business |
|
|
— |
|
|
— |
|
|
— |
|
|
— |
|
|
(5,740,000) |
|
|
(5,740,000) |
|
|
Balance, July 31, 2015 |
|
|
87,007,000 |
|
|
58,872,000 |
|
|
87,939,000 |
|
|
8,133,000 |
|
|
— |
|
|
241,951,000 |
|
|
Acquisitions |
|
|
40,047,000 |
|
|
— |
|
|
4,351,000 |
|
|
— |
|
|
— |
|
|
44,398,000 |
|
|
Foreign currency translation |
|
|
(6,039,000) |
|
|
8,000 |
|
|
— |
|
|
— |
|
|
— |
|
|
(6,031,000) |
|
|
Balance, July 31, 2016 |
|
$ |
121,015,000 |
|
$ |
58,880,000 |
|
$ |
92,290,000 |
|
$ |
8,133,000 |
|
$ |
— |
|
$ |
280,318,000 |
|
On July 31, 2016, we performed impairment studies of the Company’s goodwill and indefinite lived trademarks and trade names and concluded that such assets were not impaired. While the results of these annual reviews have historically not indicated impairment, impairment reviews are highly dependent on management’s projections of our future operating results and cash flows (which management believes to be reasonable), discount rates based on the Company’s weighted average cost of capital and appropriate benchmark peer companies. Assumptions used in determining future operating results and cash flows include current and expected market conditions and future sales forecasts. Subsequent changes in these assumptions and estimates could result in future impairment. Although we consistently use the same methods in developing the assumptions and estimates underlying the fair value calculations, such estimates are uncertain by nature and can vary from actual results. At July 31, 2016, the fair value of all of our reporting units exceeded book value by substantial amounts. However, we believe the most significant assumptions impacting the impairment assessment of Dialysis relate to the assumed rate in which annual sales will decline as well as the expected future operating efficiencies included in our projections of future operating results and cash flows of this segment. If future operating results and cash flows are substantially less than our projections, future impairment charges may be recorded. On July 31, 2016, management concluded that no events or changes in circumstances have occurred in fiscal 2016 that would indicate that the carrying amount of our intangible assets and goodwill may not be recoverable.
30
8.Warranties
A summary of activity in the warranty reserves follows:
|
|
|
|
|
|
|
|
|
|
|
|
Year Ended July 31, |
|
||||
|
|
|
2016 |
|
2015 |
|
||
|
|
|
|
|
|
|
|
|
|
Beginning balance |
|
$ |
1,740,000 |
|
$ |
1,589,000 |
|
|
Acquisitions |
|
|
28,000 |
|
|
118,000 |
|
|
Provisions |
|
|
4,554,000 |
|
|
2,583,000 |
|
|
Settlements |
|
|
(3,622,000) |
|
|
(2,523,000) |
|
|
Foreign currency translation |
|
|
(125,000) |
|
|
(27,000) |
|
|
Ending balance |
|
$ |
2,575,000 |
|
$ |
1,740,000 |
|
The warranty provisions and settlements in fiscals 2016 and 2015 relate principally to the Company’s endoscope reprocessing and water purification products. Warranty reserves are included in accrued expenses in the Consolidated Balance Sheets.
9.Financing Arrangements
On March 4, 2014, we entered into a $250,000,000 Third Amended and Restated Credit Agreement (the “2014 Credit Agreement”). The 2014 Credit Agreement includes a five-year $250,000,000 senior secured revolving facility with sublimits of up to $100,000,000 for borrowings in foreign currencies, $30,000,000 for letters of credit and $10,000,000 for swing line loans (the “2014 Revolving Credit Facility”). Subject to the satisfaction of certain conditions precedent including the consent of the lenders, the Company may from time to time increase the 2014 Revolving Credit Facility by an aggregate amount not to exceed $100,000,000. The senior lenders include Bank of America N.A. (the lead bank and administrative agent), PNC Bank, National Association and Wells Fargo Bank, National Association. The 2014 Credit Agreement expires on March 4, 2019. Additionally, subject to certain restrictions and conditions (i) any of our domestic or foreign subsidiaries may become borrowers and (ii) borrowings may occur in multi-currencies. Furthermore, we incurred debt issuance costs of $1,318,000 relating to the 2014 Credit Agreement which was recorded in other assets along with the remaining unamortized debt issuance costs of $512,000 relating to our former revolving credit facility. The total of these two amounts is being amortized over the life of the 2014 Credit Agreement. At July 31, 2016, unamortized debt issuance costs recorded in other assets amounted to $946,000.
Borrowings under the 2014 Credit Agreement bear interest at rates ranging from 0.25% to 1.25% above the lender’s base rate, or at rates ranging from 1.25% to 2.25% above the London Interbank Offered Rate (“LIBOR”), depending upon the Company’s “Consolidated Leverage Ratio,” which is defined as the consolidated ratio of total funded debt to earnings before interest, taxes, depreciation and amortization, and as further adjusted under the terms of the 2014 Credit Agreement (“Consolidated EBITDA”). At July 31, 2016, the lender’s base rate was 3.50% and the LIBOR rates ranged from 0.47% to 1.33%. The margins applicable to our outstanding borrowings were 0.50% above the lender’s base rate or 1.50% above LIBOR. All of our outstanding borrowings were under LIBOR contracts at July 31, 2016. The 2014 Credit Agreement also provides for fees on the unused portion of our facility at rates ranging from 0.20% to 0.40%, depending upon our Consolidated Leverage Ratio; such rate was 0.25% at July 31, 2016.
The 2014 Credit Agreement contains affirmative and negative covenants reasonably customary for similar credit facilities and is secured by (i) substantially all assets of Cantel and its United States-based subsidiaries, (ii) a pledge by Cantel of all of the outstanding shares of its United States-based subsidiaries and 65% of the outstanding shares of certain of Cantel’s foreign-based subsidiaries and (iii) a guaranty by Cantel’s domestic subsidiaries. We are in compliance with all financial and other covenants under the 2014 Credit Agreement.
On July 31, 2016, we had $116,000,000 of outstanding borrowings under the 2014 Credit Agreement. Subsequent to July 31, 2016, we borrowed $61,000,000 to fund the purchase price and transaction costs of the Accutron and Vantage
31
acquisitions and repaid $6,000,000 resulting in total outstanding borrowings of $171,000,000 at September 29, 2016, none of which is required to be repaid until March 2019.
10.Income Taxes
The consolidated effective tax rate was 36.2%, 37.1% and 36.9% for fiscals 2016, 2015 and 2014, respectively, and reflects income tax expense for our United States and international operations at their respective statutory rates.
The provision for income taxes consists of the following:
|
|
|
Year Ended July 31, |
|
||||||||||||||||
|
|
|
2016 |
|
2015 |
|
2014 |
|
||||||||||||
|
|
|
Current |
|
Deferred |
|
Current |
|
Deferred |
|
Current |
|
Deferred |
|
||||||
|
|
|
|
|
|
|
|
|
|
|
|
|
|
|
|
|
|
|
|
|
|
United States: |
|
|
|
|
|
|
|
|
|
|
|
|
|
|
|
|
|
|
|
|
Federal |
|
$ |
29,392,000 |
|
$ |
(216,000) |
|
$ |
24,602,000 |
|
$ |
(425,000) |
|
$ |
22,119,000 |
|
$ |
(896,000) |
|
|
State |
|
|
4,433,000 |
|
|
(153,000) |
|
|
3,920,000 |
|
|
(218,000) |
|
|
3,710,000 |
|
|
(348,000) |
|
|
International |
|
|
1,863,000 |
|
|
(1,341,000) |
|
|
1,165,000 |
|
|
(806,000) |
|
|
735,000 |
|
|
26,000 |
|
|
Total |
|
$ |
35,688,000 |
|
$ |
(1,710,000) |
|
$ |
29,687,000 |
|
$ |
(1,449,000) |
|
$ |
26,564,000 |
|
$ |
(1,218,000) |
|
The geographic components of income before income taxes are as follows:
|
|
|
Year Ended July 31, |
|
|||||||
|
|
|
2016 |
|
2015 |
|
2014 |
|
|||
|
|
|
|
|
|
|
|
|
|
|
|
|
United States |
|
$ |
92,744,000 |
|
$ |
73,645,000 |
|
$ |
67,288,000 |
|
|
International |
|
|
1,187,000 |
|
|
2,546,000 |
|
|
1,323,000 |
|
|
Total |
|
$ |
93,931,000 |
|
$ |
76,191,000 |
|
$ |
68,611,000 |
|
The consolidated effective income tax rate differed from the United States statutory tax rate of 35.0% in fiscals 2016, 2015 and 2014 due to the following:
|
|
|
Year Ended July 31, |
|
||||
|
|
|
2016 |
|
2015 |
|
2014 |
|
|
|
|
|
|
|
|
|
|
|
Expected statutory tax |
|
35.0 |
% |
35.0 |
% |
35.0 |
% |
|
Differential attributable to: |
|
|
|
|
|
|
|
|
Foreign operations |
|
0.6 |
% |
1.2 |
% |
(0.1) |
% |
|
State and local taxes |
|
3.2 |
% |
3.4 |
% |
3.2 |
% |
|
Domestic production deduction |
|
(2.3) |
% |
(2.4) |
% |
(2.3) |
% |
|
Acquisition related items, net (a) |
|
— |
% |
(1.6) |
% |
0.7 |
% |
|
Loss on sale of business |
|
— |
% |
1.1 |
% |
— |
% |
|
R&E tax credit |
|
(1.1) |
% |
(0.5) |
% |
(0.3) |
% |
|
Change in foreign tax rates |
|
(0.4) |
% |
— |
% |
— |
% |
|
Other |
|
1.2 |
% |
0.9 |
% |
0.7 |
% |
|
Consolidated effective tax rate |
|
36.2 |
% |
37.1 |
% |
36.9 |
% |
|
(a) |
Acquisition related items, net, consisted of non-deductible transaction costs net of non-taxable, favorable fair value adjustments of contingent liabilities, as more fully described in Note 6 to the Consolidated Financial Statements. |
32
Deferred income tax assets and liabilities are comprised of the following:
|
|
|
July 31, |
||||
|
|
|
2016 |
|
2015 |
||
|
Deferred tax assets: |
|
|
|
|
|
|
|
Accrued expenses |
|
$ |
5,140,000 |
|
$ |
3,650,000 |
|
Inventories |
|
|
2,990,000 |
|
|
1,996,000 |
|
Accounts receivable |
|
|
793,000 |
|
|
941,000 |
|
Other long-term liabilities |
|
|
252,000 |
|
|
690,000 |
|
Stock-based compensation |
|
|
3,665,000 |
|
|
2,640,000 |
|
Capital investment |
|
|
546,000 |
|
|
546,000 |
|
Domestic NOLs |
|
|
— |
|
|
498,000 |
|
Foreign NOLs |
|
|
5,154,000 |
|
|
4,861,000 |
|
Subtotal |
|
|
18,540,000 |
|
|
15,822,000 |
|
Valuation allowance |
|
|
(2,334,000) |
|
|
(2,037,000) |
|
|
|
|
16,206,000 |
|
|
13,785,000 |
|
Deferred tax liabilities: |
|
|
|
|
|
|
|
Property and equipment |
|
|
(8,089,000) |
|
|
(6,154,000) |
|
Intangible assets |
|
|
(19,818,000) |
|
|
(14,711,000) |
|
Goodwill |
|
|
(11,878,000) |
|
|
(10,409,000) |
|
|
|
|
(39,785,000) |
|
|
(31,274,000) |
|
Net deferred tax liabilities |
|
$ |
(23,579,000) |
|
$ |
(17,489,000) |
|
|
|
|
|
|
|
|
|
Reported in Consolidated Balance Sheets as: |
|
|
|
|
|
|
|
Deferred income taxes - current asset |
|
$ |
— |
|
$ |
6,233,000 |
|
Deferred income taxes - noncurrent liability |
|
|
(23,579,000) |
|
|
(23,722,000) |
|
|
|
$ |
(23,579,000) |
|
$ |
(17,489,000) |
Consistent with the intent of ASU 2015-17 to simplify the presentation of deferred income taxes, we elected to adopt ASU 2015-17 on a prospective basis at July 31, 2016. Therefore, as a result of this change in accounting principles, the prior year was not retrospectively adjusted and our current deferred tax assets were reclassified as a reduction to non-current deferred tax liabilities.
For foreign tax reporting purposes, our Net Operating Losses (“NOLs”) at July 31, 2016 are $5,154,000 and originated primarily from foreign acquisitions. Most of these NOLs do not expire and are fully available for utilization against future profits in certain non-U.S. tax jurisdictions. However, we have recorded a valuation allowance of $2,334,000 for these foreign NOLs, which are primarily associated with certain early-stage foreign operations. Since these early-stage foreign operations are not yet generating profits, we believe it is more likely than not that we will be unable to utilize these NOLs.
During fiscals 2016 and 2015, no dividends were repatriated from our foreign subsidiaries. All of the undistributed earnings of our foreign subsidiaries are considered to be indefinitely reinvested at July 31, 2016. Accordingly, deferred taxes are not provided on undistributed earnings of foreign subsidiaries that are indefinitely reinvested. At July 31, 2016, the cumulative amount of such undistributed earnings indefinitely reinvested outside the United States was approximately $23,395,000. Determining the tax liability that would arise if these earnings were remitted is not practical.
We record liabilities for an unrecognized tax benefit when a tax benefit for an uncertain tax position is taken or expected to be taken on a tax return, but is not recognized in our Consolidated Financial Statements because it does not meet the more-likely-than-not recognition threshold that the uncertain tax position would be sustained upon examination by the applicable taxing authority. The tax benefits recognized in the financial statements from such a position are measured based on the largest benefit that has a greater than fifty percent likelihood of being realized upon settlement with the tax authorities. Any adjustments upon resolution of income tax uncertainties are recognized in our results of operations. Our policy is to record potential interest and penalties related to income tax positions in interest expense and general and
33
administrative expense, respectively, in our Consolidated Financial Statements. However, such amounts have been relatively insignificant due to the nominal amount of our unrecognized tax benefits relating to uncertain tax positions.
A reconciliation of the beginning and ending amounts of gross unrecognized tax benefits is as follows:
|
|
|
Unrecognized |
|
|
|
|
|
Tax Benefits |
|
|
|
|
|
|
|
|
|
Unrecognized tax benefits on July 31, 2013 |
|
$ |
124,000 |
|
|
Activity during fiscal 2014 |
|
|
(124,000) |
|
|
Unrecognized tax benefits on July 31, 2014 |
|
|
— |
|
|
Activity during fiscal 2015 |
|
|
— |
|
|
Unrecognized tax benefits on July 31, 2015 |
|
|
— |
|
|
Activity during fiscal 2016 |
|
|
— |
|
|
Unrecognized tax benefits on July 31, 2016 |
|
$ |
— |
|
The Company concluded an audit by the Internal Revenue Service (“IRS”) for fiscal years 2013 and 2012 and has been recently notified by the IRS of an audit for fiscal year 2015. With respect to state or foreign income tax examinations, the Company is generally no longer subject to examinations for fiscal years ended prior to July 31, 2008.
11.Commitments and Contingencies
Long-Term Contractual Obligations
As of July 31, 2016, aggregate annual required payments over the next five years and thereafter under our contractual obligations that have long-term components are as follows:
|
|
|
Year Ended July 31, |
|
|||||||||||||||||||
|
|
|
(Amounts in thousands) |
|
|||||||||||||||||||
|
|
|
2017 |
|
2018 |
|
2019 |
|
2020 |
|
2021 |
|
Thereafter |
|
Total |
|
|||||||
|
|
|
|
|
|
|
|
|
|
|
|
|
|
|
|
|
|
|
|
|
|
|
|
|
Maturity of the credit facility |
|
$ |
— |
|
$ |
— |
|
$ |
116,000 |
|
$ |
— |
|
$ |
— |
|
$ |
— |
|
$ |
116,000 |
|
|
Expected interest payments under the credit facility (1) |
|
|
2,598 |
|
|
2,599 |
|
|
1,516 |
|
|
— |
|
|
— |
|
|
— |
|
|
6,713 |
|
|
Minimum commitments under noncancelable operating leases |
|
|
6,139 |
|
|
5,241 |
|
|
4,211 |
|
|
2,989 |
|
|
2,180 |
|
|
3,408 |
|
|
24,168 |
|
|
Compensation agreements (2) |
|
|
10,470 |
|
|
2,519 |
|
|
498 |
|
|
498 |
|
|
377 |
|
|
583 |
|
|
14,945 |
|
|
Assumed contingent liability (3) |
|
|
19 |
|
|
93 |
|
|
188 |
|
|
246 |
|
|
280 |
|
|
439 |
|
|
1,265 |
|
|
Contingent guaranteed obligation (4) |
|
|
186 |
|
|
133 |
|
|
122 |
|
|
— |
|
|
— |
|
|
— |
|
|
441 |
|
|
Other long-term obligations |
|
|
228 |
|
|
200 |
|
|
96 |
|
|
12 |
|
|
3 |
|
|
— |
|
|
539 |
|
|
Total contractual obligations |
|
$ |
19,640 |
|
$ |
10,785 |
|
$ |
122,631 |
|
$ |
3,745 |
|
$ |
2,840 |
|
$ |
4,430 |
|
$ |
164,071 |
|
|
(1) |
Primarily to fund the cash consideration paid and the costs associated with the Accutron and Vantage acquisitions, we borrowed $55,000,000 in August 2016 and $6,000,000 in September 2016, respectively, under our revolving credit facility, and repaid $6,000,000, therefore increasing the 2019 maturities of the credit facility from $116,000,000 at July 31, 2016 to $171,000,000 at September 29, 2016. Accordingly, the expected interest payments under the credit facility will be approximately $1,232,000 higher on an annualized basis as of September 29, 2016 than the amounts shown herein. The expected interest payments under our credit facility reflect an interest rate of 2.24%, which was our weighted average interest rate on outstanding borrowings at July 31, 2016. |
|
(2) |
Amounts include $4,500,000, of which $3,823,000 is payable in fiscal 2017, due to the planned retirement of our former CEO. Effective August 1, 2016 in conjunction with the Accutron Acquisition, we entered into additional compensation agreements which would increase fiscal years 2017 and 2018 by $400,000 each compared to amounts |
34
shown herein. |
|
(3) |
These future potential payments of an assumed contingent liability relate to the Jet Prep Acquisition, as further explained below, and are reflected in the July 31, 2016 Consolidated Balance Sheet at its net present value of $1,138,000 using a discount rate of 2.5%. |
|
(4) |
These future potential payments of a contingent guaranteed obligation relate to Cantel Medical (UK), as further explained below and Note 6 to the Consolidated Financial Statements. |
Operating Leases
Minimum commitments under operating leases include minimum rental commitments for our leased manufacturing facilities, warehouses, office space and equipment.
Four of the more significant leases that contain escalation clauses are two building leases for our Water Purification and Filtration business and two building leases for our Healthcare Disposables business. The two Water Purification and Filtration building leases are for the United States headquarters in suburban Philadelphia, Pennsylvania and the Canadian headquarters in suburban Toronto, Ontario. The lease for the Philadelphia building provides for monthly base rent of approximately $17,200 during fiscal 2017 and escalates annually to approximately $20,100 in fiscal 2025 when it expires. The Toronto building lease provides for monthly base rent of approximately $12,800 in fiscal 2017 and escalates annually to approximately $13,300 in fiscal 2020 when it expires. Both the Philadelphia and Toronto building leases are guaranteed by Cantel. The Healthcare Disposables segment has two significant building leases with escalation clauses that are used for manufacturing and warehousing. One building lease in Sharon, Pennsylvania provides for monthly base rent of approximately $19,300 during fiscal 2017 and escalates annually to approximately $20,700 in fiscal 2024 when it expires. The second building lease in Santa Fe Springs, California provides for monthly base rent of approximately $18,600 in fiscal 2017 and escalates annually to approximately $20,100 in fiscal 2020 when it expires.
Our Healthcare Disposables business also leases a building in Cuba, New York for manufacturing and warehousing with monthly base rent of approximately $8,000 until it expires in fiscal 2019. This facility is owned by an entity controlled by two former owners of Sterilator who are now also employees in our Healthcare Disposable segment.
Our Endoscopy business leases a building in Conroe Park, Texas for manufacturing and warehousing with monthly base rent of approximately $31,800 in fiscal 2017 and it escalates annually to $33,000 in fiscal 2021.
Rent expense related to operating leases for fiscal 2016 was recorded on a straight-line basis and aggregated $6,675,000, compared with $6,025,000 and $4,409,000 for fiscals 2015 and 2014, respectively. The increase in rent expense in fiscal 2015 was primarily due to the acquisitions of PuriCore and IMS on June 30, 2014 and November 3, 2014, respectively.
Contingent Consideration and Assumed Contingent Liability
In relation to the Jet Prep Acquisition, we have recorded at July 31, 2016 a $1,138,000 liability for the estimated fair value of an assumed contingent obligation payable to the Israeli Government, as further described in Note 6 to the Consolidated Financial Statements, which will be payable based on future sales of the Jet Prep Business. Additionally, in connection with the PuriCore Acquisition, we assumed a contingent guaranteed obligation to reimburse an endoscope service company for endoscope repair costs it incurs when servicing its customers’ endoscopes that are damaged by one of PuriCore’s discontinued endoscope reprocessing machine models, as further described in Note 6 to the Consolidated Financial Statements. As such, the estimates of the annual required payments as well as the fair value of these contingent liabilities are subjective in nature and highly dependent on future sales projections. Additionally, since we will be continually re-measuring these liabilities at each balance sheet date and recording changes in the respective fair values through our Consolidated Statements of Income, we may potentially have earnings volatility in our future results of operations until the assumed contingent obligation and contingent guaranteed obligation are satisfied, or until the sales of the Jet Prep products no longer exist.
35
Compensation Agreements
We have previously entered into various severance contracts with executives of the Company, including our corporate executive officers and certain of our subsidiary Chief Executive Officers, which define certain compensation arrangements relating to various employment termination scenarios, and multi-year employment agreements with certain executive officers of businesses we have acquired. Additionally, in March 2016 we entered into a succession plan agreement due to the planned retirement of our Chief Executive Officer who was succeeded on July 31, 2016, but remains employed as a Senior Advisor until October 15, 2016. This succession plan agreement requires future payments to our former Chief Executive Officer beginning in fiscal 2017 for transition-related services. The majority of those future payments are being recorded in general and administrative expenses from March 17, 2016 through his October 15, 2016 retirement date.
Other Long-Term Obligations
In relation to the IMS Acquisition on November 3, 2014, we assumed an $843,000 liability to the central bank of Italy as part of funding provided by an Italian government agency, of which $187,000 and $656,000 were recorded in accrued expenses and other long-term liabilities, respectively. Such amount was a portion of the financial support obtained from the Italian government’s Ministry of Education, Universities and Research to fund research and development activity relating to IMS’s automated endoscope reprocessors. The liability is payable in semi-annual installments, bears interest at 0.25% per annum and has a maturity date of January 1, 2019. At July 31, 2016, $415,000 is outstanding, of which $165,000 is recorded in accrued expense and $250,000 is recorded in other long-term liabilities.
Additionally, other long-term obligations include deferred compensation arrangements for certain former Medivators directors and officers and is recorded in other long-term liabilities.
36
12.Accumulated Other Comprehensive (Loss) Income
The components and changes in accumulated other comprehensive (loss) income for fiscals 2016, 2015 and 2014 were as follows:
|
|
|
Foreign |
|
|
|
|
|
|
|
|
|
|
|
Currency |
|
Interest Rate |
|
|
|
|
||
|
|
|
Translation |
|
Swap |
|
|
|
|
||
|
|
|
Adjustments |
|
Agreements |
|
Total |
|
|||
|
|
|
|
|
|
|
|
|
|
|
|
|
Balance, July 31, 2013 |
|
$ |
11,080,000 |
|
|
(103,000) |
|
$ |
10,977,000 |
|
|
Other comprehensive loss before reclassifications |
|
|
(1,528,000) |
|
|
(47,000) |
|
|
(1,575,000) |
|
|
Income tax effect on other comprehensive loss before reclassifications |
|
|
— |
|
|
17,000 |
|
|
17,000 |
|
|
Reclassification adjustments to interest expense for losses on interest rate swaps included in net income during the year |
|
|
— |
|
|
96,000 |
|
|
96,000 |
|
|
Reclassification adjustments for ineffective hedge on interest rate swap included in net income during the year |
|
|
— |
|
|
113,000 |
|
|
113,000 |
|
|
Income tax effect on reclassification adjustments |
|
|
— |
|
|
(76,000) |
|
|
(76,000) |
|
|
Balance, July 31, 2014 |
|
|
9,552,000 |
|
|
— |
|
|
9,552,000 |
|
|
Other comprehensive loss |
|
|
(7,064,000) |
|
|
— |
|
|
(7,064,000) |
|
|
Reclassification adjustment to loss on sale of business for foreign currency translation gain included in net income during the year |
|
|
(1,264,000) |
|
|
— |
|
|
(1,264,000) |
|
|
Balance, July 31, 2015 |
|
|
1,224,000 |
|
|
— |
|
|
1,224,000 |
|
|
Other comprehensive loss |
|
|
(13,019,000) |
|
|
— |
|
|
(13,019,000) |
|
|
Balance, July 31, 2016 |
|
$ |
(11,795,000) |
|
$ |
— |
|
$ |
(11,795,000) |
|
13.Earnings Per Common Share
Basic EPS is computed based upon the weighted average number of common shares outstanding during the year. Diluted EPS is computed based upon the weighted average number of common shares outstanding during the year plus the dilutive effect of common stock equivalents using the treasury stock method and the average market price of our common stock for the year.
We include participating securities (unvested share-based payment awards that contain nonforfeitable rights to dividends or dividend equivalents) in the computation of EPS pursuant to the two-class method. Our participating securities consist solely of unvested restricted stock awards, which have contractual participation rights equivalent to those of stockholders of unrestricted common stock. The two-class method of computing earnings per share is an allocation method that calculates earnings per share for common stock and participating securities.
37
The following table sets forth the computation of basic and diluted EPS available to shareholders of common stock (excluding participating securities):
|
|
|
|
|
|
|
|
|
|
|
|
|
|
|
Year Ended July 31, |
|
|||||||
|
|
|
2016 |
|
2015 |
|
2014 |
|
|||
|
Numerator for basic and diluted earnings per share: |
|
|
|
|
|
|
|
|
|
|
|
Net income |
|
$ |
59,953,000 |
|
$ |
47,953,000 |
|
$ |
43,265,000 |
|
|
Less income allocated to participating securities |
|
|
(488,000) |
|
|
(433,000) |
|
|
(581,000) |
|
|
Net income available to common shareholders |
|
$ |
59,465,000 |
|
$ |
47,520,000 |
|
$ |
42,684,000 |
|
|
|
|
|
|
|
|
|
|
|
|
|
|
Denominator for basic and diluted earnings per share, as adjusted for participating securities: |
|
|
|
|
|
|
|
|
|
|
|
Denominator for basic earnings per share - weighted average number of shares outstanding attributable to common stock |
|
|
41,344,013 |
|
|
41,139,467 |
|
|
40,751,629 |
|
|
|
|
|
|
|
|
|
|
|
|
|
|
Dilutive effect of stock options using the treasury stock method and the average market price for the year |
|
|
46,181 |
|
|
63,133 |
|
|
159,685 |
|
|
|
|
|
|
|
|
|
|
|
|
|
|
Denominator for diluted earnings per share - weighted average number of shares and common stock equivalents attributable to common stock |
|
|
41,390,194 |
|
|
41,202,600 |
|
|
40,911,314 |
|
|
|
|
|
|
|
|
|
|
|
|
|
|
Earnings per share attributable to common stock: |
|
|
|
|
|
|
|
|
|
|
|
Basic earnings per share |
|
$ |
1.44 |
|
$ |
1.16 |
|
$ |
1.05 |
|
|
|
|
|
|
|
|
|
|
|
|
|
|
Diluted earnings per share |
|
$ |
1.44 |
|
$ |
1.15 |
|
$ |
1.04 |
|
|
|
|
|
|
|
|
|
|
|
|
|
|
Stock options excluded from weighted average dilutive common shares outstanding because their inclusion would have been antidilutive |
|
|
— |
|
|
— |
|
|
— |
|
A reconciliation of weighted average number of shares and common stock equivalents attributable to common stock, as determined above, to the Company’s total weighted average number of shares and common stock equivalents, including participating securities, is set forth in the following table:
|
|
|
|
|
|
|
|
|
|
|
|
Year Ended July 31, |
|
||||
|
|
|
2016 |
|
2015 |
|
2014 |
|
|
Denominator for diluted earnings per share - weighted average number of shares and common stock equivalents attributable to common stock |
|
41,390,194 |
|
41,202,600 |
|
40,911,314 |
|
|
|
|
|
|
|
|
|
|
|
Participating securities |
|
340,363 |
|
378,706 |
|
558,252 |
|
|
|
|
|
|
|
|
|
|
|
Total weighted average number of shares and common stock equivalents attributable to both common stock and participating securities |
|
41,730,557 |
|
41,581,306 |
|
41,469,566 |
|
14.Repurchase of Shares
The Company does not currently have a publicly announced stock repurchase program. All of the shares purchased during fiscals 2016 and 2015 represent shares surrendered to the Company relating to cashless exercises of stock options and to pay employee withholding taxes due upon the vesting of restricted stock or the exercise of stock options. In fiscals 2016 and 2015, such purchases amounted to 67,038 and 109,367 shares at a total average price per share of $55.68 and $37.61, respectively.
38
Upon exercise of stock options or grant of stock awards, we typically issue new shares of our common stock as opposed to using treasury shares.
15.Stock-Based Compensation
The following table shows the income statement components of stock-based compensation expense recognized in the Consolidated Statements of Income:
|
|
|
Year Ended July 31, |
|||||||
|
|
|
2016 |
|
2015 |
|
2014 |
|||
|
|
|
|
|
|
|
|
|
|
|
|
Cost of sales |
|
$ |
438,000 |
|
$ |
270,000 |
|
$ |
337,000 |
|
Operating expenses: |
|
|
|
|
|
|
|
|
|
|
Selling |
|
|
929,000 |
|
|
608,000 |
|
|
665,000 |
|
General and administrative |
|
|
6,881,000 |
|
|
4,897,000 |
|
|
4,339,000 |
|
Research and development |
|
|
113,000 |
|
|
92,000 |
|
|
68,000 |
|
Total operating expenses |
|
|
7,923,000 |
|
|
5,597,000 |
|
|
5,072,000 |
|
Stock-based compensation before income taxes |
|
|
8,361,000 |
|
|
5,867,000 |
|
|
5,409,000 |
|
Income tax benefits |
|
|
(2,956,000) |
|
|
(2,026,000) |
|
|
(1,909,000) |
|
Total stock-based compensation expense, net of tax |
|
$ |
5,405,000 |
|
$ |
3,841,000 |
|
$ |
3,500,000 |
The above stock-based compensation expense before income taxes was recorded in the Consolidated Financial Statements as stock-based compensation expense and an increase to additional paid-in capital. The related income tax benefits were recorded as an increase to long-term deferred income tax assets (which are netted with long-term deferred income tax liabilities) and a reduction to income tax expense.
All of our stock options and stock awards are subject to graded vesting in which portions of the award vest at different times during the vesting period, as opposed to awards that vest at the end of the vesting period. We recognize compensation expense for awards subject to graded vesting using the straight-line basis over the vesting period, reduced by estimated forfeitures. At July 31, 2016, total unrecognized stock-based compensation expense, before income taxes, related to total nonvested stock options and stock awards was $8,960,000 with a remaining weighted average period of 15 months over which such expense is expected to be recognized. The majority of our nonvested awards relate to stock awards.
We determine the fair value of each stock award using the closing market price of our common stock on the date of grant.
39
A summary of nonvested stock award activity follows:
|
|
|
|
|
Weighted |
|
|
|
|
|
Number of |
|
Average |
|
|
|
|
|
Shares |
|
Fair Value |
|
|
|
|
|
|
|
|
|
|
|
Nonvested stock awards at July 31, 2013 |
|
605,767 |
|
$ |
11.96 |
|
|
Granted |
|
258,760 |
|
|
31.95 |
|
|
Canceled |
|
(10,066) |
|
|
15.70 |
|
|
Vested |
|
(328,619) |
|
|
11.13 |
|
|
Nonvested stock awards at July 31, 2014 |
|
525,842 |
|
|
22.25 |
|
|
Granted |
|
144,278 |
|
|
39.77 |
|
|
Canceled |
|
(12,804) |
|
|
26.20 |
|
|
Vested |
|
(313,797) |
|
|
18.62 |
|
|
Nonvested stock awards at July 31, 2015 |
|
343,519 |
|
$ |
32.77 |
|
|
Granted |
|
175,700 |
|
|
55.40 |
|
|
Canceled |
|
(4,807) |
|
|
45.06 |
|
|
Vested |
|
(183,045) |
|
|
30.06 |
|
|
Nonvested stock awards at July 31, 2016 |
|
331,367 |
|
$ |
46.09 |
|
The fair value of each option grant was estimated on the date of grant using the Black-Scholes option valuation model with the following assumptions:
|
Weighted-Average |
|
|
|
|
|
|
|
|
Black-Scholes Option |
|
Year Ended |
|
|
Year Ended |
|
|
|
Valuation Assumptions |
|
July 31, 2016 |
|
|
July 31, 2015 |
|
|
|
|
|
|
|
|
|
|
|
|
Dividend yield |
|
0.22 |
% |
|
0.25 |
% |
|
|
Expected volatility (1) |
|
55.90 |
% |
|
33.90 |
% |
|
|
Risk-free interest rate (2) |
|
1.41 |
% |
|
1.55 |
% |
|
|
Expected lives (in years) (3) |
|
5.00 |
|
|
5.00 |
|
|
|
(1) |
Volatility was based on historical closing prices of our common stock. |
|
(2) |
The U.S. Treasury rate based on the expected life at the date of grant. |
|
(3) |
Based on historical exercise behavior. |
Additionally, all options were considered to be deductible for tax purposes in the valuation model. Such non-qualified options were tax-effected using the Company’s estimated U.S. effective tax rate at the time of grant. In fiscals 2016 and 2015, the weighted average fair value of options granted was $26.49 and $11.54, respectively. There were no option exercises during the twelve months ended July 31, 2016. The aggregate intrinsic value (i.e. the excess market price over the exercise price) of all options exercised was approximately $5,178,000 and $5,702,000 in fiscals 2015 and 2014, respectively. The aggregate fair value of all options vested was approximately $344,000, $248,000 and $127,000 in fiscals 2016, 2015 and 2014, respectively.
40
A summary of stock option activity follows:
|
|
|
|
|
Weighted |
|
|
|
|
|
Number of |
|
Average |
|
|
|
|
|
Shares |
|
Exercise Price |
|
|
|
|
|
|
|
|
|
|
|
Outstanding at July 31, 2013 |
|
403,831 |
|
$ |
8.25 |
|
|
Granted |
|
30,000 |
|
|
31.81 |
|
|
Canceled |
|
(211,339) |
|
|
6.82 |
|
|
Outstanding at July 31, 2014 |
|
222,492 |
|
|
12.78 |
|
|
Granted |
|
25,000 |
|
|
36.70 |
|
|
Exercised |
|
(139,992) |
|
|
7.11 |
|
|
Outstanding at July 31, 2015 |
|
107,500 |
|
|
25.73 |
|
|
Granted |
|
15,000 |
|
|
55.36 |
|
|
Outstanding at July 31, 2016 |
|
122,500 |
|
$ |
29.36 |
|
|
|
|
|
|
|
|
|
|
Exercisable at July 31, 2014 |
|
157,492 |
|
$ |
8.21 |
|
|
|
|
|
|
|
|
|
|
Exercisable at July 31, 2015 |
|
45,000 |
|
$ |
20.32 |
|
|
|
|
|
|
|
|
|
|
Exercisable at July 31, 2016 |
|
80,834 |
|
$ |
22.72 |
|
The outstanding options at July 31, 2016 and 2015 had an aggregate intrinsic value of approximately $4,605,000 and $3,133,000, respectively. As of July 31, 2016 and 2015, all of the outstanding options had vested or were expected to vest in future periods.
Upon exercise of stock options or grant of stock awards, we typically issue new shares of our common stock as opposed to using treasury shares.
If certain criteria are met when options are exercised or restricted stock becomes vested, the Company is allowed a deduction on its United States income tax return. Accordingly, we account for the income tax effect on such income tax deductions as a reduction of previously recorded deferred income tax assets and as a reduction of income taxes payable. Excess tax benefits arise when the ultimate tax effect of the deduction for tax purposes is greater than the tax benefit on stock compensation expense which was determined based upon the award’s fair value at the time the award is granted. The differences noted above between actual tax deductions and the previously recorded deferred income tax assets are recorded as additional paid-in capital. In fiscals 2016 and 2015, such income tax deductions reduced income taxes payable by $3,059,000 and $5,317,000, respectively, and increased additional paid-in capital by $1,179,000 and $3,168,000, respectively. We classify the cash flows resulting from excess tax benefits as financing cash flows on our Consolidated Statements of Cash Flows.
41
The following table summarizes additional information related to stock options outstanding at July 31, 2016:
|
|
|
|
|
|
|
Options Outstanding |
|
Options Exercisable |
|
||||||||||||
|
|
|
|
|
|
|
|
|
|
Weighted |
|
|
|
|
|
|
|
Weighted |
|
|
|
|
|
|
|
|
|
|
|
|
|
|
Average |
|
|
|
|
|
|
|
Average |
|
|
|
|
|
|
|
|
|
|
|
|
|
|
Remaining |
|
Weighted |
|
|
|
|
Remaining |
|
Weighted |
|
||
|
|
|
|
|
|
|
Number |
|
Contractual |
|
Average |
|
Number |
|
Contractual |
|
Average |
|
||||
|
Range of Exercise |
|
Outstanding |
|
Life |
|
Exercise |
|
Exercisable |
|
Life |
|
Exercise |
|
||||||||
|
Prices |
|
at July 31, 2016 |
|
(Months) |
|
Price |
|
at July 31, 2016 |
|
(Months) |
|
Price |
|
||||||||
|
|
|
|
|
|
|
|
|
|
|
|
|
|
|
|
|
|
|
||||
|
$17.04 |
|
|
52,500 |
|
15 |
|
$ |
17.04 |
|
|
52,500 |
|
15 |
|
$ |
17.04 |
|
||||
|
$31.81 - $36.70 |
|
|
55,000 |
|
32 |
|
$ |
34.03 |
|
|
28,334 |
|
31 |
|
$ |
33.25 |
|
||||
|
$55.36 |
|
|
15,000 |
|
51 |
|
$ |
55.36 |
|
|
— |
|
— |
|
$ |
— |
|
||||
|
|
|
|
122,500 |
|
|
|
$ |
29.36 |
|
|
80,834 |
|
|
|
$ |
22.72 |
|
||||
|
|
|
|
|
|
|
|
|
|
|
|
|
|
|
|
|
|
|
||||
|
Total Intrinsic Value |
|
$ |
4,605,000 |
|
|
|
|
|
|
$ |
3,575,000 |
|
|
|
|
|
|
||||
A summary of our stock award plan follows:
2016 Equity Incentive Plan
On January 7, 2016, the company terminated the Cantel Medical Corp. 2006 Equity Incentive Plan (the “2006 Plan”) and adopted the Cantel Medical Corp. 2016 Equity Incentive Plan (the “2016 Plan”). As a result, no further options or awards will be granted under the Cantel Medical Corp. 2006 Equity Incentive Plan.
We believe that the ability to offer key employees and non-employee directors long-term, equity based compensation will help enable Cantel Medical Corp. to attract, motivate, and retain experienced and highly qualified employees and directors who will contribute to the Company’s financial success. The 2016 Plan provides for the granting of stock options, stock appreciation rights (SARs), restricted stock awards, restricted stock units (RSUs) and performance-based awards to our employees, independent contractors and consultants. It will also provide the flexibility to grant equity-based awards to our non-employee directors. The 2016 Plan does not permit the granting of discounted options or discounted stock appreciation rights.
The maximum number of shares as to which equity awards may be granted under the 2016 Plan is 1,200,000 shares. The 2016 Plan will terminate on the date of our annual meeting of stockholders following the close of our fiscal year ending in 2025, unless terminated earlier by the Board of Directors. Stock awards under this plan:
|
· |
will be granted at the closing market price at the time of the grant, |
|
· |
will include terms of each stock option and SAR determined by the committee at the time of grant, |
|
· |
may not be at an exercise price less than the fair market value of the stock on the date the option is granted and the aggregate fair market value (determined as of the date the option is granted) of shares underlying incentive stock options (“ISOs”) that are exercisable for the first time in any calendar year may not exceed $100,000, |
|
· |
granted to an individual who owns more than 10% of the outstanding voting stock of the Company, may not have the exercise price of each ISO granted be less than 110% of the fair market value of the stock on the date the ISO is granted, |
|
· |
will include terms where the Committee determines the exercise period of each stock option and SAR; however the terms of the options and SARs granted under the Plan may not exceed ten years, subject to certain exceptions set forth in the Plan, and |
|
· |
may be granted in the form of Restricted Stock and Restricted Stock Units, Performance Awards, or Dividends. |
Stock awards outstanding under this plan are subject to risk of forfeiture solely due to an employment length-of-service restriction, with such restriction lapsing as to one-third of the shares of each of the first three anniversaries of the grant date subject to being employed by the company through such vesting date. At July 31, 2016, 13,345 unvested restricted
42
stock shares were outstanding under the 2016 plan. No options were outstanding under the 2016 plan. At July 31, 2016, 1,194,054 shares are collectively available pursuant to restricted stock and other stock awards and stock options and stock appreciation rights.
2006 Equity Incentive Plan
A total of 5,591,000 shares of common stock, of which 2,700,000 shares were authorized for issuance pursuant to stock options and stock appreciation rights and 2,891,000 shares were authorized for issuance pursuant to restricted stock and other stock awards under the 2006 Plan, which was terminated on January 7, 2016 in conjunction with the adoption of the 2016 Plan. Stock options outstanding under this plan:
were granted at the closing market price at the time of the grant,
were granted as stock options that do not qualify as incentive stock options,
are exercisable in three equal annual installments commencing on the first anniversary of the grant date, and
expire five years from the date of the grant.
Restricted stock shares outstanding under this plan are subject to risk of forfeiture solely due to an employment length-of-service restriction, with such restriction lapsing as to one-third of the shares on each of the first three anniversaries of the grant date subject to being employed by the Company through such vesting date. At July 31, 2016, options to purchase 122,500 shares of common stock were outstanding, and 317,932 unvested restricted stock shares were outstanding under the 2006 Plan. No additional stock awards will be granted under this plan.
16.Retirement Plans
We have 401(k) Savings and Retirement Plans for the benefit of eligible United States employees. Additionally, our Canadian and certain European subsidiaries maintain profit sharing plans for the benefit of eligible employees. Contributions by the Company are both discretionary and non-discretionary and are limited in any year to the amount allowable by government tax authorities.
Aggregate employer contributions recognized under these plans were $3,406,000, $2,541,000 and $2,196,000 for fiscals 2016, 2015 and 2014, respectively.
17.Supplemental Cash Flow Information
Interest paid was $3,001,000, $1,970,000 and $1,787,000 for fiscals 2016, 2015 and 2014, respectively.
Income tax payments were $33,559,000, $25,239,000 and $20,481,000 for fiscals 2016, 2015 and 2014, respectively.
18.Information as to Operating Segments and Foreign and Domestic Operations
Cantel Medical is a leading global company dedicated to delivering innovative infection prevention products and services for patients, caregivers, and other healthcare providers which improve outcomes, enhance safety and help save lives. Our products include specialized medical device reprocessing systems for endoscopy and renal dialysis, advanced water purification equipment, sterilants, disinfectants and cleaners, sterility assurance monitoring products for hospitals and dental clinics, disposable infection control products primarily for dental and GI endoscopy markets, dialysate concentrates and hollow fiber membrane filtration and separation products. Additionally, we provide technical service for our products.
In accordance with FASB ASC Topic 280, “Segment Reporting,” (“ASC 280”), we have determined our reportable business segments based upon an assessment of product types, organizational structure, customers and internally prepared financial statements. The primary factors used by us in analyzing segment performance are net sales and operating income.
43
None of our customers accounted for 10% or more of our consolidated net sales during fiscals 2016, 2015 and 2014, except for DaVita Inc. (“DaVita”), which accounted for approximately 10.0% of our consolidated net sales in fiscal 2014. Net sales to DaVita were $48,620,000 in fiscal 2014.
The Company’s segments are as follows:
Endoscopy, which includes medical device reprocessing systems, disinfectants, detergents and other supplies used to high-level disinfect rigid endoscopes, flexible endoscopes and other instrumentation and disposable infection control products intended to reduce the challenges associated with proper cleaning and high-level disinfection of numerous reusable components used in gastrointestinal (GI) endoscopy procedures. In September 2015, this segment commenced the sale of endoscope transport and storage systems, and a number of endoscopy consumable accessories. Additionally, this segment performs technical maintenance service on its products.
Water Purification and Filtration, which includes water purification equipment and services, filtration and separation products and disinfectants, sterilization and decontamination products and services for the medical, pharmaceutical, biotech, beverage and commercial industrial markets.
Two customers collectively accounted for approximately 43.7% of our Water Purification and Filtration segment net sales in fiscal 2016.
Healthcare Disposables, which includes single-use, infection prevention healthcare products including face masks, sterilization pouches, towels and bibs, tray covers, saliva ejectors, plastic cups, germicidal wipes and disinfectants, as well as products for maintaining safe dental unit waterlines. This segment also manufactures and sells biological and chemical indicators for sterility assurance monitoring services in the acute-care, alternate-care, dental and industrial (medical device, life science and other manufacturers) markets. In August 2016, this segment commenced the manufacture and sale of nitrous oxide conscious sedation equipment and related single-use disposable nasal masks.
Four customers collectively accounted for approximately 49.1% of our Healthcare Disposables segment net sales in fiscal 2016.
Dialysis, which includes medical device reprocessing systems, sterilants/disinfectants, dialysate concentrates and other supplies for renal dialysis. Additionally, this segment includes technical maintenance service on its products.
Fresenius and DaVita accounted for approximately 42.6% of our Dialysis segment net sales in fiscal 2016.
Other
In addition, we had another operating segment through April 7, 2015, known as Specialty Packaging. This segment included specialty packaging and thermal control products, as well as related compliance training, for the transport of infectious and biological specimens and thermally sensitive pharmaceutical, medical and other products. The Specialty Packaging operating segment, which comprised the Other reporting segment for financial reporting purposes, was divested on April 7, 2015 as further described in Note 19 to the Consolidated Financial Statements.
The operating segments follow the same accounting policies used for our Consolidated Financial Statements as described in Note 2.
44
Information as to operating segments is summarized below:
|
|
|
|
|
|
|
|
|
|
|
|
|
|
|
Year Ended July 31, |
|
|||||||
|
|
|
2016 |
|
2015 |
|
2014 |
|
|||
|
|
|
|
|
|
|
|
|
|
|
|
|
Net sales: |
|
|
|
|
|
|
|
|
|
|
|
Endoscopy |
|
$ |
341,752,000 |
|
$ |
248,654,000 |
|
$ |
190,440,000 |
|
|
Water Purification and Filtration |
|
|
177,669,000 |
|
|
173,834,000 |
|
|
159,505,000 |
|
|
Healthcare Disposables |
|
|
112,584,000 |
|
|
106,920,000 |
|
|
101,809,000 |
|
|
Dialysis |
|
|
32,750,000 |
|
|
31,240,000 |
|
|
30,926,000 |
|
|
Other |
|
|
— |
|
|
4,356,000 |
|
|
6,069,000 |
|
|
Total |
|
$ |
664,755,000 |
|
$ |
565,004,000 |
|
$ |
488,749,000 |
|
|
|
|
|
|
|
|
|
|
|
|
|
|
|
|
Year Ended July 31, |
|
|||||||
|
|
|
2016 |
|
2015 |
|
2014 |
|
|||
|
|
|
|
|
|
|
|
|
|
|
|
|
Operating income: |
|
|
|
|
|
|
|
|
|
|
|
Endoscopy |
|
$ |
61,021,000 |
|
$ |
40,863,000 |
|
$ |
34,194,000 |
|
|
Water Purification and Filtration |
|
|
30,620,000 |
|
|
30,606,000 |
|
|
25,750,000 |
|
|
Healthcare Disposables |
|
|
24,486,000 |
|
|
19,904,000 |
|
|
18,720,000 |
|
|
Dialysis |
|
|
7,907,000 |
|
|
6,749,000 |
|
|
7,547,000 |
|
|
Other |
|
|
— |
|
|
1,118,000 |
|
|
815,000 |
|
|
|
|
|
124,034,000 |
|
|
99,240,000 |
|
|
87,026,000 |
|
|
General corporate expenses |
|
|
(26,783,000) |
|
|
(18,479,000) |
|
|
(16,098,000) |
|
|
Income from operations |
|
|
97,251,000 |
|
|
80,761,000 |
|
|
70,928,000 |
|
|
Interest expense, net |
|
|
(3,320,000) |
|
|
(2,364,000) |
|
|
(2,317,000) |
|
|
Other expense |
|
|
— |
|
|
(2,206,000) |
|
|
— |
|
|
|
|
|
|
|
|
|
|
|
|
|
|
Income before income taxes |
|
$ |
93,931,000 |
|
$ |
76,191,000 |
|
$ |
68,611,000 |
|
|
|
|
Year Ended July, 31 |
|
|||||||
|
|
|
2016 |
|
2015 |
|
2014 |
|
|||
|
Identifiable assets: |
|
|
|
|
|
|
|
|
|
|
|
Endoscopy |
|
$ |
347,107,000 |
|
$ |
238,799,000 |
|
$ |
203,582,000 |
|
|
Water Purification and Filtration |
|
|
137,731,000 |
|
|
138,069,000 |
|
|
126,397,000 |
|
|
Healthcare Disposables |
|
|
157,918,000 |
|
|
145,391,000 |
|
|
138,240,000 |
|
|
Dialysis |
|
|
20,147,000 |
|
|
26,452,000 |
|
|
25,420,000 |
|
|
Other |
|
|
— |
|
|
— |
|
|
9,316,000 |
|
|
General corporate, including cash and cash equivalents |
|
|
31,629,000 |
|
|
35,320,000 |
|
|
33,190,000 |
|
|
Total |
|
$ |
694,532,000 |
|
$ |
584,031,000 |
|
$ |
536,145,000 |
|
|
|
|
Year Ended July, 31 |
|
|||||||
|
|
|
2016 |
|
2015 |
|
2014 |
|
|||
|
Capital expenditures: |
|
|
|
|
|
|
|
|
|
|
|
Endoscopy |
|
$ |
11,299,000 |
|
$ |
7,042,000 |
|
$ |
6,820,000 |
|
|
Water Purification and Filtration |
|
|
3,376,000 |
|
|
2,984,000 |
|
|
3,318,000 |
|
|
Healthcare Disposables |
|
|
2,606,000 |
|
|
1,587,000 |
|
|
1,367,000 |
|
|
Dialysis |
|
|
667,000 |
|
|
894,000 |
|
|
1,444,000 |
|
|
Other |
|
|
— |
|
|
19,000 |
|
|
34,000 |
|
|
General corporate |
|
|
941,000 |
|
|
234,000 |
|
|
558,000 |
|
|
Total |
|
$ |
18,889,000 |
|
|
12,760,000 |
|
|
13,541,000 |
|
45
|
|
|
Year Ended July, 31 |
|
|||||||
|
|
|
2016 |
|
2015 |
|
2014 |
|
|||
|
Depreciation and amortization: |
|
|
|
|
|
|
|
|
|
|
|
Endoscopy |
|
$ |
14,333,000 |
|
$ |
10,729,000 |
|
$ |
7,001,000 |
|
|
Water Purification and Filtration |
|
|
5,441,000 |
|
|
5,257,000 |
|
|
4,416,000 |
|
|
Healthcare Disposables |
|
|
4,361,000 |
|
|
6,354,000 |
|
|
5,968,000 |
|
|
Dialysis |
|
|
681,000 |
|
|
1,382,000 |
|
|
1,142,000 |
|
|
Other |
|
|
— |
|
|
78,000 |
|
|
294,000 |
|
|
General corporate |
|
|
268,000 |
|
|
157,000 |
|
|
65,000 |
|
|
Total |
|
$ |
25,084,000 |
|
$ |
23,957,000 |
|
$ |
18,886,000 |
|
Information as to geographic areas (including net sales which represent the geographic area from which the Company derives its net sales from external customers) is summarized below:
|
|
|
Year Ended July, 31 |
|
|||||||
|
|
|
2016 |
|
2015 |
|
2014 |
|
|||
|
|
|
|
|
|
|
|
|
|
|
|
|
Net sales: |
|
|
|
|
|
|
|
|
|
|
|
United States |
|
$ |
515,055,000 |
|
$ |
447,848,000 |
|
$ |
403,892,000 |
|
|
Europe/Africa/Middle East |
|
|
88,355,000 |
|
|
62,193,000 |
|
|
32,634,000 |
|
|
Asia/Pacific |
|
|
33,374,000 |
|
|
28,529,000 |
|
|
24,736,000 |
|
|
Canada |
|
|
20,975,000 |
|
|
19,306,000 |
|
|
20,729,000 |
|
|
Latin America/South America |
|
|
6,996,000 |
|
|
7,128,000 |
|
|
6,758,000 |
|
|
Total |
|
$ |
664,755,000 |
|
$ |
565,004,000 |
|
$ |
488,749,000 |
|
|
|
|
July 31, |
|
|||||||
|
|
|
2016 |
|
2015 |
|
2014 |
|
|||
|
Total long-lived assets: |
|
|
|
|
|
|
|
|
|
|
|
United States |
|
$ |
62,820,000 |
|
$ |
57,080,000 |
|
$ |
53,221,000 |
|
|
Europe/Africa/Middle East |
|
|
14,863,000 |
|
|
9,122,000 |
|
|
2,275,000 |
|
|
Asia/Pacific |
|
|
1,607,000 |
|
|
1,081,000 |
|
|
1,112,000 |
|
|
Canada |
|
|
463,000 |
|
|
600,000 |
|
|
1,029,000 |
|
|
Total |
|
|
79,753,000 |
|
|
67,883,000 |
|
|
57,637,000 |
|
|
Goodwill and intangible assets, net |
|
|
392,037,000 |
|
|
327,787,000 |
|
|
314,599,000 |
|
|
Total |
|
$ |
471,790,000 |
|
$ |
395,670,000 |
|
$ |
372,236,000 |
|
19.Disposition of Business
In fiscal 2015, we conducted a strategic review of our Specialty Packaging business and evaluated its potential value in the marketplace relative to the business’s historic and expected returns and concluded that the business was not part of our core strategy and could return a higher value to stockholders by its divestiture. Accordingly, our Specialty Packaging business (reported in the Other reporting segment) was classified as held-for-sale within our Condensed Consolidated Balance Sheet beginning October 31, 2014. Since the operating results of the Specialty Packaging segment, as shown in Note 18 to the Consolidated Financial Statements, were not significant in relation to our overall consolidated operating results, the lack of operating results from this business due to its divestiture did not have a major effect on our operations and financial results, and accordingly, has not been classified as a discontinued operation for any of the periods presented.
On April 7, 2015, we completed the sale of our Specialty Packaging business to a global packaging and service company by selling all the issued and outstanding stock of our Specialty Packaging subsidiary in exchange for $7,531,000 in cash proceeds, of which $660,000 is held in escrow for indemnity obligations, if any, until October 7, 2016 and is recorded in other assets in our Consolidated Balance Sheet. In addition, we incurred approximately $1,128,000 in costs associated with the disposition of this business including bonuses associated with the sale, accelerated stock-based compensation
46
and to a lesser extent certain advisory fees. Furthermore as a result of this disposition, we recognized a foreign currency translation gain of $1,264,000 in our Consolidated Statement of Income, which was recorded in stockholders’ equity immediately preceding the disposition. Such foreign currency translation gain was a result of the monthly translation of the Specialty Packaging segment’s balance sheets beginning in 2004, when the business was acquired. In addition, due to the inability to currently deduct a capital loss and the uncertainty of utilizing a capital loss tax benefit in the future, a tax benefit was not recognized on a portion of the recorded loss on sale of the business. Overall, this transaction, including costs associated with the disposition and the recognition of a foreign currency translation gain, resulted in a $2,206,000 loss, or $0.04 in diluted earnings per share, which was recorded in loss on sale of business in our Consolidated Statements of Income in fiscal 2015. Such amount is subject to further adjustments upon finalization of taxes, which such estimate is currently recorded as a nominal amount, or indemnity obligations, if any.
The following table presents the carrying amounts of assets and liabilities held-for-sale immediately preceding the disposition on April 7, 2015, which are excluded from our Consolidated Balance Sheet at July 31, 2015.
|
|
|
April 7, |
|
|
|
|
|
2015 |
|
|
|
|
|
(Amounts in thousands) |
|
|
|
Cash and cash equivalents |
|
$ |
2,086 |
|
|
Accounts receivable, net of allowance for doubtful accounts |
|
|
660 |
|
|
Inventories |
|
|
789 |
|
|
Prepaid expenses and other current assets |
|
|
181 |
|
|
Property and equipment, net |
|
|
324 |
|
|
Intangible assets, net |
|
|
728 |
|
|
Goodwill |
|
|
5,740 |
|
|
Other assets |
|
|
140 |
|
|
Total assets held-for-sale |
|
$ |
10,648 |
|
|
|
|
|
|
|
|
Accounts payable |
|
$ |
352 |
|
|
Compensation payable |
|
|
70 |
|
|
Accrued expenses |
|
|
74 |
|
|
Deferred revenue |
|
|
18 |
|
|
Deferred income taxes |
|
|
163 |
|
|
Other liabilities |
|
|
75 |
|
|
Total liabilities held-for-sale |
|
$ |
752 |
|
20.Legal Proceedings
In the normal course of business, we are subject to pending and threatened legal actions. It is our policy to accrue for amounts related to these legal matters if it is probable that a liability has been incurred and an amount of anticipated exposure can be reasonably estimated. We do not believe that any of these pending claims or legal actions will have a material adverse effect on our business, financial condition, results of operations or cash flows.
47
21.Quarterly Results of Operations (unaudited)
The following is a summary of the quarterly results of operations for the years ended July 31, 2016 and 2015:
|
|
|
|
First |
|
|
Second |
|
|
Third |
|
|
Fourth |
|
|
|
|
|
Quarter |
|
|
Quarter |
|
|
Quarter |
|
|
Quarter |
|
|
2016 |
|
|
|
|
|
|
|
|
|
|
|
|
|
|
Net sales |
|
$ |
153,779,000 |
|
$ |
158,271,000 |
|
$ |
173,703,000 |
|
$ |
179,002,000 |
|
|
Cost of sales |
|
|
82,581,000 |
|
|
85,934,000 |
|
|
93,382,000 |
|
|
93,672,000 |
|
|
Gross profit |
|
|
71,198,000 |
|
|
72,337,000 |
|
|
80,321,000 |
|
|
85,330,000 |
|
|
Gross profit percentage |
|
|
46.3 |
% |
|
45.7 |
% |
|
46.2 |
% |
|
47.7 |
% |
|
|
|
|
|
|
|
|
|
|
|
|
|
|
|
|
Net income |
|
$ |
14,254,000 |
|
$ |
15,389,000 |
|
$ |
14,019,000 |
|
$ |
16,291,000 |
|
|
|
|
|
|
|
|
|
|
|
|
|
|
|
|
|
Earnings per common share: |
|
|
|
|
|
|
|
|
|
|
|
|
|
|
Basic |
|
$ |
0.34 |
|
$ |
0.37 |
|
$ |
0.34 |
|
$ |
0.39 |
|
|
Diluted |
|
$ |
0.34 |
|
$ |
0.37 |
|
$ |
0.34 |
|
$ |
0.39 |
|
|
|
|
|
First |
|
|
Second |
|
|
Third |
|
|
Fourth |
|
|
|
|
|
Quarter |
|
|
Quarter |
|
|
Quarter |
|
|
Quarter |
|
|
2015 |
|
|
|
|
|
|
|
|
|
|
|
|
|
|
Net sales |
|
$ |
136,811,000 |
|
$ |
135,430,000 |
|
$ |
141,508,000 |
|
$ |
151,255,000 |
|
|
Cost of sales |
|
|
76,297,000 |
|
|
74,839,000 |
|
|
77,909,000 |
|
|
82,492,000 |
|
|
Gross profit |
|
|
60,514,000 |
|
|
60,591,000 |
|
|
63,599,000 |
|
|
68,763,000 |
|
|
Gross profit percentage |
|
|
44.2 |
% |
|
44.7 |
% |
|
44.9 |
% |
|
45.5 |
% |
|
|
|
|
|
|
|
|
|
|
|
|
|
|
|
|
Net income |
|
$ |
11,239,000 |
|
$ |
11,085,000 |
|
$ |
12,356,000 |
|
$ |
13,273,000 |
|
|
|
|
|
|
|
|
|
|
|
|
|
|
|
|
|
Earnings per common share: |
|
|
|
|
|
|
|
|
|
|
|
|
|
|
Basic |
|
$ |
0.27 |
|
$ |
0.27 |
|
$ |
0.30 |
|
$ |
0.32 |
|
|
Diluted (1) |
|
$ |
0.27 |
|
$ |
0.27 |
|
$ |
0.30 |
|
$ |
0.32 |
|
|
(1) |
The summation of quarterly earnings per share does not equal the fiscal year earnings per share due to rounding. |
48
CANTEL MEDICAL CORP.
SCHEDULE II - VALUATION AND QUALIFYING ACCOUNTS
|
|
|
Balance at |
|
|
|
|
|
|
|
|
|
|
Balance |
|
||
|
|
|
Beginning |
|
|
|
|
|
|
|
Translation |
|
at End |
|
|||
|
|
|
of Period |
|
Additions |
|
(Deductions) |
|
Adjustments |
|
of Period |
|
|||||
|
Allowance for doubtful accounts: |
|
|
|
|
|
|
|
|
|
|
|
|
|
|
|
|
|
|
|
|
|
|
|
|
|
|
|
|
|
|
|
|
|
|
|
Year ended July 31, 2016 |
|
$ |
2,092,000 |
|
$ |
15,000 |
|
$ |
(223,000) |
|
$ |
(34,000) |
|
$ |
1,850,000 |
|
|
|
|
|
|
|
|
|
|
|
|
|
|
|
|
|
|
|
|
Year ended July 31, 2015 |
|
$ |
1,874,000 |
|
$ |
464,000 |
|
$ |
(227,000) |
|
$ |
(19,000) |
|
$ |
2,092,000 |
|
|
|
|
|
|
|
|
|
|
|
|
|
|
|
|
|
|
|
|
Year ended July 31, 2014 |
|
$ |
1,265,000 |
|
$ |
706,000 |
|
$ |
(95,000) |
|
$ |
(2,000) |
|
$ |
1,874,000 |
|
|
|
|
|
|
|
|
|
|
|
|
|
|
|
|
|
|
|
|
Reserve for excess and obsolete inventory: |
|
|
|
|
|
|
|
|
|
|
|
|
|
|
|
|
|
|
|
|
|
|
|
|
|
|
|
|
|
|
|
|
|
|
|
Year ended July 31, 2016 |
|
$ |
3,895,000 |
|
$ |
3,182,000 |
|
$ |
(1,569,000) |
|
$ |
(118,000) |
|
$ |
5,390,000 |
|
|
|
|
|
|
|
|
|
|
|
|
|
|
|
|
|
|
|
|
Year ended July 31, 2015 |
|
$ |
4,419,000 |
|
$ |
1,494,000 |
|
$ |
(1,796,000) |
|
$ |
(222,000) |
|
$ |
3,895,000 |
|
|
|
|
|
|
|
|
|
|
|
|
|
|
|
|
|
|
|
|
Year ended July 31, 2014 |
|
$ |
1,781,000 |
|
$ |
3,480,000 |
|
$ |
(802,000) |
|
$ |
(40,000) |
|
$ |
4,419,000 |
|
|
|
|
|
. |
|
|
|
|
|
|
|
|
|
|
|
|
|
|
Deferred tax asset valuation allowance: |
|
|
|
|
|
|
|
|
|
|
|
|
|
|
|
|
|
|
|
|
|
|
|
|
|
|
|
|
|
|
|
|
|
|
|
Year ended July 31, 2016 |
|
$ |
2,037,000 |
|
$ |
929,000 |
|
$ |
(712,000) |
|
|
80,000 |
|
$ |
2,334,000 |
|
|
|
|
|
|
|
|
|
|
|
|
|
|
|
|
|
|
|
|
Year ended July 31, 2015 |
|
$ |
3,538,000 |
|
$ |
1,010,000 |
|
$ |
(2,420,000) |
(1) |
$ |
(91,000) |
|
$ |
2,037,000 |
|
|
|
|
|
|
|
|
|
|
|
|
|
|
|
|
|
|
|
|
Year ended July 31, 2014 |
|
$ |
308,000 |
|
$ |
3,363,000 |
(1) |
$ |
(126,000) |
|
$ |
(7,000) |
|
$ |
3,538,000 |
|
(1)The amounts primarily include additions and deductions of valuation allowances associated with New Jersey net operating losses, as further explained in Note 10 to the Consolidated Financial Statements.
49