Attached files
| file | filename |
|---|---|
| 8-K - 8-K - IMPAC MORTGAGE HOLDINGS INC | a16-19126_18k.htm |
Exhibit 99.1
Impac Mortgage Holdings, Inc. (NYSE MKT:IMH) JMP Securities Financial Services and Real Estate Conference September 27,2016

Disclaimers This presentation, and the accompanying oral presentation, contain forward-looking statements within the meaning of Section 21E of the Securities Exchange Act of 1934, as amended, regarding management’s beliefs, estimates, projections and assumptions with respect to, among other things, the Company’s financial results, future operations, business plans and investment strategies, as well as industry and market conditions, all of which are subject to change. Words like “believe,” “expect,” “anticipate,” “promise,” “plan,” and other expressions or words of similar meanings, as well as future or conditional verbs such as “will,” “would,” “should,” “could,” or “may” are generally intended to identify forward-looking statements. Actual results and operations for any future period may vary materially from those projected herein, from past results discussed herein, or from illustrative examples provided herein. Factors which could cause actual results to differ materially from historical results or those anticipated include, but are not limited to: failure to achieve the benefits expected from the acquisition of the CashCall Mortgage operations, including an increase in origination volume generally, increase in each of our origination channels and ability to successfully use the marketing platform to expand volumes of our other loan products; difficulties related to the development, marketing, sale and financing of new mortgage products, including expansion of non-Qualified Mortgage originations and conventional and government loan programs; ability to increase our market share in the various residential mortgage businesses and create brand awareness; challenges related to retaining refinancing business; ability to effectively identify, manage, monitor and mitigate financial risks; unexpected interest rate fluctuations and margin compression; dependence on U.S. government-sponsored entities and changes in their current roles or their guarantees or guidelines; difficulties inherent in adjusting the size of our operations to reflect changes in business levels; our ability to successfully use warehousing capacity; issues and system risks related to our technology, including the ability to mitigate cybersecurity risks and cyber incidents; ability to successfully create cost and product efficiencies through new technology; more than expected increases in default rates or loss severities and mortgage related losses; ability to obtain additional financing, through lending and repurchase facilities, debt or equity funding, strategic relationships or otherwise; the terms of any financing, whether debt or equity, that we do obtain and our expected use of proceeds from any financing; obligations to indemnify third-party purchasers or repurchase loans if loans that it originates, acquires, services or assists in the fulfillment of, fail to meet certain criteria or characteristics or under other circumstances; increased competition in the mortgage lending industry by larger or more efficient companies; the outcome, including any settlements, of litigation or regulatory actions pending against us or other legal contingencies; our compliance with applicable local, state and federal licensing and operational requirements and laws and regulations, including regulations promulgated by the Consumer Financial Protection Bureau; and changes in U.S. real estate market conditions and other general market and economic conditions. Management has prepared the preliminary results presented heriein in good faith based upon the Company's internal reporting as of and for the two-month period ended August 31, 2016. These results are preliminary and unaudited, have not been reviewed by external auditors and are subject to completion and, as such, may be revised as a result of management's further review of the Company's results. There can be no assurance that the Company's final results for the quarterly period ending September 30, 2016 will not differ from these estimates. Any such changes could be material. During the course of the preparation of the Company's financial statements and related notes as of the nine months ended September 30, 2016, the Company may identify items that may require it to make material adjustments to the preliminary financial information presented above. These preliminary results should not be viewed as a substitute for full interim financial statements prepared in accordance with U.S. GAAP. In addition, the preliminary financial information presented herein is not necessarily indicative of the results to be achieved for the remainder of 2016 or any future period. You should not place undue reliance on any forward-looking statement and should consider all of the uncertainties and risks described above, as well as those more fully discussed in reports and other documents filed by the Company with the Securities and Exchange Commission from time to time. The Company undertakes no obligation to publicly update or revise any forward-looking statements or any other information contained herein, and the statements made in this presentation are current as of the date of this presentation only.
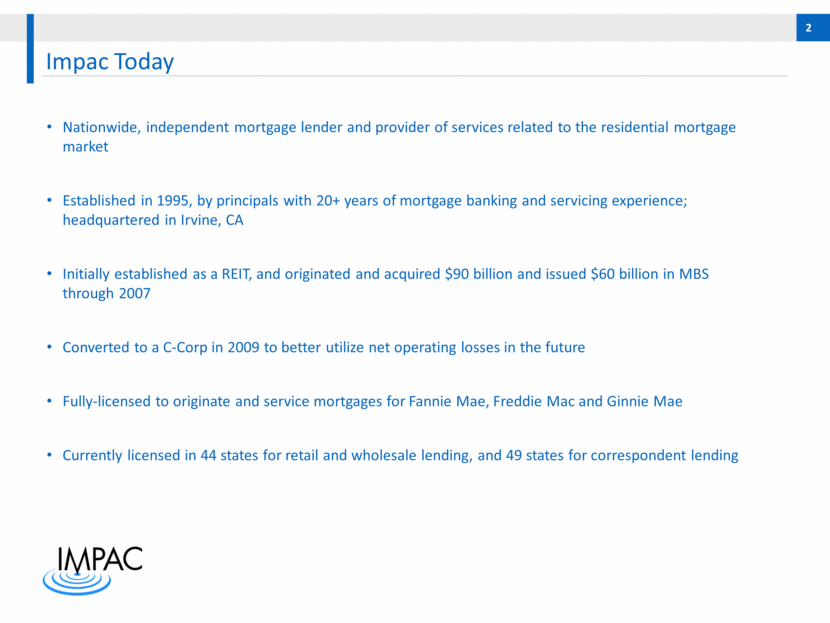
Impac Today Nationwide, independent mortgage lender and provider of services related to the residential mortgage market Established in 1995, by principals with 20+ years of mortgage banking and servicing experience; headquartered in Irvine, CA Initially established as a REIT, and originated and acquired $90 billion and issued $60 billion in MBS through 2007 Converted to a C-Corp in 2009 to better utilize net operating losses in the future Fully-licensed to originate and service mortgages for Fannie Mae, Freddie Mac and Ginnie Mae Currently licensed in 44 states for retail and wholesale lending, and 49 states for correspondent lending
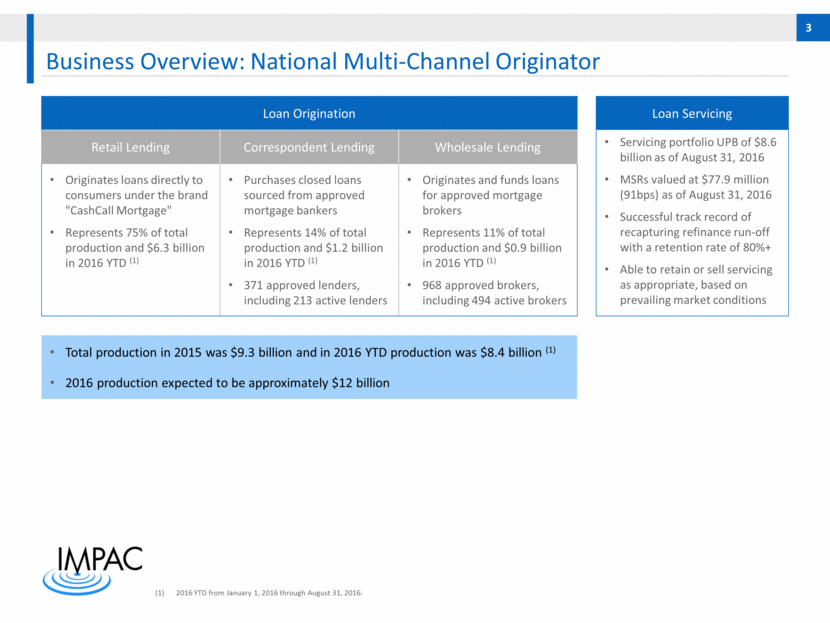
Business Overview: National Multi-Channel Originator 2016 YTD from January 1, 2016 through August 31, 2016. Loan Origination Loan Servicing Retail Lending Correspondent Lending Wholesale Lending Servicing portfolio UPB of $8.6 billion as of August 31, 2016 MSRs valued at $77.9 million (91bps) as of August 31, 2016 Successful track record of recapturing refinance run-off with a retention rate of 80%+ Able to retain or sell servicing as appropriate, based on prevailing market conditions Originates loans directly to consumers under the brand "CashCall Mortgage" Represents 75% of total production and $6.3 billion in 2016 YTD (1) Purchases closed loans sourced from approved mortgage bankers Represents 14% of total production and $1.2 billion in 2016 YTD (1) 371 approved lenders, including 213 active lenders Originates and funds loans for approved mortgage brokers Represents 11% of total production and $0.9 billion in 2016 YTD (1) 968 approved brokers, including 494 active brokers Total production in 2015 was $9.3 billion and in 2016 YTD production was $8.4 billion (1) 2016 production expected to be approximately $12 billion
Diversified Model Well-Positioned for Interest Rate Changes Rate Environment Origination Servicing Rates Rise Yield Curve Shifts Upward / Yield Curve Steepens Slow-down of refinance business Initial acceleration of purchase business vs. refinance business Opportunities in wide-margin non-QM loan products Reduced prepayment speeds on MSR portfolio MSR assets increase in value More stable servicing income revenue stream Rates Fall Yield Curve Shifts Downward / Yield Curve Flattens Increased agency origination volumes across channels Recapture of refinance business with attractive gain-on-sale margins MSR run-off and valuation adjustment Grow servicing portfolio from new originations of lower coupon loans
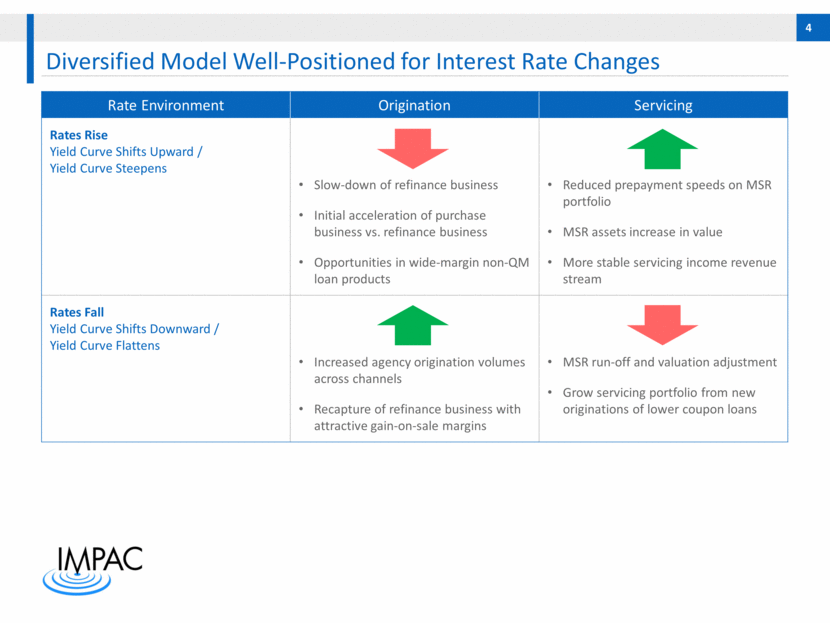
Growth Strategies Capitalize on favorable market backdrop in the mortgage industry to enhance position as a leading publicly traded nationwide non-bank mortgage lender and servicer Capitalize on MSR Investment Opportunities Finance continued aggregation of high-quality MSR assets Attractive opportunity to diversify revenue streams and mitigate interest rate exposure Valuable and durable asset in rising interest rate environment Increase Core Origination Market Share Diversify geographic footprint of retail channel Originate new loan products not previously offered by CashCall Mortgage retail platform (e.g., FHA loans and non-QM) Grow correspondent and wholesale origination channels Non-Conforming Mortgages Opportunity to originate loans for a growing subset of underserved borrowers Ability to originate non-QM products across all channels with significant opportunity to leverage CashCall Mortgage retail platform Originate loans with attractive terms and incentives for lenders (i.e., higher margin, less interest rate sensitivity) Take advantage of high barriers to entry
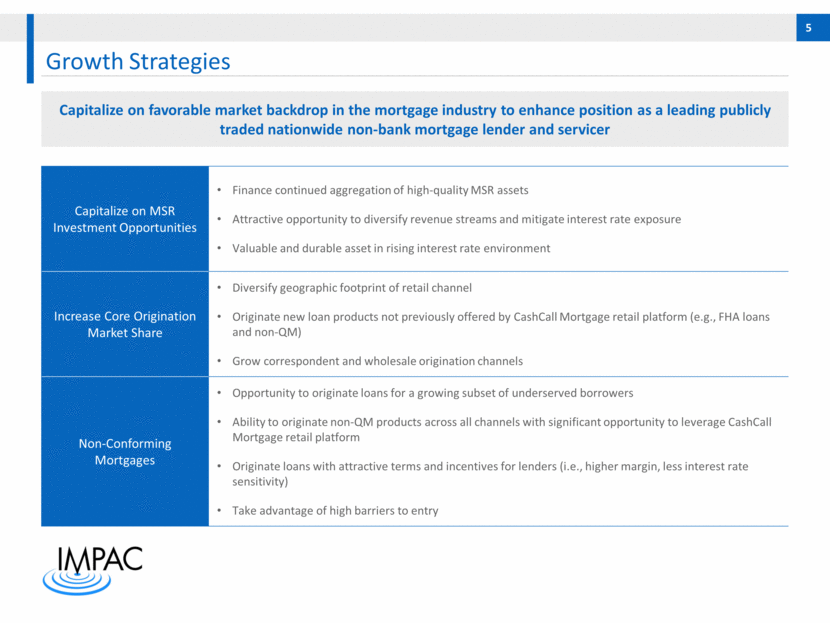
Key Financial Metrics Excluding preferred stock liquation preference. 2016 YTD from January 1, 2016 through August 31, 2016. Strong growth in origination volume Originations of $5.6 billion for six months ended June 30, 2016 vs. $5.0 billion for six months ended June 30, 2015, an 11.6% increase Originations of $8.4 billion in 2016 YTD (2) Attractive gain-on-sale margins Significant growth in servicing portfolio and MSR fair value Servicing portfolio UPB of $6.6 billion as of June 30, 2016 and $8.6 billion as of August 31, 2016 Completed follow-on offering in September 2016, increasing stockholders’ equity by $42 million to a pro forma balance of approximately $190 million Current federal NOLs carry forwards of nearly $500 million allow Impac to tax-shelter income as C-Corp and retain earnings to build book value As of, or for the period ended FY 2014 FY 2015 1H 2016 (In millions, except per share amounts) 12/31/14 12/31/15 06/30/16 Origination volume $2,848.8 $9,259.0 $5,596.6 Gain-on-sale margin (average) 0.99% 1.83% 2.37% Servicing portfolio UPB $2,267.1 $3,570.7 $6,641.5 MSR, fair value $24.4 $36.4 $56.4 MSR, fair value as % of UPB 1.08% 1.02% 0.85% Weighted average coupon of servicing portfolio 4.21% 3.96% 3.87% Total revenues $44.1 $167.0 $116.5 GAAP net income (6.3) 80.8 13.2 Non-GAAP operating net income ($13.2) $33.5 $25.5 GAAP EPS ($0.68) $6.40 $1.00 Non-GAAP operating EPS ($1.41) $2.57 $1.93 Total stockholders' equity $25.0 $114.5 $153.5 Book value per share (1) $2.60 $11.09 $12.25 Employees (period-end) 298 564 730
Question and Answer
[LOGO]
