Attached files
| file | filename |
|---|---|
| 8-K - 8-K - Cardiff Oncology, Inc. | a16-18899_18k.htm |
Exhibit 99.1
overview
Forward-looking statements Statements in this presentation about the Company's expectations, applications of its technology, markets, launch of tests and other statements that are not historical facts constitute “forward-looking statements” for purposes of the safe harbor provisions of the Private Securities Litigation Reform Act of 1995 and are based on management's current beliefs, assumptions, estimates and projections. Actual results may differ materially from those projected in the forward-looking statements for various reasons, including, without limitation, risks associated with product and test development, test transfer to contracting labs, government regulation, market acceptance, limited commercial experience, dependence on key personnel, obtaining financing and other factors discussed in the Company's periodic reports filed with the Securities and Exchange Commission, and the Company anticipates that subsequent events and developments will cause its views to change. While the Company may elect to update these forward-looking statements in the future, it specifically disclaims any obligation to do so. These forward-looking statements should not be relied upon as representing the Company’s views as of any date subsequent to the date of this presentation.

Experienced Leadership Team Bill Welch Chief Executive Officer Mark Erlander, PhD Chief Scientific Officer Karsten Schmidt, PhD Chief Technology Officer Elizabeth Anderson, CPA VP, Finance & Administration Rob Kelley VP, Marketing Vlada Melnikova, MD, PhD VP, Clinical & Translational Affairs Nick Nelson VP, Strategy & Corporate Development Brad Runge VP, Sales & Client Services Janel Dockter VP, Product Development

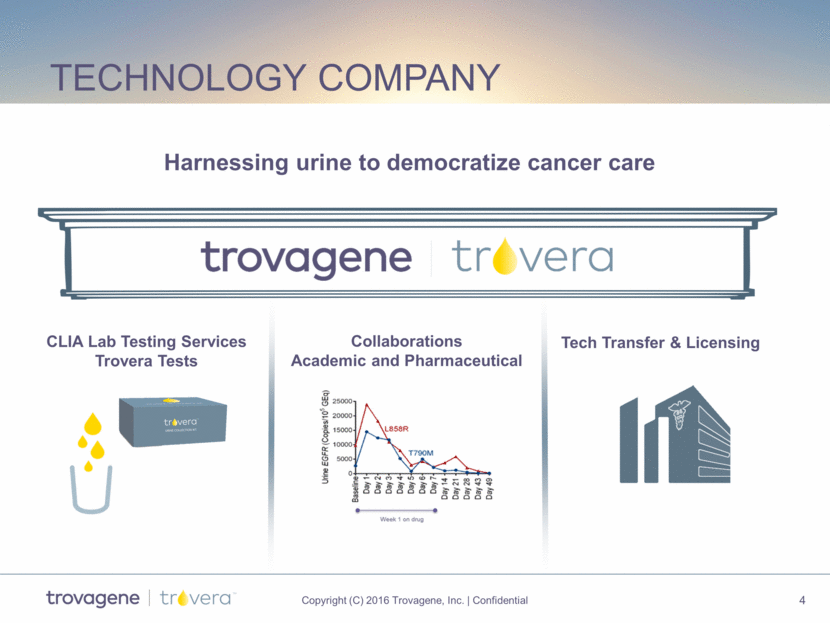
technology company Harnessing urine to democratize cancer care CLIA Lab Testing Services Trovera Tests Tech Transfer & Licensing Collaborations Academic and Pharmaceutical
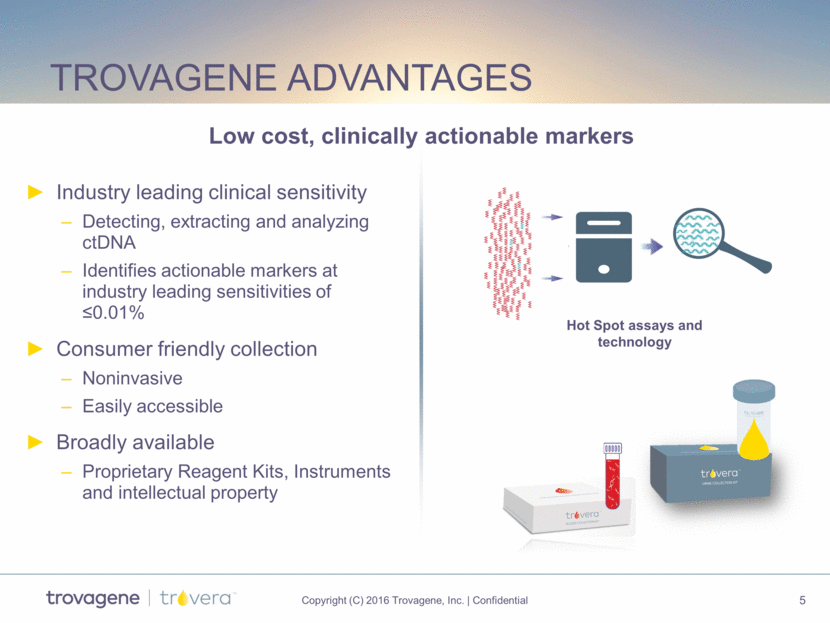
Trovagene advantages Industry leading clinical sensitivity Detecting, extracting and analyzing ctDNA Identifies actionable markers at industry leading sensitivities of <0.01% Consumer friendly collection Noninvasive Easily accessible Broadly available Proprietary Reagent Kits, Instruments and intellectual property Low cost, clinically actionable markers Hot Spot assays and technology
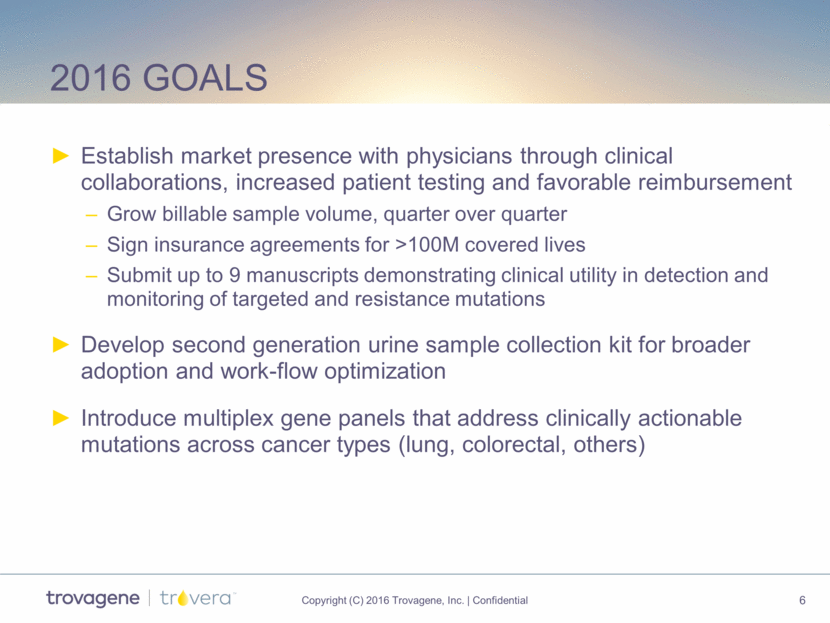
2016 goals Establish market presence with physicians through clinical collaborations, increased patient testing and favorable reimbursement Grow billable sample volume, quarter over quarter Sign insurance agreements for >100M covered lives Submit up to 9 manuscripts demonstrating clinical utility in detection and monitoring of targeted and resistance mutations Develop second generation urine sample collection kit for broader adoption and work-flow optimization Introduce multiplex gene panels that address clinically actionable mutations across cancer types (lung, colorectal, others)
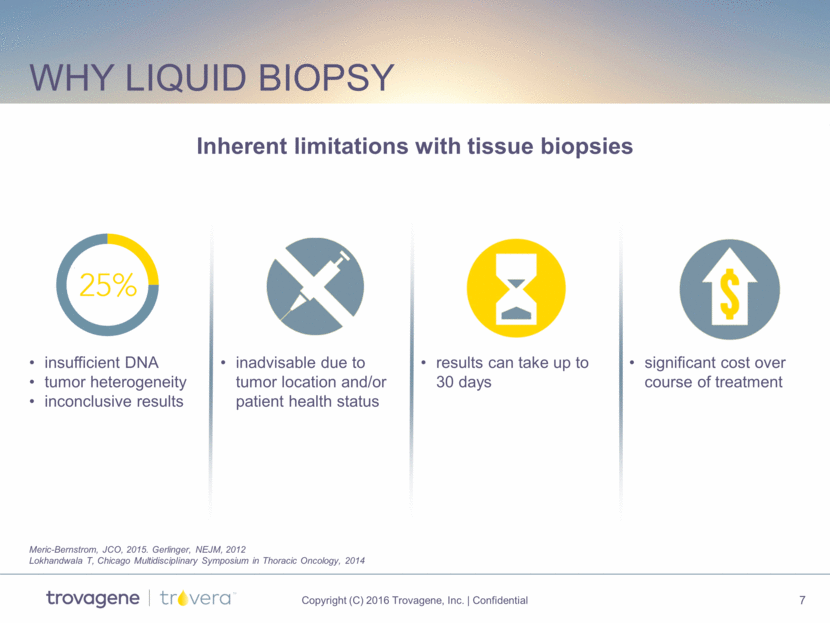
Why liquid biopsy insufficient DNA tumor heterogeneity inconclusive results inadvisable due to tumor location and/or patient health status results can take up to 30 days significant cost over course of treatment Inherent limitations with tissue biopsies Meric-Bernstrom, JCO, 2015. Gerlinger, NEJM, 2012 Lokhandwala T, Chicago Multidisciplinary Symposium in Thoracic Oncology, 2014
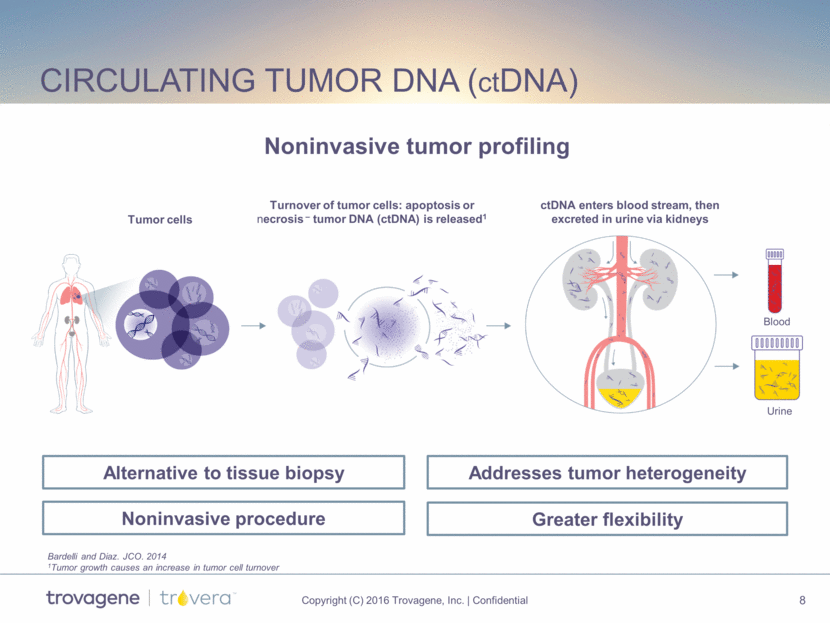
Blood Urine Noninvasive tumor profiling Circulating tumor DNA (ctDNA) Bardelli and Diaz. JCO. 2014 1Tumor growth causes an increase in tumor cell turnover Tumor cells Turnover of tumor cells: apoptosis or necrosis – tumor DNA (ctDNA) is released1 ctDNA enters blood stream, then excreted in urine via kidneys Alternative to tissue biopsy Noninvasive procedure Addresses tumor heterogeneity Greater flexibility
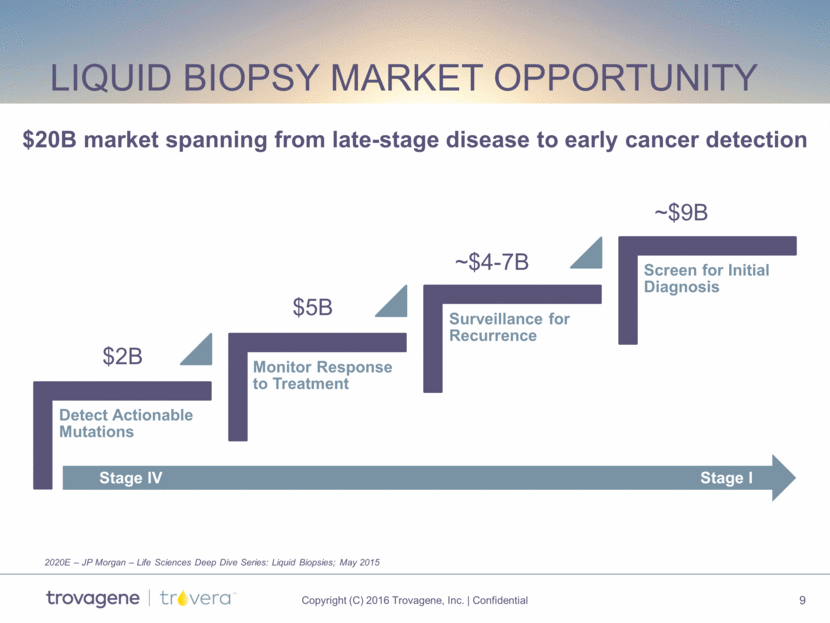
liquid biopsy Market Opportunity $20B market spanning from late-stage disease to early cancer detection $2B $5B 2020E – JP Morgan – Life Sciences Deep Dive Series: Liquid Biopsies; May 2015 ~$4-7B ~$9B Stage I Stage IV Detect Actionable Mutations Monitor Response to Treatment Surveillance for Recurrence Screen for Initial Diagnosis
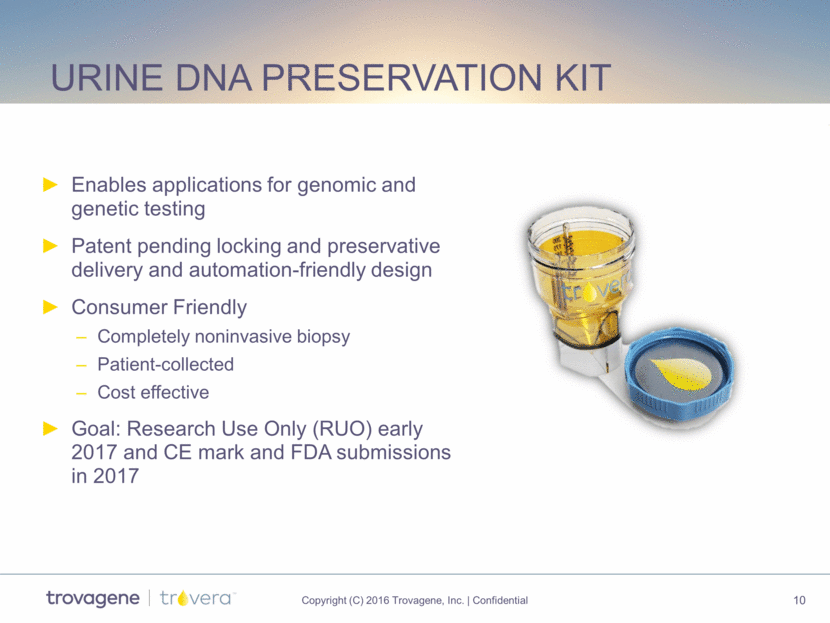
urine dna Preservation kit Enables applications for genomic and genetic testing Patent pending locking and preservative delivery and automation-friendly design Consumer Friendly Completely noninvasive biopsy Patient-collected Cost effective Goal: Research Use Only (RUO) early 2017 and CE mark and FDA submissions in 2017
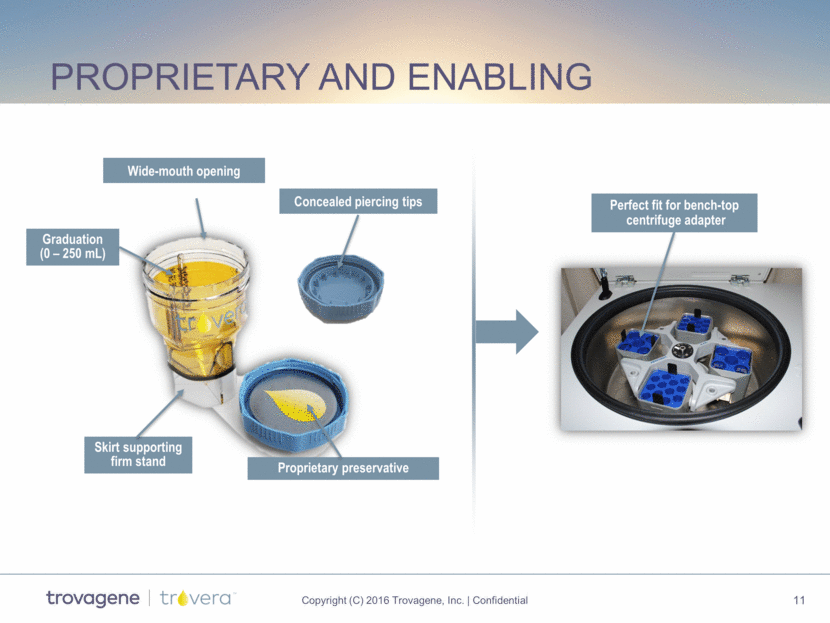
proprietary and enabling Wide-mouth opening Proprietary preservative Graduation (0 – 250 mL) Skirt supporting firm stand Concealed piercing tips Perfect fit for bench-top centrifuge adapter
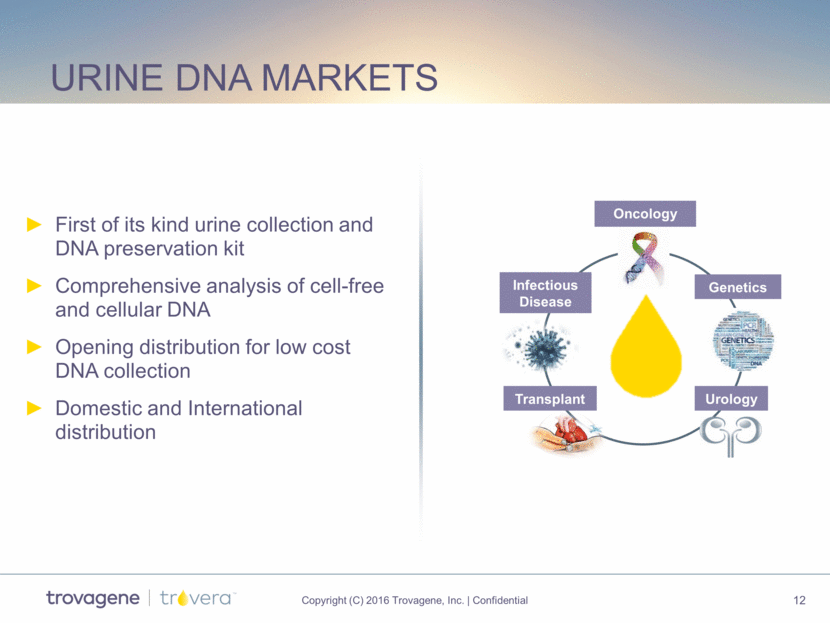
Urine DNA markets First of its kind urine collection and DNA preservation kit Comprehensive analysis of cell-free and cellular DNA Opening distribution for low cost DNA collection Domestic and International distribution Infectious Disease Transplant Urology Genetics Oncology
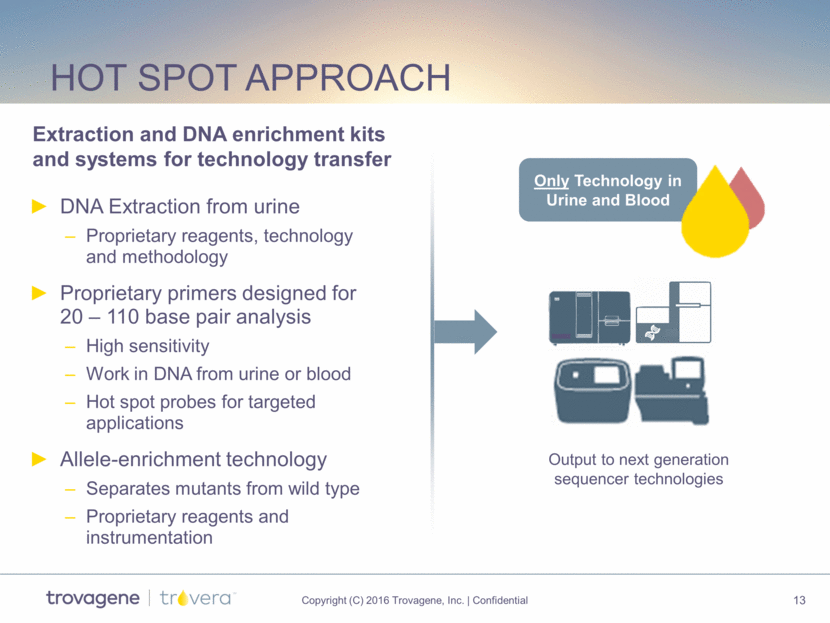
Hot spot approach DNA Extraction from urine Proprietary reagents, technology and methodology Proprietary primers designed for 20 – 110 base pair analysis High sensitivity Work in DNA from urine or blood Hot spot probes for targeted applications Allele-enrichment technology Separates mutants from wild type Proprietary reagents and instrumentation Output to next generation sequencer technologies Only Technology in Urine and Blood Extraction and DNA enrichment kits and systems for technology transfer
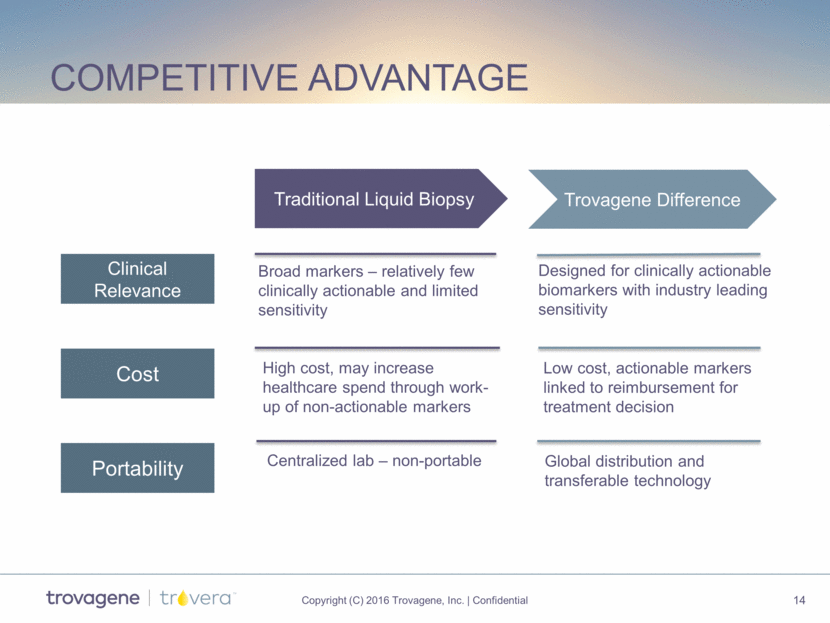
competitive advantage Traditional Liquid Biopsy Trovagene Difference Clinical Relevance Cost Portability Broad markers – relatively few clinically actionable and limited sensitivity Designed for clinically actionable biomarkers with industry leading sensitivity Global distribution and transferable technology High cost, may increase healthcare spend through work- up of non-actionable markers Low cost, actionable markers linked to reimbursement for treatment decision Centralized lab – non-portable
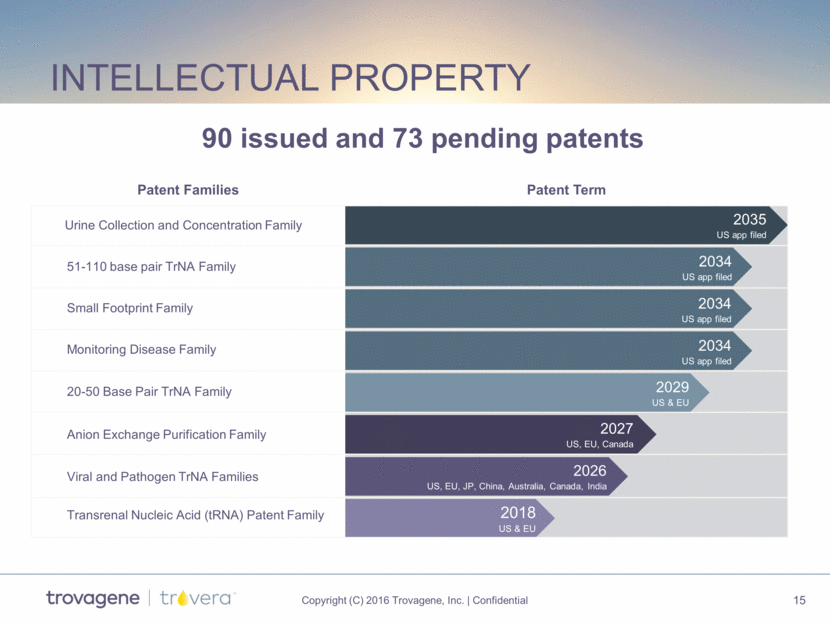
Intellectual Property 51-110 base pair TrNA Family Urine Collection and Concentration Family Patent Term 2035 US app filed 2034 US app filed 2029 US & EU 2018 US & EU Small Footprint Family Monitoring Disease Family 20-50 Base Pair TrNA Family Anion Exchange Purification Family Viral and Pathogen TrNA Families Patent Families Transrenal Nucleic Acid (tRNA) Patent Family 2026 US, EU, JP, China, Australia, Canada, India 2034 US app filed 2034 US app filed 2027 US, EU, Canada 90 issued and 73 pending patents
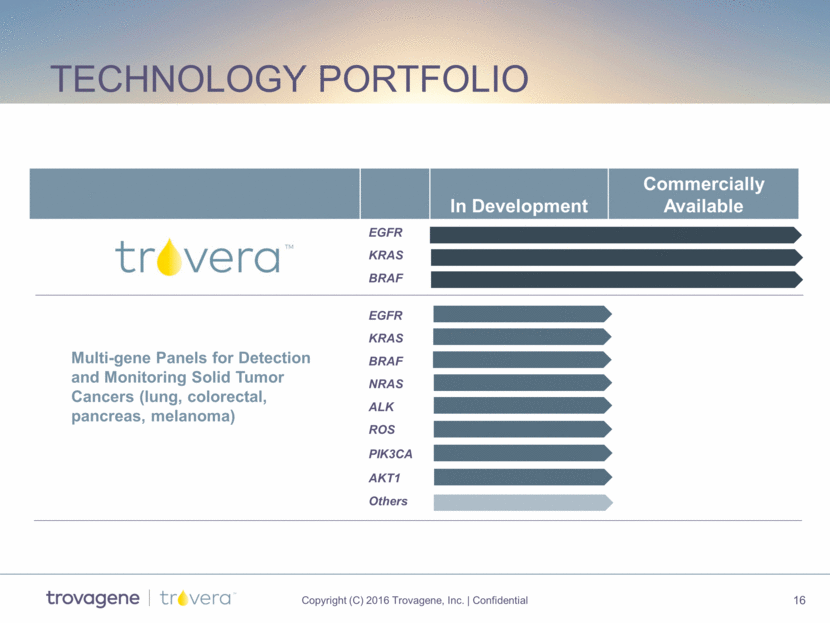
Technology portfolio In Development Commercially Available EGFR KRAS BRAF EGFR KRAS BRAF NRAS ALK ROS PIK3CA AKT1 Others Multi-gene Panels for Detection and Monitoring Solid Tumor Cancers (lung, colorectal, pancreas, melanoma)
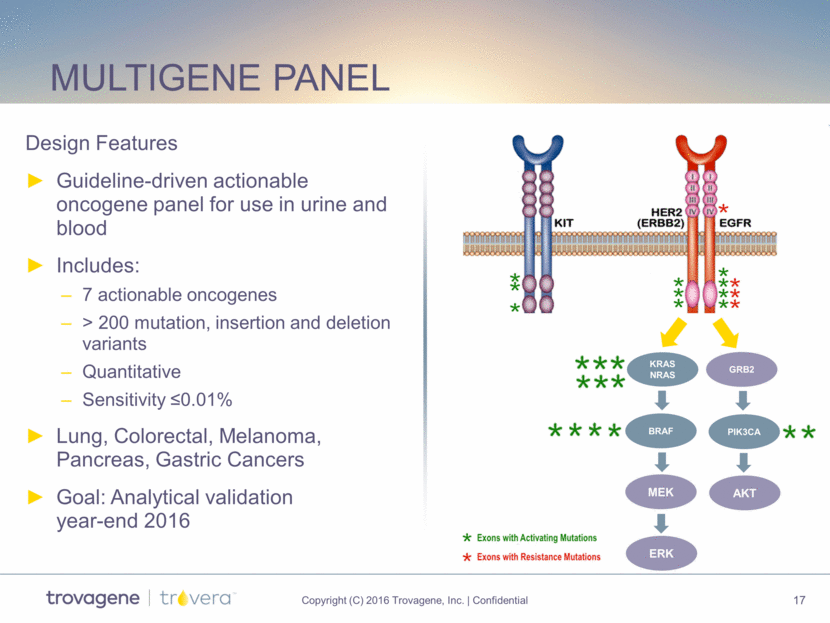
Multigene panel MEK ERK KRAS NRAS Design Features Guideline-driven actionable oncogene panel for use in urine and blood Includes: 7 actionable oncogenes > 200 mutation, insertion and deletion variants Quantitative Sensitivity <0.01% Lung, Colorectal, Melanoma, Pancreas, Gastric Cancers Goal: Analytical validation year-end 2016 BRAF GRB2 PIK3CA AKT
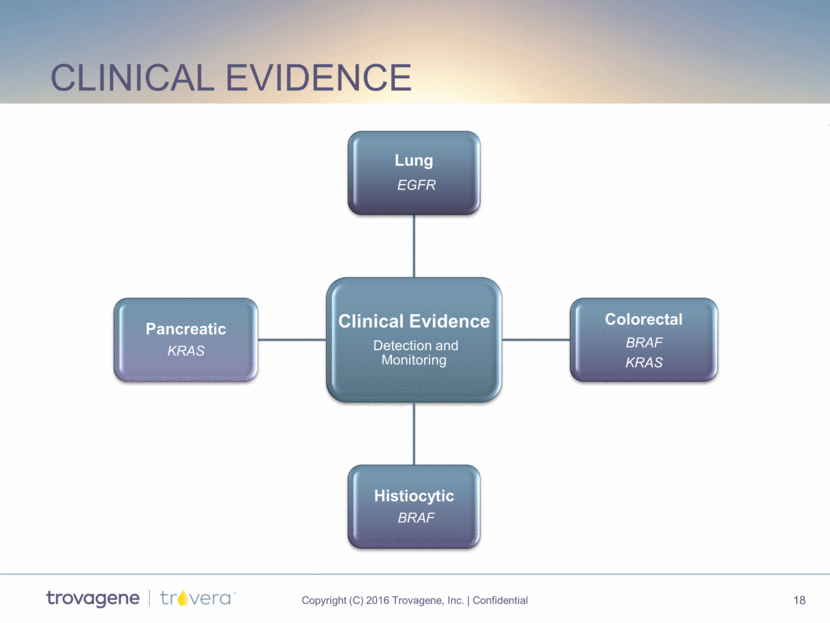
Clinical evidence Clinical Evidence Detection and Monitoring Lung EGFR Colorectal BRAF KRAS Histiocytic BRAF Pancreatic KRAS
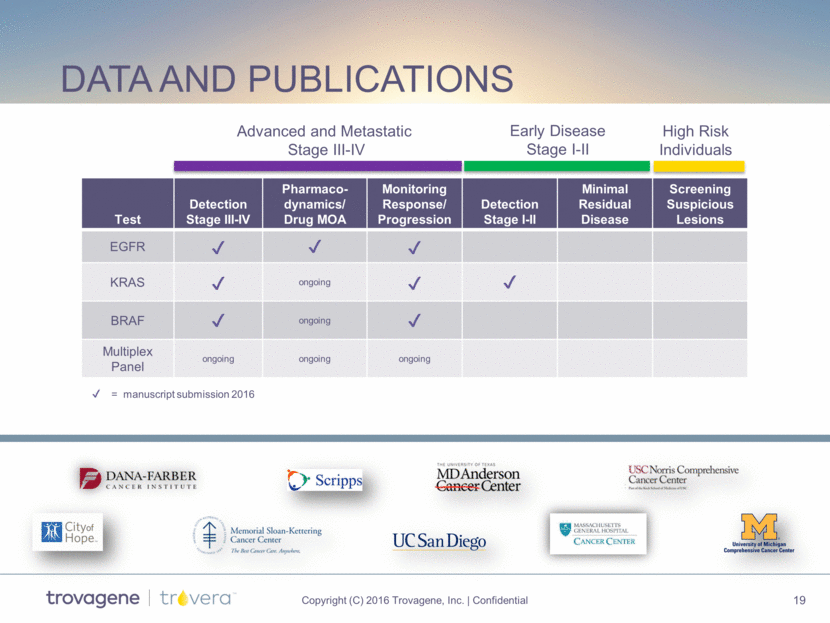
data and publications Test Detection Stage III-IV Pharmaco-dynamics/ Drug MOA Monitoring Response/ Progression Detection Stage I-II Minimal Residual Disease Screening Suspicious Lesions EGFR KRAS ongoing BRAF ongoing Multiplex Panel ongoing ongoing ongoing Advanced and Metastatic Stage III-IV Early Disease Stage I-II High Risk Individuals = manuscript submission 2016
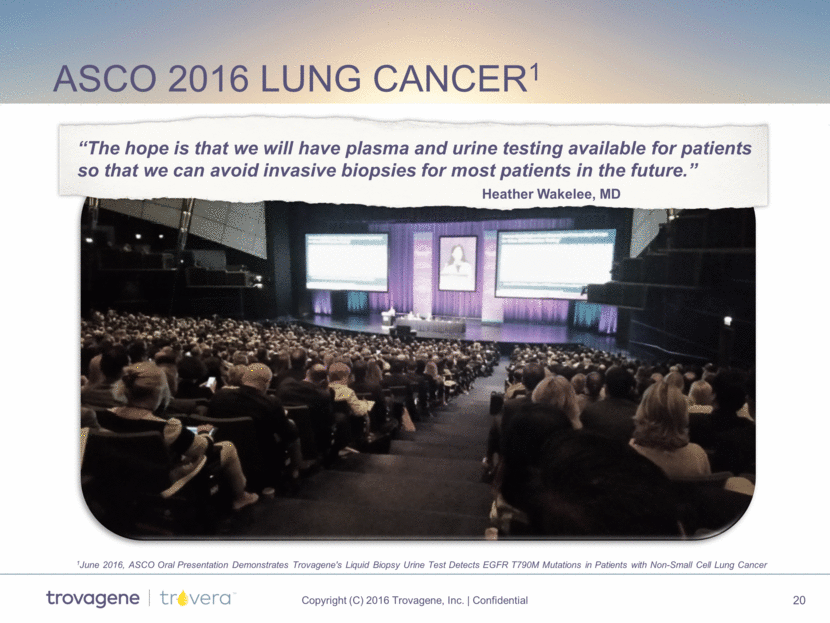
ASCO 2016 Lung cancer1 “The hope is that we will have plasma and urine testing available for patients so that we can avoid invasive biopsies for most patients in the future.” Heather Wakelee, MD 1June 2016, ASCO Oral Presentation Demonstrates Trovagene's Liquid Biopsy Urine Test Detects EGFR T790M Mutations in Patients with Non-Small Cell Lung Cancer
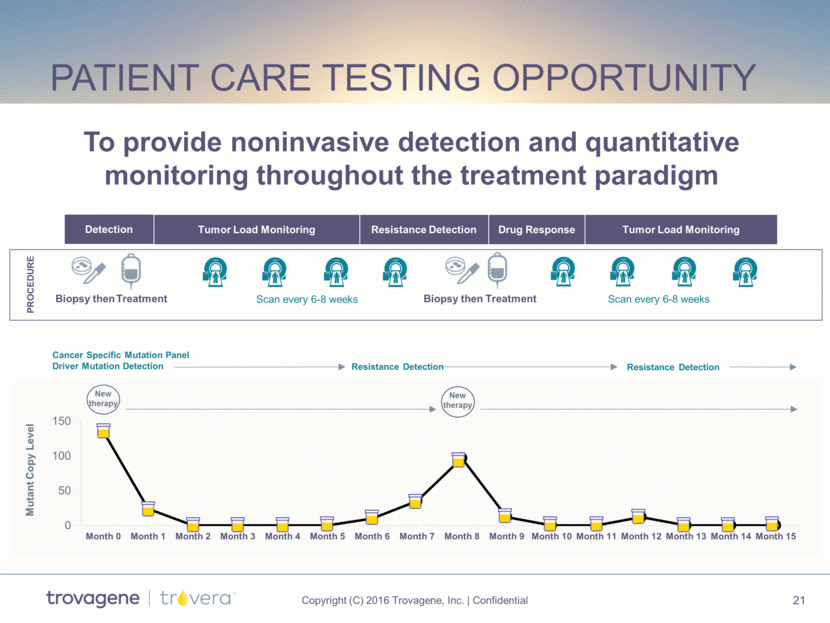
Patient Care Testing opportunity Resistance Detection Tumor Load Monitoring Drug Response Tumor Load Monitoring Treatment Treatment Biopsy then PROCEDURE Scan every 6-8 weeks Scan every 6-8 weeks Biopsy then Detection Cancer Specific Mutation Panel Driver Mutation Detection Driver Mutation One week New therapy Mutant Copy Level New therapy Resistance Detection Resistance Detection To provide noninvasive detection and quantitative monitoring throughout the treatment paradigm 0 50 100 150 Month 0 Month 1 Month 2 Month 3 Month 4 Month 5 Month 6 Month 7 Month 8 Month 9 Month 10 Month 11 Month 12 Month 13 Month 14 Month 15
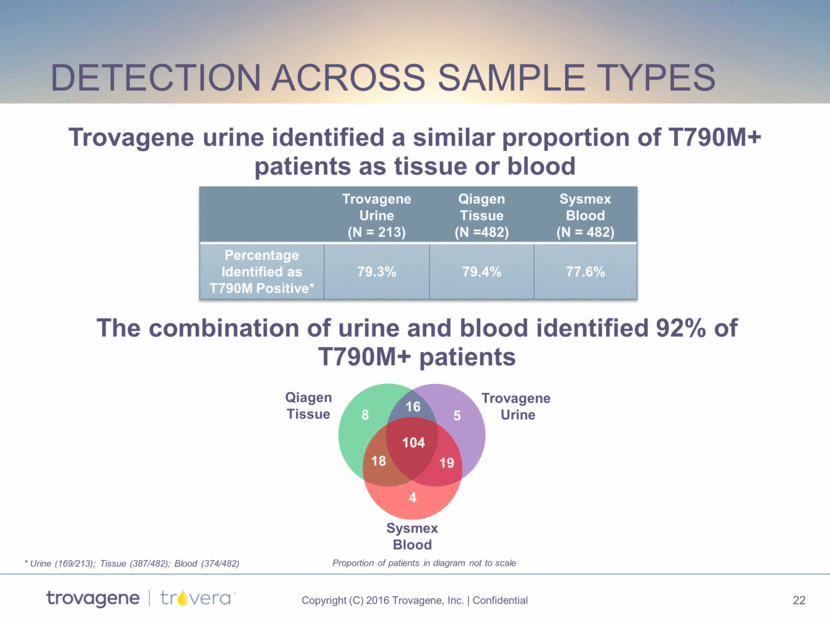
Detection Across sample types Trovagene Urine (N = 213) Qiagen Tissue (N =482) Sysmex Blood (N = 482) Percentage Identified as T790M Positive* 79.3% 79.4% 77.6% Trovagene Urine Qiagen Tissue Sysmex Blood 19 5 8 18 4 104 16 Trovagene urine identified a similar proportion of T790M+ patients as tissue or blood The combination of urine and blood identified 92% of T790M+ patients * Urine (169/213); Tissue (387/482); Blood (374/482) Proportion of patients in diagram not to scale
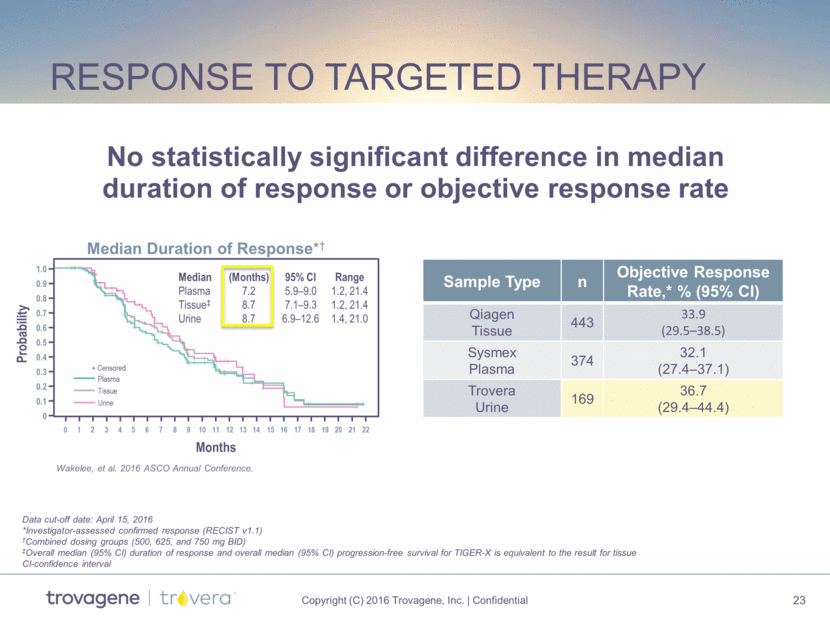
response to targeted therapy 1 0 2 3 4 5 6 7 8 9 10 11 12 13 14 15 16 17 18 19 20 21 22 Months 0 0.1 0.2 0.3 0.4 0.5 0.6 0.7 0.8 0.9 1.0 Probability Plasma Tissue Urine + Censored Median (Months) 95% CI Range Plasma 7.2 5.9–9.0 1.2, 21.4 Tissue‡ 8.7 7.1–9.3 1.2, 21.4 Urine 8.7 6.9–12.6 1.4, 21.0 0 0.1 0.2 Median Duration of Response*† Data cut-off date: April 15, 2016 *Investigator-assessed confirmed response (RECIST v1.1) †Combined dosing groups (500, 625, and 750 mg BID) ‡Overall median (95% CI) duration of response and overall median (95% CI) progression-free survival for TIGER-X is equivalent to the result for tissue CI-confidence interval Sample Type n Objective Response Rate,* % (95% CI) Qiagen Tissue 443 33.9 (29.5–38.5) Sysmex Plasma 374 32.1 (27.4–37.1) Trovera Urine 169 36.7 (29.4–44.4) Wakelee, et al. 2016 ASCO Annual Conference. No statistically significant difference in median duration of response or objective response rate
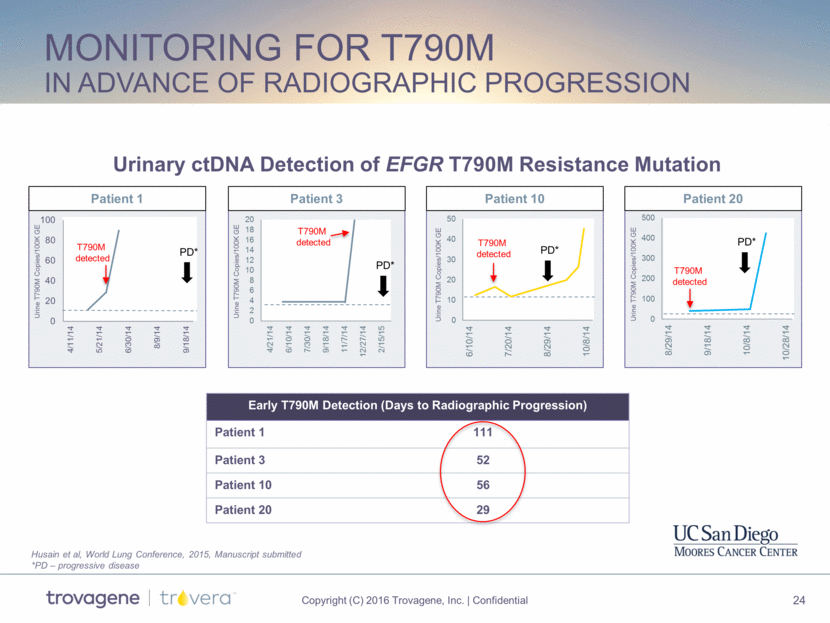
Monitoring for T790M in advance of Radiographic Progression Patient 20 Patient 10 Patient 3 PD* PD* PD* T790M detected T790M detected PD* T790M detected T790M detected Urine T790M Copies/100K GE Patient 1 Urine T790M Copies/100K GE Urine T790M Copies/100K GE Urine T790M Copies/100K GE Early T790M Detection (Days to Radiographic Progression) Patient 1 111 Patient 3 52 Patient 10 56 Patient 20 29 Urinary ctDNA Detection of EFGR T790M Resistance Mutation Husain et al, World Lung Conference, 2015, Manuscript submitted *PD – progressive disease 0 2 4 6 8 10 12 14 16 18 20 4/21/14 6/10/14 7/30/14 9/18/14 11/7/14 12/27/14 2/15/15 0 20 40 60 80 100 4/11/14 5/21/14 6/30/14 8/9/14 9/18/14 0 10 20 30 40 50 6/10/14 7/20/14 8/29/14 10/8/14 0 100 200 300 400 500 8/29/14 9/18/14 10/8/14 10/28/14
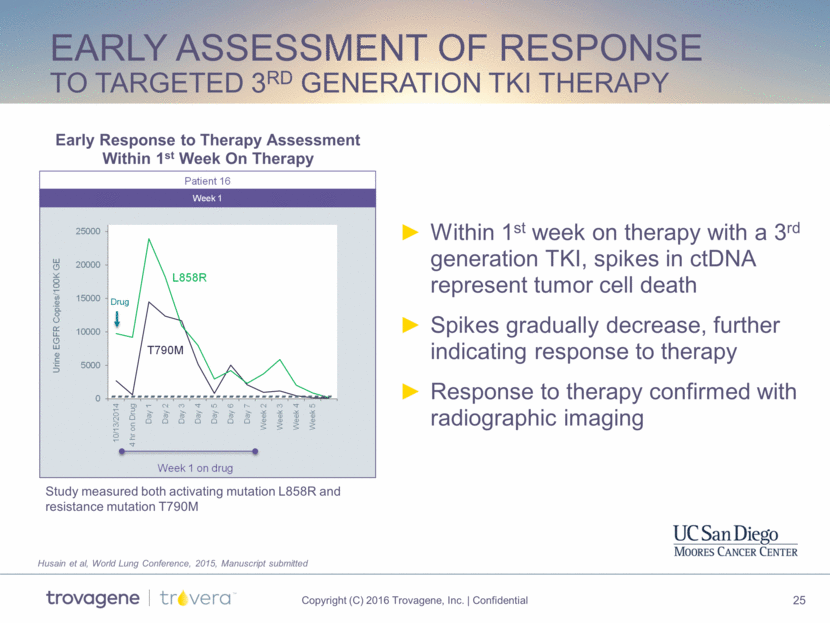
Early Assessment of Response to targeted 3rd generation TKI therapy Within 1st week on therapy with a 3rd generation TKI, spikes in ctDNA represent tumor cell death Spikes gradually decrease, further indicating response to therapy Response to therapy confirmed with radiographic imaging Husain et al, World Lung Conference, 2015, Manuscript submitted Early Response to Therapy Assessment Within 1st Week On Therapy Study measured both activating mutation L858R and resistance mutation T790M
EGFR T790M Study conclusions Urine identified a similar proportion of T790M+ patients as tissue or blood Inadequate biopsy or tumor heterogeneity likely explain discordant results, and urine identified mutations that tissue missed EGFR mutation detection from urine demonstrated very strong clinical performance Monitoring urine ctDNA T790M mutation levels longitudinally is feasible and is being further explored as a means to inform therapy selection
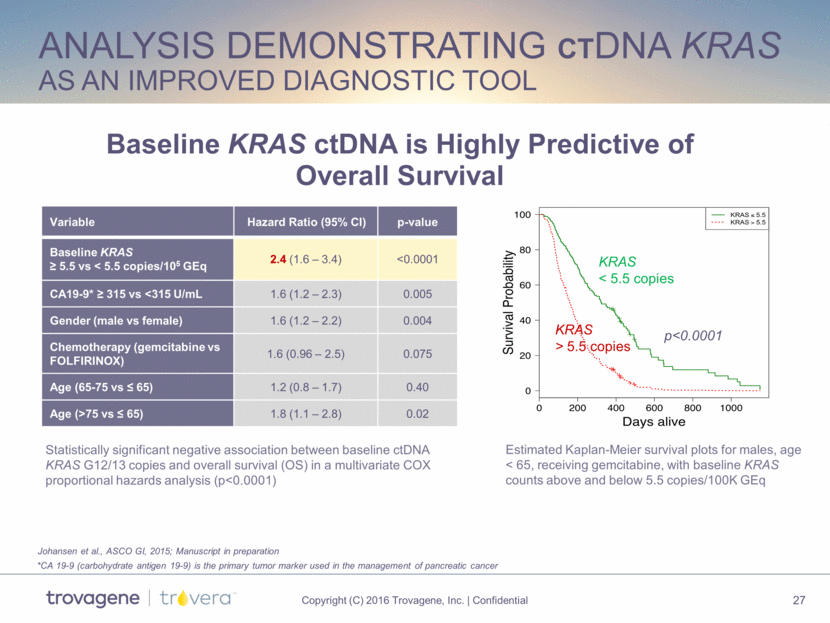
analysis demonstrating ctDNA KRAS as an improved diagnostic tool Baseline KRAS ctDNA is Highly Predictive of Overall Survival Variable Hazard Ratio (95% CI) p-value Baseline KRAS > 5.5 vs < 5.5 copies/105 GEq 2.4 (1.6 – 3.4) <0.0001 CA19-9* > 315 vs <315 U/mL 1.6 (1.2 – 2.3) 0.005 Gender (male vs female) 1.6 (1.2 – 2.2) 0.004 Chemotherapy (gemcitabine vs FOLFIRINOX) 1.6 (0.96 – 2.5) 0.075 Age (65-75 vs < 65) 1.2 (0.8 – 1.7) 0.40 Age (>75 vs < 65) 1.8 (1.1 – 2.8) 0.02 p<0.0001 Estimated Kaplan-Meier survival plots for males, age < 65, receiving gemcitabine, with baseline KRAS counts above and below 5.5 copies/100K GEq KRAS < 5.5 copies KRAS > 5.5 copies Statistically significant negative association between baseline ctDNA KRAS G12/13 copies and overall survival (OS) in a multivariate COX proportional hazards analysis (p<0.0001) Johansen et al., ASCO GI, 2015; Manuscript in preparation *CA 19-9 (carbohydrate antigen 19-9) is the primary tumor marker used in the management of pancreatic cancer
Kras Study conclusions 92.9% of 210 patients with unresectable pancreatic cancer were positive for ctDNA KRAS using Trovagene’s liquid biopsy assay This detection rate closely matches the published prevalence of KRAS in pancreatic cancer (90%), and out-performs previous studies Studies using other liquid biopsies demonstrate widely variable KRAS ctDNA sensitivity (27% – 71%)1 The superior detection assay sensitivity demonstrates clinical utility and the opportunity to move into earlier stages of disease Quantitation of KRAS may provide a more informative biomarker than CA19-9 for prognosis and monitoring for therapeutic response Early detection of resectable disease in the high risk population is feasible 1Castells, et al. JCO 1999; Tjemsvoll, et al. Molecular Oncology 2015; Maire, et al. BJC 2002; Kinguasa, et al. Cancer 2015; Chen et al. EJSO 2010
trovagene A DNA technology company with broad applications Only Molecular Dx in urine and blood Focused on clinically actionable, reimbursable biomarkers Global distribution model and tech transfer
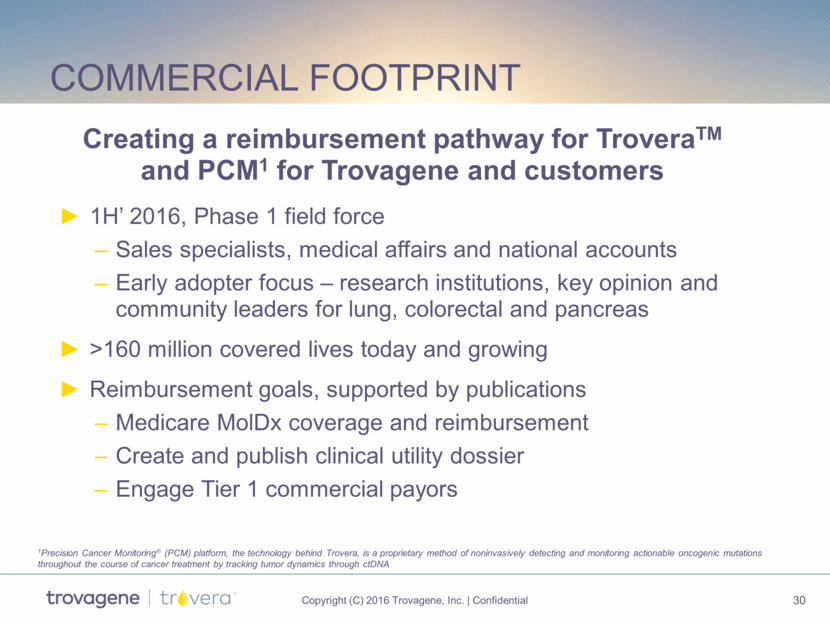
Commercial Footprint 1H’ 2016, Phase 1 field force Sales specialists, medical affairs and national accounts Early adopter focus – research institutions, key opinion and community leaders for lung, colorectal and pancreas >160 million covered lives today and growing Reimbursement goals, supported by publications Medicare MolDx coverage and reimbursement Create and publish clinical utility dossier Engage Tier 1 commercial payors Creating a reimbursement pathway for TroveraTM and PCM1 for Trovagene and customers 1Precision Cancer Monitoring® (PCM) platform, the technology behind Trovera, is a proprietary method of noninvasively detecting and monitoring actionable oncogenic mutations throughout the course of cancer treatment by tracking tumor dynamics through ctDNA
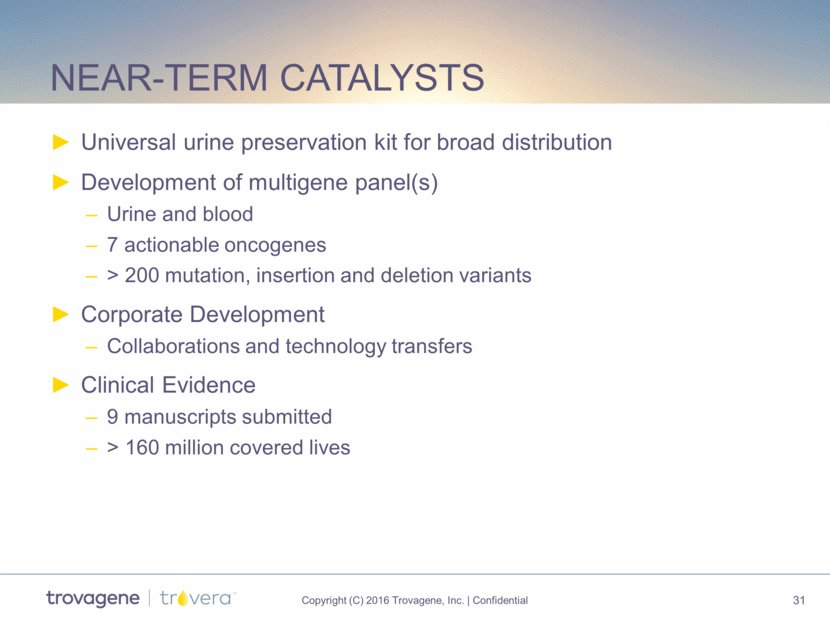
Near-term catalysts Universal urine preservation kit for broad distribution Development of multigene panel(s) Urine and blood 7 actionable oncogenes > 200 mutation, insertion and deletion variants Corporate Development Collaborations and technology transfers Clinical Evidence 9 manuscripts submitted > 160 million covered lives
Thank you for more information, please email ir@trovagene.com