Attached files
| file | filename |
|---|---|
| 8-K - 8-K - PIONEER ENERGY SERVICES CORP | a8kinvpres9-20x16.htm |

JOHNSON RICE & COMPANY 2016 ENERGY
CONFERENCE
September 2016

Forward-looking Statements
This presentation contains various forward-looking statements and information that are based on management’s current expectations and
assumptions about future events. Forward-looking statements are generally accompanied by words such as “estimate,” “project,” “predict,”
“expect,” “anticipate,” “plan,” “intend,” “seek,” “will,” “should,” “goal” and other words that convey the uncertainty of future events and
outcomes. Forward-looking information includes, among other matters, statements regarding the Company’s anticipated performance, quality of
assets, rig utilization rate, capital spending by oil and gas companies, and the Company's international operations.
Although the Company believes that the expectations and assumptions reflected in such forward-looking statements are reasonable, it can give
no assurance that such expectations and assumptions will prove to have been correct. Such statements are subject to certain risks, uncertainties
and assumptions, including general economic and business conditions and industry trends, levels and volatility of oil and gas prices, the continued
demand for drilling services or production services in the geographic areas where we operate, decisions about exploration and development
projects to be made by oil and gas exploration and production companies, the highly competitive nature of our business, technological
advancements and trends in our industry and improvements in our competitors’ equipment, the loss of one or more of our major clients or a
decrease in their demand for our services, future compliance with covenants under our senior secured revolving credit facility and our senior
notes, operating hazards inherent in our operations, the supply of marketable drilling rigs, well servicing rigs, coiled tubing and wireline units
within the industry, the continued availability of drilling rig, well servicing rig, coiled tubing and wireline unit components, the continued
availability of qualified personnel, the success or failure of our acquisition strategy, including our ability to finance acquisitions, manage growth
and effectively integrate acquisitions, the political, economic, regulatory and other uncertainties encountered by our operations, and changes in,
or our failure or inability to comply with, governmental regulations, including those relating to the environment.
Should one or more of these risks, contingencies or uncertainties materialize, or should underlying assumptions prove incorrect, actual results
may vary materially from those expected. Many of these factors have been discussed in more detail in the Company's annual report on Form 10-
K for the fiscal year ended December 31, 2015. Other unpredictable or unknown factors that the Company has not discussed in this presentation
or in its filings with the Securities and Exchange Commission could also have material adverse effects on actual results of matters that are the
subject of the forward-looking statements. All forward-looking statements speak only as the date on which they are made and the Company
undertakes no duty to update or revise any forward-looking statements. We advise our shareholders to use caution and common sense when
considering our forward-looking statements.
2

Pioneer Energy Services
(1) As of June 30, 2016
(2) Market Capitalization as of September 15, 2016; debt and cash as of June 30, 2016
TICKER SYMBOL: PES (NYSE)
TTM REVENUE1: $349 MILLION
MARKET CAPITALIZATION2: $216 MILLION
ENTERPRISE VALUE2: $596 MILLION
SERVICE LINES: LAND DRILLING, WELL SERVICING,
WIRELINE, COILED TUBING
EMPLOYEES: 1,387
3

Diversified Services
% of TTM REVENUE1
(1) Revenue breakdown based on trailing twelve month revenue as of June 30, 2016 of $349 million
DRILLING SERVICES
Drilling Services - US 23 Rigs
Drilling Services – Colombia 8 Rigs
Total Drilling 31 Rigs
PRODUCTION SERVICES
Well Servicing 125 Rigs
Wireline 125 Units
Coiled Tubing 17 Units
4
Production
Services
56%
Drilling -
Colombia
3%
Drilling - US
41%

Fleet Composition
DRILLING SERVICES1
WELL SERVICING
WIRELINE
COILED TUBING
5
(1) Since year-end 2011, added 15 AC rigs and disposed of 48 non-AC rigs
Note: all counts are as of year-end
71
64
69
62
53
31
2010 2011 2012 2013 2014 2015
6
10
13 13
17 17
2010 2011 2012 2013 2014 2015
74
89
108 109
116
125
2010 2011 2012 2013 2014 2015
84
105
120 119 120 125
2010 2011 2012 2013 2014 2015
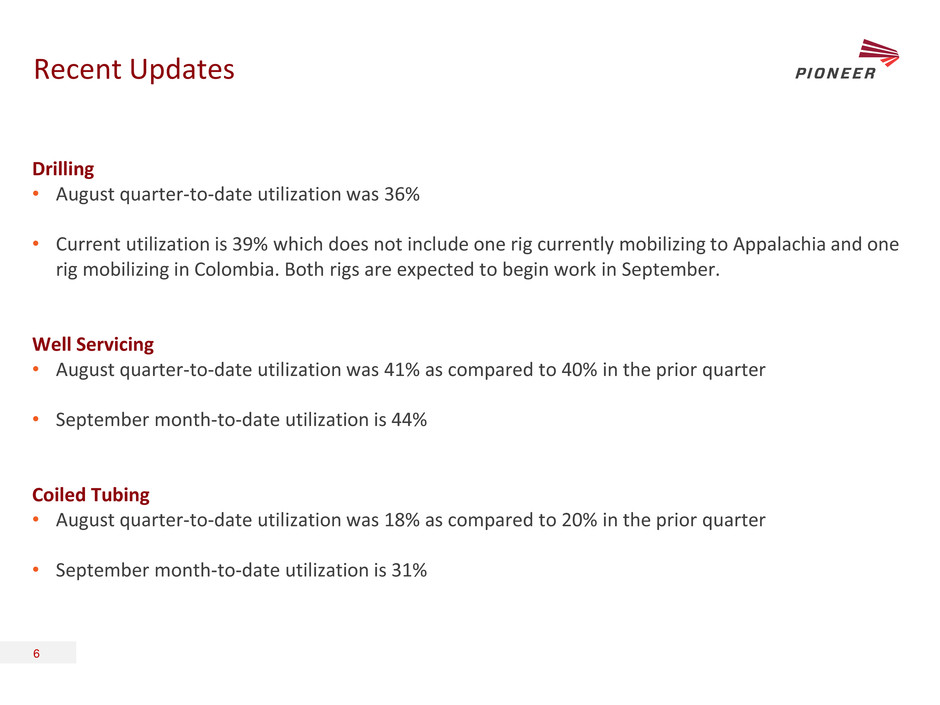
Recent Updates
Drilling
• August quarter-to-date utilization was 36%
• Current utilization is 39% which does not include one rig currently mobilizing to Appalachia and one
rig mobilizing in Colombia. Both rigs are expected to begin work in September.
Well Servicing
• August quarter-to-date utilization was 41% as compared to 40% in the prior quarter
• September month-to-date utilization is 44%
Coiled Tubing
• August quarter-to-date utilization was 18% as compared to 20% in the prior quarter
• September month-to-date utilization is 31%
6

Company Highlights
• Exposure to the full well life cycle including drilling, completions, workovers and
on-going well maintenance
• Premium shale-oriented assets in all business lines with balanced exposure to
completion and maintenance activity
• Drilling - 94% of current fleet is pad-capable
• Well Servicing - 100% of fleet 550-600hp and tall-masted
• Wireline – Well-positioned in the Eagle Ford, Bakken and Niobrara
• Coiled Tubing - 75% of on-shore units offer larger diameter coil
• Conservative approach to cash flow and balance sheet management with
continued focus on delevering
• Industry-leading safety results
7
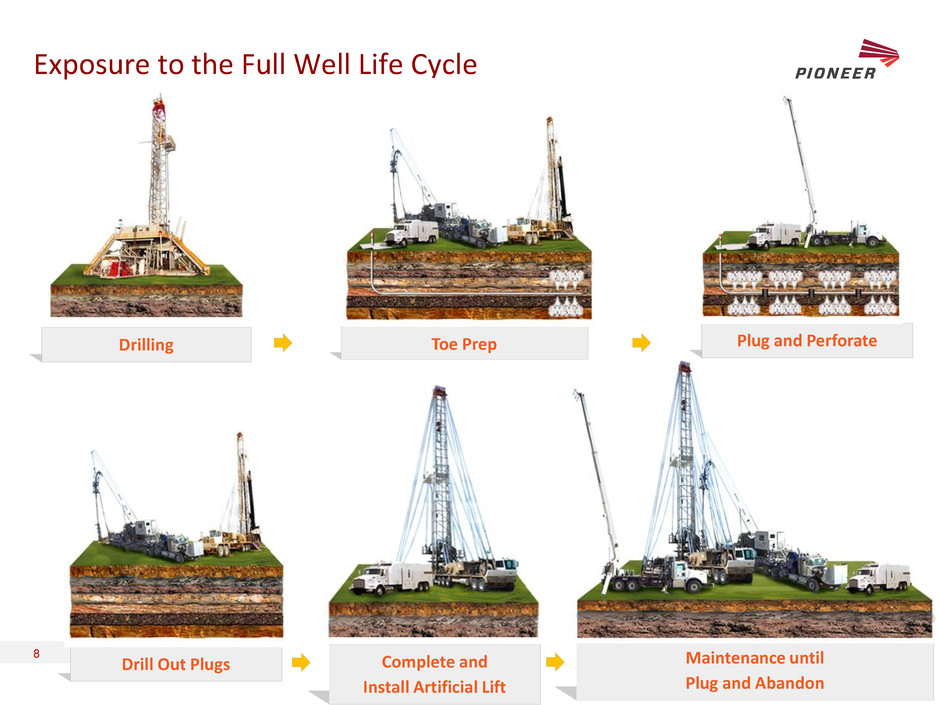
Exposure to the Full Well Life Cycle
Plug and Perforate Toe Prep Drilling
Maintenance until
Plug and Abandon
Drill Out Plugs Complete and
Install Artificial Lift
8

Premium Shale-Oriented Assets
9
US DRILLING SERVICES PRODUCTION SERVICES
• One of the most versatile and competitive
1,500 horsepower AC drilling rigs on the
market
• 2,000hp mud pumps and 7,500psi mud systems
with bi-fuel capability
• Moves in less than three days from release to
acceptance by the operator on new pad
• Walks 150’ x 50’ while racking over 24,000’ of 5”
drill pipe
• Premium shale-capable equipment
• 100% of well servicing fleet is 550-600hp
with 104’, 112’ or 116’ masts
• Full suite of coiled tubing offerings from
1 1/4” to 2 5/8” coil
• Balanced exposure to completion
and production-oriented activity in
major shale plays
91%
70%
Pad-capable - US
AC Rigs - US

Balance Sheet and Cash Flow Management
• Amended the revolving credit facility in the second quarter of 2016
• Minimum EBITDA covenant introduced from the fourth quarter of 2016 through the second
quarter of 2017
• Adjusted Senior Debt to EBITDA (ratio excludes unsecured debt) and Interest Coverage ratios
through maturity
• Reduced total commitments to $175 million from previous amount of $200 million
• Paid down $60 million on the revolving credit facility in 2015 and reduced total debt
approximately $170 million since the first quarter of 2013
10
$95
$300
$0
$100
$200
$300
$400
2016 2017 2018 2019 2020 2021 2022
($
m
ill
io
n
s)
Debt Maturities
(as of 6/30/16)
Credit Facility 6.125% Senior Notes
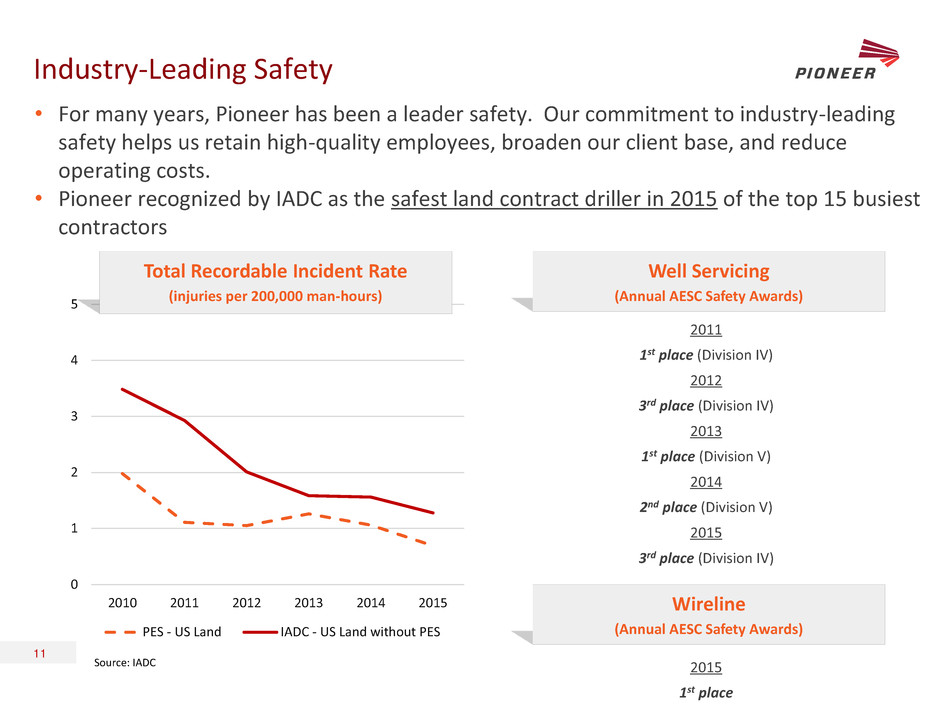
Industry-Leading Safety
• For many years, Pioneer has been a leader safety. Our commitment to industry-leading
safety helps us retain high-quality employees, broaden our client base, and reduce
operating costs.
• Pioneer recognized by IADC as the safest land contract driller in 2015 of the top 15 busiest
contractors
0
1
2
3
4
5
2010 2011 2012 2013 2014 2015
PES - US Land IADC - US Land without PES
Total Recordable Incident Rate
(injuries per 200,000 man-hours)
11
Source: IADC
Well Servicing
(Annual AESC Safety Awards)
2011
1st place (Division IV)
2012
3rd place (Division IV)
2013
1st place (Division V)
2014
2nd place (Division V)
2015
3rd place (Division IV)
Wireline
(Annual AESC Safety Awards)
2015
1st place

PRODUCTION
SERVICES
12

Well Servicing
• Of the top-tier well servicing providers, Pioneer has
the:
• Highest utilization rate
• Highest average hourly rate
• Highest average horsepower fleet with all rigs
either 550hp or 600hp
• Highest percentage of taller mast rigs with all
masts either 104’, 112’ or 116’ in height
• 100% of rigs are capable of working in the
unconventional plays
• Established in the Bakken, Eagle Ford, Fayetteville,
and along the Texas/Louisiana Gulf Coast
(1) Year-end rig count
SERVICE OVERVIEW OPERATING LOCATIONS
FLEET GROWTH1
13
74
89
108 109
116
125
2010 2011 2012 2013 2014 2015

Wireline
• Leading market share position in a number of key
geographic markets
• Majority of revenue derived from cased-hole
operations that include perforating, logging, and
pipe recovery
• Established in the Bakken, Eagle Ford, Niobrara,
Mississippian, and onshore/offshore Louisiana
(1) Based on Q2 2016 revenue
(2) Year-end unit count
SERVICE OVERVIEW OPERATING LOCATIONS
FLEET GROWTH2 DIVERSIFIED SERVICE OFFERINGS1
14
84
105
120 119 120
125
2010 2011 2012 2013 2014 2015
Open/Cased
Hole Logging
Mechanical
Services
Plug/Shoot
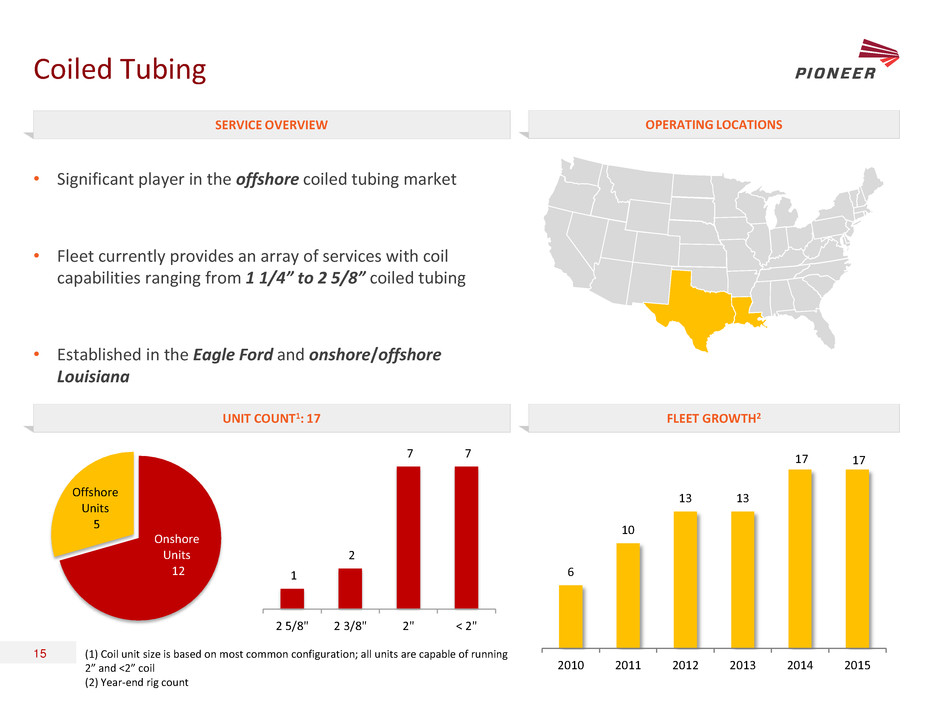
Coiled Tubing
• Significant player in the offshore coiled tubing market
• Fleet currently provides an array of services with coil
capabilities ranging from 1 1/4” to 2 5/8” coiled tubing
• Established in the Eagle Ford and onshore/offshore
Louisiana
SERVICE OVERVIEW OPERATING LOCATIONS
UNIT COUNT1: 17 FLEET GROWTH2
(1) Coil unit size is based on most common configuration; all units are capable of running
2” and <2” coil
(2) Year-end rig count
Onshore
Units
12
Offshore
Units
5
15
6
10
13 13
17 17
2010 2011 2012 2013 2014 2015
1
2
7 7
2 5/8" 2 3/8" 2" < 2"

DRILLING
SERVICES
16
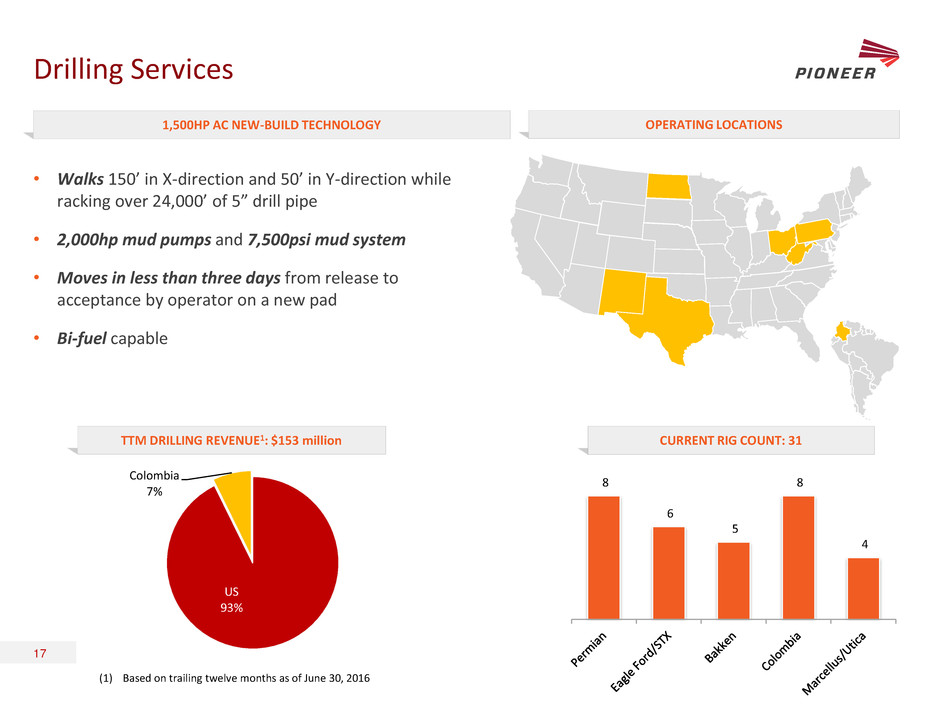
Drilling Services
(1) Based on trailing twelve months as of June 30, 2016
1,500HP AC NEW-BUILD TECHNOLOGY OPERATING LOCATIONS
TTM DRILLING REVENUE1: $153 million CURRENT RIG COUNT: 31
17
• Walks 150’ in X-direction and 50’ in Y-direction while
racking over 24,000’ of 5” drill pipe
• 2,000hp mud pumps and 7,500psi mud system
• Moves in less than three days from release to
acceptance by operator on a new pad
• Bi-fuel capable
8
6
5
8
4
US
93%
Colombia
7%

Pioneer Drilling Rig Class Comparison
RIG FLEET CHARACTERISTICS
AC SCR
Number of Rigs 16 15
Drawworks 1,200-2,000HP 1,000-1,500HP
Pad-Capable 100% 87%
Utilization %1 69% 0%
(1) Revenue utilization as of earnings call on July 28, 2016
18
94%
52%
Pad-capable - Total AC Rigs - Total
1,000HP
6%
1,200-2,000HP
94%

19

Historical Financial Results
REVENUE / ADJUSTED EBITDA ($ millions) CAPEX SPEND ($ millions)
Note: All data points reflect calendar year and trailing twelve months information derived from 10-K and 10-Q filings.
Please refer to Reconciliation of Adjusted EBITDA to Net Income
20
$919
$960
$1,055
$541
$349
$249 $235
$277
$111
$49
$0
$125
$250
$375
$500
$625
$750
$875
$1,000
$1,125
2012 2013 2014 2015 Q2 2016
TTM
Revenue Adjusted EBITDA
$364
$165
$175
$160
$13
$0
$50
$100
$150
$200
$250
$300
$350
$400
2012 2013 2014 2015 2016 Jun YTD
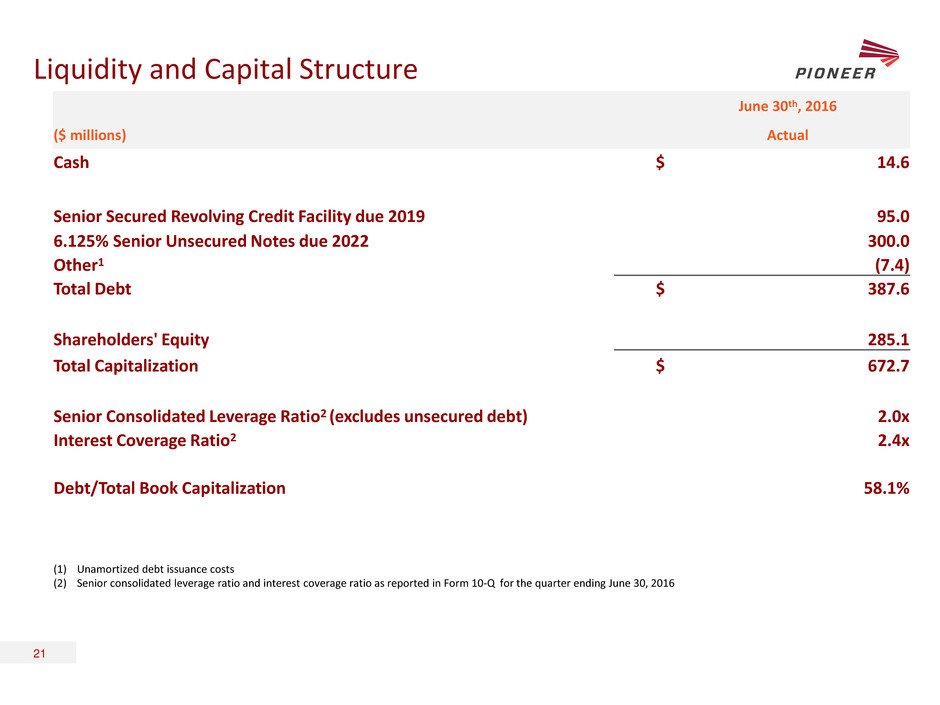
Liquidity and Capital Structure
June 30th, 2016
($ millions) Actual
Cash $ 14.6
Senior Secured Revolving Credit Facility due 2019 95.0
6.125% Senior Unsecured Notes due 2022 300.0
Other1 (7.4)
Total Debt $ 387.6
Shareholders' Equity 285.1
Total Capitalization $ 672.7
Senior Consolidated Leverage Ratio2 (excludes unsecured debt) 2.0x
Interest Coverage Ratio2 2.4x
Debt/Total Book Capitalization 58.1%
(1) Unamortized debt issuance costs
(2) Senior consolidated leverage ratio and interest coverage ratio as reported in Form 10-Q for the quarter ending June 30, 2016
21

Reconciliation of Adjusted EBITDA to Net Income
We define Adjusted EBITDA as earnings (loss) before interest income (expense), taxes, depreciation, amortization, loss on extinguishment of debt, impairments,
and the Colombian Net Equity Tax. We use this non-GAAP measure, together with our GAAP financial metrics, to assess our financial performance and evaluate
our overall progress towards meeting our long-term financial objectives. We believe that this measure is useful to investors and analysts in allowing for
greater transparency of our operating performance and makes it easier to compare our results with those of other companies within our industry. Adjusted
EBITDA should not be considered (a) in isolation of, or as a substitute for, net income (loss), (b) as an indication of cash flows from operating activities or (c) as a
measure of liquidity. In addition, Adjusted EBITDA does not represent funds available for discretionary use. Adjusted EBITDA may not be comparable to other
similarly titled measures reported by other companies. A reconciliation of adjusted EBITDA to net income (loss) as reported is included in the tables below:
22
($ in millions) 2011 2012 2013 2014 2015
Adjust d EBITDA 191.2 249.3 234.7 277.1 110.8
Colombian N t Equity Tax (7.3) - - - -
Depreciation & Amortization (132.8) (164.7) (187.9) (183.4) (150.9)
Net Interest (29.7) (37.0) (48.3) (38.8) (21.2)
Loss on Extinguishment of Debt - - - (31.2) (2.2)
Impairment Expense (0.5) (1.1) (54.3) (73.0) (129.2)
Income Tax (Expense) Benefit (9.7) (16.4) 19.8 11.3 37.6
Net Income (Loss) 11.2 30.0 (35.9) (38.0) (155.1)
Year-Ending December 31,
($ in millions)
Q3
2015
Q4
2015
Q1
2016
Q2
2016 TTM
Adjusted EBITDA 18.8 20.0 6.4 3.6 48.9
Depreciation & Amortization (35.3) ( 5.4) (29.8) (2 .9) ( 29.4)
Net Interest (5.5) (5.1) (6.3) (6.4) (23.2)
Impairment Expense (2.3) (49.5) - - (51.8)
Loss on Extinguishment of Debt - (2.2) - (0.3) (2.5)
Income Tax (Expense) Benefit 6.7 23.9 2.0 2.0 34.5
Net Income (Loss) (17.5) (48.3) (27.7) (30.0) (123.5)

