Attached files
| file | filename |
|---|---|
| EX-32.2 - EXHIBIT 32.2 - PIONEER ENERGY SERVICES CORP | exhibit3224q2017.htm |
| EX-32.1 - EXHIBIT 32.1 - PIONEER ENERGY SERVICES CORP | exhibit3214q2017.htm |
| EX-31.2 - EXHIBIT 31.2 - PIONEER ENERGY SERVICES CORP | exhibit3124q2017.htm |
| EX-31.1 - EXHIBIT 31.1 - PIONEER ENERGY SERVICES CORP | exhibit3114q2017.htm |
| EX-23.1 - EXHIBIT 23.1 - PIONEER ENERGY SERVICES CORP | exhibit231-consentq42017.htm |
| EX-21.1 - EXHIBIT 21.1 - PIONEER ENERGY SERVICES CORP | exhibit211-subsidiariesq42.htm |
| EX-12.1 - EXHIBIT 12.1 - PIONEER ENERGY SERVICES CORP | exhibit121-fixedchargesrat.htm |
UNITED STATES
SECURITIES AND EXCHANGE COMMISSION
Washington, D. C. 20549
FORM 10-K |
(Mark one)
ý | ANNUAL REPORT PURSUANT TO SECTION 13 OR 15(d) OF THE SECURITIES EXCHANGE ACT OF 1934 |
For the fiscal year ended December 31, 2017
or
o | TRANSITION REPORT PURSUANT TO SECTION 13 OR 15(d) OF THE SECURITIES EXCHANGE ACT OF 1934 |
Commission File Number: 1-8182
PIONEER ENERGY SERVICES CORP.
(Exact name of registrant as specified in its charter)
_____________________________________________
TEXAS | 74-2088619 | |
(State or other jurisdiction of incorporation or organization) | (I.R.S. Employer Identification Number) | |
1250 N.E. Loop 410, Suite 1000 San Antonio, Texas | 78209 | |
(Address of principal executive offices) | (Zip Code) | |
Registrant’s telephone number, including area code: (855) 884-0575
Securities registered pursuant to Section 12(b) of the Act:
Title of each class | Name of each exchange on which registered | |
Common Stock, $0.10 par value | NYSE | |
Indicate by check mark if the registrant is a well-known seasoned issuer, as defined in Rule 405 of the Securities Act. Yes ¨ No þ
Indicate by check mark if the registrant is not required to file reports pursuant to Section 13 or Section 15(d) of the Act. Yes ¨ No þ
Indicate by check mark whether the Registrant: (1) has filed all reports required to be filed by Section 13 or 15(d) of the Securities Exchange Act of 1934 during the preceding 12 months (or for such shorter period that the registrant was required to file such reports), and (2) has been subject to such filing requirements for the past 90 days. Yes þ No ¨
Indicate by check mark whether the Registrant has submitted electronically and posted on its corporate Website, if any, every Interactive Data File required to be submitted and posted pursuant to Rule 405 of Regulation S-T during the preceding 12 months (or for such shorter period that the registrant was required to submit and post such files). Yes þ No ¨
Indicate by check mark if disclosure of delinquent filers pursuant to Item 405 of Regulation S-K is not contained herein, and will not be contained, to the best of registrant’s knowledge, in definitive proxy or information statements incorporated by reference in Part III of this Form 10-K or any amendment to this Form 10-K. ¨
Indicate by check mark whether the registrant is a large accelerated filer, an accelerated filer, a non-accelerated filer, a smaller reporting company, or an emerging growth company. See the definitions of “large accelerated filer,” “accelerated filer,” “smaller reporting company,” and “emerging growth company” in Rule 12b-2 of the Exchange Act. (Check one):
Large accelerated filer o | Accelerated filer þ | |||
Non-accelerated filer o | (Do not check if a smaller reporting company) | Smaller reporting company o | ||
Emerging growth company o | ||||
If an emerging growth company, indicate by check mark if the registrant has elected not to use the extended transition period for complying with any new or revised financial accounting standards provided pursuant to Section 13(a) of the Exchange Act. ¨
Indicate by check mark whether the registrant is a shell company (as defined in Rule 12b-2 of the Exchange Act). Yes ¨ No þ
The aggregate market value of the registrant’s common stock held by nonaffiliates of the registrant as of the last business day of the registrant’s most recently completed second fiscal quarter (based on the closing sales price on the New York Stock Exchange (NYSE) on June 30, 2017) was approximately $154.7 million.
As of January 31, 2018, there were 77,794,527 shares of common stock, par value $0.10 per share, of the registrant issued and outstanding.
DOCUMENTS INCORPORATED BY REFERENCE
Portions of the proxy statement related to the registrant’s 2018 Annual Meeting of Shareholders are incorporated by reference into Part III of this report.
TABLE OF CONTENTS
Page | ||
Item 1. | ||
Item 1A. | ||
Item 1B. | ||
Item 2. | ||
Item 3. | ||
Item 4. | ||
Item 5. | ||
Item 6. | ||
Item 7. | ||
Item 7A. | ||
Item 8. | ||
Item 9. | ||
Item 9A. | ||
Item 9B. | ||
Item 10. | ||
Item 11. | ||
Item 12. | ||
Item 13. | ||
Item 14. | ||
Item 15. | ||
Item 16. | ||
PART I
INTRODUCTORY NOTE
SPECIAL NOTE REGARDING FORWARD-LOOKING STATEMENTS
From time to time, our management or persons acting on our behalf make forward-looking statements to inform existing and potential security holders about our company. These statements may include projections and estimates concerning the timing and success of specific projects and our future revenues, income and capital spending. Forward-looking statements are generally accompanied by words such as “estimate,” “project,” “predict,” “believe,” “expect,” “anticipate,” “plan,” “intend,” “seek,” “will,” “should,” “goal” or other words that convey the uncertainty of future events or outcomes. Forward-looking statements speak only as of the date on which they are first made, which in the case of forward-looking statements made in this report is the date of this report. Sometimes we will specifically describe a statement as being a forward-looking statement and refer to this cautionary statement.
In addition, various statements contained in this Annual Report on Form 10-K, including those that express a belief, expectation or intention, as well as those that are not statements of historical fact, are forward-looking statements. Such forward-looking statements appear in Item 1—“Business” and Item 3—“Legal Proceedings” in Part I of this report; in Item 5—“Market for Registrant’s Common Equity, Related Shareholder Matters and Issuer Purchases of Equity Securities,” Item 7—“Management’s Discussion and Analysis of Financial Condition and Results of Operations,” Item 7A—“Quantitative and Qualitative Disclosures About Market Risk” and in the Notes to Consolidated Financial Statements we have included in Item 8 of Part II of this report; and elsewhere in this report. Forward-looking statements speak only as of the date of this report. We disclaim any obligation to update these statements, and we caution you not to place undue reliance on them. We base forward-looking statements on our current expectations and assumptions about future events. While our management considers the expectations and assumptions to be reasonable, they are inherently subject to significant business, economic, competitive, regulatory and other risks, contingencies and uncertainties, most of which are difficult to predict and many of which are beyond our control. These risks, contingencies and uncertainties relate to, among other matters, the following:
• | general economic and business conditions and industry trends; |
• | levels and volatility of oil and gas prices; |
• | the continued demand for drilling services or production services in the geographic areas where we operate; |
• | decisions about exploration and development projects to be made by oil and gas exploration and production companies; |
• | the highly competitive nature of our business; |
• | technological advancements and trends in our industry, and improvements in our competitors’ equipment; |
• | the loss of one or more of our major clients or a decrease in their demand for our services; |
• | future compliance with covenants under our term loan, ABL facility and senior notes; |
• | operating hazards inherent in our operations; |
• | the supply of marketable drilling rigs, well servicing rigs, coiled tubing units and wireline units within the industry; |
• | the continued availability of new components for drilling rigs, well servicing rigs, coiled tubing units and wireline units; |
• | the continued availability of qualified personnel; |
• | the success or failure of our acquisition strategy, including our ability to finance acquisitions, manage growth and effectively integrate acquisitions; |
• | the political, economic, regulatory and other uncertainties encountered by our operations, and |
• | changes in, or our failure or inability to comply with, governmental regulations, including those relating to the environment. |
We believe the items we have outlined above are important factors that could cause our actual results to differ materially from those expressed in a forward-looking statement contained in this report or elsewhere. We have discussed many of these factors in more detail elsewhere in this report. Other unpredictable or unknown factors could also have material adverse effects on actual results of matters that are the subject of our forward-looking statements. We undertake no obligation to update or revise any forward-looking statements, except as required by applicable securities laws and regulations. We advise our security holders that they should (1) recognize that unpredictable or unknown factors not referred to above could affect the accuracy of our forward-looking statements and (2) use caution and common sense when considering our forward-looking statements. Also, please read the risk factors set forth in Item 1A—“Risk Factors.”
1
ITEM 1. | BUSINESS |
Company Overview
Pioneer Energy Services Corp. provides land-based drilling services and production services to a diverse group of oil and gas exploration and production companies in the United States and internationally in Colombia. We also provide two of our services (coiled tubing and wireline services) offshore in the Gulf of Mexico. Drilling services and production services are fundamental to establishing and maintaining the flow of oil and natural gas throughout the productive life of a well.
• | Drilling Services— From 1999 to 2011, we significantly expanded our fleet through acquisitions and the construction of new drilling rigs. As our industry changed with the evolution of shale drilling, we began a transformation process in 2011 by selectively disposing of our older, less capable rigs, while we continued to invest in our rig building program to construct more technologically advanced, pad-optimal rigs to meet the changing needs of our clients. |
Today, our current drilling rig fleet is 100% pad-capable and offers the latest advancements in pad drilling. We have 16 AC rigs in the US and eight SCR rigs in Colombia, all of which have 1,500 horsepower or greater drawworks. The removal of older, less capable rigs from our fleet and investments in the construction of new drilling rigs has transformed our fleet into a highly capable, pad optimal fleet focused on the horizontal drilling market. We believe this positions us to compete well, grow our presence in the significant shale basins in the US, and improve profitability.
In addition to our drilling rigs, we provide the drilling crews and most of the ancillary equipment needed to operate our drilling rigs. The drilling rigs in our fleet are currently deployed through our division offices in the following regions:
Rig Count | |||
Domestic drilling | |||
Marcellus/Utica | 6 | ||
Eagle Ford | 1 | ||
Permian Basin | 7 | ||
Bakken | 2 | ||
International drilling | 8 | ||
24 | |||
• | Production Services— In 2008, we acquired two production services companies which significantly expanded our service offerings to include well servicing and wireline services, and at the end of 2011, we acquired a coiled tubing services business to further expand our production services offerings. Since the acquisitions of these businesses, we continued to invest in their organic growth and significantly expanded all our production services fleets. Although we temporarily suspended organic growth during the recent downturn, we continue to selectively update our fleets. |
Today, our production services business segments provide a range of well, wireline and coiled tubing services to a diverse group of exploration and production companies, with our operations concentrated in the major domestic onshore oil and gas producing regions in the Mid-Continent and Rocky Mountain states and in the Gulf Coast, both onshore and offshore. The primary production services we offer are the following:
• | Well Servicing. A range of services are required in order to establish production in newly-drilled wells and to maintain production over the useful lives of active wells. We use our well servicing rig fleet to provide these necessary services, including the completion of newly-drilled wells, maintenance and workover of active wells, and plugging and abandonment of wells at the end of their useful lives. As of December 31, 2017, we have a fleet of 113 rigs with 550 horsepower and 12 rigs with 600 horsepower with operations in 10 locations, mostly in the Gulf Coast states, as well as in Arkansas, North Dakota, and Colorado. |
• | Wireline Services. Oil and gas exploration and production companies require wireline services to better understand the reservoirs they are drilling or producing, and use logging services to accurately characterize reservoir rocks and fluids. To complete a cased-hole well, the production casing must be perforated to establish a flow path between the reservoir and the wellbore. We use our fleet of wireline units to provide these important logging and perforating services in addition to a range of other mechanical services that are needed in order to place equipment in or retrieve equipment or debris from the wellbore, install bridge plugs and control pressure. As of December 31, 2017, we |
2
have a fleet of 112 wireline units in 17 operating locations in the Gulf Coast, Mid-Continent and Rocky Mountain states. Additionally, we ordered two new greaseless wireline units in 2017 which we placed in service in January 2018, specifically designed to reduce noise when operating in proximity to urban areas.
• | Coiled Tubing Services. Coiled tubing is another important element of the well servicing industry that allows operators to continue production during service operations on a well under pressure without shutting in the well, thereby reducing the risk of formation damage. Coiled tubing services involve the use of a continuous metal pipe spooled on a large reel for oil and natural gas well applications, such as wellbore clean-outs, nitrogen jet lifts, through-tubing fishing, formation stimulation utilizing acid, chemical treatments and fracturing. Coiled tubing is also used for a number of horizontal well applications such as milling temporary plugs between frac stages. As of December 31, 2017, our coiled tubing business consists of 10 onshore and four offshore coiled tubing units which are deployed through three operating locations that provide services in Texas, Louisiana, Wyoming and surrounding areas. We currently have one additional larger diameter coiled tubing unit on order for delivery in mid-2018. |
Pioneer Energy Services Corp. was incorporated under the laws of the State of Texas in 1979 as the successor to a business that had been operating since 1968. Over the last 15 years, we have significantly expanded and transformed our business through acquisitions and organic growth. Our business is comprised of two business lines — Drilling Services and Production Services. We report our Drilling Services business as two reportable segments: (i) Domestic Drilling and (ii) International Drilling. We report our Production Services business as three reportable segments: (i) Well Servicing, (ii) Wireline Services, and (iii) Coiled Tubing Services. We revised our reportable business segments as of the fourth quarter of 2017 to reflect changes in the basis used by management in making decisions regarding our business for resource allocation and performance assessment. Financial information about our operating segments is included in Note 10, Segment Information, of the Notes to Consolidated Financial Statements, included in Part II, Item 8, Financial Statements and Supplementary Data, of this Annual Report on Form 10-K.
Industry Overview
Demand for oilfield services offered by our industry is a function of our clients’ willingness to make operating expenditures and capital expenditures to explore for, develop and produce hydrocarbons, which is primarily driven by current and expected oil and natural gas prices.
Our business is influenced substantially by exploration and production companies’ spending that is generally categorized as either a capital expenditure or an operating expenditure.
Capital expenditures by oil and gas exploration and production companies tend to be relatively sensitive to volatility in oil or natural gas prices because project decisions are tied to a return on investment spanning a number of months or years. As such, capital expenditure economics often require the use of commodity price forecasts which may prove inaccurate over the amount of time necessary to plan and execute a capital expenditure project (such as a drilling program for a number of wells in a certain area). When commodity prices are depressed for longer periods of time, capital expenditure projects are routinely deferred until prices are forecasted to return to an acceptable level.
In contrast, both mandatory and discretionary operating expenditures are more stable than capital expenditures for exploration as these expenditures are less sensitive to commodity price volatility. Mandatory operating expenditure projects involve activities that cannot be avoided in the short term, such as regulatory compliance, safety, contractual obligations and certain projects to maintain the well and related infrastructure in operating condition. Discretionary operating expenditure projects may not be critical to the short-term viability of a lease or field and are generally evaluated according to a simple short-term payout criterion that is less dependent on commodity price forecasts.
Capital expenditures for the drilling and completion of exploratory and development wells in proven areas are more directly influenced by current and expected oil and natural gas prices and generally reflect the volatility of commodity prices. In contrast, operating expenditures for the maintenance of existing wells, for which a range of production services are required in order to maintain production, are relatively more stable and predictable.
Drilling and production services have historically trended similarly in response to fluctuations in commodity prices. However, because exploration and production companies often adjust their budgets for exploration and development drilling first in response to a shift in commodity prices, the demand for drilling services is generally impacted first and to a greater extent than the demand for production services which is more dependent on ongoing expenditures that are necessary to maintain production. Additionally, within the range of production services businesses, those that derive more revenue from
3
production related activity, as opposed to completion of new wells, tend to be less affected by fluctuations in commodity prices and temporary reductions in industry activity.
However, in a severe downturn that is prolonged, both operating and capital expenditures are significantly reduced, and the demand for all our service offerings is significantly impacted. After a prolonged downturn, among the production services, the demand for completion-oriented services generally improves first, as exploration and production companies begin to complete wells that were previously drilled but not completed during the downturn, and to complete newly drilled wells as the demand for drilling services improves during recovery.
Our industry experienced a severe down cycle that began in late 2014 and which persisted through 2016 with WTI oil prices that dipped below $30 in early 2016. A modest recovery in commodity prices began in the latter half of 2016 which continued through 2017, with average oil prices during the last quarter of 2017 averaging approximately $55 per barrel. The trends in spot prices of WTI crude oil and Henry Hub natural gas, and the resulting trends in domestic land rig counts (per Baker Hughes) and domestic well servicing rig counts (per Guiberson/Association of Energy Service Companies) over the last three years are illustrated in the graphs below.
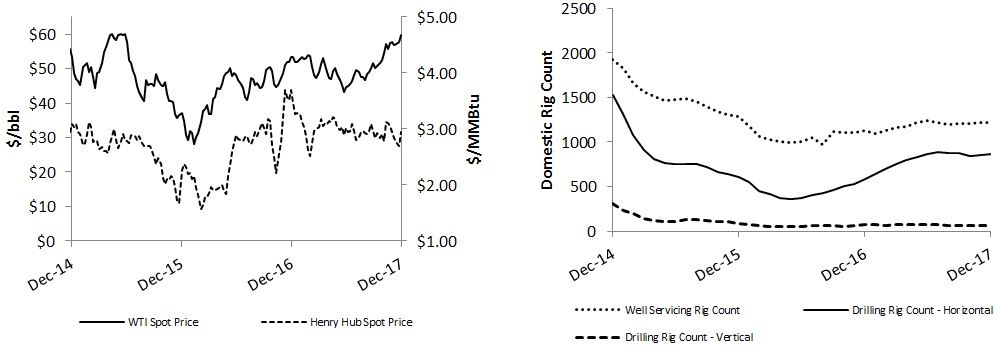
Colombian oil prices have historically trended in line with West Texas Intermediate (WTI) oil prices. Demand for drilling and production services in Colombia is largely dependent upon its national oil company’s long-term exploration and production programs, and to a lesser extent, additional activity from other producers in the region.
Technological advancements and trends in our industry also affect the demand for certain types of equipment, and can affect the overall demand for equipment in our industry. For several years, prior to late 2014, higher oil prices drove industry equipment utilization and revenue rates up, particularly in oil-producing regions and certain shale regions. However, advancements in technology improved the efficiency of drilling rigs and overall demand remained steady, while the demand for certain drilling rigs decreased, particularly in vertical well markets. The decline was a result of higher demand for drilling rigs that are able to drill horizontally and the increased use of “pad drilling” which enables a series of horizontal wells to be drilled in succession by walking or skidding a drilling rig at a single pad-site location, thereby improving the productivity of exploration and production activities and minimizing mobilization costs. This trend, then coupled with the downturn, resulted in significantly reduced demand for drilling rigs that do not have the ability to walk or skid and to drill horizontal wells.
For additional information concerning the effects of the volatility in oil and gas prices and the effects of technological advancements and trends in our industry, see Item 1A – “Risk Factors” in Part I of this Annual Report on Form 10-K.
Competitive Strengths
Our competitive strengths include:
• | High Quality Assets. Our current drilling rig fleet is 100% pad-capable and offers the latest advancements in pad drilling. We have 16 AC rigs in the US and eight SCR rigs in Colombia, all of which have 1,500 horsepower or greater drawworks. Our well servicing fleet is 100% tall-masted, 550 to 600 horsepower rigs, and 60% of our onshore coiled tubing units offer larger diameter coil. We believe that our modern and well maintained fleet allows us to realize higher utilization and pricing because we are able to offer our clients technologically advanced equipment that allows them to operate with less downtime and greater efficiency. |
4
• | A Leading Provider in Domestic Shale Regions. Our drilling and production services fleets operate in many of the most attractive producing regions in the United States, including the Utica, Marcellus, Eagle Ford, Niobrara, multiple shales in the Permian Basin, SCOOP/STACK and Bakken. We believe our drilling rigs are particularly well suited to these areas where the optimal rig configuration is dictated by local geology and market conditions, and we have focused the expansion of our production services fleets to these regions with the most opportunity for growth. All our fleet equipment is mobile between domestic regions, diversifying our geographic exposure and limiting the impact of any regional slowdown. |
• | Provide Services Throughout the Well Life Cycle. By offering our clients both drilling and production services, we capture revenue throughout the life cycle of a well and diversify our business. Our drilling services business performs work prior to initial production, and our production services business provides services such as logging, completion, perforation, workover and maintenance throughout the productive life of a well. We also provide certain end-of-well-life activities such as plugging and abandonment. Drilling and production services activity have historically exhibited different degrees of demand fluctuation, and we believe the diversity of our services reduces our exposure to decreases in demand for any single service activity. Further, the diversity of our service offerings enables us to cross-sell our services, which has allowed us to generate more business from existing clients and increase our profits as we expand our services within existing markets. |
• | Industry-Leading Safety Record. Our safety program called “LiveSafe” focuses on creating an environment where everyone is committed to and recognizes the possibility of always working without incident or injury. The commitment to LiveSafe helps keep our employees safe and reduces our business risk. In 2017, we lowered our lost time incident rates for the fourth consecutive year, achieving the lowest in our company’s history. In 2016, our coiled tubing services segment won the AESC Gold Safety Award, and our wireline services segment won the Bronze Safety Award. In 2015, we were recognized by the International Association of Drilling Contractors as the safest land contract driller of the 15 busiest contractors, with a total recordable incident rate 46% lower than the industry average, and our wireline services segment won the AESC Gold Safety award. Our excellent safety record and reputation are critical to winning new business and expanding our relationships with existing clients. |
• | Skilled Management Team. We believe that an important competitive factor in achieving long-term client relationships includes having an experienced and skilled management team, with a focus on the growth and development of our leadership team, maintaining employee continuity and effective succession planning. Our CEO, Wm. Stacy Locke, joined Pioneer in 1995 as President and has over 35 years of industry experience. Our management team has operated through numerous oilfield services cycles and provides us with valuable long-term experience and a detailed understanding of client requirements. We seek to minimize employee turnover, invest in the growth of our employees, and recruit new talent through our focus on employee training and development, safety and competitive compensation. |
• | Longstanding and Diversified Clients. We maintain long-standing, high quality client relationships with a diverse group of oil and gas exploration and production companies. Our largest three clients, Apache Corporation, Extraction Oil & Gas, LLC and Whiting Petroleum Corporation, accounted for approximately 7%, 6% and 6%, respectively, of our 2017 consolidated revenues. We believe our relationships with our clients are strong and the diversity of our client base offers numerous opportunities for growth as our industry continues to improve. |
Strategy
Our strategy is to be a premier land drilling and production services company through steady and disciplined growth, which we executed through the acquisition and building of our high quality drilling rig fleet and production services businesses. In 2011, we shifted our approach to accommodate changes in the industry, which resulted in a period of combined growth and rejuvenation through the disposition of assets which use older technology. Today, we provide drilling and production services in many of the most attractive hydrocarbon producing markets throughout the United States, and provide drilling services in Colombia.
Through the downturn that began in late 2014 and the early stages of recovery that began in late 2016, our recent efforts have been focused on:
• | Reducing Costs and Improving Profitability. During 2015 and 2016, we reduced our total headcount by over 50%, reduced wage rates for our operations personnel, reduced incentive compensation, eliminated certain employment benefits and closed ten field offices to reduce overhead and reduce associated lease payments. In 2016, we lowered our capital expenditures by 77% from the prior year, limiting our capital spending to primarily routine expenditures to maintain our equipment and deferring discretionary upgrades and additions except those that we committed to in 2014 |
5
before the market slowdown. As our industry continues to recover from the downturn, we remain prudent in our efforts to preserve the benefits of our reduced cost structure, in order to capture the full impact of increasing activity and improving profitability.
• | Improving Liquidity and Financial Flexibility. In December 2016, we sold 12.1 million shares of common stock in a public offering, and applied the net proceeds to reduce our outstanding debt under our revolving credit facility. In November 2017, we entered into a new senior secured asset-based lending facility (the “ABL Facility”) and a term loan agreement (the “Term Loan”), the proceeds of which were used to repay and extinguish our prior revolving credit facility which was set to mature in 2019. The ABL Facility and Term Loan provide us greater financial flexibility and increased liquidity. We currently have availability for equity or debt offerings up to $234.6 million under our shelf registration statement, subject to the limitations imposed by our Term Loan, ABL Facility and Senior Notes. |
• | Liquidating Nonstrategic Assets. Since the beginning of 2015, we have sold 37 drilling rigs and other drilling equipment for aggregate net proceeds in excess of $65 million, and have four domestic drilling rigs held for sale, along with other drilling equipment, at December 31, 2017. In 2017, we sold 16 of our older wireline units and two of our smaller diameter coiled tubing units for $1.3 million, and have two wireline units and one coiled tubing unit and spare equipment remaining held for sale at December 31, 2017. Subsequently, we sold six wireline units that were not previously held for sale in January 2018. We continue to evaluate our domestic and international fleets for additional drilling rigs or equipment for which a near term sale would be favorable. |
• | Selectively Optimizing our Fleets. As our vendors and competitors have experienced financial pressure resulting from the industry downturn, we took advantage of favorable asset pricing conditions to enhance our production services fleets, including the exchange of 20 older well servicing rigs for 20 new-model rigs and the purchase of four new wireline units. In January 2018, we added two new greaseless electric wireline units specifically designed to reduce noise when operating in proximity to urban areas, and have one large diameter coiled tubing unit on order for delivery in 2018. |
We continue to evaluate our business and look for opportunities to further achieve these goals, which we believe will position us to take advantage of future business opportunities and maintain our long-term growth strategy.
Our long-term strategy as a premier land drilling and production services company is to further leverage our relationships with existing clients, expand our client base in the areas where we currently operate and further enhance our geographic diversification through selective expansion. The key elements of this long-term strategy are focused on our:
• | Performance in our Core Businesses. We maintain a continual focus on our relationships with our clients and vendors, and our commitment to safety and service quality goals. In 2017, we lowered our lost time incident rates for the fourth consecutive year, achieving the lowest in our company’s history. In 2016, our coiled tubing services segment won the AESC Gold Safety Award, and our wireline services segment won the Bronze Safety Award. In 2015, we were recognized by the International Association of Drilling Contractors as the safest land contract driller of the 15 busiest contractors, with a total recordable incident rate 46% lower than the industry average, and our wireline services segment won the AESC Gold Safety award. Our excellent safety record and reputation are critical to winning new business and expanding our relationships with existing clients. |
• | Investments in Our Business. We have historically invested in the growth and technological advancement of our business by engaging in select rig building opportunities and acquisitions, strategically upgrading our existing assets and disposing of assets which use older technology. |
Since the beginning of 2010, we have added significant capacity to our production services offerings through the addition of 49 wireline units, 51 well servicing rigs and 14 coiled tubing units. From 2011 to 2015, we constructed 15 walking AC drilling rigs. During 2015 and 2016, we removed all 31 of our mechanical and lower horsepower electric drilling rigs from our fleet, which were the most negatively impacted by the industry downturn, as well as all 12 domestic SCR rigs in our fleet. We achieved this by selling a total of 37 drilling rigs, retiring two, and placing the remaining four as held for sale.
Today, our current drilling rig fleet is 100% pad-capable and offers the latest advancements in pad drilling. We have 16 AC rigs in the US and eight SCR rigs in Colombia, all of which have 1,500 horsepower or greater drawworks. The removal of older, less capable rigs from our fleet and investments in the construction of new drilling rigs has transformed our fleet into a highly capable, pad optimal fleet focused on the horizontal drilling market. We believe this positions us to compete well, grow our presence in the significant shale basins in the US, and improve profitability.
6
• | A Leading Provider in Domestic Shale Regions. The investments we’ve made in our business have been focused on increasing our presence in regions where demand benefits from shale development. Shale plays are increasingly important to domestic hydrocarbon production, and not all rigs are capable of successfully working in these unconventional producing regions. Our domestic drilling and production services fleets are highly capable and designed for operation in today’s long lateral environment. |
We are currently operating in the Utica, Marcellus, Eagle Ford, Niobrara, multiple shales in the Permian Basin, SCOOP/STACK and Bakken. With the expectation that the modest recovery experienced in 2017 will continue to bring improved activity and pricing to our industry, we are allocating our resources to the markets with the best opportunities for increased activity and reactivating units in those areas with increasing demand.
Overview of Our Segments and Services
Our business is comprised of two business lines — Drilling Services and Production Services. We report our Drilling Services business as two reportable segments: (i) Domestic Drilling and (ii) International Drilling. We report our Production Services business as three reportable segments: (i) Well Servicing, (ii) Wireline Services, and (iii) Coiled Tubing Services. We revised our reportable business segments as of the fourth quarter of 2017 to reflect changes in the basis used by management in making decisions regarding our business for resource allocation and performance assessment. Financial information about our operating segments is included in Note 10, Segment Information, of the Notes to Consolidated Financial Statements, included in Part II, Item 8, Financial Statements and Supplementary Data, of this Annual Report on Form 10-K.
Drilling Services
A land drilling rig consists of power generation system(s), a hoisting system, a rotating system, pumps and related equipment to circulate and clean drilling fluid, blowout preventers, and other related equipment. Generally, our land drilling rigs operate with crews of five to six persons, and 100% of our drilling rigs have the ability to drill multiple well bores from a single surface location as discussed in more detail below.
There are numerous factors that differentiate land drilling rigs, such as the type of power used, drilling depth capabilities or drawworks horsepower, mud pump pressure rating, and the ability to drill multiple well bores from a single surface location or pad.
Regarding the type of power used, mechanical rigs are generally less expensive than their electric counterparts. Mechanical rigs use torque converters, clutches, chains, belts, and transmissions to couple engines directly to various types of equipment. Mechanical rigs are considered less efficient and less precise than SCR and AC rigs, which are electric rigs that generate electrical power through one or more engine generator sets. SCR rigs utilize direct current to supply and control DC motors coupled to the various drilling equipment, while AC rigs utilize alternating current and AC motors. Both types of electric rigs are considered safer, more reliable, and more efficient than mechanical rigs. AC rigs are considered to be more energy efficient and provide more precise control of equipment than their SCR counterparts, which enhances rig safety and reduces drilling time.
The following table summarizes our current rig fleet composition by segment:
Multi-well, Pad-capable | |||||
SCR rigs | AC rigs | Total | |||
Domestic drilling | — | 16 | 16 | ||
International drilling | 8 | — | 8 | ||
24 | |||||
Technological advancements and trends in our industry affect the demand for certain types of equipment. Every drilling rig in our fleet is equipped with at least 1,500 horsepower drawworks, a top drive, an iron roughneck, an automatic catwalk, and a walking or skidding system. This equipment, which is described in more detail below, provides our clients with drilling rigs that have more varied capabilities for drilling in unconventional plays and improves our efficiency and safety.
In horizontal well drilling, operators can utilize top drives to reach formations that may not be accessible with conventional rotary drilling. Top drives provide maximum torque and rotational control which increases the degree of control afforded the operator, and reduces the difficulties encountered while drilling horizontal wells. An iron roughneck is a remotely operated pipe handling feature on the rig floor, which is used to help reduce the occurrence of repetitive motion injuries and decrease drill pipe tripping time. An automated catwalk is a drill pipe handling feature used to raise drill pipe, drill
7
collars, casing, and other necessary items to the drilling rig floor. Its function has significant safety advantages and can reduce the overall time required to complete the well.
In recent years, oil and gas exploration and production companies have increased the use of “pad drilling” whereby a series of horizontal wells are drilled in succession by walking or skidding a drilling rig at a single pad-site location. Walking systems increase efficiency by allowing multiple wells to be drilled on the same pad site and permitting the drilling rig to move between wells while drill pipe remains in the derrick and ancillary systems such as engines and mud tanks remain stationary, thus reducing move times and costs. Our omnidirectional walking systems enable the drilling rig to move forward, backward, and side to side which affords the operator additional flexibility. The removal of older, less capable rigs from our fleet and investments in the construction of new drilling rigs has transformed our fleet into a highly capable, pad optimal fleet focused on the horizontal drilling market.
We believe that our drilling rigs and other related equipment are in good operating condition. Our employees perform periodic maintenance and minor repair work on our drilling rigs. We rely on various oilfield service companies for major repair work and overhaul of our drilling equipment when needed. We also engage in periodic improvement and upgrades of our drilling equipment. In the event of major breakdowns or mechanical problems, our rigs could be subject to significant idle time and a resulting loss of revenue if the necessary repair services are not immediately available.
In addition to our drilling rigs, we provide the drilling crews and most of the ancillary equipment needed to operate our drilling rigs. We obtain our contracts for drilling oil and natural gas wells either through competitive bidding or through direct negotiations with existing or potential clients. Our drilling contracts generally provide for compensation on a daywork basis. Contract terms generally depend on the complexity and risk of operations, the on-site drilling conditions, the type of equipment used, and the anticipated duration of the work to be performed. Spot market contracts generally provide for the drilling of a single well and typically permit the client to terminate on short notice. Drilling contracts for individual wells are usually completed in less than 30 days. We typically enter into longer-term drilling contracts for our newly constructed rigs and/or during periods of high rig demand.
Production Services
Our production services business segments provide a range of well, wireline and coiled tubing services to a diverse group of exploration and production companies, with our operations concentrated in the major domestic onshore oil and gas producing regions in the Mid-Continent and Rocky Mountain states and in the Gulf Coast, both onshore and offshore.
Newly drilled wells require completion services to prepare the well for production. The completion process may involve selectively perforating the well casing in the productive zones to allow oil or gas to flow into the well bore, stimulating and testing these zones and installing the production string and other downhole equipment. The completion process typically requires a few days to several weeks, depending on the nature and type of the completion, and generally requires additional auxiliary equipment. Accordingly, completion services require less well-to-well mobilization of equipment and can provide higher operating margins than regular maintenance work. The demand for completion services is directly related to drilling activity levels, which are sensitive to changes in oil and gas prices.
Regular maintenance is required throughout the life of a well to sustain optimal levels of oil and gas production. Common maintenance services include repairing inoperable pumping equipment in an oil well, replacing defective tubing in a gas well, cleaning a live well, and servicing mechanical issues. Our maintenance services involve relatively low-cost, short-duration jobs which are part of normal well operating costs. The need for maintenance does not directly depend on the level of drilling activity, although it is somewhat impacted by short-term fluctuations in oil and gas prices. Accordingly, maintenance services generally experience relatively stable demand; however, when oil or gas prices are too low to justify additional expenditures, operating companies may choose to temporarily shut in producing wells rather than incur additional maintenance costs.
In addition to periodic maintenance, producing oil and gas wells occasionally require major repairs or modifications called workovers, which are typically more complex and more time consuming than maintenance operations. Workover services include extensions of existing wells to drain new formations either through perforating the well casing to expose additional productive zones not previously produced, deepening well bores to new zones or the drilling of lateral well bores to improve reservoir drainage patterns. Workovers also include major subsurface repairs such as repair or replacement of well casing, recovery or replacement of tubing and removal of foreign objects from the well bore. A workover may require a few days to several weeks and generally requires additional auxiliary equipment. The demand for workover services is sensitive to oil and gas producers’ intermediate and long-term expectations for oil and gas prices.
8
At the end of the well life cycle, a process is required to permanently close oil and gas wells that are no longer capable of producing in economic quantities. Many well operators bid this work on a “turnkey” basis, requiring the service company to perform the entire job, including the sale or disposal of equipment salvaged from the well as part of the compensation received, and complying with state regulatory requirements. Plugging and abandonment work can provide favorable operating margins and is less sensitive to oil and gas pricing than drilling and workover activity since well operators must plug a well in accordance with state regulations when it is no longer productive.
As of December 31, 2017, the fleet count and composition for each of our production services business segments is as follows:
550 HP | 600 HP | Total | ||||
Well servicing rigs, by horsepower (HP) rating | 113 | 12 | 125 | |||
Offshore | Onshore | Total | ||||
Wireline units | 4 | 108 | 112 | |||
Coiled tubing units | 4 | 10 | 14 | |||
• | Well Servicing. Our well servicing rig fleet provides a range of services, including the completion of newly-drilled wells, maintenance and workover of existing wells, and plugging and abandonment of wells at the end of their useful lives. |
Well servicing rigs are frequently used to complete newly drilled wells to minimize the use of higher cost drilling rigs in the completion process. Our well servicing rigs are also used to convert former producing wells to injection wells through which water or carbon dioxide is then pumped into the formation for enhanced oil recovery operations. Extensive workover operations are normally performed by a well servicing rig with additional specialized auxiliary equipment, which may include rotary drilling equipment, mud pumps, mud tanks and fishing tools, depending upon the particular type of workover operation. All of our well servicing rigs are designed to perform complex workover operations. We also perform plugging and abandonment work throughout our core areas of operation in conjunction with equipment provided by other service companies.
We believe that our well servicing fleet is among the newest in the industry, consisting entirely of tall-masted rigs with at least 550 horsepower, capable of working at depths of over 20,000 feet. These specifications allow us to operate in areas with deeper well depths and perform jobs that rigs with lesser capabilities cannot. In 2017, we traded in 20 of our older 550 horsepower well servicing rigs for 20 new-model rigs, further improving the quality of our rig fleet, enhancing our ability to recruit crew talent and competitively positioning us for new service opportunities as the market continues to improve.
Our well servicing operations are deployed through 10 locations, mostly in the Gulf Coast states, as well as in Arkansas, North Dakota, and Colorado.
• | Wireline Services. Wireline trucks, like well servicing rigs, are utilized throughout the life of a well. Wireline trucks are often used in place of a well servicing rig when there is no requirement to remove tubulars from the well in order to make repairs. Wireline services typically utilize a single truck equipped with a spool of wireline that is used to lower and raise a variety of specialized tools in and out of the wellbore. |
Electric wireline contains a conduit that allows signals to be transmitted to or from tools located in the well. These tools can be used to measure pressures and temperatures as well as the condition of the casing and the cement that holds the casing in place. In order for oil and gas exploration and production companies to better understand the reservoirs they are drilling or producing, they require logging services to accurately characterize reservoir rocks and fluids. We provide both open and cased-hole logging services. Other applications for wireline tools include placing equipment in or retrieving equipment (or debris) from the wellbore, installing bridge plugs, perforating the casing in order to prepare the well for production, or cutting off pipe that is stuck in the well so that the free section can be recovered.
Our wireline operations are deployed through 17 locations in Texas, Kansas, Colorado, Montana, North Dakota, Louisiana, Oklahoma and Wyoming.
• | Coiled Tubing Services. Coiled tubing is another important element of the well servicing industry that allows operators to continue production during service operations on a well under pressure without shutting in the well, thereby reducing the risk of formation damage. Coiled tubing services involve the use of a continuous metal pipe spooled on a large reel for oil and natural gas well applications, such as wellbore clean-outs, nitrogen jet lifts, through-tubing fishing, formation |
9
stimulation utilizing acid, chemical treatments and fracturing. Coiled tubing is also used for a number of horizontal well applications such as milling temporary plugs between frac stages.
Our coiled tubing operations are deployed through three operating locations that provide services in Texas, Louisiana, Wyoming and surrounding areas.
Seasonality
All our production services operations are impacted by seasonal factors. Our business can be negatively impacted during the winter months due to inclement weather, fewer daylight hours, and holidays. Because our well servicing rigs, wireline units and coiled tubing units are mobile, during periods of heavy snow, ice or rain, we may not be able to move our equipment between locations.
Clients
We provide drilling and production services to numerous oil and gas exploration and production companies. The following table shows our three largest clients as a percentage of our total revenue for each of our last three fiscal years.
Total Revenue Percentage | ||
Year ended December 31, 2017 | ||
Apache Corporation | 7.5 | % |
Extraction Oil & Gas, LLC | 6.4 | % |
Whiting Petroleum Corporation | 6.3 | % |
Year ended December 31, 2016 | ||
Apache Corporation | 11.9 | % |
Whiting Petroleum Corporation | 10.1 | % |
PDC Energy, Inc | 4.4 | % |
Year ended December 31, 2015 | ||
Whiting Petroleum Corporation | 17.8 | % |
Ecopetrol | 6.1 | % |
Apache Corporation | 4.6 | % |
Competition
We encounter substantial competition from other drilling contractors and other oilfield service companies. Our primary market areas are highly fragmented and competitive. The fact that drilling and production services equipment are mobile and can be moved from one market to another in response to market conditions heightens the competition in the industry and may result in an oversupply of equipment in an area. Contract drilling companies and other oilfield service companies compete primarily on a regional basis, and the intensity of competition may vary significantly from region to region at any particular time. If demand for drilling or production services improves in a region where we operate, our competitors might respond by moving in suitable rigs and production services equipment from other regions. An influx of equipment from other regions could rapidly intensify competition, reduce profitability and make any improvement in demand for our services short-lived.
Most drilling services contracts and production services contracts are awarded on the basis of competitive bids, which also results in price competition. In addition to pricing and equipment availability, we believe the following factors are also important to our clients in determining which drilling services or production services provider to select:
• | the type, capability and condition of each of the competing drilling rigs, well servicing rigs, wireline units and coiled tubing units; |
• | the mobility and efficiency of the equipment; |
• | the quality of service and experience of the crews; |
• | the reputation and safety record of the company providing the services; |
• | the offering of integrated and/or ancillary services; and |
• | the ability to provide drilling and production services equipment adaptable to, and personnel familiar with, new technologies and drilling and production techniques. |
10
While we must be competitive in our pricing, our competitive strategy generally emphasizes the quality of our equipment, our safety record, our ability to offer ancillary services, the experience of our crews and the quality of service we provide to differentiate us from our competitors. This strategy is less effective when lower demand for drilling and production services intensifies price competition and makes it more difficult for us to compete on the basis of factors other than price. In all of the markets in which we compete, an oversupply of drilling rigs or production services equipment generally causes greater price competition and reduced profitability.
We believe that an important competitive factor in establishing and maintaining long-term client relationships is having an experienced, skilled and well-trained work force. In recent years, many of our larger clients have placed increased emphasis on the safety performance and quality of the crews, equipment and services provided by their contractors. We have devoted, and will continue to devote, substantial resources toward employee safety and training programs. Although we believe clients consider all of these factors, price is generally the primary factor in determining which service provider is awarded the work. However, we believe that many clients are willing to pay a slight premium for the quality and safe, efficient service we provide.
The following is an overview of the market for each of our services:
• | Domestic and International Drilling. Our principal domestic drilling competitors are Helmerich & Payne, Inc., Precision Drilling Corporation, Patterson-UTI Energy, Inc. and Nabors Industries Ltd. In Colombia, we primarily compete with Tuscany International Drilling, Nabors Industries Ltd., and Estrella International Energy Services Ltd. Our current drilling rig fleet is 100% pad-capable and offers the latest advancements in pad drilling, which we believe positions us well to compete and expand our presence in predominant shale regions. |
• | Well Servicing. The largest well servicing providers that we compete with are Key Energy Services, Basic Energy Services, C&J Energy Services, Superior Energy Services and Forbes Energy Services. As compared to the other large competitors in this industry, we believe our fleet is one of the youngest, most uniform fleets, which in addition to our safety performance and service quality, has historically allowed us to operate at utilization and hourly rates that are among the highest of our peers. |
• | Wireline. The wireline market in the United States is dominated by a small number of companies, including ourselves. These competitors include Allied-Horizontal Wireline Services, Renegade Services, C&J Energy Services, Nine Energy Services, and Quintana Energy Services. Additional competitors include Schlumberger Ltd., Halliburton Company and other independents. The market for wireline services is very competitive, but historically we have competed effectively with our competitors because of the diversified services we provide, our performance and strong client service. |
• | Coiled Tubing. The market for coiled tubing has expanded within the oilfield services market over recent years due to technological advances which increased the number of applications for the coiled tubing unit, and due to the increase in deep well and horizontal drilling. Our primary competitors in the coiled tubing services market currently include C&J Energy Services, Superior Energy Services, Key Energy Services, Schlumberger Ltd., Halliburton Company, Quintana Energy Services and RPC, Inc. |
In addition, there are numerous smaller companies that compete in all of our services markets. Some of our competitors have greater financial, technical and other resources than we do. Their greater capabilities in these areas may enable them to:
• | better withstand industry downturns; |
• | compete more effectively on the basis of price and technology; |
• | retain skilled personnel; and |
• | build new rigs or acquire and refurbish existing rigs and place them into service more quickly than us in periods of high drilling demand. |
The need for our services fluctuates primarily in relation to the price (or anticipated price) of oil and natural gas, which in turn is driven by the supply of and demand for oil and natural gas. The level of our revenues, earnings and cash flows are substantially dependent upon, and affected by, the level of domestic and international oil and gas exploration and development activity, as well as the equipment capacity in any particular region. For a more detailed discussion, see Item 7—“Management’s Discussion and Analysis of Financial Condition and Results of Operations.”
Raw Materials
The materials and supplies we use in our drilling and production services operations include fuels to operate our equipment, drilling mud, drill pipe, drill collars, drill bits, cement and other job materials such as explosives, perforating guns and
11
coiled tubing. We do not rely on a single source of supply for any of these items. From time to time, there have been shortages of drilling and production services equipment and supplies during periods of high demand. Shortages could result in increased prices for equipment or supplies that we may be unable to pass on to clients. In addition, during periods of shortages, the delivery times for equipment and supplies can be substantially longer. Any significant delays in our obtaining equipment or supplies could limit our operations and jeopardize our relations with clients. In addition, shortages of equipment or supplies could delay and adversely affect our ability to obtain new contracts for our rigs, which could have a material adverse effect on our financial condition and results of operations.
Operating Risks and Insurance
Our operations are subject to the many hazards inherent in exploration and production activity, including the risks of:
• | blowouts; |
• | cratering; |
• | fires and explosions; |
• | loss of well control; |
• | collapse of the borehole; |
• | damaged or lost drilling equipment; and |
• | damage or loss from natural disasters. |
Any of these hazards can result in substantial liabilities or losses to us from, among other things:
• | suspension of operations; |
• | damage to, or destruction of, our property and equipment and that of others; |
• | personal injury and loss of life; |
• | damage to producing or potentially productive oil and gas formations through which we drill; and |
• | environmental damage. |
We seek to protect ourselves from some but not all operating hazards through insurance coverage. However, some risks are either not insurable or insurance is available only at rates that we consider uneconomical. Those risks include, among other things, pollution liability in excess of relatively low limits. Depending on competitive conditions and other factors, we attempt to obtain contractual protection against uninsured operating risks from our clients. However, clients who provide contractual indemnification protection may not in all cases maintain adequate insurance or otherwise have the financial resources necessary to support their indemnification obligations. Our insurance or indemnification arrangements may not adequately protect us against liability or loss from all the hazards of our operations. The occurrence of a significant event that we have not fully insured or indemnified against or the failure of a client to meet its indemnification obligations to us could materially and adversely affect our results of operations and financial condition. Furthermore, we may be unable to maintain adequate insurance in the future at rates we consider reasonable.
Our current insurance coverage includes property insurance on our rigs, drilling equipment, production services equipment and real property. Our insurance coverage for property damage to our rigs, drilling equipment and production services equipment is based on our estimates of the cost of comparable used equipment to replace the insured property. The policy provides for a deductible of no more than $750,000 per drilling rig and a deductible on production services equipment of $100,000 per occurrence. Our third-party liability insurance coverage is $101 million per occurrence and in the aggregate, with a deductible of $250,000 per occurrence and an additional $250,000 annual aggregate deductible. We also carry insurance coverage for pollution liability up to $20 million with a deductible of $500,000. We believe that we are adequately insured for public liability and property damage to others with respect to our operations. However, such insurance may not be sufficient to protect us against liability for all consequences of well disasters, extensive fire damage or damage to the environment.
Employees
We currently have approximately 2,300 employees, the majority of which work in our drilling and production services operations and are primarily compensated on an hourly basis. The number of employees in operations fluctuates depending on the utilization of our drilling rigs, well servicing rigs, wireline units and coiled tubing units at any particular time. None of our employment arrangements are subject to collective bargaining arrangements.
Our operations require the services of employees having the technical training and experience necessary to achieve proper operational results. As a result, our operations depend, to a considerable extent, on the continuing availability of such personnel. From time to time, shortages of qualified personnel have occurred in our industry. If we should suffer any material
12
loss of personnel to competitors or be unable to employ additional or replacement personnel with the requisite level of training and experience to adequately operate our equipment, our operations could be materially and adversely affected. While we believe our wage rates are competitive and our relationships with our employees are satisfactory, a significant increase in the wages paid by other employers could result in a reduction in our workforce, increases in wage rates, or both. The occurrence of either of these events for a significant period of time could have a material adverse effect on our financial condition and results of operations.
Facilities
We lease our corporate office facilities located at 1250 N.E. Loop 410, Suite 1000 San Antonio, Texas 78209. We conduct our business operations through 50 other real estate locations, of which we own 12, located throughout the United States in Texas, Oklahoma, Colorado, Montana, North Dakota, Pennsylvania, Wyoming, Mississippi, Arkansas, Louisiana and Kansas, and one property is located internationally in Colombia. These real estate locations are primarily used for regional offices and storage and maintenance yards.
Governmental Regulation
Many aspects of our operations are subject to various federal, state and local laws and governmental regulations, including laws and regulations governing:
• | environmental quality; |
• | pollution control; |
• | remediation of contamination; |
• | preservation of natural resources; |
• | transportation; and |
• | worker safety. |
Environment Protection. Our operations are subject to stringent federal, state and local laws, rules and regulations governing the protection of the environment and human health and safety.
Some of the laws, rules and regulations applicable to our industry relate to the disposal of hazardous substances, oilfield waste and other waste materials and restrict the types, quantities and concentrations of those substances that can be released into the environment. Several of those laws also require removal and remedial action and other cleanup under certain circumstances, commonly regardless of fault. Our operations routinely involve the handling of significant amounts of waste materials, some of which are classified as hazardous wastes and/or hazardous substances. Planning, implementation and maintenance of protective measures are required to prevent accidental discharges. Spills of oil, natural gas liquids, drilling fluids and other substances may subject us to penalties and cleanup requirements. Handling, storage and disposal of both hazardous and non-hazardous wastes are also subject to these regulatory requirements. In addition, our operations are often conducted in or near ecologically sensitive areas, such as wetlands, which are subject to special protective measures and which may expose us to additional operating costs and liabilities for accidental discharges of oil, gas, drilling fluids, contaminated water or other substances, or for noncompliance with other aspects of applicable laws and regulations.
Environmental laws and regulations are complex and subject to frequent change. Failure to comply with governmental requirements or inadequate cooperation with governmental authorities could subject a responsible party to administrative, civil or criminal action. We may also be exposed to environmental or other liabilities originating from businesses and assets which we acquired from others. Our compliance with amended, new or more stringent requirements, stricter interpretations of existing requirements or the future discovery of contamination or regulatory noncompliance may require us to make material expenditures or subject us to liabilities that we currently do not anticipate.
There are a variety of regulatory developments, proposals or requirements and legislative initiatives that have been introduced in the United States and international regions in which we operate that are focused on restricting the emission of carbon dioxide, methane and other greenhouse gases.
Hydraulic fracturing of wells and subsurface water disposal are also under public and governmental scrutiny due to concerns regarding potential environmental and physical impacts, including groundwater and drinking water impacts, as well as whether such activities may cause earthquakes. Increased regulation and attention given to the hydraulic fracturing process could lead to greater opposition, including litigation, to oil and gas production activities using hydraulic fracturing techniques. Additional legislation or regulation could also lead to operational delays or increased operating costs in the production of oil and natural gas, including from the developing shale plays, incurred by our clients. The adoption of any federal, state or local laws or the implementation of regulations or ordinances restricting or increasing the costs of hydraulic fracturing
13
could cause a decrease in the completion of new oil and natural gas wells and an associated decrease in demand for our drilling and well servicing activities, any or all of which could adversely affect our financial position, results of operations and cash flows.
Our wireline operations involve the use of radioactive isotopes along with other nuclear, electrical, acoustic, and mechanical devices. Our activities involving the use of isotopes are regulated by the U.S. Nuclear Regulatory Commission and specified agencies of certain states. Additionally, we use high explosive charges for perforating casing and formations, and we use various explosive cutters to assist in wellbore cleanout. Such operations are regulated by the U.S. Department of Justice, Bureau of Alcohol, Tobacco, Firearms, and Explosives and require us to obtain licenses or other approvals for the use of densitometers as well as explosive charges. We have obtained these licenses and approvals when necessary and believe that we are in substantial compliance with these federal requirements.
In addition, our business depends on the demand for land drilling and production services from the oil and gas industry and, therefore, is affected by tax, environmental and other laws relating to the oil and gas industry generally, by changes in those laws and by changes in related administrative regulations. It is possible that these laws and regulations may in the future add significantly to our operating costs or those of our clients, or otherwise directly or indirectly affect our operations.
See Item 1A—“Risk Factors” in Part I of this Annual Report on Form 10-K for a detailed discussion of risks we face concerning laws and governmental regulations.
Transportation. Among the services we provide, we operate as a motor carrier for the transportation of our own equipment and therefore are subject to regulation by the U.S. Department of Transportation and by various state agencies. These regulatory authorities exercise broad powers, governing activities such as the authorization to engage in motor carrier operations and regulatory safety. There are additional regulations specifically relating to the trucking industry, including testing and specification of equipment and product handling requirements. The trucking industry is subject to possible regulatory and legislative changes that may affect the economics of the industry by requiring changes in operating practices or by changing the demand for common or contract carrier services or the cost of providing truckload services. Some of these possible changes include increasingly stringent environmental regulations, changes in the hours of service regulations which govern the amount of time a driver may drive in any specific period, onboard black box recorder devices or limits on vehicle weight and size.
Interstate motor carrier operations are subject to safety requirements prescribed by the U.S. Department of Transportation. To a large degree, intrastate motor carrier operations are subject to state safety regulations that mirror federal regulations. Such matters as weight and dimension of equipment are also subject to federal and state regulations.
From time to time, various legislative proposals are introduced, including proposals to increase federal, state, or local taxes, including taxes on motor fuels, which may increase our costs or adversely impact the recruitment of drivers. We cannot predict whether, or in what form, any increase in such taxes applicable to us will be enacted.
Available Information
Our Website address is www.pioneeres.com. Our annual reports on Form 10-K, quarterly reports on Form 10-Q, current reports on Form 8-K and amendments to those reports, are available free of charge through our Website as soon as reasonably practicable after we electronically file those materials with, or furnish those materials to, the Securities and Exchange Commission. The public may read and copy these materials at the Securities and Exchange Commission’s Public Reference Room at 100 F Street, N.E., Washington, DC 20549. For additional information on the operations of the Securities and Exchange Commission’s Public Reference Room, please call 1-800-SEC-0330. In addition, the Securities and Exchange Commission maintains an Internet site at www.sec.gov that contains reports, proxy and information statements and other information regarding issuers that file electronically. We have also posted on our Website our: Charters for the Audit, Compensation, and Nominating and Corporate Governance Committees of our Board; Code of Business Conduct and Ethics; Corporate Governance Guidelines; and Company Contact Information. Information on our website is not incorporated into this report or otherwise made part of this report.
ITEM 1A. | RISK FACTORS |
The information set forth in this Item 1A should be read in conjunction with the rest of the information included in this report, including “Management’s Discussion and Analysis of Financial Condition and Results of Operations” in Item 7 and the financial statements and related notes this report contains. While we attempt to identify, manage and mitigate risks and uncertainties associated with our business to the extent practical under the circumstances, some level of risk and uncertainty will always be present. Additional risks and uncertainties that are not presently known to us or that we currently believe are immaterial also may negatively impact our business, financial condition or operating results.
Set forth below are various risks and uncertainties that could adversely impact our business, financial condition, results of operations and cash flows.
Risks Relating to the Oil and Gas Industry
• | We derive all our revenues from companies in the oil and gas exploration and production industry, a historically cyclical industry with levels of activity that are significantly affected by the levels and volatility of oil and gas prices. |
As a provider of contract land drilling services and oil and gas production services, our business depends on the level of exploration and production activity in the geographic markets where we operate. The oil and gas exploration and production industry is a historically cyclical industry characterized by significant changes in the levels of exploration and development activities.
Oil and gas prices, and market expectations of potential changes in those prices, significantly affect the levels of those activities. Oil and gas prices have been volatile historically and, we believe, will continue to be so in the future. Worldwide political, economic, and military events as well as natural disasters have contributed to oil and gas price volatility historically, and are likely to continue to do so in the future. Many factors beyond our control affect oil and gas prices, including:
• | the worldwide supply and demand for oil and gas; |
• | the cost of exploring for, producing and delivering oil and gas; |
• | the discovery rate of new oil and gas reserves; |
• | the rate of decline of existing and new oil and gas reserves; |
• | available pipeline and other oil and gas transportation capacity; |
• | the levels of oil and gas storage; |
• | the ability of oil and gas exploration and production companies to raise capital; |
• | economic conditions in the United States and elsewhere; |
• | actions by the Organization of Petroleum Exporting Countries, which we refer to as OPEC; |
• | political instability in oil and gas producing regions; |
• | governmental regulations, both domestic and foreign; |
• | domestic and foreign tax policy; |
• | weather conditions in the United States and elsewhere; |
• | the pace adopted by foreign governments for the exploration, development and production of their national reserves, or their investments in oil and gas reserves located in other countries; and |
• | the price of foreign imports of oil and gas. |
14
Additionally, the above factors can also be affected by technological advances affecting energy consumption and the supply and demand within the market for renewable energy resources.
• | As a result of the decline in oil prices that began in late 2014, our clients reduced spending on exploration and production projects in 2015 and 2016, resulting in a significant decrease in demand for our services, which has improved during 2017. |
Oil and natural gas prices, and market expectations of potential changes in these prices, significantly impact the level of worldwide drilling and production services activities. Reduced demand for oil and natural gas generally results in lower prices for these commodities and often impacts the economics of planned drilling projects and ongoing production projects, resulting in the curtailment, reduction, delay or postponement of such projects for an indeterminate period of time. When drilling and production activity and spending declines, both dayrates and utilization historically decline as well.
Beginning in October 2014, oil prices worldwide dropped significantly. Our clients significantly reduced both their operating and capital expenditures during 2015 and 2016, which adversely affected our business. In 2017, our clients modestly increased their spending as compared to 2016 levels, and we expect continued increases in 2018. However, if the oil and natural gas prices again decline, oil and gas exploration and production companies may cancel or curtail their drilling programs and further reduce production spending on existing wells, thereby reducing demand for our services. If the reduction in the overall level of exploration and development activities, whether resulting from changes in oil and gas prices or otherwise, continues or worsens, it could materially and adversely affect us further by negatively impacting:
• | our revenues, cash flows and profitability; |
• | the fair market value of our drilling rig fleet and production services equipment; |
• | our ability to maintain or increase our borrowing capacity; |
• | our ability to obtain additional capital to finance our business or make acquisitions, and the cost of that capital; |
• | the collectability of our receivables; and |
• | our ability to retain skilled operations personnel. |
Risks Relating to Our Business
• | Reduced demand for or excess capacity of drilling services or production services could adversely affect our profitability. |
Our profitability in the future will depend on many factors, but largely on pricing and utilization rates for our drilling and production services. A reduction in the demand for drilling rigs or an increase in the supply of drilling rigs, whether through new construction or refurbishment, could decrease the dayrates and utilization rates for our drilling services, which would adversely affect our revenues and profitability. An increase in supply of well servicing rigs, wireline units and coiled tubing units, without a corresponding increase in demand, could similarly decrease the pricing and utilization rates of our production services, which would adversely affect our revenues and profitability.
• | We operate in a highly competitive, fragmented industry in which price competition could reduce our profitability. |
We encounter substantial competition from other drilling contractors and other oilfield service companies. Our primary market areas are highly fragmented and competitive. The fact that drilling and production services equipment are mobile and can be moved from one market to another in response to market conditions heightens the competition in the industry and may result in an oversupply of equipment in an area. Contract drilling companies and other oilfield service companies compete primarily on a regional basis, and the intensity of competition may vary significantly from region to region at any particular time. If demand for drilling or production services improves in a region where we operate, our competitors might respond by moving in suitable rigs and production services equipment from other regions. An influx of equipment from other regions could rapidly intensify competition, reduce profitability and make any improvement in demand for our services short-lived.
Most drilling services contracts and production services contracts are awarded on the basis of competitive bids, which also results in price competition. In addition to pricing and equipment availability, we believe the following factors are also important to our clients in determining which drilling services or production services provider to select:
• | the type, capability and condition of each of the competing drilling rigs, well servicing rigs, wireline units and coiled tubing units; |
• | the mobility and efficiency of the equipment; |
15
• | the quality of service and experience of the crews; |
• | the reputation and safety record of the company providing the services; |
• | the offering of integrated and/or ancillary services; and |
• | the ability to provide drilling and production services equipment adaptable to, and personnel familiar with, new technologies and drilling and production techniques. |
While we must be competitive in our pricing, our competitive strategy generally emphasizes the quality of our equipment, our safety record, our ability to offer ancillary services, the experience of our crews and the quality of service we provide to differentiate us from our competitors. This strategy is less effective when lower demand for drilling and production services intensifies price competition and makes it more difficult for us to compete on the basis of factors other than price. In all of the markets in which we compete, an oversupply of drilling rigs or production services equipment generally causes greater price competition and reduced profitability.
• | We face competition from many competitors with greater resources. |
Some of our competitors have greater financial, technical and other resources than we do. Their greater capabilities in these areas may enable them to:
• | better withstand industry downturns; |
• | compete more effectively on the basis of price and technology; |
• | retain skilled personnel; and |
• | build new rigs or acquire and refurbish existing rigs and place them into service more quickly than us in periods of high drilling demand. |
• | Technological advancements and trends in our industry also affect the demand for certain types of equipment, and can affect the overall demand for equipment in our industry. |
Technological advancements and trends in our industry also affect the demand for certain types of equipment, and can affect the overall demand for equipment in our industry. For several years, prior to late 2014, higher oil prices drove industry equipment utilization and revenue rates up, particularly in oil-producing regions and certain shale regions. However, advancements in technology improved the efficiency of drilling rigs and overall demand remained steady, while the demand for certain drilling rigs decreased, particularly in vertical well markets. The decline was a result of higher demand for drilling rigs that are able to drill horizontally and the increased use of “pad drilling” which enables a series of horizontal wells to be drilled in succession by walking or skidding a drilling rig at a single pad-site location, thereby improving the productivity of exploration and production activities and minimizing mobilization costs. This trend, then coupled with the downturn, resulted in significantly reduced demand for drilling rigs that do not have the ability to walk or skid and to drill horizontal wells, and could further reduce the overall demand for all drilling rigs.
In drilling, all rig classes were severely impacted by the industry downturn. However, AC drilling rigs equipped with either a walking or skidding system are the best suited for horizontal pad drilling and we believe they are the most desirable rig design available.
Although we take measures to ensure that we use advanced technologies for drilling and production services equipment, changes in technology or improvements in our competitors’ equipment could make our equipment less competitive or require significant capital investments to keep our equipment competitive, which could have an adverse effect on our financial condition and operating results.
• | We derive a significant portion of our revenue from a limited number of major clients, and our business, financial condition and results of operations could be materially adversely affected if we are unable to maintain relationships with these clients, or if their demand for our services decreases. |
In the past, we have derived a significant portion of our revenue from a limited number of major clients. For the years ended December 31, 2017, 2016 and 2015, our drilling and production services to our top three clients accounted for approximately 20%, 26%, and 29%, respectively, of our revenue. The loss of one or more of our major clients, or their decrease in demand for our services, could have a material adverse effect on our business, financial condition and results of operations. We experienced significantly reduced demand for our services during 2015 and 2016 from all clients, including our major clients, but we experienced a modest recovery in demand during 2017. For a detail of our three largest clients as a percentage of our total revenues during the last three fiscal years, see Item 1—“Business” in Part I of this Annual Report on Form 10-K.
16
• | Our indebtedness could restrict our operations and make us more vulnerable to adverse economic conditions. |
Our indebtedness is primarily a result of the acquisitions of the well servicing and wireline services businesses which we acquired in 2008 and the coiled tubing business that we acquired in 2011, as well as organic growth investments. At December 31, 2017, our total debt consists of $300 million outstanding under our Senior Notes and $175 million outstanding under our Term Loan, with additional borrowing availability under our ABL Facility.
Our current and future indebtedness could have important consequences, including:
• | limiting our ability to use operating cash flow in other areas of our business because we must dedicate a substantial portion of these funds to make principal and interest payments on our indebtedness; |
• | making us more vulnerable to a downturn in our business, our industry or the economy in general as a substantial portion of our operating cash flow could be required to make principal and interest payments on our indebtedness, making it more difficult to react to changes in our business, industry and market conditions; |
• | limiting our flexibility in planning for, or reacting to, changes in our business and the industry in which we operate; |
• | impairing our ability to make investments and obtain additional financing for working capital, capital expenditures, acquisitions or other general corporate purposes; |
• | limiting our ability to obtain additional financing that may be necessary to operate or expand our business; |
• | putting us at a competitive disadvantage to competitors that have less debt; and |
• | increasing our vulnerability to rising interest rates. |
We currently expect that cash and cash equivalents, cash generated from operations, proceeds from sales of certain non-strategic assets, and available borrowings under our ABL Facility are adequate to cover our liquidity requirements for at least the next 12 months. However, our ability to make payments on our indebtedness, and to fund planned capital expenditures, will depend on our ability to generate cash in the future. This, to a certain extent, is subject to:
• | conditions in the oil and gas industry; |
• | general economic and financial conditions; |
• | competition in the markets where we operate; |
• | the impact of legislative and regulatory actions on how we conduct our business; and |
• | other factors, all of which are beyond our control. |
If our business does not generate sufficient cash flow from operations to service our outstanding indebtedness, we may have to undertake alternative financing plans, subject to the limitations imposed by our Term Loan, ABL Facility and Senior Notes, such as:
• | refinancing or restructuring our debt; |
• | selling assets; |
• | reducing or delaying acquisitions or capital investments, such as refurbishments of our rigs and related equipment; and/or |
• | seeking to raise additional capital. |
However, we may be unable to implement alternative financing plans, if necessary, on commercially reasonable terms or at all, and any such alternative financing plans might be insufficient to allow us to meet our debt obligations. If we are unable to generate sufficient cash flow or are otherwise unable to obtain the funds required to make principal and interest payments on our indebtedness, or if we otherwise fail to comply with the various covenants in our Term Loan, ABL Facility, and Senior Notes, we could be in default under the terms of such instruments. In the event of a default, our lenders could elect to declare all the loans made under our Term Loan, ABL Facility, and Senior Notes to be due and payable together with accrued and unpaid interest and terminate their commitments thereunder and we or one or more of our subsidiaries could be forced into bankruptcy or liquidation. Any of the foregoing consequences could materially and adversely affect our business, financial condition, results of operations and prospects.
17
• | Our Term Loan, ABL Facility, and Senior Notes impose significant covenants on us that may affect our ability to successfully operate our business. |
Our Term Loan contains customary restrictions that, among other things, and subject to certain exceptions, limit our ability to:
• | incur additional debt; |
• | incur or permit liens on assets; |
• | make investments and acquisitions; |
• | consolidate or merge with another company; |
• | engage in asset sales; and |
• | pay dividends or make distributions. |
In addition, our Term Loan requires us to maintain certain financial covenants and to satisfy certain financial conditions, which may require us to reduce our debt or take some other action in order to comply with them.
Our ABL Facility contains restrictive covenants that, among other things, and subject to certain exceptions, limit our ability to:
• | declare dividends and make other distributions; |
• | issue or sell certain equity interests; |
• | optionally prepay, redeem or repurchase certain of our subordinated indebtedness; |
• | make loans or investments (including acquisitions); |
• | incur additional indebtedness or modify the terms of permitted indebtedness; |
• | grant liens; |
• | change our business or the business of our subsidiaries; |
• | merge, consolidate, reorganize, recapitalize, or reclassify our equity interests; |
• | sell our assets, and |
• | enter into certain types of transactions with affiliates. |
The Indenture governing our Senior Notes, among other things, limits us and certain of our subsidiaries, subject to certain exceptions, in our ability to:
• | pay dividends on stock, repurchase stock, redeem subordinated indebtedness or make other restricted payments and investments; |
• | incur, assume or guarantee additional indebtedness or issue preferred or disqualified stock; |
• | create liens on our or their assets; |
• | enter into sale and leaseback transactions; |
• | sell or transfer assets; |
• | borrow, pay dividends, or transfer other assets from certain of our subsidiaries; |
• | consolidate with or merge with or into, or sell all or substantially all of our properties to any other person; |
• | enter into transactions with affiliates; and |
• | enter into new lines of business. |
The failure to comply with any of these covenants would cause an event of default under our Term Loan, ABL Facility, or Senior Notes. An event of default, if not waived, could result in acceleration of the outstanding indebtedness, in which case the debt would become immediately due and payable. If this occurs, we may not be able to pay our debt or borrow sufficient funds to refinance it. Even if new financing is available, it may not be available on terms that are acceptable to us. These covenants could also limit our ability to obtain future financing, make needed capital expenditures, withstand a downturn in our business or the economy in general, or otherwise conduct necessary corporate activities. We also may be prevented from taking advantage of business opportunities that arise because of the limitations imposed on us by the restrictive covenants under our Term Loan, ABL Facility, and Senior Notes.
• | Our operations involve operating hazards, which, if not insured or indemnified against, could adversely affect our results of operations and financial condition. |
Our operations are subject to the many hazards inherent in exploration and production activity, including the risks of:
• | blowouts; |
• | cratering; |
• | fires and explosions; |
• | loss of well control; |
18
• | collapse of the borehole; |
• | damaged or lost drilling equipment; and |
• | damage or loss from natural disasters. |
Any of these hazards can result in substantial liabilities or losses to us from, among other things:
• | suspension of operations; |
• | damage to, or destruction of, our property and equipment and that of others; |
• | personal injury and loss of life; |
• | damage to producing or potentially productive oil and gas formations through which we drill; and |
• | environmental damage. |
We seek to protect ourselves from some but not all operating hazards through insurance coverage. However, some risks are either not insurable or insurance is available only at rates that we consider uneconomical. Those risks include, among other things, pollution liability in excess of relatively low limits. Depending on competitive conditions and other factors, we attempt to obtain contractual protection against uninsured operating risks from our clients. However, clients who provide contractual indemnification protection may not in all cases maintain adequate insurance or otherwise have the financial resources necessary to support their indemnification obligations. Our insurance or indemnification arrangements may not adequately protect us against liability or loss from all the hazards of our operations. The occurrence of a significant event that we have not fully insured or indemnified against or the failure of a client to meet its indemnification obligations to us could materially and adversely affect our results of operations and financial condition. Furthermore, we may be unable to maintain adequate insurance in the future at rates we consider reasonable.
• | We could be adversely affected if shortages of equipment, supplies or personnel occur. |
From time to time, there have been shortages of drilling and production services equipment and supplies during periods of high demand which we believe could recur. Shortages could result in increased prices for equipment or supplies that we may be unable to pass on to clients. In addition, during periods of shortages, the delivery times for equipment and supplies can be substantially longer. Any significant delays in our obtaining equipment or supplies could limit our operations and jeopardize our relations with clients. In addition, shortages of equipment or supplies could delay and adversely affect our ability to obtain new contracts for our rigs, which could have a material adverse effect on our financial condition and results of operations.
Our strategy of constructing drilling rigs during periods of peak demand requires that we maintain an adequate supply of drilling rig components to complete our rig building program. Our suppliers may be unable to continue providing us the needed drilling rig components if their manufacturing sources are unable to fulfill their commitments.
Our operations require the services of employees having the technical training and experience necessary to achieve proper operational results. As a result, our operations depend, to a considerable extent, on the continuing availability of such personnel. Shortages of qualified personnel have occurred in our industry. If we should suffer any material loss of personnel to competitors or be unable to employ additional or replacement personnel with the requisite level of training and experience to adequately operate our equipment, our operations could be materially and adversely affected. A significant increase in the wages paid by other employers could result in a reduction in our workforce, increases in wage rates, or both. The occurrence of either of these events for a significant period of time could have a material adverse effect on our financial condition and results of operations.
• | Our acquisition strategy exposes us to various risks, including those relating to difficulties in identifying suitable acquisition opportunities and integrating businesses, assets and personnel, as well as difficulties in obtaining financing for targeted acquisitions and the potential for increased leverage or debt service requirements. |
A component of our long-term business strategy is a pursuit of acquisitions of complementary assets and businesses, subject to the limitations imposed by our Term Loan, ABL Facility, and Senior Notes. This acquisition strategy in general involves numerous inherent risks, including:
• | unanticipated costs and assumption of liabilities and exposure to unforeseen liabilities of acquired businesses, including environmental liabilities; |
• | difficulties in integrating the operations and assets of the acquired business and the acquired personnel; |
• | limitations on our ability to properly assess and maintain an effective internal control environment over an acquired business in order to comply with applicable periodic reporting requirements; |
• | potential losses of key employees and clients of the acquired businesses; |
19
• | risks of entering markets in which we have limited prior experience; and |
• | increases in our expenses and working capital requirements. |
The process of integrating an acquired business may involve unforeseen costs and delays or other operational, technical and financial difficulties that may require a disproportionate amount of management attention and financial and other resources. Our failure to achieve consolidation savings, to incorporate the acquired businesses and assets into our existing operations successfully or to minimize any unforeseen operational difficulties could have a material adverse effect on our financial condition and results of operations.
In addition, we may not have sufficient capital resources to complete additional acquisitions. Historically, we have funded business acquisitions and the growth of our rig fleet through a combination of debt and equity financing. We may incur substantial additional indebtedness to finance future acquisitions and also may issue equity securities or convertible securities in connection with such acquisitions. Debt service requirements could represent a significant burden on our results of operations and financial condition and the issuance of additional equity or convertible securities could be dilutive to our existing shareholders. Furthermore, we may not be able to obtain additional financing on satisfactory terms or at all.
Even if we have access to the necessary capital, we may be unable to continue to identify additional suitable acquisition opportunities, negotiate acceptable terms or successfully acquire identified targets.
• | Our cash and cash equivalents and short term investments could be adversely affected if the financial institutions in which we hold our cash and cash equivalents fail. |
We maintain cash balances at third-party financial institutions in excess of the Federal Deposit Insurance Corporation insurance limit. While we monitor the cash balances in the operating accounts and adjust the balances as appropriate, we may incur a loss to the extent such loss exceeds the insurance limitation, and there could be a material impact on our business, if one or more of the financial institutions with which we deposit fails or is subject to other adverse conditions in the financial or credit markets and bank regulators elect to impose losses on uninsured depositors. To date, we have experienced no loss or lack of access to our invested cash or cash equivalents. However, in the future, our invested cash and cash equivalents could be adversely affected by adverse conditions in the financial and credit markets.
• | Our international operations are subject to political, economic and other uncertainties not generally encountered in our domestic operations. |
Our international operations are subject to political, economic and other uncertainties not generally encountered in our U.S. operations which include, among potential others:
• | risks of war, terrorism, civil unrest and kidnapping of employees; |
• | employee strikes, work stoppages, labor disputes and other slowdowns; |
• | expropriation, confiscation or nationalization of our assets; |
• | renegotiation or nullification of contracts; |
• | foreign taxation, such as the tax for equality and the net-worth tax in Colombia; |
• | the inability to repatriate earnings or capital due to laws limiting the right and ability of foreign subsidiaries to pay dividends and remit earnings to affiliated companies; |
• | changing political conditions and changing laws and policies affecting trade and investment; |
• | concentration of clients; |
• | regional economic downturns; |
• | the overlap of different tax structures; |
• | the burden of complying with multiple and potentially conflicting laws; |
• | the risks associated with the assertion of foreign sovereignty over areas in which our operations are conducted; |
• | the risks associated with any lack of compliance with the Foreign Corrupt Practices Act of 1977 (“FCPA”) or other anti-corruption laws; |
• | the risks associated with fluctuating currency values, hard currency shortages and controls of foreign currency exchange, and higher rates of inflation as compared to our domestic operations; |
• | difficulty in collecting international accounts receivable; and |
• | potentially longer payment cycles. |
20
Additionally, we may be subject to foreign governmental regulations favoring or requiring the awarding of contracts to local contractors or requiring foreign contractors to employ citizens of, or purchase supplies from, a particular jurisdiction. These regulations could adversely affect our ability to compete.
We are committed to doing business in accordance with applicable anti-corruption laws and our code of conduct and ethics. We are subject, however, to the risk that our employees and agents may take action determined to be in violation of anti-corruption laws, including the FCPA or other similar laws. Any violation of the FCPA or other applicable anti-corruption laws could result in substantial fines, sanctions, civil and/or criminal penalties and curtailment of operations in certain jurisdictions and might materially adversely affect our business, results of operations or financial condition. In addition, actual or alleged violations could damage our reputation and ability to do business. Further, detecting, investigating, and resolving actual or alleged violations is expensive and can consume significant time and attention of our senior management.
• | Our operations are subject to various laws and governmental regulations that could restrict our future operations and increase our operating costs. |
Many aspects of our operations are subject to various federal, state and local laws and governmental regulations, including laws and regulations governing:
• | environmental quality; |
• | pollution control; |
• | remediation of contamination; |
• | preservation of natural resources; |
• | transportation; and |
• | worker safety. |
Environment Protection. Our operations are subject to stringent federal, state and local laws, rules and regulations governing the protection of the environment and human health and safety.
Some of the laws, rules and regulations applicable to our industry relate to the disposal of hazardous substances, oilfield waste and other waste materials and restrict the types, quantities and concentrations of those substances that can be released into the environment. Several of those laws also require removal and remedial action and other cleanup under certain circumstances, commonly regardless of fault. Our operations routinely involve the handling of significant amounts of waste materials, some of which are classified as hazardous wastes and/or hazardous substances. Planning, implementation and maintenance of protective measures are required to prevent accidental discharges. Spills of oil, natural gas liquids, drilling fluids and other substances may subject us to penalties and cleanup requirements. Handling, storage and disposal of both hazardous and non-hazardous wastes are also subject to these regulatory requirements. In addition, our operations are often conducted in or near ecologically sensitive areas, such as wetlands, which are subject to special protective measures and which may expose us to additional operating costs and liabilities for accidental discharges of oil, gas, drilling fluids, contaminated water or other substances, or for noncompliance with other aspects of applicable laws and regulations.
The federal Clean Water Act; the Oil Pollution Act; the federal Clean Air Act; the federal Resource Conservation and Recovery Act; the federal Comprehensive Environmental Response, Compensation, and Liability Act (CERCLA); the Safe Drinking Water Act (SDWA); the federal Outer Continental Shelf Lands Act; the Occupational Safety and Health Act (OSHA); regulations implementing these federal statutes (such as the 2015 Waters of the United States rule, which may be rescinded pursuant to a proposal issued in June 2017); and their state counterparts and similar statutes are the primary statutes that impose the requirements described above and provide for civil, criminal and administrative penalties and other sanctions for violation of their requirements. The OSHA hazard communication standard, the Environmental Protection Agency (EPA) “community right-to-know” regulations under Title III of the federal Superfund Amendment and Reauthorization Act and comparable state statutes require us to organize and report information about the hazardous materials we use in our operations to employees, state and local government authorities and local citizens. In addition, CERCLA, also known as the “Superfund” law, and similar state statutes impose strict liability, without regard to fault or the legality of the original conduct, on certain classes of persons who are considered responsible for the release or threatened release of hazardous substances into the environment. These persons include the current owner or operator of a facility where a release has occurred, the owner or operator of a facility at the time a release occurred, and companies that disposed of or arranged for the disposal of hazardous substances found at a particular site. This liability may be joint and several. Such liability, which may be imposed for the conduct of others and for conditions others have caused, includes the cost of removal and remedial action as well as damages to natural resources. Few
21
defenses exist to the liability imposed by many environmental laws and regulations. It is also common for third parties to file claims for personal injury and property damage caused by substances released into the environment.
Environmental laws and regulations are complex and subject to frequent change. Failure to comply with governmental requirements or inadequate cooperation with governmental authorities could subject a responsible party to administrative, civil or criminal action. We may also be exposed to environmental or other liabilities originating from businesses and assets which we acquired from others. Our compliance with amended, new or more stringent requirements, stricter interpretations of existing requirements or the future discovery of contamination or regulatory noncompliance may require us to make material expenditures or subject us to liabilities that we currently do not anticipate.
There are a variety of regulatory developments, proposals or requirements and legislative initiatives that have been introduced in the United States and international regions in which we operate that are focused on restricting the emission of carbon dioxide, methane and other greenhouse gases. Among these developments at the international level is the United Nations Framework Convention on Climate Change, which produced the “Kyoto Protocol” (an internationally applied protocol, which has been ratified in Colombia, which is a location where we provide drilling services) in 1992. More recently, in December 2015, 195 countries adopted under the Framework Convention a resolution known as the “Paris Agreement” to reduce emissions of greenhouse gases with a goal of limiting global warming to below 2 °C (3.6 °F). The Paris Agreement does not establish enforceable emissions reduction targets, but countries may establish greenhouse gas reduction measures pursuant to the agreement. The agreement went into effect in November 2016. The United States ratified the Paris Agreement in September 2016. It has since notified the United Nations of its intent to withdraw from the Paris Agreement, but under the terms of the agreement the U.S. will remain a party until approximately August 2020.
In addition, the U.S. Congress has from time to time considered legislation to reduce emissions of greenhouse gases, primarily through the development of greenhouse gas cap and trade programs. Also, more than one-third of the states already have begun implementing legal measures to reduce emissions of greenhouse gases. There have been two multi-state organizations devoted to climate action. The Regional Greenhouse Gas Initiative (RGGI) is located in the Northeastern and Mid-Atlantic United States. The Western Regional Climate Action Initiative once included multiple U.S. states and much of Canada but is now comprised of California, British Columbia, Manitoba, Ontario, and Quebec.
In 2007, the United States Supreme Court, in Massachusetts, et al. v. EPA, held that carbon dioxide may be regulated as an “air pollutant” under the federal Clean Air Act. In December 2009, the EPA responded to this decision and issued a finding that the current and projected concentrations of greenhouse gases in the atmosphere threaten the public health and welfare of current and future generations, and that certain greenhouse gases from motor vehicles contribute to the atmospheric concentrations of greenhouse gases and hence to the threat of climate change.
Based on these findings, in 2010 the EPA adopted two sets of regulations that restrict emissions of greenhouse gases under existing provisions of the federal Clean Air Act, including one that requires a reduction in emissions of greenhouse gases from motor vehicles and another that requires certain construction and operating permit reviews for greenhouse gas emissions from certain large stationary sources. In June 2014, the U.S. Supreme Court invalidated elements of the greenhouse gas permitting rule; however, the EPA can still impose certain greenhouse gas control requirements for certain large stationary sources. In addition, the EPA adopted rules requiring the monitoring and reporting of greenhouse gases from certain sources, including, among others, onshore oil and natural gas production facilities.
In April 2012, the EPA issued regulations specifically applicable to the oil and gas industry that require operators to significantly reduce volatile organic compounds, or VOC, emissions from natural gas wells that are hydraulically fractured through the use of “green completions” to capture natural gas that would otherwise escape into the air. The EPA also issued regulations that establish standards for VOC emissions from several types of equipment at natural gas well sites, including storage tanks, compressors, dehydrators and pneumatic controllers.
In August 2015, the EPA finalized rules to limit carbon dioxide emissions from new and existing electric utility generating units. New units must meet specified carbon dioxide emissions limitations. The rules for existing units, known as the “Clean Power Plan,” were to require by 2030 an overall reduction in carbon dioxide emissions of 32% below the amount of carbon dioxide emitted in 2005. Although the EPA proposed repeal of the Clean Power Plan in October and December 2017, on December 28, 2017, the EPA issued an Advance Notice of Proposed Rulemaking soliciting comments on emissions reductions that might be promulgated in place of the Clean Power Plan.
22
In May 2016, the EPA issued a rule to reduce methane (a greenhouse gas) and VOC emissions from additional oil and gas operations. Among other requirements, the rules impose standards for hydraulically fractured oil wells and equipment leaks at oil and gas production sites and extend certain existing standards to downstream oil and gas operations. In April 2017, the EPA granted reconsideration of aspects of this rule.
Although it is not possible at this time to predict whether proposed climate change initiatives will be adopted as initially written, if at all, or how legislation or new regulations that may be adopted to address greenhouse gas emissions would impact our business, any such future laws and regulations could result in increased compliance costs or additional operating restrictions. Any additional costs or operating restrictions associated with legislation or regulations regarding greenhouse gas emissions could have a material adverse effect on our operating results and cash flows. In addition, these developments could curtail the demand for fossil fuels such as oil and gas in areas of the world where our clients operate and thus adversely affect demand for our services, which may in turn adversely affect our future results of operations. Finally, we cannot predict with any certainty whether changes to temperature, storm intensity or precipitation patterns as a result of climate change will have a material impact on our operations.
In addition, our business depends on the demand for land drilling and production services from the oil and gas industry and, therefore, is affected by tax, environmental and other laws relating to the oil and gas industry generally, by changes in those laws and by changes in related administrative regulations. It is possible that these laws and regulations may in the future add significantly to our operating costs or those of our clients, or otherwise directly or indirectly affect our operations.
Our wireline operations involve the use of radioactive isotopes along with other nuclear, electrical, acoustic, and mechanical devices. Our activities involving the use of isotopes are regulated by the U.S. Nuclear Regulatory Commission and specified agencies of certain states. Additionally, we use high explosive charges for perforating casing and formations, and we use various explosive cutters to assist in wellbore cleanout. Such operations are regulated by the U.S. Department of Justice, Bureau of Alcohol, Tobacco, Firearms, and Explosives and require us to obtain licenses or other approvals for the use of densitometers as well as explosive charges. We have obtained these licenses and approvals when necessary and believe that we are in substantial compliance with these federal requirements.
Transportation. Among the services we provide, we operate as a motor carrier for the transportation of our own equipment and therefore are subject to regulation by the U.S. Department of Transportation and by various state agencies. These regulatory authorities exercise broad powers, governing activities such as the authorization to engage in motor carrier operations and regulatory safety. There are additional regulations specifically relating to the trucking industry, including testing and specification of equipment and product handling requirements. The trucking industry is subject to possible regulatory and legislative changes that may affect the economics of the industry by requiring changes in operating practices or by changing the demand for common or contract carrier services or the cost of providing truckload services. Some of these possible changes include increasingly stringent environmental regulations, changes in the hours of service regulations which govern the amount of time a driver may drive in any specific period, onboard black box recorder devices or limits on vehicle weight and size.
Interstate motor carrier operations are subject to safety requirements prescribed by the U.S. Department of Transportation. To a large degree, intrastate motor carrier operations are subject to state safety regulations that mirror federal regulations. Such matters as weight and dimension of equipment are also subject to federal and state regulations.
From time to time, various legislative proposals are introduced, including proposals to increase federal, state, or local taxes, including taxes on motor fuels, which may increase our costs or adversely impact the recruitment of drivers. We cannot predict whether, or in what form, any increase in such taxes applicable to us will be enacted.
• | Federal and state legislative and regulatory initiatives related to hydraulic fracturing could result in operating restrictions or delays in the completion of oil and natural gas wells that may reduce demand for our drilling and well servicing activities and could adversely affect our financial position, results of operations and cash flows. |
Hydraulic fracturing is a commonly used process that involves injection of water, sand, and a minor amount of certain chemicals to fracture the hydrocarbon-bearing rock formation to allow flow of hydrocarbons into the wellbore. Federal agencies have adopted new rules, such as the Bureau of Land Management’s (BLM) hydraulic fracturing rule finalized in March 2015, that impose additional requirements on the practice of hydraulic fracturing. In December 2017, the BLM rescinded this rule, but there may be litigation to reinstate the rule. In October 2016, the BLM updated its rules to restrict flaring associated with the development of oil and natural gas on public lands, including through hydraulic fracturing. Portions of the rule have been suspended until January 2019, but there may be litigation to reinstate the rule.
23
Additional federal regulations may also be developed. Several states are considering legislation to regulate hydraulic fracturing practices that could impose more stringent permitting, transparency, and well construction requirements on hydraulic-fracturing operations or otherwise seek to ban fracturing activities altogether. Hydraulic fracturing of wells and subsurface water disposal are also under public and governmental scrutiny due to concerns regarding potential environmental and physical impacts, including groundwater and drinking water impacts, as well as whether such activities may cause earthquakes.
The federal Energy Policy Act of 2005 amended the Underground Injection Control provisions of the federal Safe Drinking Water Act (SDWA) to exclude certain hydraulic fracturing practices from the definition of “underground injection.” The EPA has asserted regulatory authority over certain hydraulic fracturing activities involving diesel fuel and has developed guidance relating to such practices. In addition, repeal of the SDWA exclusion of hydraulic fracturing has been advocated by certain advocacy organizations and others in the public. Congress has from time to time considered legislation to repeal the exemption for hydraulic fracturing from the SDWA, which would have the effect of allowing the EPA to promulgate new regulations and permitting requirements for hydraulic fracturing, and to require the disclosure of the chemical constituents of hydraulic fracturing fluids to a regulatory agency, which would make the information public via the Internet. For example, in May 2014, the EPA responded to a petition by environmental groups by issuing an Advanced Notice of Proposed Rulemaking to solicit input regarding whether the agency should require manufacturers and processors of hydraulic fracturing chemicals to report composition and usage of such chemicals and to disclose associated health and safety studies.
Scrutiny of hydraulic fracturing activities continues in other ways, with the EPA having completed a multi-year study of the potential environmental impacts of hydraulic fracturing. The Final Report issued by the EPA in December 2016 concluded that hydraulic fracturing activities can impact drinking water resources under some circumstances and identified conditions under which impacts can be more frequent or severe. In addition, in April 2012, the EPA issued the first federal air standards for natural gas wells that are hydraulically fractured, which require operators to significantly reduce VOC emissions through the use of “green completions” to capture natural gas that would otherwise escape into the air. These new rules address emissions of various pollutants frequently associated with oil and natural gas production and processing activities by, among other things, requiring new or reworked hydraulically-fractured gas wells to control emissions through flaring or reduced emission (or “green”) completions. The rules also establish specific new requirements, which were effective in 2012, for emissions from compressors, controllers, dehydrators, storage tanks, gas processing plants, and certain other equipment. The EPA has amended these rules several times. In May 2016, the EPA finalized a rule to reduce methane (a greenhouse gas) and VOC emissions from oil and gas operations. It is also possible that the EPA will further amend its oil and gas regulations. These rules may require a number of modifications to our clients’ and our own operations, including the installation of new equipment to control emissions. Compliance with such rules could result in additional costs for us and our clients, including increased capital expenditures and operating costs, which may adversely impact our cash flows and results of operations.
The EPA has also developed effluent limitations for the treatment and discharge of wastewater resulting from hydraulic fracturing activities to publicly owned treatment works (POTW). The agency’s final regulations, published on June 28, 2016, prohibited any discharge of wastewater pollutants from onshore unconventional oil and gas extraction facilities to a POTW. The EPA will also be assessing whether oil and gas wastes should continue to be exempt from being considered hazardous waste under the federal Resource Conservation and Recovery Act, pursuant to a Consent Decree with environmental groups approved in federal court in December 2016. The U.S. Department of the Interior has also finalized regulations relating to the use of hydraulic fracturing techniques on public lands and disclosure of fracturing fluid constituents (i.e. the BLM’s hydraulic fracturing rule issued in March 2015) and has finalized, in October 2016, a rule to reduce flaring and venting associated with oil and gas operations on public lands. The BLM rules have since been rescinded or delayed, but it is possible that they will be reinstated through litigation.
In addition, some states and localities have adopted, and others are considering adopting, regulations or ordinances that could restrict hydraulic fracturing in certain circumstances, that would require, with some exceptions, disclosure of constituents of hydraulic fracturing fluids, or that would impose higher taxes, fees or royalties on natural gas production. Moreover, public debate over hydraulic fracturing and shale gas production continued to see strong public opposition, and has resulted in delays of well permits in some areas.
In June 2014, the State of New York’s Court of Appeals upheld the right of individual municipalities in the State of New York to ban hydraulic fracturing using zoning restrictions. In December 2014, New York State Governor Cuomo announced that hydraulic fracturing will be permanently banned in the state. Similarly situated municipalities in other states may seek to ban or restrict resource extraction operations within their borders using zoning and/or setback
24
restrictions, which could adversely affect the ability of resource extraction enterprises to operate in certain parts of the country, and thus adversely affect demand for our services, which may in turn adversely affect our future results of operations.
Increased regulation and attention given to the hydraulic fracturing process could lead to greater opposition, including litigation, to oil and gas production activities using hydraulic fracturing techniques. Additional legislation or regulation could also lead to operational delays or increased operating costs in the production of oil and natural gas, including from the developing shale plays, incurred by our clients. The adoption of any federal, state or local laws or the implementation of regulations or ordinances restricting or increasing the costs of hydraulic fracturing could cause a decrease in the completion of new oil and natural gas wells and an associated decrease in demand for our drilling and well servicing activities, any or all of which could adversely affect our financial position, results of operations and cash flows.
• | Our operations are subject to cybersecurity risks. |
Our operations are increasingly dependent on information technologies and services. Threats to information technology systems associated with cybersecurity risks and cyber incidents or attacks continue to grow, and include, among other things, storms and natural disasters, terrorist attacks, utility outages, theft, viruses, malware, design defects, human error, or complications encountered as existing systems are maintained, repaired, replaced, or upgraded. Risks associated with these threats include, among other things:
• | loss, corruption, or misappropriation of intellectual property, or other proprietary or confidential information (including client, supplier, or employee data); |
• | disruption or impairment of our and our customers’ business operations and safety procedures; |
• | loss or damage to our worksite data delivery systems; and |
• | increased costs to prevent, respond to or mitigate cybersecurity events. |
Although we utilize various procedures and controls to mitigate our exposure to such risk, cybersecurity attacks and other cyber events are evolving and unpredictable. Moreover, we do not have control over the information technology systems of our clients, suppliers, and others with which our systems may connect and communicate. As a result, the occurrence of a cyber incident could go unnoticed for a period time. Any such incident could have a material adverse effect on our business, financial condition and results of operations.
• | Our ability to use our net operating loss and tax credit carryforwards might be limited. |
Section 382 of the U.S. Internal Revenue Code contains rules that limit the ability of a company that undergoes an ownership change to utilize its net operating losses and tax credit carryforwards existing as of the date of such ownership change. Under the rules, such an ownership change is generally any change in ownership of more than 50% of a company’s stock within a rolling three-year period. The rules generally operate by focusing on changes in ownership among shareholders owning, directly or indirectly, 5% or more of the stock of a company and any change in ownership arising from new issuances of stock by the company.
If we were to undergo one or more “ownership changes” as defined by Section 382, our net operating losses and certain of our tax credits existing as of the date of each ownership change may be unavailable, in whole or in part, to offset U.S. federal income tax resulting from our operations or any gains from the disposition of any of our assets and/or business, which could result in increased U.S. federal income tax liability.
Risks Relating to Our Capitalization and Organizational Documents
• | We do not intend to pay dividends on our common stock in the foreseeable future, and therefore only appreciation of the price of our common stock will provide a return to our shareholders. |
We have not paid or declared any dividends on our common stock and currently intend to retain any earnings to fund our working capital needs, reduce debt and fund growth opportunities. Any future dividends will be at the discretion of our board of directors after taking into account various factors it deems relevant, including our financial condition and performance, cash needs, income tax consequences and restrictions imposed by the Texas Business Organizations Code and other applicable laws and by our Term Loan, ABL Facility, and Senior Notes. Our debt arrangements include provisions that generally prohibit us from paying dividends on our capital stock, including our common stock.
25
• | We may issue preferred stock whose terms could adversely affect the voting power or value of our common stock. |
Our articles of incorporation authorize us to issue, without the approval of our shareholders, one or more classes or series of preferred stock having such designations, preferences, limitations and relative rights, including preferences over our common stock respecting dividends and distributions, as our board of directors may determine; however, our issuance of preferred stock is subject to the limitations imposed on us by our ABL Facility and Senior Notes. The terms of one or more classes or series of preferred stock could adversely impact the voting power or value of our common stock. For example, we might grant holders of preferred stock the right to elect some number of our directors in all events or on the happening of specified events or the right to veto specified transactions. Similarly, the repurchase or redemption rights or liquidation preferences we might assign to holders of preferred stock could affect the residual value of the common stock.
• | Provisions in our organizational documents could delay or prevent a change in control of our company even if that change would be beneficial to our shareholders. |
The existence of some provisions in our organizational documents could delay or prevent a change in control of our company even if that change would be beneficial to our shareholders. Our articles of incorporation and bylaws contain provisions that may make acquiring control of our company difficult, including:
• | provisions regulating the ability of our shareholders to nominate candidates for election as directors or to bring matters for action at annual meetings of our shareholders; |
• | limitations on the ability of our shareholders to call a special meeting and act by written consent; |
• | provisions dividing our board of directors into three classes elected for staggered terms; and |
• | the authorization given to our board of directors to issue and set the terms of preferred stock. |
ITEM 1B. | UNRESOLVED STAFF COMMENTS |
Not applicable.
ITEM 2. | PROPERTIES |
For a description of our significant properties, see “Business—General” and “Business—Facilities” in Item 1 of this report. We believe that we have sufficient properties to conduct our operations and that our significant properties are suitable for their intended use.
ITEM 3. | LEGAL PROCEEDINGS |
Due to the nature of our business, we are, from time to time, involved in routine litigation or subject to disputes or claims related to our business activities, including workers’ compensation claims and employment-related disputes. In the opinion of our management, none of the pending litigation, disputes or claims against us will have a material adverse effect on our financial condition or results of operations.
ITEM 4. | MINE SAFETY DISCLOSURES |
Not applicable.
26
PART II
ITEM 5. | MARKET FOR REGISTRANT’S COMMON EQUITY, RELATED SHAREHOLDER MATTERS AND ISSUER PURCHASES OF EQUITY SECURITIES |
As of January 31, 2018, 77,794,527 shares of our common stock were outstanding, held by 300 shareholders of record. The number of record holders does not necessarily bear any relationship to the number of beneficial owners of our common stock.
Our common stock trades on the New York Stock Exchange under the symbol “PES.” The following table sets forth, for each of the periods indicated, the high and low sales prices per share:
Low | High | ||||||
Year ended December 31, 2017 | |||||||
First Quarter | $ | 3.65 | $ | 7.20 | |||
Second Quarter | 1.70 | 4.50 | |||||
Third Quarter | 1.60 | 2.65 | |||||
Fourth Quarter | 1.70 | 3.20 | |||||
Year ended December 31, 2016 | |||||||
First Quarter | $ | 0.95 | $ | 2.46 | |||
Second Quarter | 1.98 | 5.05 | |||||
Third Quarter | 2.64 | 4.89 | |||||
Fourth Quarter | 3.35 | 7.15 | |||||
The last reported sales price for our common stock on the New York Stock Exchange on January 31, 2018 was $3.25 per share.
We have not paid or declared any dividends on our common stock and currently intend to retain earnings to fund our working capital needs and growth opportunities. Any future dividends will be at the discretion of our board of directors after taking into account various factors it deems relevant, including our financial condition and performance, cash needs, income tax consequences and the restrictions imposed by the Texas Business Organizations Code and other applicable laws and our Term Loan, ABL Facility, and Senior Notes. Our debt arrangements include provisions that generally prohibit us from paying dividends on our capital stock.
We did not make any unregistered sales of equity securities during the quarter ended December 31, 2017. No shares of our common stock were purchased by or on behalf of our company or any affiliated purchaser during the quarter ended December 31, 2017.
27
Performance Graph
The following graph compares, for the periods from December 31, 2012 to December 31, 2017, the cumulative total shareholder return on our common stock with the cumulative total return on the companies that comprise the NYSE Composite Index and a peer group index that includes five companies that provide contract drilling services and/or production services.
The companies that comprise the peer group index are Patterson-UTI Energy, Inc., Nabors Industries Ltd., Basic Energy Services, Inc., Key Energy Services and Precision Drilling Corporation, and have been weighted according to each company’s stock market capitalization. Two of the companies in the peer group, Basic Energy Services, Inc. and Key Energy Services, filed for bankruptcy protection in 2016 under Chapter 11 of the United States Bankruptcy Code, which significantly decreased the market capitalization of these peers, as well as their impact on the total return calculated for the peer group.
The comparison assumes that $100 was invested on December 31, 2012 in our common stock, the companies that compose the NYSE Composite Index and the peer group index, and further assumes all dividends were reinvested.
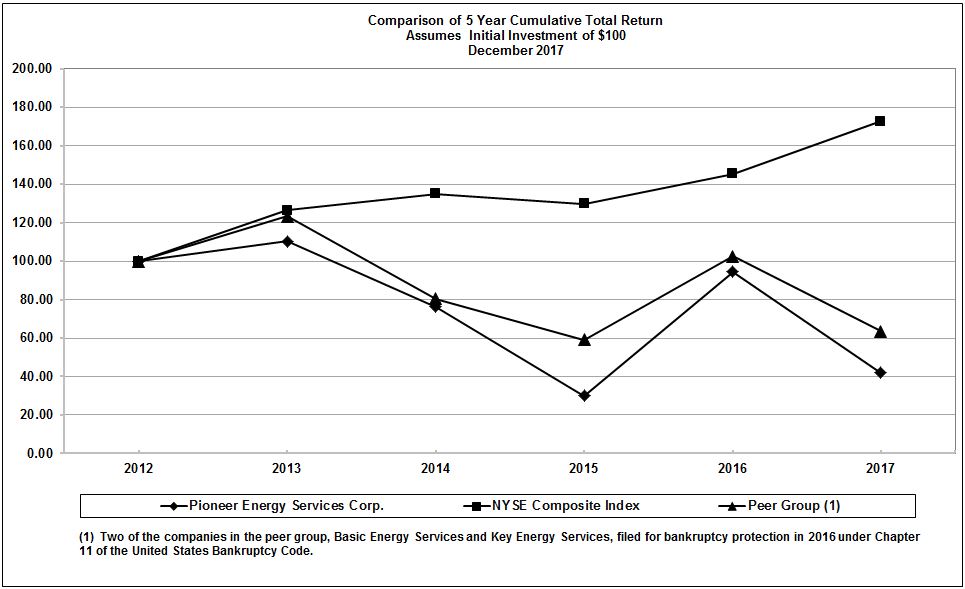
28
ITEM 6. | SELECTED FINANCIAL DATA |
The following information derives from our audited financial statements. This information should be reviewed in conjunction with “Management’s Discussion and Analysis of Financial Condition and Results of Operations” in Item 7 of this report and the financial statements and related notes this report contains.
Year ended December 31, | |||||||||||||||||||
2017 | 2016 | 2015 | 2014 | 2013 | |||||||||||||||
(In thousands, except per share amounts) | |||||||||||||||||||
Statement of Operations Data (1) | |||||||||||||||||||
Revenues | $ | 446,455 | $ | 277,076 | $ | 540,778 | $ | 1,055,223 | $ | 960,186 | |||||||||
Income (loss) from operations | (51,230 | ) | (113,448 | ) | (166,700 | ) | 23,984 | (6,229 | ) | ||||||||||
Income (loss) before income taxes | (79,321 | ) | (139,123 | ) | (192,719 | ) | (49,322 | ) | (55,778 | ) | |||||||||
Net earnings (loss) applicable to common shareholders | (75,118 | ) | (128,391 | ) | (155,140 | ) | (38,018 | ) | (35,932 | ) | |||||||||
Earnings (loss) per common share-basic | $ | (0.97 | ) | $ | (1.96 | ) | $ | (2.41 | ) | $ | (0.60 | ) | $ | (0.58 | ) | ||||
Earnings (loss) per common share-diluted | $ | (0.97 | ) | $ | (1.96 | ) | $ | (2.41 | ) | $ | (0.60 | ) | $ | (0.58 | ) | ||||
Other Financial Data (1) | |||||||||||||||||||
Net cash provided by (used in) operating activities | $ | (5,817 | ) | $ | 5,131 | $ | 142,719 | $ | 233,041 | $ | 174,580 | ||||||||
Net cash used in investing activities | (47,364 | ) | (24,767 | ) | (101,656 | ) | (151,918 | ) | (150,676 | ) | |||||||||
Net cash provided by (used in) financing activities | 118,635 | 15,670 | (61,827 | ) | (73,584 | ) | (20,252 | ) | |||||||||||
Capital expenditures | 61,447 | 32,556 | 142,907 | 188,121 | 125,420 | ||||||||||||||
As of December 31, | |||||||||||||||||||
2017 | 2016 | 2015 | 2014 | 2013 | |||||||||||||||
(In thousands) | |||||||||||||||||||
Balance Sheet Data: | |||||||||||||||||||
Working capital | $ | 130,645 | $ | 47,994 | $ | 45,226 | $ | 121,882 | $ | 118,547 | |||||||||
Property and equipment, net | 549,623 | 584,080 | 702,585 | 856,541 | 937,657 | ||||||||||||||
Long-term debt, excluding current portion, debt issuance costs and discount | 475,000 | 346,000 | 395,000 | 455,053 | 499,666 | ||||||||||||||
Shareholders’ equity | 210,096 | 281,398 | 342,643 | 495,064 | 518,433 | ||||||||||||||
Total assets | 766,869 | 700,102 | 821,975 | 1,171,589 | 1,229,623 | ||||||||||||||
(1) | The statement of operations and other financial data reflect the impact of impairment charges as follows: |
Year ended December 31, | |||||||||||||||||||
2017 | 2016 | 2015 | 2014 | 2013 | |||||||||||||||
(In thousands) | |||||||||||||||||||
Property and equipment | $ | 1,902 | $ | 12,815 | $ | 114,813 | $ | 73,025 | $ | 9,492 | |||||||||
Intangible assets | — | — | 14,339 | — | 3,100 | ||||||||||||||
Goodwill | — | — | — | — | 41,700 | ||||||||||||||
29
ITEM 7. | MANAGEMENT’S DISCUSSION AND ANALYSIS OF FINANCIAL CONDITION AND RESULTS OF OPERATIONS |
Statements we make in the following discussion that express a belief, expectation or intention, as well as those that are not historical fact, are forward-looking statements that are subject to risks, uncertainties and assumptions. Our actual results, performance or achievements, or industry results, could differ materially from those we express in the following discussion as a result of a variety of factors, including general economic and business conditions and industry trends, levels and volatility of oil and gas prices, the continued demand for drilling services or production services in the geographic areas where we operate, decisions about exploration and development projects to be made by oil and gas exploration and production companies, the highly competitive nature of our business, technological advancements and trends in our industry and improvements in our competitors' equipment, the loss of one or more of our major clients or a decrease in their demand for our services, future compliance with covenants under debt agreements, including our senior secured term loan, our senior secured revolving asset-based credit facility, and our senior notes, operating hazards inherent in our operations, the supply of marketable drilling rigs, well servicing rigs, coiled tubing units and wireline units within the industry, the continued availability of new components for drilling rigs, well servicing rigs, coiled tubing units and wireline units, the continued availability of qualified personnel, the success or failure of our acquisition strategy, including our ability to finance acquisitions, manage growth and effectively integrate acquisitions, the political, economic, regulatory and other uncertainties encountered by our operations, and changes in, or our failure or inability to comply with, governmental regulations, including those relating to the environment. We have discussed many of these factors in more detail elsewhere in this report, including under the headings “Special Note Regarding Forward-Looking Statements” in the Introductory Note to Part I and “Risk Factors” in Item 1A. These factors are not necessarily all the important factors that could affect us. Other unpredictable or unknown factors could also have material adverse effects on actual results of matters that are the subject of our forward-looking statements. All forward-looking statements speak only as of the date on which they are made and we undertake no obligation to publicly update or revise any forward-looking statements whether as a result of new information, future events or otherwise. We advise our shareholders that they should (1) recognize that important factors not referred to above could affect the accuracy of our forward-looking statements and (2) use caution and common sense when considering our forward-looking statements.
Company Overview
Pioneer Energy Services Corp. provides land-based drilling services and production services to a diverse group of oil and gas exploration and production companies in the United States and internationally in Colombia. We also provide two of our services (coiled tubing and wireline services) offshore in the Gulf of Mexico. Drilling services and production services are fundamental to establishing and maintaining the flow of oil and natural gas throughout the productive life of a well.
Business Segments
Our business is comprised of two business lines — Drilling Services and Production Services. We report our Drilling Services business as two reportable segments: (i) Domestic Drilling and (ii) International Drilling. We report our Production Services business as three reportable segments: (i) Well Servicing, (ii) Wireline Services, and (iii) Coiled Tubing Services. We revised our reportable business segments as of the fourth quarter of 2017 to reflect changes in the basis used by management in making decisions regarding our business for resource allocation and performance assessment. Financial information about our operating segments is included in Note 10, Segment Information, of the Notes to Consolidated Financial Statements, included in Part II, Item 8, Financial Statements and Supplementary Data, of this Annual Report on Form 10-K.
• | Drilling Services— Our current drilling rig fleet is 100% pad-capable and offers the latest advancements in pad drilling. We have 16 AC rigs in the US and eight SCR rigs in Colombia, all of which have 1,500 horsepower or greater drawworks. In addition to our drilling rigs, we provide the drilling crews and most of the ancillary equipment needed to operate our drilling rigs. |
30
The drilling rigs in our fleet are currently deployed through our division offices in the following regions:
Rig Count | |||
Domestic drilling | |||
Marcellus/Utica | 6 | ||
Eagle Ford | 1 | ||
Permian Basin | 7 | ||
Bakken | 2 | ||
International drilling | 8 | ||
24 | |||
• | Production Services— Our production services business segments provide a range of well, wireline and coiled tubing services to a diverse group of exploration and production companies, with our operations concentrated in the major domestic onshore oil and gas producing regions in the Mid-Continent and Rocky Mountain states and in the Gulf Coast, both onshore and offshore. |
As of December 31, 2017, the fleet count and composition for each of our production services business segments is as follows:
550 HP | 600 HP | Total | ||||
Well servicing rigs, by horsepower (HP) rating | 113 | 12 | 125 | |||
Offshore | Onshore | Total | ||||
Wireline services units | 4 | 108 | 112 | |||
Coiled tubing services units | 4 | 10 | 14 | |||
Market Conditions in Our Industry
Industry Overview — Demand for oilfield services offered by our industry is a function of our clients’ willingness to make operating expenditures and capital expenditures to explore for, develop and produce hydrocarbons, which is primarily driven by current and expected oil and natural gas prices.
Our business is influenced substantially by exploration and production companies’ spending that is generally categorized as either a capital expenditure or an operating expenditure. Capital expenditures for the drilling and completion of exploratory and development wells in proven areas are more directly influenced by current and expected oil and natural gas prices and generally reflect the volatility of commodity prices. In contrast, operating expenditures for the maintenance of existing wells, for which a range of production services are required in order to maintain production, are relatively more stable and predictable.
Drilling and production services have historically trended similarly in response to fluctuations in commodity prices. However, because exploration and production companies often adjust their budgets for exploration and development drilling first in response to a shift in commodity prices, the demand for drilling services is generally impacted first and to a greater extent than the demand for production services which is more dependent on ongoing expenditures that are necessary to maintain production. Additionally, within the range of production services businesses, those that derive more revenue from production related activity, as opposed to completion of new wells, tend to be less affected by fluctuations in commodity prices and temporary reductions in industry activity.
However, in a severe downturn that is prolonged, both operating and capital expenditures are significantly reduced, and the demand for all our service offerings is significantly impacted. After a prolonged downturn, among the production services, the demand for completion-oriented services generally improves first, as exploration and production companies begin to complete wells that were previously drilled but not completed during the downturn, and to complete newly drilled wells as the demand for drilling services improves during recovery.
For additional information concerning the effects of the volatility in oil and gas prices and the effects of technological advancements and trends in our industry, see Item 1A – “Risk Factors” in Part I of this Annual Report on Form 10-K.
31
Market Conditions — Our industry experienced a severe down cycle that began in late 2014 and which persisted through 2016 with WTI oil prices that dipped below $30 in early 2016. A modest recovery in commodity prices began in the latter half of 2016 which continued through 2017, with average oil prices during the last quarter of 2017 averaging approximately $55 per barrel.
The trends in spot prices of WTI crude oil and Henry Hub natural gas, and the resulting trends in domestic land rig counts (per Baker Hughes) and domestic well servicing rig counts (per Guiberson/Association of Energy Service Companies) over the last three years are illustrated in the graphs below.
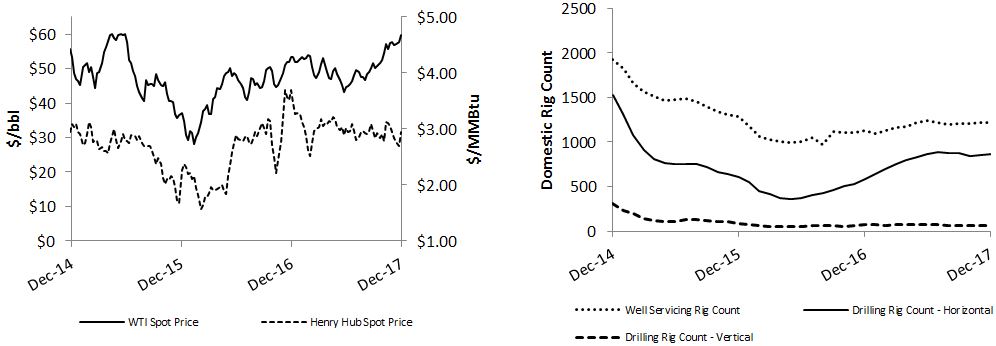
The trends in commodity pricing and domestic rig counts over the last 12 months are illustrated below:
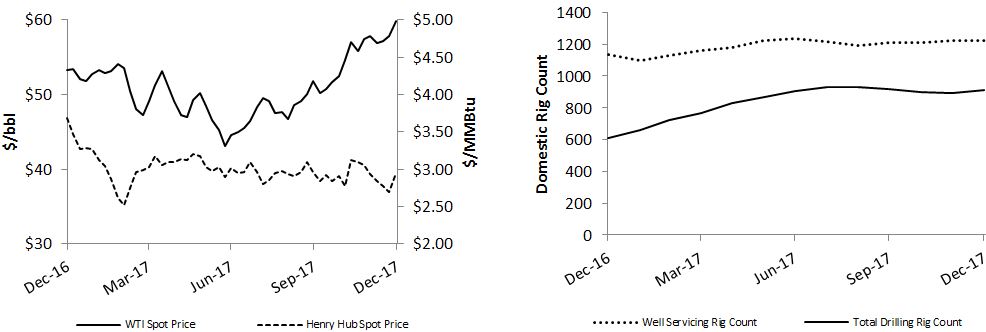
With the increases in commodity prices that began in late 2016, we experienced a resulting increase in activity and revenue rates for our services during 2017.
Our well servicing rig hours, number of wireline jobs completed, and coiled tubing revenue days during the quarter ended December 31, 2017 increased by 2%, 11%, and 27%, respectively, as compared to the fourth quarter of 2016, while average revenues for services performed (on a per hour, job and day basis, respectively) during this same period increased as well, largely due to an increase in the proportion of the work performed attributable to completion-related activity and larger diameter coiled tubing services.
A year ago, the utilization of our AC fleet was 81% and there were four rigs earning revenues in Colombia. Since then, all of our idle domestic rigs have been placed on new contracts and the current utilization of our AC rig fleet is 100%. Of the eight rigs in Colombia, six are earning revenues, five of which are under term contracts. The term contracts in Colombia are cancelable by our clients without penalty, although the contract would still require payment for demobilization services and requires 30 days notice. We are actively marketing our idle drilling rigs in Colombia to various operators and we are evaluating other options, including the possibility of the sale of some or all of our assets in Colombia.
32
As of December 31, 2017, 22 of our 24 drilling rigs are earning revenues, 19 of which are under term contracts which if not canceled or renewed prior to the end of their terms, will expire as follows:
Spot Market Contracts | Term Contract Expiration by Period | |||||||||||||||||||
Total Term Contracts | Within 6 Months | 6 Months to 1 Year | 1 Year to 18 Months | 18 Months to 2 Years | 2 to 4 Years | |||||||||||||||
Domestic rigs | 2 | 14 | 4 | 8 | 1 | 1 | — | |||||||||||||
International rigs | 1 | 5 | — | 2 | 1 | 1 | 1 | |||||||||||||
3 | 19 | 4 | 10 | 2 | 2 | 1 | ||||||||||||||
Absent a significant decline in commodity prices, we expect continued improvement in activity and pricing during 2018. Although we expect a highly competitive environment will continue in 2018, we believe our high-quality equipment, services and safety record make us well positioned to compete.
Liquidity and Capital Resources
Sources of Capital Resources
Our principal sources of liquidity currently consist of:
• | cash and cash equivalents ($73.6 million as of December 31, 2017); |
• | cash generated from operations; |
• | proceeds from sales of certain non-strategic assets; and |
• | the unused portion of our asset-based lending facility (the “ABL Facility”). |
Senior Secured Term Loan — Our senior secured term loan (the “Term Loan”) entered into on November 8, 2017 provided for one drawing in the amount of $175 million, net of a 2% original issue discount. Proceeds from the issuance of the Term Loan were used to repay the entire outstanding balance under our Revolving Credit Facility, plus fees and accrued and unpaid interest, as well as the fees and expenses associated with entering into the Term Loan and ABL Facility, which is further described below. The remainder of the proceeds are available to be used for other general corporate purposes. The Term Loan is set to mature on November 8, 2022, or earlier, subject to certain circumstances as described in the agreement, and including an earlier maturity date if the outstanding balance of the Senior Notes exceeds $15.0 million on December 14, 2021, at which time the Term Loan would then mature. The Term Loan contains certain covenants which are described in more detail in the Debt Compliance Requirements section below.
Asset-based Lending Facility — In addition to entering into the Term Loan, on November 8, 2017, we also entered into a senior secured revolving asset-based credit facility (the “ABL Facility”) providing for borrowings in the aggregate principal amount of up to $75 million, subject to a borrowing base and including a $30 million sub-limit for letters of credit. The ABL Facility bears interest, at our option, at the LIBOR rate or the base rate as defined in the ABL Facility, plus an applicable margin ranging from 1.75% to 3.25%, based on average availability on the ABL Facility. The ABL Facility is generally set to mature 90 days prior to the maturity of the Term Loan, subject to certain circumstances, including the future repayment, extinguishment or refinancing of our Term Loan and/or Senior Notes prior to their respective maturity dates. We have not drawn upon the ABL Facility to date. As of December 31, 2017, we had $9.7 million in committed letters of credit, which, after borrowing base limitations, resulted in borrowing availability of $53.1 million. Borrowings available under the ABL Facility are available for general corporate purposes and there are no limitations on our ability to access the borrowing capacity provided there is no default and compliance with the covenants under the ABL Facility is maintained. Additional information regarding these covenants is provided in the Debt Compliance Requirements section below.
Shelf Registration Statement — In the future, we may also consider equity and/or debt offerings, as appropriate, to meet our liquidity needs. On May 15, 2015, we filed a registration statement that permits us to sell equity or debt in one or more offerings up to a total dollar amount of $300 million. As of December 31, 2017, $234.6 million under the shelf registration statement is available for equity or debt offerings, subject to the limitations imposed by our Term Loan, ABL Facility and Senior Notes.
We currently expect that cash and cash equivalents, cash generated from operations, proceeds from sales of certain non-strategic assets, and available borrowings under our ABL Facility are adequate to cover our liquidity requirements for at least the next 12 months.
33
Uses of Capital Resources
For the years ended December 31, 2017 and 2016, our primary uses of capital resources were for property and equipment additions, which consisted of the following (amounts in thousands):
Year ended December 31, | |||||||
2017 | 2016 | ||||||
Drilling services business: | |||||||
Routine | $ | 16,793 | $ | 4,948 | |||
Discretionary | 4,010 | 2,454 | |||||
Fleet additions and major components | 7,337 | 12,464 | |||||
28,140 | 19,866 | ||||||
Production services business: | |||||||
Routine | 13,185 | 8,259 | |||||
Discretionary | 7,826 | 4,256 | |||||
Fleet additions | 14,126 | — | |||||
35,137 | 12,515 | ||||||
Net cash used for purchases of property and equipment | 63,277 | 32,381 | |||||
Net impact of accruals | (1,830 | ) | 175 | ||||
Total capital expenditures | $ | 61,447 | $ | 32,556 | |||
In 2016, we lowered our capital expenditures by 77% from the prior year, limiting our capital spending to primarily routine expenditures to maintain our equipment and deferring discretionary upgrades and additions except those that we committed to in 2014 before the market slowdown. In 2017, we maintained capital discipline by limiting our capital spending to primarily routine expenditures while also engaging in select asset acquisitions to optimize our production services fleets, including the exchange of 20 older well servicing rigs for 20 new-model rigs, the purchase of seven new wireline units, and installments on one coiled tubing unit. Routine expenditures in 2017 primarily included refurbishments and start-up costs to redeploy assets that had been idle, including two drilling rigs in Colombia.
Currently, we expect to spend approximately $55 million on capital expenditures during 2018, which we expect will be allocated approximately 35% for our drilling services business segments and approximately 65% for our production services business segments. Our total planned capital expenditures include $15 million of discretionary spending for the purchase of one large-diameter coiled tubing unit and remaining payments on three wireline units, two of which were delivered in January, and additional drilling and production services equipment. Actual capital expenditures may vary depending on the climate of our industry and any resulting increase or decrease in activity levels, the timing of commitments and payments, and the level of rig build and other expansion opportunities that meet our strategic and return on capital employed criteria. We expect to fund the capital expenditures in 2018 from operating cash flow in excess of our working capital requirements, proceeds from sales of certain non-strategic assets, remaining proceeds from our Term Loan issuance, and from available borrowings under our ABL Facility, if necessary.
Working Capital — Our working capital was $130.6 million at December 31, 2017, compared to $48.0 million at December 31, 2016. Our current ratio, which we calculate by dividing current assets by current liabilities, was 2.5 at December 31, 2017, as compared to 1.7 at December 31, 2016.
Our operations have historically generated cash flows sufficient to meet our requirements for debt service and normal capital expenditures. However, our working capital requirements generally increase during periods when rig construction projects are in progress or during periods of expansion in our production services business, at which times we have been more likely to access capital through equity or debt financing. Additionally, our working capital needs may increase in periods of increasing activity following a sustained period of low activity, which is the primary reason for the $5.8 million of net cash used in operating activities during the year ended December 31, 2017. During periods of sustained low activity and pricing, we may access additional capital through the use of available funds under our ABL Facility.
34
The changes in the components of our working capital were as follows (amounts in thousands), and as described below:
December 31, 2017 | December 31, 2016 | Change | |||||||||
Cash and cash equivalents | $ | 73,640 | $ | 10,194 | $ | 63,446 | |||||
Restricted cash | 2,008 | — | 2,008 | ||||||||
Receivables: | |||||||||||
Trade, net of allowance for doubtful accounts | 79,592 | 38,764 | 40,828 | ||||||||
Unbilled receivables | 16,029 | 7,417 | 8,612 | ||||||||
Insurance recoveries | 13,874 | 17,003 | (3,129 | ) | |||||||
Other receivables | 3,510 | 8,939 | (5,429 | ) | |||||||
Inventory | 14,057 | 9,660 | 4,397 | ||||||||
Assets held for sale | 6,620 | 15,093 | (8,473 | ) | |||||||
Prepaid expenses and other current assets | 6,229 | 6,926 | (697 | ) | |||||||
Current assets | 215,559 | 113,996 | 101,563 | ||||||||
Accounts payable | 29,538 | 19,208 | 10,330 | ||||||||
Deferred revenues | 905 | 1,449 | (544 | ) | |||||||
Accrued expenses: | |||||||||||
Payroll and related employee costs | 21,023 | 14,813 | 6,210 | ||||||||
Insurance premiums and deductibles | 6,742 | 6,446 | 296 | ||||||||
Insurance claims and settlements | 13,289 | 13,667 | (378 | ) | |||||||
Interest | 6,624 | 5,395 | 1,229 | ||||||||
Other | 6,793 | 5,024 | 1,769 | ||||||||
Current liabilities | 84,914 | 66,002 | 18,912 | ||||||||
Working capital | $ | 130,645 | $ | 47,994 | $ | 82,651 | |||||
• | Cash and cash equivalents — During 2017, we used $63.3 million of cash for the purchases of property and equipment and used $5.8 million in operating activities, primarily funded by $119.2 million of net borrowings (net of debt issuance costs), $12.6 million of proceeds from the sale of assets, as well as $3.3 million of insurance proceeds received from drilling rig and wireline unit damages. Cash used in operations during 2017 was primarily for increased working capital due to the recent increase in activity. |
• | Restricted cash — Our restricted cash balance at December 31, 2017 reflects the portion of net proceeds from the issuance of our Term Loan which are currently held in a restricted account until the completion of certain administrative tasks related to providing access rights to certain of our real property, which we expect to complete within 12 months. Accordingly, the related restricted cash is presented as current in the accompanying consolidated balance sheets. |
• | Trade and unbilled receivables — The net increase in our total trade and unbilled receivables during 2017 is primarily due to the 77% increase in our revenues during the quarter ended December 31, 2017, as compared to the quarter ended December 31, 2016, as well as the timing of billing and collection cycles for long-term drilling contracts in Colombia. Our domestic trade receivables generally turn over within 90 days, and our Colombian trade receivables generally turn over within 120 days, which can take more time when setting up the billing process with new clients. |
• | Insurance recoveries — The decrease in our insurance recoveries receivables during 2017 is primarily due to an insurance claim receivable of $3.1 million for a drilling rig that was damaged during 2016, for which the proceeds were received in early 2017. |
• | Other receivables — The decrease in other receivables during 2017 is primarily due to the sale of two drilling rigs in December 2016, for which the proceeds of $6.3 million were received in January 2017. This decrease is partially offset by an increase in net income tax receivables for Colombia as well as $0.6 million remaining of a short-term note receivable from the sales of two mechanical drilling rigs that were sold during the third quarter of 2017. |
• | Inventory — The increase in inventory during 2017 is primarily due to the increase in activity for our Colombian operations, as well as purchases of supplies and job materials for our wireline and coiled tubing operations. |
35
• | Assets held for sale — As of December 31, 2017, our consolidated balance sheet reflects assets held for sale of $6.6 million, which primarily represents the fair value of three domestic SCR drilling rigs and one domestic mechanical drilling rig, as well as other drilling equipment, two wireline units and one coiled tubing unit and spare equipment. The decrease in assets held for sale as of December 31, 2017, when comparing to December 31, 2016, is primarily due to 20 older well servicing rigs that were designated as held for sale that were traded in for 20 new-model rigs in the first quarter of 2017, as well as the sale of two mechanical drilling rigs and 13 wireline units. |
• | Prepaid expenses and other current assets — The decrease in prepaid expenses and other current assets during 2017 is primarily due to the amortization of mobilization costs for several domestic and international drilling rigs which were mobilized under new contracts in late 2016 and early 2017. For more information about rig mobilization service revenues and costs, see Note 1, Organization and Summary of Significant Accounting Policies, of the Notes to Consolidated Financial Statements, included in Part II, Item 8, Financial Statements and Supplementary Data, of this Annual Report on Form 10-K. |
• | Accounts payable — Our accounts payable generally turn over within 90 days. The increase in accounts payable during 2017 is primarily due to the 64% increase in our operating costs for the quarter ended December 31, 2017 as compared to the quarter ended December 31, 2016, resulting from an increase in activity, and partially offset by a decrease of $1.8 million in our accruals for capital expenditures. |
• | Accrued payroll and related employee costs — The increase in accrued payroll and related employee costs during 2017 is primarily due to an increase in the accrual for our 2017 annual bonuses due to improved company performance, as well as an increase in accrued salaries and wages due to a 25% increase in headcount during 2017 to accommodate the increased demand for our services. |
• | Accrued interest — The increase in accrued interest expense during 2017 is primarily due to increased amount of debt outstanding as a result of the issuance of our Term Loan, from which a portion of the proceeds were used to repay and retire our Revolving Credit Facility, and for which interest incurs at a higher rate. |
• | Other accrued expenses —The increase in other accrued expenses during 2017 is primarily due to an increase in our accrued liability for value-added tax obligations (“VAT”) in Colombia as a result of an increase in activity in 2017. |
Debt and Other Contractual Obligations — The following table includes information about the amount and timing of our contractual obligations at December 31, 2017 (amounts in thousands):
Payments Due by Period | |||||||||||||||||||
Contractual Obligations | Total | Within 1 Year | 2 to 3 Years | 4 to 5 Years | Beyond 5 Years | ||||||||||||||
Debt | $ | 475,000 | $ | — | $ | — | $ | 475,000 | $ | — | |||||||||
Interest on debt | 144,899 | 34,108 | 68,215 | 42,576 | — | ||||||||||||||
Purchase commitments | 8,170 | 8,170 | — | — | — | ||||||||||||||
Operating leases | 9,902 | 3,081 | 3,534 | 1,441 | 1,846 | ||||||||||||||
Incentive compensation | 15,722 | 4,637 | 11,085 | — | — | ||||||||||||||
$ | 653,693 | $ | 49,996 | $ | 82,834 | $ | 519,017 | $ | 1,846 | ||||||||||
• | Debt — Debt obligations at December 31, 2017 consisted of $300 million of principal amount outstanding under our Senior Notes which mature on March 15, 2022 and $175 million of principal amount outstanding under our Term Loan which is expected to mature on December 14, 2021. As of December 31, 2017, we had no debt outstanding under our ABL Facility. |
• | Interest on debt — Interest payment obligations on our Senior Notes are calculated based on the coupon interest rate of 6.125% due semi-annually in arrears on March 15 and September 15 of each year until maturity on March 15, 2022. Interest payment obligations on our Term Loan were estimated based on (1) the 9.0% interest rate that was in effect at December 31, 2017, and (2) the principal balance of $175 million at December 31, 2017, and assuming repayment of the outstanding balance occurs at December 14, 2021. |
• | Purchase commitments — Purchase commitments primarily pertain to deposits on one new coiled tubing unit, which was ordered in the fourth quarter of 2017, remaining installments on three new wireline units that were on order for delivery in 2018, as well as routine capital expenditures and inventory. |
36
• | Operating leases — Our operating leases consist of lease agreements for office space, operating facilities, field personnel housing, and office equipment. |
• | Incentive compensation — Incentive compensation is payable to our employees, generally contingent upon their continued employment through the date of each respective award’s payout. A portion of our long-term incentive compensation is performance-based and therefore the final amount will be determined based on our actual performance relative to a pre-determined peer group over the performance period. |
Debt Compliance Requirements — The following is a summary of our debt compliance requirements including covenants, restrictions and guarantees, all of which are described in more detail in Note 3, Debt, and Note 13, Guarantor/Non-Guarantor Condensed Consolidating Financial Statements, of the Notes to Consolidated Financial Statements, included in Part II, Item 8, Financial Statements and Supplementary Data, of this Annual Report on Form 10-K.
The Term Loan contains a financial covenant requiring the ratio of (i) the net orderly liquidation value of our fixed assets (based on appraisals obtained as required by our lenders), on a consolidated basis, in which the lenders under the Term Loan maintain a first priority security interest, plus proceeds of asset dispositions not required to be used to effect a prepayment of the Term Loan to (ii) the outstanding principal amount of the Term Loan, to be at least equal to 1.50 to 1.00 as of any June 30 or December 31 of any calendar year through maturity. As of December 31, 2017, the asset coverage ratio, as calculated under the Term Loan, was 2.05 to 1.00.
The Term Loan contains customary mandatory prepayments from the proceeds of certain transactions including certain asset dispositions and debt issuances, and has additional customary restrictions that limit our ability to enter into various transactions. In addition, the Term Loan contains customary events of default, upon the occurrence and during the continuation of any of which the applicable margin would increase by 2% per year. Our obligations under the Term Loan are guaranteed by our wholly-owned domestic subsidiaries, and are secured by substantially all of our domestic assets, in each case, subject to certain exceptions and permitted liens.
The ABL Facility also contains customary restrictive covenants which, subject to certain exceptions, limit, among other things, our ability to enter into certain transactions. Additionally, if our availability under the ABL Facility is less than 15% of the maximum amount, we are required to maintain a minimum fixed charge coverage ratio, as defined in the ABL Facility, of at least 1.00 to 1.00, measured on a trailing 12 month basis.
Our obligations under the ABL Facility are guaranteed by us and our domestic subsidiaries, subject to certain exceptions, and are secured by (i) a first-priority perfected security interest in all inventory and cash, and (ii) a second-priority perfected security in substantially all of our tangible and intangible assets, in each case, subject to certain exceptions and permitted liens.
The Senior Notes are fully and unconditionally guaranteed, jointly and severally, on a senior unsecured basis by certain of our existing domestic subsidiaries and by certain of our future domestic subsidiaries. The subsidiaries that generally operate our non-U.S. business concentrated in Colombia do not guarantee our Senior Notes. Our Senior Notes are not subject to any sinking fund requirements. The Indenture governing our Senior Notes contains additional restrictive covenants that limit our ability to enter into various transactions.
As of December 31, 2017, we were in compliance with all covenants required by our Term Loan, ABL Facility and Senior Notes.
37
Results of Operations
Statements of Operations Analysis - Year Ended December 31, 2017 Compared with Year Ended December 31, 2016
The following table provides certain information about our operations, including a detail of each of our business segments’ revenues, operating costs and gross margin, and the percentage of the consolidated amount of each which is attributable to each business segment, for the years ended December 31, 2017 and 2016 (amounts in thousands, except percentages):
Year ended December 31, | |||||||||||||
2017 | 2016 | ||||||||||||
Revenues: | |||||||||||||
Domestic drilling | $ | 129,276 | 29 | % | $ | 112,399 | 41 | % | |||||
International drilling | 41,349 | 9 | % | 6,808 | 2 | % | |||||||
Drilling services | 170,625 | 38 | % | 119,207 | 43 | % | |||||||
Well servicing | 77,257 | 17 | % | 71,491 | 26 | % | |||||||
Wireline services | 163,716 | 37 | % | 67,419 | 24 | % | |||||||
Coiled tubing services | 34,857 | 8 | % | 18,959 | 7 | % | |||||||
Production services | 275,830 | 62 | % | 157,869 | 57 | % | |||||||
Consolidated revenues | $ | 446,455 | 100 | % | $ | 277,076 | 100 | % | |||||
Operating costs: | |||||||||||||
Domestic drilling | $ | 83,122 | 25 | % | $ | 63,686 | 31 | % | |||||
International drilling | 31,994 | 10 | % | 9,465 | 5 | % | |||||||
Drilling services | 115,116 | 35 | % | 73,151 | 36 | % | |||||||
Well servicing | 56,379 | 17 | % | 53,208 | 26 | % | |||||||
Wireline services | 128,137 | 39 | % | 57,634 | 28 | % | |||||||
Coiled tubing services | 31,248 | 9 | % | 19,956 | 10 | % | |||||||
Production services | 215,764 | 65 | % | 130,798 | 64 | % | |||||||
Consolidated operating costs | $ | 330,880 | 100 | % | $ | 203,949 | 100 | % | |||||
Gross margin: | |||||||||||||
Domestic drilling | $ | 46,154 | 40 | % | $ | 48,713 | 67 | % | |||||
International drilling | 9,355 | 8 | % | (2,657 | ) | (4 | )% | ||||||
Drilling services | 55,509 | 48 | % | 46,056 | 63 | % | |||||||
Well servicing | 20,878 | 18 | % | 18,283 | 25 | % | |||||||
Wireline services | 35,579 | 31 | % | 9,785 | 13 | % | |||||||
Coiled tubing services | 3,609 | 3 | % | (997 | ) | (1 | )% | ||||||
Production services | 60,066 | 52 | % | 27,071 | 37 | % | |||||||
Consolidated gross margin | $ | 115,575 | 100 | % | $ | 73,127 | 100 | % | |||||
Consolidated: | |||||||||||||
Net loss | $ | (75,118 | ) | $ | (128,391 | ) | |||||||
Adjusted EBITDA (1) | $ | 49,873 | $ | 14,237 | |||||||||
(1) Adjusted EBITDA represents income (loss) before interest expense, income tax (expense) benefit, depreciation and amortization, loss on extinguishment of debt and impairments. Adjusted EBITDA is a non-GAAP measure that our management uses to facilitate period-to-period comparisons of our core operating performance and to evaluate our long-term financial performance against that of our peers. We believe that this measure is useful to investors and analysts in allowing for greater transparency of our core operating performance and makes it easier to compare our results with those of other companies within our industry. Adjusted EBITDA should not be considered (a) in isolation of, or as a substitute for, net income (loss), (b) as an indication of cash flows from operating activities or (c) as a measure of liquidity. In addition, Adjusted EBITDA does not represent funds available for discretionary use. Adjusted EBITDA may not be comparable to other similarly titled measures reported by other companies.
38
A reconciliation of net loss, as reported, to Adjusted EBITDA, and a reconciliation of net loss, as reported, to consolidated gross margin are set forth in the following table.
Year ended December 31, | |||||||
2017 | 2016 | ||||||
(amounts in thousands) | |||||||
Reconciliation of net loss and Adjusted EBITDA to consolidated gross margin: | |||||||
Net loss | $ | (75,118 | ) | $ | (128,391 | ) | |
Depreciation and amortization | 98,777 | 114,312 | |||||
Impairment | 1,902 | 12,815 | |||||
Interest expense | 27,039 | 25,934 | |||||
Loss on extinguishment of debt | 1,476 | 299 | |||||
Income tax benefit | (4,203 | ) | (10,732 | ) | |||
Adjusted EBITDA | 49,873 | 14,237 | |||||
General and administrative | 69,681 | 61,184 | |||||
Bad debt expense | 53 | 156 | |||||
Gain on dispositions of property and equipment, net | (3,608 | ) | (1,892 | ) | |||
Other income | (424 | ) | (558 | ) | |||
Consolidated gross margin | $ | 115,575 | $ | 73,127 | |||
Consolidated gross margin — Our consolidated gross margin increased by 58% during 2017, as compared to 2016, as a result of higher activity for each of our drilling and production services business segments during the year ended December 31, 2017, as compared to 2016, as our industry continues to recover from an industry downturn. Spot prices have also improved for all of our business segments throughout 2017. Of the $42.4 million increase in consolidated gross margin, 78% is attributable to our production services segments, primarily due to improved demand for our wireline services, while the remaining increase attributable to our drilling services business segments is primarily due to higher activity for our international drilling operations.
Drilling Services — Our drilling services revenues increased by $51.4 million, or 43%, during 2017, as compared to 2016, while operating costs increased by $42.0 million, or 57%. The increases in our drilling services revenues and operating costs primarily resulted from a 42% increase in revenue days due to the increasing demand in our industry, especially in Colombia.
39
The following table provides operating statistics for each of our drilling services segments for the years ended December 31, 2017 and 2016:
Year ended December 31, | |||||||
2017 | 2016 | ||||||
Domestic drilling: | |||||||
Average number of drilling rigs | 16 | 23 | |||||
Utilization rate | 95 | % | 55 | % | |||
Revenue days | 5,524 | 4,628 | |||||
Average revenues per day | $ | 23,403 | $ | 24,287 | |||
Average operating costs per day | 15,047 | 13,761 | |||||
Average margin per day | $ | 8,356 | $ | 10,526 | |||
International drilling: | |||||||
Average number of drilling rigs | 8 | 8 | |||||
Utilization rate | 46 | % | 7 | % | |||
Revenue days | 1,345 | 218 | |||||
Average revenues per day | $ | 30,743 | $ | 31,229 | |||
Average operating costs per day | 23,787 | 43,417 | |||||
Average margin per day | $ | 6,956 | $ | (12,188 | ) | ||
Our domestic drilling fleet utilization reached 100% by mid-2017, and remained fully utilized through December 31, 2017. Our domestic drilling average revenues per day during 2017, as compared to 2016, decreased, while our average operating costs per day increased, due to the expiration of term contracts during 2016 that were entered into prior to the downturn at higher revenue rates, many of which were terminated early. Thus, there were more revenue days during 2017 attributable to daywork activity versus revenue days associated with rigs that were earning but not working and incurring minimal operating costs during 2016.
Demand for drilling rigs influences the types of drilling contracts we are able to obtain, and the type of revenues we earn under our drilling contracts. As a result of the downturn in our industry, several of our clients terminated a number of their drilling contracts with us. Drilling rigs under contracts which are terminated early earn lower standby revenue rates, as compared to daywork rates, and incur minimal operating costs. The following table provides the percentages of our consolidated drilling services revenues by contract type for the years ended December 31, 2017 and 2016:
Year ended December 31, | |||||
2017 | 2016 | ||||
Daywork contracts (not terminated early) | 100 | % | 89 | % | |
Daywork contracts terminated early | — | % | 11 | % | |
Our international drilling fleet utilization steadily improved throughout 2017, culminating in a 75% utilization rate at the end of 2017, versus 50% utilization at December 31, 2016, which resulted in a significant increase in our average margin per day. The substantial increase in average margin per day is largely a result of the low utilization in 2016, during which time we incurred certain fixed costs, as well as additional costs during the fourth quarter of 2016 to mobilize previously stacked rigs under new contracts, which resulted in a negative average margin per day during 2016.
Production Services — Our revenues from production services increased by $118.0 million, or 75%, during 2017, as compared to 2016, while operating costs increased by $85.0 million, or 65%, respectively. The increases in revenues and operating costs in our production services segments are a result of the increased demand for our services, particularly those that perform completion-related activities.
40
The following table provides operating statistics for each of our production services segments for the years ended December 31, 2017 and 2016:
Year ended December 31, | |||||||
2017 | 2016 | ||||||
Well servicing: | |||||||
Average number of rigs | 125 | 125 | |||||
Utilization rate | 43 | % | 41 | % | |||
Rig hours | 150,240 | 144,151 | |||||
Average revenue per hour | $ | 514 | $ | 496 | |||
Wireline services: | |||||||
Average number of units | 115 | 122 | |||||
Number of jobs | 11,139 | 8,169 | |||||
Average revenue per job | $ | 14,698 | $ | 8,253 | |||
Coiled tubing services: | |||||||
Average number of units | 16 | 17 | |||||
Revenue days | 1,529 | 1,352 | |||||
Average revenue per day | $ | 22,797 | $ | 14,023 | |||
Increases in production services revenues and operating costs were led by our wireline services business segment, which experienced a significant increase in completion-related activity as wells that were drilled but not completed during the downturn created higher demand for completion services as our industry continues to recover. The number of wireline jobs we completed increased by 36% during 2017, as compared to 2016 while average revenue per job increased by 78%, which is largely due to completion-related jobs that earn higher revenue rates but also incur higher costs for the job materials consumed on these types of jobs.
Our well servicing and coiled tubing services business segments experienced a more moderate increase in demand. Well servicing utilization increased to 43% during 2017, from 41% during 2016, representing a 4% increase in well servicing rig hours, while average revenue per hour also increased by 4%. Our coiled tubing revenue days increased by 13%, while the average revenue per day increased by 63%, which was primarily due to a larger proportion of the work performed with larger diameter coiled tubing units which typically earn higher revenue rates as compared to smaller diameter coiled tubing units.
Depreciation and amortization expense — Our depreciation and amortization expense decreased by $15.5 million during 2017, as compared to 2016, primarily as a result of the impairments, dispositions of various equipment, and assets we placed as held for sale during 2016, as well as reduced capital expenditures during 2016 and 2017 due to the downturn. During the year ended December 31, 2016, we recognized $11.6 million of depreciation on drilling and well servicing rigs, wireline units, and certain other equipment which were subsequently sold or placed as held for sale, and $1.3 million of amortization expense for certain intangible assets that were fully amortized by the end of 2016.
Impairment — During the years ended December 31, 2017 and 2016, we recognized impairment charges of $1.9 million and $12.8 million, respectively, primarily to reduce the carrying values of certain assets which were classified as held for sale, to their estimated fair values based on expected sale prices. For more detail, see Note 2, Property and Equipment, of the Notes to Consolidated Financial Statements, included in Part II, Item 8 Financial Statements and Supplementary Data, of this Annual Report on Form 10-K.
Interest expense — Our interest expense increased by $1.1 million during the year ended December 31, 2017, as compared to 2016, primarily due to the increased interest rate under our Revolving Credit Facility, which was amended in June 2016, and the issuance of our Term Loan in November 2017. Proceeds from the issuance of our Term Loan were used to repay and retire the Revolving Credit Facility, and resulted in an increase in our total debt outstanding, as well as an increased rate applicable to the outstanding borrowings. Weighted average debt outstanding under our Revolving Credit Facility and/or Term Loan (beginning in November 2017) was approximately $95.4 million and $96.0 million during the years ended December 31, 2017 and 2016, respectively, while the weighted average interest rate on these borrowings during these periods was approximately 6.9% and 5.7%, respectively.
41
Loss on extinguishment of debt — Our loss on extinguishment of debt in 2017 represents the write-off of net unamortized debt issuance costs associated with the extinguishment of our Revolving Credit Facility in November 2017. Our 2016 loss on debt extinguishment represents the write-off of net unamortized debt issuance costs resulting from the reduction of borrowing capacity under our Revolving Credit Facility when it was amended in 2016.
Income tax benefit — Our effective income tax rate for the year ended December 31, 2017 was lower than the federal statutory rate in the United States primarily due to effects of recent tax law changes, valuation allowances, foreign currency translation, state taxes, and other permanent differences. For more detail, see Note 5, Income Taxes, of the Notes to Consolidated Financial Statements, included in Part II, Item 8, Financial Statements and Supplementary Data, of this Annual Report on Form 10-K.
General and administrative expense — Our general and administrative expense increased by approximately $8.5 million, or 14%, during 2017, as compared to 2016, primarily related to increased compensation costs. The increase in compensation cost was primarily due to a $7.1 million increase in salary, employee benefits and bonus expense during the year ended December 31, 2017, partially as a result of increased headcount to accommodate higher activity levels, as well as increased incentive compensation based on improved company performance.
Gain on dispositions of property and equipment, net — Our net gain of $3.6 million on the disposition of various property and equipment during the year ended December 31, 2017 included sales of drilling and coiled tubing equipment and vehicles, as well as the loss of drill pipe in operation, for which we were reimbursed by our client. Net gains in 2017 also included the disposal of three cranes that were damaged, for which we received $0.2 million of the $0.8 million of insurance proceeds and expect to receive the remaining proceeds in early 2018. Our net gain of $1.9 million on the disposition of property and equipment during 2016 was primarily related to a net gain on the sale of drilling rigs and the disposal of excess drill pipe. These gains during 2016 were partially offset by a loss on the disposition of damaged drilling equipment.
Other income (expense), net — Our other income is primarily related to net foreign currency gains recognized for our Colombian operations.
42
Statements of Operations Analysis - Year Ended December 31, 2016 Compared with Year Ended December 31, 2015
The following table provides certain information about our operations, including a detail of each of our business segments’ revenues, operating costs and gross margin, and the percentage of the consolidated amount of each which is attributable to each business segment, for the years ended December 31, 2016 and 2015 (amounts in thousands, except percentages):
Year ended December 31, | |||||||||||||
2016 | 2015 | ||||||||||||
Revenues: | |||||||||||||
Domestic drilling | $ | 112,399 | 41 | % | $ | 205,440 | 38 | % | |||||
International drilling | 6,808 | 2 | % | 43,878 | 8 | % | |||||||
Drilling services | 119,207 | 43 | % | 249,318 | 46 | % | |||||||
Well servicing | 71,491 | 26 | % | 133,440 | 25 | % | |||||||
Wireline services | 67,419 | 24 | % | 120,387 | 22 | % | |||||||
Coiled tubing services | 18,959 | 7 | % | 37,633 | 7 | % | |||||||
Production services | 157,869 | 57 | % | 291,460 | 54 | % | |||||||
Consolidated revenues | $ | 277,076 | 100 | % | $ | 540,778 | 100 | % | |||||
Operating costs: | |||||||||||||
Domestic drilling | $ | 63,686 | 31 | % | $ | 108,602 | 30 | % | |||||
International drilling | 9,465 | 5 | % | 35,594 | 10 | % | |||||||
Drilling services | 73,151 | 36 | % | 144,196 | 40 | % | |||||||
Well servicing | 53,208 | 26 | % | 91,125 | 25 | % | |||||||
Wireline services | 57,634 | 28 | % | 88,848 | 26 | % | |||||||
Coiled tubing services | 19,956 | 10 | % | 33,847 | 9 | % | |||||||
Production services | 130,798 | 64 | % | 213,820 | 60 | % | |||||||
Consolidated operating costs | $ | 203,949 | 100 | % | $ | 358,016 | 100 | % | |||||
Gross margin: | |||||||||||||
Domestic drilling | $ | 48,713 | 67 | % | $ | 96,838 | 53 | % | |||||
International drilling | (2,657 | ) | (4 | )% | 8,284 | 5 | % | ||||||
Drilling services | 46,056 | 63 | % | 105,122 | 58 | % | |||||||
Well servicing | 18,283 | 25 | % | 42,315 | 23 | % | |||||||
Wireline services | 9,785 | 13 | % | 31,539 | 17 | % | |||||||
Coiled tubing services | (997 | ) | (1 | )% | 3,786 | 2 | % | ||||||
Production services | 27,071 | 37 | % | 77,640 | 42 | % | |||||||
Consolidated gross margin | $ | 73,127 | 100 | % | $ | 182,762 | 100 | % | |||||
Consolidated: | |||||||||||||
Net loss | $ | (128,391 | ) | $ | (155,140 | ) | |||||||
Adjusted EBITDA (1) | $ | 14,237 | $ | 110,780 | |||||||||
(1) Adjusted EBITDA represents income (loss) before interest expense, income tax (expense) benefit, depreciation and amortization, loss on extinguishment of debt and impairments. Adjusted EBITDA is a non-GAAP measure that our management uses to facilitate period-to-period comparisons of our core operating performance and to evaluate our long-term financial performance against that of our peers. We believe that this measure is useful to investors and analysts in allowing for greater transparency of our core operating performance and makes it easier to compare our results with those of other companies within our industry. Adjusted EBITDA should not be considered (a) in isolation of, or as a substitute for, net income (loss), (b) as an indication of cash flows from operating activities or (c) as a measure of liquidity. In addition, Adjusted EBITDA does not represent funds available for discretionary use. Adjusted EBITDA may not be comparable to other similarly titled measures reported by other companies.
43
A reconciliation of net loss, as reported, to Adjusted EBITDA, and a reconciliation of net loss, as reported, to consolidated gross margin are set forth in the following table.
Year ended December 31, | |||||||
2016 | 2015 | ||||||
(amounts in thousands) | |||||||
Reconciliation of net loss and Adjusted EBITDA to consolidated gross margin: | |||||||
Net loss | $ | (128,391 | ) | $ | (155,140 | ) | |
Depreciation and amortization | 114,312 | 150,939 | |||||
Impairment | 12,815 | 129,152 | |||||
Interest expense | 25,934 | 21,222 | |||||
Loss on extinguishment of debt | 299 | 2,186 | |||||
Income tax benefit | (10,732 | ) | (37,579 | ) | |||
Adjusted EBITDA | 14,237 | 110,780 | |||||
General and administrative | 61,184 | 73,903 | |||||
Bad debt expense (recovery) | 156 | (188 | ) | ||||
Gain on dispositions of property and equipment, net | (1,892 | ) | (4,344 | ) | |||
Other (income) expense | (558 | ) | 2,611 | ||||
Consolidated gross margin | $ | 73,127 | $ | 182,762 | |||
Consolidated gross margin — Our consolidated gross margin decreased by 60% during 2016, as compared to 2015, primarily as a result of decreased activity and pricing pressure for all our service offerings. Of the $109.6 million decrease in consolidated gross margin, 54% was attributable to our drilling services business segments, primarily due to a reduction in domestic drilling activity. The remaining decrease attributable to our production services business segments is primarily due to a reduction in well servicing and wireline services activity.
In response to the downturn in our industry, we took several actions during 2015 and 2016 to reduce costs and better scale our business to the reduced revenues. We reduced our total headcount by over 50%, reduced wage rates for our operations personnel, reduced incentive compensation and eliminated certain employment benefits. We closed ten field offices to reduce overhead and reduce associated lease payments, amended our Revolving Credit Facility, and sold 35 drilling rigs and other drilling equipment for aggregate net proceeds of $65.5 million.
44
Drilling Services —Our drilling services revenues decreased by $130.1 million, or 52%, during 2016, as compared to 2015, while operating costs decreased by $71.0 million, or 49%. The decreases in our drilling services revenues and costs primarily resulted from a 46% decrease in revenue days due to the significant reduction in demand from an industry downturn that bottomed during the second quarter of 2016.
The following table provides operating statistics for each of our drilling services business segments for the years ended December 31, 2016 and 2015:
Year ended December 31, | |||||||
2016 | 2015 | ||||||
Domestic drilling: | |||||||
Average number of drilling rigs | 23 | 31 | |||||
Utilization rate | 55 | % | 70 | % | |||
Revenue days | 4,628 | 7,911 | |||||
Average revenues per day | $ | 24,287 | $ | 25,969 | |||
Average operating costs per day | 13,761 | 13,728 | |||||
Average margin per day | $ | 10,526 | $ | 12,241 | |||
International drilling: | |||||||
Average number of drilling rigs | 8 | 8 | |||||
Utilization rate | 7 | % | 39 | % | |||
Revenue days | 218 | 1,129 | |||||
Average revenues per day | $ | 31,229 | $ | 38,864 | |||
Average operating costs per day | 43,417 | 31,527 | |||||
Average margin per day | $ | (12,188 | ) | $ | 7,337 | ||
Our domestic drilling average revenues per day during 2016 decreased relative to 2015, while our average operating costs per day increased, primarily due to the expiration of term contracts that were entered into in 2014 prior to the downturn at higher revenue rates, many of which were terminated early. Our domestic drilling average operating costs per day increased as a result of more revenue days attributable to daywork activity during 2016, versus more revenue days in 2015 from rigs that were earning but not working and incurring minimal costs under contracts that were terminated early. These increases in 2016 were partially offset by our reduced cost structure.
Demand for drilling rigs influences the types of drilling contracts we are able to obtain, and the type of revenues we earn under our drilling contracts. As a result of the downturn in our industry, several of our clients terminated a number of their drilling contracts with us. Drilling rigs under contracts which are terminated early earn lower standby revenue rates, as compared to daywork rates, and incur minimal operating costs. Alternatively, turnkey drilling contracts result in higher average revenues per day and higher average operating costs per day as compared to daywork drilling contracts.
The following table provides the percentages of our consolidated drilling services revenues by contract type for the years ended December 31, 2016 and 2015:
Year ended December 31, | |||||
2016 | 2015 | ||||
Daywork contracts (not terminated early) | 89 | % | 77 | % | |
Daywork contracts terminated early | 11 | % | 20 | % | |
Turnkey contracts | — | % | 3 | % | |
Our international drilling fleet utilization declined throughout 2016 and 2015 as several contracted rigs were placed on standby by our clients in response to weakening oil prices. In the fourth quarter of 2015, all three of the contracted rigs were placed on standby and remained idle until being redeployed in late 2016. As a result of the low utilization in 2016 and the contracts placed on standby, for which we continued to incur overhead costs until the rig was reactivated, our average international drilling revenues per day decreased while average operating costs per day increased. The increases were partially offset by our reduced cost structure in Colombia.
45
Production Services —Our production services revenues decreased by $133.6 million, or 46%, during 2016, as compared to 2015, while operating costs decreased by $83.0 million, or 39%, respectively. The decreases in revenues and operating costs are a result of reduced demand for our services, which similarly affected each of our production services business segments.
The following table provides operating statistics for each of our production services business segments for the years ended December 31, 2016 and 2015:
Year ended December 31, | |||||||
2016 | 2015 | ||||||
Well servicing: | |||||||
Average number of rigs | 125 | 122 | |||||
Utilization rate | 41 | % | 65 | % | |||
Rig hours | 144,151 | 225,938 | |||||
Average revenue per hour | $ | 496 | $ | 591 | |||
Wireline services: | |||||||
Average number of units | 122 | 125 | |||||
Number of jobs | 8,169 | 9,661 | |||||
Average revenue per job | $ | 8,253 | $ | 12,461 | |||
Coiled tubing services: | |||||||
Average number of units | 17 | 17 | |||||
Revenue days | 1,352 | 1,672 | |||||
Average revenue per day | $ | 14,023 | $ | 22,507 | |||
The decreases in revenues and operating costs for each of our production services segments are a result of the significantly reduced demand for our services in response to the downturn in our industry, which led to decreased activity and increased pricing pressure for all our service offerings. Our well servicing utilization decreased to 41% during 2016, from 65% during 2015, representing a 36% decrease in rig hours, while average revenues per hour decreased by 16%. The the number of wireline jobs we completed during 2016 decreased by 15%, as compared to 2015, while average revenue per job decreased by 34%. Similarly, our coiled tubing services revenue days decreased by 19%, while the average revenue per day also decreased by 38%.
Depreciation and amortization expense — Our depreciation and amortization expense decreased by $36.6 million during 2016, as compared to 2015, primarily as a result of the impairment charges during 2015 to reduce the carrying values of domestic and Colombia drilling rigs, coiled tubing equipment, and intangible assets to their estimated fair values. The sales and disposals of drilling rigs and equipment during 2015 also contributed to the decrease in depreciation expense in 2016. During 2015, we recognized $10.3 million of depreciation on drilling rigs which were subsequently sold or placed as held for sale, and $3.8 million for the amortization of coiled tubing intangible assets which were impaired to zero at the end of 2015. The overall decrease in our depreciation expense was partially offset by $6.1 million of additional depreciation recognized during the year ended December 31, 2016 for the five new drilling rigs which we deployed in 2015.
Impairment — During the year ended December 31, 2016, we recognized impairment charges of $12.8 million, primarily to reduce the carrying values of assets which were classified as held for sale, to their estimated fair values, based on expected sales prices. During the year ended December 31, 2015, we recognized impairment charges of $129.2 million, primarily related to certain domestic and international drilling rigs, coiled tubing equipment, and intangibles and other equipment designated as held for sale. For more detail, see Note 2, Property and Equipment, of the Notes to Consolidated Financial Statements, included in Part II, Item 8, Financial Statements and Supplementary Data, of this Annual Report on Form 10-K.
Interest expense — Our interest expense increased by $4.7 million during 2016, as compared to 2015, primarily due to the increased interest rate under our Revolving Credit Facility, which was amended in late 2015 and again in June 2016.
Loss on extinguishment of debt — Our loss on debt extinguishment represents the write off of debt costs associated with the reduced borrowing capacity of our Revolving Credit Facility as a result of the amendments in 2015 and 2016.
46
Income tax expense (benefit) — Our effective income tax rate for the year ended December 31, 2016 was 8%, which is lower than the federal statutory rate in the United States primarily due to valuation allowances, the effect of foreign currency translation, state taxes, and other permanent differences. For more detail, see Note 5, Income Taxes, of the Notes to Consolidated Financial Statements, included in Part II, Item 8, Financial Statements and Supplementary Data, of this Annual Report on Form 10-K.
General and administrative expense — Our general and administrative expense decreased by approximately $12.7 million, or 17% during 2016, as compared to 2015. This decrease is primarily due to a decrease in compensation and benefit costs during 2016 of $5.2 million, resulting primarily from the reduction in our workforce and reduced employee benefits and other actions taken to minimize various administrative costs such as rent, office and travel expenses.
Gain on dispositions of property and equipment, net — Our net gain of $1.9 million on the disposition of property and equipment during the year ended December 31, 2016 was primarily related to a net gain on the sale of three domestic drilling rigs and the disposal of excess drill pipe. These gains were partially offset by a loss on the disposition of damaged drilling equipment. Our net gain of $4.3 million on the disposition of property and equipment during the year ended December 31, 2015 was primarily for the sale of 32 domestic drilling rigs and other drilling equipment.
Other (income) expense — The increase in our other income is primarily related to net foreign currency gains recognized for our Colombian operations during the year ended December 31, 2016, as compared to net foreign currency losses during 2015.
Inflation
When the demand for drilling and production services increases, we may be affected by inflation, which primarily impacts:
• | wage rates for our operations personnel which increase when the availability of personnel is scarce; |
• | materials and supplies used in our operations; |
• | equipment repair and maintenance costs; |
• | costs to upgrade existing equipment; and |
• | costs to construct new equipment. |
With the recent increases in activity in our industry, we estimate that inflation has had a modest impact on our operations during 2016 and 2017. However, we expect that we will experience a moderate increase in inflation in 2018 if activity continues to improve.
Off-Balance Sheet Arrangements
We do not have any off-balance sheet arrangements.
Critical Accounting Policies and Estimates
The preparation of financial statements in conformity with US GAAP requires us to make estimates and assumptions that affect the amounts reported in our financial statements and accompanying notes. Actual results could differ from those estimates.
Revenues and Cost Recognition — Our drilling services business segments earn revenues by drilling oil and gas wells for our clients under daywork contracts. We recognize revenues on daywork contracts for the days completed based on the dayrate specified in each contract.
With most drilling contracts, we receive payments contractually designated for the mobilization of rigs and other equipment. Payments received, and costs incurred for the mobilization services are deferred and recognized on a straight line basis over the related contract term. Costs incurred to relocate rigs and other drilling equipment to areas in which a contract has not been secured are expensed as incurred. Reimbursements that we receive for out-of-pocket expenses are recorded as revenues and the out-of-pocket expenses for which they relate are recorded as operating costs.
With most term drilling contracts, we are entitled to receive a full or reduced rate of revenues from our clients if they choose to place a rig on standby or to early terminate the contract before its original expiration term. Revenues derived from rigs placed on standby or from the early termination of term drilling contracts are deferred and recognized as the amounts become fixed or determinable, over the remainder of the original term or when the rig is sold.
47
Our production services business segments earn revenues for well servicing, wireline services and coiled tubing services pursuant to master services agreements based on purchase orders, contracts or other arrangements with the client that include fixed or determinable prices. Production services jobs are generally short-term and are charged at current market rates. Production service revenue is recognized when the service has been rendered and collectability is reasonably assured.
All of our revenues are recognized net of sales taxes when applicable.
Long-lived assets — We evaluate for potential impairment of long-lived assets when indicators of impairment are present, which may include, among other things, significant adverse changes in industry trends (including revenue rates, utilization rates, oil and natural gas market prices, and industry rig counts). In performing an impairment evaluation, we estimate the future undiscounted net cash flows from the use and eventual disposition of the assets grouped at the lowest level that independent cash flows can be identified. We perform an impairment evaluation and estimate future undiscounted cash flows for each of our reporting units separately, which are our domestic drilling services, international drilling services, well servicing, wireline services and coiled tubing services segments. If the sum of the estimated future undiscounted net cash flows is less than the carrying amount of the asset group, then we determine the fair value of the asset group. The amount of an impairment charge is measured as the difference between the carrying amount and the fair value of the assets. The assumptions used in the impairment evaluation are inherently uncertain and require management judgment.
Deferred taxes — We provide deferred taxes for the basis differences in our property and equipment between financial reporting and tax reporting purposes and other costs such as compensation, net operating loss carryforwards, employee benefit and other accrued liabilities which are deducted in different periods for financial reporting and tax reporting purposes. For property and equipment, differences arise from differences in depreciation periods and methods and the value of assets acquired in a business acquisition where we acquire an entity rather than just its assets. For financial reporting purposes, we depreciate the various components of our drilling rigs, well servicing rigs, wireline units and coiled tubing units over 1 to 25 years and refurbishments over 3 to 5 years, while federal income tax rules generally require that we depreciate drilling rigs, well servicing rigs, wireline units and coiled tubing units over 5 years. Therefore, in the first 5 years of our ownership of a drilling rig, well servicing rig, wireline unit or coiled tubing unit, our tax depreciation exceeds our financial reporting depreciation, resulting in our providing deferred taxes on this depreciation difference. After 5 years, financial reporting depreciation exceeds tax depreciation, and the deferred tax liability begins to reverse.
Accounting estimates — Material estimates that are particularly susceptible to significant changes in the near term relate to our estimate of the allowance for doubtful accounts, our determination of depreciation and amortization expenses, our estimates of projected cash flows and fair values for impairment evaluations, our estimate of the valuation allowance for deferred tax assets, our estimate of the liability relating to the self-insurance portion of our health and workers’ compensation insurance, our estimate of compensation related accruals and our estimate of sales tax audit liability.
• | We estimate an allowance for doubtful accounts based on the creditworthiness of our clients as well as general economic conditions. We evaluate the creditworthiness of our clients based on commercial credit reports, trade references, bank references, financial information, production information and any past experience we have with the client. Consequently, any change in those factors could affect our estimate of our allowance for doubtful accounts. In some instances, we require new clients to establish escrow accounts or make prepayments. We had an allowance for doubtful accounts of $1.2 million and $1.7 million at December 31, 2017 and December 31, 2016, respectively. |
• | Our determination of the useful lives of our depreciable assets directly affects our determination of depreciation expense and deferred taxes. A decrease in the useful life of our property and equipment would increase depreciation expense and reduce deferred taxes. We provide for depreciation of our drilling, production, transportation and other equipment on a straight-line method over useful lives that we have estimated and that range from 1 to 25 years. We record the same depreciation expense whether a drilling rig, well servicing rig, wireline unit or coiled tubing unit is idle or working. Our estimates of the useful lives of our drilling, production, transportation and other equipment are based on our almost 50 years of experience in the oilfield services industry with similar equipment. |
• | We evaluate for potential impairment of long-lived assets when indicators of impairment are present, which may include, among other things, significant adverse changes in industry trends (including revenue rates, utilization rates, oil and natural gas market prices, and industry rig counts). Despite the modest recovery in commodity prices that began in late 2016 and continued through 2017, we continue to monitor all indicators of potential impairments in accordance with ASC Topic 360, Property, Plant and Equipment. Due to continued performance at levels lower than anticipated and a |
48
decline in our projected cash flows for the coiled tubing reporting unit, we again performed an impairment evaluation of our coiled tubing business as of June 30, 2017 and concluded that no impairment was present.
The assumptions used in the impairment evaluation are inherently uncertain and require management judgment. Although we believe the assumptions and estimates used in our impairment analyses are reasonable and appropriate, different assumptions and estimates could materially impact the analyses and resulting conclusions. If any of our assets become or remain idle for an extended amount of time, then our estimated cash flows may further decrease, and therefore the probability of a near term sale may increase. If any of the foregoing were to occur, we may incur additional impairment charges.
• | As of December 31, 2017, we had $106.2 million of deferred tax assets related to domestic and foreign net operating losses that are available to reduce future taxable income. In assessing the realizability of our deferred tax assets, we consider whether it is more likely than not that some portion or all of the deferred tax assets will not be realized. The ultimate realization of deferred tax assets is dependent upon the generation of future taxable income during the periods in which those temporary differences become deductible. As a result, we have a valuation allowance that fully offsets our foreign and U.S. federal deferred tax assets as of December 31, 2017. The valuation allowance and the recent change in tax laws are the primary factors causing our effective tax rate to be significantly lower than the statutory rate of 35%. For more information, see Note 5, Income Taxes, of the Notes to Consolidated Financial Statements, included in Part II, Item 8, Financial Statements and Supplementary Data, of this Annual Report on Form 10-K. |
• | Our accrued insurance premiums and deductibles as of December 31, 2017 include accruals for costs incurred under the self-insurance portion of our health insurance of approximately $2.0 million and our workers’ compensation, general liability and auto liability insurance of approximately $4.6 million. We have stop-loss coverage of $200,000 per covered individual per year under our health insurance and a deductible of $500,000 per occurrence under our workers’ compensation insurance. We have a deductible of $250,000 per occurrence under both our general liability insurance and auto liability insurance. We accrue for these costs as claims are incurred using an actuarial calculation that is based on industry and our company’s historical claim development data, and we accrue the costs of administrative services associated with claims processing. |
• | Our compensation expense includes estimates for certain of our long-term incentive compensation plans which have performance-based award components dependent upon our performance over a set performance period, as compared to the performance of a pre-defined peer group. The accruals for these awards include estimates which affect our compensation expense, employee related accruals and equity. The accruals are adjusted based on actual achievement levels at the end of the pre-determined performance periods. Additionally, our phantom stock unit awards are classified as liability awards under ASC Topic 718, Compensation—Stock Compensation, because we expect to settle the awards in cash when they vest, and are remeasured at fair value at the end of each reporting period until they vest. The change in fair value is recognized as a current period compensation expense in our statement of operations. Therefore, changes in the inputs used to measure fair value can result in volatility in our compensation expense. This volatility increases as the phantom stock awards approach the vesting date. For more information, see Note 8, Equity Transactions and Stock-Based Compensation Plans, of the Notes to Consolidated Financial Statements, included in Part II, Item 8, Financial Statements and Supplementary Data, of this Annual Report on Form 10-K. |
• | We are currently undergoing sales and use tax audits for multi-year periods and we are working to resolve all relevant issues. As of December 31, 2017 and December 31, 2016, our accrued liability was $1.2 million and $0.6 million, respectively, based on our estimate of the sales and use tax obligations that are expected to result from these audits. For more information, see Note 11, Commitments and Contingencies, of the Notes to Consolidated Financial Statements, included in Part II, Item 8, Financial Statements and Supplementary Data, of this Annual Report on Form 10-K. |
Recently Issued Accounting Standards
For a detail of recently issued accounting standards, see Note 1, Organization and Summary of Significant Accounting Policies, of the Notes to Consolidated Financial Statements, included in Part II, Item 8, Financial Statements and Supplementary Data, of this Annual Report on Form 10-K.
49
Recent Developments
On December 22, 2017, the Tax Cuts and Jobs Act of 2017 (the “Tax Reform Act”) was enacted, with an effective date of January 1, 2018. The legislation significantly changes U.S. tax law by, among other things, lowering corporate income tax rates from 35% to 21%, repealing the alternative minimum tax (AMT), limiting the deductibility of interest expense, implementing a territorial tax system and imposing a repatriation tax on deemed repatriated earnings of foreign subsidiaries. The net impact of the Tax Reform Act for the period ended December 31, 2017 is a $5.4 million benefit, net of valuation allowances.
For more information, see Note 5, Income Taxes, of the Notes to Consolidated Financial Statements, included in Part II, Item 8, Financial Statements and Supplementary Data, of this Annual Report on Form 10-K.
ITEM 7A. | QUANTITATIVE AND QUALITATIVE DISCLOSURES ABOUT MARKET RISK |
Interest Rate Risk — We are subject to interest rate market risk on our variable rate debt. As of December 31, 2017, the principal amount under our Term Loan was $175 million, which is our only variable rate debt with an outstanding balance. The impact of a hypothetical 1% increase or decrease in interest rates on this amount of debt would have resulted in a corresponding increase or decrease, respectively, in interest expense of approximately $1.8 million during the year ended December 31, 2017. This potential increase or decrease is based on the simplified assumption that the level of variable rate debt remains constant with an immediate across-the-board interest rate increase or decrease as of January 1, 2017.
Foreign Currency Risk — While the U.S. dollar is the functional currency for reporting purposes for our Colombian operations, we enter into transactions denominated in Colombian Pesos. Nonmonetary assets and liabilities are translated at historical rates and monetary assets and liabilities are translated at exchange rates in effect at the end of the period. Income statement accounts are translated at average rates for the period. As a result, Colombian Peso denominated transactions are affected by changes in exchange rates. We generally accept the exposure to exchange rate movements without using derivative financial instruments to manage this risk. Therefore, both positive and negative movements in the Colombian Peso currency exchange rate against the U.S. dollar have and will continue to affect the reported amount of revenues, expenses, profit, and assets and liabilities in our consolidated financial statements. The impact of currency rate changes on our Colombian Peso denominated transactions and balances resulted in net foreign currency gains of $0.3 million for the year ended December 31, 2017.
50
ITEM 8. | FINANCIAL STATEMENTS AND SUPPLEMENTARY DATA |
PIONEER ENERGY SERVICES CORP.
INDEX TO CONSOLIDATED FINANCIAL STATEMENTS
Page | |
51
Report of Independent Registered Public Accounting Firm
The shareholders and board of directors
Pioneer Energy Services Corp.:
Opinion on the Consolidated Financial Statements
We have audited the accompanying consolidated balance sheets of Pioneer Energy Services Corp. and subsidiaries (the Company) as of December 31, 2017 and 2016, the related consolidated statements of operations, shareholders’ equity, and cash flows for each of the years in the three-year period ended December 31, 2017, and the related notes (collectively, the consolidated financial statements). In our opinion, the consolidated financial statements present fairly, in all material respects, the financial position of the Company as of December 31, 2017 and 2016, and the results of its operations and its cash flows for each of the years in the three-year period ended December 31, 2017, in conformity with U.S. generally accepted accounting principles.
We also have audited, in accordance with the standards of the Public Company Accounting Oversight Board (United States) (PCAOB), the Company’s internal control over financial reporting as of December 31, 2017, based on criteria established in Internal Control—Integrated Framework (2013) issued by the Committee of Sponsoring Organizations of the Treadway Commission (COSO), and our report dated February 16, 2018 expressed an unqualified opinion on the effectiveness of the Company’s internal control over financial reporting.
Basis for Opinion
These consolidated financial statements are the responsibility of the Company’s management. Our responsibility is to express an opinion on these consolidated financial statements based on our audits. We are a public accounting firm registered with the PCAOB and are required to be independent with respect to the Company in accordance with the U.S. federal securities laws and the applicable rules and regulations of the Securities and Exchange Commission and the PCAOB.
We conducted our audits in accordance with the standards of the PCAOB. Those standards require that we plan and perform the audit to obtain reasonable assurance about whether the consolidated financial statements are free of material misstatement, whether due to error or fraud. Our audits included performing procedures to assess the risks of material misstatements of the consolidated financial statements, whether due to error or fraud, and performing procedures that respond to those risks. Such procedures included examining, on a test basis, evidence regarding the amounts and disclosures in the consolidated financial statements. Our audits also included evaluating the accounting principles used and significant estimates made by management, as well as evaluating the overall presentation of the consolidated financial statements. We believe that our audits provide a reasonable basis for our opinion.
/s/ KPMG LLP
We have served as the Company’s auditor since 1979.
San Antonio, Texas
February 16, 2018
52
Report of Independent Registered Public Accounting Firm
The shareholders and board of directors
Pioneer Energy Services Corp.:
Opinion on Internal Control Over Financial Reporting
We have audited Pioneer Energy Services Corp.’s and subsidiaries’ (the Company) internal control over financial reporting as of December 31, 2017, based on criteria established in Internal Control—Integrated Framework (2013), issued by the Committee of Sponsoring Organizations of the Treadway Commission. In our opinion, the Company maintained, in all material respects, effective internal control over financial reporting as of December 31, 2017, based on criteria established in Internal Control—Integrated Framework (2013) issued by the Committee of Sponsoring Organizations of the Treadway Commission.
We also have audited, in accordance with the standards of the Public Company Accounting Oversight Board (United States) (PCAOB), the consolidated balance sheets of the Company as of December 31, 2017 and 2016, the related consolidated statements of operations, shareholders’ equity, and cash flows for each of the years in the three-year period ended December 31, 2017, and the related notes (collectively, the consolidated financial statements), and our report dated February 16, 2018 expressed an unqualified opinion on those consolidated financial statements.
Basis for Opinion
The Company’s management is responsible for maintaining effective internal control over financial reporting and for its assessment of the effectiveness of internal control over financial reporting, included in the accompanying Management’s Report on Internal Control over Financial Reporting. Our responsibility is to express an opinion on the Company’s internal control over financial reporting based on our audit. We are a public accounting firm registered with the PCAOB and are required to be independent with respect to the Company in accordance with the U.S. federal securities laws and the applicable rules and regulations of the Securities and Exchange Commission and the PCAOB.
We conducted our audit in accordance with the standards of the PCAOB. Those standards require that we plan and perform the audit to obtain reasonable assurance about whether effective internal control over financial reporting was maintained in all material respects. Our audit of internal control over financial reporting included obtaining an understanding of internal control over financial reporting, assessing the risk that a material weakness exists, and testing and evaluating the design and operating effectiveness of internal control based on the assessed risk. Our audit also included performing such other procedures as we considered necessary in the circumstances. We believe that our audit provides a reasonable basis for our opinion.
Definition and Limitations of Internal Control Over Financial Reporting
A company’s internal control over financial reporting is a process designed to provide reasonable assurance regarding the reliability of financial reporting and the preparation of financial statements for external purposes in accordance with generally accepted accounting principles. A company’s internal control over financial reporting includes those policies and procedures that (1) pertain to the maintenance of records that, in reasonable detail, accurately and fairly reflect the transactions and dispositions of the assets of the company; (2) provide reasonable assurance that transactions are recorded as necessary to permit preparation of financial statements in accordance with generally accepted accounting principles, and that receipts and expenditures of the company are being made only in accordance with authorizations of management and directors of the company; and (3) provide reasonable assurance regarding prevention or timely detection of unauthorized acquisition, use, or disposition of the company’s assets that could have a material effect on the financial statements.
Because of its inherent limitations, internal control over financial reporting may not prevent or detect misstatements. Also, projections of any evaluation of effectiveness to future periods are subject to the risk that controls may become inadequate because of changes in conditions, or that the degree of compliance with the policies or procedures may deteriorate.
/s/ KPMG LLP
San Antonio, Texas
February 16, 2018
53
PIONEER ENERGY SERVICES CORP. AND SUBSIDIARIES
CONSOLIDATED BALANCE SHEETS
December 31, 2017 | December 31, 2016 | ||||||
(in thousands, except share data) | |||||||
ASSETS | |||||||
Current assets: | |||||||
Cash and cash equivalents | $ | 73,640 | $ | 10,194 | |||
Restricted cash | 2,008 | — | |||||
Receivables: | |||||||
Trade, net of allowance for doubtful accounts | 79,592 | 38,764 | |||||
Unbilled receivables | 16,029 | 7,417 | |||||
Insurance recoveries | 13,874 | 17,003 | |||||
Other receivables | 3,510 | 8,939 | |||||
Inventory | 14,057 | 9,660 | |||||
Assets held for sale | 6,620 | 15,093 | |||||
Prepaid expenses and other current assets | 6,229 | 6,926 | |||||
Total current assets | 215,559 | 113,996 | |||||
Property and equipment, at cost | 1,093,635 | 1,058,261 | |||||
Less accumulated depreciation | 544,012 | 474,181 | |||||
Net property and equipment | 549,623 | 584,080 | |||||
Other long-term assets | 1,687 | 2,026 | |||||
Total assets | $ | 766,869 | $ | 700,102 | |||
LIABILITIES AND SHAREHOLDERS’ EQUITY | |||||||
Current liabilities: | |||||||
Accounts payable | $ | 29,538 | $ | 19,208 | |||
Deferred revenues | 905 | 1,449 | |||||
Accrued expenses: | |||||||
Payroll and related employee costs | 21,023 | 14,813 | |||||
Insurance premiums and deductibles | 6,742 | 6,446 | |||||
Insurance claims and settlements | 13,289 | 13,667 | |||||
Interest | 6,624 | 5,395 | |||||
Other | 6,793 | 5,024 | |||||
Total current liabilities | 84,914 | 66,002 | |||||
Long-term debt, less unamortized discount and debt issuance costs | 461,665 | 339,473 | |||||
Deferred income taxes | 3,151 | 8,180 | |||||
Other long-term liabilities | 7,043 | 5,049 | |||||
Total liabilities | 556,773 | 418,704 | |||||
Commitments and contingencies (Note 11) | |||||||
Shareholders’ equity: | |||||||
Preferred stock, 10,000,000 shares authorized; none issued and outstanding | — | — | |||||
Common stock $.10 par value; 200,000,000 shares authorized at December 31, 2017; 77,719,021 and 77,146,906 shares outstanding at December 31, 2017 and December 31, 2016, respectively | 7,835 | 7,766 | |||||
Additional paid-in capital | 546,158 | 541,823 | |||||
Treasury stock, at cost; 630,688 and 515,546 shares at December 31, 2017 and December 31, 2016, respectively | (4,416 | ) | (3,883 | ) | |||
Accumulated deficit | (339,481 | ) | (264,308 | ) | |||
Total shareholders’ equity | 210,096 | 281,398 | |||||
Total liabilities and shareholders’ equity | $ | 766,869 | $ | 700,102 | |||
See accompanying notes to consolidated financial statements.
54
PIONEER ENERGY SERVICES CORP. AND SUBSIDIARIES
CONSOLIDATED STATEMENTS OF OPERATIONS
Year ended December 31, | |||||||||||
2017 | 2016 | 2015 | |||||||||
(in thousands, except per share data) | |||||||||||
Revenues | $ | 446,455 | $ | 277,076 | $ | 540,778 | |||||
Costs and expenses: | |||||||||||
Operating costs | 330,880 | 203,949 | 358,016 | ||||||||
Depreciation and amortization | 98,777 | 114,312 | 150,939 | ||||||||
General and administrative | 69,681 | 61,184 | 73,903 | ||||||||
Bad debt expense (recovery) | 53 | 156 | (188 | ) | |||||||
Impairment | 1,902 | 12,815 | 129,152 | ||||||||
Gain on dispositions of property and equipment, net | (3,608 | ) | (1,892 | ) | (4,344 | ) | |||||
Total costs and expenses | 497,685 | 390,524 | 707,478 | ||||||||
Loss from operations | (51,230 | ) | (113,448 | ) | (166,700 | ) | |||||
Other income (expense): | |||||||||||
Interest expense, net of interest capitalized | (27,039 | ) | (25,934 | ) | (21,222 | ) | |||||
Loss on extinguishment of debt | (1,476 | ) | (299 | ) | (2,186 | ) | |||||
Other income (expense), net | 424 | 558 | (2,611 | ) | |||||||
Total other expense, net | (28,091 | ) | (25,675 | ) | (26,019 | ) | |||||
Loss before income taxes | (79,321 | ) | (139,123 | ) | (192,719 | ) | |||||
Income tax benefit | 4,203 | 10,732 | 37,579 | ||||||||
Net loss | $ | (75,118 | ) | $ | (128,391 | ) | $ | (155,140 | ) | ||
Loss per common share - Basic | $ | (0.97 | ) | $ | (1.96 | ) | $ | (2.41 | ) | ||
Loss per common share - Diluted | $ | (0.97 | ) | $ | (1.96 | ) | $ | (2.41 | ) | ||
Weighted average number of shares outstanding—Basic | 77,390 | 65,452 | 64,310 | ||||||||
Weighted average number of shares outstanding—Diluted | 77,390 | 65,452 | 64,310 | ||||||||
See accompanying notes to consolidated financial statements.
55
PIONEER ENERGY SERVICES CORP. AND SUBSIDIARIES
CONSOLIDATED STATEMENTS OF SHAREHOLDERS’ EQUITY
Shares | Amount | Additional Paid In Capital | Accumulated Earnings (Deficit) | Total Shareholders’ Equity | ||||||||||||||||||||||||||
Common | Treasury | Common | Treasury | |||||||||||||||||||||||||||
(In thousands) | ||||||||||||||||||||||||||||||
Balance as of December 31, 2014 | 64,137 | (317 | ) | $ | 6,414 | $ | (3,030 | ) | $ | 472,457 | $ | 19,223 | $ | 495,064 | ||||||||||||||||
Net loss | — | — | — | — | — | (155,140 | ) | (155,140 | ) | |||||||||||||||||||||
Exercise of options and related income tax effect | 203 | — | 20 | — | 761 | — | 781 | |||||||||||||||||||||||
Purchase of treasury stock | — | (141 | ) | — | (729 | ) | — | — | (729 | ) | ||||||||||||||||||||
Income tax effect of restricted stock vesting | — | — | — | — | (884 | ) | — | (884 | ) | |||||||||||||||||||||
Income tax effect of stock option forfeitures and expirations | — | — | — | — | (78 | ) | — | (78 | ) | |||||||||||||||||||||
Issuance of restricted stock | 616 | — | 62 | — | (62 | ) | — | — | ||||||||||||||||||||||
Stock-based compensation expense | — | — | — | — | 3,629 | — | 3,629 | |||||||||||||||||||||||
Balance as of December 31, 2015 | 64,956 | (458 | ) | $ | 6,496 | $ | (3,759 | ) | $ | 475,823 | $ | (135,917 | ) | $ | 342,643 | |||||||||||||||
Net loss | — | — | — | — | — | (128,391 | ) | (128,391 | ) | |||||||||||||||||||||
Sale of common stock, net of offering costs | 12,075 | — | — | — | 1,208 | — | — | 64,222 | — | — | — | 65,430 | ||||||||||||||||||
Exercise of options and related income tax effect | 46 | — | 5 | — | 178 | — | 183 | |||||||||||||||||||||||
Purchase of treasury stock | — | (58 | ) | — | (124 | ) | — | — | (124 | ) | ||||||||||||||||||||
Income tax effect of restricted stock vesting | — | — | — | — | (1,023 | ) | — | (1,023 | ) | |||||||||||||||||||||
Income tax effect of stock option forfeitures and expirations | — | — | — | — | (1,264 | ) | — | (1,264 | ) | |||||||||||||||||||||
Issuance of restricted stock | 586 | — | 57 | — | (57 | ) | — | — | ||||||||||||||||||||||
Stock-based compensation expense | — | — | — | — | 3,944 | — | 3,944 | |||||||||||||||||||||||
Balance as of December 31, 2016 | 77,663 | (516 | ) | $ | 7,766 | $ | (3,883 | ) | $ | 541,823 | $ | (264,308 | ) | $ | 281,398 | |||||||||||||||
Net loss | — | — | — | — | — | (75,118 | ) | (75,118 | ) | |||||||||||||||||||||
Purchase of treasury stock | — | (115 | ) | — | (533 | ) | — | — | (533 | ) | ||||||||||||||||||||
Issuance of restricted stock | 687 | — | 69 | — | (69 | ) | — | — | ||||||||||||||||||||||
Stock-based compensation expense | — | — | — | — | 4,404 | (55 | ) | 4,349 | ||||||||||||||||||||||
Balance as of December 31, 2017 | 78,350 | (631 | ) | $ | 7,835 | $ | (4,416 | ) | $ | 546,158 | $ | (339,481 | ) | $ | 210,096 | |||||||||||||||
See accompanying notes to consolidated financial statements.
56
PIONEER ENERGY SERVICES CORP. AND SUBSIDIARIES
CONSOLIDATED STATEMENTS OF CASH FLOWS
Year ended December 31, | |||||||||||
2017 | 2016 | 2015 | |||||||||
(in thousands) | |||||||||||
Cash flows from operating activities: | |||||||||||
Net loss | $ | (75,118 | ) | $ | (128,391 | ) | $ | (155,140 | ) | ||
Adjustments to reconcile net loss to net cash provided by (used in) operating activities: | |||||||||||
Depreciation and amortization | 98,777 | 114,312 | 150,939 | ||||||||
Allowance for doubtful accounts, net of recoveries | 53 | 156 | 248 | ||||||||
Write-off of obsolete inventory | — | 101 | — | ||||||||
Gain on dispositions of property and equipment, net | (3,608 | ) | (1,892 | ) | (4,344 | ) | |||||
Stock-based compensation expense | 4,349 | 3,944 | 3,629 | ||||||||
Amortization of debt issuance costs and discount | 1,548 | 1,776 | 1,691 | ||||||||
Loss on extinguishment of debt | 1,476 | 299 | 2,186 | ||||||||
Impairment | 1,902 | 12,815 | 129,152 | ||||||||
Deferred income taxes | (5,030 | ) | (11,608 | ) | (39,286 | ) | |||||
Change in other long-term assets | (1 | ) | 662 | 420 | |||||||
Change in other long-term liabilities | 1,994 | 478 | (132 | ) | |||||||
Changes in current assets and liabilities: | |||||||||||
Receivables | (49,750 | ) | 16,341 | 114,644 | |||||||
Inventory | (4,397 | ) | (630 | ) | 1,267 | ||||||
Prepaid expenses and other current assets | 744 | 310 | 1,769 | ||||||||
Accounts payable | 12,409 | 1,969 | (30,514 | ) | |||||||
Deferred revenues | (348 | ) | (3,985 | ) | 1,922 | ||||||
Accrued expenses | 9,183 | (1,526 | ) | (35,732 | ) | ||||||
Net cash provided by (used in) operating activities | (5,817 | ) | 5,131 | 142,719 | |||||||
Cash flows from investing activities: | |||||||||||
Purchases of property and equipment | (63,277 | ) | (32,381 | ) | (159,615 | ) | |||||
Proceeds from sale of property and equipment | 12,569 | 7,577 | 57,674 | ||||||||
Proceeds from insurance recoveries | 3,344 | 37 | 285 | ||||||||
Net cash used in investing activities | (47,364 | ) | (24,767 | ) | (101,656 | ) | |||||
Cash flows from financing activities: | |||||||||||
Debt repayments | (120,000 | ) | (71,000 | ) | (60,002 | ) | |||||
Proceeds from issuance of debt | 245,500 | 22,000 | — | ||||||||
Debt issuance costs | (6,332 | ) | (819 | ) | (1,877 | ) | |||||
Proceeds from exercise of options | — | 183 | 781 | ||||||||
Proceeds from issuance of common stock, net of offering costs of $4,001 | — | 65,430 | — | ||||||||
Purchase of treasury stock | (533 | ) | (124 | ) | (729 | ) | |||||
Net cash provided by (used in) financing activities | 118,635 | 15,670 | (61,827 | ) | |||||||
Net increase (decrease) in cash, cash equivalents and restricted cash | 65,454 | (3,966 | ) | (20,764 | ) | ||||||
Beginning cash, cash equivalents and restricted cash | 10,194 | 14,160 | 34,924 | ||||||||
Ending cash, cash equivalents and restricted cash | $ | 75,648 | $ | 10,194 | $ | 14,160 | |||||
Supplementary disclosure: | |||||||||||
Interest paid | $ | 25,082 | $ | 24,516 | $ | 22,506 | |||||
Income tax paid | $ | 1,431 | $ | 671 | $ | 2,691 | |||||
Noncash investing and financing activity: | |||||||||||
Change in capital expenditure accruals | $ | (1,830 | ) | $ | 175 | $ | (16,708 | ) | |||
See accompanying notes to consolidated financial statements.
57
PIONEER ENERGY SERVICES CORP. AND SUBSIDIARIES
NOTES TO CONSOLIDATED FINANCIAL STATEMENTS
1. Organization and Summary of Significant Accounting Policies
Business
Pioneer Energy Services Corp. provides land-based drilling services and production services to a diverse group of oil and gas exploration and production companies in the United States and internationally in Colombia. We also provide two of our services (coiled tubing and wireline services) offshore in the Gulf of Mexico.
Our drilling services business segments provide contract land drilling services through four domestic divisions which are located in the Marcellus/Utica, Eagle Ford, Permian Basin and Bakken regions, and internationally in Colombia. In addition to our drilling rigs, we provide the drilling crews and most of the ancillary equipment needed to operate our drilling rigs. Our drilling rig fleet is 100% pad-capable and offers the latest advancements in pad drilling. The following table summarizes our current rig fleet count and composition for each drilling services business segment:
Multi-well, Pad-capable | |||||
AC rigs | SCR rigs | Total | |||
Domestic drilling | 16 | — | 16 | ||
International drilling | — | 8 | 8 | ||
24 | |||||
Our production services business segments provide a range of well, wireline and coiled tubing services to a diverse group of exploration and production companies, with our operations concentrated in the major domestic onshore oil and gas producing regions in the Mid-Continent and Rocky Mountain states and in the Gulf Coast, both onshore and offshore. As of December 31, 2017, the fleet count and composition for each of our production services business segments is as follows:
550 HP | 600 HP | Total | ||||
Well servicing rigs, by horsepower (HP) rating | 113 | 12 | 125 | |||
Onshore | Offshore | Total | ||||
Wireline services units | 108 | 4 | 112 | |||
Coiled tubing services units | 10 | 4 | 14 | |||
Basis of Presentation
The accompanying consolidated financial statements include the accounts of Pioneer Energy Services Corp. and our wholly owned subsidiaries. All intercompany balances and transactions have been eliminated in consolidation. The accompanying consolidated financial statements have been prepared in accordance with accounting principles generally accepted in the United States of America.
In preparing the accompanying consolidated financial statements, we make various estimates and assumptions that affect the amounts of assets and liabilities we report as of the dates of the balance sheets and income and expenses we report for the periods shown in the income statements and statements of cash flows. Our actual results could differ significantly from those estimates. Material estimates that are particularly susceptible to significant changes in the near term relate to our estimate of the allowance for doubtful accounts, our determination of depreciation and amortization expenses, our estimates of projected cash flows and fair values for impairment evaluations, our estimate of the valuation allowance for deferred tax assets, our estimate of the liability relating to the self-insurance portion of our health and workers’ compensation insurance, our estimate of compensation related accruals and our estimate of sales tax audit liability.
In preparing the accompanying consolidated financial statements, we have reviewed events that have occurred after December 31, 2017, through the filing of this Form 10-K, for inclusion as necessary.
Foreign Currencies
Our functional currency for our foreign subsidiary in Colombia is the U.S. dollar. Nonmonetary assets and liabilities are translated at historical rates and monetary assets and liabilities are translated at exchange rates in effect at the end of the
58
period. Income statement accounts are translated at average rates for the period. Gains and losses from remeasurement of foreign currency financial statements into U.S. dollars and from foreign currency transactions are included in other income or expense.
Revenues and Cost Recognition
Drilling Services—Our drilling services business segments earn revenues by drilling oil and gas wells for our clients under daywork contracts. We recognize revenues on daywork contracts for the days completed based on the dayrate specified in each contract.
With most drilling contracts, we receive payments contractually designated for the mobilization of rigs and other equipment. Payments received, and costs incurred for the mobilization services are deferred and recognized on a straight line basis over the related contract term. Costs incurred to relocate rigs and other drilling equipment to areas in which a contract has not been secured are expensed as incurred. Reimbursements that we receive for out-of-pocket expenses are recorded as revenues and the out-of-pocket expenses for which they relate are recorded as operating costs.
Amortization of deferred revenues and costs during the years ended December 31, 2017, 2016 and 2015 were as follows (amounts in thousands):
Year ended December 31, | |||||||||||
2017 | 2016 | 2015 | |||||||||
Amortization of deferred revenues | $ | 2,400 | $ | 1,566 | $ | 1,099 | |||||
Amortization of deferred costs | 4,953 | 2,813 | 2,337 | ||||||||
Our current and long-term deferred revenues and costs as of December 31, 2017 and 2016 were as follows (amounts in thousands):
December 31, 2017 | December 31, 2016 | ||||||
Current: | |||||||
Deferred revenues | $ | 905 | $ | 1,449 | |||
Deferred costs | 1,377 | 2,290 | |||||
Long-term: | |||||||
Deferred revenues | $ | 558 | $ | 202 | |||
Deferred costs | 402 | 212 | |||||
With most term drilling contracts, we are entitled to receive a full or reduced rate of revenues from our clients if they choose to place a rig on standby or to early terminate the contract before its original expiration term. Generally, these revenues are billed and collected over the remaining term of the contract, as the rig is often placed on standby rather than fully released from the contract, and thus may go back to work at the client’s decision any time before the end of the contract. Some of our drilling contracts contain “make-whole” provisions whereby if we are able to secure additional work for the rig with another client, then each party is entitled to a make-whole payment. If the dayrates under the new contract are less than the dayrates in the original contract, we would be entitled to a reduced revenue dayrate from the terminating client, and likewise, the terminating client may be entitled to a payment from us if the new contract dayrates exceed those of the original contract. A client may also choose to early terminate the contract and make an upfront early termination payment based on a per day rate for the remaining term of the contract. Revenues derived from rigs placed on standby or from the early termination of term drilling contracts are deferred and recognized as the amounts become fixed or determinable, over the remainder of the original term or when the rig is sold. Currently, there are no drilling rigs in our fleet with contracts placed on standby.
Drilling Contracts—As of December 31, 2017, all 16 of our domestic drilling rigs are earning revenues, 14 of which are under term contracts. Of the eight rigs in Colombia, six are earning revenues, five of which are under term contracts. The term contracts in Colombia are cancelable by our clients without penalty, although the contract would still require payment for demobilization services and requires 30 days notice. We are actively marketing our idle drilling rigs in Colombia to various operators and we are evaluating other options, including the possibility of the sale of some or all of our assets in Colombia.
59
Production Services—Our production services business segments earn revenues for well servicing, wireline services and coiled tubing services pursuant to master services agreements based on purchase orders, contracts or other arrangements with the client that include fixed or determinable prices. Production services jobs are generally short-term and are charged at current market rates. Production service revenue is recognized when the service has been rendered and collectability is reasonably assured.
All of our revenues are recognized net of sales taxes when applicable.
Concentration of Clients—We derive a significant portion of our revenue from a limited number of major clients. For the years ended December 31, 2017, 2016 and 2015, our drilling and production services to our top three clients accounted for approximately 20%, 26%, and 29%, respectively, of our revenue.
Cash and Restricted Cash
For purposes of the consolidated statements of cash flows, we consider all highly liquid instruments purchased with a maturity of three months or less to be cash equivalents. We had no cash equivalents at December 31, 2017 and 2016.
Our restricted cash balance at December 31, 2017 reflects the portion of net proceeds from the issuance of our senior secured term loan which are currently held in a restricted account until the completion of certain administrative tasks related to providing access rights to certain of our real property, which we expect to complete within 12 months. Accordingly, the related restricted cash is presented as current in the accompanying consolidated balance sheets.
Trade Accounts Receivable
We record trade accounts receivable at the amount we invoice to our clients. These accounts do not bear interest. The allowance for doubtful accounts is our best estimate of the amount of probable credit losses in our accounts receivable as of the balance sheet date. We determine the allowance based on the credit worthiness of our clients and general economic conditions. Consequently, an adverse change in those factors could affect our estimate of our allowance for doubtful accounts.
We review our allowance for doubtful accounts on a monthly basis. Our typical drilling contract provides for payment of invoices in 30 days. We generally do not extend payment terms beyond 30 days and have not extended payment terms beyond 90 days for any of our domestic contracts in the last three fiscal years. Our production services terms generally provide for payment of invoices in 30 days. Balances more than 90 days past due are reviewed individually for collectability. We charge off account balances against the allowance after we have exhausted all reasonable means of collection and determined that the potential for recovery is remote. We do not have any off-balance sheet credit exposure related to our clients.
The changes in our allowance for doubtful accounts consist of the following (amounts in thousands):
Year ended December 31, | |||||||||||
2017 | 2016 | 2015 | |||||||||
Balance at beginning of year | $ | 1,678 | $ | 2,254 | $ | 2,547 | |||||
Increase (decrease) in allowance charged to expense | (197 | ) | 404 | 472 | |||||||
Accounts charged against the allowance | (257 | ) | (980 | ) | (765 | ) | |||||
Balance at end of year | $ | 1,224 | $ | 1,678 | $ | 2,254 | |||||
60
Unbilled Accounts Receivable
The asset “unbilled receivables” represents revenues we have recognized in excess of amounts billed on drilling contracts and production services completed. We typically bill our clients at 15-day intervals during the performance of daywork drilling contracts and upon completion of the daywork contract. Our unbilled receivables as of December 31, 2017 and 2016 were as follows (amounts in thousands):
December 31, 2017 | December 31, 2016 | ||||||
Daywork drilling contracts in progress | $ | 15,254 | $ | 7,042 | |||
Production services | 775 | 375 | |||||
$ | 16,029 | $ | 7,417 | ||||
Inventories
Inventories primarily consist of drilling rig replacement parts and supplies held for use by our drilling operations in Colombia, and supplies held for use by our wireline and coiled tubing operations. Inventories are valued at the lower of cost (first in, first out or actual) or net realizable value.
Prepaid Expenses and Other Current Assets
Prepaid expenses and other current assets include items such as insurance, rent deposits and fees. We routinely expense these items in the normal course of business over the periods these expenses benefit. Prepaid expenses and other current assets also include the current portion of deferred mobilization costs for certain drilling contracts that are recognized on a straight-line basis over the contract term.
Property and Equipment
Property and equipment are carried at cost less accumulated depreciation. Depreciation is provided for our assets over the estimated useful lives of the assets using the straight-line method. We record the same depreciation expense whether our equipment is idle or working. We charge our expenses for maintenance and repairs to operating costs. We capitalize expenditures for renewals and betterments to the appropriate property and equipment accounts.
Other Long-Term Assets
Other long-term assets consist of cash deposits related to the deductibles on our workers’ compensation insurance policies, deferred compensation plan investments, the long-term portion of deferred mobilization costs, and intangible assets.
Other Current Liabilities
Our other accrued expenses include accruals for items such as property tax, sales tax, and professional and other fees. We routinely expense these items in the normal course of business over the periods these expenses benefit.
Other Long-Term Liabilities
Our other long-term liabilities consist of the noncurrent portion of liabilities associated with our long-term compensation plans, deferred lease liabilities, and the long-term portion of deferred mobilization revenues.
Treasury Stock
Treasury stock purchases are accounted for under the cost method whereby the cost of the acquired common stock is recorded as treasury stock. Gains and losses on the subsequent reissuance of treasury stock shares are credited or charged to additional paid in capital using the average cost method.
Stock-based Compensation
We recognize compensation cost for our stock-based compensation awards based on the fair value estimated in accordance with ASC Topic 718, Compensation—Stock Compensation. For our awards with graded vesting, we recognize compensation expense on a straight-line basis over the service period for each separately vesting portion of the award as if the award was,
61
in substance, multiple awards. We adopted ASU 2016-09 in the first quarter of 2017 and elected to prospectively recognize forfeitures when they occur, rather than estimating future forfeitures.
Income Taxes
We follow the asset and liability method of accounting for income taxes, under which we recognize deferred tax assets and liabilities for the future tax consequences attributable to differences between the financial statement carrying amounts of existing assets and liabilities and their respective tax basis. We measure our deferred tax assets and liabilities by using the enacted tax rates we expect to apply to taxable income in the years in which we expect to recover or settle those temporary differences. The effect of a change in tax rates on deferred tax assets and liabilities is reflected in income in the period of enactment. The recent change in tax rates resulting from the enactment of the Tax Cuts and Jobs Act enacted on December 22, 2017 is described in more detail in Note 5, Income Taxes.
Related-Party Transactions
During the years ended December 31, 2017, 2016 and 2015, the Company paid approximately $0.2 million in each period for trucking and equipment rental services, which represented arms-length transactions, to Gulf Coast Lease Service. Joe Freeman, our Senior Vice President of Well Servicing, serves as the President of Gulf Coast Lease Service, which is owned and operated by Mr. Freeman’s two sons. Mr. Freeman does not receive compensation from Gulf Coast Lease Service, and he serves primarily in an advisory role to his sons.
Comprehensive Income
We have not reported comprehensive income due to the absence of items of other comprehensive income in the periods presented.
Recently Issued Accounting Standards
Changes to accounting principles generally accepted in the United States of America (“U.S. GAAP”) are established by the Financial Accounting Standards Board (FASB) in the form of Accounting Standards Updates (ASUs) to the FASB Accounting Standards Codification (ASC). We consider the applicability and impact of all ASUs; any ASUs not listed below were assessed and determined to be either not applicable or are expected to have an immaterial impact on our consolidated financial position and results of operations.
• | Revenue Recognition. In May 2014, the FASB issued ASU No. 2014-09, a comprehensive new revenue recognition standard that will supersede nearly all existing revenue recognition guidance. The standard outlines a single comprehensive model for revenue recognition based on the core principle that a company will recognize revenue when promised goods or services are transferred to clients, in an amount that reflects the consideration to which an entity expects to be entitled in exchange for those goods or services. We have substantially completed our assessment of the impact of this new standard. |
We expect that the application of this new standard will result in the recognition of our services as a single performance obligation comprised of a series of distinct time increments which are satisfied over time. Revenues associated with mobilization and demobilization, which do not relate to a distinct good or service, will be estimated and recognized ratably over the term of the contract. All other revenues associated with the services we provide, including dayrate revenues and production services revenues, will continue to be recognized in the period during which the services are performed. We expect our revenue recognition under the new standard to differ from our current revenue recognition pattern primarily as it relates to drilling demobilization revenue, which, prior to the new standard, is recognized when the demobilization activity occurs at the end of the contract term, but under the new guidance will be estimated and recognized over the term of the contract.
This new standard is effective for us beginning January 1, 2018, which we have adopted using the modified retrospective method, in which the standard is applied to all contracts existing as of the date of initial application, with the cumulative effect of applying the standard recognized in retained earnings (the adoption date adjustments). We estimate that the adoption of this standard results in a cumulative effect adjustment of less than $1.0 million before applicable income taxes, which primarily consists of the impact of the timing difference related to recognition of demobilization revenue for affected contracts.
62
As we work towards finalizing our assessment, we are continuing to evaluate the requirements of this standard and complete other implementation activities such as implementing new procedures, finalizing the adoption date adjustment and drafting disclosures.
• | Leases. In February 2016, the FASB issued ASU No. 2016-02, Leases, which among other things, requires lessees to recognize substantially all leases on the balance sheet, with expense recognition that is similar to the current lease standard, and aligns the principles of lessor accounting with the principles of the FASB’s new revenue guidance (referenced above). This ASU is effective for us beginning January 1, 2019 and requires a modified retrospective application, although certain practical expedients are permitted. |
We have performed a scoping and preliminary assessment of the impact of this new standard. As a lessee, this standard will impact us in situations where we lease real estate and office equipment, for which we will recognize a right-of-use asset and a corresponding lease liability on our consolidated balance sheet. The future lease obligations disclosed in Note 4, Leases, provides some insight to the estimated impact of adoption for us as a lessee. As a lessor, we expect the adoption of this new standard will apply to our drilling contracts and as a result, we expect to have a lease component and a service component of our revenues derived from these contracts. We have not yet determined the impact this standard may have on our production services businesses. We continue to evaluate the impact of this guidance and have not yet determined its impact on our financial position and results of operations.
• | Stock-Based Compensation. In March 2016, the FASB issued ASU No. 2016-09, Stock Compensation: Improvements to Employee Share-Based Payment Accounting, to reduce complexity in accounting standards involving several aspects of the accounting for employee share-based payment transactions, including the income tax consequences, classification of awards as either equity or liabilities, and classification on the statement of cash flows. |
We adopted this ASU as of January 1, 2017 and we recognized a $3.1 million deferred tax asset for previously unrecognized tax benefits, which was then fully reserved by a valuation allowance (see Note 5, Income Taxes). Additionally, we elected to prospectively account for forfeitures as they occur, rather than estimating future forfeitures. The total cumulative-effect impact of adoption, net of valuation allowances, was approximately $55,000 relating to our change in accounting for forfeitures, and was recognized as a reduction to retained earnings in our consolidated statement of shareholders’ equity, together with the impact of stock-based compensation expense. The adoption of this ASU also results in the presentation of any excess tax benefits resulting from the exercise of stock options as operating cash flows in the statement of cash flows, which we apply retrospectively for any comparative periods affected.
• | Restricted Cash in Statement of Cash Flows. In November 2016, the FASB issued ASU No. 2016-18, Restricted Cash (a consensus of the FASB Emerging Issues Task Force), which requires that restricted cash be included with cash and cash equivalents when reconciling the beginning and end-of-period total amounts shown on the statement of cash flows. This guidance must be applied retrospectively to all periods presented. We early adopted this ASU effective December 31, 2017. See Cash and Restricted Cash section above, included in this Note 1, Organization and Summary of Significant Accounting Policies, for detail regarding the nature of our restricted cash. |
Reclassifications
Certain amounts in the consolidated financial statements for the prior years have been reclassified to conform to the current year’s presentation.
We revised our reportable business segments as of the fourth quarter of 2017, which now include five operating segments, comprised of two drilling services business segments (domestic and international drilling) and three production services business segments (well servicing, wireline services and coiled tubing services). We revised our segments to reflect changes in the basis used by management in making decisions regarding our business for resource allocation and performance assessment. These changes reflect our current operating focus as is required by ASC Topic 280, Segment Reporting. See Note 10, Segment Information for this revised presentation.
63
2. Property and Equipment
As of December 31, 2017 and 2016, the estimated useful lives and costs of our asset classes are as follows:
As of December 31, | |||||||||
2017 | 2016 | ||||||||
Lives | Cost (amounts in thousands) | ||||||||
Drilling rigs and equipment | 3 - 25 | $ | 594,743 | $ | 582,477 | ||||
Well servicing rigs and equipment | 3 - 20 | 244,747 | 225,125 | ||||||
Wireline units and equipment | 1 - 10 | 142,224 | 141,959 | ||||||
Coiled tubing units and equipment | 1 - 7 | 18,141 | 16,347 | ||||||
Vehicles | 3 - 10 | 47,932 | 45,424 | ||||||
Office equipment | 3 - 10 | 12,717 | 11,628 | ||||||
Buildings and improvements | 3 - 40 | 24,013 | 23,884 | ||||||
Property and equipment not yet placed in service | — | 6,751 | 9,050 | ||||||
Land | — | 2,367 | 2,367 | ||||||
$ | 1,093,635 | $ | 1,058,261 | ||||||
Capital Expenditures—Our capital expenditures were $61.4 million, $32.6 million and $142.9 million during the years ended December 31, 2017, 2016, and 2015, respectively, which includes $0.4 million, $0.2 million and $3.0 million, respectively, of capitalized interest costs incurred in connection with the expansion of our well servicing fleet in 2017 and the construction of new drilling rigs and other drilling equipment in 2016 and 2015.
Capital expenditures during 2017 primarily related to the acquisition of 20 well servicing rigs and expansion of our wireline fleet, upgrades to certain domestic drilling rigs, routine capital expenditures necessary to deploy assets that were previously idle, and other new drilling equipment and trucks. Capital expenditures during 2016 consisted primarily of routine expenditures to maintain our drilling and production services fleets, and expenditures for equipment ordered in 2014 before the market slowdown. During 2015, capital expenditures primarily related to our five drilling rigs which began construction during 2014 and were completed in 2015, as well as unit additions to our production services fleets that were ordered in 2014.
Capital expenditures incurred for property and equipment not yet placed in service as of December 31, 2017 was primarily related to routine refurbishments on one international drilling rig in preparation for its deployment in 2018, installments on the purchase of three wireline units and one coiled tubing unit, and scheduled refurbishments on drilling and production services equipment. At December 31, 2016, property and equipment not yet placed in service was primarily related to new drilling equipment that was ordered in 2014 but required a long lead-time for delivery, as well as deposits for 20 well servicing rigs and four new wireline units that were on order for delivery in 2017.
Gain/Loss on Disposition of Property—We recorded a net gain during the year ended December 31, 2017 of $3.6 million on the disposition of property and equipment, primarily for sales of drilling and coiled tubing equipment and vehicles, as well as the loss of drill pipe in operation, for which we were reimbursed by our client. Net gains in 2017 also included the disposal of three cranes that were damaged, for which we received $0.2 million of the $0.8 million of insurance proceeds and expect to receive the remaining proceeds in early 2018.
During 2016, we recorded a net gain of $1.9 million on the disposition of property and equipment, primarily for the sale of three SCR drilling rigs and other drilling equipment for aggregate net proceeds of $11.9 million, and the disposal of excess drill pipe for a gain. The net gains on disposition of assets were partially offset by a loss on the disposition of damaged property when one of our AC drilling rigs sustained damages that resulted in a disposal of damaged components with an aggregate net carrying value of $4.0 million, for which we received insurance proceeds of $3.1 million in January 2017.
During 2015, we recorded a net gain of $4.3 million primarily from the sale of 32 drilling rigs and other drilling equipment which we sold for aggregate net proceeds of $53.6 million.
Assets Held for Sale—As of December 31, 2017, our consolidated balance sheet reflects assets held for sale of $6.6 million, which primarily represents the fair value of three domestic SCR drilling rigs and one domestic mechanical drilling rig, as well as two wireline units and one coiled tubing unit and spare equipment. As of December 31, 2016, our consolidated balance sheet reflects assets held for sale of $15.1 million, which primarily represents the fair value of six domestic mechanical and SCR drilling rigs and drilling equipment, 13 wireline units, 20 older well servicing rigs that were traded in for 20 new-model rigs in the first quarter of 2017, and certain coiled tubing equipment.
64
Impairments—We evaluate for potential impairment of long-lived assets when indicators of impairment are present, which may include, among other things, significant adverse changes in industry trends (including revenue rates, utilization rates, oil and natural gas market prices, and industry rig counts). In performing an impairment evaluation, we estimate the future undiscounted net cash flows from the use and eventual disposition of the assets grouped at the lowest level that independent cash flows can be identified. We perform an impairment evaluation and estimate future undiscounted cash flows for each of our reporting units separately, which are our domestic drilling services, international drilling services, well servicing, wireline services and coiled tubing services segments. If the sum of the estimated future undiscounted net cash flows is less than the carrying amount of the asset group, then we determine the fair value of the asset group. The amount of an impairment charge is measured as the difference between the carrying amount and the fair value of the assets.
Beginning in late 2014, oil prices declined significantly resulting in a downturn in our industry that persisted through 2016, affecting both drilling and production services. As a result, we performed several impairment evaluations on our long-lived assets, in accordance with ASC Topic 360, Property, Plant and Equipment, summarized below.
As of December 31, 2014, we owned a total of 31 mechanical and lower horsepower electric drilling rigs, all of which were subsequently sold or placed as held for sale during 2015. As the downturn worsened through 2015, resulting in significantly reduced revenue and utilization rates, and our projections reflected a more delayed recovery than previously anticipated, we performed impairment testing in 2015 on all the SCR drilling rigs in our domestic and international fleets, and our coiled tubing operations.
As a result of the impairment testing performed in 2015, we recognized $9.7 million to reduce the carrying values of the six SCR drilling rigs that were not pad-capable, and $18.6 million to reduce the carrying values of the six domestic pad-capable SCR rigs in our fleet (those equipped with either a walking or skidding system), to their estimated fair values, based on market appraisals which are considered Level 3 inputs as defined by ASC Topic 820, Fair Value Measurements and Disclosures. All of these drilling rigs were subsequently either sold, retired, or placed as held for sale during 2015 and 2016.
We also recognized impairment charges during 2015 of $60.2 million related to our international drilling operations in Colombia ($50.2 million to reduce the carrying values of all eight drilling rigs and related drilling equipment, $3.6 million to reduce the carrying value of inventory, and $6.4 million to reduce the carrying value of nonrecoverable prepaid taxes) and $30.9 million related to our coiled tubing operations ($14.3 million related to our coiled tubing intangibles and $16.6 million to reduce the carrying values of our coiled tubing units and equipment to their estimated fair value, based on market appraisals).
As business conditions and our projected cash flows for our Colombian operations improved as compared to the projections used for the impairment analysis in 2015, we did not perform any impairment testing on this business in 2016 or 2017. However, due to lower than anticipated operating results in 2016 and 2017 and a decline in our projected cash flows for the coiled tubing reporting unit, we performed an impairment analysis of our coiled tubing long-lived assets at September 30, 2016 and again at June 30, 2017, which indicated that our projected net undiscounted cash flows associated with the coiled tubing reporting unit were in excess of the net carrying value of the assets at both dates and thus no impairment was present.
During the years ended December 31, 2017, 2016 and 2015, we recognized impairment charges of $1.9 million, $11.9 million, and $9.9 million, respectively, to reduce the carrying values of assets which were classified as held for sale, to their estimated fair values, based on expected sales prices which are classified as Level 3 inputs as defined by ASC Topic 820, Fair Value Measurements and Disclosures. During the year ended December 31, 2016, we also recognized $0.9 million of impairment charges to reduce the carrying value of a portion of steel that is on hand for the construction of drilling rigs, which we no longer believe is likely to be used.
65
The following table summarizes impairment expense recognized during the years ended December 31, 2017, 2016, and 2015 (amounts in thousands):
Year ended December 31, | |||||||||||
2017 | 2016 | 2015 | |||||||||
Assets held for sale | $ | 1,902 | $ | 11,897 | $ | 9,858 | |||||
Colombian assets | — | — | 60,130 | ||||||||
Domestic drilling rigs and equipment | — | 918 | 28,228 | ||||||||
Coiled tubing assets | — | — | 30,936 | ||||||||
$ | 1,902 | $ | 12,815 | $ | 129,152 | ||||||
In order to estimate our future undiscounted cash flows from the use and eventual disposition of our drilling assets, we incorporated probabilities of selling these assets in the near term, versus working them at a significantly reduced expected rate of utilization through the end of their remaining useful lives. The most significant assumptions used in our analysis are the expected margin per day and utilization, as well as the estimated proceeds upon any future sale or disposal of the assets. We used an income approach to estimate the fair value of our coiled tubing services reporting unit in 2016 and 2017. The most significant inputs used in our impairment analysis of our coiled tubing operations include the projected utilization and pricing of our coiled tubing services, which are classified as Level 3 inputs as defined by ASC Topic 820, Fair Value Measurements and Disclosures.
Although we believe the assumptions and estimates used in our impairment analyses are reasonable and appropriate, different assumptions and estimates could materially impact the analyses and resulting conclusions. The assumptions used in the impairment evaluation are inherently uncertain and require management judgment. These impairment charges are not expected to have an impact on our liquidity or debt covenants; however, they are a reflection of the overall downturn in our industry and decline in our projected future cash flows. If any of our assets become or remain idle for an extended amount of time, then our estimated cash flows may further decrease, and therefore the probability of a near term sale may increase. If any of the foregoing were to occur, we may incur additional impairment charges.
3. Debt
Our debt consists of the following (amounts in thousands):
December 31, 2017 | December 31, 2016 | ||||||
Senior secured term loan | $ | 175,000 | $ | — | |||
Senior secured revolving credit facility | — | 46,000 | |||||
Senior notes | 300,000 | 300,000 | |||||
475,000 | 346,000 | ||||||
Less unamortized discount (based on imputed interest rate of 10.44%) | (3,387 | ) | — | ||||
Less unamortized debt issuance costs | (9,948 | ) | (6,527 | ) | |||
$ | 461,665 | $ | 339,473 | ||||
Senior Secured Term Loan
Our senior secured term loan (the “Term Loan”) entered into on November 8, 2017 provided for one drawing in the amount of $175 million, net of a 2% original issue discount. Proceeds from the issuance of the Term Loan were used to repay the entire outstanding balance under our Revolving Credit Facility, plus fees and accrued and unpaid interest, as well as the fees and expenses associated with entering into the Term Loan and ABL Facility, which is further described below. The remainder of the proceeds are available to be used for other general corporate purposes.
The Term Loan is not subject to amortization payments of principal. Interest on the principal amount accrues at the LIBOR rate or the base rate as defined in the agreement, at our option, plus an applicable margin of 7.75% and 6.75%, respectively. The Term Loan is set to mature on November 8, 2022, or earlier, subject to certain circumstances as described in the agreement, and including an earlier maturity date if the outstanding balance of the Senior Notes exceeds $15.0 million on December 14, 2021, at which time the Term Loan would then mature. However, the Term Loan may be prepaid, at our option, at any time, in whole or in part, subject to a minimum of $5 million, and subject to a declining call premium as defined in the agreement.
66
The Term Loan contains a financial covenant requiring the ratio of (i) the net orderly liquidation value of our fixed assets (based on appraisals obtained as required by our lenders), on a consolidated basis, in which the lenders under the Term Loan maintain a first priority security interest, plus proceeds of asset dispositions not required to be used to effect a prepayment of the Term Loan to (ii) the outstanding principal amount of the Term Loan, to be at least equal to 1.50 to 1.00 as of any June 30 or December 31 of any calendar year through maturity.
The Term Loan contains customary mandatory prepayments from the proceeds of certain transactions including certain asset dispositions and debt issuances, and has additional customary restrictions that, among other things, and subject to certain exceptions, limit our ability to:
• | incur additional debt; |
• | incur or permit liens on assets; |
• | make investments and acquisitions; |
• | consolidate or merge with another company; |
• | engage in asset sales; and |
• | pay dividends or make distributions. |
In addition, the Term Loan contains customary events of default, upon the occurrence and during the continuation of any of which the applicable margin would increase by 2% per year, including without limitation:
• | payment defaults; |
• | covenant defaults; |
• | material breaches of representations or warranties; |
• | event of default under, or acceleration of, other material indebtedness; |
• | bankruptcy or insolvency; |
• | material judgments against us; |
• | failure of any security document supporting the Term Loan; and |
• | change of control. |
Our obligations under the Term Loan are guaranteed by our wholly-owned domestic subsidiaries, and are secured by substantially all of our domestic assets, in each case, subject to certain exceptions and permitted liens.
Asset-based Lending Facility
In addition to entering into the Term Loan, on November 8, 2017, we also entered into a senior secured revolving asset-based credit facility (the “ABL Facility”) providing for borrowings in the aggregate principal amount of up to $75 million, subject to a borrowing base and including a $30 million sub-limit for letters of credit. The ABL Facility bears interest, at our option, at the LIBOR rate or the base rate as defined in the ABL Facility, plus an applicable margin ranging from 1.75% to 3.25%, based on average availability on the ABL Facility. The ABL Facility requires a commitment fee due monthly based on the average monthly unused amount of the commitments of the lenders, a fronting fee due for each letter of credit issued, and a monthly letter of credit fee due based on the average undrawn amount of letters of credit outstanding during such period. The ABL Facility is generally set to mature 90 days prior to the maturity of the Term Loan, subject to certain circumstances, including the future repayment, extinguishment or refinancing of our Term Loan and/or Senior Notes prior to their respective maturity dates. Availability under the ABL Facility will be determined by reference to a borrowing base as defined in the agreement, generally comprised of a percentage of our accounts receivable and inventory.
We have not drawn upon the ABL Facility to date. As of December 31, 2017, we had $9.7 million in committed letters of credit, which, after borrowing base limitations, resulted in borrowing availability of $53.1 million. Borrowings available under the ABL Facility are available for general corporate purposes and there are no limitations on our ability to access the borrowing capacity provided there is no default and compliance with the covenants under the ABL Facility is maintained. Additionally, if our availability under the ABL Facility is less than 15% of the maximum amount, we are required to maintain a minimum fixed charge coverage ratio, as defined in the ABL Facility, of at least 1.00 to 1.00, measured on a trailing 12 month basis.
The ABL Facility also contains customary restrictive covenants which, subject to certain exceptions, limit, among other things, our ability to:
• | declare dividends and make other distributions; |
67
• | issue or sell certain equity interests; |
• | optionally prepay, redeem or repurchase certain of our subordinated indebtedness; |
• | make loans or investments (including acquisitions); |
• | incur additional indebtedness or modify the terms of permitted indebtedness; |
• | grant liens; |
• | change our business or the business of our subsidiaries; |
• | merge, consolidate, reorganize, recapitalize, or reclassify our equity interests; |
• | sell our assets, and |
• | enter into certain types of transactions with affiliates. |
Our obligations under the ABL Facility are guaranteed by us and our domestic subsidiaries, subject to certain exceptions, and are secured by (i) a first-priority perfected security interest in all inventory and cash, and (ii) a second-priority perfected security in substantially all of our tangible and intangible assets, in each case, subject to certain exceptions and permitted liens.
Senior Notes
In 2014, we issued $300 million of unregistered senior notes at face value, with a coupon interest rate of 6.125% that are due in 2022 (the “Senior Notes”). The Senior Notes will mature on March 15, 2022 with interest due semi-annually in arrears on March 15 and September 15 of each year. We have the option to redeem the Senior Notes, in whole or in part, at any time on or after March 15, 2017 in each case at the redemption price specified in the Indenture dated March 18, 2014 (the “Indenture”) plus any accrued and unpaid interest and any additional interest (as defined in the Indenture) thereon to the date of redemption.
In accordance with a registration rights agreement with the holders of our Senior Notes, we filed an exchange offer registration statement on Form S-4 with the Securities and Exchange Commission that became effective on October 2, 2014. The exchange offer registration statement enabled the holders of our Senior Notes to exchange their senior notes for publicly registered notes with substantially identical terms. References to the “Senior Notes” herein include the senior notes issued in the exchange offer.
If we experience a change of control (as defined in the Indenture), we will be required to make an offer to each holder of the Senior Notes to repurchase all or any part of the Senior Notes at a purchase price equal to 101% of the principal amount of each Senior Note, plus accrued and unpaid interest, if any, to the date of repurchase. If we engage in certain asset sales, within 365 days of such sale we will be required to use the net cash proceeds from such sale, to the extent we do not reinvest those proceeds in our business, to make an offer to repurchase the Senior Notes at a price equal to 100% of the principal amount of each Senior Note, plus accrued and unpaid interest to the repurchase date.
The Indenture, among other things, limits us and certain of our subsidiaries, subject to certain exceptions, in our ability to:
• | pay dividends on stock, repurchase stock, redeem subordinated indebtedness or make other restricted payments and investments; |
• | incur, assume or guarantee additional indebtedness or issue preferred or disqualified stock; |
• | create liens on our or their assets; |
• | enter into sale and leaseback transactions; |
• | sell or transfer assets; |
• | borrow, pay dividends, or transfer other assets from certain of our subsidiaries; |
• | consolidate with or merge with or into, or sell all or substantially all of our properties to any other person; |
• | enter into transactions with affiliates; and |
• | enter into new lines of business. |
The Senior Notes are not subject to any sinking fund requirements. The Senior Notes are fully and unconditionally guaranteed, jointly and severally, on a senior unsecured basis by certain of our existing domestic subsidiaries and by certain of our future domestic subsidiaries. (See Note 13, Guarantor/Non-Guarantor Condensed Consolidated Financial Statements.)
Senior Secured Revolving Credit Facility and Loss on Extinguishment of Debt
We had a credit agreement, most recently amended on June 30, 2016, with Wells Fargo Bank, N.A. and a syndicate of lenders which provided for a senior secured revolving credit facility, with sub-limits for letters of credit and swing-line
68
loans, of up to an aggregate commitment amount of $150 million, all of which was set to mature in March 2019 (the “Revolving Credit Facility”). However, in connection with our entry into the Term Loan in November 2017, as described above, all indebtedness outstanding under the Revolving Credit Facility was repaid, together with related costs and expenses, and the Revolving Credit Facility was retired. In connection with the retirement of the Revolving Credit Facility in 2017, we recognized $1.5 million of loss on extinguishment of debt for the write off of the unamortized debt issuance costs, which were being amortized using the straight-line method over the term of the agreement. Additionally, during the years ended December 31, 2016 and 2015, we recognized $0.3 million and $2.2 million, respectively, of loss on extinguishment of debt for the reduction of borrowing capacity under our Revolving Credit Facility.
Debt Issuance Costs and Original Issue Discount
Costs incurred in connection with the issuance of our Senior Notes were capitalized and are being amortized using the effective interest method over the term of the Senior Notes which mature in March 2022. The original issue discount and costs incurred in connection with the issuance of the Term Loan were capitalized and are being amortized using the effective interest method over the expected term of the agreement. Costs incurred in connection with the ABL Facility were capitalized and are being amortized using the straight-line method over the expected term of the agreement.
4. Leases
We lease our corporate office facilities in San Antonio, Texas, and we lease real estate at 38 other locations, which are primarily used for field offices, storage and maintenance yards, and field personnel housing. We lease these properties, as well as office and other equipment, under non-cancelable operating leases, most of which contain renewal options and some of which contain escalation clauses. We recognize rent expense on a straight-line basis for our leases with escalating payments.
Rent expense under operating leases, including rental exit costs, was $4.8 million, $5.0 million and $6.2 million for the years ended December 31, 2017, 2016 and 2015, respectively. Future lease obligations required under non-cancelable operating leases as of December 31, 2017 were as follows (amounts in thousands):
Year ended December 31, | |||
2018 | $ | 3,081 | |
2019 | 2,273 | ||
2020 | 1,261 | ||
2021 | 818 | ||
2022 | 623 | ||
Thereafter | 1,846 | ||
$ | 9,902 | ||
5. Income Taxes
The jurisdictional components of loss before income taxes consist of the following (amounts in thousands):
Year ended December 31, | |||||||||||
2017 | 2016 | 2015 | |||||||||
Domestic | $ | (76,078 | ) | $ | (122,277 | ) | $ | (123,499 | ) | ||
Foreign | (3,243 | ) | (16,846 | ) | (69,220 | ) | |||||
Loss before income taxes | $ | (79,321 | ) | $ | (139,123 | ) | $ | (192,719 | ) | ||
69
The components of our income tax expense (benefit) consist of the following (amounts in thousands):
Year ended December 31, | |||||||||||
2017 | 2016 | 2015 | |||||||||
Current: | |||||||||||
Federal | $ | (81 | ) | $ | (219 | ) | $ | (535 | ) | ||
State | 146 | (95 | ) | 401 | |||||||
Foreign | 978 | 1,189 | 1,238 | ||||||||
1,043 | 875 | 1,104 | |||||||||
Deferred: | |||||||||||
Federal | (5,417 | ) | (12,500 | ) | (42,113 | ) | |||||
State | 143 | 902 | 29 | ||||||||
Foreign | 28 | (9 | ) | 3,401 | |||||||
(5,246 | ) | (11,607 | ) | (38,683 | ) | ||||||
Income tax benefit | $ | (4,203 | ) | $ | (10,732 | ) | $ | (37,579 | ) | ||
The difference between the income tax benefit and the amount computed by applying the federal statutory income tax rate of 35% to loss before income taxes consists of the following (amounts in thousands):
Year ended December 31, | |||||||||||
2017 | 2016 | 2015 | |||||||||
Expected tax expense (benefit) | $ | (27,762 | ) | $ | (48,693 | ) | $ | (67,452 | ) | ||
Valuation allowance: | |||||||||||
Valuation allowance on operations | 24,265 | 38,324 | 20,329 | ||||||||
Impact of Tax Reform Act on valuation allowance | (25,564 | ) | — | — | |||||||
Change in tax rate | 20,147 | 516 | — | ||||||||
State income taxes | 339 | (3,033 | ) | (2,066 | ) | ||||||
Foreign currency translation loss | 599 | 838 | 8,660 | ||||||||
Net tax benefits and nondeductible expenses in foreign jurisdictions | 1,493 | 407 | 2,135 | ||||||||
Incentive stock options | 1,297 | 97 | 83 | ||||||||
Nondeductible expenses for tax purposes | 796 | 386 | 577 | ||||||||
Expiration of capital loss | — | 641 | — | ||||||||
Other, net | 187 | (215 | ) | 155 | |||||||
Income tax benefit | $ | (4,203 | ) | $ | (10,732 | ) | $ | (37,579 | ) | ||
Income tax expense (benefit) was allocated as follows (amounts in thousands):
Year ended December 31, | |||||||||||
2017 | 2016 | 2015 | |||||||||
Continuing operations | $ | (4,203 | ) | $ | (10,732 | ) | $ | (37,579 | ) | ||
Shareholders’ equity | — | 2,287 | 962 | ||||||||
$ | (4,203 | ) | $ | (8,445 | ) | $ | (36,617 | ) | |||
70
Deferred income taxes arise from temporary differences between the tax basis of assets and liabilities and their reported amounts in the consolidated financial statements. The components of our deferred income tax assets and liabilities were as follows (amounts in thousands):
Year ended December 31, | |||||||
2017 | 2016 | ||||||
Deferred tax assets: | |||||||
Domestic net operating loss carryforward | $ | 94,598 | $ | 122,769 | |||
Foreign net operating loss carryforward | 11,619 | 8,640 | |||||
Intangibles | 18,058 | 33,722 | |||||
Property and equipment | 9,280 | 11,809 | |||||
Employee benefits and insurance claims accruals | 5,652 | 6,802 | |||||
Employee stock-based compensation | 3,753 | 6,732 | |||||
Accounts receivable reserve | 284 | 626 | |||||
Inventory | 295 | 613 | |||||
Accrued expenses not deductible for tax purposes | — | 232 | |||||
Accrued revenue not income for book purposes | 316 | 277 | |||||
143,855 | 192,222 | ||||||
Valuation allowance | (59,766 | ) | (57,820 | ) | |||
Deferred tax liabilities: | |||||||
Accrued expenses not deductible for book purposes | (112 | ) | — | ||||
Property and equipment | (87,128 | ) | (142,582 | ) | |||
Net deferred tax assets (liabilities) | $ | (3,151 | ) | $ | (8,180 | ) | |
As of December 31, 2017, we had $106.2 million of deferred tax assets related to domestic and foreign net operating losses that are available to reduce future taxable income. In assessing the realizability of our deferred tax assets, we consider whether it is more likely than not that some portion or all of the deferred tax assets will not be realized. The ultimate realization of deferred tax assets is dependent upon the generation of future taxable income during the periods in which those temporary differences become deductible.
In performing this analysis as of December 31, 2017 in accordance with ASC Topic 740, Income Taxes, we assessed the available positive and negative evidence to estimate whether sufficient future taxable income will be generated to permit the use of deferred tax assets. A significant piece of negative evidence evaluated is the cumulative loss incurred during previous years. Such negative evidence limits the ability to consider other positive evidence that is subjective, such as projections for taxable income in future years. Due to the downturn in our industry, we are in a net deferred tax asset position, and as a result, we recognized a benefit only to the extent that reversals of deferred income tax liabilities are expected to generate taxable income in each relevant jurisdiction in future periods which would offset our deferred tax assets.
Our domestic net operating losses have a 20 year carryforward period and can be used to offset future domestic taxable income until their expiration, beginning in 2030, with the latest expiration in 2037, while the majority of our foreign net operating losses (any generated prior to 2017) have an indefinite carryforward period. However, we have a valuation allowance that fully offsets our foreign and U.S. federal deferred tax assets as of December 31, 2017. We also have net operating loss carryforwards in many of the states that we operate in. Most of these are filed on a unitary or combined basis. These states have carryover periods between 5 and 20 years, with most being 15 or 20. We have determined that a valuation allowance should be recorded against some of the state benefits through December 31, 2017. The valuation allowance and the recent change in tax laws, as described further below, are the primary factors causing our effective tax rate to be significantly lower than the statutory rate of 35%. The amount of the deferred tax asset considered realizable, however, would increase if cumulative losses are no longer present and additional weight is given to subjective evidence in the form of projected future taxable income.
On December 22, 2017, the Tax Cuts and Jobs Act of 2017 (the “Tax Reform Act”) was enacted. The legislation significantly changes U.S. tax law by, among other things, permanently reducing the U.S. corporate income tax rate from a maximum of 35% to a flat rate of 21%, repealing the alternative minimum tax (AMT), implementing a territorial tax system and imposing a repatriation tax on deemed repatriated earnings of foreign subsidiaries.
71
As a result of the reduction in the U.S. corporate income tax rate, we revalued our ending net deferred tax assets at December 31, 2017 and recognized a $20.1 million tax expense in 2017, which is fully offset by a $20.1 million reduction of the valuation allowance.
Due to the repeal of the AMT, we have reduced the valuation allowance by $5.2 million to remove the effects of AMT on the realizability of our deferred tax assets in future years. In addition, we reversed the valuation allowance on the AMT credit carryforward of $0.2 million that will now be refundable through 2021 and has been reclassified from a deferred tax asset to a non-current receivable.
The Tax Reform Act provides for a one-time deemed mandatory repatriation of post-1986 undistributed foreign subsidiary earnings and profits through the year ended December 31, 2017. We have an accumulated deficit from our foreign operations, and therefore we have not included any tax impacts for this provision.
To minimize tax base erosion with a territorial tax system, beginning in 2018, the Tax Reform Act provides for a new global intangible low-taxed income (GILTI) provision. Under the GILTI provision, certain foreign subsidiary earnings in excess of an allowable return on the foreign subsidiary’s tangible assets are included in U.S. taxable income. We expect to be subject to GILTI; however, the inclusion is expected to be offset by net operating loss carry forwards in the U.S. We are still evaluating, pending further interpretive guidance, whether to make a policy election to treat the GILTI tax as a period expense or to provide U.S. deferred taxes on foreign temporary differences that are expected to generate GILTI income when they reverse in future years.
Given the significance of the legislation, the SEC staff issued Staff Accounting Bulletin No. 118 (SAB 118), which allows registrants to record provisional amounts during a one year “measurement period” similar to that used when accounting for business combinations. However, the measurement period is deemed to have ended earlier when the registrant has obtained, prepared and analyzed the information necessary to finalize its accounting. During the measurement period, impacts of the law are expected to be recorded at the time a reasonable estimate for all or a portion of the effects can be made, and provisional amounts can be recognized and adjusted as information becomes available, prepared or analyzed. SAB 118 summarizes a three-step process to be applied at each reporting period to account for and qualitatively disclose: (1) the effects of the change in tax law for which accounting is complete; (2) provisional amounts (or adjustments to provisional amounts) for the effects of the tax law where accounting is not complete, but that a reasonable estimate has been determined; and (3) a reasonable estimate cannot yet be made and therefore taxes are reflected in accordance with law prior to the enactment of the Tax Reform Act.
Our accounting is complete for the year ended December 31, 2017 as related to the re-measurement of deferred taxes to the new tax rate of 21%, repeal of the AMT, and mandatory repatriation. We are awaiting further interpretive guidance regarding the possible application of deferred taxes to GILTI, and thus taxes are reflected in accordance with law prior to the enactment of the Tax Reform Act.
Other significant provisions that are not yet effective for the year ended December 31, 2017, but may impact income taxes in future years include a limitation on the current deductibility of net interest expense in excess of 30% of adjusted taxable income, and a limitation of net operating losses generated after 2017 to 80% of taxable income.
Because we have an accumulated foreign deficit of $52.4 million at December 31, 2017, we have not recorded a tax liability from the mandatory repatriation provision of the Tax Reform Act. We do not intend to distribute earnings in a taxable manner, and therefore, we intend to limit any potential distributions to earnings previously taxed in the U.S., or earnings that would qualify for the 100% dividends received deduction provided for in the Tax Reform Act. As a result, we have not recognized a deferred tax liability on our investment in foreign subsidiaries.
On December 29, 2016, the Colombian government enacted a tax reform bill that eliminated the tax for equality (“CREE”), increased the general corporate tax rate from 25% to 40% in 2017, 37% in 2018, 33% in 2019 and created a new 5% dividend tax, among other things. Deferred tax assets and liabilities were adjusted to the new rates; however, the valuation allowance fully offset the impact to tax expense. A few other notable provisions include a shorter twelve-year carryforward period for net operating losses generated after 2016, a longer statute of limitations for returns filed after 2016 and annual limits on tax depreciation allowed.
We have no unrecognized tax benefits relating to ASC Topic 740 and no unrecognized tax benefit activity during the year ended December 31, 2017.
72
We record interest and penalty expense related to income taxes as interest and other expense, respectively. At December 31, 2017, no interest or penalties have been or are required to be accrued. Our open tax years are 2010 and forward for our federal and most state income tax returns in the United States and 2012 and forward for our income tax returns in Colombia.
6. | Fair Value of Financial Instruments |
The FASB’s Accounting Standards Codification (ASC) Topic 820, Fair Value Measurements and Disclosures, defines fair value and provides a hierarchal framework associated with the level of subjectivity used in measuring assets and liabilities at fair value. Our financial instruments consist primarily of cash, trade and other receivables, trade payables, phantom stock unit awards and long-term debt.
The carrying value of cash, trade and other receivables, and trade payables are considered to be representative of their respective fair values due to the short-term nature of these instruments. At December 31, 2017 and December 31, 2016, the aggregate estimated fair value of our phantom stock unit awards was $6.1 million and $7.0 million, respectively, for which the vested portion recognized as a liability in our consolidated balance sheets was $3.6 million and $2.0 million, respectively. The phantom stock unit awards, and the measurement of fair value for these awards, are described in more detail in Note 8, Equity Transactions and Stock-Based Compensation Plans.
The fair value of our long-term debt is estimated using a discounted cash flow analysis, based on rates that we believe we would currently pay for similar types of debt instruments. This discounted cash flow analysis is based on inputs defined by ASC Topic 820 as Level 2 inputs, which are observable inputs for similar types of debt instruments. The following table presents supplemental fair value information about our long-term debt at December 31, 2017 and December 31, 2016 (amounts in thousands):
December 31, 2017 | December 31, 2016 | ||||||||||||||
Carrying Amount | Fair Value | Carrying Amount | Fair Value | ||||||||||||
Total debt, net of discount and debt issuance costs | $ | 461,665 | $ | 415,561 | $ | 339,473 | $ | 326,249 | |||||||
7. | Earnings (Loss) Per Common Share |
The following table presents a reconciliation of the numerators and denominators of the basic earnings per share and diluted earnings per share computations (amounts in thousands, except per share data):
Year ended December 31, | |||||||||||
2017 | 2016 | 2015 | |||||||||
Numerator (both basic and diluted): | |||||||||||
Net loss | $ | (75,118 | ) | $ | (128,391 | ) | $ | (155,140 | ) | ||
Denominator: | |||||||||||
Weighted-average shares (denominator for basic earnings (loss) per share) | 77,390 | 65,452 | 64,310 | ||||||||
Dilutive effect of outstanding stock options, restricted stock and restricted stock unit awards | — | — | — | ||||||||
Denominator for diluted earnings (loss) per share | 77,390 | 65,452 | 64,310 | ||||||||
Loss per common share - Basic | $ | (0.97 | ) | $ | (1.96 | ) | $ | (2.41 | ) | ||
Loss per common share - Diluted | $ | (0.97 | ) | $ | (1.96 | ) | $ | (2.41 | ) | ||
Potentially dilutive securities excluded as anti-dilutive | 5,116 | 4,953 | 4,832 | ||||||||
8. Equity Transactions and Stock-Based Compensation Plans
Equity Transactions
On May 15, 2015, we filed a registration statement that permits us to sell equity or debt in one or more offerings up to a total dollar amount of $300 million. In December 2016, we sold 12,075,000 shares of common stock in a public offering and received proceeds of $65.4 million, net of underwriting discounts and offering expenses. As of December 31, 2017,
73
$234.6 million under the shelf registration statement is available for equity or debt offerings, subject to the limitations imposed by our Term Loan, ABL Facility and Senior Notes.
Stock-based Compensation Plans
We have stock-based award plans that are administered by the Compensation Committee of our Board of Directors, which selects persons eligible to receive awards and determines the number, terms, conditions and other provisions of the awards.
At December 31, 2017, the total shares available for future grants to employees and directors under existing plans were 3,204,802, which excludes awards we grant in the form of phantom stock unit awards which are expected to be paid in cash. In January 2018, our Board of Directors approved the grant of the following awards:
Vesting Period | Number of Shares or Units | |||
Restricted stock unit awards | 3 years | 788,377 | ||
Phantom stock unit awards | 39 months | 1,188,216 | ||
We grant stock option and restricted stock awards with vesting based on time of service conditions. We grant restricted stock unit awards with vesting based on time of service conditions, and in certain cases, subject to performance and market conditions. We grant phantom stock unit awards with vesting based on time of service, performance and market conditions, which are classified as liability awards under ASC Topic 718, Compensation—Stock Compensation since we expect to settle the awards in cash when they become vested.
We recognize compensation cost for our stock-based compensation awards based on the fair value estimated in accordance with ASC Topic 718. For our awards with graded vesting, we recognize compensation expense on a straight-line basis over the service period for each separately vesting portion of the award as if the award was, in substance, multiple awards. We adopted ASU 2016-09 in the first quarter of 2017 and elected to prospectively recognize forfeitures when they occur, rather than estimating future forfeitures.
The following table summarizes the stock-based compensation expense recognized, by award type, and the compensation expense recognized for phantom stock unit awards during the years ended December 31, 2017, 2016 and 2015 (amounts in thousands):
Year ended December 31, | |||||||||||
2017 | 2016 | 2015 | |||||||||
Stock option awards | $ | 974 | $ | 766 | $ | 923 | |||||
Restricted stock awards | 461 | 421 | 399 | ||||||||
Restricted stock unit awards | 2,914 | 2,757 | 2,307 | ||||||||
$ | 4,349 | $ | 3,944 | $ | 3,629 | ||||||
Phantom stock unit awards | $ | 1,609 | $ | 1,971 | $ | — | |||||
The following table summarizes the unrecognized compensation cost (amounts in thousands) to be recognized and the weighted-average period remaining (in years) over which the compensation cost is expected to be recognized, by award type, as of December 31, 2017:
Weighted-Average Period Remaining | Unrecognized Compensation Cost | ||||
Stock options | 0.66 | $ | 599 | ||
Restricted stock awards | 0.38 | 174 | |||
Restricted stock unit awards | 1.32 | 3,655 | |||
Phantom stock unit awards | 1.33 | 2,491 | |||
$ | 6,919 | ||||
Stock Options
We grant stock option awards which generally become exercisable over a three-year period and expire ten years after the date of grant. Our stock-based compensation plans require that all stock option awards have an exercise price that is not less than the fair market value of our common stock on the date of grant. We issue shares of our common stock when vested stock option awards are exercised.
74
We estimate the fair value of each option grant on the date of grant using a Black-Scholes option pricing model. The following table summarizes the assumptions used in the Black-Scholes option pricing model based on a weighted-average calculation for the options granted during the years ended December 31, 2017, 2016 and 2015:
Year ended December 31, | ||||||||
2017 | 2016 | 2015 | ||||||
Expected volatility | 76 | % | 70 | % | 64 | % | ||
Risk-free interest rates | 2.1 | % | 1.5 | % | 1.4 | % | ||
Expected life in years | 5.86 | 5.70 | 5.52 | |||||
Grant-date fair value | $4.28 | $0.80 | $2.31 | |||||
The assumptions used in the Black-Scholes option pricing model are based on multiple factors, including historical exercise patterns of homogeneous groups with respect to exercise and post-vesting employment termination behaviors, expected future exercising patterns for these same homogeneous groups and volatility of our stock price. As we have not declared dividends since we became a public company, we did not use a dividend yield. In each case, the actual value that will be realized, if any, will depend on the future performance of our common stock and overall stock market conditions. There is no assurance the value an optionee actually realizes will be at or near the value we have estimated using the Black-Scholes options-pricing model.
The following table summarizes our stock option activity from December 31, 2016 through December 31, 2017:
Number of Shares | Weighted-Average Exercise Price Per Share | Weighted-Average Remaining Contract Term in Years | Aggregate Intrinsic Value (in thousands)(1) | ||||
Outstanding stock options as of December 31, 2016 | 4,384,425 | $7.42 | |||||
Granted | 268,185 | 6.40 | |||||
Forfeited | (382,700) | 13.82 | |||||
Outstanding stock options as of December 31, 2017 | 4,269,910 | $6.78 | 4.5 | $1,576 | |||
Stock options exercisable as of December 31, 2017 | 3,288,463 | $7.90 | 3.4 | $525 | |||
(1) Intrinsic value is the amount by which the market price of our common stock exceeds the exercise price of the stock options. | |||||||
The following table presents the aggregate intrinsic value of stock options exercised during the years ended December 31, 2017, 2016 and 2015 (amounts in thousands):
Year ended December 31, | |||||||||||
2017 | 2016 | 2015 | |||||||||
Aggregate intrinsic value of stock options exercised | $ | — | $ | 12 | $ | 361 | |||||
The following table summarizes our nonvested stock option activity from December 31, 2016 through December 31, 2017:
Number of Shares | Weighted-Average Grant-Date Fair Value Per Share | ||
Nonvested stock options as of December 31, 2016 | 1,186,917 | $1.29 | |
Granted | 268,185 | 4.28 | |
Vested | (473,655) | 1.69 | |
Nonvested stock options as of December 31, 2017 | 981,447 | $1.91 | |
75
Restricted Stock
We grant restricted stock awards that vest over a one-year period with a fair value based on the closing price of our common stock on the date of the grant. When restricted stock awards are granted, or when restricted stock unit awards are converted to restricted stock, shares of our common stock are considered issued, but subject to certain restrictions.
The following table presents the weighted-average grant-date fair value per share of restricted stock awards granted and the aggregate fair value of restricted stock awards vested during the years ended December 31, 2017, 2016 and 2015:
Year ended December 31, | |||||||||||
2017 | 2016 | 2015 | |||||||||
Grant-date fair value (per share) | $ | 2.75 | $ | 2.76 | $ | 7.40 | |||||
Aggregate fair value of awards vested (in thousands) | $ | 483 | $ | 137 | $ | 368 | |||||
The following table summarizes our restricted stock activity from December 31, 2016 through December 31, 2017:
Number of Shares | Weighted-Average Grant-Date Fair Value per Share | ||
Nonvested restricted stock as of December 31, 2016 | 166,664 | $2.76 | |
Granted | 167,272 | 2.75 | |
Vested | (166,664) | 2.76 | |
Nonvested restricted stock as of December 31, 2017 | 167,272 | $2.75 | |
Restricted Stock Units
We grant restricted stock unit awards with vesting based on time of service conditions only (“time-based RSUs”), and we grant restricted stock unit awards with vesting based on time of service, which are also subject to performance and market conditions (“performance-based RSUs”). Shares of our common stock are issued to recipients of restricted stock units only when they have satisfied the applicable vesting conditions. Our time-based RSUs generally vest over a three-year period, with fair values based on the closing price of our common stock on the date of grant. Our performance-based RSUs generally cliff vest after 39 months from the date of grant and are granted at a target number of issuable shares, for which the final number of shares of common stock is adjusted based on our actual achievement levels that are measured against predetermined performance conditions. The number of shares of common stock awarded will be based upon the Company’s achievement in certain performance conditions, as compared to a predefined peer group, over the performance period, generally three years.
Approximately half of the performance-based RSUs outstanding are subject to a market condition based on relative total shareholder return, as compared to that of our predetermined peer group, and therefore the fair value of these awards is measured using a Monte Carlo simulation model. Compensation expense for equity awards with a market condition is reduced only for actual forfeitures; no adjustment to expense is otherwise made, regardless of the number of shares issued. The remaining performance-based RSUs are subject to performance conditions, based on our EBITDA and EBITDA return on capital employed, relative to our predetermined peer group, and therefore the fair value is based on the closing price of our common stock on the date of grant, applied to the estimated number of shares that will be awarded. Compensation expense ultimately recognized for awards with performance conditions will be equal to the fair value of the restricted stock unit award based on the actual outcome of the service and performance conditions.
In April 2017, we determined that 121% of the target number of shares granted during 2014 were actually earned based on the Company’s achievement of the performance measures as described above, resulting in an increase of 54,429 shares being issued. As of December 31, 2017, we estimate that the weighted average achievement level for our outstanding performance-based RSUs granted in 2015 and 2017 will be approximately 100% of the predetermined performance conditions.
76
The following table summarizes our restricted stock unit activity from December 31, 2016 through December 31, 2017:
Time-Based Award | Performance-Based Award | ||||||||||
Number of Time-Based Award Units | Weighted-Average Grant-Date Fair Value per Unit | Number of Performance-Based Award Units | Weighted-Average Grant-Date Fair Value per Unit | ||||||||
Nonvested restricted stock units as of December 31, 2016 | 397,790 | $3.45 | 685,817 | $7.28 | |||||||
Granted | 96,728 | 5.61 | 563,469 | 7.75 | |||||||
Achieved performance adjustment | — | — | 54,429 | 9.66 | |||||||
Vested | (202,387) | 4.90 | (317,598 | ) | 9.66 | ||||||
Forfeited | (40,245) | 2.66 | — | — | |||||||
Nonvested restricted stock units as of December 31, 2017 | 251,886 | $3.24 | 986,117 | $6.91 | |||||||
The following table presents the weighted-average grant-date fair value per share of restricted stock units granted and the aggregate intrinsic value of restricted stock units vested (converted) during the years ended December 31, 2017, 2016 and 2015:
Year ended December 31, | |||||||||||
2017 | 2016 | 2015 | |||||||||
Time-based RSUs: | |||||||||||
Grant-date fair value of awards granted (per share) | $ | 5.61 | $ | 1.47 | $ | 4.08 | |||||
Aggregate intrinsic value of awards vested (in thousands) | $ | 1,206 | $ | 314 | $ | 1,575 | |||||
Performance-based RSUs: | |||||||||||
Grant-date fair value of awards granted (per share) | $ | 7.75 | $ | — | $ | 6.66 | |||||
Aggregate intrinsic value of awards vested (in thousands) | $ | 969 | $ | 609 | $ | 1,402 | |||||
Phantom Stock Unit Awards
In 2016, we granted 1,268,068 phantom stock unit awards with a weighted-average grant-date fair value of $1.35 per share. These awards cliff-vest after 39 months from the date of grant, with vesting based on time of service, performance and market conditions. The number of units ultimately awarded will be based upon the Company’s achievement in certain performance conditions, as compared to a predefined peer group, over the three-year performance period, and each unit awarded will entitle the employee to a cash payment equal to the stock price of our common stock on the date of vesting, subject to a maximum of $8.08 (which is four times the stock price on the date of grant).
The fair value of these awards is measured using inputs that are defined as Level 3 inputs under ASC Topic 820, Fair Value Measurements and Disclosures. Half of the phantom stock unit awards granted are subject to a market condition based on relative total shareholder return, as compared to that of our predetermined peer group, and therefore the fair value of these awards is measured using a Monte Carlo simulation model. The remaining phantom stock unit awards are subject to performance conditions, based on our EBITDA and EBITDA return on capital employed, relative to our predetermined peer group, and the fair value of these awards is measured using a Black-Scholes pricing model. As of December 31, 2017, our achievement level for the awards granted during 2016 is estimated to be approximately 150%.
These awards are classified as liability awards under ASC Topic 718, Compensation—Stock Compensation, because we expect to settle the awards in cash when they vest, and are remeasured at fair value at the end of each reporting period until they vest. The change in fair value is recognized as a current period compensation expense in our statement of operations. Therefore, changes in the inputs used to measure fair value can result in volatility in our compensation expense. This volatility increases as the phantom stock awards approach the vesting date. We estimate that a hypothetical increase of $1 in the market price of our common stock as of December 31, 2017, if all other inputs were unchanged, would result in an increase in cumulative compensation expense of $0.9 million, which represents the hypothetical increase in fair value of the liability which would be recognized as compensation expense in our statement of operations.
9. Employee Benefit Plans and Insurance
We maintain a 401(k) retirement plan for our eligible employees. Under this plan, we may make a matching contribution, on a discretionary basis, equal to a percentage of each eligible employee’s annual contribution, which we determine annually. Our matching contributions for the years ended December 31, 2017, 2016 and 2015 were $3.1 million, $0.3 million and $4.2 million, respectively. In an effort to reduce costs in response to the downturn in our industry, we suspended matching contributions from February 2016 to January 2017.
We maintain a self-insurance program, for major medical and hospitalization coverage for employees and their dependents, which is partially funded by employee payroll deductions. We have provided for reported claims costs as well as incurred but not reported medical costs in the accompanying consolidated balance sheets. We have a maximum liability of $200,000 per covered individual per year. Amounts in excess of the stated maximum are covered under a separate policy provided by an insurance company. Accrued insurance premiums and deductibles included $2.0 million for our estimate of incurred but unpaid costs related to the self-insurance portion of our health insurance at both December 31, 2017 and 2016.
We are self-insured for up to $500,000 per incident for all workers’ compensation claims submitted by employees for on-the-job injuries. We accrue our workers’ compensation claim cost estimates based on historical claims development data and we accrue the cost of administrative services associated with claims processing. We also have a deductible of $250,000 per occurrence under both our general liability insurance and auto liability insurance. Accrued insurance premiums and deductibles at December 31, 2017 and 2016 include $4.6 million and $4.4 million, respectively, for our estimate of costs
77
relative to the self-insured portion of our workers’ compensation, general liability and auto liability insurance. Based upon our past experience, management believes that we have adequately provided for potential losses. However, future multiple occurrences of serious injuries to employees could have a material adverse effect on our financial position and results of operations.
10. | Segment Information |
We revised our reportable business segments as of the fourth quarter of 2017, which now include five operating segments, comprised of two drilling services business segments (domestic and international drilling) and three production services business segments (well servicing, wireline services and coiled tubing services). We revised our segments to reflect changes in the basis used by management in making decisions regarding our business for resource allocation and performance assessment. These changes reflect our current operating focus as is required by ASC Topic 280, Segment Reporting. The following financial information presented as of and for the years ended December 31, 2017, 2016, and 2015 have been restated to reflect this change.
Our domestic and international drilling services segments provide contract land drilling services to a diverse group of exploration and production companies through our four drilling divisions in the US and internationally in Colombia. In addition to our drilling rigs, we provide the drilling crews and most of the ancillary equipment needed to operate our drilling rigs.
Our well servicing, wireline services and coiled tubing services segments provide a range of production services to a diverse group of exploration and production companies, with our operations concentrated in the major domestic onshore oil and gas producing regions in the Mid-Continent and Rocky Mountain states and in the Gulf Coast, both onshore and offshore.
The following table sets forth certain financial information for each of our segments and corporate (amounts in thousands):
As of and for the year ended December 31, | |||||||||||
2017 | 2016 | 2015 | |||||||||
Revenues: | |||||||||||
Domestic drilling | $ | 129,276 | $ | 112,399 | $ | 205,440 | |||||
International drilling | 41,349 | 6,808 | 43,878 | ||||||||
Drilling services | 170,625 | 119,207 | 249,318 | ||||||||
Well servicing | 77,257 | 71,491 | 133,440 | ||||||||
Wireline services | 163,716 | 67,419 | 120,387 | ||||||||
Coiled tubing services | 34,857 | 18,959 | 37,633 | ||||||||
Production services | 275,830 | 157,869 | 291,460 | ||||||||
Consolidated revenues | $ | 446,455 | $ | 277,076 | $ | 540,778 | |||||
Operating costs: | |||||||||||
Domestic drilling | $ | 83,122 | $ | 63,686 | $ | 108,602 | |||||
International drilling | 31,994 | 9,465 | 35,594 | ||||||||
Drilling services | 115,116 | 73,151 | 144,196 | ||||||||
Well servicing | 56,379 | 53,208 | 91,125 | ||||||||
Wireline services | 128,137 | 57,634 | 88,848 | ||||||||
Coiled tubing services | 31,248 | 19,956 | 33,847 | ||||||||
Production services | 215,764 | 130,798 | 213,820 | ||||||||
Consolidated operating costs | $ | 330,880 | $ | 203,949 | $ | 358,016 | |||||
Gross margin: | |||||||||||
Domestic drilling | $ | 46,154 | $ | 48,713 | $ | 96,838 | |||||
International drilling | 9,355 | (2,657 | ) | 8,284 | |||||||
Drilling services | 55,509 | 46,056 | 105,122 | ||||||||
Well servicing | 20,878 | 18,283 | 42,315 | ||||||||
Wireline services | 35,579 | 9,785 | 31,539 | ||||||||
Coiled tubing services | 3,609 | (997 | ) | 3,786 | |||||||
Production services | 60,066 | 27,071 | 77,640 | ||||||||
Consolidated gross margin | $ | 115,575 | $ | 73,127 | $ | 182,762 | |||||
78
As of and for the year ended December 31, | |||||||||||
2017 | 2016 | 2015 | |||||||||
Identifiable Assets: | |||||||||||
Domestic drilling | $ | 404,144 | $ | 415,953 | $ | 463,618 | |||||
International drilling (1) | 36,403 | 36,337 | 54,590 | ||||||||
Drilling services | 440,547 | 452,290 | 518,208 | ||||||||
Well servicing | 125,951 | 126,917 | 155,421 | ||||||||
Wireline services | 92,081 | 80,502 | 94,777 | ||||||||
Coiled tubing services | 30,254 | 26,062 | 31,332 | ||||||||
Production services | 248,286 | 233,481 | 281,530 | ||||||||
Corporate | 78,036 | 14,331 | 22,237 | ||||||||
Consolidated identifiable assets | $ | 766,869 | $ | 700,102 | $ | 821,975 | |||||
Depreciation and Amortization: | |||||||||||
Domestic drilling | $ | 45,243 | $ | 53,900 | $ | 68,651 | |||||
International drilling | 5,718 | 6,869 | 11,614 | ||||||||
Drilling services | 50,961 | 60,769 | 80,265 | ||||||||
Well servicing | 19,943 | 22,925 | 25,810 | ||||||||
Wireline services | 18,451 | 20,707 | 26,837 | ||||||||
Coiled tubing services | 8,181 | 8,661 | 16,688 | ||||||||
Production services | 46,575 | 52,293 | 69,335 | ||||||||
Corporate | 1,241 | 1,250 | 1,339 | ||||||||
Consolidated depreciation and amortization | $ | 98,777 | $ | 114,312 | $ | 150,939 | |||||
Capital Expenditures: | |||||||||||
Domestic drilling | $ | 19,219 | $ | 19,118 | $ | 111,839 | |||||
International drilling | 6,319 | 678 | 1,221 | ||||||||
Drilling services | 25,538 | 19,796 | 113,060 | ||||||||
Well servicing | 17,776 | 5,274 | 15,716 | ||||||||
Wireline services | 11,883 | 3,499 | 9,101 | ||||||||
Coiled tubing services | 5,496 | 3,548 | 4,411 | ||||||||
Production services | 35,155 | 12,321 | 29,228 | ||||||||
Corporate | 754 | 439 | 619 | ||||||||
Consolidated capital expenditures | $ | 61,447 | $ | 32,556 | $ | 142,907 | |||||
(1) Identifiable assets for our international operations in Colombia include five drilling rigs that are owned by our Colombia subsidiary and three drilling rigs that are owned by one of our domestic subsidiaries and leased to our Colombia subsidiary.
The following table reconciles the consolidated gross margin of our segments reported above to loss from operations as reported on the consolidated statements of operations (amounts in thousands):
Year ended December 31, | |||||||||||
2017 | 2016 | 2015 | |||||||||
Consolidated gross margin | $ | 115,575 | $ | 73,127 | $ | 182,762 | |||||
Depreciation and amortization | (98,777 | ) | (114,312 | ) | (150,939 | ) | |||||
General and administrative | (69,681 | ) | (61,184 | ) | (73,903 | ) | |||||
Bad debt (expense) recovery | (53 | ) | (156 | ) | 188 | ||||||
Impairment | (1,902 | ) | (12,815 | ) | (129,152 | ) | |||||
Gain on dispositions of property and equipment, net | 3,608 | 1,892 | 4,344 | ||||||||
Loss from operations | $ | (51,230 | ) | $ | (113,448 | ) | $ | (166,700 | ) | ||
11. | Commitments and Contingencies |
In connection with our operations in Colombia, our foreign subsidiaries have obtained bonds for bidding on drilling contracts, performing under drilling contracts, and remitting customs and importation duties. We have guaranteed payments of $59.2 million relating to our performance under these bonds as of December 31, 2017.
79
We are currently undergoing sales and use tax audits for multi-year periods and we are working to resolve all relevant issues. As of December 31, 2017 and December 31, 2016, our accrued liability was $1.2 million and $0.6 million, respectively, based on our estimate of the sales and use tax obligations that are expected to result from these audits. Due to the inherent uncertainty of the audit process, we believe that it is reasonably possible that we may incur additional tax assessments with respect to one or more of the audits in excess of the amount accrued. We believe that such an outcome would not have a material adverse effect on our results of operations or financial position. Because certain of these audits are in a preliminary stage, an estimate of the possible loss or range of loss from an adverse result in all or substantially all of these cases cannot reasonably be made.
Due to the nature of our business, we are, from time to time, involved in litigation or subject to disputes or claims related to our business activities, including workers’ compensation claims and employment-related disputes. Legal costs relating to these matters are expensed as incurred. In the opinion of our management, none of the pending litigation, disputes or claims against us will have a material adverse effect on our financial condition, results of operations or cash flow from operations.
12. Quarterly Results of Operations (unaudited)
The following table summarizes quarterly financial data for the years ended December 31, 2017 and 2016 (in thousands, except per share data):
First Quarter | Second Quarter | Third Quarter | Fourth Quarter | Total | |||||||||||||||
Year ended December 31, 2017 | |||||||||||||||||||
Revenues | $ | 95,757 | $ | 107,130 | $ | 117,281 | $ | 126,287 | $ | 446,455 | |||||||||
Loss from operations | (18,873 | ) | (12,729 | ) | (10,892 | ) | (8,736 | ) | (51,230 | ) | |||||||||
Income tax benefit (expense) | (48 | ) | (1,135 | ) | (17 | ) | 5,403 | 4,203 | |||||||||||
Net loss | (25,124 | ) | (20,209 | ) | (17,227 | ) | (12,558 | ) | (75,118 | ) | |||||||||
Loss per share: | |||||||||||||||||||
Basic | $ | (0.33 | ) | $ | (0.26 | ) | $ | (0.22 | ) | $ | (0.16 | ) | $ | (0.97 | ) | ||||
Diluted | $ | (0.33 | ) | $ | (0.26 | ) | $ | (0.22 | ) | $ | (0.16 | ) | $ | (0.97 | ) | ||||
Year ended December 31, 2016 | |||||||||||||||||||
Revenues | $ | 74,952 | $ | 62,290 | $ | 68,353 | $ | 71,481 | $ | 277,076 | |||||||||
Loss from operations | (23,014 | ) | (26,025 | ) | (29,885 | ) | (34,524 | ) | (113,448 | ) | |||||||||
Income tax benefit | 1,958 | 1,990 | 1,698 | 5,086 | 10,732 | ||||||||||||||
Net loss | (27,699 | ) | (29,991 | ) | (34,620 | ) | (36,081 | ) | (128,391 | ) | |||||||||
Loss per share: | |||||||||||||||||||
Basic | $ | (0.43 | ) | $ | (0.46 | ) | $ | (0.53 | ) | $ | (0.53 | ) | $ | (1.96 | ) | ||||
Diluted | $ | (0.43 | ) | $ | (0.46 | ) | $ | (0.53 | ) | $ | (0.53 | ) | $ | (1.96 | ) | ||||
80
13. | Guarantor/Non-Guarantor Condensed Consolidating Financial Statements |
Our Senior Notes are fully and unconditionally guaranteed, jointly and severally, on a senior unsecured basis by all existing 100% owned domestic subsidiaries, except for Pioneer Services Holdings, LLC. The subsidiaries that generally operate our non-U.S. business concentrated in Colombia do not guarantee our Senior Notes. The non-guarantor subsidiaries do not have any payment obligations under the Senior Notes, the guarantees or the Indenture.
In the event of a bankruptcy, liquidation or reorganization of any non-guarantor subsidiary, such non-guarantor subsidiary will pay the holders of its debt and other liabilities, including its trade creditors, before it will be able to distribute any of its assets to us. In the future, any non-U.S. subsidiaries, immaterial subsidiaries and subsidiaries that we designate as unrestricted subsidiaries under the Indenture will not guarantee the Senior Notes. As of December 31, 2017, there were no restrictions on the ability of subsidiary guarantors to transfer funds to the parent company.
As a result of the guarantee arrangements, we are presenting the following condensed consolidating balance sheets, statements of operations and statements of cash flows of the issuer, the guarantor subsidiaries and the non-guarantor subsidiaries.
81
CONDENSED CONSOLIDATING BALANCE SHEETS
(in thousands)
December 31, 2017 | |||||||||||||||||||
Parent | Guarantor Subsidiaries | Non-Guarantor Subsidiaries | Eliminations | Consolidated | |||||||||||||||
ASSETS | |||||||||||||||||||
Current assets: | |||||||||||||||||||
Cash and cash equivalents | $ | 72,258 | $ | (1,881 | ) | $ | 3,263 | $ | — | $ | 73,640 | ||||||||
Restricted cash | 2,008 | — | — | — | 2,008 | ||||||||||||||
Receivables, net of allowance | 7 | 93,866 | 19,174 | (42 | ) | 113,005 | |||||||||||||
Intercompany receivable (payable) | (24,836 | ) | 51,532 | (26,696 | ) | — | — | ||||||||||||
Inventory | — | 7,741 | 6,316 | — | 14,057 | ||||||||||||||
Assets held for sale | — | 6,620 | — | — | 6,620 | ||||||||||||||
Prepaid expenses and other current assets | 1,238 | 3,193 | 1,798 | — | 6,229 | ||||||||||||||
Total current assets | 50,675 | 161,071 | 3,855 | (42 | ) | 215,559 | |||||||||||||
Net property and equipment | 2,011 | 521,080 | 26,532 | — | 549,623 | ||||||||||||||
Investment in subsidiaries | 596,927 | 20,095 | — | (617,022 | ) | — | |||||||||||||
Deferred income taxes | 38,028 | — | — | (38,028 | ) | — | |||||||||||||
Other long-term assets | 496 | 788 | 403 | — | 1,687 | ||||||||||||||
Total assets | $ | 688,137 | $ | 703,034 | $ | 30,790 | $ | (655,092 | ) | $ | 766,869 | ||||||||
LIABILITIES AND SHAREHOLDERS’ EQUITY | |||||||||||||||||||
Current liabilities: | |||||||||||||||||||
Accounts payable | $ | 286 | $ | 24,174 | $ | 5,078 | $ | — | $ | 29,538 | |||||||||
Deferred revenues | — | 97 | 808 | — | 905 | ||||||||||||||
Accrued expenses | 12,504 | 37,814 | 4,195 | (42 | ) | 54,471 | |||||||||||||
Total current liabilities | 12,790 | 62,085 | 10,081 | (42 | ) | 84,914 | |||||||||||||
Long-term debt, less unamortized discount and debt issuance costs | 461,665 | — | — | — | 461,665 | ||||||||||||||
Deferred income taxes | — | 41,179 | — | (38,028 | ) | 3,151 | |||||||||||||
Other long-term liabilities | 3,586 | 2,843 | 614 | — | 7,043 | ||||||||||||||
Total liabilities | 478,041 | 106,107 | 10,695 | (38,070 | ) | 556,773 | |||||||||||||
Total shareholders’ equity | 210,096 | 596,927 | 20,095 | (617,022 | ) | 210,096 | |||||||||||||
Total liabilities and shareholders’ equity | $ | 688,137 | $ | 703,034 | $ | 30,790 | $ | (655,092 | ) | $ | 766,869 | ||||||||
December 31, 2016 | |||||||||||||||||||
Parent | Guarantor Subsidiaries | Non-Guarantor Subsidiaries | Eliminations | Consolidated | |||||||||||||||
ASSETS | |||||||||||||||||||
Current assets: | |||||||||||||||||||
Cash and cash equivalents | $ | 9,898 | $ | (764 | ) | $ | 1,060 | $ | — | $ | 10,194 | ||||||||
Receivables, net of allowance | 480 | 64,946 | 7,210 | (513 | ) | 72,123 | |||||||||||||
Intercompany receivable (payable) | (24,836 | ) | 35,427 | (10,591 | ) | — | — | ||||||||||||
Inventory | — | 5,659 | 4,001 | — | 9,660 | ||||||||||||||
Assets held for sale | — | 15,035 | 58 | — | 15,093 | ||||||||||||||
Prepaid expenses and other current assets | 1,280 | 4,014 | 1,632 | — | 6,926 | ||||||||||||||
Total current assets | (13,178 | ) | 124,317 | 3,370 | (513 | ) | 113,996 | ||||||||||||
Net property and equipment | 2,501 | 556,062 | 25,517 | — | 584,080 | ||||||||||||||
Investment in subsidiaries | 577,965 | 24,270 | — | (602,235 | ) | — | |||||||||||||
Deferred income taxes | 65,041 | — | — | (65,041 | ) | — | |||||||||||||
Other long-term assets | 583 | 1,029 | 414 | — | 2,026 | ||||||||||||||
Total assets | $ | 632,912 | $ | 705,678 | $ | 29,301 | $ | (667,789 | ) | $ | 700,102 | ||||||||
LIABILITIES AND SHAREHOLDERS’ EQUITY | |||||||||||||||||||
Current liabilities: | |||||||||||||||||||
Accounts payable | $ | 546 | $ | 16,317 | $ | 2,345 | $ | — | $ | 19,208 | |||||||||
Deferred revenues | — | 680 | 769 | — | 1,449 | ||||||||||||||
Accrued expenses | 9,316 | 34,765 | 1,777 | (513 | ) | 45,345 | |||||||||||||
Total current liabilities | 9,862 | 51,762 | 4,891 | (513 | ) | 66,002 | |||||||||||||
Long-term debt, less unamortized discount and debt issuance costs | 339,473 | — | — | — | 339,473 | ||||||||||||||
Deferred income taxes | — | 73,249 | (28 | ) | (65,041 | ) | 8,180 | ||||||||||||
Other long-term liabilities | 2,179 | 2,702 | 168 | — | 5,049 | ||||||||||||||
Total liabilities | 351,514 | 127,713 | 5,031 | (65,554 | ) | 418,704 | |||||||||||||
Total shareholders’ equity | 281,398 | 577,965 | 24,270 | (602,235 | ) | 281,398 | |||||||||||||
Total liabilities and shareholders’ equity | $ | 632,912 | $ | 705,678 | $ | 29,301 | $ | (667,789 | ) | $ | 700,102 | ||||||||
82
CONDENSED CONSOLIDATING STATEMENTS OF OPERATIONS
(in thousands)
Year ended December 31, 2017 | |||||||||||||||||||
Parent | Guarantor Subsidiaries | Non-Guarantor Subsidiaries | Eliminations | Consolidated | |||||||||||||||
Revenues | $ | — | $ | 405,106 | $ | 41,349 | $ | — | $ | 446,455 | |||||||||
Costs and expenses: | |||||||||||||||||||
Operating costs | — | 298,898 | 31,982 | — | 330,880 | ||||||||||||||
Depreciation and amortization | 1,242 | 91,817 | 5,718 | — | 98,777 | ||||||||||||||
General and administrative | 22,869 | 45,387 | 1,922 | (497 | ) | 69,681 | |||||||||||||
Bad debt expense | — | 53 | — | — | 53 | ||||||||||||||
Impairment | — | 1,902 | — | — | 1,902 | ||||||||||||||
Gain (loss) on dispositions of property and equipment, net | 2 | (3,454 | ) | (156 | ) | — | (3,608 | ) | |||||||||||
Intercompany leasing | — | (4,860 | ) | 4,860 | — | — | |||||||||||||
Total costs and expenses | 24,113 | 429,743 | 44,326 | (497 | ) | 497,685 | |||||||||||||
Income (loss) from operations | (24,113 | ) | (24,637 | ) | (2,977 | ) | 497 | (51,230 | ) | ||||||||||
Other income (expense): | |||||||||||||||||||
Equity in earnings of subsidiaries | 4,317 | (3,936 | ) | — | (381 | ) | — | ||||||||||||
Interest expense, net of interest capitalized | (27,061 | ) | 20 | 2 | — | (27,039 | ) | ||||||||||||
Loss on extinguishment of debt | (1,476 | ) | — | — | — | (1,476 | ) | ||||||||||||
Other income (expense), net | 54 | 896 | (29 | ) | (497 | ) | 424 | ||||||||||||
Total other (expense) income | (24,166 | ) | (3,020 | ) | (27 | ) | (878 | ) | (28,091 | ) | |||||||||
Income (loss) before income taxes | (48,279 | ) | (27,657 | ) | (3,004 | ) | (381 | ) | (79,321 | ) | |||||||||
Income tax (expense) benefit 1 | (26,839 | ) | 31,974 | (932 | ) | — | 4,203 | ||||||||||||
Net income (loss) | $ | (75,118 | ) | $ | 4,317 | $ | (3,936 | ) | $ | (381 | ) | $ | (75,118 | ) | |||||
Year ended December 31, 2016 | |||||||||||||||||||
Parent | Guarantor Subsidiaries | Non-Guarantor Subsidiaries | Eliminations | Consolidated | |||||||||||||||
Revenues | $ | — | $ | 270,268 | $ | 6,808 | $ | — | $ | 277,076 | |||||||||
Costs and expenses: | |||||||||||||||||||
Operating costs | — | 194,515 | 9,434 | — | 203,949 | ||||||||||||||
Depreciation and amortization | 1,250 | 106,193 | 6,869 | — | 114,312 | ||||||||||||||
General and administrative | 21,657 | 38,564 | 1,515 | (552 | ) | 61,184 | |||||||||||||
Bad debt expense | — | 156 | — | — | 156 | ||||||||||||||
Impairment | — | 12,260 | 555 | — | 12,815 | ||||||||||||||
Gain on dispositions of property and equipment, net | — | (1,838 | ) | (54 | ) | — | (1,892 | ) | |||||||||||
Intercompany leasing | — | (4,860 | ) | 4,860 | — | — | |||||||||||||
Total costs and expenses | 22,907 | 344,990 | 23,179 | (552 | ) | 390,524 | |||||||||||||
Income (loss) from operations | (22,907 | ) | (74,722 | ) | (16,371 | ) | 552 | (113,448 | ) | ||||||||||
Other income (expense): | |||||||||||||||||||
Equity in earnings of subsidiaries | (63,374 | ) | (17,835 | ) | — | 81,209 | — | ||||||||||||
Interest expense, net of interest capitalized | (25,845 | ) | (88 | ) | (1 | ) | — | (25,934 | ) | ||||||||||
Loss on extinguishment of debt | (299 | ) | — | — | — | (299 | ) | ||||||||||||
Other income (expense), net | 18 | 1,430 | (338 | ) | (552 | ) | 558 | ||||||||||||
Total other (expense) income | (89,500 | ) | (16,493 | ) | (339 | ) | 80,657 | (25,675 | ) | ||||||||||
Income (loss) before income taxes | (112,407 | ) | (91,215 | ) | (16,710 | ) | 81,209 | (139,123 | ) | ||||||||||
Income tax (expense) benefit 1 | (15,984 | ) | 27,841 | (1,125 | ) | — | 10,732 | ||||||||||||
Net income (loss) | $ | (128,391 | ) | $ | (63,374 | ) | $ | (17,835 | ) | $ | 81,209 | $ | (128,391 | ) | |||||
1 The income tax expense (benefit) reflected in each column does not include any tax effect of the equity in earnings (losses) of subsidiaries. | |||||||||||||||||||
83
CONDENSED CONSOLIDATING STATEMENTS OF OPERATIONS
(Continued)
(in thousands)
Year ended December 31, 2015 | |||||||||||||||||||
Parent | Guarantor Subsidiaries | Non-Guarantor Subsidiaries | Eliminations | Consolidated | |||||||||||||||
Revenues | $ | — | $ | 496,900 | $ | 43,878 | $ | — | $ | 540,778 | |||||||||
Costs and expenses: | |||||||||||||||||||
Operating costs | — | 322,458 | 35,558 | — | 358,016 | ||||||||||||||
Depreciation and amortization | 1,338 | 137,987 | 11,614 | — | 150,939 | ||||||||||||||
General and administrative | 21,515 | 50,710 | 2,230 | (552 | ) | 73,903 | |||||||||||||
Bad debt expense (recovery) | — | 571 | (759 | ) | — | (188 | ) | ||||||||||||
Impairment | — | 73,270 | 56,632 | (750 | ) | 129,152 | |||||||||||||
Gain (loss) on dispositions of property and equipment, net | 117 | (4,350 | ) | (111 | ) | — | (4,344 | ) | |||||||||||
Intercompany leasing | — | (4,860 | ) | 4,860 | — | — | |||||||||||||
Total costs and expenses | 22,970 | 575,786 | 110,024 | (1,302 | ) | 707,478 | |||||||||||||
Income (loss) from operations | (22,970 | ) | (78,886 | ) | (66,146 | ) | 1,302 | (166,700 | ) | ||||||||||
Other income (expense): | |||||||||||||||||||
Equity in earnings of subsidiaries | (126,553 | ) | (74,459 | ) | — | 201,012 | — | ||||||||||||
Interest expense, net of interest capitalized | (21,128 | ) | (117 | ) | 23 | — | (21,222 | ) | |||||||||||
Loss on extinguishment of debt | (2,186 | ) | — | — | — | (2,186 | ) | ||||||||||||
Other income (expense), net | 6 | 1,687 | (3,752 | ) | (552 | ) | (2,611 | ) | |||||||||||
Total other (expense) income | (149,861 | ) | (72,889 | ) | (3,729 | ) | 200,460 | (26,019 | ) | ||||||||||
Income (loss) before income taxes | (172,831 | ) | (151,775 | ) | (69,875 | ) | 201,762 | (192,719 | ) | ||||||||||
Income tax (expense) benefit 1 | 16,941 | 25,222 | (4,584 | ) | — | 37,579 | |||||||||||||
Net income (loss) | $ | (155,890 | ) | $ | (126,553 | ) | $ | (74,459 | ) | $ | 201,762 | $ | (155,140 | ) | |||||
1 The income tax expense (benefit) reflected in each column does not include any tax effect of the equity in earnings (losses) of subsidiaries. | |||||||||||||||||||
84
CONDENSED CONSOLIDATING STATEMENTS OF CASH FLOWS
(in thousands)
Year ended December 31, 2017 | |||||||||||||||||||
Parent | Guarantor Subsidiaries | Non-Guarantor Subsidiaries | Eliminations | Consolidated | |||||||||||||||
Cash flows from operating activities | $ | (40,068 | ) | $ | 25,492 | $ | 8,759 | $ | — | $ | (5,817 | ) | |||||||
Cash flows from investing activities: | |||||||||||||||||||
Purchases of property and equipment | (745 | ) | (56,556 | ) | (6,407 | ) | 431 | (63,277 | ) | ||||||||||
Proceeds from sale of property and equipment | — | 12,768 | 232 | (431 | ) | 12,569 | |||||||||||||
Proceeds from insurance recoveries | — | 3,344 | — | — | 3,344 | ||||||||||||||
(745 | ) | (40,444 | ) | (6,175 | ) | — | (47,364 | ) | |||||||||||
Cash flows from financing activities: | |||||||||||||||||||
Debt repayments | (120,000 | ) | — | — | — | (120,000 | ) | ||||||||||||
Proceeds from issuance of debt | 245,500 | — | — | — | 245,500 | ||||||||||||||
Debt issuance costs | (6,332 | ) | — | — | — | (6,332 | ) | ||||||||||||
Purchase of treasury stock | (533 | ) | — | — | — | (533 | ) | ||||||||||||
Intercompany contributions/distributions | (13,454 | ) | 13,835 | (381 | ) | — | — | ||||||||||||
105,181 | 13,835 | (381 | ) | — | 118,635 | ||||||||||||||
Net increase (decrease) in cash, cash equivalents and restricted cash | 64,368 | (1,117 | ) | 2,203 | — | 65,454 | |||||||||||||
Beginning cash, cash equivalents and restricted cash | 9,898 | (764 | ) | 1,060 | — | 10,194 | |||||||||||||
Ending cash, cash equivalents and restricted cash | $ | 74,266 | $ | (1,881 | ) | $ | 3,263 | $ | — | $ | 75,648 | ||||||||
Year ended December 31, 2016 | |||||||||||||||||||
Parent | Guarantor Subsidiaries | Non-Guarantor Subsidiaries | Eliminations | Consolidated | |||||||||||||||
Cash flows from operating activities | $ | (39,344 | ) | $ | 45,035 | $ | (560 | ) | $ | — | $ | 5,131 | |||||||
Cash flows from investing activities: | |||||||||||||||||||
Purchases of property and equipment | (452 | ) | (31,049 | ) | (880 | ) | — | (32,381 | ) | ||||||||||
Proceeds from sale of property and equipment | — | 7,523 | 54 | — | 7,577 | ||||||||||||||
Proceeds from insurance recoveries | — | 37 | — | — | 37 | ||||||||||||||
(452 | ) | (23,489 | ) | (826 | ) | — | (24,767 | ) | |||||||||||
Cash flows from financing activities: | |||||||||||||||||||
Debt repayments | (71,000 | ) | — | — | — | (71,000 | ) | ||||||||||||
Proceeds from issuance of debt | 22,000 | — | — | — | 22,000 | ||||||||||||||
Debt issuance costs | (819 | ) | — | — | — | (819 | ) | ||||||||||||
Proceeds from exercise of options | 183 | — | — | — | 183 | ||||||||||||||
Proceeds from common stock, net of offering costs | 65,430 | — | — | 65,430 | |||||||||||||||
Purchase of treasury stock | (124 | ) | — | — | — | (124 | ) | ||||||||||||
Intercompany contributions/distributions | 16,803 | (16,698 | ) | (105 | ) | — | — | ||||||||||||
32,473 | (16,698 | ) | (105 | ) | — | 15,670 | |||||||||||||
Net increase (decrease) in cash and cash equivalents | (7,323 | ) | 4,848 | (1,491 | ) | — | (3,966 | ) | |||||||||||
Beginning cash and cash equivalents | 17,221 | (5,612 | ) | 2,551 | — | 14,160 | |||||||||||||
Ending cash and cash equivalents | $ | 9,898 | $ | (764 | ) | $ | 1,060 | $ | — | $ | 10,194 | ||||||||
85
CONDENSED CONSOLIDATING STATEMENTS OF CASH FLOWS
(Continued)
(in thousands)
Year ended December 31, 2015 | |||||||||||||||||||
Parent | Guarantor Subsidiaries | Non-Guarantor Subsidiaries | Eliminations | Consolidated | |||||||||||||||
Cash flows from operating activities | $ | 4,067 | $ | 147,643 | $ | (8,991 | ) | $ | — | $ | 142,719 | ||||||||
Cash flows from investing activities: | |||||||||||||||||||
Purchases of property and equipment | (663 | ) | (157,336 | ) | (1,885 | ) | 269 | (159,615 | ) | ||||||||||
Proceeds from sale of property and equipment | 32 | 57,444 | 467 | (269 | ) | 57,674 | |||||||||||||
Proceeds from insurance recoveries | — | 285 | — | — | 285 | ||||||||||||||
(631 | ) | (99,607 | ) | (1,418 | ) | — | (101,656 | ) | |||||||||||
Cash flows from financing activities: | |||||||||||||||||||
Debt repayments | (60,000 | ) | (2 | ) | — | — | (60,002 | ) | |||||||||||
Debt issuance costs | (1,877 | ) | — | — | — | (1,877 | ) | ||||||||||||
Proceeds from exercise of options | 781 | — | — | — | 781 | ||||||||||||||
Purchase of treasury stock | (729 | ) | — | — | — | (729 | ) | ||||||||||||
Intercompany contributions/distributions | 47,922 | (48,130 | ) | 208 | — | — | |||||||||||||
(13,903 | ) | (48,132 | ) | 208 | — | (61,827 | ) | ||||||||||||
Net increase (decrease) in cash and cash equivalents | (10,467 | ) | (96 | ) | (10,201 | ) | — | (20,764 | ) | ||||||||||
Beginning cash and cash equivalents | 27,688 | (5,516 | ) | 12,752 | — | 34,924 | |||||||||||||
Ending cash and cash equivalents | $ | 17,221 | $ | (5,612 | ) | $ | 2,551 | $ | — | $ | 14,160 | ||||||||
86
ITEM 9. | CHANGES IN AND DISAGREEMENTS WITH ACCOUNTANTS ON ACCOUNTING AND FINANCIAL DISCLOSURE |
Not applicable.
ITEM 9A. | CONTROLS AND PROCEDURES |
In accordance with Exchange Act Rules 13a-15 and 15d-15, we carried out an evaluation, under the supervision and with the participation of management, including our Chief Executive Officer and Chief Financial Officer, of the effectiveness of our disclosure controls and procedures as of the end of the period covered by this report. Based upon that evaluation, our Chief Executive Officer and Chief Financial Officer concluded that our disclosure controls and procedures were effective as of December 31, 2017, to ensure that information required to be disclosed in our reports filed or submitted under the Exchange Act is (1) recorded, processed, summarized and reported within the time periods specified in the Securities and Exchange Commission’s rules and forms and (2) accumulated and communicated to our management, including our Chief Executive Officer and Chief Financial Officer, as appropriate to allow timely decisions regarding required disclosure.
In the ordinary course of business, we may make changes to our systems and processes to improve controls and increase efficiency, and make changes to our internal controls over financial reporting in order to ensure that we maintain an effective internal control environment. There has been no change in our internal control over financial reporting that occurred during the three months ended December 31, 2017 that has materially affected, or is reasonably likely to materially affect, our internal control over financial reporting.
Management’s Annual Report on Internal Control Over Financial Reporting
The management of Pioneer Energy Services Corp. is responsible for establishing and maintaining adequate internal control over financial reporting. Pioneer Energy Services Corp.’s internal control over financial reporting is a process designed to provide reasonable assurance regarding the reliability of financial reporting and the preparation of financial statements for external purposes in accordance with generally accepted accounting principles. A company’s internal control over financial reporting includes those policies and procedures that: (1) pertain to the maintenance of records that, in reasonable detail, accurately and fairly reflect the transactions and dispositions of the assets of the company; (2) provide reasonable assurance that transactions are recorded as necessary to permit preparation of financial statements in accordance with generally accepted accounting principles, and that receipts and expenditures of Pioneer Energy Services Corp. are being made only in accordance with authorizations of management and directors of the company; and (3) provide reasonable assurance regarding prevention or timely detection of unauthorized acquisition, use, or disposition of the company’s assets that could have a material effect on the financial statements. Because of its inherent limitations, internal control over financial reporting may not prevent or detect misstatements. Also, projections of any evaluation of effectiveness to future periods are subject to the risk that controls may become inadequate because of changes in conditions, or that the degree of compliance with the policies or procedures may deteriorate.
Pioneer Energy Services Corp.’s management assessed the effectiveness of Pioneer Energy Services Corp.’s internal control over financial reporting as of December 31, 2017. In making this assessment, it used the criteria set forth by the Committee of Sponsoring Organizations of the Treadway Commission (COSO) in Internal Control-Integrated Framework (2013). Based on our assessment we have concluded that, as of December 31, 2017, Pioneer Energy Services Corp.’s internal control over financial reporting was effective based on those criteria.
KPMG LLP, the independent registered public accounting firm that audited the consolidated financial statements of Pioneer Energy Services Corp. included in this Annual Report on Form 10-K, has issued an attestation report on the effectiveness of Pioneer Energy Services Corp.’s internal control over financial reporting as of December 31, 2017. This report is included in Item 8, Financial Statements and Supplementary Data.
ITEM 9B. | OTHER INFORMATION |
Not applicable.
87
PART III
In Items 10, 11, 12, 13 and 14 below, we are incorporating by reference the information we refer to in those Items from the definitive proxy statement for our 2018 Annual Meeting of Shareholders. We intend to file that definitive proxy statement with the SEC on or about April 17, 2018 (and, in any event, not later than 120 days after the end of the fiscal year covered by this report).
ITEM 10. | DIRECTORS, EXECUTIVE OFFICERS AND CORPORATE GOVERNANCE |
Please see the information appearing in the proposal for the election of directors and under the headings “Executive Officers,” “Information Concerning Meetings and Committees of the Board of Directors,” “Code of Business Conduct and Ethics and Corporate Governance Guidelines” and “Section 16(a) Beneficial Ownership Reporting Compliance” in the definitive proxy statement for our 2018 Annual Meeting of Shareholders for the information this Item 10 requires.
ITEM 11. | EXECUTIVE COMPENSATION |
Please see the information appearing under the headings “Compensation Discussion and Analysis,” “Director Compensation,” “Executive Compensation,” “Compensation Committee Interlocks and Insider Participation” and “Report of the Compensation Committee” in the definitive proxy statement for our 2018 Annual Meeting of Shareholders for the information this Item 11 requires.
ITEM 12. | SECURITY OWNERSHIP OF CERTAIN BENEFICIAL OWNERS AND MANAGEMENT AND RELATED SHAREHOLDER MATTERS |
Please see the information appearing under the heading “Security Ownership of Certain Beneficial Owners and Management” in the definitive proxy statement for our 2018 Annual Meeting of Shareholders for the information this Item 12 requires.
Equity Compensation Plan Information
The following table summarizes, as of December 31, 2017, the indicated information regarding our Amended and Restated 2007 Incentive Plan (“the 2007 Incentive Plan”) and the Pioneer Drilling Company 2003 Stock Plan. The material features of these plans are described in Note 8, Equity Transactions and Stock-Based Compensation Plans, of the Notes to Consolidated Financial Statements, included in Part II, Item 8, Financial Statements and Supplementary Data, of this Annual Report on Form 10-K.
Plan category | Number of Securities to be Issued Upon Exercise of Outstanding Options, Warrants And Rights(1) | Weighted Average Exercise Price of Outstanding Options, Warrants And Rights(2) | Number of Securities Remaining Available for Future Issuance Under Equity Compensation Plans(3) | ||||||
Equity compensation plans approved by security holders | 5,508,039 | $ | 6.78 | 3,204,802 | |||||
Equity compensation plans not approved by security holders | — | — | — | ||||||
5,508,039 | $ | 6.78 | 3,204,802 | ||||||
(1) | Includes (a) 3,743,991 shares subject to issuance pursuant to outstanding awards of stock options and 1,238,129 shares subject to issuance pursuant to outstanding awards of restricted stock units (assuming the target level of performance achievement) under the 2007 Incentive Plan; and (b) 525,919 shares subject to issuance pursuant to outstanding awards of stock options under the Pioneer Drilling Company 2003 Stock Plan. It does not include awards we grant in the form of phantom stock unit awards which are expected to be paid in cash. |
(2) | The weighted-average exercise price does not take into account the shares issuable upon vesting of outstanding awards of restricted stock units, which have no exercise price. |
(3) | Represents 2,322,320 shares available for future issuance in the form of restricted stock under the 2007 Incentive Plan as of December 31, 2017. |
88
From January 1, 2018 to February 16, 2018, we granted restricted stock unit awards covering 788,377 shares of our common stock to 87 employees and executive officers. Applying the share counting rules under the 2007 Incentive Plan, these grants reduce the total number of shares available for issuance under the 2007 Incentive Plan by 1,087,960, leaving 2,116,842 shares available for issuance as of February 16, 2018. Pursuant to the terms of the 2007 Incentive Plan, if full value awards are issued, the fungible share pool approach under the 2007 Incentive Plan would deplete the shares available for issuance at a rate of 1.38 shares per share actually covered by an award.
ITEM 13. | CERTAIN RELATIONSHIPS AND RELATED TRANSACTIONS, AND DIRECTOR INDEPENDENCE |
Please see the information appearing in the proposal for the election of directors and under the heading “Certain Relationships and Related Transactions” in the definitive proxy statement for our 2018 Annual Meeting of Shareholders for the information this Item 13 requires.
ITEM 14. | PRINCIPAL ACCOUNTING FEES AND SERVICES |
Please see the information appearing in the proposal for the ratification of the appointment of our independent registered public accounting firm in the definitive proxy statement for our 2018 Annual Meeting of Shareholders for the information this Item 14 requires.
PART IV
ITEM 15. | EXHIBITS, FINANCIAL STATEMENT SCHEDULES |
(1) Financial Statements.
See Index to Consolidated Financial Statements included in Item 8, Financial Statements and Supplementary Data.
(2) Financial Statement Schedules.
No financial statement schedules are submitted because either they are inapplicable or because the required information is included in the consolidated financial statements or notes thereto.
(3) Exhibits.
See the Index to Exhibits immediately preceding the exhibits filed with this report.
ITEM 16. | EXHIBITS, FINANCIAL STATEMENT SCHEDULES |
Not applicable.
89
SIGNATURES
Pursuant to the requirements of Section 13 or 15(d) of the Securities Exchange Act of 1934, the registrant has duly caused this report to be signed on its behalf by the undersigned, thereunto duly authorized.
PIONEER ENERGY SERVICES CORP. | ||
February 16, 2018 | /S/ WM. STACY LOCKE | |
Wm. Stacy Locke Chief Executive Officer and President | ||
Pursuant to the requirements of the Securities Exchange Act of 1934, this report has been signed below by the following persons on behalf of the registrant and in the capacities and on the dates indicated.
Signature | Title | Date | ||
/S/ DEAN A. BURKHARDT | Chairman | February 16, 2018 | ||
Dean A. Burkhardt | ||||
/S/ WM. STACY LOCKE | President, Chief Executive Officer and Director (Principal Executive Officer) | February 16, 2018 | ||
Wm. Stacy Locke | ||||
/S/ LORNE E. PHILLIPS | Executive Vice President and Chief Financial Officer (Principal Financial Officer and Principal Accounting Officer) | February 16, 2018 | ||
Lorne E. Phillips | ||||
/S/ C. JOHN THOMPSON | Director | February 16, 2018 | ||
C. John Thompson | ||||
/S/ JOHN MICHAEL RAUH | Director | February 16, 2018 | ||
John Michael Rauh | ||||
/S/ SCOTT D. URBAN | Director | February 16, 2018 | ||
Scott D. Urban | ||||
90
Index to Exhibits
The following documents are exhibits to this Form 10-K:
Exhibit Number | Description | |
3.1* | - | |
3.2* | - | |
4.1* | - | |
4.2* | - | |
4.3* | - | |
10.1+* | - | |
10.2+* | - | |
10.3+* | - | |
10.4+* | - | |
10.5+* | - | |
10.6+* | - | |
10.7+* | - | |
10.8+* | - | |
10.9+* | - | |
10.10+* | - | |
10.11+* | - | |
10.12+* | - | |
10.13+* | - | |
10.14+* | - | |
10.15+* | - | |
91
10.16* | - | |
10.17* | - | |
10.18* | - | |
10.19* | - | |
10.20* | - | |
10.21* | - | |
10.22* | ||
10.23* | ||
10.24* | ||
10.25* | ||
10.26* | ||
10.27* | ||
10.28+* | - | |
10.29+* | - | |
10.30+* | - | |
10.31+* | - | |
10.32+* | ||
12.1** | - | |
21.1** | - | |
92
23.1** | - | |
31.1** | - | |
31.2** | - | |
32.1# | - | |
32.2# | - | |
101** | - | The following financial statements from Pioneer Energy Services Corp.’s Form 10-K for the year ended December 31, 2017, formatted in XBRL (eXtensible Business Reporting Language): (i) Consolidated Balance Sheets, (ii) Consolidated Statements of Operations, (iii) Consolidated Statements of Cash Flows, and (iv) Notes to Consolidated Financial Statements. |
* | Incorporated by reference to the filing indicated. | |
** | Filed herewith. | |
# | Furnished herewith. | |
+ | Management contract or compensatory plan or arrangement. | |
93