Attached files
| file | filename |
|---|---|
| 8-K - 8-K - EMPIRE DISTRICT ELECTRIC CO | a16-18669_18k.htm |
Exhibit 99.1
SERVICES YOU COUNT ON Second Quarter 2016 Investor Update Revised 9/19/2016 The Empire District Electric Company
Forward Looking Statements Certain matters discussed in this presentation are “forward-looking statements” intended to qualify for the safe harbor from liability established by the Private Securities Litigation Reform Act of 1995. Statements that are not historical facts, including statements about beliefs, expectations, estimates, projections, goals, forecasts, assumptions, risks and uncertainties, are forward-looking statements. Forward-looking statements are often characterized by the use of words such as “believes,” “estimates,” “expects,” “projects,” “may,” “intends,” “plans,” “anticipates,” “pro forma,” “predicts,” “seeks,” “could,” “would,” “will,” “can,” “continue” or “potential” and the negative of these terms or other comparable or similar terminology or expressions. The forward-looking statements in this presentation include, without limitation, statements relating to Liberty Utilities proposed acquisition of Empire, regulatory approvals, and the completion of the proposed transaction. These statements reflect Empire’s management’s current beliefs and are based on information currently available to Empire management. Forward-looking statements involve significant risk, uncertainties and assumptions. Certain factors or assumptions have been applied in drawing the conclusions contained in the forward-looking statements (some of which may prove to be incorrect). Empire cautions readers that a number of factors could cause actual results, performance or achievement to differ materially from the results discussed or implied in the forward-looking statements. Important factors that could cause actual results, performance and results to differ materially from those indicated by any such forward-looking statements include risks and uncertainties relating to the following: (i) the risk that Liberty Utilities or Empire may be unable to obtain governmental and regulatory approvals required for the proposed transaction, or required governmental and regulatory approvals may delay the proposed transaction; (ii) the occurrence of any event, change or other circumstances that could give rise to the termination of the merger agreement; or could otherwise cause the failure of the merger to close; (iii) the risk that a condition to the closing of the proposed transaction may not be satisfied; (iv) the failure to obtain any financing necessary to complete the merger; (v) the outcome of any legal proceedings, regulatory proceedings or enforcement matters that may be instituted against Empire and others relating to the merger agreement; (vi) the receipt of an unsolicited offer from another party to acquire assets or capital stock of Empire that could interfere with the proposed merger; (vii) the timing to consummate the proposed transaction; (viii) disruption from the proposed transaction making it more difficult to maintain relationships with customers, employees, regulators or suppliers; (ix) the diversion of management time and attention on the transaction; (x) general worldwide economic conditions and related uncertainties; (xi) the effect and timing of changes in laws or in governmental regulations (including environmental laws and regulations); (xii) the timing and extent of changes in interest rates, commodity prices and demand and market prices for gas and electricity; and (xiii) other factors discussed or referred to in the “Risk Factors” or “Forward Looking Statements” sections of Empire’s most recent Annual Report on Form 10-K filed with the Securities and Exchange Commission (the SEC) and in subsequently filed Forms 10-Q and 8-K. Additional risks and uncertainties are discussed in the proxy statement and other materials that Empire has filed with the SEC in connection with the proposed transaction. There can be no assurance that the proposed transaction will be completed, or if it is completed, that it will close within the anticipated time period. These factors should be considered carefully and undue reliance should not be placed on the forward-looking statements. Each forward-looking statement in this presentation speaks only as of the date of the particular statement. For additional information with respect to certain of the risks or factors, reference should be made to Empire’s filings with the SEC. Except as required by law, Empire disclaims any intention or obligation to update or revise any forward-looking statements, whether as a result of new information, future events or otherwise.
Index Merger Update . . . . . . . . . . . . . . 3 Second Quarter Update . . . . . . . 7 Regulatory Update . . . . . . . . . . 15 Supplemental Materials . . . . . . 18 Who We Are . . . . . . . . . . . . . . . . . 19 Growth . . . . . . . . . . . . . . . . . . . . . . 21 Financial . . . . . . . . . . . . . . . . . . . . 23 Operations . . . . . . . . . . . . . . . . . . 29 Contacts . . . . . . . . . . . . . . . . . . . . 31 Index
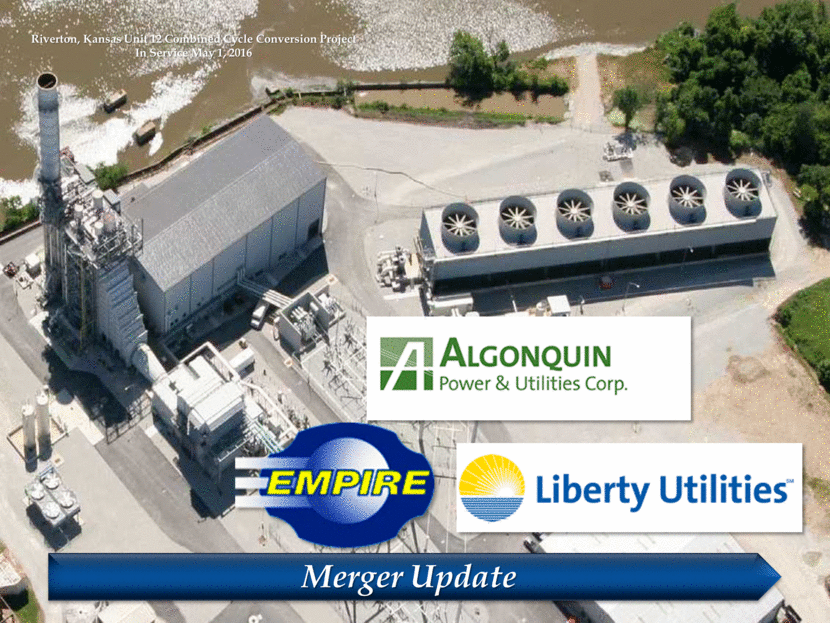
SERVICES YOU COUNT ON Merger Update Riverton, Kansas Unit 12 Combined Cycle Conversion Project In Service May 1, 2016
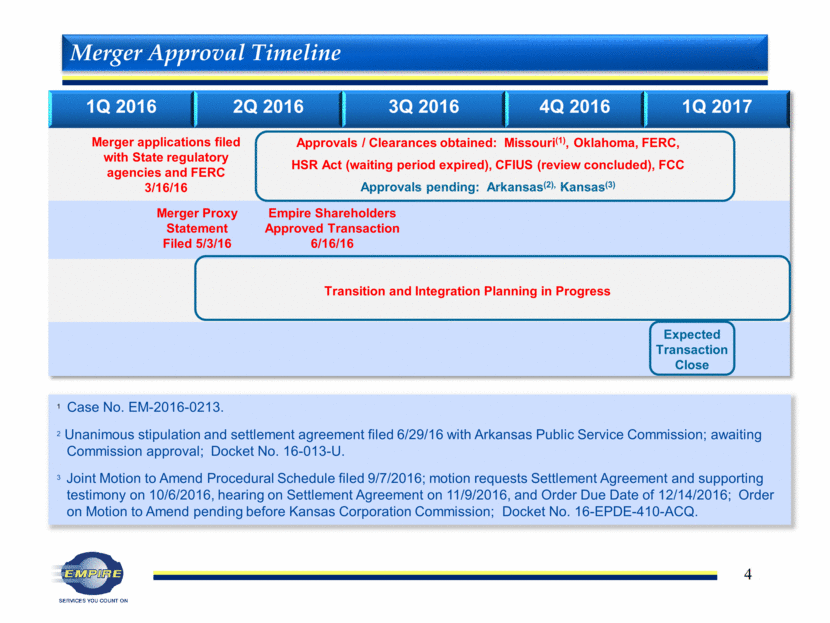
1Q 2016 2Q 2016 3Q 2016 4Q 2016 1Q 2017 Merger applications filed with State regulatory agencies and FERC 3/16/16 Approvals / Clearances obtained: Missouri(1), Oklahoma, FERC, HSR Act (waiting period expired), CFIUS (review concluded), FCC Approvals pending: Arkansas(2), Kansas(3) Merger Proxy Statement Filed 5/3/16 Empire Shareholders Approved Transaction 6/16/16 Transition and Integration Planning in Progress Expected Transaction Close Merger Approval Timeline 1 Case No. EM-2016-0213. 2 Unanimous stipulation and settlement agreement filed 6/29/16 with Arkansas Public Service Commission; awaiting Commission approval; Docket No. 16-013-U. 3 Joint Motion to Amend Procedural Schedule filed 9/7/2016; motion requests Settlement Agreement and supporting testimony on 10/6/2016, hearing on Settlement Agreement on 11/9/2016, and Order Due Date of 12/14/2016; Order on Motion to Amend pending before Kansas Corporation Commission; Docket No. 16-EPDE-410-ACQ.
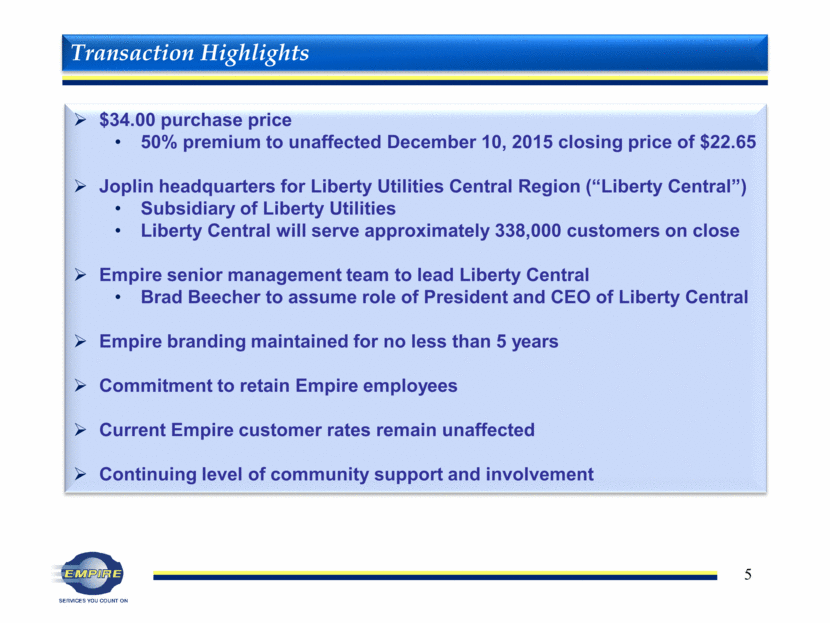
$34.00 purchase price 50% premium to unaffected December 10, 2015 closing price of $22.65 Joplin headquarters for Liberty Utilities Central Region (“Liberty Central”) Subsidiary of Liberty Utilities Liberty Central will serve approximately 338,000 customers on close Empire senior management team to lead Liberty Central Brad Beecher to assume role of President and CEO of Liberty Central Empire branding maintained for no less than 5 years Commitment to retain Empire employees Current Empire customer rates remain unaffected Continuing level of community support and involvement Transaction Highlights
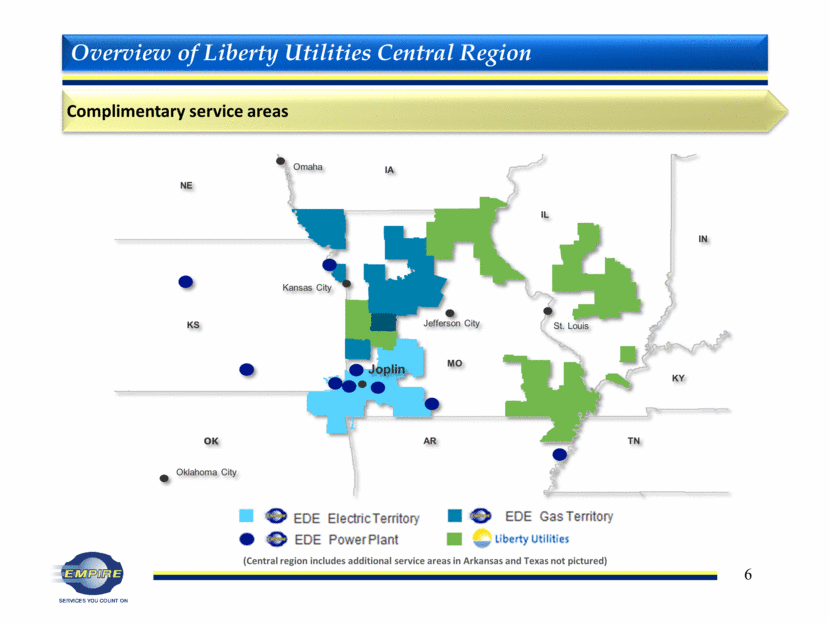
Kansas City Oklahoma City St. Louis Omaha KS NE IA MO OK AR IL Joplin IN KY TN Jefferson City Overview of Liberty Utilities Central Region Complimentary service areas (Central region includes additional service areas in Arkansas and Texas not pictured)
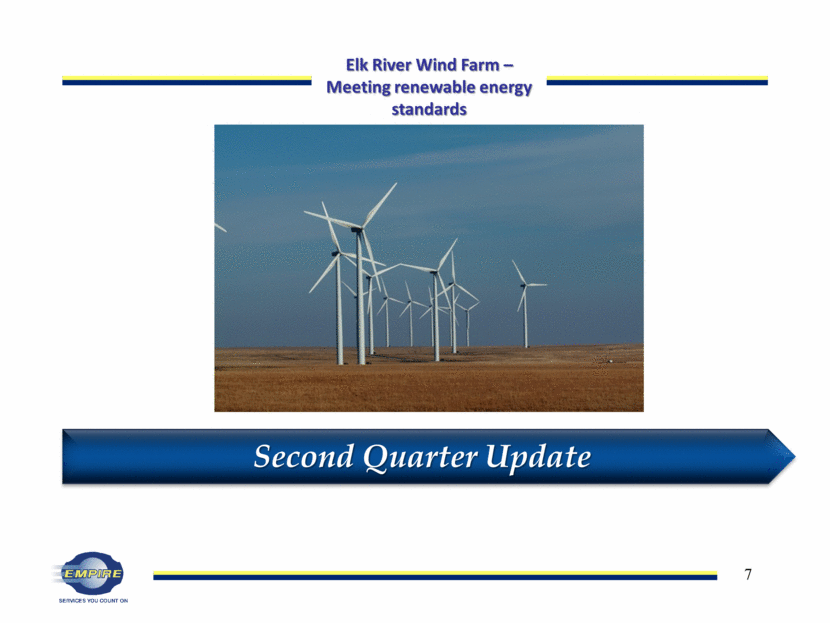
Second Quarter Update Elk River Wind Farm – Meeting renewable energy standards
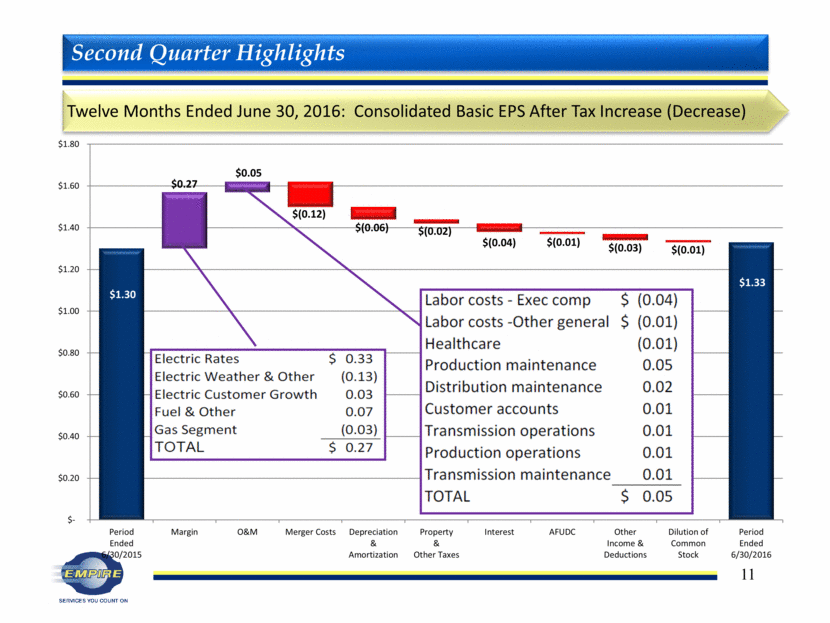
2nd Quarter 2016 2nd Quarter 2015 YTD June, 2016 YTD June, 2015 TME June, 2016 TME June, 2015 Net Income (millions) $9.2 $6.8 $23.2 $21.4 $58.4 $56.4 Earnings Per Share - including merger costs $0.21 $0.16 $0.53 $0.49 $1.33 $1.30 Earnings Per Share -exclusive of merger costs $0.27 $0.16 $0.65 $0.49 $1.45 $1.30 Dividends Per Share $0.26 $0.26 $0.52 $0.52 $1.04 $1.035 Quarter: Increased Missouri rates Lower O&M costs Increased depreciation and amortization and interest expense Merger related costs Second Quarter Highlights Twelve Month Ended: Increased Missouri rates Customer growth Mild winter weather and other volumetric changes Fuel decrease due to deferral timing Increased depreciation and amortization, interest and other non-operating expenses Reduced AFUDC levels Merger related costs Year-to-Date: Increased Missouri rates Customer growth Mild winter weather and other volumetric changes Increased depreciation and amortization, interest expense Reduced AFUDC levels Merger related costs Riverton 12 Combined Cycle placed in service May 1, 2016 Electric Vehicle Initiative Launch Results Drivers: (1) 1 Diluted $0.15 2 Diluted $1.29 (2)
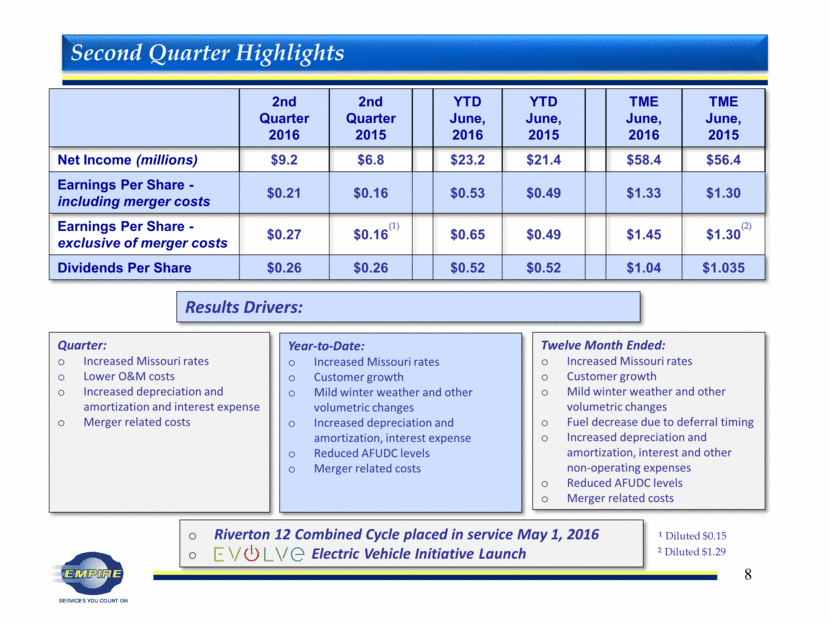
Second Quarter Highlights Quarter ended June 30, 2016: Consolidated Basic EPS After Tax Increase (Decrease) $(0.01) $0.10 $0.04 $0.00 $0.00 $(0.06) $(0.01) $(0.01) ? $0.16 $0.21 $- $0.05 $0.10 $0.15 $0.20 $0.25 $0.30 $0.35 $0.40 Period Ended 6/30/2015 Margin O&M Merger Costs Depreciation & Amortization Property & Other Taxes Interest AFUDC Other Income & Deductions Period Ended 6/30/2016
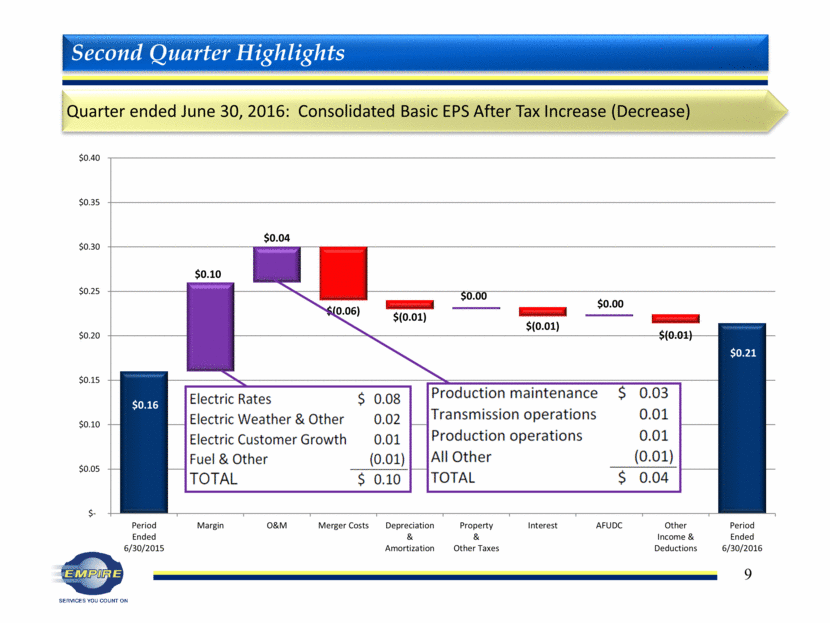
Second Quarter Highlights Year-to-Date June 30, 2016: Consolidated Basic EPS After Tax Increase (Decrease) $0.12 $0.05 $0.00 $0.01 $0.00 $(0.12) $(0.01) $(0.01) $0.49 $0.53 $- $0.10 $0.20 $0.30 $0.40 $0.50 $0.60 $0.70 Period Ended 6/30/2015 Margin O&M Merger Costs Depreciation & Amortization Property & Other Taxes Interest AFUDC Other Income & Deductions Period Ended 6/30/2016
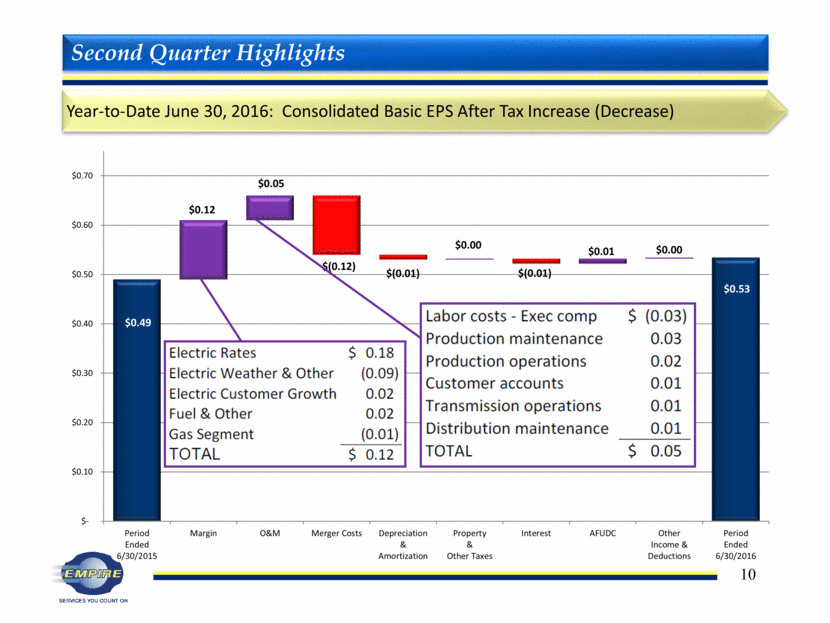
Second Quarter Highlights Twelve Months Ended June 30, 2016: Consolidated Basic EPS After Tax Increase (Decrease) $(0.04) $0.27 $0.05 $(0.12) $(0.06) $(0.02) $(0.01) $(0.03) $(0.01) $1.30 $1.33 $- $0.20 $0.40 $0.60 $0.80 $1.00 $1.20 $1.40 $1.60 $1.80 Period Ended 6/30/2015 Margin O&M Merger Costs Depreciation & Amortization Property & Other Taxes Interest AFUDC Other Income & Deductions Dilution of Common Stock Period Ended 6/30/2016
Earnings Per Share 2016 Earnings Drivers 2016 Guidance: Full year of Asbury AQCS cost recovery in customer rates Rates in effect late September 2016 for Missouri case filed October 16, 2015 to recover Riverton Unit 12 Combined Cycle project costs Riverton lag effect until project costs recovered in customer rates in September 2016 Riverton 12 depreciation rate approximately 2% Adjusted to include estimated merger costs of $15 to $17 million, with approximately 50% payable in 2016 (assuming 2017 closing) (1) $1.29 Diluted Range adjusted 2/26/16 to $1.26 to $1.44 (1) $1.30 $1.00 $1.10 $1.20 $1.30 $1.40 $1.50 $1.60 2015 Actual 2016 Guidance Range Estimate Guidance Range $1.38 to $1.54 (2/4/16)
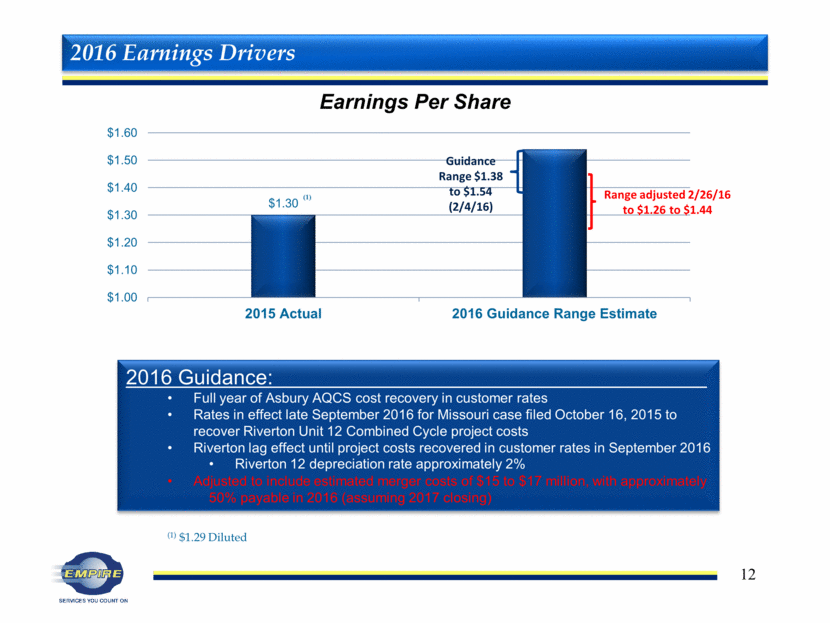
Quarterly ROE* – Trailing 12-Month Basis * Not weather adjusted Return on Equity ROE absent merger-related costs 7.3% 7.8% 0.0% 1.0% 2.0% 3.0% 4.0% 5.0% 6.0% 7.0% 8.0% 9.0% 10.0% Q2 2009 Q3 2009 Q4 2009 Q1 2010 Q2 2010 Q3 2010 Q4 2010 Q1 2011 Q2 2011 Q3 2011 Q4 2011 Q1 2012 Q2 2012 Q3 2012 Q4 2012 Q1 2013 Q2 2013 Q3 2013 Q4 2013 Q1 2014 Q2 2014 Q3 2014 Q4 2014 Q1 2015 Q2 2015 Q3 2015 Q4 2015 Q1 2016 Q2 2016 ROE 8.8% 7.3% 6.9% 6.2% 6.0% 7.1% 7.2% 7.7% 8.0% 8.0% 7.9% 7.6% 7.8% 7.6% 7.8% 8.1% 8.2% 7.8% 8.5% 9.4% 9.3% 9.1% 8.6% 7.7% 7.2% 7.2% 7.1% 6.9% 7.2%
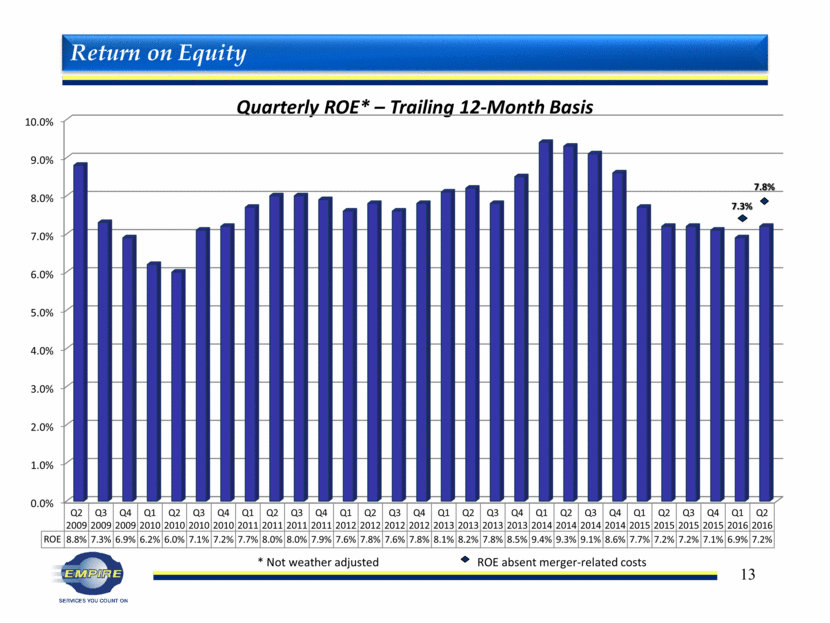
Electric Vehicle Initiative Launch www.evolvewithempire.com Initiative Includes: Expansion of charging station network Rebates for purchase or lease of new electric vehicle (EV), plug-in hybrids, electric fork trucks Dealer incentives Federal tax credits available Initiative Purpose: Address flattening customer usage trend Optimize off-peak power, such as wind energy, to help manage long-term customer costs Provide customers service and information as they consider new technology options like EV Corporate goal of responsible stewardship of the environment
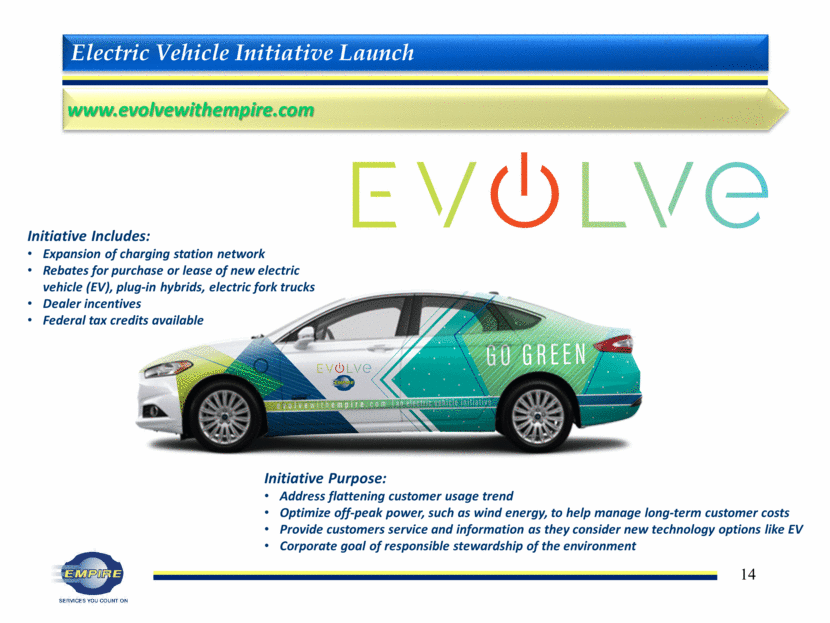
Regulatory Update Leading by example – adopting electric and plug-in technologies for vehicle fleet
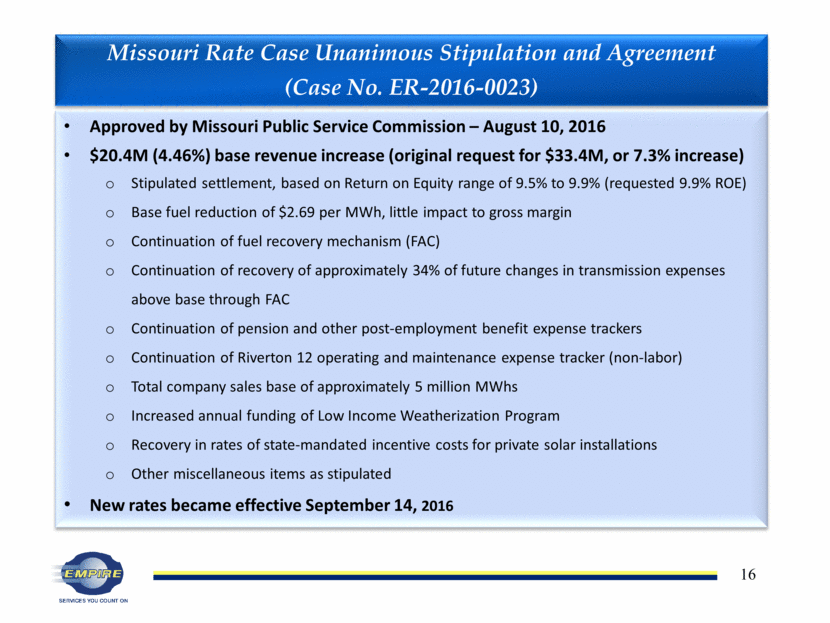
Approved by Missouri Public Service Commission – August 10, 2016 $20.4M (4.46%) base revenue increase (original request for $33.4M, or 7.3% increase) Stipulated settlement, based on Return on Equity range of 9.5% to 9.9% (requested 9.9% ROE) Base fuel reduction of $2.69 per MWh, little impact to gross margin Continuation of fuel recovery mechanism (FAC) Continuation of recovery of approximately 34% of future changes in transmission expenses above base through FAC Continuation of pension and other post-employment benefit expense trackers Continuation of Riverton 12 operating and maintenance expense tracker (non-labor) Total company sales base of approximately 5 million MWhs Increased annual funding of Low Income Weatherization Program Recovery in rates of state-mandated incentive costs for private solar installations Other miscellaneous items as stipulated New rates became effective September 14, 2016 Missouri Rate Case Unanimous Stipulation and Agreement (Case No. ER-2016-0023)
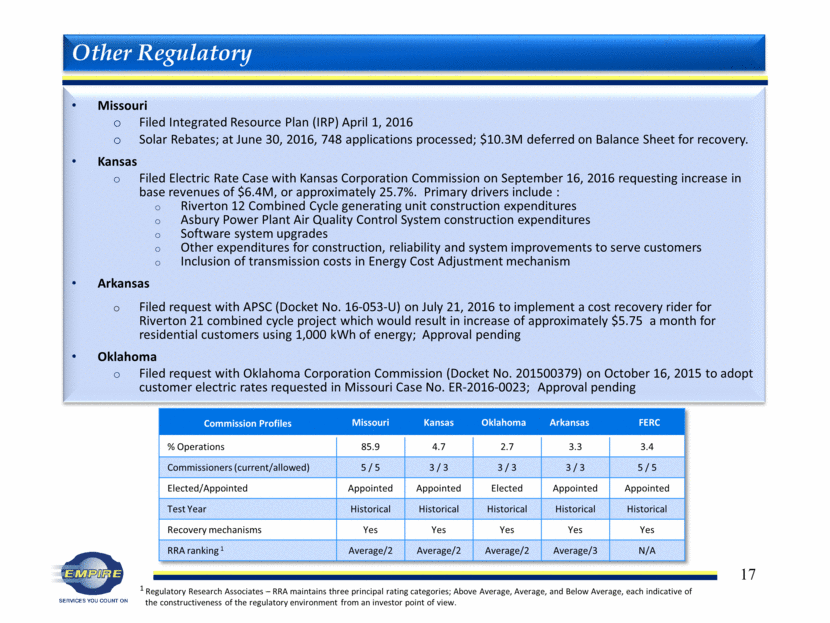
Missouri Filed Integrated Resource Plan (IRP) April 1, 2016 Solar Rebates; at June 30, 2016, 748 applications processed; $10.3M deferred on Balance Sheet for recovery. Kansas Filed Electric Rate Case with Kansas Corporation Commission on September 16, 2016 requesting increase in base revenues of $6.4M, or approximately 25.7%. Primary drivers include : Riverton 12 Combined Cycle generating unit construction expenditures Asbury Power Plant Air Quality Control System construction expenditures Software system upgrades Other expenditures for construction, reliability and system improvements to serve customers Inclusion of transmission costs in Energy Cost Adjustment mechanism Arkansas Filed request with APSC (Docket No. 16-053-U) on July 21, 2016 to implement a cost recovery rider for Riverton 21 combined cycle project which would result in increase of approximately $5.75 a month for residential customers using 1,000 kWh of energy; Approval pending Oklahoma Filed request with Oklahoma Corporation Commission (Docket No. 201500379) on October 16, 2015 to adopt customer electric rates requested in Missouri Case No. ER-2016-0023; Approval pending Other Regulatory Commission Profiles Missouri Kansas Oklahoma Arkansas FERC % Operations 85.9 4.7 2.7 3.3 3.4 Commissioners (current/allowed) 5 / 5 3 / 3 3 / 3 3 / 3 5 / 5 Elected/Appointed Appointed Appointed Elected Appointed Appointed Test Year Historical Historical Historical Historical Historical Recovery mechanisms Yes Yes Yes Yes Yes RRA ranking 1 Average/2 Average/2 Average/2 Average/3 N/A 1 Regulatory Research Associates – RRA maintains three principal rating categories; Above Average, Average, and Below Average, each indicative of the constructiveness of the regulatory environment from an investor point of view.
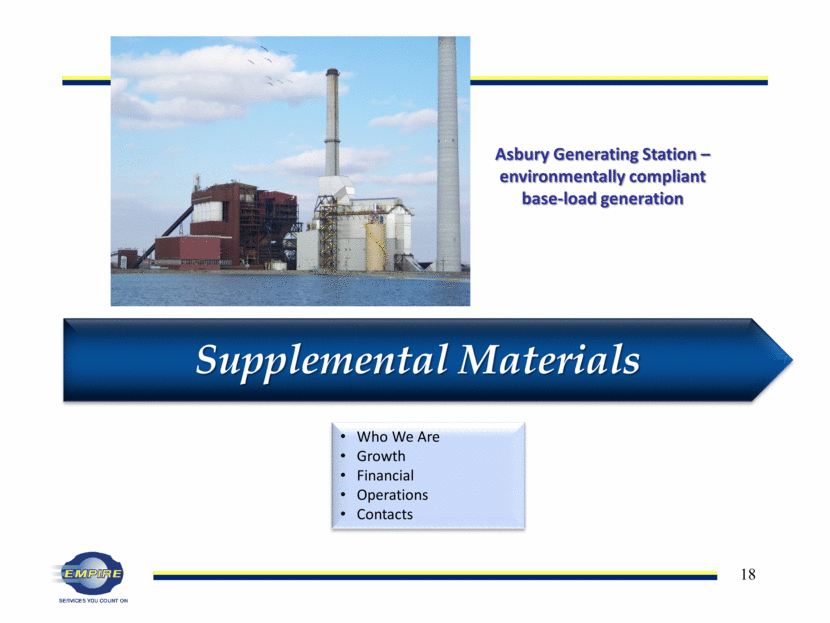
Supplemental Materials Who We Are Growth Financial Operations Contacts Asbury Generating Station –environmentally compliant base-load generation
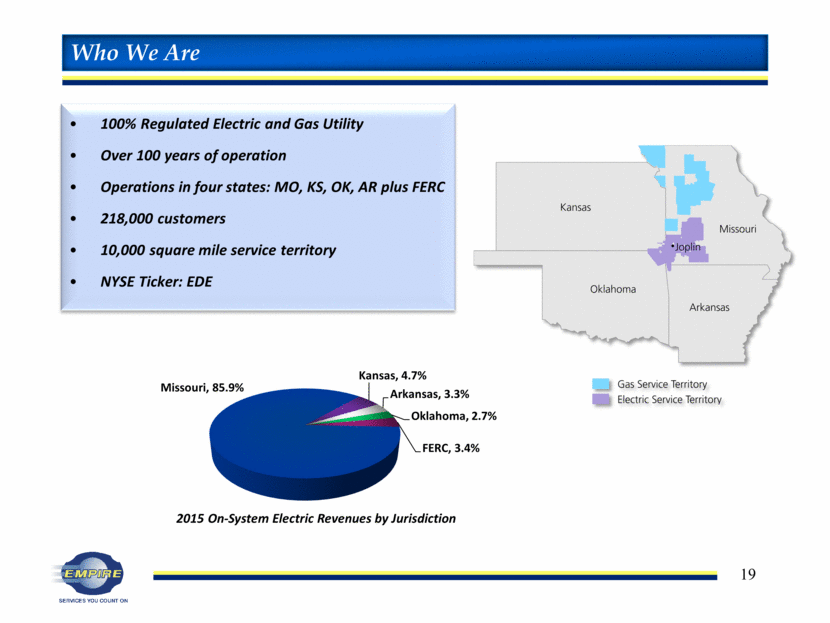
Who We Are 100% Regulated Electric and Gas Utility Over 100 years of operation Operations in four states: MO, KS, OK, AR plus FERC 218,000 customers 10,000 square mile service territory NYSE Ticker: EDE FERC , 3.4% Missouri , 85.9% Kansas , 4.7% Arkansas , 3.3% Oklahoma , 2.7% 2015 On - System Electric Revenues by Jurisdiction
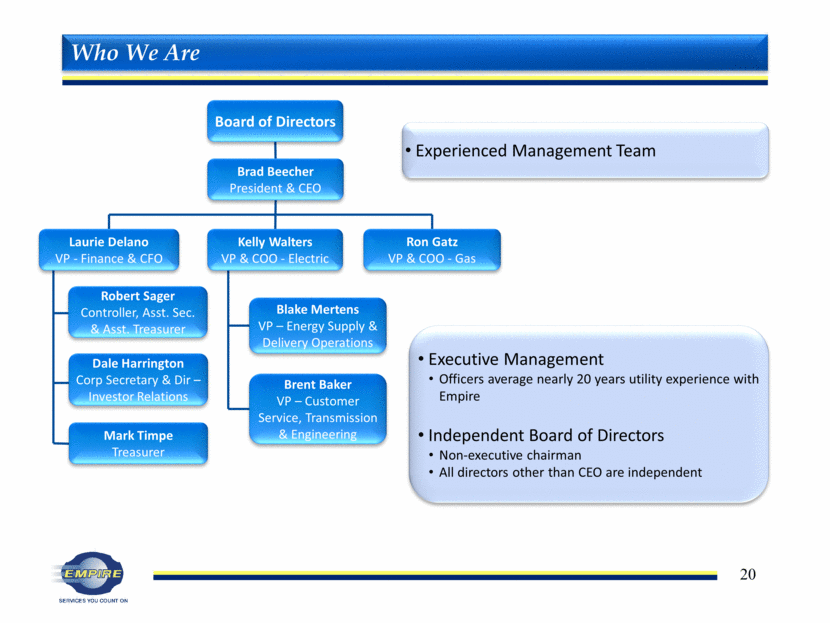
Executive Management Officers average nearly 20 years utility experience with Empire Independent Board of Directors Non-executive chairman All directors other than CEO are independent Who We Are Board of Directors Brad Beecher President & CEO Laurie Delano VP - Finance & CFO Kelly Walters VP & COO - Electric Ron Gatz VP & COO - Gas Robert Sager Controller, Asst. Sec. & Asst. Treasurer Dale Harrington Corp Secretary & Dir – Investor Relations Mark Timpe Treasurer Blake Mertens VP – Energy Supply & Delivery Operations Brent Baker VP – Customer Service, Transmission & Engineering Experienced Management Team
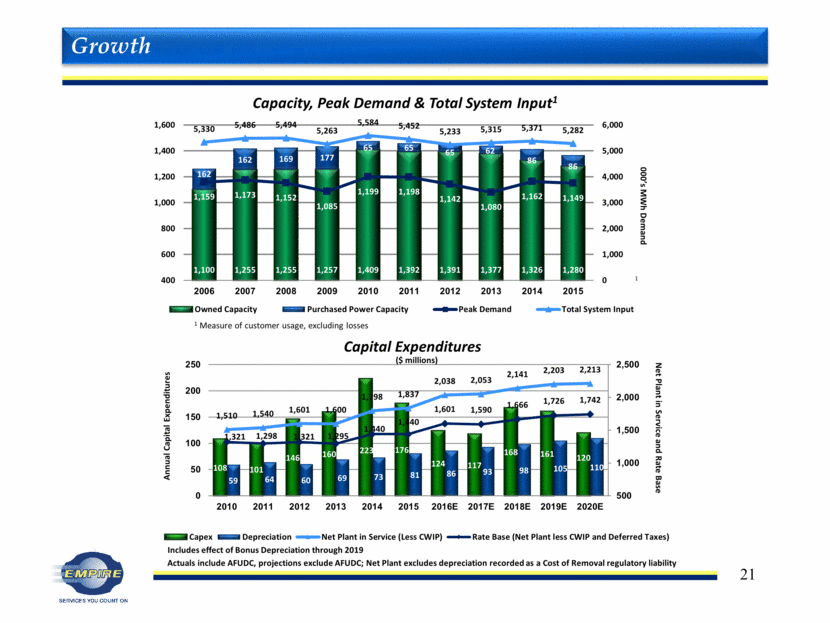
1 Measure of customer usage, excluding losses Actuals include AFUDC, projections exclude AFUDC; Net Plant excludes depreciation recorded as a Cost of Removal regulatory liability Includes effect of Bonus Depreciation through 2019 Growth 1 1,100 1,255 1,255 1,257 1,409 1,392 1,391 1,377 1,326 1,280 162 162 169 177 65 65 65 62 86 86 1,159 1,173 1,152 1,085 1,199 1,198 1,142 1,080 1,162 1,149 5,330 5,486 5,494 5,263 5,584 5,452 5,233 5,315 5,371 5,282 0 1,000 2,000 3,000 4,000 5,000 6,000 400 600 800 1,000 1,200 1,400 1,600 2006 2007 2008 2009 2010 2011 2012 2013 2014 2015 000’s MWh Demand Capacity, Peak Demand & Total System Input 1 Owned Capacity Purchased Power Capacity Peak Demand Total System Input 108 101 146 160 223 176 124 117 168 161 120 59 64 60 69 73 81 86 93 98 105 110 1,510 1,540 1,601 1,600 1,798 1,837 2,038 2,053 2,141 2,203 2,213 1,321 1,298 1,321 1,295 1,440 1,440 1,601 1,590 1,666 1,726 1,742 500 1,000 1,500 2,000 2,500 0 50 100 150 200 250 2010 2011 2012 2013 2014 2015 2016E 2017E 2018E 2019E 2020E Net Plant in Service and Rate Base Annual Capital Expenditures Capex Depreciation Net Plant in Service (Less CWIP) Rate Base (Net Plant less CWIP and Deferred Taxes) Capital Expenditures ($ millions)
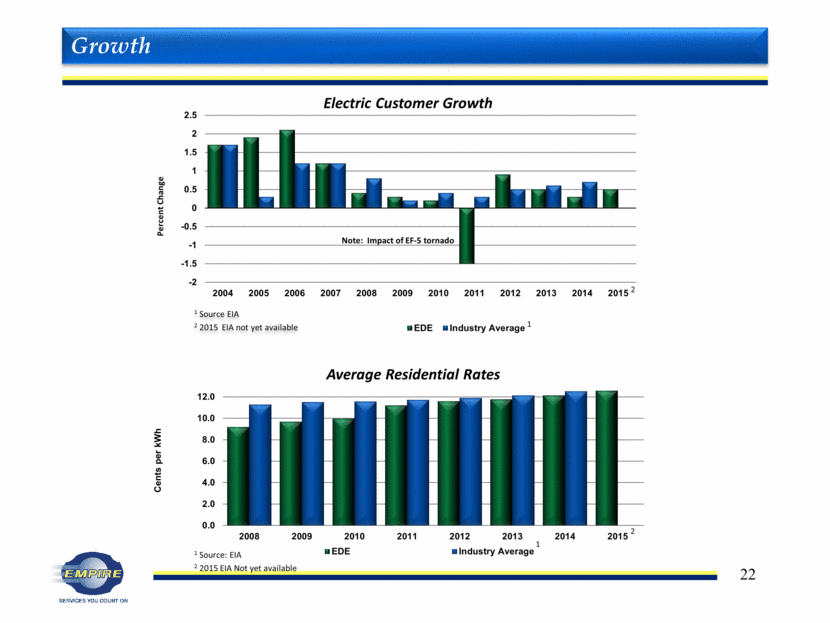
Electric Customer Growth Average Residential Rates 1 Source EIA 2 2015 EIA not yet available 1 Source: EIA 2 2015 EIA Not yet available Growth 1 2 -2 -1.5 -1 -0.5 0 0.5 1 1.5 2 2.5 2004 2005 2006 2007 2008 2009 2010 2011 2012 2013 2014 2015 Percent Change EDE Industry Average 1 Note: Impact of E F - 5 tornado 2 0.0 2.0 4.0 6.0 8.0 10.0 12.0 2008 2009 2010 2011 2012 2013 2014 2015 Cents per kWh EDE Industry Average
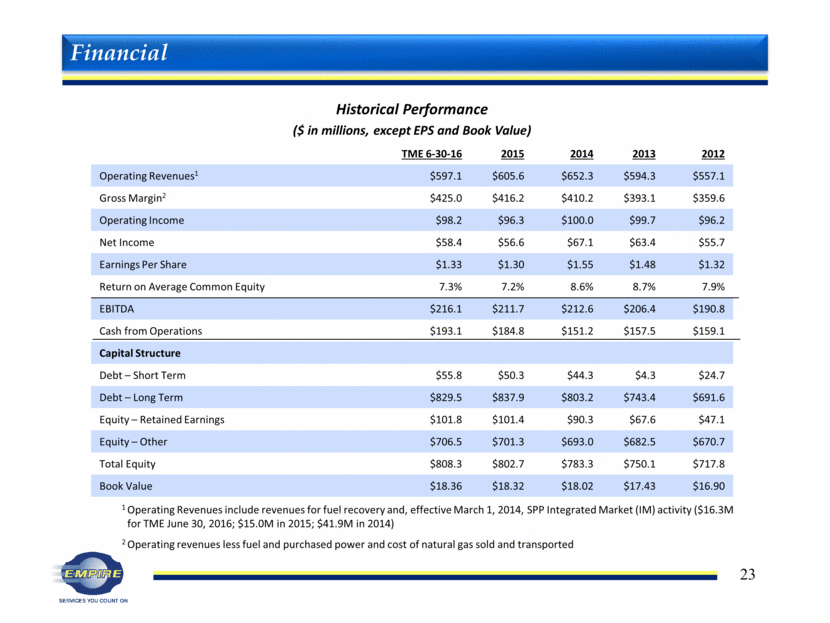
1 Operating Revenues include revenues for fuel recovery and, effective March 1, 2014, SPP Integrated Market (IM) activity ($16.3M for TME June 30, 2016; $15.0M in 2015; $41.9M in 2014) 2 Operating revenues less fuel and purchased power and cost of natural gas sold and transported Historical Performance ($ in millions, except EPS and Book Value) TME 6-30-16 2015 2014 2013 2012 Operating Revenues1 $597.1 $605.6 $652.3 $594.3 $557.1 Gross Margin2 $425.0 $416.2 $410.2 $393.1 $359.6 Operating Income $98.2 $96.3 $100.0 $99.7 $96.2 Net Income $58.4 $56.6 $67.1 $63.4 $55.7 Earnings Per Share $1.33 $1.30 $1.55 $1.48 $1.32 Return on Average Common Equity 7.3% 7.2% 8.6% 8.7% 7.9% EBITDA $216.1 $211.7 $212.6 $206.4 $190.8 Cash from Operations $193.1 $184.8 $151.2 $157.5 $159.1 Capital Structure Debt – Short Term $55.8 $50.3 $44.3 $4.3 $24.7 Debt – Long Term $829.5 $837.9 $803.2 $743.4 $691.6 Equity – Retained Earnings $101.8 $101.4 $90.3 $67.6 $47.1 Equity – Other $706.5 $701.3 $693.0 $682.5 $670.7 Total Equity $808.3 $802.7 $783.3 $750.1 $717.8 Book Value $18.36 $18.32 $18.02 $17.43 $16.90 Financial
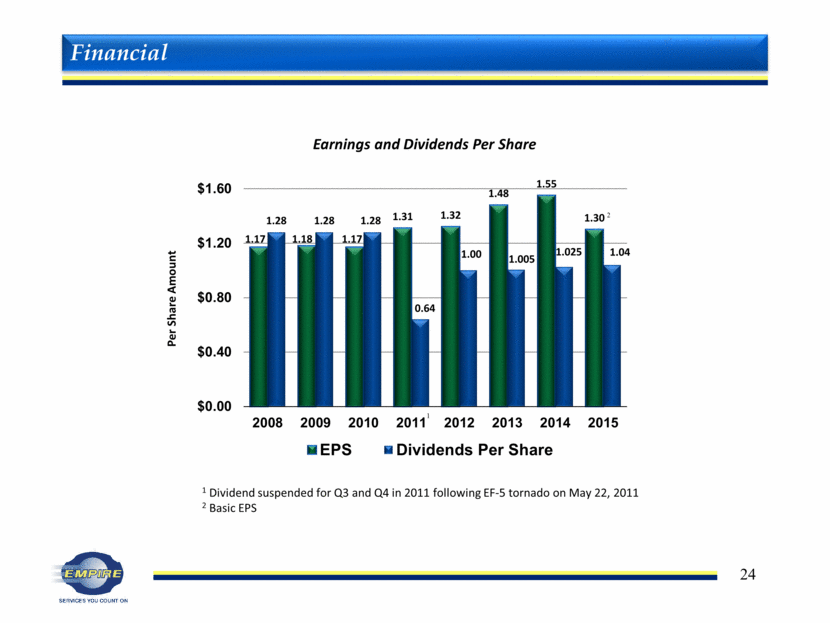
Financial 1 Dividend suspended for Q3 and Q4 in 2011 following EF-5 tornado on May 22, 2011 2 Basic EPS 1.17 1.18 1.17 1.31 1.32 1.48 1.55 1.30 1.28 1.28 1.28 0.64 1.00 1.005 1.025 1.04 $0.00 $0.40 $0.80 $1.20 $1.60 2008 2009 2010 2011 2012 2013 2014 2015 Earnings and Dividends Per Share EPS Dividends Per Share 1 Per Share Amount 2
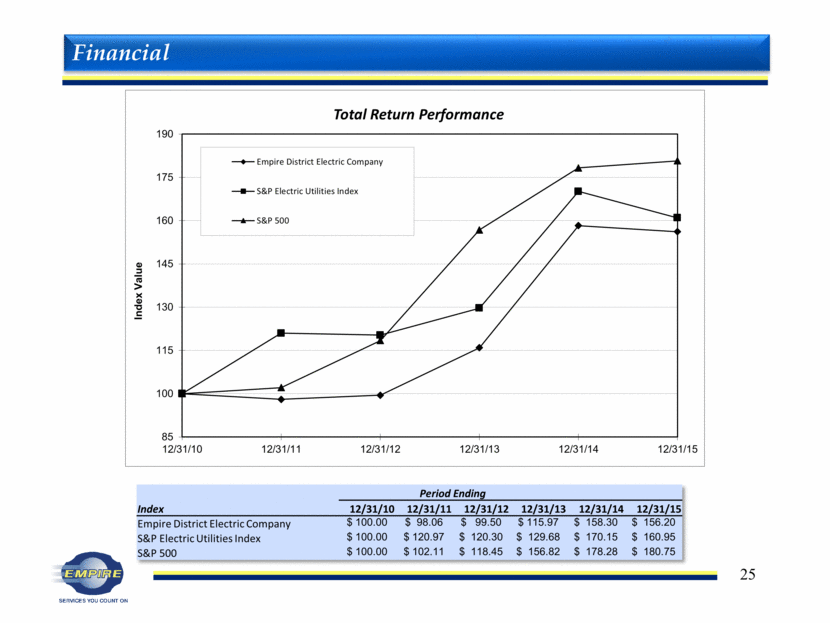
Period Ending Index 12/31/10 12/31/11 12/31/12 12/31/13 12/31/14 12/31/15 Empire District Electric Company $ 100.00 $ 98.06 $ 99.50 $ 115.97 $ 158.30 $ 156.20 S&P Electric Utilities Index $ 100.00 $ 120.97 $ 120.30 $ 129.68 $ 170.15 $ 160.95 S&P 500 $ 100.00 $ 102.11 $ 118.45 $ 156.82 $ 178.28 $ 180.75 Financial 85 100 115 130 145 160 175 190 12/31/10 12/31/11 12/31/12 12/31/13 12/31/14 12/31/15 Index Value Total Return Performance Empire District Electric Company S&P Electric Utilities Index S&P 500
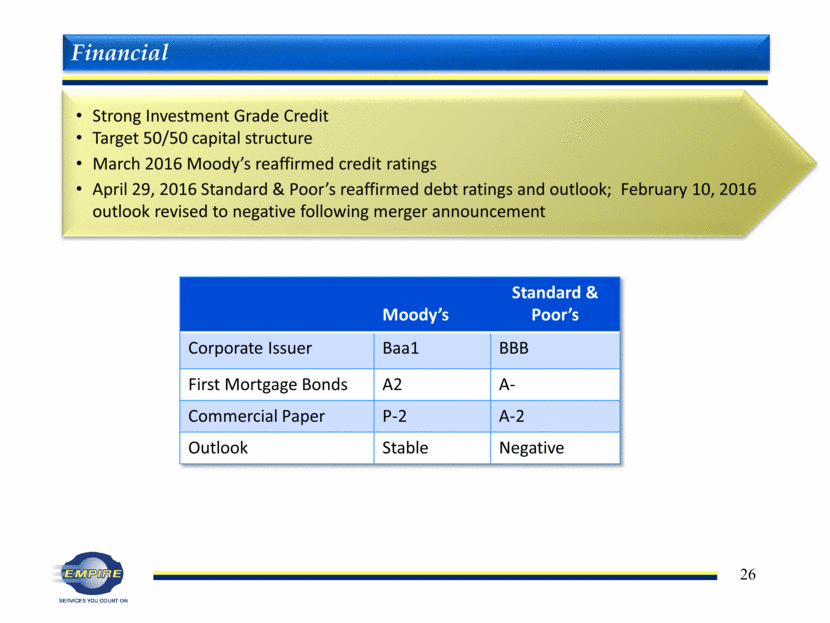
Moody’s Standard & Poor’s Corporate Issuer Baa1 BBB First Mortgage Bonds A2 A- Commercial Paper P-2 A-2 Outlook Stable Negative Financial Strong Investment Grade Credit Target 50/50 capital structure March 2016 Moody’s reaffirmed credit ratings April 29, 2016 Standard & Poor’s reaffirmed debt ratings and outlook; February 10, 2016 outlook revised to negative following merger announcement
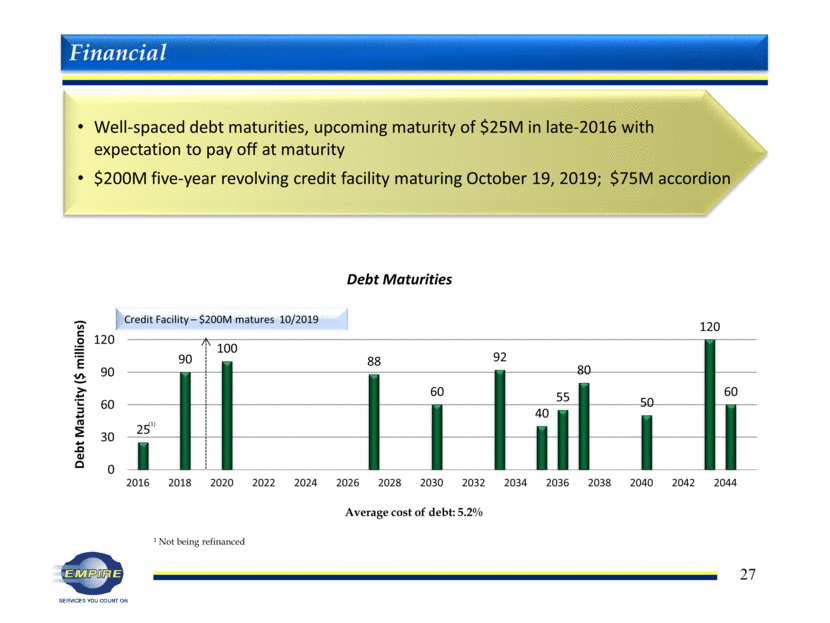
Financial Well-spaced debt maturities, upcoming maturity of $25M in late-2016 with expectation to pay off at maturity $200M five-year revolving credit facility maturing October 19, 2019; $75M accordion Average cost of debt: 5.2% 1 Not being refinanced (1) 25 90 100 88 60 92 40 55 80 50 120 60 0 30 60 90 120 2016 2018 2020 2022 2024 2026 2028 2030 2032 2034 2036 2038 2040 2042 2044 Debt Maturity ($ millions) Debt Maturities Credit Facility – $200M matures 10/2019
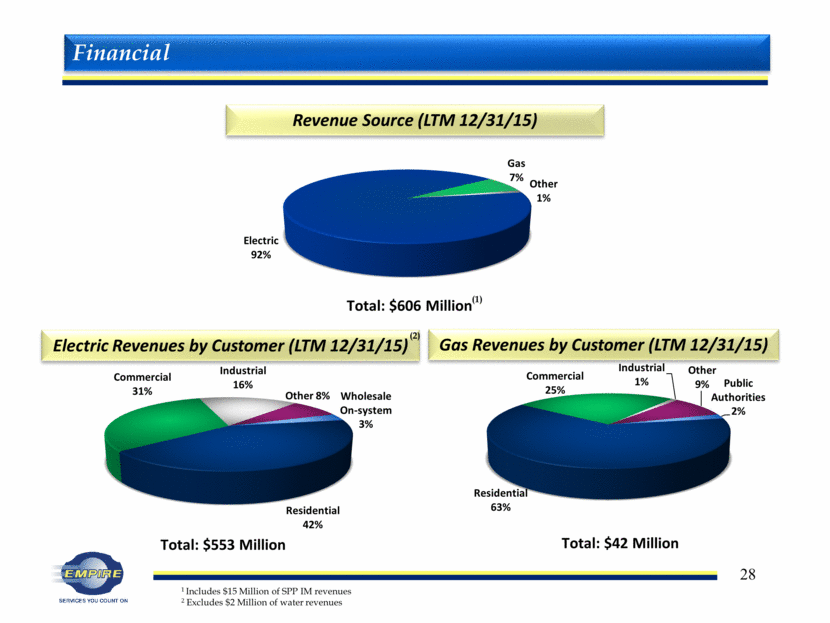
Financial Revenue Source (LTM 12/31/15) Electric Revenues by Customer (LTM 12/31/15) Gas Revenues by Customer (LTM 12/31/15) (1) 1 Includes $15 Million of SPP IM revenues 2 Excludes $2 Million of water revenues (2) Electric 92% Gas 7% Other 1% Total: $606 Million Residential 42% Commercial 31% Industrial 16% Other 8% Wholesale On - system 3% Total: $553 Million Residential 63% Commercial 25% Industrial 1% Other 9% Public Authorities 2% Total: $42 Million
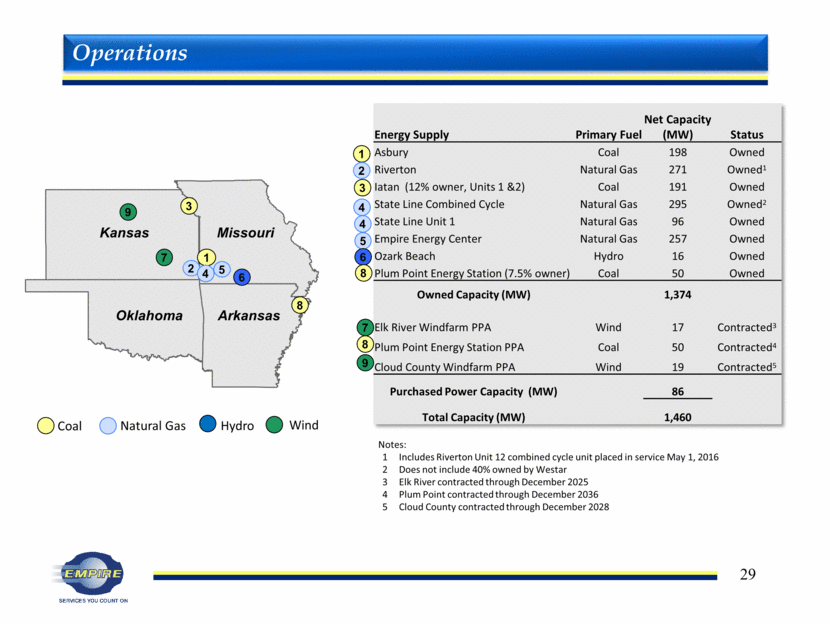
Energy Supply Primary Fuel Net Capacity (MW) Status Asbury Coal 198 Owned Riverton Natural Gas 271 Owned1 Iatan (12% owner, Units 1 &2) Coal 191 Owned State Line Combined Cycle Natural Gas 295 Owned2 State Line Unit 1 Natural Gas 96 Owned Empire Energy Center Natural Gas 257 Owned Ozark Beach Hydro 16 Owned Plum Point Energy Station (7.5% owner) Coal 50 Owned Owned Capacity (MW) 1,374 Elk River Windfarm PPA Wind 17 Contracted3 Plum Point Energy Station PPA Coal 50 Contracted4 Cloud County Windfarm PPA Wind 19 Contracted5 Purchased Power Capacity (MW) 86 Total Capacity (MW) 1,460 Notes: Includes Riverton Unit 12 combined cycle unit placed in service May 1, 2016 Does not include 40% owned by Westar Elk River contracted through December 2025 Plum Point contracted through December 2036 Cloud County contracted through December 2028 Kansas 9 7 Oklahoma Arkansas Missouri 3 6 1 2 4 5 1 2 3 4 5 6 7 9 8 8 Coal Natural Gas Hydro Wind 4 8 Operations
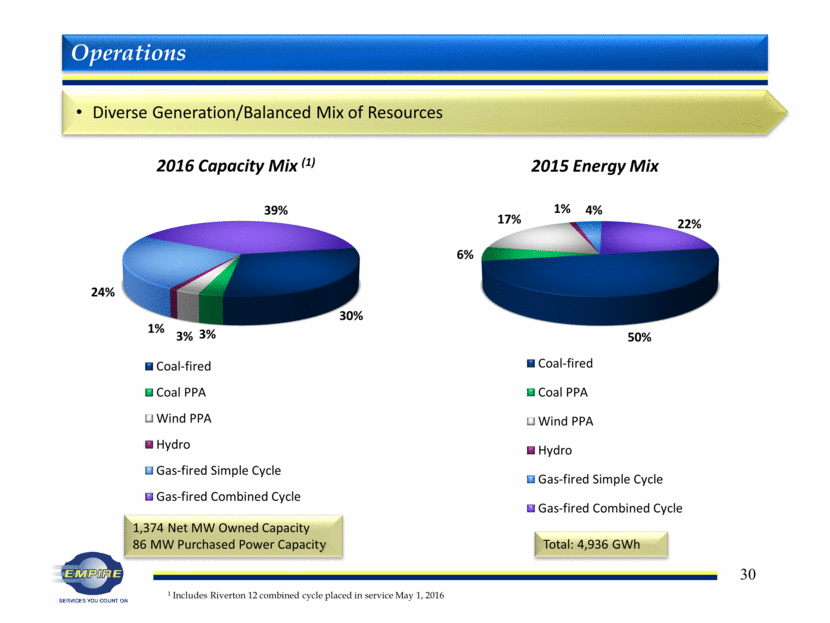
Operations Diverse Generation/Balanced Mix of Resources 1,374 Net MW Owned Capacity 86 MW Purchased Power Capacity Total: 4,936 GWh 1 Includes Riverton 12 combined cycle placed in service May 1, 2016 30% 3% 3% 1% 24% 39% 2016 Capacity Mix (1) Coal-fired Coal PPA Wind PPA Hydro Gas-fired Simple Cycle Gas-fired Combined Cycle 50% 6% 17% 1% 4% 22% 2015 Energy Mix Coal-fired Coal PPA Wind PPA Hydro Gas-fired Simple Cycle Gas-fired Combined Cycle
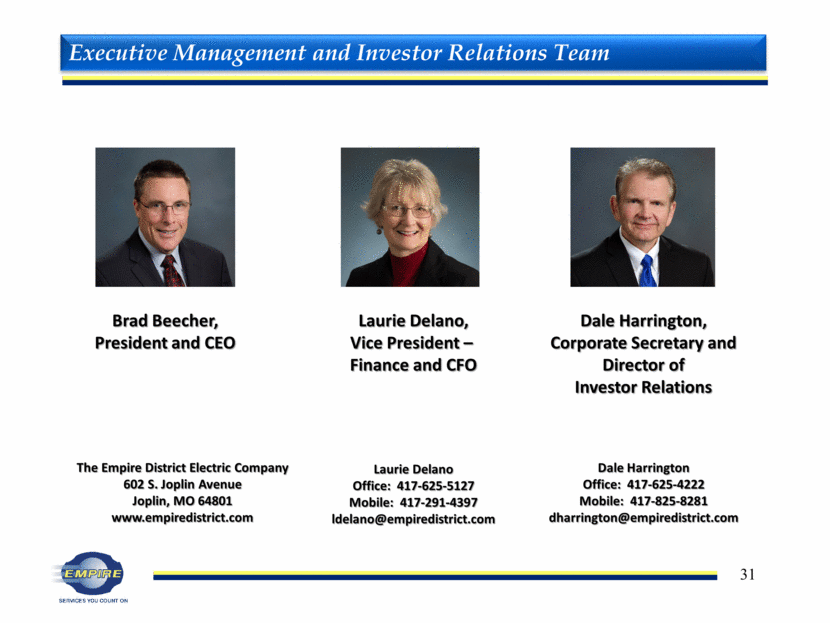
Brad Beecher, President and CEO Laurie Delano, Vice President – Finance and CFO Dale Harrington, Corporate Secretary and Director of Investor Relations The Empire District Electric Company 602 S. Joplin Avenue Joplin, MO 64801 www.empiredistrict.com Laurie Delano Office: 417-625-5127 Mobile: 417-291-4397 ldelano@empiredistrict.com Dale Harrington Office: 417-625-4222 Mobile: 417-825-8281 dharrington@empiredistrict.com Executive Management and Investor Relations Team
Making lives better every day with reliable energy and service SERVICES YOU COUNT ON Asbury Generating Station – 2015 AQCS construction Photo by Randy Richardson, AQCS Construction Manager

