Attached files
| file | filename |
|---|---|
| EX-12 - EX-12 - EMPIRE DISTRICT ELECTRIC CO | a2202053zex-12.htm |
| EX-23 - EX-23 - EMPIRE DISTRICT ELECTRIC CO | a2202053zex-23.htm |
| EX-24 - EX-24 - EMPIRE DISTRICT ELECTRIC CO | a2202053zex-24.htm |
| EX-21 - EX-21 - EMPIRE DISTRICT ELECTRIC CO | a2202053zex-21.htm |
| EX-31.(A) - EX-31.(A) - EMPIRE DISTRICT ELECTRIC CO | a2202053zex-31_a.htm |
| EX-32.(A) - EX-32.(A) - EMPIRE DISTRICT ELECTRIC CO | a2202053zex-32_a.htm |
| EX-10.Q - EX-10.Q - EMPIRE DISTRICT ELECTRIC CO | a2202053zex-10_q.htm |
| EX-31.(B) - EX-31.(B) - EMPIRE DISTRICT ELECTRIC CO | a2202053zex-31_b.htm |
| EX-32.(B) - EX-32.(B) - EMPIRE DISTRICT ELECTRIC CO | a2202053zex-32_b.htm |
Use these links to rapidly review the document
INDEX TO FINANCIAL STATEMENTS
TABLE OF CONTENTS
UNITED STATES
SECURITIES AND EXCHANGE COMMISSION
Washington, D.C. 20549
FORM 10-K
| (Mark One) | ||
ý |
ANNUAL REPORT PURSUANT TO SECTION 13 OR 15(d) OF THE SECURITIES EXCHANGE ACT OF 1934 |
|
For the fiscal year ended December 31, 2010 |
||
or |
||
o |
TRANSITION REPORT PURSUANT TO SECTION 13 OR 15(d) OF THE SECURITIES EXCHANGE ACT OF 1934 |
|
For the transition period from to . |
||
Commission file number: 1-3368
THE EMPIRE DISTRICT ELECTRIC COMPANY
(Exact name of registrant as specified in its charter)
| Kansas (State of Incorporation) |
44-0236370 (I.R.S. Employer Identification No.) |
|
602 S. Joplin Avenue, Joplin, Missouri (Address of principal executive offices) |
64801 (zip code) |
Registrant's telephone number: (417) 625-5100
Securities registered pursuant to Section 12(b) of the Act:
| Title of each class | Name of each exchange on which registered | |
|---|---|---|
| Common Stock ($1 par value) | New York Stock Exchange |
Securities registered pursuant to Section 12(g) of the Act: None
Indicate by check mark if the registrant is a well-known seasoned issuer, as defined in Rule 405 of the Securities Act. Yes ý No o
Indicate by check mark if the registrant is not required to file reports pursuant to Section 13 or Section 15(d) of the Act. Yes o No ý
Indicate by check mark whether the registrant (1) has filed all reports required to be filed by Section 13 or 15(d) of the Securities Exchange Act of 1934 during the preceding 12 months (or for such shorter period that the registrant was required to file such reports), and (2) has been subject to such filing requirements for the past 90 days. Yes ý No o
Indicate by check mark whether the registrant has submitted electronically and posted on its corporate Web site, if any, every Interactive Data File required to be submitted and posted pursuant to Rule 405 of Regulation S-T during the preceding 12 months (or for such shorter period that the registrant was required to submit and post such files). Yes o No o
Indicate by check mark if disclosure of delinquent filers pursuant to Item 405 of Regulation S-K is not contained herein, and will not be contained, to the best of registrant's knowledge, in definitive proxy or information statements incorporated by reference in Part III of this Form 10-K or any amendment to this Form 10-K. ý
Indicate by check mark whether the registrant is a large accelerated filer, an accelerated filer, a non-accelerated filer, or a smaller reporting company. See the definitions of "large accelerated filer," "accelerated filer" and "smaller reporting company" in Rule 12b-2 of the Exchange Act. (Check one):
| Large accelerated filer ý | Accelerated filer o | Non-accelerated filer o (Do not check if a smaller reporting company) |
Smaller reporting company o |
Indicate by check mark whether the registrant is a shell company (as defined in Rule 12b-2 of the Exchange Act). Yes o No ý
The aggregate market value of the registrant's voting common stock held by nonaffiliates of the registrant, based on the closing price on the New York Stock Exchange on June 30, 2010, was approximately $776,378,968.
As of February 4, 2011, 41,666,218 shares of common stock were outstanding.
The following documents have been incorporated by reference into the parts of the Form 10-K as indicated:
| The Company's proxy statement, filed pursuant to Regulation 14A under the Securities Exchange Act of 1934, for its Annual Meeting of Stockholders to be held on April 28, 2011 |
Part of Item 10 of Part III All of Item 11 of Part III Part of Item 12 of Part III All of Item 13 of Part III All of Item 14 of Part III |
Certain matters discussed in this quarterly report are "forward-looking statements" intended to qualify for the safe harbor from liability established by the Private Securities Litigation Reform Act of 1995. Such statements address or may address future plans, objectives, expectations and events or conditions concerning various matters such as capital expenditures, earnings, pension and other costs, competition, litigation, our construction program, our generation plans, our financing plans, potential acquisitions, rate and other regulatory matters, liquidity and capital resources and accounting matters. Forward-looking statements may contain words like "anticipate", "believe", "expect", "project", "objective" or similar expressions to identify them as forward-looking statements. Factors that could cause actual results to differ materially from those currently anticipated in such statements include:
- •
- weather, business and economic conditions and other factors which may impact sales volumes and customer growth;
- •
- the amount, terms and timing of rate relief we seek and related matters;
- •
- the cost and availability of purchased power and fuel, and the results of our activities (such as hedging) to reduce the
volatility of such costs;
- •
- the results of prudency and similar reviews by regulators of costs we incur, including capital expenditures, fuel and
purchased power costs and Southwest Power Pool (SPP) regional transmission organization (RTO) expansion costs;
- •
- the costs and other impacts resulting from natural disasters, such as tornados and ice storms;
- •
- matters such as the effect of changes in credit ratings on the availability and our cost of funds;
- •
- costs and effects of legal and administrative proceedings, settlements, investigations and claims;
- •
- interruptions or changes in our coal delivery, gas transportation or storage agreements or arrangements;
- •
- our exposure to the credit risk of our hedging counterparties;
- •
- operation of our electric generation facilities and electric and gas transmission and distribution systems, including the
performance of our joint owners;
- •
- volatility in the credit, equity and other financial markets and the resulting impact on our short term debt costs and our
ability to issue debt or equity securities, or otherwise secure funds to meet our capital expenditure, dividend and liquidity needs;
- •
- the periodic revision of our construction and capital expenditure plans and cost and timing estimates;
- •
- legislation and regulation, including environmental regulation (such as NOx, SO2, mercury, ash and
CO2) and health care regulation;
- •
- the timing of accretion estimates, and integration costs relating to completed and contemplated acquisitions and the
performance of acquired businesses;
- •
- rate regulation, growth rates, discount rates, capital spending rates, terminal value calculations and other factors
integral to the calculations utilized to test the impairment of goodwill, in addition to market and economic conditions which could adversely affect the analysis and ultimately negatively impact
earnings;
- •
- competition, including the regional SPP energy imbalance market;
- •
- electric utility restructuring, including ongoing federal activities and potential state activities;
3
- •
- changes in accounting requirements, including the potential consequences of International Financial Reporting Standards
being required for U.S. SEC registrants rather than U.S. GAAP;
- •
- the performance of our pension assets and other post employment benefit plan assets and the resulting impact on our
related funding commitments;
- •
- other circumstances affecting anticipated rates, revenues and costs.
All such factors are difficult to predict, contain uncertainties that may materially affect actual results, and may be beyond our control. New factors emerge from time to time and it is not possible for management to predict all such factors or to assess the impact of each such factor on us. Any forward-looking statement speaks only as of the date on which such statement is made, and we do not undertake any obligation to update any forward-looking statement to reflect events or circumstances after the date on which such statement is made.
We caution you that any forward-looking statements are not guarantees of future performance and involve known and unknown risk, uncertainties and other factors which may cause our actual results, performance or achievements to differ materially from the facts, results, performance or achievements we have anticipated in such forward-looking statements.
4
We operate our businesses as three segments: electric, gas and other. The Empire District Electric Company (EDE), a Kansas corporation organized in 1909, is an operating public utility engaged in the generation, purchase, transmission, distribution and sale of electricity in parts of Missouri, Kansas, Oklahoma and Arkansas. As part of our electric segment, we also provide water service to three towns in Missouri. The Empire District Gas Company (EDG) is our wholly owned subsidiary engaged in the distribution of natural gas in Missouri. Our other segment consists of our fiber optics business.
Our gross operating revenues in 2010 were derived as follows:
Electric segment sales* |
89.6 | % | ||
Gas segment sales |
9.4 | |||
Other segment sales |
1.0 |
- *
- Sales from our electric segment include 0.3% from the sale of water.
The territory served by our electric operations embraces an area of about 10,000 square miles, located principally in southwestern Missouri, and also includes smaller areas in southeastern Kansas, northeastern Oklahoma and northwestern Arkansas. The principal economic activities of these areas include light industry, agriculture and tourism. Of our total 2010 retail electric revenues, approximately 88.9% came from Missouri customers, 5.3% from Kansas customers, 3.0% from Oklahoma customers and 2.8% from Arkansas customers.
We supply electric service at retail to 120 incorporated communities as of December 31, 2010, and to various unincorporated areas and at wholesale to four municipally owned distribution systems. The largest urban area we serve is the city of Joplin, Missouri, and its immediate vicinity, with a population of approximately 157,000. We operate under franchises having original terms of twenty years or longer in virtually all of the incorporated communities. Approximately 49% of our electric operating revenues in 2010 were derived from incorporated communities with franchises having at least ten years remaining and approximately 21% were derived from incorporated communities in which our franchises have remaining terms of ten years or less. Although our franchises contain no renewal provisions, in recent years we have obtained renewals of all of our expiring electric franchises prior to the expiration dates.
Our electric operating revenues in 2010 were derived as follows:
Residential |
42.4 | % | ||
Commercial |
30.3 | |||
Industrial |
14.4 | |||
Wholesale on-system |
4.0 | |||
Wholesale off-system |
4.7 | |||
Miscellaneous sources* |
2.6 | |||
Other electric revenues |
1.6 |
- *
- primarily public authorities
Our largest single on-system wholesale customer is the city of Monett, Missouri, which in 2010 accounted for approximately 3% of electric revenues. No single retail customer accounted for more than 2% of electric revenues in 2010.
Our gas operations serve customers in northwest, north central and west central Missouri. We provide natural gas distribution to 44 communities and 314 transportation customers as of December 31, 2010. The
5
largest urban area we serve is the city of Sedalia with a population of over 20,000. We operate under franchises having original terms of twenty years in virtually all of the incorporated communities. Seventeen of the franchises have 10 years or more remaining on their term. Although our franchises contain no renewal provisions, since our acquisition we have obtained renewals of all our expiring gas franchises prior to the expiration dates.
Our gas operating revenues in 2010 were derived as follows:
Residential |
63.4 | % | ||
Commercial |
26.2 | |||
Industrial |
1.6 | |||
Other |
8.8 |
No single retail customer accounted for more than 3% of gas revenues in 2010.
Our other segment consists of our fiber optics business. As of December 31, 2010, we have 92 fiber customers.
Electric Generating Facilities and Capacity
At December 31, 2010, our generating plants consisted of:
Plant
|
*Capacity (megawatts) |
Primary Fuel | ||||
|---|---|---|---|---|---|---|
Asbury |
207 | Coal | ||||
Riverton |
286 | Coal and Natural Gas | ||||
Iatan I (12% ownership) |
85 | ** | Coal | |||
Iatan 2 (12% ownership) |
102 | ** | Coal | |||
Plum Point Energy Station (7.52% ownership) |
50 | ** | Coal | |||
State Line Combined Cycle (60% ownership) |
300 | ** | Natural Gas | |||
Empire Energy Center |
267 | Natural Gas | ||||
State Line Unit No. 1 |
96 | Natural Gas | ||||
Ozark Beach |
16 | Hydro | ||||
TOTAL |
1,409 | |||||
- *
- Based
on summer rating conditions as utilized by Southwest Power Pool.
- **
- Capacity reflects our allocated shares of the capacity of these plants.
See Item 2, "Properties — Electric Segment Facilities" for further information about these plants.
We, and most other electric utilities with interstate transmission facilities, have placed our facilities under the Federal Energy Regulatory Commission (FERC) regulated open access tariffs that provide all wholesale buyers and sellers of electricity the opportunity to procure transmission services (at the same rates) that the utilities provide themselves. We are a member of the Southwest Power Pool Regional Transmission Organization (SPP RTO). See Item 7, "Management's Discussion and Analysis of Financial Condition and Results of Operations — Competition."
We currently supplement our on-system generating capacity with purchases of capacity and energy from other sources in order to meet the demands of our customers and the capacity margins applicable to us under current pooling agreements and National Electric Reliability Council rules. The SPP requires its members to maintain a minimum 12% capacity margin. Our long-term contract with Westar Energy for the purchase of 162 megawatts of capacity and energy ended May 31, 2010. In order to replace this 162 megawatts of capacity and energy, we entered into contracts to add 202 megawatts of power to our system. This energy is from two new plants that became operational in 2010, with 100 megawatts from the new
6
Plum Point Energy Station (50 megawatts of owned capacity and 50 megawatts of purchased power) and 102 megawatts from the new Iatan 2 generating facility, each of which is described below.
The Plum Point Energy Station is a new 665-megawatt, coal-fired generating facility near Osceola, Arkansas which met its in-service criteria on August 13, 2010 and entered commercial operation on September 1, 2010. We own, through an undivided interest, 50 megawatts of the project's capacity. The estimated total cost is approximately $88.0 million, excluding allowance for funds used during construction (AFUDC), and our share of the Plum Point costs through December 31, 2010 was $86.9 million. In addition to the amounts noted above, we have recorded $16.5 million of AFUDC for the Plum Point construction since its inception. We also have a long-term (30 year) purchased power agreement for an additional 50 megawatts of capacity and have the option to purchase an undivided ownership interest in the 50 megawatts covered by the purchased power agreement in 2015.
We also purchased an undivided ownership interest in the coal-fired Iatan 2 generating facility operated by Kansas City Power & Light Company (KCP&L) and located at the site of the existing Iatan Generating Station (Iatan 1) near Weston, Missouri. We own 12%, or approximately 102 megawatts, of the 850-megawatt unit, which met its in-service criteria on August 26, 2010 and entered commercial operation on December 31, 2010. Our share of the Iatan 2 construction costs is expected to be in a range of approximately $237 million to $240 million, excluding AFUDC. Our share of the Iatan 2 costs through December 31, 2010 was $228.9 million. Current projections estimate $11.1 million being spent in 2011 for our share of expected expenditures for Iatan 2. In addition to the amounts noted above, we recorded $19.1 million of AFUDC for the Iatan 2 construction since its inception.
We have a 20-year purchased power agreement which began on December 15, 2008 with Cloud County Windfarm, LLC, owned by Horizon Wind Energy, Houston, Texas to purchase the energy generated at the approximately 105-megawatt Phase 1 Meridian Way Wind Farm located in Cloud County, Kansas which commenced commercial operation on December 15, 2008. We also have a 20-year contract with Elk River Windfarm, LLC, owned by IBERDROLA RENEWABLES, Inc. (formerly known as PPM Energy), to purchase the energy generated at the 150-megawatt Elk River Windfarm located in Butler County, Kansas. The windfarm was declared commercial on December 15, 2005. We do not own any portion of either windfarm.
The following chart sets forth our purchase commitments and our anticipated owned capacity (in megawatts) during the indicated years. The capacity ratings we use for our generating units are based on summer rating conditions under SPP guidelines. The portion of the purchased power that may be counted as capacity from the Elk River Windfarm, LLC and the Cloud County Windfarm, LLC is included in this chart. Because the wind power is an intermittent, non-firm resource, SPP rating criteria does not allow us to count a substantial amount of the wind power as capacity. See Item 7, "Managements' Discussion and Analysis of Financial Condition and Results of Operations — Liquidity and Capital Resources."
Contract Year
|
Purchased Power Commitment* |
Anticipated Owned Capacity |
Total Megawatts | |||
|---|---|---|---|---|---|---|
| 2010 | 106** | 1409 | 1515 | |||
| 2011 | 65 | 1409 | 1474 | |||
| 2012 | 65 | 1409 | 1474 | |||
| 2013 | 65 | 1409 | 1474 | |||
| 2014 | 65 | 1409 | 1474 |
- *
- Includes an estimated 7 megawatts for the Elk River Windfarm, LLC and 8 megawatts for the Cloud County Windfarm, LLC.
7
- **
- The year 2010 included an additional 41 megawatts of purchased power capacity through a contract with Merrill Lynch to address the expected in-service delays of Plum Point and Iatan 2. The costs under that contract were immaterial.
The maximum hourly demand on our system reached a record high of 1,199 megawatts on January 8, 2010. Our previous winter peak of 1,100 megawatts was established on December 22, 2008. Our maximum hourly summer demand of 1,173 megawatts was set on August 15, 2007. Our previous summer record peak of 1,159 megawatts was established on July 19, 2006.
At December 31, 2010, our principal gas utility properties consisted of approximately 87 miles of transmission mains and approximately 1,126 miles of distribution mains.
The following table sets forth the three pipelines that serve our gas customers:
Service Area
|
Name of Pipeline | |
|---|---|---|
| South | Southern Star Central Gas Pipeline | |
| North | Panhandle Eastern Pipe Line Company | |
| Northwest | ANR Pipeline Company |
Our all-time peak of 73,280 mcfs was established on January 7, 2010, replacing the previous record of 70,820 mcfs which was set on January 4, 2010.
Total property additions (including construction work in progress but excluding AFUDC) for the three years ended December 31, 2010, amounted to $440.6 million and retirements during the same period amounted to $39.8 million. Please refer to Item 7, "Management's Discussion and Analysis of Financial Condition and Results of Operations — Liquidity and Capital Resources" for more information.
Our total capital expenditures, excluding AFUDC and expenditures to retire assets, were $101.2 million in 2010 and for the next three years are estimated for planning purposes to be as follows:
| |
Estimated Capital Expenditures (amounts in millions) | |||||||||||||
|---|---|---|---|---|---|---|---|---|---|---|---|---|---|---|
| |
2011 | 2012 | 2013 | Total | ||||||||||
New electric generating facilities: |
||||||||||||||
Iatan 2 |
$ | 12.6 | $ | — | $ | — | $ | 12.6 | ||||||
Riverton Unit 12 combined cycle conversion |
— | — | 6.7 | 6.7 | ||||||||||
Additions to existing electric generating facilities: |
||||||||||||||
Asbury |
1.6 | 3.7 | 6.2 | 11.5 | ||||||||||
Environmental upgrades — Asbury |
3.6 | 38.9 | 76.7 | 119.2 | ||||||||||
Environmental upgrades — Iatan |
3.3 | — | — | 3.3 | ||||||||||
Other |
13.2 | 10.2 | 15.8 | 39.2 | ||||||||||
Electric transmission facilities |
9.8 | 15.3 | 22.1 | 47.2 | ||||||||||
Electric distribution system additions |
37.6 | 41.6 | 43.4 | 122.6 | ||||||||||
Non-regulated additions |
1.5 | 1.5 | 1.5 | 4.5 | ||||||||||
General and other additions |
19.5 | 12.4 | 14.2 | 46.1 | ||||||||||
Gas system additions |
3.6 | 3.9 | 2.3 | 9.8 | ||||||||||
TOTAL |
$ | 106.3 | $ | 127.5 | $ | 188.9 | $ | 422.7 | ||||||
8
Construction expenditures for additions to our transmission and distribution systems to meet projected increases in customer demand and environmental upgrades at Asbury constitute the majority of the projected capital expenditures for the three-year period listed above.
Estimated capital expenditures are reviewed and adjusted for, among other things, revised estimates of future capacity needs, the cost of funds necessary for construction and the availability and cost of alternative power. Actual capital expenditures may vary significantly from the estimates due to a number of factors including changes in customer requirements, construction delays, changes in equipment delivery schedules, ability to raise capital, environmental matters, the extent to which we receive timely and adequate rate increases, the extent of competition from independent power producers and cogenerators, other changes in business conditions and changes in legislation and regulation, including those relating to the energy industry. See "— Regulation" below and Item 7, "Management's Discussion and Analysis of Financial Condition and Results of Operations — Competition."
Electric Segment
Our total system output for 2010, based on kilowatt-hours generated, was as follows:
Steam generation units |
41.5 | % | ||
Combustion turbine generation units |
24.5 | |||
Hydro generation |
1.4 | |||
Purchased power — windfarms |
13.6 | |||
Purchased power — other |
19.0 |
Approximately 62.3% of the total fuel requirements for our generating units in 2010 (based on kilowatt-hours generated) were supplied by coal and approximately 37.4% supplied by natural gas with fuel oil and tire-derived fuel (TDF), which is produced from discarded passenger car tires, providing the remainder. The amount and percentage of electricity generated by natural gas increased in 2010 as compared to 2009 while the amount of energy we purchased decreased, primarily reflecting that it was more economical to produce gas-fired generation than to purchase power during this period.
Our Asbury Plant is fueled primarily by coal with oil being used as start-up fuel and TDF being used as a supplement fuel. In 2010, Asbury burned a coal blend consisting of approximately 87.9% Western coal (Powder River Basin) and 12.1% blend coal on a tonnage basis. Our average coal inventory target at Asbury is approximately 60 days. As of December 31, 2010, we had sufficient coal on hand to supply anticipated requirements at Asbury for 56-70 days, as compared to 52-95 days as of December 31, 2009, depending on the actual blend ratio within this range.
Our Riverton Plant fuel requirements are primarily met by coal with the remainder supplied by natural gas, petroleum coke and oil. Riverton Unit 12, a Siemens V84.3A2 gas combustion turbine installed in 2007, and three other smaller units are fueled by natural gas. During 2010, Riverton Units 7 and 8 burned an estimated blend of approximately 87.1% Western coal (Powder River Basin) and 12.9% petroleum coke on a tonnage basis. Our average coal inventory target at Riverton is approximately 60 days. Riverton Unit 7 requires a minimum amount of blend fuel to operate, while Riverton Unit 8 can burn 100% Western coal or a mix of Western and blend fuel. Based on these assumptions, we had sufficient coal as of December 31, 2010 to run 40 days on both units as compared to 36 days as of December 31, 2009.
9
The following table sets forth the percentage of our anticipated coal requirements we have secured through a combination of contracts and binding proposals for the following years:
Year
|
Percentage secured | |||
|---|---|---|---|---|
2011 |
100 | % | ||
2012 |
65 | % | ||
2013 |
61 | % | ||
2014 |
31 | % | ||
All of the Western coal used at our Asbury and Riverton plants is shipped to the Asbury Plant by rail, a distance of approximately 800 miles, under a six and one-half year contract with the Burlington Northern and Santa Fe Railway Company (BNSF) and the Kansas City Southern Railway Company which began on June 30, 2010. The overall delivered price of coal is expected to be higher in 2011 than in 2010 as we incur the increased rail costs that went into effect in July of 2010. Riverton receives its Western inventory from the coal transported by train to the Asbury Plant which is then transported by truck to Riverton. We currently lease one aluminum unit train full time and a second set is leased on a part-time basis to deliver Western coal to the Asbury Plant.
Unit 1 and Unit 2 at the Iatan Plant are coal-fired generating units which are jointly-owned by KCP&L, a subsidiary of Great Plains Energy, Inc. and us, with our share of ownership being 12% in each plant. KCP&L is the operator of these plants and is responsible for arranging their fuel supply. KCP&L has secured contracts for low sulfur Western coal in quantities sufficient to meet 80% of Iatan's requirements for 2011 and approximately 40% for 2012, 35% for 2013, and 20% for 2014. The coal is transported by rail under a contract with BNSF Railway, which expires on December 31, 2013.
The Plum Point Energy Station is a new 665-megawatt, coal-fired generating facility built by Plum Point Energy Associates (PPEA) near Osceola, Arkansas. We own, through an undivided interest, 50 megawatts of the project's capacity. North America Energy Services is the operator of this plant. Plum Point Services Company, LLC (PPSC), the project management company acting on behalf of the joint owners, is responsible for arranging its fuel supply. PPSC has secured contracts for low sulfur Western coal in quantities sufficient to meet 83% of Plum Point's requirements for 2011 and approximately 84% for 2012, 82% for 2013 and 92% for 2014. During the third quarter of 2009, we entered into a 15 year lease agreement for 54 railcars for our ownership share of Plum Point, which began commercial operation on September 1, 2010. In December 2010, we entered into another 15-year lease agreement for an additional 54 railcars associated with our Plum Point purchased power agreement.
Our Energy Center and State Line combustion turbine facilities (not including the State Line Combined Cycle (SLCC) Unit, which is fueled 100% by natural gas) are fueled primarily by natural gas with oil also available for use primarily as backup. Based on kilowatt hours generated during 2010, Energy Center generation was 98.6% natural gas with the remainder being fuel oil, and essentially all of the State Line Unit 1 generation came from natural gas. As of December 31, 2010, oil inventories were sufficient for approximately 2 days of full load operation on Units No. 1, 2, 3 and 4 at the Energy Center and 5 days of full load operation for State Line Unit No. 1. As typical oil usage is minimal, these inventories are sufficient for our current requirements. Additional oil will be purchased as needed.
We have firm transportation agreements with Southern Star Central Pipeline, Inc. with original expiration dates of July 31, 2016, for the transportation of natural gas to the SLCC. This date is adjusted for periods of contract suspension by us during outages of the SLCC. This transportation agreement can also supply natural gas to State Line Unit No.1, the Energy Center or the Riverton Plant, as elected by us on a secondary basis. We also have a precedent agreement with Southern Star, which provides additional transportation capability until 2022. This contract provides firm transport to the sites listed above that previously were only served on a secondary basis. We expect that these transportation agreements will serve nearly all of our natural gas transportation needs for our generating plants over the next several
10
years. Any remaining gas transportation requirements, although small, will be met by utilizing capacity release on other holder contracts, interruptible transport, or delivered to the plants by others.
The majority of our physical natural gas supply requirements will be met by short-term forward contracts and spot market purchases. Forward natural gas commodity prices and volumes are hedged several years into the future in accordance with our Risk Management Policy in an attempt to lessen the volatility in our fuel expenditures and gain predictability. In addition, we have signed an agreement with Southern Star to purchase one million Dths of firm gas storage service capacity for a period of five years beginning in April 2011. The reservation charge for this storage capacity is approximately $1.1 million annually. This storage capacity will enable us to better manage our natural gas commodity and transportation needs for our electric segment.
The following table sets forth a comparison of the costs, including transportation and other miscellaneous costs, per million Btu of various types of fuels used in our electric facilities:
Fuel Type / Facility
|
2010 | 2009 | 2008 | |||||||
|---|---|---|---|---|---|---|---|---|---|---|
Coal — Iatan |
$ | 1.193 | $ | 1.186 | $ | 1.070 | ||||
Coal — Asbury |
1.877 | 1.763 | 1.577 | |||||||
Coal — Riverton |
1.833 | 1.768 | 1.724 | |||||||
Natural Gas |
6.061 | 7.376 | 6.909 | |||||||
Oil |
15.443 | 14.318 | 16.721 | |||||||
Weighted average cost of fuel burned per kilowatt-hour generated |
2.9936 | 3.1698 | 3.1307 | |||||||
Gas Segment
In June 2007, we acquired 10,000 MMBtus per day of firm transportation from Cheyenne Plains Pipeline Company so that up to 75% of our natural gas purchases going forward could come from the Rocky Mountain gas area. Cheyenne Plains interconnects with all of the interstate pipelines listed below that feed our market area.
We have agreements with many of the major suppliers in both the Midcontinent and Rocky Mountain regions that provide us with both supply and price diversity. We expanded our supplier base in 2008 and will continue to do so to enhance supply reliability as well as provide for increased price competition.
The following table sets forth the current costs, including storage, transportation and other miscellaneous costs, per mcf of gas used in our gas operations:
Service Area
|
Name of Pipeline | 2010 | 2009 | 2008 | ||||||||
|---|---|---|---|---|---|---|---|---|---|---|---|---|
South |
Southern Star Central Gas Pipeline | $ | 6.7068 | $ | 7.8475 | $ | 8.9898 | |||||
North |
Panhandle Eastern Pipe Line Company | 6.1151 | 7.4055 | 8.3207 | ||||||||
Northwest |
ANR Pipeline Company | 5.3216 | 7.1160 | 8.0716 | ||||||||
|
Weighted average cost per mcf | $ | 6.3745 | $ | 7.6395 | $ | 8.6964 | |||||
At December 31, 2010, we had 750 full-time employees, including 52 employees of EDG. 338 of the EDE employees are members of Local 1474 of The International Brotherhood of Electrical Workers (IBEW). On May 9, 2007, the Local 1474 IBEW voted to ratify a new five-year agreement effective retroactively to November 1, 2006, the expiration date of the last contract. At December 31, 2010, 34 EDG employees were members of Local 1464 of the IBEW. In June 2009, Local 1464 of the IBEW ratified a new four-year agreement with EDG effective June 1, 2009.
11
ELECTRIC OPERATING STATISTICS(1)
| |
2010 | 2009 | 2008 | 2007 | 2006 | |||||||||||||
|---|---|---|---|---|---|---|---|---|---|---|---|---|---|---|---|---|---|---|
Electric Operating Revenues (000's): |
||||||||||||||||||
Residential |
$ | 204,900 | $ | 180,404 | $ | 179,293 | $ | 174,584 | $ | 159,381 | ||||||||
Commercial |
146,310 | 135,800 | 132,888 | 129,035 | 115,059 | |||||||||||||
Industrial |
69,684 | 65,983 | 67,353 | 67,712 | 64,820 | |||||||||||||
Public authorities(2) |
12,099 | 11,411 | 10,876 | 9,933 | 8,892 | |||||||||||||
Wholesale on-system |
19,254 | 18,199 | 19,229 | 18,444 | 17,561 | |||||||||||||
Miscellaneous(3) |
7,573 | 6,814 | 6,976 | 5,703 | 4,605 | |||||||||||||
Interdepartmental |
199 | 178 | 154 | 123 | 101 | |||||||||||||
Total system |
460,019 | 418,789 | 416,769 | 405,534 | 370,419 | |||||||||||||
Wholesale off-system |
22,891 | 14,344 | 29,697 | 19,627 | 12,234 | |||||||||||||
Total electric operating revenues(4) |
482,910 | 433,133 | 446,466 | 425,161 | 382,653 | |||||||||||||
Electricity generated and purchased (000's of kWh): |
||||||||||||||||||
Steam |
2,650,042 | 2,259,304 | 2,228,716 | 2,074,323 | 2,589,360 | |||||||||||||
Hydro |
88,104 | 76,733 | 32,601 | 71,360 | 22,673 | |||||||||||||
Combustion turbine |
1,566,074 | 926,934 | 1,480,729 | 1,427,298 | 955,856 | |||||||||||||
Total generated |
4,304,220 | 3,262,971 | 3,742,046 | 3,572,981 | 3,567,889 | |||||||||||||
Purchased |
2,085,550 | 2,516,702 | 2,440,246 | 2,373,282 | 2,065,991 | |||||||||||||
Total generated and purchased |
6,389,770 | 5,779,673 | 6,182,292 | 5,946,263 | 5,633,880 | |||||||||||||
Interchange (net) |
(1,716 | ) | (568 | ) | (436 | ) | (940 | ) | (173 | ) | ||||||||
Total system output |
6,388,054 | 5,779,105 | 6,181,856 | 5,945,323 | 5,633,707 | |||||||||||||
Transmission by others losses(5) |
(5,688 | ) | — | — | — | — | ||||||||||||
Total system input |
6,382,366 | 5,779,105 | 6,181,856 | 5,945,323 | 5,633,707 | |||||||||||||
Maximum hourly system demand (Kw) |
1,199,000 | 1,085,000 | 1,152,000 | 1,173,000 | 1,159,000 | |||||||||||||
Owned capacity (end of period) (Kw) |
1,409,000 | 1,257,000 | 1,255,000 | 1,255,000 | 1,102,000 | |||||||||||||
Annual load factor (%) |
53.17 | 55.38 | 54.29 | 53.39 | 52.50 | |||||||||||||
Electric sales (000's of kWh): |
||||||||||||||||||
Residential |
2,060,368 | 1,866,473 | 1,952,869 | 1,930,493 | 1,898,846 | |||||||||||||
Commercial |
1,644,917 | 1,579,832 | 1,622,048 | 1,610,814 | 1,547,077 | |||||||||||||
Industrial |
1,007,033 | 992,165 | 1,073,250 | 1,110,328 | 1,145,490 | |||||||||||||
Public authorities(2) |
124,554 | 121,816 | 122,375 | 115,109 | 111,204 | |||||||||||||
Wholesale on-system |
355,807 | 332,061 | 344,525 | 342,347 | 337,658 | |||||||||||||
Total system |
5,192,679 | 4,892,347 | 5,115,067 | 5,109,091 | 5,040,275 | |||||||||||||
Wholesale off-system |
798,084 | 515,899 | 688,203 | 459,665 | 303,493 | |||||||||||||
Total Electric Sales |
5,990,763 | 5,408,246 | 5,803,270 | 5,568,756 | 5,343,768 | |||||||||||||
Company use (000's of kWh)(6) |
9,598 | 9,088 | 9,209 | 9,369 | 9,324 | |||||||||||||
kWh losses (000's of kWh) |
382,005 | 361,771 | 369,377 | 367,198 | 280,615 | |||||||||||||
Total System Input |
6,382,366 | 5,779,105 | 6,181,856 | 5,945,323 | 5,633,707 | |||||||||||||
Customers (average number): |
||||||||||||||||||
Residential |
141,693 | 141,206 | 140,791 | 139,840 | 137,689 | |||||||||||||
Commercial |
24,505 | 24,412 | 24,532 | 24,330 | 24,035 | |||||||||||||
Industrial |
358 | 355 | 361 | 362 | 370 | |||||||||||||
Public authorities(2) |
2,003 | 1,995 | 1,935 | 1,927 | 1,907 | |||||||||||||
Wholesale on-system |
4 | 4 | 4 | 4 | 4 | |||||||||||||
Total System |
168,563 | 167,972 | 167,623 | 166,463 | 164,005 | |||||||||||||
Wholesale off-system |
22 | 19 | 22 | 20 | 20 | |||||||||||||
Total |
168,585 | 167,991 | 167,645 | 166,483 | 164,025 | |||||||||||||
Average annual sales per residential customer (kWh) |
14,541 | 13,218 | 13,871 | 13,805 | 13,791 | |||||||||||||
Average annual revenue per residential customer |
$ | 1,446 | $ | 1,278 | $ | 1,273 | $ | 1,248 | $ | 1,158 | ||||||||
Average residential revenue per kWh |
9.94 | ¢ | 9.67 | ¢ | 9.18 | ¢ | 9.04 | ¢ | 8.39 | ¢ | ||||||||
Average commercial revenue per kWh |
8.89 | ¢ | 8.60 | ¢ | 8.19 | ¢ | 8.01 | ¢ | 7.44 | ¢ | ||||||||
Average industrial revenue per kWh |
6.92 | ¢ | 6.65 | ¢ | 6.28 | ¢ | 6.10 | ¢ | 5.66 | ¢ | ||||||||
- (1)
- See
Item 6, "Selected Financial Data" for additional financial information regarding Empire.
- (2)
- Includes
Public Street & Highway Lighting and Public Authorities.
- (3)
- Includes
transmission service revenues, late payment fees, renewable energy credit sales, rent, etc.
- (4)
- Before
intercompany eliminations.
- (5)
- Energy
provided in-kind to third party transmission providers to compensate for transmission losses associated with delivery of capacity and
energy under their transmission tariffs.
- (6)
- Includes kWh used by Company and Interdepartmental.
12
| |
2010 | 2009 | 2008 | 2007 | 2006(2) | |||||||||||||
|---|---|---|---|---|---|---|---|---|---|---|---|---|---|---|---|---|---|---|
Gas Operating Revenues (000's): |
||||||||||||||||||
Residential |
$ | 32,245 | $ | 36,176 | $ | 39,639 | $ | 39,205 | $ | 15,957 | ||||||||
Commercial |
13,336 | 15,552 | 17,416 | 16,588 | 7,127 | |||||||||||||
Industrial |
812 | 2,066 | 5,069 | 752 | 356 | |||||||||||||
Public authorities |
342 | 365 | 416 | 373 | 161 | |||||||||||||
Total retail sales revenues |
46,735 | 54,159 | 62,540 | 56,918 | 23,601 | |||||||||||||
Miscellaneous(3) |
436 | 221 | 231 | 206 | 93 | |||||||||||||
Transportation revenues |
3,714 | 2,934 | 2,667 | 2,753 | 1,451 | |||||||||||||
Total Gas Operating Revenues |
50,885 | 57,314 | 65,438 | 59,877 | 25,145 | |||||||||||||
Maximum Daily Flow (mcf) |
73,280 | 70,046 | 66,005 | 68,379 | 60,890 | |||||||||||||
Gas delivered to customers (000's of mcf sales)(4) |
||||||||||||||||||
Residential |
2,675 | 2,687 | 2,949 | 2,835 | 1,101 | |||||||||||||
Commercial |
1,265 | 1,278 | 1,397 | 1,304 | 559 | |||||||||||||
Industrial |
108 | 218 | 553 | 76 | 32 | |||||||||||||
Public authorities |
33 | 30 | 35 | 30 | 12 | |||||||||||||
Total retail sales |
4,081 | 4,213 | 4,934 | 4,245 | 1,704 | |||||||||||||
Transportation sales |
4,829 | 4,330 | 4,059 | 4,300 | 2,150 | |||||||||||||
Total gas operating and transportation sales |
8,910 | 8,543 | 8,993 | 8,545 | 3,854 | |||||||||||||
Company use(4) |
4 | 3 | 4 | 2 | — | |||||||||||||
Transportation sales (cash outs) |
— | — | — | 56 | 56 | |||||||||||||
Mcf losses |
70 | 36 | 140 | 8 | (70 | ) | ||||||||||||
Total system sales |
8,984 | 8,582 | 9,137 | 8,611 | 3,840 | |||||||||||||
Customers (average number): |
||||||||||||||||||
Residential |
38,277 | 38,621 | 39,159 | 40,315 | 40,673 | |||||||||||||
Commercial |
4,968 | 5,038 | 5,119 | 5,208 | 5,399 | |||||||||||||
Industrial |
26 | 25 | 26 | 24 | 26 | |||||||||||||
Public authorities |
137 | 131 | 127 | 124 | 128 | |||||||||||||
Total retail customers |
43,408 | 43,815 | 44,431 | 45,671 | 46,226 | |||||||||||||
Transportation customers |
313 | 296 | 272 | 270 | 252 | |||||||||||||
Total gas customers |
43,721 | 44,111 | 44,703 | 45,941 | 46,478 | |||||||||||||
- (1)
- See
Item 6, "Selected Financial Data" for additional financial information regarding Empire.
- (2)
- 2006
revenues and mcf sales represent the months of June through December 2006.
- (3)
- Primarily
includes miscellaneous service revenue and late fees.
- (4)
- Includes mcf used by Company and Interdepartmental mcf.
13
Executive Officers and Other Officers of Empire
The names of our officers, their ages and years of service with Empire as of December 31, 2010, positions held during the past five years and effective date of such positions are presented below. All of our officers have been employed by Empire for at least the last five years.
| Name | Age at 12/31/10 |
Positions With the Company | With the Company Since |
Officer Since |
||||||||
|---|---|---|---|---|---|---|---|---|---|---|---|---|
William L. Gipson(1) |
53 | President and Chief Executive Officer (2002) |
1981 | 1997 | ||||||||
Bradley P. Beecher(2) |
45 | Executive Vice President (2011), Executive Vice President and Chief Operating Officer — Electric (2010), Vice President and Chief Operating Officer — Electric (2006) |
2001 | 2001 | ||||||||
Harold Colgin(3) |
61 | Vice President — Energy Supply (2006), General Manager — Energy Supply (2006) |
1972 | 2006 | ||||||||
Ronald F. Gatz |
60 | Vice President and Chief Operating Officer — Gas (2006) |
2001 | 2001 | ||||||||
Gregory A. Knapp |
59 | Vice President — Finance and Chief Financial Officer (2002) |
2002 | 2002 | ||||||||
Michael E. Palmer(4) |
54 | Vice President — Transmission Policy and Corporate Services (2011), Vice President — Commercial Operations (2001) |
1986 | 2001 | ||||||||
Kelly S. Walters(5) |
45 | Vice President and Chief Operating Officer — Electric (2011), Vice President — Regulatory and Services (2006) |
2001 | 2006 | ||||||||
Blake Mertens(6) |
33 | Vice President — Energy Supply (2011), General Manager — Energy Supply (2010), Director of Strategic Projects, Safety and Environmental Services (2010), Assistant Director of Strategic Projects (2009), Manager of Strategic Projects (2006) |
2001 | 2011 | ||||||||
Martin O. Penning(7) |
55 | Vice President — Commercial Operations, (2011), Director of Commercial Operations (2006) |
1980 | 2011 | ||||||||
Janet S. Watson |
58 | Secretary — Treasurer (1995) |
1994 | 1995 | ||||||||
Laurie A. Delano |
55 | Controller, Assistant Secretary and Assistant Treasurer and Principal Accounting Officer (2005) |
2002 | 2005 | ||||||||
- (1)
- William L.
Gipson will retire from his position as President and Chief Executive Officer effective May 31, 2011.
- (2)
- Bradley P.
Beecher will become President and Chief Executive Officer effective June 1, 2011. Effective February 4, 2011,
Mr. Beecher has been elected executive vice president.
- (3)
- Harold
Colgin will retire from his position as Vice President — Energy Supply effective April 30, 2011.
- (4)
- Michael E.
Palmer was elected Vice President — Transmission Policy and Corporate Services effective February 4, 2011.
- (5)
- Kelly S.
Walters was elected Vice President and Chief Operating Officer — Electric effective February 4, 2011.
- (6)
- Blake
Mertens was elected Vice President — Energy Supply effective May 1, 2011.
- (7)
- Martin Penning was elected Vice President — Commercial Operations effective February 4, 2011.
14
Electric Segment
General. As a public utility, our electric segment operations are subject to the jurisdiction of the MPSC, the State Corporation Commission of the State of Kansas (KCC), the Corporation Commission of Oklahoma (OCC) and the Arkansas Public Service Commission (APSC) with respect to services and facilities, rates and charges, regulatory accounting, valuation of property, depreciation and various other matters. Each such Commission has jurisdiction over the creation of liens on property located in its state to secure bonds or other securities. The KCC also has jurisdiction over the issuance of all securities because we are a regulated utility incorporated in Kansas. Our transmission and sale at wholesale of electric energy in interstate commerce and our facilities are also subject to the jurisdiction of the FERC, under the Federal Power Act. FERC jurisdiction extends to, among other things, rates and charges in connection with such transmission and sale; the sale, lease or other disposition of such facilities and accounting matters. See discussion in Item 7, "Management's Discussion and Analysis of Financial Condition and Results of Operations — Competition."
During 2010, approximately 89.7% of our electric operating revenues was received from retail customers. Sales subject to FERC jurisdiction represented approximately 9.1% of our electric operating revenues during 2010 with the remaining 1.2% being from miscellaneous sources. The percentage of retail revenues derived from each state follows:
Missouri |
88.9 | % | ||
Kansas |
5.3 | |||
Oklahoma |
3.0 | |||
Arkansas |
2.8 |
Rates. See Item 7, "Management's Discussion and Analysis of Financial Condition and Results of Operations — Rate Matters" for information concerning recent electric rate proceedings.
Fuel Adjustment Clauses. Typical fuel adjustment clauses permit the distribution to customers of changes in fuel costs without the need for a general rate proceeding. Fuel adjustment clauses are presently applicable to our retail electric sales in Missouri, Oklahoma and Kansas and system wholesale kilowatt-hour sales under FERC jurisdiction. We have an Energy Cost Recovery Rider in Arkansas that adjusts for changing fuel and purchased power costs on an annual basis.
Gas Segment
General. As a public utility, our gas segment operations are subject to the jurisdiction of the MPSC with respect to services and facilities, rates and charges, regulatory accounting, valuation of property, depreciation and various other matters. The MPSC also has jurisdiction over the creation of liens on property to secure bonds or other securities.
Purchased Gas Adjustment (PGA). The PGA clause allows EDG to recover from our customers, subject to routine regulatory review, the cost of purchased gas supplies, including costs associated with our use of natural gas financial instruments to hedge the purchase price of natural gas and related carrying costs. This PGA clause allows us to make rate changes periodically (up to four times) throughout the year in response to weather conditions and supply demands, rather than in one possibly extreme change per year.
See Note 11 to the consolidated financial statements for information regarding environmental matters.
15
Conditions Respecting Financing
Our EDE Indenture of Mortgage and Deed of Trust, dated as of September 1, 1944, as amended and supplemented (the EDE Mortgage), and our Restated Articles of Incorporation (Restated Articles), specify earnings coverage and other conditions which must be complied with in connection with the issuance of additional first mortgage bonds or cumulative preferred stock, or the incurrence of unsecured indebtedness. The principal amount of all series of first mortgage bonds outstanding at any one time under the EDE Mortgage is limited by terms of the mortgage to $1 billion. Substantially all of the property, plant and equipment of The Empire District Electric Company (but not its subsidiaries) is subject to the lien of the EDE Mortgage. Restrictions in the EDE mortgage bond indenture could affect our liquidity. The EDE Mortgage contains a requirement that for new first mortgage bonds to be issued, our net earnings (as defined in the EDE Mortgage) for any twelve consecutive months within the fifteen months preceding issuance must be two times the annual interest requirements (as defined in the EDE Mortgage) on all first mortgage bonds then outstanding and on the prospective issue of new first mortgage bonds. Our earnings for the year ended December 31, 2010, would permit us to issue approximately $362.3 million of new first mortgage bonds based on this test at an assumed interest rate of 6.0%. In addition to the interest coverage requirement, the EDE Mortgage provides that new bonds must be issued against, among other things, retired bonds or 60% of net property additions. At December 31, 2010, we had retired bonds and net property additions which would enable the issuance of at least $634.0 million principal amount of bonds if the annual interest requirements are met. As of December 31, 2010, we believe we are in compliance with all restrictive covenants of the EDE Mortgage.
Under our Restated Articles, (a) cumulative preferred stock may be issued only if our net income available for interest and dividends (as defined in our Restated Articles) for a specified twelve-month period is at least 11/2 times the sum of the annual interest requirements on all indebtedness and the annual dividend requirements on all cumulative preferred stock to be outstanding immediately after the issuance of such additional shares of cumulative preferred stock, and (b) so long as any preferred stock is outstanding, the amount of unsecured indebtedness outstanding may not exceed 20% of the sum of the outstanding secured indebtedness plus our capital and surplus. We have no outstanding preferred stock. Accordingly, the restriction in our Restated Articles does not currently restrict the amount of unsecured indebtedness that we may have outstanding.
The EDG Indenture of Mortgage and Deed of Trust, dated as of June 1, 2006, as amended and supplemented (the EDG Mortgage) contains a requirement that for new first mortgage bonds to be issued, the amount of such new first mortgage bonds shall not exceed 75% of the cost of property additions acquired after the date of the Missouri Gas acquisition. The principal amount of all series of first mortgage bonds outstanding at any one time under the EDG Mortgage is limited by terms of the mortgage to $300 million. Substantially all of the property, plant and equipment of The Empire District Gas Company is subject to the lien of the EDG Mortgage. The mortgage also contains a limitation on the issuance by EDG of debt (including first mortgage bonds, but excluding short-term debt incurred in the ordinary course under working capital facilities) unless, after giving effect to such issuance, EDG's ratio of EBITDA (defined as net income plus interest, taxes, depreciation, amortization and certain other non-cash charges) to interest charges for the most recent four fiscal quarters is at least 2.0 to 1. As of December 31, 2010, this test would allow us to issue approximately $8.3 million principal amount of new first mortgage bonds.
See Item 7, "Management's Discussion and Analysis of Financial Condition and Results of Operations — Liquidity and Capital Resources."
We maintain a web site at www.empiredistrict.com. Our annual report on Form 10-K, quarterly reports on Form 10-Q, current reports on form 8-K and related amendments are available free of charge through our web site as soon as reasonably practicable after such reports are filed with or furnished to the SEC electronically. Our Corporate Governance Guidelines, our Code of Business Conduct and Ethics, our
16
Code of Ethics for the Chief Executive Officer and Senior Financial Officer, the charters for our Audit Committee, Compensation Committee and Nominating/Corporate Governance Committee, our Procedures for Reporting Complaints on Accounting, Internal Accounting Controls and Auditing Matters, our Procedures for Communicating with Non-Management Directors and our Policy and Procedures with Respect to Related Person Transactions can also be found on our web site. All of these documents are available in print to any interested party who requests them. Our web site and the information contained in it and connected to it shall not be deemed incorporated by reference into this Form 10-K.
Investors should review carefully the following risk factors and the other information contained in this Form 10-K. The risks we face are not limited to those in this section. There may be additional risks and uncertainties (either currently unknown or not currently believed to be material) that could adversely affect our financial position, results of operations and liquidity.
Readers are cautioned that the risks and uncertainties described in this Form 10-K are not the only ones facing Empire. Additional risks and uncertainties that we are not presently aware of, or that we currently consider immaterial, may also affect our business operations. Our business, financial condition or results of operations (including our ability to pay dividends on our common stock) could suffer if the concerns set forth below are realized.
Any reduction in our credit ratings could materially and adversely affect our business, financial condition and results of operations.
Currently, our corporate credit ratings and the ratings for our securities are as follows:
| |
Fitch | Moody's | Standard & Poor's | |||
|---|---|---|---|---|---|---|
Corporate Credit Rating |
n/r* | Baa2 | BBB- | |||
EDE First Mortgage Bonds |
BBB+ | A3 | BBB+ | |||
Senior Notes |
BBB | Baa2 | BBB- | |||
Commercial Paper |
F2 | P-2 | A-3 | |||
Outlook |
Stable | Stable | Stable |
- *
- Not rated.
The ratings indicate the agencies' assessment of our ability to pay the interest and principal of these securities. A rating is not a recommendation to purchase, sell or hold securities and each rating should be evaluated independently of any other rating. The lower the rating, the higher the interest cost of the securities when they are sold. In addition, a downgrade in our senior unsecured long-term debt rating would result in an increase in our borrowing costs under our bank credit facility. If any of our ratings fall below investment grade (investment grade is defined as Baa3 or above for Moody's and BBB- or above for Standard & Poor's and Fitch), our ability to issue short-term debt, commercial paper or other securities or to market those securities would be impaired or made more difficult or expensive. Therefore, any such downgrades could have a material adverse effect on our business, financial condition and results of operations. In addition, any actual downgrade of our commercial paper rating from Moody's or Fitch, may make it difficult for us to issue commercial paper. To the extent we are unable to issue commercial paper, we will need to meet our short-term debt needs through borrowings under our revolving credit facilities, which may result in higher costs.
We cannot assure you that any of our current ratings will remain in effect for any given period of time or that a rating will not be lowered or withdrawn entirely by a rating agency if, in its judgment, circumstances in the future so warrant.
17
We are exposed to increases in costs and reductions in revenue which we cannot control and which may adversely affect our business, financial condition and results of operations.
The primary drivers of our electric operating revenues in any period are: (1) rates we can charge our customers, (2) weather, (3) customer growth and (4) general economic conditions. Of the factors driving revenues, weather has the greatest short-term effect on the demand for electricity for our regulated business. Mild weather reduces demand and, as a result, our electric operating revenues. In addition, changes in customer demand due to downturns in the economy could reduce our revenues.
The primary drivers of our electric operating expenses in any period are: (1) fuel and purchased power expenses, (2) maintenance and repairs expense, including repairs following severe weather and plant outages, (3) taxes and (4) non-cash items such as depreciation and amortization expense. Although we generally recover these expenses through our rates, there can be no assurance that we will recover all, or any part of, such increased costs in future rate cases.
The primary drivers of our gas operating revenues in any period are: (1) rates we can charge our customers, (2) weather, (3) customer growth, (4) the cost of natural gas and interstate pipeline transportation charges and (5) general economic conditions. Because natural gas is heavily used for residential and commercial heating, the demand for this product depends heavily upon weather patterns throughout our natural gas service territory and a significant amount of our natural gas revenues are recognized in the first and fourth quarters related to the heating seasons. Accordingly, our natural gas operations have historically generated less revenues and income when weather conditions are warmer in the winter.
The primary driver of our gas operating expense in any period is the price of natural gas.
Significant increases in electric and gas operating expenses or reductions in electric and gas operating revenues may occur and result in a material adverse effect on our business, financial condition and results of operations.
We are exposed to factors that can increase our fuel and purchased power expenditures, including disruption in deliveries of coal or natural gas, decreased output from our power plants, failure of performance by
purchased power counterparties and market risk in our fuel procurement strategy.
Fuel and purchased power costs are our largest expenditures. Increases in the price of coal, natural gas or the cost of purchased power will result in increased electric operating expenditures.
We depend upon regular deliveries of coal as fuel for our Riverton, Asbury, Iatan and Plum Point plants. Substantially all of this coal comes from mines in the Powder River Basin of Wyoming and is delivered to the plants by train. Production problems in these mines, railroad transportation or congestion problems, or unavailability of trains could affect delivery cycle times required to maintain plant inventory levels, causing us to implement coal conservation and supply replacement measures to retain adequate reserve inventories at our facilities. These measures could include some or all of the following: reducing the output of our coal plants, increasing the utilization of our higher-cost gas-fired generation facilities, purchasing power from other suppliers, adding additional leased trains to our supply system and purchasing locally mined coal which can be delivered without using the railroads. Such measures could result in increased fuel and purchased power expenditures.
With the addition of the Missouri fuel adjustment mechanism effective September 1, 2008, we now have a fuel cost recovery mechanism in all of our jurisdictions, which significantly reduces our net income exposure to the impact of the risks discussed above. However, cash flow could still be impacted by these increased expenditures. We are also subject to prudency reviews which could negatively impact our net income if a regulatory commission would conclude our costs were incurred imprudently.
We have also established a risk management practice of purchasing contracts for future fuel needs to meet underlying customer needs and manage cost and pricing uncertainty. Within this activity, we may
18
incur losses from these contracts. By using physical and financial instruments, we are exposed to credit risk and market risk. Market risk is the exposure to a change in the value of commodities caused by fluctuations in market variables, such as price. The fair value of derivative financial instruments we hold is adjusted cumulatively on a monthly basis until prescribed determination periods. At the end of each determination period, which is the last day of each calendar month in the period, any realized gain or loss for that period related to the contract will be reclassified to fuel expense and recovered or refunded to the customer through our fuel adjustment mechanisms. Credit risk is the risk that the counterparty might fail to fulfill its obligations under contractual terms.
We may be unable to recover increases in the cost of natural gas from our natural gas utility customers, or may lose customers as a result of any price increases.
In our natural gas utility business, we are permitted to recover the cost of gas directly from our customers through the use of a purchased gas adjustment provision. Our purchased gas adjustment provision is regularly reviewed by the MPSC. In addition to reviewing our adjustments to customer rates, the MPSC reviews our costs for prudency as well. To the extent the MPSC may determine certain costs were not incurred prudently, it could adversely affect our gas segment earnings and cash flows. In addition, increases in natural gas costs affect total prices to our customers and, therefore, the competitive position of gas relative to electricity and other forms of energy. Increases in natural gas costs may also result in lower usage by customers unable to switch to alternate fuels. Such disallowed costs or customer losses could have a material adverse effect on our business, financial condition and results of operations.
We are subject to regulation in the jurisdictions in which we operate.
We are subject to comprehensive regulation by federal and state utility regulatory agencies, which significantly influences our operating environment and our ability to recover our costs from utility customers. The utility commissions in the states where we operate regulate many aspects of our utility operations, including the rates that we can charge customers, siting and construction of facilities, pipeline safety and compliance, customer service and our ability to recover costs we incur, including capital expenditures and fuel and purchased power costs.
The FERC has jurisdiction over wholesale rates for electric transmission service and electric energy sold in interstate commerce. Federal, state and local agencies also have jurisdiction over many of our other activities.
Information concerning recent filings requesting increases in rates and related matters is set forth under Item 7, "Management's Discussion and Analysis of Financial Condition and Results of Operations — Rate Matters."
We are unable to predict the impact on our operating results from the regulatory activities of any of these agencies. Despite our requests, these regulatory commissions have sole discretion to leave rates unchanged, grant increases or order decreases in the base rates we charge our utility customers. They have similar authority with respect to our recovery of increases in our fuel and purchased power costs. If our costs increase and we are unable to recover increased costs through base rates or fuel adjustment clauses, or if we are unable to fully recover our investments in new facilities, our results of operations could be materially adversely affected. Changes in regulations or the imposition of additional regulations could also have a material adverse effect on our results of operations.
Operations risks may adversely affect our business and financial results.
The operation of our electric generation, and electric and gas transmission and distribution systems involves many risks, including breakdown or failure of expensive and sophisticated equipment, processes and personnel performance; operating limitations that may be imposed by equipment conditions, environmental or other regulatory requirements; fuel supply or fuel transportation reductions or
19
interruptions; transmission scheduling constraints; and catastrophic events such as fires, explosions, severe weather or other similar occurrences.
We have implemented training, preventive maintenance and other programs, but there is no assurance that these programs will prevent or minimize future breakdowns, outages or failures of our generation facilities. In those cases, we would need to either produce replacement power from our other facilities or purchase power from other suppliers at potentially volatile and higher cost in order to meet our sales obligations.
These and other operating events may reduce our revenues, increase costs, or both, and may materially affect our results of operations, financial position and cash flows.
Financial market disruptions may increase financing costs, limit access to the credit markets or cause reductions in investment values in our pension plan assets.
We estimate our capital expenditures to be $106.3 million in 2011. Although we believe it is unlikely we will have difficulty accessing the markets for the capital needed to complete these projects (if such a need arises), financing costs could fluctuate. Market conditions have positively impacted the return on our pension plan and Other Postretirement Benefits (OPEB) assets. However, our costs also increased, resulting in a $0.7 million increase in our 2009 net pension and OPEB liability. During 2010, our net pension and OPEB liability increased $8.8 million. We expect to fund approximately $23.1 million in 2011 for pension and OPEB liabilities. Future market declines could result in increased pension and OPEB liabilities and funding obligations.
The cost and schedule of construction projects may materially change.
Our capital expenditure budget for the next three years is estimated to be $422.6 million, This includes expenditures for new generating facilities, additions to our existing facilities and additions to our transmission and distribution systems. There are risks that actual costs may exceed budget estimates, delays may occur in obtaining permits and materials, suppliers and contractors may not perform as required under their contracts, there may be inadequate availability, productivity or increased cost of qualified craft labor, start-up activities may take longer than planned, the scope and timing of projects may change, and other events beyond our control may occur that may materially affect the schedule, budget, cost and performance of projects. To the extent the completion of projects is delayed, we expect that the timing of receipt of increases in base rates reflecting our investment in such projects will be correspondingly delayed. Costs associated with these projects will also be subject to prudency review by regulators as part of future rate case filings and all costs may not be allowed recovery.
We are subject to environmental laws and the incurrence of environmental liabilities which may adversely affect our business, financial condition and results of operations.
We are subject to extensive federal, state and local regulation with regard to air and other environmental matters. Failure to comply with these laws and regulations could have a material adverse effect on our results of operations and financial position. In addition, new environmental laws and regulations, and new interpretations of existing environmental laws and regulations, have been adopted and may in the future be adopted which may substantially increase our future environmental expenditures for both new facilities and our existing facilities. Compliance with current and future air emission standards (such as those limiting emission levels of sulfur dioxide (SO2) and nitrogen oxide (NOx) and, potentially, carbon dioxide (CO2)) has required, and may in the future require, significant environmental expenditures. Although we have historically recovered such costs through our rates, there can be no assurance that we will recover all, or any part of, such increased costs in future rate cases. The incurrence of additional material environmental costs which are not recovered in our rates may result in a material adverse effect on our business, financial condition and results of operations.
20
ITEM 1B. UNRESOLVED STAFF COMMENTS
None.
At December 31, 2010, we owned generating facilities with an aggregate generating capacity of 1,409 megawatts.
Our principal electric baseload generating plant is the Asbury Plant with 207 megawatts of generating capacity. The plant, located near Asbury, Missouri, is a coal-fired generating station with two steam turbine generating units. The plant presently accounts for approximately 14% of our owned generating capacity and in 2010 accounted for approximately 29.4% of the energy generated by us. Routine plant maintenance, during which the entire plant is taken out of service, is scheduled once each year, normally for approximately four weeks in the spring. Approximately every fifth year, the maintenance outage is scheduled to be extended to a total of six weeks to permit inspection of the Unit No. 1 turbine. The last such outage took place in the fall of 2007. The Unit No. 2 turbine is inspected approximately every 35,000 hours of operations and was last inspected in 2001. As of December 31, 2010, Unit No. 2 has operated approximately 3,300 hours since its last turbine inspection in 2001. When the Asbury Plant is out of service, we typically experience increased purchased power and fuel expenditures associated with replacement energy, which is now likely to be recovered through our fuel adjustment clauses.
Our generating plant located at Riverton, Kansas, has two steam-electric generating units (Units 7 and 8) with an aggregate generating capacity of 92 megawatts and four gas-fired combustion turbine units (Units 9, 10, 11 and 12) with an aggregate generating capacity of 194 megawatts. The steam-electric generating units burn coal as a primary fuel and have the capability of burning natural gas. We installed a Siemens V84.3A2 combustion turbine (Unit 12) at our Riverton plant in 2007 with a summer rated capacity of 150 megawatts. It began commercial operation on April 10, 2007.
We own a 12% undivided interest in the coal-fired Unit No. 1 and Unit No. 2 at the Iatan Generating Station located near Weston, Missouri, 35 miles northwest of Kansas City, Missouri, as well as a 3% interest in the site and a 12% interest in certain common facilities. A new air permit was issued for the Iatan Generating Station on January 31, 2006. The new permit covers the entire Iatan Generating Station and includes both Unit No. 1 and Unit No. 2. Iatan 1 was on maintenance outage from the third quarter of 2008 until the second quarter of 2009 for activities ranging from a turbine upgrade and generator rewind to the tie-in of the new air quality control systems. Unit No. 2 entered commercial operation on December 31, 2010. We are entitled to 12% of the units' available capacity, currently 85 megawatts for Unit No. 1 and 102 megawatts for Unit No. 2, and are obligated to pay for that percentage of the operating costs of the units. KCP&L operates the units for the joint owners.
We own a 7.52% undivided interest in the coal-fired Plum Point Energy Station located near Osceola, Arkansas. We are entitled to 50 megawatts, or 7.52% of the unit's available capacity. The Plum Point Energy Station met its in-service criteria on August 13, 2010 and entered commercial operation on September 1, 2010.
Our State Line Power Plant, which is located west of Joplin, Missouri, consists of Unit No. 1, a combustion turbine unit with generating capacity of 96 megawatts and a Combined Cycle Unit with generating capacity of 500 megawatts of which we are entitled to 60%, or 300 megawatts. The Combined Cycle Unit consists of the combination of two combustion turbines, two heat recovery steam generators, a steam turbine and auxiliary equipment. The Combined Cycle Unit is jointly owned with Westar Generating Inc., a subsidiary of Westar Energy, Inc., which owns the remaining 40% of the unit. Westar reimburses us for a percentage of the operating costs per our joint ownership agreement stipulations. We are the operator of the Combined Cycle Unit. All units at our State Line Power Plant burn natural gas as a primary fuel with Unit No. 1 having the additional capability of burning oil.
21
We have four combustion turbine peaking units at the Empire Energy Center in Jasper County, Missouri, with an aggregate generating capacity of 267 megawatts. These peaking units operate on natural gas, as well as oil.
Our hydroelectric generating plant (FERC Project No. 2221), located on the White River at Ozark Beach, Missouri, has a generating capacity of 16 megawatts. We have a long-term license from FERC to operate this plant which forms Lake Taneycomo in southwestern Missouri. As part of the Energy and Water Development Appropriations Act of 2006 (the Appropriations Act), a new minimum flow was established with the intent of increasing minimum flows on recreational streams in Arkansas. To accomplish this, the level of Bull Shoals Lake will be increased an average of 5 feet. The increase at Bull Shoals will decrease the net head waters available for generation at Ozark Beach by 5 feet and, thus, reduce our electrical output. We estimate the lost production to be up to 16% of our average annual energy production for this unit. The loss in this facility would require us to replace it with additional generation from our gas-fired and coal-fired units or with purchased power. The Appropriations Act required the Southwest Power Administration (SWPA), in coordination with us and our relevant public service commissions, to determine our economic detriment assuming a January 1, 2011 implementation date. On June 17, 2010, the SWPA posted a revised Final Determination that our customers' damages were $26.6 million. On September 16, 2010, we received a $26.6 million payment from the SWPA. The $26.6 million payment will have no material impact on net income as we expect the benefits will flow through to our customers. In addition, the SWPA has delayed the implementation of the new minimum flows until 2016.
At December 31, 2010, our transmission system consisted of approximately 22 miles of 345 kV lines, 441 miles of 161 kV lines, 745 miles of 69 kV lines and 81 miles of 34.5 kV lines. Our distribution system consisted of approximately 6,923 miles of line.
Our electric generation stations, other than Plum Point Energy Station, are located on land owned in fee. We own a 3% undivided interest as tenant in common in the land for the Iatan Generating Station. We own a similar interest in 60% of the land used for the State Line Combined Cycle Unit. Substantially all of our electric transmission and distribution facilities are located either (1) on property leased or owned in fee; (2) over streets, alleys, highways and other public places, under franchises or other rights; or (3) over private property by virtue of easements obtained from the record holders of title. Substantially all of our electric segment property, plant and equipment are subject to the EDE Mortgage.
We also own and operate water pumping facilities and distribution systems consisting of a total of approximately 87 miles of water mains in three communities in Missouri.
At December 31, 2010, our principal gas utility properties consisted of approximately 87 miles of transmission mains and approximately 1,126 miles of distribution mains.
Substantially all of our gas transmission and distribution facilities are located either (1) on property leased or owned in fee; (2) under streets, alleys, highways and other public places, under franchises or other rights; or (3) under private property by virtue of easements obtained from the record holders of title. Substantially all of our gas segment property, plant and equipment are subject to the EDG Mortgage.
Our other segment consists of our leasing of fiber optics cable and equipment (which we also use in our own utility operations).
See Note 11 of "Notes to Consolidated Financial Statements" under Item 8, which description is incorporated herein by reference.
22
ITEM 5. MARKET FOR REGISTRANT'S COMMON EQUITY, RELATED STOCKHOLDER MATTERS AND ISSUER PURCHASES OF EQUITY SECURITIES.
Our common stock is listed on the New York Stock Exchange. On February 4, 2011, there were 4,939 record holders and 34,172 individual participants in security position listings. The high and low sale prices for our common stock as reported by the New York Stock Exchange for composite transactions, and the amount per share of quarterly dividends declared and paid on the common stock for each quarter of 2010 and 2009 were as follows:
| |
Price of Common Stock | |
|
||||||||||||||||
|---|---|---|---|---|---|---|---|---|---|---|---|---|---|---|---|---|---|---|---|
| |
Dividends Paid Per Share |
||||||||||||||||||
| |
2010 | 2009 | |||||||||||||||||
| |
High | Low | High | Low | 2010 | 2009 | |||||||||||||
First Quarter |
$ | 19.30 | $ | 17.75 | $ | 18.51 | $ | 11.92 | $ | 0.32 | $ | 0.32 | |||||||
Second Quarter |
20.00 | 17.57 | 16.66 | 14.19 | 0.32 | 0.32 | |||||||||||||
Third Quarter |
20.41 | 18.41 | 19.00 | 16.44 | 0.32 | 0.32 | |||||||||||||
Fourth Quarter |
22.50 | 20.06 | 19.36 | 17.78 | 0.32 | 0.32 | |||||||||||||
Holders of our common stock are entitled to dividends, if, as, and when declared by the Board of Directors, out of funds legally available therefore subject to the prior rights of holders of any outstanding cumulative preferred stock and preference stock. Payment of dividends is determined by our Board of Directors after considering all relevant factors, including the amount of our retained earnings, which is essentially our accumulated net income less dividend payouts. As of December 31, 2010, our retained earnings balance was $5.5 million (compared to $10.1 million at December 31, 2009) after paying out $52.0 million in dividends during 2010. A reduction of our dividend per share, partially or in whole, could have an adverse effect on our common stock price. On February 3, 2011, the Board of Directors declared a quarterly dividend of $0.32 per share on common stock payable March 15, 2011 to holders of record as of March 1, 2011.
Under Kansas corporate law, our Board of Directors may only declare and pay dividends out of our surplus or, if there is no surplus, out of our net profits for the fiscal year in which the dividend is declared or the preceding fiscal year, or both. Our surplus, under Kansas law, is equal to our retained earnings plus accumulated other comprehensive income/(loss), net of income tax. However, Kansas law does permit, under certain circumstances, our Board of Directors to transfer amounts from capital in excess of par value to surplus. In addition, Section 305(a) of the Federal Power Act (FPA) prohibits the payment by a utility of dividends from any funds "properly included in capital account". There are no additional rules or regulations issued by the FERC under the FPA clarifying the meaning of this limitation. However, several decisions by the FERC on specific dividend proposals suggest that any determination would be based on a fact-intensive analysis of the specific facts and circumstances surrounding the utility and the dividend in question, with particular focus on the impact of the proposed dividend on the liquidity and financial condition of the utility.
In addition, the EDE Mortgage and our Restated Articles contain certain dividend restrictions. The most restrictive of these is contained in the EDE Mortgage, which provides that we may not declare or pay any dividends (other than dividends payable in shares of our common stock) or make any other distribution on, or purchase (other than with the proceeds of additional common stock financing) any shares of, our common stock if the cumulative aggregate amount thereof after August 31, 1944 (exclusive of the first quarterly dividend of $98,000 paid after said date) would exceed the sum of $10.75 million and the earned surplus (as defined in the EDE Mortgage) accumulated subsequent to August 31, 1944, or the date of succession in the event that another corporation succeeds to our rights and liabilities by a merger or consolidation. On March 11, 2008, we amended the EDE Mortgage in order to provide us with more flexibility to pay dividends to our shareholders by increasing the basket available to pay dividends by
23
$10.75 million, as described above. As of December 31, 2010, this restriction did not prevent us from issuing dividends.
During 2010, no purchases of our common stock were made by or on behalf of us.
Participants in our Dividend Reinvestment and Stock Purchase Plan may acquire, at a 3% discount, newly issued common shares with reinvested dividends. Participants may also purchase, at an averaged market price, newly issued common shares with optional cash payments on a weekly basis, subject to certain restrictions. We also offer participants the option of safekeeping for their stock certificates.
Our shareholders rights plan, dated July 26, 2000, expired July 25, 2010, pursuant to its terms. See Note 5 of "Notes to Consolidated Financial Statements" under Item 8 for additional information. In addition, we have stock based compensation programs which are described in Note 4 of "Notes to Consolidated Financial Statements" under Item 8.
Our By-laws provide that K.S.A. Sections 17-1286 through 17-1298, the Kansas Control Share Acquisitions Act, will not apply to control share acquisitions of our capital stock.
See Note 4 of "Notes to Consolidated Financial Statements" under Item 8 for additional information regarding our common stock and equity compensation plans.
24
The following graph and table indicates the value at the end of the specified years of a $100 investment made on December 31, 2005, in our common stock and similar investments made in the securities of the companies in the Standard & Poor's 500 Composite Index (S&P 500 Index) and the Standard & Poor's Electric Utilities Index (S&P Electric Utility). The graph and table assume that dividends were reinvested when received.
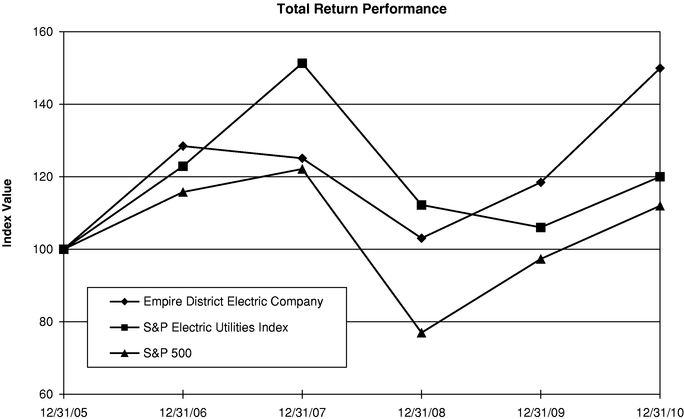
Total Return Analysis
|
12/31/2005 | 12/31/2006 | 12/31/2007 | 12/31/2008 | 12/31/2009 | 12/31/2010 | |||||||||||||
|---|---|---|---|---|---|---|---|---|---|---|---|---|---|---|---|---|---|---|---|
The Empire District Electric Company |
$ | 100.00 | $ | 128.47 | $ | 125.10 | $ | 103.05 | $ | 118.46 | $ | 149.96 | |||||||
S&P Electric Utilities Index |
$ | 100.00 | $ | 122.92 | $ | 151.35 | $ | 112.24 | $ | 106.03 | $ | 120.02 | |||||||
S&P 500 Index |
$ | 100.00 | $ | 115.79 | $ | 122.16 | $ | 76.96 | $ | 97.33 | $ | 111.99 | |||||||
25
ITEM 6. SELECTED FINANCIAL DATA
(in thousands, except per share amounts)(1)
| |
2010 | 2009 | 2008 | 2007 | 2006(2) | |||||||||||||
|---|---|---|---|---|---|---|---|---|---|---|---|---|---|---|---|---|---|---|
Operating revenues |
$ | 541,276 | $ | 497,168 | $ | 518,163 | $ | 490,160 | $ | 412,171 | ||||||||
Operating income |
$ | 80,495 | $ | 74,495 | $ | 71,012 | $ | 65,566 | $ | 69,821 | ||||||||
Total allowance for funds used during construction |
$ | 10,174 | $ | 14,133 | $ | 12,518 | $ | 7,665 | $ | 4,255 | ||||||||
Income from continuing operations |
$ | 47,396 | $ | 41,296 | $ | 39,722 | $ | 33,181 | $ | 40,029 | ||||||||
Income (loss) from discontinued operations, net of tax |
$ | — | $ | — | $ | — | $ | 63 | $ | (749 | ) | |||||||
Net income |
$ | 47,396 | $ | 41,296 | $ | 39,722 | $ | 33,244 | $ | 39,280 | ||||||||
Weighted average number of common shares outstanding — basic |
40,545 | 34,924 | 33,821 | 30,587 | 28,277 | |||||||||||||
Weighted average number of common shares outstanding — diluted |
40,580 | 34,956 | 33,860 | 30,610 | 28,296 | |||||||||||||
Earnings from continuing operations per weighted average share of common stock — basic and diluted |
$ | 1.17 | $ | 1.18 | $ | 1.17 | $ | 1.09 | $ | 1.42 | ||||||||
Loss from discontinued operations per weighted average share of common stock — basic and diluted |
$ | — | $ | — | $ | — | $ | 0.00 | $ | (0.03 | ) | |||||||
Total earnings per weighted average share of common stock — basic and diluted |
$ | 1.17 | $ | 1.18 | $ | 1.17 | $ | 1.09 | $ | 1.39 | ||||||||
Cash dividends per share |
$ | 1.28 | $ | 1.28 | $ | 1.28 | $ | 1.28 | $ | 1.28 | ||||||||
Common dividends paid as a percentage of net income |
109.7 | % | 108.5 | % | 109.0 | % | 117.2 | % | 91.8 | % | ||||||||
Allowance for funds used during construction as a percentage of net income |
21.5 | % | 34.2 | % | 31.5 | % | 23.1 | % | 10.8 | % | ||||||||
Book value per common share (actual) outstanding at end of year |
$ | 15.82 | $ | 15.75 | $ | 15.56 | $ | 16.04 | $ | 15.49 | ||||||||
Capitalization: |
||||||||||||||||||
Common equity |
$ | 657,624 | $ | 600,150 | $ | 528,872 | $ | 539,176 | $ | 468,609 | ||||||||
Long-term debt |
$ | 693,072 | $ | 640,156 | $ | 611,567 | $ | 541,880 | $ | 462,398 | ||||||||
Ratio of earnings to fixed charges |
2.63x | 2.15x | 2.19x | 2.08x | 2.60x | |||||||||||||
Total assets |
$ | 1,921,311 | $ | 1,839,846 | $ | 1,713,846 | $ | 1,473,074 | $ | 1,319,142 | ||||||||
Plant in service at original cost |
$ | 2,108,115 | $ | 1,718,584 | $ | 1,586,152 | $ | 1,506,234 | $ | 1,380,431 | ||||||||
Capital expenditures (including AFUDC)(3) |
$ | 108,157 | $ | 148,804 | $ | 206,405 | $ | 195,568 | $ | 120,171 | ||||||||
- (1)
- 2006
has been adjusted to show continuing operations, reflecting the sale of MAPP and Conversant in 2006 and Fast Freedom in 2007.
- (2)
- Includes
EDG data for the months of June through December 2006.
- (3)
- 2006 capital expenditures do not include $103.2 million for the acquisition of the Missouri Gas operations.
26
ITEM 7. MANAGEMENT'S DISCUSSION AND ANALYSIS OF FINANCIAL CONDITION AND RESULTS OF OPERATIONS
We operate our businesses as three segments: electric, gas and other. The Empire District Electric Company (EDE) is an operating public utility engaged in the generation, purchase, transmission, distribution and sale of electricity in parts of Missouri, Kansas, Oklahoma and Arkansas. As part of our electric segment, we also provide water service to three towns in Missouri. The Empire District Gas Company (EDG) is our wholly owned subsidiary. It provides natural gas distribution to customers in 44 communities in northwest, north central and west central Missouri. Our other segment consists of our fiber optics business.
During the year ended December 31, 2010, our gross operating revenues were derived as follows:
Electric segment sales* |
89.6 | % | ||
Gas segment sales |
9.4 | |||
Other segment sales |
1.0 |
- *
- Sales from our electric segment include 0.3% from the sale of water.
Electric Segment
The primary drivers of our electric operating revenues in any period are: (1) rates we can charge our customers, (2) weather, (3) customer growth and (4) general economic conditions. The utility commissions in the states in which we operate, as well as the Federal Energy Regulatory Commission (FERC), set the rates which we can charge our customers. In order to offset expenses, we depend on our ability to receive adequate and timely recovery of our costs (primarily fuel and purchased power) and/or rate relief. We assess the need for rate relief in all of the jurisdictions we serve and file for such relief when necessary. Of the factors driving revenues, weather has the greatest short-term effect on the demand for electricity for our regulated business. Very hot summers and very cold winters increase electric demand, while mild weather reduces demand. Residential and commercial sales are impacted more by weather than industrial sales, which are mostly affected by business needs for electricity and by general economic conditions. Customer growth, which is the growth in the number of customers, contributes to the demand for electricity. We expect our annual electric customer growth to range from approximately 0.85% to 1.35% over the next several years. Our electric customer growth for the year ended December 31, 2010 was 0.2%. We define electric sales growth to be growth in kWh sales period over period excluding the impact of weather. The primary drivers of electric sales growth are customer growth and general economic conditions.
The primary drivers of our electric operating expenses in any period are: (1) fuel and purchased power expense, (2) maintenance and repairs expense, including repairs following severe weather and plant outages, (3) taxes and (4) non-cash items such as depreciation and amortization expense. Historically, fuel and purchased power costs were the expense items that had the most significant impact on our net income. In our 2007 rate case, the Missouri Public Service Commission (MPSC) authorized a fuel adjustment clause for our Missouri customers effective September 1, 2008. The MPSC established a base rate for the recovery of fuel and purchased power expenses used to supply energy. The clause permits the distribution to customers of 95% of the changes in fuel and purchased power costs above or below the base. With the addition of the Missouri fuel adjustment mechanism, we now have a fuel cost recovery mechanism in all of our jurisdictions, which significantly reduces the impact of fluctuating fuel and purchased power costs on our net income.
27
Gas Segment
The primary drivers of our gas operating revenues in any period are: (1) rates we can charge our customers, (2) weather, (3) customer growth, (4) the cost of natural gas and interstate pipeline transportation charges and (5) general economic conditions. The MPSC sets the rates which we can charge our customers. In order to offset expenses, we depend on our ability to receive adequate and timely recovery of our costs (primarily commodity natural gas) and/or rate relief. We assess the need for rate relief and file for such relief when necessary. A Purchased Gas Adjustment (PGA) clause is included in our gas rates, which allows us to recover our actual cost of natural gas from customers through rate changes, which are made periodically (up to four times) throughout the year in response to weather conditions, natural gas costs and supply demands. Weather affects the demand for natural gas. Very cold winters increase demand for gas, while mild weather reduces demand. Due to the seasonal nature of the gas business, revenues and earnings are typically concentrated in the November through March period, which generally corresponds with the heating season. Customer growth, which is the growth in the number of customers, contributes to the demand for gas. Our gas segment customer contraction for the year ended December 31, 2020 was 0.9%, which we believe was due to depressed economic conditions. The rate of gas customer contraction is expected to level out during the next two years and begin modest growth after 2012. We define gas sales growth to be growth in mcf sales excluding the impact of weather. The primary drivers of gas sales growth are customer growth and general economic conditions.
The primary driver of our gas operating expense in any period is the price of natural gas. However, because gas purchase costs for our gas utility operations are normally recovered from our customers, any change in gas prices does not have a corresponding impact on income unless such costs are deemed imprudent or cause customers to reduce usage.
Earnings
For the year ended December 31, 2010, basic and diluted earnings per weighted average share of common stock were $1.17 on $47.4 million of net income compared to $1.18 on $41.3 million of net income for the year ended December 31, 2009. The primary positive drivers for 2010 as compared to 2009 were increased electric revenues (resulting from rate increases and increased demand in 2010 due to favorable weather) and decreased interest charges. The primary negative drivers for 2010 as compared to 2009 were increased electric operations and maintenance expenses, increased depreciation and amortization, the dilutive effect of additional shares of common stock issued (mainly due to our equity distribution program), changes in AFUDC amounts and the changes in effective tax rates, including the two non-cash charges in the first quarter of 2010 discussed below.
The table below sets forth a reconciliation of basic and diluted earnings per share between 2009 and 2010, which is a non-GAAP presentation. The economic substance behind our non-GAAP earnings per share (EPS) measure is to present the after tax impact of significant items and components of the statement of income on a per share basis before the impact of additional stock issuances.
We believe this presentation is useful to investors because the statement of income does not readily show the EPS impact of the various components, including the effect of new stock issuances. This could limit the readers' understanding of the reasons for the EPS change from previous years. This information is useful to management, and we believe this information is useful to investors, to better understand the reasons for the fluctuation in EPS between the prior and current years on a per share basis.
This reconciliation may not be comparable to other companies or more useful than the GAAP presentation included in the statements of income. We also note that this presentation does not purport to be an alternative to earnings per share determined in accordance with GAAP as a measure of operating performance or any other measure of financial performance presented in accordance with GAAP. Management compensates for the limitations of using non-GAAP financial measures by using them to supplement GAAP results to provide a more complete understanding of the factors and trends affecting
28
the business than GAAP results alone. The dilutive effect of additional shares issued included in the table reflects the estimated impact of all shares issued during the period. Similar tables presented in our 2010 Form 10-Q filings also reflected the estimated impact of all shares issued during the applicable periods, but split the impact into two line items, "dilutive effect of additional shares issued" (which reflected shares issued pursuant to the equity distribution program completed in June 2010) and "other income and deductions" (which reflected all other shares issued during the applicable periods).
Earnings Per Share — 2009 |
$ | 1.18 | |||
Revenues |
|||||
Electric on-system |
$ | 0.78 | |||
Electric off-system and other |
0.18 | ||||
Gas |
(0.12 | ) | |||
Other |
0.01 | ||||
Expenses |
|||||
Electric fuel and purchased power |
(0.33 | ) | |||
Cost of natural gas sold and transported |
0.17 | ||||
Regulated — electric segment |
(0.14 | ) | |||
Regulated — gas segment |
0.02 | ||||
Maintenance and repairs |
(0.07 | ) | |||
Depreciation and amortization |
(0.14 | ) | |||
Other taxes |
(0.03 | ) | |||
Interest charges |
0.08 | ||||
AFUDC |
(0.07 | ) | |||
Change in effective income tax rates |
(0.15 | ) | |||
Dilutive effect of additional shares issued |
(0.19 | ) | |||
Other income and deductions |
(0.01 | ) | |||
Earnings Per Share — 2010 |
$ | 1.17 | |||
Fourth Quarter Results
Earnings for the fourth quarter of 2010 were $8.5 million, or $0.20 per share, as compared to $7.9 million, or $0.22 per share, in the fourth quarter 2009. Total revenues increased approximately $11.9 million (9.9%) for the fourth quarter of 2010 as compared to the fourth quarter of 2009 primarily due to increased sales and rate increases in 2010. Partially offsetting the increase in revenues were increases in operations and maintenance expenses and depreciation and amortization.
New Construction
On March 14, 2006, we entered into contracts to purchase a 50 megawatt, 7.52% undivided interest in the Plum Point Energy Station. The Plum Point Energy Station met its in-service criteria on August 13, 2010 and entered commercial operation on September 1, 2010. We also have a long-term (30 year) purchased power agreement for an additional 50 megawatts of capacity and have the option to purchase an undivided ownership interest in the 50 megawatts covered by the purchased power agreement in 2015.
On June 13, 2006, we announced we had entered into an agreement with Kansas City Power & Light (KCP&L) to purchase an undivided ownership interest in the coal-fired Iatan 2 generating facility. We own 12%, or approximately 102 megawatts, of the 850-megawatt unit. KCP&L reported that Iatan 2 met its in-service criteria on August 26, 2010. Iatan 2 entered commercial operation on December 31, 2010.
29
Regulatory Matters
We filed several rate cases primarily to recover the costs of the completed plants described above. These are described below.
A stipulated agreement in our 2009 Missouri electric rate case was filed on May 12, 2010, calling for an annual increase of $46.8 million, provided the Plum Point Generating Station met its in-service criteria by August 15, 2010. The Plum Point Generating Station completed its in-service criteria testing on August 12, 2010, with an in-service date of August 13, 2010, and the new rates were effective September 10, 2010.
On September 28, 2010, we filed a rate increase request with the MPSC for an annual increase in base rates for our Missouri electric customers in the amount of $36.5 million, or 9.2% to recover the Iatan 2 costs and other cost of service items not included in the recently completed Missouri rate case. KCP&L reported that Iatan 2 met its in-service criteria on August 26, 2010.
A stipulated agreement in our current Kansas rate case was filed on May 4, 2010, and approved by the KCC on June 25, 2010, calling for a $2.8 million, or 12.4%, increase in base rates effective July 1, 2010.
On August 30, 2010, we were granted a two-phase Capital Reliability Rider (CRR) by the Oklahoma Corporation Commission (OCC) with the first phase effective September 1, 2010. In total, the CRR revenue has been specifically limited by the OCC to an overall annual revenue increase of $2.6 million, or 27.67% increase. On January 28, 2011 we requested the approval by the OCC of the phase 2 rates of the CRR. We requested an additional $1.1 million, which brings the total annual revenue under the OCC to approximately $2.5 million. We will file a general rate case within six months of the commercial operation date of Iatan 2 (which was December 31, 2010) to replace the CRR with permanent rates.
On August 19, 2010, we filed a rate increase request with the Arkansas Public Service Commission (APSC) for an annual increase in base rates for our Arkansas electric customers in the amount of $3.2 million, or 27.3%. On February 2, 2011 we entered into a unanimous settlement agreement with the parties involved. The settlement includes a general rate increase of $2.1 million, or 19%. The settlement calls for the implementation of a new tariff, the Transmission Cost Recovery Rider (TCR) designed to track changes in the cost of transmission charges from the Southwest Power Pool, Inc. The existing Energy Cost Recovery Rider was also modified to include the recovery of the costs associated with certain air quality control materials. A hearing on the settlement has been scheduled for March 8, 2011 at the APSC.
On March 12, 2010, we filed Generation Formula Rate (GFR) tariffs with the FERC which we propose to be utilized for our wholesale customers. On June 30, 2010, three of our on-system wholesale customers were granted intervention in the GFR rate case. On September 15, 2010, the parties agreed to a settlement in principle and are now working to finalize the terms of the settlement.
In December 2008, the Office of the Public Counsel (OPC) and intervenors Praxair, Inc. and Explorer Pipeline Company filed Petitions for Writ of Review with the Cole County Circuit Court challenging the tariffs resulting from our 2006 Missouri rate case that went into effect January 1, 2007. The Cole County Circuit Court issued a ruling on December 8, 2009, affirming the Commission's Report and Order. OPC, Praxair and Explorer Pipeline filed appeals with the Western District Court of Appeals. On October 26, 2010, the Western District Court of Appeals affirmed the Commission's Report and Order. Praxair, Inc. and Explorer Pipeline Company filed with the Western District Court of Appeals a Motion for Rehearing and an Application for Transfer to the Supreme Court. On December 7, 2010, the Western District Court of Appeals overruled the Motion for Rehearing and denied the Application for Transfer to the Supreme Court. Praxair, Inc. then asked the Missouri Supreme Court to transfer the case to that court. On January 25, 2011, the request was denied.
On June 5, 2009, we filed a request with the MPSC for an annual increase in base rates for our Missouri gas customers in the amount of $2.9 million, or 4.9%. On February 24, 2010, the MPSC
30
unanimously approved an agreement among the OPC, the MPSC staff and Empire for an increase of $2.6 million. Pursuant to the Agreement, new rates went into effect on April 1, 2010.
For additional information, see "Rate Matters" below.
Iatan 2 Coal Investment Tax Credits
A December 2009 award from an arbitration panel ordered KCP&L to renegotiate with the IRS a previous $125 million advanced coal investment tax credit granted to the Iatan 2 plant. The IRS executed a revised memorandum of understanding (MOU) on September 7, 2010, which granted us our share, $17.7 million, of advanced coal investment tax credits in accordance with the arbitration panel's order. We will utilize these credits to reduce our 2010 tax payments and 2010 tax liability. The tax credit will have no significant income statement impact as the credits will flow to our customers as we amortize the tax credits over the life of the plant. See Note 9 of "Notes to Consolidated Financial Statements" under Item 8.
Financings
On January 28, 2011, we filed a $400 million shelf registration statement with the SEC covering our common stock, unsecured debt securities, preference stock, and first mortgage bonds. This shelf registration statement became effective on February 7, 2011. We plan to use proceeds under this shelf to fund capital expenditures, refinancings of existing debt or general corporate needs when needed during the effective period. The issuance of securities under this shelf is subject to the receipt of local regulatory approvals.
On August 25, 2010, we issued $50 million principal amount of 5.20% first mortgage bonds due September 1, 2040. The net proceeds (after payment of expenses) of approximately $49.1 million were used to redeem $48.3 million aggregate principal amount of our Senior Notes, 7.05% Series due 2022 on August 27, 2010.
On May 28, 2010, we issued $100 million principal amount of 4.65% first mortgage bonds due June 1, 2020. The net proceeds (after payment of expenses) of approximately $98.8 million, were used to redeem all 2 million outstanding shares of our 8.5% trust preferred securities totaling $50 million, on June 28, 2010, and to repay short-term debt which was incurred, in part, to fund the repayment, at maturity, of our 6.5% first mortgage bonds due 2010.
We successfully completed an equity distribution program during the second quarter of 2010 and used the net proceeds to repay short-term debt and for general corporate purposes, including the funding of our current construction program. During 2010, we issued and sold 2,870,985 shares of our common stock pursuant to this equity distribution program, at an average price per share of $18.41, resulting in net proceeds to us of approximately $51.3 million. Since inception of the program on February 25, 2009, in the aggregate, we issued and sold 6,535,216 shares pursuant to the program, at an average price per share of $18.36, resulting in net proceeds to us of approximately $116.0 million.
Ozark Beach Plant
On September 16, 2010, we received a $26.6 million payment from the Southwest Power Administration (SWPA) to reimburse us for the estimated future lifetime replacement cost of the electrical energy and capacity lost due to the White River Minimum Flows project at Ozark Beach. The $26.6 million payment will have no material impact on net income as we expect the benefits will flow through to our customers. In addition, the SWPA has delayed the implementation of the new minimum flows until 2016. See Item 2, "Properties — Electric Segment Facilities" for additional information.
31
Healthcare Reform Act — Medicare Part D benefits
On March 23, 2010, the Patient Protection and Affordable Care Act was enacted. This legislation includes a provision that reduces the deductibility, for income tax purposes, of retiree healthcare costs to the extent an employer receives federal subsidies. Companies receive the subsidy when they provide retiree prescription benefits at least equivalent to Medicare Part D coverage in their postretirement healthcare plan. Although the elimination of this tax benefit does not take effect until 2013, this change required us to recognize the full accounting impact in our financial statements in the period in which the legislation was enacted. As a result, in the first quarter of 2010, we recorded a one-time non-cash charge of approximately $2.1 million to reflect the impact of this change. Our 2010 effective tax rate also increased due to the additional tax expense associated with the changes in the Medicare Part D tax benefit. See Note 9 of "Notes to Consolidated Financial Statements."
Renewable Energy
On November 4, 2008, Missouri voters approved the Clean Energy Initiative (Proposition C). This initiative requires us and other investor-owned utilities in Missouri to generate or purchase electricity from renewable energy sources, such as solar, wind, biomass and hydro power, at the rate of at least 2% of retail sales by 2011, increasing to at least 15% by 2021. Two percent of this amount must be solar. We believe we are exempt from the solar requirement. A challenge to our exemption brought by two of our customers and Power Source Solar, Inc. is pending in the Missouri Western District Court of Appeals. In July 2010, the MPSC submitted to the Missouri Secretary of State's office its rule for the renewable energy mandate. We are awaiting action from the Missouri Secretary of State but believe we are in compliance with the law. Kansas established a renewable portfolio standard (RPS) in May 2009 which was approved October 27, 2010, effective November 19, 2010. Its final rulemaking was released in November 2010 which calls for 10% of our Kansas retail customer peak capacity requirements to be sourced from renewables by 2011, 15% by 2016, and 20% by 2020. In addition, there are several proposals currently before the U.S. Congress to adopt a nationwide RPS.
Shareholder Rights Plan
Our shareholder rights plan, dated as of July 26, 2000, expired July 25, 2010, pursuant to its terms.
The following discussion analyzes significant changes in the results of operations for the years 2010, 2009 and 2008.
The following table represents our results of operations by operating segment for the applicable years ended December 31 (in millions):
| |
2010 | 2009 | 2008 | ||||||||
|---|---|---|---|---|---|---|---|---|---|---|---|
Electric |
$ | 43.2 | $ | 39.1 | $ | 37.4 | |||||
Gas |
2.6 | 0.9 | 1.7 | ||||||||
Other |
1.6 | 1.3 | 0.6 | ||||||||
Net income |
$ | 47.4 | $ | 41.3 | $ | 39.7 | |||||
32
Electric Segment
Our electric segment income for 2010 was $43.2 million as compared to $39.1 million for 2009.
Electric operating revenues comprised approximately 89.2% of our total operating revenues during 2010. Electric operating revenues for 2010, 2009, and 2008 were comprised of the following:
| |
2010 | 2009 | 2008 | |||||||
|---|---|---|---|---|---|---|---|---|---|---|
Residential |
42.4 | % | 41.6 | % | 40.2 | % | ||||
Commercial |
30.3 | 31.4 | 29.8 | |||||||
Industrial |
14.4 | 15.2 | 15.1 | |||||||
Wholesale on-system |
4.0 | 4.2 | 4.3 | |||||||
Wholesale off-system |
4.7 | 3.3 | 6.6 | |||||||
Miscellaneous sources* |
2.6 | 2.7 | 2.5 | |||||||
Other electric revenues |
1.6 | 1.6 | 1.5 | |||||||
- *
- primarily public authorities
The percentage of revenues provided from our wholesale off-system transactions increased during 2010 as compared to 2009 primarily due to increased market demand resulting from more favorable weather in 2010 as compared to 2009. The percentage of revenues provided from our wholesale off-system transactions decreased during 2009 as compared to 2008 primarily due to decreased market demand resulting from milder weather in 2009 and general economic conditions.
The amounts and percentage changes from the prior periods in kilowatt-hour ("kWh") sales and electric segment operating revenues by major customer class for on-system and off-system sales were as follows:
| |
kWh Sales (in millions) |
|||||||||||||||||||
|---|---|---|---|---|---|---|---|---|---|---|---|---|---|---|---|---|---|---|---|---|
Customer Class
|
2010 | 2009 | % Change* | 2009 | 2008 | % Change* | ||||||||||||||
Residential |
2,060.4 | 1,866.5 | 10.4 | % | 1,866.5 | 1,952.9 | (4.4 | )% | ||||||||||||
Commercial |
1,644.9 | 1,579.8 | 4.1 | 1,579.8 | 1,622.0 | (2.6 | ) | |||||||||||||
Industrial |
1,007.0 | 992.2 | 1.5 | 992.2 | 1,073.3 | (7.6 | ) | |||||||||||||
Wholesale on-system |
355.8 | 332.0 | 7.2 | 332.0 | 344.5 | (3.6 | ) | |||||||||||||
Other** |
126.5 | 123.4 | 2.5 | 123.4 | 123.8 | (0.3 | ) | |||||||||||||
Total on-system sales |
5,194.6 | 4,893.9 | 6.1 | 4,893.9 | 5,116.5 | (4.3 | ) | |||||||||||||
Off-system |
798.1 | 515.9 | 54.7 | 515.9 | 688.2 | (25.0 | ) | |||||||||||||
Total KWh Sales |
5,992.7 | 5,409.8 | 10.8 | 5,409.8 | 5,804.7 | (6.8 | ) | |||||||||||||
- *
- Percentage
changes are based on actual kWh sales and may not agree to the rounded amounts shown above.
- **
- Other kWh sales include street lighting, other public authorities and interdepartmental usage.
33
| |
Electric Segment Operating Revenues (in millions) | |||||||||||||||||||
|---|---|---|---|---|---|---|---|---|---|---|---|---|---|---|---|---|---|---|---|---|
Customer Class
|
2010 | 2009 | % Change* | 2009 | 2008 | % Change* | ||||||||||||||
Residential |
$ | 204.9 | $ | 180.4 | 13.6 | % | $ | 180.4 | $ | 179.3 | 0.6 | % | ||||||||
Commercial |
146.3 | 135.8 | 7.7 | 135.8 | 132.9 | 2.2 | ||||||||||||||
Industrial |
69.7 | 66.0 | 5.6 | 66.0 | 67.4 | (2.0 | ) | |||||||||||||
Wholesale on-system |
19.2 | 18.2 | 5.8 | 18.2 | 19.2 | (5.4 | ) | |||||||||||||
Other** |
12.3 | 11.6 | 6.1 | 11.6 | 11.0 | 5.1 | ||||||||||||||
Total on-system revenues |
452.4 | 412.0 | 9.8 | 412.0 | 409.8 | 0.5 | ||||||||||||||
Off-system |
22.9 | 14.3 | 59.6 | 14.3 | 29.7 | (51.7 | ) | |||||||||||||
Total revenues from KWh sales |
475.3 | 426.3 | 11.5 | 426.3 | 439.5 | (3.0 | ) | |||||||||||||
Miscellaneous revenues*** |
7.6 | 6.8 | 11.1 | 6.8 | 7.0 | (2.3 | ) | |||||||||||||
Total electric operating revenues |
$ | 482.9 | $ | 433.1 | 11.5 | $ | 433.1 | $ | 446.5 | (3.0 | ) | |||||||||
Water revenues |
1.8 | 1.8 | 2.3 | 1.8 | 1.7 | (1.0 | ) | |||||||||||||
Total Electric Segment Operating Revenues |
$ | 484.7 | $ | 434.9 | 11.5 | $ | 434.9 | $ | 448.2 | (3.0 | ) | |||||||||
- *
- Percentage
changes are based on actual revenues and may not agree to the rounded amounts shown above.
- **
- Other
operating revenues include street lighting, other public authorities and interdepartmental usage.
- ***
- Miscellaneous revenues include transmission service revenues, late payment fees, renewable energy credit sales, rent, etc.
2010 Compared to 2009
On-System Operating Revenues and Kilowatt-Hour Sales
KWh sales for our on-system customers increased approximately 6.1% during 2010 as compared to 2009 with the associated revenues increasing approximately $40.5 million (9.8%). Weather and other related factors increased revenues an estimated $24.1 million. Total cooling degree days (the cumulative number of degrees that the average temperature for each day during that period was above 65° F) for 2010 were 56.5% more than 2009 and 27.2% more than the 30-year average. Total heating degree days (the sum of the number of degrees that the daily average temperature for each day during that period was below 65° F) for 2010 were 2.9% more than 2009 and 2.3% more than the 30-year average. Rate changes, primarily the September 2010 Missouri rate increase and July 2010 Kansas rate increase (discussed below), contributed an estimated $14.0 million to revenues, while continued sales growth contributed an estimated $2.4 million. We expect our annual customer growth to range from approximately 0.85% to 1.35% over the next several years.
Residential and commercial kWh sales increased in 2010 primarily due to favorable weather during the year. The related revenues increased during 2010 primarily due to the Missouri and Kansas rate increases, as well as continued sales growth. Industrial kWh sales increased 1.5% in 2010 as compared to 2009 when there was a slowdown created by economic uncertainty. Industrial revenues increased 5.6% mainly due to the Missouri and Kansas rate increases. On-system wholesale kWh sales and revenues increased reflecting the increased market demand resulting from the favorable weather.
Off-System Electric Transactions
In addition to sales to our own customers, we also sell power to other utilities as available, including through the Southwest Power Pool (SPP) energy imbalance services (EIS) market. See "— Competition" below. The majority of our off-system sales margins are now included as a component of the fuel
34
adjustment clause in our Missouri, Kansas and Oklahoma jurisdictions and generally adjust the fuel and purchased power expense. As a result, nearly all of the off-system sales margin flows back to the customer and has little effect on net income.
Off-system revenues and related expenses were higher during 2010 as compared to 2009 primarily due to increased market demand resulting from the favorable weather discussed above. Total purchased power related expenses are included in our discussion of purchased power costs below.
Our miscellaneous revenues were $7.6 million during 2010 as compared to $6.8 million during 2009. These revenues are comprised mainly of transmission revenues, late payment fees and renewable energy credit sales.
Operating Revenue Deductions — Fuel and Purchased Power
During 2010, total fuel and purchased power expenses increased approximately $17.3 million (9.5%) as compared to 2009. The table below is a reconciliation of our actual fuel and purchased power expenditures (netted with the regulatory adjustments) to the fuel and purchased power expense shown on our statements of income for 2010 and 2009.
| (in millions) |
2010 | 2009 | ||||||
|---|---|---|---|---|---|---|---|---|
Actual fuel and purchased power expenditures |
$ | 200.0 | $ | 182.1 | ||||
Kansas regulatory adjustments** |
(0.1 | ) | 0.5 | |||||
Missouri fuel adjustment deferral** |
(4.5 | ) | (2.0 | ) | ||||
Missouri fuel adjustment recovery* |
3.1 | 1.7 | ||||||
Unrealized (gain)/loss on derivatives |
0.8 | (0.3 | ) | |||||
Total fuel and purchased power expense per income statement |
$ | 199.3 | $ | 182.0 | ||||
- *
- Recovered
from customers from prior deferral period.
- **
- A negative amount indicates costs have been under recovered from customers and a positive amount indicates costs have been over recovered from customers.
The overall fuel and purchased power increase primarily reflects the effect of increased market demand in 2010 resulting from favorable weather conditions.
Summarized in the table below are our 2010 estimated cost and volume changes in the components of fuel and purchased power expenses when compared to 2009. This table incorporates all the changes mentioned above. As shown below, the largest impact on fuel and purchased power costs was increased generation by our gas-fired units.
| (in millions) |
2010 vs. 2009 | ||||
|---|---|---|---|---|---|
Natural gas generation volume |
$ | 35.1 | |||
Coal generation volume |
7.5 | ||||
Purchased power spot purchase volume |
(9.8 | ) | |||
Coal (cost per mWh) |
(0.9 | ) | |||
Natural gas (cost per mWh) |
(16.9 | ) | |||
Purchased power (cost per mWh) |
3.4 | ||||
Other (primarily fuel adjustments) |
(1.1 | ) | |||
TOTAL |
$ | 17.3 | |||
35
Operating Revenue Deductions — Other Than Fuel and Purchased Power
Regulated operating expenses increased approximately $7.0 million (11.1%) during 2010 as compared to 2009 primarily due to changes in the following accounts:
| (in millions) |
2010 vs. 2009 | ||||
|---|---|---|---|---|---|
Transmission and distribution expense* |
$ | 1.9 | |||
General labor costs |
1.2 | ||||
Employee pension expense |
1.0 | ||||
Employee health care expense |
1.0 | ||||
Customer accounts expense** |
1.5 | ||||
Steam power other operating expense |
0.6 | ||||
Property insurance |
0.4 | ||||
Injuries and damages expense |
0.3 | ||||
Customer assistance expense |
0.3 | ||||
General office expense |
0.3 | ||||
Other steam power expense*** |
(1.9 | ) | |||
Other miscellaneous accounts (netted) |
0.4 | ||||
TOTAL |
$ | 7.0 | |||
- *
- Approximately
$1.6 million of this total is for charges incurred for delivering the output from Plum Point to our system.
- **
- Mainly
increased banking fees and uncollectible accounts.
- ***
- Related to Iatan 1 and Iatan 2 operating costs that we were able to defer in accordance with our agreement with the MPSC that allows deferral of certain costs until the plant additions are included in customer rates.
Maintenance and repairs expense increased approximately $3.8 million (11.8%) during 2010 primarily due to changes in the following accounts:
| (in millions) |
2010 vs. 2009 | ||||
|---|---|---|---|---|---|
Distribution maintenance expense* |
$ | 1.3 | |||
Transmission maintenance expense |
0.7 | ||||
Maintenance and repairs expense at the Riverton plant — coal units** |
0.9 | ||||
Maintenance and repairs expense at the Iatan plant |
0.7 | ||||
Maintenance and repairs expense at the Plum Point plant |
0.4 | ||||
Maintenance and repairs expense at the Asbury plant |
0.3 | ||||
Maintenance and repairs expense at the Riverton plant — gas units |
0.4 | ||||
Maintenance and repairs expense to SLCC*** |
(1.1 | ) | |||
Other miscellaneous accounts (netted) |
0.2 | ||||
TOTAL |
$ | 3.8 | |||
- *
- Mainly
due to continued implementation of our system reliability plan.
- **
- Mainly
due to the 2010 five-year maintenance outage.
- ***
- Decrease mainly due to maintenance outage in 2009.
Depreciation and amortization expense increased approximately $5.9 million (12.4%) during 2010 reflecting our additions to plant in service and to additional regulatory amortization of $3.1 million. The remainder is increased plant in service in 2010, partially offset by the effect of deferred depreciation
36
related to Iatan 2 as allowed in our regulatory agreements pertaining to our Kansas and Missouri jurisdictions. This is net of the construction accounting effect of deferring $2.0 million of Iatan 1 and Iatan 2 depreciation expense in 2010 as compared to $0.8 million of Iatan 1 depreciation expense in 2009. Other taxes increased approximately $2.0 million due to increased property tax reflecting our additions to plant in service and increased municipal franchise taxes.
2009 Compared to 2008
On-System Operating Revenues and Kilowatt-Hour Sales
KWh sales for our on-system customers decreased approximately 4.3% during 2009 as compared to 2008 with the associated revenues increasing approximately $2.2 million (0.5%). Weather and other related factors decreased revenues an estimated $20.3 million. Total cooling degree days for 2009 were 12.3% less than 2008 and 18.7% less than the 30-year average. Total heating degree days for 2009 were 4.0% less than 2008 and 0.5% less than the 30-year average. Rate changes, primarily the August 2008 Missouri rate increase (discussed below), contributed an estimated $21.9 million to revenues while continued sales growth contributed an estimated $0.6 million.
Residential and commercial kWh sales decreased in 2009 primarily due to mild weather during the year. The related revenues increased during 2009 primarily due to the August 2008 Missouri rate increase and continued sales growth. Industrial kWh sales decreased 7.6% mainly due to a slowdown created by economic uncertainty while the associated revenues decreased 2.0%, reflecting the economic conditions, partially offset by the Missouri rate increase. On-system wholesale kWh sales and revenues decreased reflecting the general economic conditions and mild weather.
Off-System Electric Transactions
Off-system revenues and related expenses were less during 2009 as compared to 2008 primarily due to decreased market demand and lower gas prices that made it more economical for utilities to generate their own power rather than purchase it. Total purchased power related expenses are included in our discussion of purchased power costs below.
Our miscellaneous revenues were $6.8 million during 2009 as compared to $7.0 million during 2008. These revenues are comprised mainly of transmission revenues, late payment fees and renewable energy credit sales.
Operating Revenue Deductions — Fuel and Purchased Power
Total fuel and purchased power expenses decreased approximately $22.1 million (10.8%) during 2009 as compared to 2008. The table below is a reconciliation of our actual fuel and purchased power
37
expenditures (netted with the regulatory adjustments) to the fuel and purchased power expense shown on our statements of income for 2009 and 2008.
| (in millions) |
2009 | 2008 | ||||||
|---|---|---|---|---|---|---|---|---|
Actual fuel and purchased power expenditures |
$ | 182.1 | $ | 204.1 | ||||
Kansas regulatory adjustments** |
0.5 | (0.5 | ) | |||||
Missouri fuel adjustment deferral* |
(2.0 | ) | 0.2 | |||||
Missouri fuel adjustment recovery** |
1.7 | |||||||
Unrealized (gain)/loss on derivatives |
(0.3 | ) | 0.3 | |||||
Total fuel and purchased power expense per income statement |
$ | 182.0 | $ | 204.1 | ||||
- *
- A
negative amount indicates costs have been under recovered from customers and a positive amount indicates costs have been over recovered from customers.
- **
- Recovered from customers from prior deferral period.
The overall fuel and purchased power expense decrease primarily reflects the effect of decreased market demand resulting from mild weather in 2009, as well as the effects of an extended outage at the Asbury plant lasting from the fourth quarter of 2007 into the first quarter of 2008 during which time we relied on purchased power as well as our gas-fired units to replace our coal-fired generation. The decrease in fuel costs also includes the effect of decreased off-system sales.
Summarized in the table below are our estimated cost and volume changes in the components of fuel and purchased power expenses when compared to 2008. This table incorporates all the changes mentioned above. As shown below, the largest impacts on fuel and purchased power costs were lower purchased power and natural gas prices and decreased generation by our gas-fired units.
| (in millions) |
2009 vs 2008 | ||||
|---|---|---|---|---|---|
Coal (cost) |
$ | 3.8 | |||
Natural gas (cost) |
2.3 | ||||
Purchased power (cost) |
(10.1 | ) | |||
Coal generation volume |
(0.6 | ) | |||
Natural gas generation volume |
(23.1 | ) | |||
Purchased power spot purchase volume |
3.0 | ||||
Natural gas — gain on unwind of positions |
2.1 | ||||
Other (including fuel adjustments) |
0.5 | ||||
TOTAL |
$ | (22.1 | ) | ||
38
Operating Revenue Deductions — Other Than Fuel and Purchased Power
Regulated operating expenses increased approximately $1.0 million (1.6%) during 2009 as compared to 2008 primarily due to changes in the following accounts:
| (in millions) |
2009 vs. 2008 | ||||
|---|---|---|---|---|---|
Professional services |
$ | 1.5 | |||
Other steam power expense |
1.2 | ||||
General labor costs |
0.8 | ||||
Customer accounts expense* |
0.6 | ||||
Employee health care expense |
(1.3 | ) | |||
Injuries and damages expense |
(1.1 | ) | |||
Employee pension expense |
(0.4 | ) | |||
Regulatory commission expense |
(0.3 | ) | |||
TOTAL |
$ | 1.0 | |||
- *
- Mainly increased banking fees.
We were able to defer $0.6 million in other steam power expense, which is included in the regulated operating expense increase, related to Iatan 1 operating costs in accordance with our agreement with the MPSC that allowed deferral of certain costs until the environmental upgrades to Iatan 1 were included in our rate base.
Maintenance and repairs expense increased approximately $4.5 million (16.4%) during 2009 primarily due to changes in the following accounts:
| (in millions) |
2009 vs. 2008 | ||||
|---|---|---|---|---|---|
Distribution maintenance costs* |
$ | 3.8 | |||
Maintenance and repairs expense at the Asbury plant |
1.2 | ||||
Maintenance and repairs expense to the SLCC |
0.3 | ||||
Maintenance and repairs expense to the Riverton gas units |
0.1 | ||||
Maintenance and repairs expense to State Line Unit No. 1 |
0.1 | ||||
Maintenance and repairs expense at the Iatan plant |
(0.6 | ) | |||
Maintenance and repairs expense to the Riverton coal units |
(0.4 | ) | |||
TOTAL |
$ | 4.5 | |||
- *
- Includes $2.5 million of ice storm related amortization
Depreciation and amortization expense decreased approximately $2.3 million (4.5%) during 2009 primarily due to reduced regulatory amortization resulting from the Missouri rate case that went into effect August 23, 2008. Other taxes increased approximately $0.8 million due to increased property tax reflecting our additions to plant in service and increased municipal franchise taxes.
39
Gas Segment
Gas Operating Revenues and Sales
The following tables detail our natural gas sales and revenues for the years ended December 31:
| |
Total Gas Delivered to Customers | ||||||||||||||||||
|---|---|---|---|---|---|---|---|---|---|---|---|---|---|---|---|---|---|---|---|
| (bcf sales) |
2010 | 2009 | % Change | 2009 | 2008 | % Change | |||||||||||||
Residential |
2.68 | 2.69 | (0.4 | )% | 2.69 | 2.95 | (8.9 | )% | |||||||||||
Commercial |
1.26 | 1.27 | (1.0 | ) | 1.27 | 1.40 | (8.6 | ) | |||||||||||
Industrial* |
0.11 | 0.22 | (50.5 | ) | 0.22 | 0.55 | (60.5 | ) | |||||||||||
Other** |
0.03 | 0.03 | 11.6 | 0.03 | 0.03 | (13.3 | ) | ||||||||||||
Total retail sales |
4.08 | 4.21 | (3.1 | ) | 4.21 | 4.93 | (14.6 | ) | |||||||||||
Transportation sales* |
4.83 | 4.33 | 11.5 | 4.33 | 4.06 | 6.7 | |||||||||||||
Total gas operating sales |
8.91 | 8.54 | 4.3 | 8.54 | 8.99 | (5.0 | ) | ||||||||||||
| |
Operating Revenues and Cost of Gas Sold | ||||||||||||||||||
|---|---|---|---|---|---|---|---|---|---|---|---|---|---|---|---|---|---|---|---|
| ($ in millions) |
2010 | 2009 | % Change | 2009 | 2008 | % Change | |||||||||||||
Residential |
$ | 32.3 | $ | 36.2 | (10.9 | )% | $ | 36.2 | $ | 39.6 | (8.7 | )% | |||||||
Commercial |
13.3 | 15.5 | (14.2 | ) | 15.5 | 17.4 | (10.7 | ) | |||||||||||
Industrial* |
0.8 | 2.1 | (60.7 | ) | 2.1 | 5.1 | (59.3 | ) | |||||||||||
Other** |
0.4 | 0.4 | (6.0 | ) | 0.4 | 0.4 | (12.8 | ) | |||||||||||
Total retail revenues |
$ | 46.8 | $ | 54.2 | (13.7 | ) | $ | 54.2 | $ | 62.5 | (13.4 | ) | |||||||
Other revenues |
0.4 | 0.2 | 107.3 | 0.2 | 0.2 | (2.1 | ) | ||||||||||||
Transportation revenues* |
3.7 | 2.9 | 26.6 | 2.9 | 2.7 | 10.0 | |||||||||||||
Total gas operating revenues |
$ | 50.9 | $ | 57.3 | (11.2 | ) | $ | 57.3 | $ | 65.4 | (12.4 | ) | |||||||
Cost of gas sold |
26.6 | 35.6 | (25.2 | ) | 35.6 | 42.6 | (16.5 | ) | |||||||||||
Gas operating revenues over cost of gas in rates |
$ | 24.3 | $ | 21.7 | 11.8 | $ | 21.7 | $ | 22.8 | (4.8 | ) | ||||||||
- *
- Percentage
change reflects the transfer of a customer from transportation to industrial sales in April 2008 and back to transportation in
April 2009 and a customer switching from industrial sales to transportation in October 2009 after an eight-month suspension.
- **
- Other includes other public authorities and interdepartmental usage.
2010 Compared to 2009
Operating Revenues and bcf Sales
Gas retail sales decreased 3.1% during 2010 as compared to 2009 reflecting customer contraction of 0.9%. We believe this contraction was due to depressed economic conditions. We estimate that the rate of gas customer contraction will level out during the next two years and begin modest growth after 2012. Residential and commercial sales decreased slightly during 2010 despite heating degree days being 1.8% higher in 2010 than 2009. Heating degree days were 2.2% lower in 2010, however, than the 30-year average. Industrial sales decreased during 2010 due to customer contraction and the transfer of the customer between classes mentioned above.
During 2010, gas segment revenues were approximately $50.9 million as compared to $57.3 million in 2009, a decrease of 11.2%. This decrease was largely driven by lower PGAs that went into effect November 13, 2009 and November 2, 2010. During 2010, our PGA revenue (which represents the cost of gas recovered from our customers) was approximately $26.6 million as compared to $35.6 million in 2009, a decrease of approximately $9.0 million (25.2%), representing a decrease in the cost of gas. The cost of
40
natural gas was lower for 2010 compared to 2009 as we experienced more than a 20% decrease in the annual price. The overall impact resulted in an improved margin of approximately $2.6 million primarily due to an increase in base rates for our Missouri gas customers that was effective April 1, 2010.
Our PGA clause allows us to recover from our customers, subject to routine regulatory review, the cost of purchased gas supplies, transportation and storage, including costs associated with the use of financial instruments to hedge the purchase price of natural gas. Pursuant to the provisions of the PGA clause, the difference between actual costs incurred and costs recovered through the application of the PGA are reflected as a regulatory asset or regulatory liability until the balance is recovered from or credited to customers.
As of December 31, 2010, we had unrecovered purchased gas costs of $0.4 million recorded as a non-current regulatory asset and over recovered purchased gas costs of $1.2 million recorded as a current regulatory liability.
Operating Revenue Deductions
Total other operating expenses were $9.5 million during 2010 as compared to $10.3 million in 2009, primarily due to a $0.7 million decrease in employee pension expense and a $0.2 million decrease in customer accounts expense (mainly uncollectible accounts) partially offset by a $0.1 million increase in regulatory commission expense.
Depreciation and amortization expense increased approximately $1.0 million (50.5%) during 2010 due to increased depreciation rates resulting from our 2010 Missouri gas rate case.
Our gas segment had net income of $2.6 million in 2010 as compared to $0.9 million in 2009.
2009 Compared to 2008
Operating Revenues and bcf Sales
Gas retail sales decreased 14.6% during 2009 as compared to 2008 reflecting milder weather, the switching of customers between industrial sales and transportation (see footnote above) and the effect of our gas segment customer contraction of 1.3% in 2009. We believe this contraction was due to depressed economic conditions. Residential and commercial sales decreased during 2009 primarily due to the milder weather as well as customer contraction. Heating degree days were 9.7% lower than 2008 and 3.9% lower than the 30-year average. Industrial sales decreased during 2009 due to the transfer of customers between classes mentioned above.
During 2009, gas segment revenues were approximately $57.3 million as compared to $65.4 million in 2008, a decrease of 12.4%. This decrease was largely driven by the decrease in residential and industrial sales as well as PGA revenue. During 2009, our PGA revenue was approximately $35.6 million as compared to $42.6 million in 2008, a decrease of approximately $7.0 million. This decrease was largely driven by the decrease in sales and decreases in the PGAs that went into effect May 15, 2009 and November 13, 2009.
As of December 31, 2009, we had unrecovered purchased gas costs of $0.4 million recorded as a current regulatory asset and over recovered purchased gas costs of $1.9 million recorded as a regulatory liability.
Operating Revenue Deductions
Total other operating expenses were $10.3 million during 2009 as compared to $10.0 million in 2008, mainly due to a $0.2 million increase in distribution operation expense and a $0.1 million increase in general labor costs.
41
Our gas segment had net income of $0.9 million in 2009 as compared to $1.7 million in 2008.
Consolidated Company
Income Taxes
The following table shows the increases in our consolidated provision for income taxes (in millions) and our consolidated effective federal and state income tax rates for the applicable years ended December 31:
| |
2010 | 2009 | 2008 | |||||||
|---|---|---|---|---|---|---|---|---|---|---|
Consolidated provision for income taxes |
$ | 10.9 | $ | 0.4 | $ | 4.7 | ||||
Consolidated effective federal and state income tax rates |
39.2 | % | 32.5 | % | 32.5 | % | ||||
The effective tax rate for 2010 is higher than 2009 primarily due to the new health care legislation. On March 23, 2010, the Patient Protection and Affordable Care Act became law. This legislation includes a provision that reduces the deductibility, for income tax purposes, of retiree healthcare costs to the extent an employer receives federal subsidies. Companies receive the subsidy when they provide retiree prescription benefits at least equivalent to Medicare Part D coverage in their postretirement healthcare plan. Although the elimination of this tax benefit does not take effect until 2013, this change required us to recognize the full accounting impact in our financial statements in the period in which the legislation was enacted. As a result, in the first quarter of 2010, we recorded a one-time non-cash charge of approximately $2.1 million to income taxes to reflect the impact of this change. Our 2010 effective tax rate also increased due to the additional tax expense associated with the changes in the Medicare Part D tax benefit. As a result, our effective income tax rate for 2010 was 39.2% as compared to 32.5% in 2009. Excluding these non-cash charges, the effective tax rate in 2010 would have been 35.0%.
As part of an agreement reached in our most recently completed Missouri electric rate case, effective September 10, 2010, we agreed to commence an eighteen year amortization of a deferred asset related to the tax benefits of cost of removal. These tax benefits were flowed through to customers from 1981 – 2008 and totaled approximately $11.1 million. We recorded a regulatory asset expecting to recover these benefits from customers in future periods. We estimated the portion of the amortization period where rate recovery would no longer be probable for this item and wrote off approximately $1.2 million in the first quarter of 2010. Amortization of the remaining regulatory tax asset will begin in 2012, which is also when we expect to be able to request rate recovery of the asset.
A December 2009 award from an arbitration panel ordered KCP&L to renegotiate with the IRS a previous $125 million advanced coal investment tax credit granted to our Iatan 2 plant. The IRS executed a revised memorandum of understanding (MOU) on September 7, 2010, which granted us our share, $17.7 million, of advanced coal investment tax credits in accordance with the arbitration panel's order. We will utilize approximately $5.1 million of these credits to reduce our 2010 tax payments and 2010 tax liability and these are reflected as part of our income tax receivable in accounts receivable — other. The remainder is recorded as deferred taxes. The tax credit will have no significant income statement impact as the credits will flow to our customers as we amortize the tax credits over the life of the plant.
On September 16, 2010, we received approximately $26.6 million from the SWPA as payment regarding the decrease in available net head waters at our hydroelectric generating plant located on the White River at Ozark Beach, Missouri. Currently, we have increased our current liability for income taxes by $10.0 million in anticipation that we will pay income taxes currently on the $26.6 million award, but no impact to our revenues or net income has been recorded to date. See Note 9 of "Notes to Consolidated Financial Statements" under Item 8 for additional information regarding income taxes.
Based on the extension of bonus depreciation through 2012 enacted by Congress, we do not expect to incur any federal income tax liability during 2011. Additionally, we currently estimate that approximately $12 million of advanced coal investment tax credits will be available to partially offset federal tax liabilities in 2012 and possibly 2013.
42
The following table shows the total allowance for funds used during construction (AFUDC) for the applicable periods ended December 31. AFUDC decreased in 2010 as compared to 2009 and 2008 reflecting the completion of Iatan 2 and the Plum Point Energy Station in 2010. AFUDC increased in 2009 as compared to 2008 due to higher levels of construction in 2009. See Note 1 of "Notes to Consolidated Financial Statements" under Item 8.
| ($ in millions) |
2010 | 2009 | 2008 | |||||||
|---|---|---|---|---|---|---|---|---|---|---|
Allowance for equity funds used during construction |
$ | 4.5 | $ | 6.2 | $ | 5.9 | ||||
Allowance for borrowed funds used during construction |
5.7 | 7.9 | 6.6 | |||||||
Total AFUDC |
$ | 10.2 | $ | 14.1 | $ | 12.5 | ||||
Total interest charges on long-term and short-term debt for 2010, 2009 and 2008 are shown below. The decrease in long-term debt interest for 2010, as compared to 2009, reflects the redemption of $48.3 million aggregate principal amount of our Senior Notes, 7.05% Series due 2022, which were redeemed on August 27, 2010, and replaced by $50 million principal amount 5.20% first mortgage bonds issued August 25, 2010. The decrease for 2010 also reflects the redemption of 6.5% first mortgage bonds on April 1, 2010 and the redemption of our 8.5% trust preferred securities on June 28, 2010, which were replaced by 4.65% first mortgage bonds issued May 28, 2010. The increase in long-term debt interest for 2009 reflects the interest on the $75 million principal amount of first mortgage bonds we issued March 27, 2009 and the $90 million principal amount of first mortgage bonds we issued May 16, 2008. The decreases in short-term debt interest for all periods presented primarily reflect lower levels of borrowing.
| |
Interest Charges ($ in millions) |
||||||||||||||||||
|---|---|---|---|---|---|---|---|---|---|---|---|---|---|---|---|---|---|---|---|
| |
2010 | 2009 | Change | 2009 | 2008 | Change | |||||||||||||
Long-term debt interest |
$ | 41.9 | $ | 42.1 | (0.3 | )% | $ | 42.1 | $ | 36.0 | 16.8 | % | |||||||
Short-term debt interest |
0.6 | 1.1 | (43.9 | ) | 1.1 | 1.9 | (39.3 | ) | |||||||||||
Trust preferred securities interest |
2.1 | 4.3 | (50.8 | ) | 4.3 | 4.3 | 0.0 | ||||||||||||
Iatan 1 and 2 carrying charges* |
(3.2 | ) | (1.3 | ) | 136.9 | (1.3 | ) | — | — | ||||||||||
Other interest |
0.9 | 0.6 | 28.2 | 0.6 | 1.1 | (42.5 | ) | ||||||||||||
Total interest charges |
$ | 42.3 | $ | 46.8 | (9.5 | ) | $ | 46.8 | $ | 43.3 | 8.0 | ||||||||
- *
- Beginning in the second quarter of 2009, we deferred Iatan 1 carrying charges to reflect construction accounting in accordance with our agreement with the MPSC that allows deferral of certain costs until the environmental upgrades to Iatan 1 are included in our rate base. We began deferring Iatan 2 carrying charges in the third quarter of 2010. See Note 3 of "Notes to Consolidated Financial Statements" under Item 8 for information regarding carrying charges.
We continually assess the need for rate relief in all of the jurisdictions we serve and file for such relief when necessary. In addition to the information set forth below, see Note 3 of "Notes to Consolidated Financial Statements" under Item 8.
Our rates for retail electric and natural gas services (other than specially negotiated retail rates for industrial or large commercial customers, which are subject to regulatory review and approval) are determined on a "cost of service" basis. Rates are designed to provide, after recovery of allowable operating expenses, an opportunity for us to earn a reasonable return on "rate base." "Rate base" is generally determined by reference to the original cost (net of accumulated depreciation and amortization)
43
of utility plant in service, subject to various adjustments for deferred taxes and other items. Over time, rate base is increased by additions to utility plant in service and reduced by depreciation, amortization and retirement of utility plant or write-off's as ordered by the utility commissions. In general, a request of new rates is made on the basis of a "rate base" as of a date prior to the date of the request and allowable operating expenses for a 12-month test period ended prior to the date of the request. Although the current rate making process provides recovery of some future changes in rate base and operating costs, it does not reflect all changes in costs for the period in which new retail rates will be in place. This results in a lag between the time we incur costs and the time when we can start recovering the costs through rates.
The following table sets forth information regarding electric and water rate increases since January 1, 2008:
Jurisdiction
|
Date Requested |
Annual Increase Granted |
Percent Increase Granted |
Date Effective |
||||||
|---|---|---|---|---|---|---|---|---|---|---|
Missouri — Electric |
October 29, 2009 | $ | 46,800,000 | 13.40 | % | September 10, 2010 | ||||
Oklahoma — Electric |
March 25, 2010 | $ | 1,456,979 | 15.70 | % | September 1, 2010 | ||||
Kansas — Electric |
November 4, 2009 | $ | 2,800,000 | 12.4 | % | July 1, 2010 | ||||
Missouri — Gas |
June 5, 2009 | $ | 2,600,000 | 4.37 | % | April 1, 2010 | ||||
Missouri — Electric |
October 1, 2007 | $ | 22,040,395 | 6.70 | % | August 23, 2008 | ||||
Electric Segment
Missouri
2010 Rate Case
On September 28, 2010, we filed a rate increase request with the MPSC for an annual increase in base rates for our Missouri electric customers in the amount of $36.5 million, or 9.2%, to recover the Iatan 2 costs and other cost of service items not included in the 2009 Missouri rate case (see below).
2009 Rate Case
On October 29, 2009, we filed a request with the MPSC for an annual increase in base rates for our Missouri electric customers in the amount of $68.2 million, or 19.6%. This request was primarily designed to allow us to recover capital expenditures associated with environmental upgrades at Iatan 1 and our investment in new generating units at Iatan 2 and the Plum Point Generating Station. As a result of the delay in the Iatan 2 project, however, we agreed to not seek a permanent increase in this rate case for any costs associated with the Iatan 2 unit with the exception of that portion of the Iatan common plant needed to operate Iatan 1.
A stipulated agreement was filed on May 12, 2010, calling for an annual increase of $46.8 million, provided the Plum Point Generating Station met its in-service criteria by August 15, 2010. If the in-service criteria were not met by such date, a base rate increase of $33.1 million was stipulated. The Plum Point Generating Station completed its in-service criteria testing on August 12, 2010, with an in-service date of August 13, 2010, thus new rates, providing for the full increase of $46.8 million, were effective September 10, 2010. The $46.8 million authorized increase in annual revenues includes $36.8 million in base rate revenue and $10 million in regulatory amortization. The regulatory amortization, which is treated as additional book depreciation for rate-making purposes and is reflected in the financial statements, was granted to provide additional cash flow through rates. This regulatory amortization is related to our investments in facilities and environmental upgrades completed during the recent construction cycle. As agreed in our regulatory plan, we will use construction accounting for our Iatan 2 project. See Note 3 and Note 11 of "Notes to Consolidated Financial Statements" under Item 8. We also agreed to commence an eighteen year amortization of a deferred asset related to the tax benefits of cost of removal. These tax
44
benefits were flowed through to customers from 1981 to 2008 and totaled approximately $11.1 million. We had previously recorded a regulatory asset expecting to recover these benefits from customers in future periods. We estimated the portion of the amortization period where rate recovery would no longer be probable for this item and wrote off approximately $1.2 million in the first quarter of 2010. Amortization of the remaining regulatory tax asset will begin in 2012, which is also when we expect to be able to request rate recovery of the asset. See Note 9 of "Notes to Consolidated Financial Statements" under Item 8.
2007 Rate Case
The MPSC issued an order on July 30, 2008 in response to a request filed with the MPSC on October 1, 2007 for an annual increase in base rates for our Missouri electric customers. This order granted an annual increase in revenues for our Missouri electric customers in the amount of $22.0 million, or 6.7%, based on a 10.8% return on equity. The new rates went into effect August 23, 2008.
The order contained two components. The first component provided an addition to base rates of approximately $27.7 million. This increase in base rates was partially offset by a $5.7 million reduction to regulatory amortization, which is the second component to support certain credit metrics of the overall change in revenue authorized by the MPSC. Regulatory amortization provided us additional cash through rates during our construction cycle. This construction, which was part of our long-range plan to ensure reliability, included the facilities at the Riverton Power Plant and Iatan 2 Power Plant, as well as environmental improvements at the Asbury Power Plant and at Iatan 1. The regulatory amortization as a result of this case was approximately $4.5 million annually and was recorded as depreciation expense.
The MPSC also authorized a fuel adjustment clause for our Missouri customers effective September 1, 2008. The MPSC established a base cost for the recovery of fuel and purchased power expenses used to supply energy. The clause permits the distribution to customers of 95% of the changes in fuel and purchased power costs above or below the base cost. Off-system sales margins are also part of the recovery of fuel and purchased power costs. As a result, the off-system sales margin flows back to the customer. Rates related to the recovery of fuel and purchased power costs will be modified twice a year subject to the review and approval by the MPSC. In accordance with accounting guidance for regulated activities, 95% of the difference between the actual cost of fuel and purchased power and the base cost of fuel and purchased power recovered from our customers is recorded as an adjustment to fuel and purchased power expense with a corresponding regulatory asset or a regulatory liability. If the actual fuel and purchased power costs are higher or lower than the base fuel and purchased power costs billed to customers, 95% of these amounts will be recovered or refunded to our customers when the fuel adjustment clause is modified.
The MPSC order in the rate case approved a Stipulation and Agreement providing for the recovery of deferred expenses of approximately $14.2 million over a five year period for the 2007 ice storms. In addition, the MPSC order required the implementation of a two-way tracking mechanism for recovery of the costs relating to the new MPSC rules on infrastructure inspection and vegetation management. The mechanism authorized by the MPSC created a regulatory liability in any year we spend less than the target amount, which has been set at $8.6 million for our Missouri jurisdiction, and a regulatory asset if we spend more than the target amount. Any regulatory asset and liability amounts created using the tracking mechanism will then be netted against each other and taken into account in our next rate case. The MPSC also approved Stipulations and Agreements providing for the continuation of the pension and other post-retirement employee benefits tracking mechanism established in our 2006 and 2007 Missouri rate orders.
The MPSC issued its Report and Order on July 30, 2008, effective August 9, 2008. The OPC and intervenors Praxair, Inc. and Explorer Pipeline Company filed applications for rehearing with the MPSC regarding this order. On August 12, 2008, the MPSC issued its Order Granting Expedited Treatment and Approving Compliance Tariff Sheets, effective August 23, 2008, in which the MPSC approved our tariff
45
sheets containing our base rates for service rendered on and after August 23, 2008, and approved our fuel adjustment clause tariff sheets effective September 1, 2008. On September 3, 2008, the MPSC denied all pending applications for rehearing.
On October 2, 2008, the OPC and intervenors Praxair, Inc. and Explorer Pipeline Company filed Petitions for Writ of Review with the Cole County Circuit Court. These actions were consolidated into one proceeding, briefs were filed and the Cole County Circuit Court heard oral arguments on September 29, 2009. The Cole County Circuit Court issued a ruling on December 31, 2009, affirming the Commission's Report and Order. OPC, Praxair and Explorer Pipeline filed appeals with the Western District Court of Appeals. Explorer Pipeline was dismissed from the pending appeal on October 18, 2010.
2006 Rate Case
In December 2008, the OPC and intervenors Praxair, Inc. and Explorer Pipeline Company filed Petitions for Writ of Review with the Cole County Circuit Court challenging the tariffs resulting from our 2006 Missouri rate case that went into effect January 1, 2007. The Cole County Circuit Court issued a ruling on December 8, 2009, affirming the Commission's Report and Order. OPC, Praxair and Explorer Pipeline filed appeals with the Western District Court of Appeals. On October 26, 2010, the Western District Court of Appeals affirmed the Commission's Report and Order. Praxair, Inc. and Explorer Pipeline Company filed with the Western District Court of Appeals a Motion for Rehearing and an Application for Transfer to the Supreme Court. On December 7, 2010, the Western District Court of Appeals overruled the Motion for Rehearing and denied the Application for Transfer to the Supreme Court. Praxair, Inc. then asked the Missouri Supreme Court to transfer the case to that court. On January 25, 2011, the request was denied.
Kansas
On November 4, 2009, we filed a request with the KCC for an annual increase in base rates for our Kansas electric customers in the amount of $5.2 million, or 24.6%. This request was primarily to allow us to recover capital expenditures associated with environmental upgrades at Iatan 1 completed in 2009 and at our Asbury plant completed in 2008 and our investment in new generating units at Iatan 2, the Plum Point Generating Station and our Riverton 12 unit that went on line in 2007. A stipulated agreement was filed on May 4, 2010, and approved by the KCC on June 25, 2010, calling for a $2.8 million, or 12.4%, increase in base rates effective July 1, 2010. We will defer depreciation and operating and maintenance expense on both Plum Point and Iatan 2 from their respective in-service dates until the effective date for rates from the next Kansas case, expected to be an abbreviated rate case that will be filed within the next year. These deferrals will be recovered over a 3-5 year period as determined in that next case. We will record AFUDC on all Plum Point and Iatan 2 capital expenditures incurred after January 31, 2010.
Oklahoma
On March 25, 2010, we requested a capital cost recovery rider (CCRR) at the Oklahoma Corporation Commission (OCC). The rider was designed to recover the carrying costs on our capital investment for generation, transmission and distribution assets that have been added to the system since our last Oklahoma general rate case (May 2003), as well as investments made on an ongoing basis. As requested, the operation of the CCRR would have increased our operating revenue by approximately $3 million, or approximately 33%, in Oklahoma in a series of three steps to be followed with a general rate case in 2011. On August 30, 2010, we were granted a two-phase Capital Reliability Rider (CRR) by the OCC. The first phase of the rider was put into place for Oklahoma customers for usage on and after September 1, 2010, and results in an overall annual base revenue increase of approximately $1.5 million, or 15.7%. In total, the CRR revenue has been specifically limited by the OCC to an overall annual revenue increase of $2.6 million, or 27.67% increase. On January 28, 2011 we requested the approval by the OCC of the phase 2 rates of the CRR. We requested an additional $1.1 million, which brings the total annual revenue
46
under the OCC to approximately $2.5 million. We will file a general rate case within six months of the commercial operation date of Iatan 2 (which was December 31, 2010) to replace the CRR with permanent rates.
Arkansas
On August 19, 2010, we filed a rate increase request with the Arkansas Public Service Commission (APSC) for an annual increase in base rates for our Arkansas electric customers in the amount of $3.2 million, or 27.3%. On February 2, 2011 we entered into a unanimous settlement agreement with the parties involved. The settlement includes a general rate increase of $2.1 million, or 19%. The settlement calls for the implementation of a new tariff, the Transmission Cost Recovery Rider (TCR) designed to track changes in the cost of transmission charges from the Southwest Power Pool, Inc. The existing Energy Cost Recovery Rider was also modified to include the recovery of the costs associated with certain air quality control materials. A hearing on the settlement has been scheduled for March 8, 2011 at the APSC.
FERC
On March 12, 2010, we filed GFR tariffs with the FERC which we propose to be utilized for our wholesale customers. On May 28, 2010, the FERC issued an order that conditionally approved our GFR filing subject to refund effective June 1, 2010. As of December 31, 2010, we had collected $0.6 million in rates subject to refund. On June 30, 2010, three of our on-system wholesale customers were granted intervention in the GFR rate case. Also on May 28, 2010, we filed a notice with the FERC requesting termination of the current bundled service agreements for our wholesale customers effective July 31, 2010. On July 28, 2010, the FERC issued an order accepting and suspending the proposed terminations for a nominal period to become effective July 31, 2010, subject to refund. The FERC's order also consolidated the GFR and termination proceedings. On September 15, 2010, the parties agreed to a settlement in principle and are now working to finalize the terms of the settlement.
Gas Segment
On June 5, 2009, we filed a request with the MPSC for an annual increase in base rates for our Missouri gas customers in the amount of $2.9 million, or 4.9%. In this filing, we requested recovery of the ongoing cost of operating and maintaining our 1,200-mile gas distribution system and a return on equity of 11.3%. On February 24, 2010, the MPSC unanimously approved an agreement among the Office of the Public Counsel (OPC), the MPSC staff and Empire for an increase of $2.6 million. Pursuant to the Agreement, new rates went into effect on April 1, 2010.
Electric Segment
SPP-RTO
Energy Imbalance Services: On February 1, 2007, the Southwest Power Pool (SPP) regional transmission organization (RTO) launched its energy imbalance services market (EIS). In general, the SPP RTO EIS market provides real time energy for most participating members within the SPP regional footprint. Imbalance energy prices are based on market bids and status/availability of dispatchable generation and transmission within the SPP market footprint. In addition to energy imbalance service, the SPP RTO performs a real time security-constrained economic dispatch of all generation voluntarily offered into the EIS market to the market participants to also serve the native load.
Day Ahead Market: The SPP and its members have been evaluating the costs and benefits on expanding the EIS market into a full day ahead energy market with a co-optimized ancillary services market, which will include the consolidation of all SPP balancing authorities, including ours, into a single
47
SPP balancing authority. On April 28, 2009, the SPP Regional State Committee (SPP RSC), whose members include state commissioners from our four state commissions, and the SPP Board of Directors (SPP BOD) endorsed a cost benefit report that recommended the SPP RTO move forward with the development of a day-ahead market with unit commitment and co-optimized ancillary services market (Day-Ahead Market) and implement the complete Day-Ahead Market as soon as practical, which is anticipated in late 2013 or early 2014. As part of the Day-Ahead Market, the SPP RTO will create, prior to implementation of such market, a single NERC approved balancing authority to take over balancing authority responsibilities for its members, including us, which is expected to provide operational and economic benefits for our customers. The implementation of the Day-Ahead Market will replace the existing EIS market, which to date has, and is expected to continue to, provide benefits for our customers.
SPP Regional Transmission Development: On August 15, 2008, the SPP filed with the FERC proposed revisions to its open access transmission pro forma tariff (OATT) to establish a process for including a "balanced portfolio" of economic transmission upgrades in the annual SPP Transmission Expansion Plan. The cost of such upgrades will be recovered through a regional rate allocated to SPP members based on their load ratio share within SPP's market area of the balanced portfolio's cost. On October 16, 2008, the FERC accepted the balanced portfolio approach, which sets forth the selection process of a group of projects and regional cost allocation rules based on projected benefits and allocated costs over a ten year period. The plan will be balanced if the portfolio is cost beneficial for each zone, including ours, within the SPP. A balanced portfolio could include projects below the 345 kv level (which is the bright line voltage level for projects to be included in the portfolio) to increase benefits to a particular zone to achieve balance of benefits and costs over the ten year study period. On April 28, 2009, the SPP RSC and the SPP BOD approved the first set of balanced portfolio extra high voltage transmission projects to be constructed within the SPP region. The transmission expansion projects, totaling over $840 million, include projects in Missouri, Kansas, Arkansas, Oklahoma, Nebraska and Texas. We anticipate this set of transmission expansion projects will provide long term benefits to our customers. While we do not project our allocated costs for the balanced portfolio projects to be material, we expect that the costs will be recoverable in future rates. Also on April 28, 2009, the SPP RSC and BOD approved a new report that recommended restructuring of the SPP's regional planning processes, which would establish an integrated planning process for reliability, transmission service and economic transmission projects, based on a new set of planning principles that focus on the construction of a more robust transmission system large enough in both scale and geography to provide flexibility to meet SPP members' and customers' future needs. We will continue to actively participate in the development of these new processes as well as cost allocation and recovery issues with members, prospective customers and the state commission representatives to the SPP RSC.
On October 27, 2009, the SPP BOD endorsed a new transmission cost allocation method to replace the existing FERC accepted cost allocation method for new transmission facilities needed to continue to reliably and economically serve SPP customers, including ours, well into the future. On April 19, 2010, SPP filed revisions to its OATT to adopt a new highway/byway cost allocation methodology which require SPP BOD approved transmission projects of 300 kV or larger to be funded by the region at 100%, transmission projects between 100 kV and 300 kV to receive 33% regional funding with individual constructing zones to pay 67% of those projects built within the zone. For projects under 100kV, the constructing zones would pay 100% of the cost. On May 17, 2010, we filed a joint protest at the FERC with other SPP members based on our disagreement with the SPP on the allocation percentages and various other issues. On June 17, 2010, the FERC unconditionally approved the new highway/byway cost allocation method. We and other members of the SPP filed a Request for Rehearing on July 19, 2010. It is uncertain as to when or if the FERC will rule on our Request for Rehearing. To date, the SPP's BOD has approved $1.4 billion in highway/byway projects to be constructed over the next several years. As these projects are constructed, we will be allocated a share of the costs of the projects pursuant to the FERC accepted cost allocation method. We expect that these costs will be recoverable in future rates.
48
In a related but separate filing, on May 17, 2010, the SPP filed revisions to its OATT to incorporate a modified transmission planning process, the Integrated Transmission Plan (ITP) that the SPP will use to determine its near and long term transmission needs to meet reliability and provide economic benefits throughout the SPP region. On June 7, 2010, we made a joint protest filing at the FERC regarding the ITP filing which expressed our concerns over the lack of explicit provisions in the SPP OATT to protect SPP customers from the approval of transmission projects that may not sufficiently benefit the SPP region. On July 15, 2010, the FERC issued an order conditionally accepting SPP proposed ITP planning process and tariff provisions to be effective on July 17, 2010, and ordered SPP to make a compliance filing by August 15, 2010, on the timing of ITP business practices and factors to be considered for changing the allocation of costs methods for dual winding high voltage transformers. We and the other parties to the SPP ITP jointly filed a formal Request for Rehearing at the FERC on the ITP order on August 13, 2010. On September 7, 2010, the FERC granted our Request For Rehearing to allow additional time for FERC's further consideration.
FERC Market Power Order
As part of our market based pricing authority from the FERC, we are required to conduct a market power analysis within our service territory and within the SPP RTO region every three years. We filed our triennial market power analysis with the FERC on July 30, 2009, concluding there were no material changes to our market position. As a result, we did not anticipate any changes to our existing market based rate authority. On July 13, 2010, the FERC issued an order accepting our triennial market power analysis and authorized the continuation of our market based rate authority for wholesale transactions outside our service territory.
Other FERC Activity
On May 21, 2009, the FERC issued an order clarifying that, going forward, small public utilities that have been granted waiver of Order No. 889 (Open Access Same Time Information Systems (OASIS) requirement) and the Standards of Conduct for transmission operations, which includes us, are required to submit a notification filing if there has been a material change in facts that may affect the basis on which a public utility's waiver was premised. The Standards of Conduct generally govern the communications between our day to day transmission operations personnel and our day to day wholesale marketing and sales personnel. We submitted our filing on July 13, 2009 in which we stated our belief that continuation of our waiver, issued in 1997 and reaffirmed in 2004, was appropriate and reasonable. Based on the May 21, 2009 order, it is possible that the FERC will revoke our waiver which would impact communication between our transmission and wholesale marketing and sales functions and operations within our organization. As part of our filing, we sought a twelve month extension in order to comply with the Standard of Conduct requirements in the event the FERC determined that revoking our waiver was appropriate. The FERC's decision on this and other Standard of Conduct waiver filings is pending. As of July 19, 2010, we have voluntarily taken steps to allow us to comply with a FERC order with minimal additional impact.
On June 17, 2010, FERC issued a Notice of Proposed Rulemaking (NOPR) proposing to amend the transmission planning and cost allocation requirements established in Order No. 890 to ensure that FERC-jurisdictional services are provided on a basis that is just, reasonable and not unduly discriminatory or preferential. With respect to transmission planning, FERC said that the proposed rule would: (1) provide that local and regional transmission planning processes account for transmission needs driven by public policy requirements established by state or federal laws or regulations; (2) improve coordination between neighboring transmission planning regions with respect to interregional facilities; and (3) remove from FERC-approved tariffs or agreements a right of first refusal created by those documents that provides an incumbent transmission provider with an undue advantage over a non-incumbent transmission developer. Neither incumbent nor non-incumbent transmission facility developers should, as a result of a
49
FERC-approved tariff or agreement, receive different treatment in a regional transmission planning process, FERC contended. Further, both should share similar benefits and obligations commensurate with that participation, including the right, consistent with state or local laws or regulations, to construct and own a facility that it sponsors in a regional transmission planning process and that is selected for inclusion in the regional transmission plan. With respect to cost allocation, the proposed rule would establish a closer link between transmission planning processes and cost allocation and would require cost allocation methods for intraregional and interregional transmission facilities to satisfy newly established cost allocation principles. We participated in the development of comments by the SPP RTO which were filed at FERC on September 29, 2010. We will continue to monitor the NOPR as it may affect our existing rights to construct transmission facilities in our service territory as well as high voltage transmission expansion and cost allocation that will affect our cost of delivery service to our customers.
Gas Segment
Non-residential gas customers whose annual usage exceeds certain amounts may purchase natural gas from a source other than EDG. EDG does not have a non-regulated energy marketing service that sells natural gas in competition with outside sources. EDG continues to receive non-gas related revenues for distribution and other services if natural gas is purchased from another source by our eligible customers.
LIQUIDITY AND CAPITAL RESOURCES
Overview. Our primary sources of liquidity are cash provided by operating activities, short-term borrowings under our commercial paper program (which is supported by our credit facilities) and borrowings from our unsecured revolving credit facility. As needed, we raise funds from the debt and equity capital markets to fund our liquidity and capital resource needs.
Our issuance of various securities, including equity, long-term and short-term debt, is subject to customary approval or authorization by state and federal regulatory bodies including state public service commissions and the SEC. We estimate that internally generated funds (funds provided by operating activities less dividends paid) will provide the majority of the funds required in 2011 for our budgeted capital expenditures (as discussed in "Capital Requirements and Investing Activities" below). We believe the amounts available to us under our credit facilities and the issuance of debt and equity securities together with this cash provided by operating activities will allow us to meet our needs for working capital, pension contributions, our continuing construction expenditures, anticipated debt redemptions, interest payments on debt obligations, dividend payments and other cash needs through the next several years.
We will continue to evaluate our need to increase available liquidity based on our view of working capital requirements, including the timing of our construction programs and other factors. See Item 1A, "Risk Factors" for additional information on items that could impact our liquidity and capital resource requirements. The following table provides a summary of our operating, investing and financing activities for the last three years.
| |
Fiscal Year | ||||||||||
|---|---|---|---|---|---|---|---|---|---|---|---|
| (in millions) |
2010 | 2009 | 2008 | ||||||||
Cash provided by/(used in): |
|||||||||||
Operating activities |
$ | 138.1 | $ | 129.6 | $ | 93.0 | |||||
Investing activities |
(109.2 | ) | (154.7 | ) | (211.8 | ) | |||||
Financing activities |
(20.0 | ) | 28.0 | 117.5 | |||||||
Net change in cash and cash equivalents |
$ | 8.9 | $ | 2.9 | $ | (1.3 | ) | ||||
50
Cash flow from Operating Activities
We prepare our statement of cash flows using the indirect method. Under this method, we reconcile net income to cash flows from operating activities by adjusting net income for those items that impact net income but may not result in actual cash receipts or payments during the period. These reconciling items include depreciation and amortization, pension costs, deferred income taxes, equity AFUDC, changes in commodity risk management assets and liabilities and changes in the consolidated balance sheet for working capital from the beginning to the end of the period.
Year-over-year changes in our operating cash flows are attributable primarily to working capital changes resulting from the impact of weather, the timing of customer collections, payments for natural gas and coal purchases and the effects of deferred fuel recoveries. The increase in natural gas prices directly impacts the cost of gas stored in inventory. In the third quarter of 2010, we also received a $26.6 million SWPA payment which positively impacted operating cash flows.
2010 compared to 2009. In 2010, our net cash flow provided from operating activities was $138.1 million, an increase of $8.5 million or 6.6% from 2009. This increase was primarily a result of:
- •
- Changes in net income — $6.1 million.
- •
- One-time payment from SWPA for future minimum flow decreases at Ozark Beach hydro plant (see
Note 1 — Other Noncurrent Liabilities of "Notes to Consolidated Financial Statements" under Item 8) — $26.6 million
- •
- Changes in investment tax credits, including the granting of $17.7 million of advanced coal investment tax credits
resulting from a revised MOU from the IRS, offset by changes in deferred income taxes — $11.6 million
- •
- Draw down of the commodity risk management margin accounts through settlement of hedged positions in
2009 — $(8.5) million.
- •
- Changes in seasonal levels of inventory, including the effect of building coal inventories at Plum Point and
Iatan 2 — $(6.2) million.
- •
- Changes in pension and other post retirement benefit costs primarily due to the result of increased pension contributions
of $7.2 million — $(7.8) million.
- •
- Changes in receivables due to seasonal levels of trade accounts receivable, unbilled revenues and income taxes receivable,
offset by insurance proceeds received from the 2009 State Line generator failure — $(14.2) million.
- •
- Changes in prepaid expenses and deferred charges primarily related to changes in deferred fuel costs and non-cash construction accounting (See Note 3 of "Notes to Consolidated Financial Statements" under Item 8) — $(9.9) million.
2009 compared to 2008. In 2009, our net cash flow provided from operating activities was $129.6 million, an increase of $36.6 million or 39.3% from 2008. This increase was primarily a result of:
- •
- Draw down of the commodity risk management margin accounts through settlement of hedged positions —
$10.3 million.
- •
- Decreased cash payments for income taxes, reflecting positive affects for accelerated tax
depreciation — $6.7 million.
- •
- Changes in depreciation and amortization, reflecting collection of deferred ice storm costs from
customers — $3.2 million
- •
- Changes in the levels of accounts receivable and inventory, primarily from lower gas prices — $23.3 million.
51
Capital Requirements and Investing Activities
Our net cash flows used in investing activities decreased $45.5 million from 2009 to 2010. The decrease was primarily the result of a decrease in electric plant additions and replacements, including new generation construction in 2010.
Our net cash flows used in investing activities decreased $57.1 million from 2008 to 2009. The 2008 capital expenditures reflect cash outlays for the December 2007 ice storm. These expenditures were incurred in 2007 but paid in the first quarter of 2008. In addition, expenditures for new generation and distribution and transmission system additions were lower in 2009 than in 2008.
Our capital expenditures totaled approximately $108.2 million, $148.8 million, and $206.4 million in 2010, 2009 and 2008, respectively.
A breakdown of these capital expenditures for 2010, 2009 and 2008 is as follows:
| |
Capital Expenditures | ||||||||||
|---|---|---|---|---|---|---|---|---|---|---|---|
| (in millions) |
2010 | 2009 | 2008 | ||||||||
Distribution and transmission system additions |
$ | 38.8 | $ | 33.7 | $ | 46.8 | |||||
New generation — Plum Point Energy Station |
6.9 | 16.3 | 30.9 | ||||||||
New generation — Iatan 2 |
42.7 | 66.2 | 82.6 | ||||||||
Storms |
0.1 | 6.4 | 4.3 | ||||||||
Additions and replacements — electric plant |
7.2 | 22.8 | 40.2 | ||||||||
Gas segment additions and replacements |
5.0 | 2.1 | 1.9 | ||||||||
Transportation |
1.3 | 1.4 | 1.2 | ||||||||
Other (including retirements and salvage — net)(1) |
3.4 | (1.4 | ) | (3.6 | ) | ||||||
Subtotal |
$ | 105.4 | $ | 147.5 | $ | 204.3 | |||||
Non-regulated capital expenditures (primarily fiber optics) |
2.8 | 1.3 | 2.1 | ||||||||
Subtotal capital expenditures incurred(2) |
$ | 108.2 | $ | 148.8 | $ | 206.4 | |||||
Adjusted for capital expenditures payable(3) |
3.8 | 3.8 | 6.9 | ||||||||
Insurance proceeds receivable |
(0.1 | ) | 5.6 | — | |||||||
Capital lease, primarily Plum Point unit train |
(2.7 | ) | (2.9 | ) | — | ||||||
Total cash outlay |
$ | 109.2 | $ | 155.3 | $ | 213.3 | |||||
- (1)
- Other
includes equity AFUDC of $(4.5) million, $(6.2) million and $(5.9) million for 2010, 2009 and 2008, respectively. 2009 and 2008 also include proceeds
from sale of property of $0.5 million and $1.5 million, respectively.
- (2)
- Expenditures
incurred represent the total cost for work completed for the projects during the year. Discussion of capital expenditures throughout this
10-K is presented on this basis. These capital expenditures include AFUDC, capital expenditures to retire assets and benefits from salvage.
- (3)
- The amount of expenditures paid/(unpaid) at the end of the year to adjust to actual cash outlay reflected in the Investing Activities section of the Statement of Cash Flows.
Approximately 75%, 55% and 23% of our cash requirements for capital expenditures for 2010, 2009 and 2008, respectively, were satisfied internally from operations (funds provided by operating activities less dividends paid). The remaining amounts of such requirements were satisfied from short-term borrowings and proceeds from our sales of common stock and debt securities discussed below.
52
Our estimated capital expenditures (excluding AFUDC) for 2011, 2012 and 2013 are detailed below. See Item 1, "Business — Construction Program." We anticipate that we will spend the following amounts over the next three years for the following projects:
Project
|
2011 | 2012 | 2013 | ||||||||
|---|---|---|---|---|---|---|---|---|---|---|---|
Iatan 2 |
$ | 12.6 | $ | — | $ | — | |||||
Riverton Unit 12 combined cycle conversion |
— | — | 6.7 | ||||||||
Electric distribution system additions |
37.5 | 41.6 | 43.4 | ||||||||
Electric transmission facilities additions |
9.8 | 15.3 | 22.1 | ||||||||
Additions to existing electric generating facilities — Asbury |
3.8 | 42.6 | 81.4 | ||||||||
Other |
42.6 | 28.0 | 35.3 | ||||||||
Total |
$ | 106.3 | $ | 127.5 | $ | 188.9 | |||||
We estimate that internally generated funds will provide approximately 99% of the funds required in 2011 for our budgeted capital expenditures. We intend to utilize a combination of short-term debt, the proceeds of sales of long-term debt and/or common stock (including common stock sold under our Employee Stock Purchase Plan, our Dividend Reinvestment and Stock Purchase Plan, and our 401(k) Plan and our ESOP) if needed to finance additional amounts needed beyond those provided by operating activities for such capital expenditures. We will continue to utilize short-term debt as needed to support normal operations or other temporary requirements. The estimates herein may be changed because of changes we make in our construction program, unforeseen construction costs, our ability to obtain financing, regulation and for other reasons. See further discussion under "Financing Activities" below.
Our net cash flows provided by financing activities decreased $48.0 million to ($20.0) million during 2010 as compared to $28.0 million in 2009, primarily due to a decrease in proceeds (net of repayments of long-term debt) received from new issuances of long-term debt and equity as described below and increased dividends.
Our net cash flows provided by financing activities decreased $89.5 million to $28.0 million during 2009 as compared to $117.5 million in 2008, primarily due to a decrease in proceeds (net of repayments) of short-term debt borrowings in 2009.
On August 25, 2010, we issued $50 million principal amount of 5.20% first mortgage bonds due September 1, 2040. The net proceeds (after payment of expenses) of approximately $49.1 million were used to redeem $48.3 million aggregate principal amount of our Senior Notes, 7.05% Series due 2022 on August 27, 2010.
On May 28, 2010, we issued $100 million principal amount of 4.65% first mortgage bonds due June 1, 2020. The net proceeds (after payment of expenses) of approximately $98.8 million, were used to redeem all 2 million outstanding shares of our 8.5% trust preferred securities, totaling $50 million, on June 28, 2010, and to repay short-term debt which was incurred, in part, to fund the repayment, at maturity, of our 6.5% first mortgage bonds due 2010.
On February 25, 2009, we entered into an equity distribution agreement with UBS Securities LLC (UBS). Under the terms of the agreement, as amended, we could offer and sell shares of our common stock, par value $1.00 per share, having an aggregate offering amount of up to $120 million from time to time through UBS, as sales agent. We successfully completed our equity distribution program during the second quarter of 2010 and used the net proceeds to repay short-term debt and for general corporate purposes, including the funding of our current construction program. During 2010, we issued and sold 2,870,985 shares of our common stock pursuant to this equity distribution program, at an average price per share of $18.41, resulting in net proceeds to us of approximately $51.3 million. Since inception of the
53
program, in the aggregate, we issued and sold 6,535,216 shares pursuant to the program, at an average price per share of $18.36, resulting in net proceeds to us of approximately $116.0 million.
On March 27, 2009, we issued $75 million principal amount of 7% first mortgage bonds due April 1, 2024. The net proceeds (after payment of expenses) of approximately $72.6 million were used to repay short-term debt incurred, in part, to fund our current construction program.
On May 16, 2008, we issued $90 million principal amount of first mortgage bonds. The net proceeds of approximately $89.4 million, less $0.4 million of legal and other financing fees, were added to our general funds and used primarily to pay down short-term indebtedness incurred, in part, as a result of our on-going construction program.
On January 28, 2011, we filed a $400 million shelf registration statement with the SEC covering our common stock, unsecured debt securities, preference stock, and first mortgage bonds. This shelf registration statement became effective on February 7, 2011. We plan to use proceeds under this shelf to fund capital expenditures, refinancings of existing debt or general corporate needs when needed during the effective period. The issuance of securities under this shelf is subject to the receipt of local regulatory approvals.
On January 26, 2010, we entered into the Second Amended and Restated Unsecured Credit Agreement which amended and restated our revolving credit facility. This agreement extends the termination date of the revolving credit facility from July 15, 2010 to January 26, 2013. In addition, the pricing and fees under the facility were amended. Interest on borrowings under the facility accrues at a rate equal to, at our option, (i) the highest of (A) the bank's prime commercial rate, (B) the federal funds effective rate plus 0.5% or (C) one month LIBOR plus 1.0%, plus a margin or (ii) one month, two month or three month LIBOR, in each case, plus a margin. Each margin is based on our current credit ratings and the pricing schedule in the facility. As of the date hereof, and based on our current credit ratings, the LIBOR margin under the facility increased from 0.80% to 2.70%. A facility fee is payable quarterly on the full amount of the commitments under the facility and a usage fee is payable on the full amount of the commitments under the facility for any period in which we have drawn less than 33% of the total revolving commitments under the facility, in each case based on our current credit ratings. In addition, upon entering into the amended and restated facility, we paid an upfront fee to the revolving credit banks of $900,000 in the aggregate. The aggregate amount of the revolving commitments remained unchanged at $150 million and there were no other material changes to the terms of the facility.
The facility is used for working capital, general corporate purposes and to back-up our use of commercial paper. This facility requires our total indebtedness to be less than 62.5% of our total capitalization at the end of each fiscal quarter and our EBITDA (defined as net income plus interest, taxes, depreciation and amortization) to be at least two times our interest charges for the trailing four fiscal quarters at the end of each fiscal quarter. Failure to maintain these ratios will result in an event of default under the credit facility and will prohibit us from borrowing funds thereunder. As of December 31, 2010, we are in compliance with these ratios. Our total indebtedness is 52.2% of our total capitalization as of December 31, 2010 and our EBITDA is 5.0 times our interest charges. This credit facility is also subject to cross-default if we default on in excess of $10 million in the aggregate on our other indebtedness. This arrangement does not serve to legally restrict the use of our cash in the normal course of operations. There were no outstanding borrowings under this agreement at December 31, 2010. However, $24.0 million was used to back up our outstanding commercial paper.
On March 11, 2009, we entered into a $50 million unsecured credit agreement. This agreement, which terminated on July 15, 2010, provided for $50 million of revolving loans to be available to us for working capital, general corporate purposes and to back-up our use of commercial paper and was in addition to, and had substantially identical covenants and terms as (other than pricing) our Second Amended and Restated Unsecured Credit Agreement dated January 26, 2010 discussed above.
54
The principal amount of all series of first mortgage bonds outstanding at any one time under the EDE Mortgage is limited by terms of the mortgage to $1 billion. Substantially all of the property, plant and equipment of The Empire District Electric Company (but not its subsidiaries) is subject to the lien of the EDE Mortgage. Restrictions in the EDE mortgage bond indenture could affect our liquidity. The EDE Mortgage contains a requirement that for new first mortgage bonds to be issued, our net earnings (as defined in the EDE Mortgage) for any twelve consecutive months within the fifteen months preceding issuance must be two times the annual interest requirements (as defined in the EDE Mortgage) on all first mortgage bonds then outstanding and on the prospective issue of new first mortgage bonds. Our earnings for the year ended December 31, 2010 would permit us to issue approximately $362.3 million of new first mortgage bonds based on this test with an assumed interest rate of 6.0%. In addition to the interest coverage requirement, the EDE Mortgage provides that new bonds must be issued against, among other things, retired bonds or 60% of net property additions. At December 31, 2010, we had retired bonds and net property additions which would enable the issuance of at least $634.0 million principal amount of bonds if the annual interest requirements are met. As of December 31, 2010, we are in compliance with all restrictive covenants of the EDE Mortgage.
The principal amount of all series of first mortgage bonds outstanding at any one time under the EDG Mortgage is limited by terms of the mortgage to $300 million. Substantially all of the property, plant and equipment of The Empire District Gas Company is subject to the lien of the EDG Mortgage. The EDG Mortgage contains a requirement that for new first mortgage bonds to be issued, the amount of such new first mortgage bonds shall not exceed 75% of the cost of property additions acquired after the date of the Missouri Gas acquisition. The mortgage also contains a limitation on the issuance by EDG of debt (including first mortgage bonds, but excluding short-term debt incurred in the ordinary course under working capital facilities) unless, after giving effect to such issuance, EDG's ratio of EBITDA (defined as net income plus interest, taxes, depreciation, amortization and certain other non-cash charges) to interest charges for the most recent four fiscal quarters is at least 2.0 to 1. As of December 31, 2010, this test would allow us to issue approximately $8.3 million principal amount of new first mortgage bonds.
Currently, our corporate credit ratings and the ratings for our securities are as follows:
| |
Fitch | Moody's | Standard & Poor's | |||
|---|---|---|---|---|---|---|
Corporate Credit Rating |
n/r* | Baa2 | BBB- | |||
First Mortgage Bonds |
BBB+ | A3 | BBB+ | |||
Senior Notes |
BBB | Baa2 | BBB- | |||
Commercial Paper |
F2 | P-2 | A-3 | |||
Outlook |
Stable | Stable | Stable |
- *
- Not rated.
On March 24, 2010, Standard & Poor's issued a report with our ratings unchanged and upgraded our business profile to "excellent" from "strong". On May 14, 2010, Moody's upgraded our First Mortgage Bonds from Baa1 to A3 and upgraded its outlook from negative to stable. Moody's affirmed all of our other ratings. On April 1, 2010, Fitch affirmed our ratings and revised their rating outlook to stable. The revision took into consideration the anticipated completion of our five-year baseload capital expenditure program in 2010 and assumes we will receive timely and adequate regulatory recovery of newly completed investments.
A security rating is not a recommendation to buy, sell or hold securities. Each rating is subject to revision or withdrawal at any time by the assigning rating organization. Each security rating agency has its own methodology for assigning ratings, and, accordingly, each rating should be considered independently of all other ratings.
55
Set forth below is information summarizing our contractual obligations as of December 31, 2010. Not included in these amounts are expected obligations associated with our share of the Iatan 2 construction for which we have not yet been billed. Other pension and postretirement benefit plans are funded on an ongoing basis to match their corresponding costs, per regulatory requirements and have been estimated for 2011-2015 as noted below.
| |
Payments Due By Period (in millions) |
|||||||||||||||
|---|---|---|---|---|---|---|---|---|---|---|---|---|---|---|---|---|
Contractual Obligations(1)
|
Total | Less Than 1 Year |
1-3 Years | 3-5 Years | More Than 5 Years |
|||||||||||
Long-term debt (w/o discount) |
$ | 689.8 | $ | 0.6 | $ | 112.3 | $ | — | $ | 576.9 | ||||||
Interest on long-term debt |
626.5 | 40.1 | 77.6 | 69.9 | 438.9 | |||||||||||
Short-term debt |
24.0 | 24.0 | — | — | — | |||||||||||
Capital lease obligations |
8.1 | 0.6 | 1.2 | 1.1 | 5.2 | |||||||||||
Operating lease obligations(2) |
6.6 | 1.0 | 1.7 | 1.4 | 2.5 | |||||||||||
Electric purchase obligations(3) |
338.0 | 80.5 | 118.6 | 71.6 | 67.3 | |||||||||||
Gas purchase obligations(4) |
50.3 | 9.1 | 14.8 | 12.6 | 13.8 | |||||||||||
Open purchase orders |
19.0 | 18.8 | 0.1 | — | 0.1 | |||||||||||
Postretirement benefit obligation funding |
26.1 | 5.7 | 11.0 | 9.4 | — | |||||||||||
Pension benefit funding |
79.3 | 18.2 | 30.8 | 30.3 | — | |||||||||||
Other long-term liabilities(5) |
3.5 | 0.1 | 0.3 | 0.3 | 2.8 | |||||||||||
TOTAL CONTRACTUAL OBLIGATIONS(6) |
$ | 1,871.2 | $ | 198.7 | $ | 368.4 | $ | 196.6 | $ | 1,107.5 | ||||||
- (1)
- Some
of our contractual obligations have price escalations based on economic indices, but we do not anticipate these escalations to be
significant.
- (2)
- Excludes
payments under our Elk River Wind Farm, LLC and Cloud County Wind Farm, LLC agreements, as payments are contingent upon output of the
facilities. Payments under the Elk River Wind Farm, LLC agreement can run from zero up to a maximum of approximately $16.9 million per year based on a 20 year average cost and an
annual output of 550,000 megawatt hours. Payments under the Meridian Way Wind Farm agreement can range from zero to a maximum of approximately $14.6 million per year based on a
20-year average cost.
- (3)
- Includes
a water usage contract for our SLCC facility, fuel and purchased power contracts and associated transportation costs, as well as purchased power
for 2011 through 2015 for Plum Point.
- (4)
- Represents
fuel contracts and associated transportation costs of our gas segment.
- (5)
- Other
long-term liabilities primarily represent electric facilities charges paid to City Utilities of Springfield, Missouri of $11,000 per month
over 30 years.
- (6)
- Our estimate of uncertain tax liabilities totaled $0.4 million at December 31, 2010. Due to the uncertainties surrounding this estimate, we cannot reasonably estimate the timing of potential payments, if any, and have not included any in the table above.
Holders of our common stock are entitled to dividends if, as, and when declared by the Board of Directors, out of funds legally available therefore, subject to the prior rights of holders of any outstanding cumulative preferred stock and preference stock. Payment of dividends is determined by our Board of Directors after considering all relevant factors, including the amount of our retained earnings (which is essentially our accumulated net income less dividend payouts). As of December 31, 2010, our retained earnings balance was $5.5 million, compared to $10.1 million as of December 31, 2009, after paying out
56
$52.0 million in dividends during 2010. A reduction of our dividend per share, partially or in whole, could have an adverse effect on our common stock price. On February 3, 2011, the Board of Directors declared a quarterly dividend of $0.32 per share on common stock payable March 15, 2011 to holders of record as of March 1, 2011.
Our diluted earnings per share were $1.17 for the year ended December 31, 2010 and were $1.18 and $1.17 for the years ended December 31, 2009 and 2008, respectively. Dividends paid per share were $1.28 for the year ended December 31, 2010 and for each of the years ended December 31, 2009 and 2008.
Under Kansas corporate law, our Board of Directors may only declare and pay dividends out of our surplus or, if there is no surplus, out of our net profits for the fiscal year in which the dividend is declared or the preceding fiscal year, or both. Our surplus, under Kansas law, is equal to our retained earnings plus accumulated other comprehensive income/(loss), net of income tax. However, Kansas law does permit, under certain circumstances, our Board of Directors to transfer amounts from capital in excess of par value to surplus. In addition, Section 305(a) of the Federal Power Act (FPA) prohibits the payment by a utility of dividends from any funds "properly included in capital account". There are no additional rules or regulations issued by the FERC under the FPA clarifying the meaning of this limitation. However, several decisions by the FERC on specific dividend proposals suggest that any determination would be based on a fact-intensive analysis of the specific facts and circumstances surrounding the utility and the dividend in question, with particular focus on the impact of the proposed dividend on the liquidity and financial condition of the utility.
In addition, the EDE Mortgage and our Restated Articles contain certain dividend restrictions. The most restrictive of these is contained in the EDE Mortgage, which provides that we may not declare or pay any dividends (other than dividends payable in shares of our common stock) or make any other distribution on, or purchase (other than with the proceeds of additional common stock financing) any shares of, our common stock if the cumulative aggregate amount thereof after August 31, 1944 (exclusive of the first quarterly dividend of $98,000 paid after said date) would exceed the sum of $10.75 million and the earned surplus (as defined in the EDE Mortgage) accumulated subsequent to August 31, 1944, or the date of succession in the event that another corporation succeeds to our rights and liabilities by a merger or consolidation. On March 11, 2008, we amended the EDE Mortgage in order to provide us with more flexibility to pay dividends to our shareholders by increasing the basket available to pay dividends by $10.75 million, as described above. As of December 31, 2010, this restriction did not prevent us from issuing dividends.
OFF-BALANCE SHEET ARRANGEMENTS
We have no off-balance sheet arrangements that have or are reasonably likely to have a current or future effect on our financial condition, changes in financial condition, revenues or expenses, results of operations, liquidity, capital expenditures or capital resources, other than operating leases entered into in the normal course of business.
Set forth below are certain accounting policies that are considered by management to be critical and that typically require difficult, subjective or complex judgments, often as a result of the need to make estimates about the effect of matters that are inherently uncertain (other accounting policies may also require assumptions that could cause actual results to be different than anticipated results). A change in assumptions or judgments applied in determining the following matters, among others, could have a material impact on future financial results.
Pensions and Other Postretirement Benefits (OPEB). We recognize expense related to pension and postretirement benefits as earned during the employee's period of service. Related assets and liabilities are established based upon the funded status of the plan compared to the accumulated benefit obligation. Our
57
pension and OPEB expense or benefit includes amortization of previously unrecognized net gains or losses. Additional income or expense may be recognized when our unrecognized gains or losses as of the most recent measurement date exceed 10% of our postretirement benefit obligation or fair value of plan assets, whichever is greater. For pension benefits and OPEB benefits, unrecognized net gains or losses as of the measurement date are amortized into actuarial expense over ten years.
In our 2005 electric Missouri Rate Case, the MPSC ruled that we would be allowed to recover pension costs consistent with our GAAP policy noted above. In accordance with the rate order, we prospectively calculated the value of plan assets using a market related value method as allowed by the Accounting Standard Codification (ASC) guidance on defined benefit plans disclosure.
The MPSC ruling also allowed us to record the Missouri portion of any costs above or below the amount included in rates as a regulatory asset or liability, respectively. Therefore, the deferral of these costs began in the second quarter of 2005. In our 2006 Kansas Rate Case, the KCC also ruled that we would be allowed to change our recognition of pension costs, deferring the Kansas portion of any costs above or below the amount included in our rate case as a regulatory asset or liability. In our agreement with the MPSC regarding the purchase of Missouri Gas by EDG, we were allowed to adopt this pension cost recovery methodology for EDG, as well. Also, it was agreed that the effects of purchase accounting entries related to pension and other post-retirement benefits would be recoverable in future rate proceedings. Thus the fair value adjustment acquisition entries have been recorded as regulatory assets, as we believe these amounts are probable of recovery in future rates. The regulatory asset is reduced by an amount equal to the difference between the regulatory costs and the estimated GAAP costs. The difference between this total and the costs being recovered from customers will be deferred as a regulatory asset or liability in accordance with the ASC guidance on regulated operations, and recovered over a period of 5 years. We now expect future pension expense or benefits are probable of full recovery in rates charged to our Missouri and Kansas customers, thus lowering our sensitivity to accounting risks and uncertainties.
Our 2006 Missouri rate case order and our 2010 Kansas rate order allow us to defer any OPEB cost that is different from those allowed recovery in rate cases. This treatment is similar to treatment afforded pension costs. This includes the use of a market-related value of assets, the amortization of unrecognized gains or losses into expense over ten years and the recognition of regulatory assets and liabilities as described in the immediately preceding paragraph.
Based on the regulatory treatment of pension and OPEB recovery afforded in our jurisdictions, we have concluded that the amount of unfunded defined benefit pension and postretirement plan obligations will be recorded as regulatory assets on our balance sheet rather than as reductions of equity through comprehensive income.
Our funding policy is to contribute annually an amount at least equal to the actuarial cost of pension and postretirement benefits. See Note 8 of "Notes to Consolidated Financial Statements" under Item 8.
Risks and uncertainties affecting the application of our pension accounting policy include: future rate of return on plan assets, interest rates used in valuing benefit obligations (i.e. discount rates), demographic assumptions (i.e. mortality and retirement rates) and employee compensation trend rates. Factors that could result in additional pension expense and/or funding include: a lower discount rate than estimated, higher compensation rate increases, lower return on plan assets, and longer retirement periods.
Risks and uncertainties affecting the application of our OPEB accounting policy and related funding include: future rate of return on plan assets, interest rates used in valuing benefit obligations (i.e. discount rates), healthcare cost trend rates, Medicare prescription drug costs and demographic assumptions (i.e. mortality and retirement rates). See Note 1 and Note 8 of "Notes to Consolidated Financial Statements" under Item 8 for further information.
58
Hedging Activities. We engage in hedging activities in an effort to minimize our risk from volatile natural gas prices. We enter into both physical and financial contracts with counterparties relating to our future natural gas requirements that lock in prices (with respect to a range of predetermined percentages of our expected future natural gas needs) in an attempt to lessen the volatility in our fuel expenditures and gain predictability. We recognize that if risk is not timely and adequately balanced or if counterparties fail to perform contractual obligations, actual results could differ materially from intended results.
As of December 31, 2010, all derivative instruments are recognized at fair value on the balance sheet with unrealized gains and losses deferred as a regulatory asset or liability, due to our fuel recovery mechanisms for our electric segment and our gas segment. For all our derivative contracts, once settled, the realized gain or loss is recorded to fuel expense and is subject to our fuel adjustment clause mechanisms. Missouri, our largest electric jurisdiction, permits the distribution to customers of 95% of the changes in fuel and purchased power costs prudently incurred above or below the base cost.
Risks and uncertainties affecting the application of this accounting policy include: market conditions in the energy industry, especially the effects of price volatility, regulatory and global political environments and requirements, fair value estimations on longer term contracts, the effectiveness of the derivative instrument in hedging the change in fair value of the hedged item, estimating underlying fuel demand and counterparty ability to perform. If we estimate that we have overhedged forecasted demand, the gain or loss on the overhedged portion will be recognized immediately in our Consolidated Statement of Income and then deferred to a regulatory asset or liability, given it is probable of recovery through our fuel adjustment mechanisms. See Note 14 of "Notes to Consolidated Financial Statements" under Item 8 for detailed information regarding our hedging information.
Regulatory Assets and Liabilities. In accordance with the ASC accounting guidance for regulated activities, our financial statements reflect ratemaking policies prescribed by the regulatory commissions having jurisdiction over us (Missouri, Kansas, Arkansas, Oklahoma and FERC).
In accordance with accounting guidance for regulated activities, we record a regulatory asset for all or part of an incurred cost that would otherwise be charged to expense in accordance with the accounting guidance, which requires that an asset be recorded if it is probable that future revenue in an amount at least equal to the capitalized cost will be allowable for costs for rate making purposes and the current available evidence indicates that future revenue will be provided to permit recovery of the cost. Additionally, we follow the accounting guidance for regulated activities which says that a liability should be recorded when a regulator has provided current recovery for a cost that is expected to be incurred in the future. We follow this guidance for incurred costs or credits that are subject to future recovery from or refund to our customers in accordance with the orders of our regulators.
Historically, all costs of this nature, which are determined by our regulators to have been prudently incurred, have been recoverable through rates in the course of normal ratemaking procedures. Regulatory assets and liabilities are ratably eliminated through a charge or credit, respectively, to earnings while being recovered in revenues and fully recognized if and when it is no longer probable that such amounts will be recovered through future revenues. We continually assess the recoverability of our regulatory assets. Although we believe it unlikely, should retail electric competition legislation be passed in the states we serve, we may determine that we no longer meet the criteria set forth in the ASC accounting guidance for regulated activities with respect to continued recognition of some or all of the regulatory assets and liabilities. Any regulatory changes that would require us to discontinue application of ASC accounting guidance for regulated activities based upon competitive or other events may also impact the valuation of certain utility plant investments. Impairment of regulatory assets or utility plant investments could have a material adverse effect on our financial condition and results of operations.
As of December 31, 2010, we have recorded $194.4 million in regulatory assets and $88.8 million as regulatory liabilities. See Note 3 of "Notes to Consolidated Financial Statements" under Item 8 for detailed information regarding our regulatory assets and liabilities.
59
Risks and uncertainties affecting the application of this accounting policy include: regulatory environment, external regulatory decisions and requirements, anticipated future regulatory decisions and their impact of deregulation and competition on ratemaking process, unexpected disallowances, possible changes in accounting standards (including as a result of adoption of IFRS) and the ability to recover costs.
Unbilled Revenue. At the end of each period we estimate, based on expected usage, the amount of revenue to record for energy and natural gas that has been provided to customers but not billed. Risks and uncertainties affecting the application of this accounting policy include: projecting customer energy usage, estimating the impact of weather and other factors that affect usage (such as line losses) for the unbilled period and estimating loss of energy during transmission and delivery.
Contingent Liabilities. We are a party to various claims and legal proceedings arising in the ordinary course of our business, which are primarily related to workers' compensation and public liability. We regularly assess our insurance deductibles, analyze litigation information with our attorneys and evaluate our loss experience. Based on our evaluation as of the end of 2010, we believe that we have accrued liabilities in accordance with ASC accounting guidance sufficient to meet potential liabilities that could result from these claims. This liability at December 31, 2010 and 2009 was $3.4 million and $3.1 million, respectively.
Risks and uncertainties affecting these assumptions include: changes in estimates on potential outcomes of litigation and potential litigation yet unidentified in which we might be named as a defendant.
Goodwill. As of December 31, 2010, the consolidated balance sheet included $39.5 million of goodwill. All of this goodwill was derived from our gas acquisition and recorded in our gas segment, which is also the reporting unit for goodwill testing purposes. Accounting guidance requires us to test goodwill for impairment on an annual basis or whenever events or circumstances indicate possible impairment. Absent an indication of fair value from a potential buyer or a similar specific transaction, a combination of the market and income approaches is used to estimate the fair value of goodwill.
We use the market approach which estimates fair value of the gas reporting unit by comparing certain financial metrics to comparable companies. Comparable companies whose securities are actively traded in the public market are judgmentally selected by management based on operational and economic similarities. We utilize EBITDA (earnings before interest, taxes, depreciation, and amortization) multiples of the comparable companies in relation to the EBITDA results of the gas reporting unit to determine an estimate of fair value.
We also utilize a valuation technique under the income approach which estimates the discounted future cash flows of operations. Our procedures include developing a baseline test and performing sensitivity analysis to calculate a reasonable valuation range. The sensitivities are derived from altering those assumptions which are subjective in nature and inherent to a discounted cash flows calculation. Other qualitative factors and comparisons to industry peers are also used to further support the assumptions and ultimately the overall evaluation. A key qualitative assumption considered in our evaluation is the impact of regulation, including rate regulation and cost recovery for the gas reporting unit. Some of the key quantitative assumptions included in our tests involve: regulatory rate design and results; the discount rate; the growth rate; capital spending rates and terminal value calculations. We believe it is unlikely that a change to one of these key assumptions, by itself, would be significant enough to result in an impairment charge. However, if significant negative changes occurred to multiple key assumptions, an impairment charge could result. With the exception of the capital spending rate, the key assumptions noted are significantly determined by market factors and significant changes in market factors that impact the gas reporting unit would likely be mitigated by our current and future regulatory rate design to some extent. Other risks and uncertainties affecting these assumptions include: management's identification of impairment indicators, changes in business, industry, laws, technology and economic conditions. Actual results for the gas reporting unit indicate a recent decline in gas customer growth and
60
demand, but this was anticipated in our assumptions for purposes of the discounted cash flow calculation. Our forecasts anticipate the customer contraction will minimize in the near future and return to positive customer growth within the next few years.
We weight the results of the two approaches discussed above in order to estimate the fair value of the gas reporting unit. Our annual test performed as of October 31, 2010 indicated the estimated fair market value of the gas reporting unit to be 10 – 15% higher than its carrying value at that time. While we believe the assumptions utilized in our analysis were reasonable, significant adverse developments in future periods could negatively impact goodwill impairment considerations, which could adversely impact earnings.
Use of Management's Estimates. The preparation of our consolidated financial statements in conformity with generally accepted accounting principles (GAAP) requires management to make estimates and assumptions that affect the reported amounts of assets, liabilities, revenues and expenses, and related disclosure of contingent assets and liabilities at the date of the financial statements and the reported amounts of revenues and expenses during the reporting period. We evaluate our estimates on an on-going basis, including those related to unbilled utility revenues, collectibility of accounts receivable, depreciable lives, asset impairment and goodwill evaluations, employee benefit obligations, contingent liabilities, asset retirement obligations, the fair value of stock based compensation and tax provisions. Actual amounts could differ from those estimates.
RECENTLY ISSUED ACCOUNTING STANDARDS
See Note 1 of "Notes to Consolidated Financial Statements" under Item 8 for further information regarding Recently Issued and Proposed Accounting Standards.
61
ITEM 7A. QUANTITATIVE AND QUALITATIVE DISCLOSURES ABOUT MARKET RISK
Our fuel procurement activities involve primary market risk exposures, including commodity price risk and credit risk. Commodity price risk is the potential adverse price impact related to the fuel procurement for our generating units. Credit risk is the potential adverse financial impact resulting from non-performance by a counterparty of its contractual obligations. Additionally, we are exposed to interest rate risk which is the potential adverse financial impact related to changes in interest rates.
Market Risk and Hedging Activities. Prices in the wholesale power markets often are extremely volatile. This volatility impacts our cost of power purchased and our participation in energy trades. If we were unable to generate an adequate supply of electricity for our customers, we would attempt to purchase power from others. Such supplies are not always available. In addition, congestion on the transmission system can limit our ability to make purchases from (or sell into) the wholesale markets.
We engage in physical and financial trading activities with the goals of reducing risk from market fluctuations. In accordance with our established Energy Risk Management Policy, which typically includes entering into various derivative transactions, we attempt to mitigate our commodity market risk. Derivatives are utilized to manage our gas commodity market risk and to help manage our exposure resulting from purchasing most of our natural gas on the volatile spot market for the generation of power for our native-load customers. See Note 14 of "Notes to Consolidated Financial Statements" under Item 8 for further information.
Commodity Price Risk. We are exposed to the impact of market fluctuations in the price and transportation costs of coal, natural gas, and electricity and employ established policies and procedures to manage the risks associated with these market fluctuations, including utilizing derivatives.
We satisfied 62.3% of our 2010 generation fuel supply need through coal. Approximately 92% of our 2010 coal supply was Western coal. We have contracts and binding proposals to supply a portion of the fuel for our coal plants through 2013. These contracts satisfy approximately 100% of our anticipated fuel requirements for 2011, 65% for 2012, 61% for 2013 and 31% for our 2014 requirements for our Asbury and Riverton coal plants. In order to manage our exposure to fuel prices, future coal supplies will be acquired using a combination of short-term and long-term contracts.
We are exposed to changes in market prices for natural gas we must purchase to run our combustion turbine generators. Our natural gas procurement program is designed to manage our costs to avoid volatile natural gas prices. We enter into physical forward and financial derivative contracts with counterparties relating to our future natural gas requirements that lock in prices (with respect to predetermined percentages of our expected future natural gas needs) in an attempt to lessen the volatility in our fuel expenditures and improve predictability. As of February 4, 2011, 88%, or 5.0 million Dths's, of our anticipated volume of natural gas usage for our electric operations for 2011 is hedged. See Note 14 of "Notes to Consolidated Financial Statements" under Item 8 for further information.
Based on our expected natural gas purchases for our electric operations for 2011, if average natural gas prices should increase 10% more in 2011 than the price at December 31, 2010, our natural gas expenditures would increase by approximately $0.3 million based on our December 31, 2010 total hedged positions for the next twelve months. However, such an increase would be probable of recovery through fuel adjustment mechanisms. With the addition of the Missouri fuel adjustment mechanism effective September 1, 2008, we now have a fuel cost recovery mechanism in all of our jurisdictions, which significantly reduces the impact of fluctuating fuel costs.
We attempt to mitigate a portion of our natural gas price risk associated with our gas segment using physical forward purchase agreements, storage and derivative contracts. As of February 5, 2011, we have 0.6 million Dths in storage on the three pipelines that serve our customers. This represents 28% of our storage capacity. We have an additional 0.7 million Dths hedged through financial derivatives and physical contracts. Our long-term hedge strategy is to mitigate price volatility for our customers by hedging a
62
minimum of 50% of the current year, up to 50% of the second year and up to 20% of third year expected gas usage by the beginning of the ACA year at September 1. However, due to purchased natural gas cost recovery mechanisms for our retail customers, fluctuations in the cost of natural gas have little effect on income.
Credit Risk. In order to minimize overall credit risk, we maintain credit policies, including the evaluation of counterparty financial condition and the use of standardized agreements that facilitate the netting of cash flows associated with a single counterparty. See Note 14 of "Notes to Consolidated Financial Statements (Unaudited)" regarding agreements containing credit risk contingent features. In addition, certain counterparties make available collateral in the form of cash held as margin deposits as a result of exceeding agreed-upon credit exposure thresholds or may be required to prepay the transaction. Conversely, we are required to post collateral with counterparties at certain thresholds, which is typically the result of changes in commodity prices. Amounts reported as margin deposit liabilities represent counterparty funds we hold that result from various trading counterparties exceeding agreed-upon credit exposure thresholds. Amounts reported as margin deposit assets represent our funds held on deposit for our NYMEX contracts with our broker and other financial contracts with other counterparties that resulted from us exceeding agreed-upon credit limits established by the counterparties. The following table depicts our margin deposit assets at December 31, 2010 and December 31, 2009. There were no margin deposit liabilities at these dates.
| (in millions) |
2010 | 2009 | |||||
|---|---|---|---|---|---|---|---|
Margin deposit assets |
$ | 3.9 | $ | 2.9 | |||
Our exposure to credit risk is concentrated primarily within our fuel procurement process, as we transact with a smaller, less diverse group of counterparties and transactions may involve large notional volumes and potentially volatile commodity prices. Below is a table showing our net credit exposure at December 31, 2010, reflecting that our counterparties are exposed to Empire for the net unrealized mark-to-market losses for physical forward and financial natural gas contracts carried at fair value.
| (in millions) |
|
|||
|---|---|---|---|---|
Net unrealized mark-to-market losses for physical forward natural gas contracts |
$ | 15.2 | ||
Net unrealized mark-to-market losses for financial natural gas contracts |
4.3 | |||
Net credit exposure |
$ | 19.5 | ||
The $4.3 million net unrealized mark-to-market loss for financial natural gas contracts is comprised of $4.3 million of exposure to counterparties of Empire for unrealized losses and no exposure to Empire of unrealized gains. We are holding no collateral from any counterparty since we are below the $10 million mark-to-market collateral threshold in our agreements. As noted above, as of December 31, 2010, we have $3.9 million on deposit for NYMEX contract exposure to Empire, of which $3.5 million represents our collateral requirement. If NYMEX gas prices decreased 25% from their December 31, 2010 levels, our collateral requirement would increase $2.2 million. If these prices increased 25%, our collateral requirement would decrease $2.7 million.
We sell electricity and gas and provide distribution and transmission services to a diverse group of customers, including residential, commercial and industrial customers. Credit risk associated with trade accounts receivable from energy customers is limited due to the large number of customers. In addition, we enter into contracts with various companies in the energy industry for purchases of energy-related commodities, including natural gas in our fuel procurement process.
Interest Rate Risk. We are exposed to changes in interest rates as a result of financing through our issuance of commercial paper and other short-term debt. We manage our interest rate exposure by limiting our variable-rate exposure (applicable to commercial paper and borrowings under our unsecured credit
63
agreement) to a certain percentage of total capitalization, as set by policy, and by monitoring the effects of market changes in interest rates. See Notes 6 and 7 of "Notes to Consolidated Financial Statements" under Item 8 for further information.
If market interest rates average 1% more in 2011 than in 2010, our interest expense would increase, and income before taxes would decrease by less than $0.5 million. This amount has been determined by considering the impact of the hypothetical interest rates on our highest month-end commercial paper balance for 2010. These analyses do not consider the effects of the reduced level of overall economic activity that could exist in such an environment. In the event of a significant change in interest rates, management would likely take actions to further mitigate its exposure to the change. However, due to the uncertainty of the specific actions that would be taken and their possible effects, the sensitivity analysis assumes no changes in our financial structure.
64
ITEM 8. FINANCIAL STATEMENTS AND SUPPLEMENTARY DATA
REPORT OF INDEPENDENT REGISTERED PUBLIC ACCOUNTING FIRM
To
the Board of Directors and Stockholders
of the Empire District Electric Company:
In our opinion, the consolidated financial statements listed in the index appearing under Item 15 present fairly, in all material respects, the financial position of The Empire District Electric Company and its subsidiaries at December 31, 2010 and 2009, and the results of their operations and their cash flows for each of the three years in the period ended December 31, 2010 in conformity with accounting principles generally accepted in the United States of America. In addition, in our opinion, the financial statement schedule listed in the index appearing under Item 15 presents fairly, in all material respects, the information set forth therein when read in conjunction with the related consolidated financial statements. Also in our opinion, the Company maintained, in all material respects, effective internal control over financial reporting as of December 31, 2010, based on criteria established in Internal Control — Integrated Framework issued by the Committee of Sponsoring Organizations of the Treadway Commission (COSO). The Company's management is responsible for these financial statements and financial statement schedule, for maintaining effective internal control over financial reporting and for its assessment of the effectiveness of internal control over financial reporting, included in the accompanying Management's Report on Internal Control Over Financial Reporting. Our responsibility is to express opinions on these financial statements, on the financial statement schedule, and on the Company's internal control over financial reporting based on our integrated audits. We conducted our audits in accordance with the standards of the Public Company Accounting Oversight Board (United States). Those standards require that we plan and perform the audits to obtain reasonable assurance about whether the financial statements are free of material misstatement and whether effective internal control over financial reporting was maintained in all material respects. Our audits of the financial statements included examining, on a test basis, evidence supporting the amounts and disclosures in the financial statements, assessing the accounting principles used and significant estimates made by management, and evaluating the overall financial statement presentation. Our audit of internal control over financial reporting included obtaining an understanding of internal control over financial reporting, assessing the risk that a material weakness exists, and testing and evaluating the design and operating effectiveness of internal control based on the assessed risk. Our audits also included performing such other procedures as we considered necessary in the circumstances. We believe that our audits provide a reasonable basis for our opinions.
A company's internal control over financial reporting is a process designed to provide reasonable assurance regarding the reliability of financial reporting and the preparation of financial statements for external purposes in accordance with generally accepted accounting principles. A company's internal control over financial reporting includes those policies and procedures that (i) pertain to the maintenance of records that, in reasonable detail, accurately and fairly reflect the transactions and dispositions of the assets of the company; (ii) provide reasonable assurance that transactions are recorded as necessary to permit preparation of financial statements in accordance with generally accepted accounting principles, and that receipts and expenditures of the company are being made only in accordance with authorizations of management and directors of the company; and (iii) provide reasonable assurance regarding prevention or timely detection of unauthorized acquisition, use, or disposition of the company's assets that could have a material effect on the financial statements.
Because of its inherent limitations, internal control over financial reporting may not prevent or detect misstatements. Also, projections of any evaluation of effectiveness to future periods are subject to the risk that controls may become inadequate because of changes in conditions, or that the degree of compliance with the policies or procedures may deteriorate.
PricewaterhouseCoopers LLP
St. Louis, Missouri
February 17, 2011
65
THE EMPIRE DISTRICT ELECTRIC COMPANY
CONSOLIDATED BALANCE SHEETS
| |
December 31, | |||||||
|---|---|---|---|---|---|---|---|---|
| |
2010 | 2009 | ||||||
| |
($-000's) |
|||||||
Assets |
||||||||
Plant and property, at original cost: |
||||||||
Electric |
$ | 2,001,142 | $ | 1,619,949 | ||||
Natural gas |
63,581 | 58,180 | ||||||
Water |
11,128 | 10,891 | ||||||
Other |
32,264 | 29,564 | ||||||
Construction work in progress |
9,337 | 302,012 | ||||||
|
2,117,452 | 2,020,596 | ||||||
Accumulated depreciation and amortization |
598,363 | 561,586 | ||||||
|
1,519,089 | 1,459,010 | ||||||
Current assets: |
||||||||
Cash and cash equivalents |
14,499 | 5,620 | ||||||
Accounts receivable — trade, net of allowance of $865 and $1,087, respectively |
41,380 | 36,136 | ||||||
Accrued unbilled revenues |
23,595 | 23,717 | ||||||
Accounts receivable — other |
25,445 | 21,417 | ||||||
Fuel, materials and supplies |
45,557 | 43,973 | ||||||
Unrealized gain in fair value of derivative contracts |
39 | 2,782 | ||||||
Prepaid expenses and other |
5,649 | 4,438 | ||||||
Regulatory assets |
4,974 | 772 | ||||||
|
161,138 | 138,855 | ||||||
Noncurrent assets and deferred charges: |
||||||||
Regulatory assets |
189,404 | 168,254 | ||||||
Goodwill |
39,492 | 39,492 | ||||||
Unamortized debt issuance costs |
9,257 | 10,638 | ||||||
Unrealized gain in fair value of derivative contracts |
194 | 2,525 | ||||||
Iatan investment tax credits |
— | 17,713 | ||||||
Other |
2,737 | 3,359 | ||||||
|
241,084 | 241,981 | ||||||
Total assets |
$ | 1,921,311 | $ | 1,839,846 | ||||
(Continued)
The accompanying notes are an integral part of these consolidated financial statements.
66
THE EMPIRE DISTRICT ELECTRIC COMPANY
CONSOLIDATED BALANCE SHEETS (Continued)
| |
December 31, | ||||||||
|---|---|---|---|---|---|---|---|---|---|
| |
2010 | 2009 | |||||||
| |
($-000's) |
||||||||
Capitalization and liabilities |
|||||||||
Common stock, $1 par value, 100,000,000 shares authorized, 41,576,869 and 38,112,280 shares issued and outstanding, respectively |
$ |
41,577 |
$ |
38,112 |
|||||
Capital in excess of par value |
610,579 | 551,631 | |||||||
Retained earnings |
5,468 | 10,068 | |||||||
Accumulated comprehensive income/(loss), net of income taxes |
— | 339 | |||||||
Total common stockholders' equity |
657,624 | 600,150 | |||||||
Long-term debt (net of current portion) |
|||||||||
Note payable to securitization trust |
— | 50,000 | |||||||
Obligations under capital lease |
4,995 | 2,563 | |||||||
First mortgage bonds and secured debt |
488,577 | 339,643 | |||||||
Unsecured debt |
199,500 | 247,950 | |||||||
Total long-term debt |
693,072 | 640,156 | |||||||
Total long-term debt and common stockholders' equity |
1,350,696 | 1,240,306 | |||||||
Current liabilities: |
|||||||||
Accounts payable and accrued liabilities |
58,820 | 67,406 | |||||||
Current maturities of long-term debt |
881 | 51,021 | |||||||
Short-term debt |
24,000 | 50,500 | |||||||
Customer deposits |
11,061 | 10,394 | |||||||
Interest accrued |
6,004 | 5,698 | |||||||
Other current liabilities |
578 | — | |||||||
Unrealized loss in fair value of derivative contracts |
760 | 4,337 | |||||||
Taxes accrued |
3,935 | 3,386 | |||||||
Regulatory liabilities |
1,243 | — | |||||||
|
107,282 | 192,742 | |||||||
Commitments and contingencies (Note 11) |
|||||||||
Noncurrent liabilities and deferred credits: |
|||||||||
Regulatory liabilities |
87,579 | 87,533 | |||||||
Deferred income taxes |
212,003 | 194,315 | |||||||
Unamortized investment tax credits |
19,597 | 20,125 | |||||||
Pension and other postretirement benefit obligations |
93,405 | 84,240 | |||||||
Unrealized loss in fair value of derivative contracts |
3,564 | 426 | |||||||
Other |
47,185 | 20,159 | |||||||
|
463,333 | 406,798 | |||||||
Total capitalization and liabilities |
$ | 1,921,311 | $ | 1,839,846 | |||||
The accompanying notes are an integral part of these consolidated financial statements.
67
THE EMPIRE DISTRICT ELECTRIC COMPANY
CONSOLIDATED STATEMENTS OF INCOME
| |
Year Ended December 31, | ||||||||||
|---|---|---|---|---|---|---|---|---|---|---|---|
| |
2010 | 2009 | 2008 | ||||||||
| |
($-000's, except per share amounts) |
||||||||||
Operating revenues: |
|||||||||||
Electric |
$ | 482,910 | $ | 433,133 | $ | 446,466 | |||||
Gas |
50,885 | 57,314 | 65,438 | ||||||||
Water |
1,805 | 1,764 | 1,782 | ||||||||
Other |
5,676 | 4,957 | 4,477 | ||||||||
|
541,276 | 497,168 | 518,163 | ||||||||
Operating revenue deductions: |
|||||||||||
Fuel and purchased power |
199,299 | 182,028 | 204,058 | ||||||||
Cost of natural gas sold and transported |
26,614 | 35,601 | 42,630 | ||||||||
Regulated operating expenses |
79,292 | 73,086 | 71,918 | ||||||||
Other operating expenses |
1,950 | 1,801 | 1,889 | ||||||||
Maintenance and repairs |
36,771 | 33,012 | 28,549 | ||||||||
Depreciation and amortization |
58,656 | 51,494 | 53,562 | ||||||||
Provision for income taxes |
30,470 | 19,571 | 19,128 | ||||||||
Other taxes |
27,729 | 26,080 | 25,417 | ||||||||
|
460,781 | 422,673 | 447,151 | ||||||||
Operating income |
80,495 | 74,495 | 71,012 | ||||||||
Other income and (deductions): |
|||||||||||
Allowance for equity funds used during construction |
4,538 | 6,209 | 5,929 | ||||||||
Interest income |
176 | 217 | 1,057 | ||||||||
Benefit/(provision) for other income taxes |
(63 | ) | (311 | ) | 2 | ||||||
Other — non-operating expense, net |
(1,039 | ) | (460 | ) | (1,569 | ) | |||||
|
3,612 | 5,655 | 5,419 | ||||||||
Interest charges: |
|||||||||||
Long-term debt |
41,959 | 42,084 | 36,041 | ||||||||
Trust preferred securities |
2,090 | 4,250 | 4,250 | ||||||||
Short-term debt |
631 | 1,125 | 1,854 | ||||||||
Allowance for borrowed funds used during construction |
(5,636 | ) | (7,924 | ) | (6,589 | ) | |||||
Other |
(2,333 | ) | (681 | ) | 1,153 | ||||||
|
36,711 | 38,854 | 36,709 | ||||||||
Net income |
$ | 47,396 | $ | 41,296 | $ | 39,722 | |||||
Weighted average number of common shares outstanding — basic |
40,545 | 34,924 | 33,821 | ||||||||
Weighted average number of common shares outstanding — diluted |
40,580 | 34,956 | 33,860 | ||||||||
Total earnings per weighted average share of common stock — basic and diluted |
$ | 1.17 | $ | 1.18 | $ | 1.17 | |||||
Dividends declared per share of common stock |
$ | 1.28 | $ | 1.28 | $ | 1.28 | |||||
The accompanying notes are an integral part of these consolidated financial statements.
68
THE EMPIRE DISTRICT ELECTRIC COMPANY
CONSOLIDATED STATEMENTS OF COMPREHENSIVE INCOME
| |
Year Ended December 31, | |||||||||
|---|---|---|---|---|---|---|---|---|---|---|
| |
2010 | 2009 | 2008 | |||||||
| |
($-000's) |
|||||||||
Net income |
$ | 47,396 | $ | 41,296 | $ | 39,722 | ||||
Reclassification adjustments for (gain)/loss included in net income or reclassified to regulatory asset or liability |
5,814 | 13,568 | (3,872 | ) | ||||||
Net change in fair market value of open derivative contracts for period |
(6,362 | ) | (9,576 | ) | (17,394 | ) | ||||
Income taxes |
209 | (1,521 | ) | 8,102 | ||||||
Comprehensive income |
$ | 47,057 | $ | 43,767 | $ | 26,558 | ||||
The accompanying notes are an integral part of these consolidated financial statements.
69
THE EMPIRE DISTRICT ELECTRIC COMPANY
CONSOLIDATED STATEMENTS OF COMMON STOCKHOLDERS' EQUITY
| |
Common Stock |
Capital in excess of Par |
Retained earnings |
Accumulated comprehensive Income/(loss) |
Total | |||||||||||||
|---|---|---|---|---|---|---|---|---|---|---|---|---|---|---|---|---|---|---|
| |
($-000's) |
|||||||||||||||||
Balance at December 31, 2007 |
$ | 33,606 | $ | 477,385 | $ | 17,153 | $ | 11,032 | $ | 539,176 | ||||||||
Net income |
39,722 | 39,722 | ||||||||||||||||
Stock/stock units issued through: |
||||||||||||||||||
Stock purchase and reinvestment plans |
376 | 6,058 | 6,434 | |||||||||||||||
Dividends declared |
(43,296 | ) | (43,296 | ) | ||||||||||||||
Reclassification adjustment for gains included in net income |
(3,872 | ) | (3,872 | ) | ||||||||||||||
Change in fair value of open derivative contracts for period |
(17,394 | ) | (17,394 | ) | ||||||||||||||
Income taxes |
8,102 | 8,102 | ||||||||||||||||
Balance at December 31, 2008 |
33,982 | 483,443 | 13,579 | (2,132 | ) | 528,872 | ||||||||||||
Net income |
41,296 | 41,296 | ||||||||||||||||
Stock/stock units issued through: |
||||||||||||||||||
Public offering |
3,664 | 60,825 | 64,489 | |||||||||||||||
Stock purchase and reinvestment plans |
466 | 7,363 | 7,829 | |||||||||||||||
Dividends declared |
(44,807 | ) | (44,807 | ) | ||||||||||||||
Reclassification adjustment for losses included in net income |
13,568 | 13,568 | ||||||||||||||||
Change in fair value of open derivative contracts for period |
(9,576 | ) | (9,576 | ) | ||||||||||||||
Income taxes |
(1,521 | ) | (1,521 | ) | ||||||||||||||
Balance at December 31, 2009 |
38,112 | 551,631 | 10,068 | 339 | 600,150 | |||||||||||||
Net income |
47,396 | 47,396 | ||||||||||||||||
Stock/stock units issued through: |
||||||||||||||||||
Public offering |
2,871 | 48,325 | 51,196 | |||||||||||||||
Stock purchase and reinvestment plans |
594 | 10,623 | 11,217 | |||||||||||||||
Dividends declared |
(51,996 | ) | (51,996 | ) | ||||||||||||||
Reclassification adjustment for losses included in net income |
5,814 | 5,814 | ||||||||||||||||
Change in fair value of open derivative contracts for period |
(6,362 | ) | (6,362 | ) | ||||||||||||||
Income taxes |
209 | 209 | ||||||||||||||||
Balance at December 31, 2010 |
$ | 41,577 | $ | 610,579 | $ | 5,468 | $ | — | $ | 657,624 | ||||||||
The accompanying notes are an integral part of these consolidated financial statements.
70
THE EMPIRE DISTRICT ELECTRIC COMPANY
CONSOLIDATED STATEMENTS OF CASH FLOWS
| |
Year Ended December 31, | ||||||||||
|---|---|---|---|---|---|---|---|---|---|---|---|
| |
2010 | 2009 | 2008 | ||||||||
| |
($-000's) |
||||||||||
Operating activities: |
|||||||||||
Net income |
$ | 47,396 | $ | 41,296 | $ | 39,722 | |||||
Adjustments to reconcile net income to cash flows from operating activities: |
|||||||||||
Depreciation and amortization |
71,076 | 62,247 | 59,066 | ||||||||
Pension and other postretirement benefit costs, net of contributions |
(3,683 | ) | 4,096 | 8,282 | |||||||
Deferred income taxes and unamortized investment tax credit, net |
26,880 | 15,324 | 8,580 | ||||||||
Allowance for equity funds used during construction |
(4,538 | ) | (6,209 | ) | (5,929 | ) | |||||
Stock compensation expense |
3,478 | 2,616 | 2,169 | ||||||||
Non cash (gain)/loss on derivatives |
1,853 | 10,350 | (39 | ) | |||||||
Gain on the sale of assets |
— | (457 | ) | — | |||||||
Impairment of other non-operating investment |
— | — | 556 | ||||||||
Cash flows impacted by changes in: |
|||||||||||
Accounts receivable and accrued unbilled revenues |
(11,211 | ) | 2,989 | (10,938 | ) | ||||||
Fuel, materials and supplies |
(1,585 | ) | 4,635 | (4,720 | ) | ||||||
Prepaid expenses, other current assets and deferred charges |
(17,403 | ) | (7,464 | ) | (2,683 | ) | |||||
Accounts payable and accrued liabilities |
(6,179 | ) | (1,305 | ) | (4,905 | ) | |||||
Interest, taxes accrued and customer deposits |
1,522 | 806 | 2,234 | ||||||||
Other liabilities and other deferred credits |
3,954 | 699 | 1,597 | ||||||||
SWPA minimum flows payment |
26,564 | — | — | ||||||||
Net cash provided by operating activities |
138,124 | 129,623 | 92,992 | ||||||||
(Continued)
The accompanying notes are an integral part of these consolidated financial statements.
71
THE EMPIRE DISTRICT ELECTRIC COMPANY
CONSOLIDATED STATEMENTS OF CASH FLOWS (Continued)
| |
Year Ended December 31, | ||||||||||
|---|---|---|---|---|---|---|---|---|---|---|---|
| |
2010 | 2009 | 2008 | ||||||||
| |
($-000's) |
||||||||||
Investing activities: |
|||||||||||
Capital expenditures — regulated |
$ | (106,388 | ) | $ | (154,016 | ) | $ | (211,311 | ) | ||
Capital expenditures and other investments — non-regulated |
(2,817 | ) | (1,239 | ) | (1,969 | ) | |||||
Proceeds from the sale of property, plant and equipment |
— | 544 | 1,538 | ||||||||
Total net cash used in investing activities |
(109,205 | ) | (154,711 | ) | (211,742 | ) | |||||
Financing activities: |
|||||||||||
Proceeds from first mortgage bonds |
149,635 | 75,000 | 89,950 | ||||||||
Proceeds from issuance of notes payable |
— | 2,470 | — | ||||||||
Long-term debt issuance costs |
(1,758 | ) | (2,397 | ) | (3,168 | ) | |||||
Proceeds from issuance of common stock, net of issuance costs |
60,239 | 70,271 | 5,385 | ||||||||
Repayment of first mortgage bonds |
(50,000 | ) | (20,025 | ) | — | ||||||
Redemption of trust preferred securities |
(50,000 | ) | — | — | |||||||
Redemption of senior notes |
(48,304 | ) | |||||||||
Net short-term borrowings (repayments) |
(26,500 | ) | (51,500 | ) | 68,960 | ||||||
Dividends |
(51,996 | ) | (44,807 | ) | (43,296 | ) | |||||
Other |
(1,356 | ) | (1,058 | ) | (370 | ) | |||||
Net cash provided by (used in) financing activities |
(20,040 | ) | 27,954 | 117,461 | |||||||
Net increase (decrease) in cash and cash equivalents |
8,879 |
2,866 |
(1,289 |
) |
|||||||
Cash and cash equivalents, beginning of year |
5,620 | 2,754 | 4,043 | ||||||||
Cash and cash equivalents, end of year |
$ | 14,499 | $ | 5,620 | $ | 2,754 | |||||
2010 |
2009 |
2008 |
|||||||||
Supplemental cash flow information: |
|||||||||||
Interest paid |
$ | 43,044 | $ | 45,730 | $ | 40,384 | |||||
Income taxes paid, net of refund |
11,264 | 3,246 | 8,706 | ||||||||
Supplementary non-cash investing activities: |
|||||||||||
Change in accrued additions to property, plant and equipment not reported above |
$ | (3,846 | ) | $ | (3,833 | ) | $ | (6,895 | ) | ||
Capital lease obligations for purchase of new equipment |
2,696 | 2,946 | — | ||||||||
The accompanying notes are an integral part of these consolidated financial statements.
72
THE EMPIRE DISTRICT ELECTRIC COMPANY
NOTES TO CONSOLIDATED FINANCIAL STATEMENTS
1. Summary of Significant Accounting Policies
We operate our businesses as three segments: electric, gas and other. The Empire District Electric Company (EDE), a Kansas corporation organized in 1909, is an operating public utility engaged in the generation, purchase, transmission, distribution and sale of electricity in parts of Missouri, Kansas, Oklahoma and Arkansas. As part of our electric segment, we also provide water service to three towns in Missouri. The Empire District Gas Company (EDG) is our wholly owned subsidiary engaged in the distribution of natural gas in Missouri. Our other segment consists of our fiber optics business. See Note 12. Our gross operating revenues in 2010 were derived as follows:
Electric segment sales* |
89.6 | % | ||
Gas segment sales |
9.4 | % | ||
Other segment sales |
1.0 | % |
- *
- Sales from our electric segment include 0.3% from the sale of water.
The utility portions of our business are subject to regulation by the Missouri Public Service Commission (MPSC), the State Corporation Commission of the State of Kansas (KCC), the Corporation Commission of Oklahoma (OCC), the Arkansas Public Service Commission (APSC) and the Federal Energy Regulatory Commission (FERC). Our accounting policies are in accordance with the ratemaking practices of the regulatory authorities and conform to generally accepted accounting principles as applied to regulated public utilities.
Our electric operations serve approximately 169,000 customers and the 2010 electric operating revenues were derived as follows:
Customer
|
% of revenue | |||
|---|---|---|---|---|
Residential |
42.4 | % | ||
Commercial |
30.3 | % | ||
Industrial |
14.4 | % | ||
Wholesale on-system |
4.0 | % | ||
Wholesale off-system |
4.7 | % | ||
Miscellaneous sources, primarily public authorities |
2.5 | % | ||
Other electric revenues |
1.7 | % | ||
Our retail electric revenues for 2010 by jurisdiction were as follows:
Jurisdiction
|
% of revenue | |||
|---|---|---|---|---|
Missouri |
88.9 | % | ||
Kansas |
5.3 | % | ||
Arkansas |
3.0 | % | ||
Oklahoma |
2.8 | % | ||
73
THE EMPIRE DISTRICT ELECTRIC COMPANY
NOTES TO CONSOLIDATED FINANCIAL STATEMENTS (Continued)
Our gas operations serve approximately 44,000 customers and the 2010 gas operating revenues were derived as follows:
Customer
|
% of revenue | |||
|---|---|---|---|---|
Residential |
63.4 | % | ||
Commercial |
26.2 | % | ||
Industrial |
1.6 | % | ||
Other |
8.8 | % | ||
The consolidated financial statements include the accounts of EDE, EDG, and our other (fiber optic) subsidiary. The consolidated entity is referred to throughout as "we" or the "Company". All intercompany balances and transactions have been eliminated in consolidation. See Note 12 for additional information regarding our three segments. Certain immaterial reclassifications have been made to prior year information to conform to the current year presentation.
Accounting for the Effects of Regulation
In accordance with the Accounting Standard Codification (ASC) guidance for regulated operations, our financial statements reflect ratemaking policies prescribed by the regulatory commissions having jurisdiction over our regulated generation and other utility operations (the MPSC, the KCC, the OCC, the APSC and the FERC).
We record a regulatory asset for all or part of an incurred cost that would otherwise be charged to expense in accordance with the ASC guidance for regulated operations which say that an asset should be recorded if it is probable that future revenue in an amount at least equal to the capitalized cost will be allowable for costs for rate making purposes and the current available evidence indicates that future revenue will be provided to permit recovery of the cost. This guidance also says that a liability should be recorded when a regulator has provided current recovery for a cost that is expected to be incurred in the future. We follow this guidance for incurred costs or credits that are subject to future recovery from or refund to our customers in accordance with the orders of our regulators.
Historically, all costs of this nature, which are determined by our regulators to have been prudently incurred, have been recoverable through rates in the course of normal ratemaking procedures. Regulatory assets and liabilities are ratably amortized through a charge or credit, respectively, to earnings while being recovered in revenues and fully recognized if and when it is no longer probable that such amounts will be recovered through future revenues. We continually assess the recoverability of our regulatory assets. Although we believe it unlikely, should retail electric competition legislation be passed in the states we serve, we may determine that we no longer meet the criteria set forth in the ASC guidance for regulated operations with respect to continued recognition of some or all of the regulatory assets and liabilities. Any regulatory changes that would require us to discontinue application of this guidance based upon competitive or other events may also impact the valuation of certain utility plant investments. Impairment of regulatory assets or utility plant investments could have a material adverse effect on our financial condition and results of operations. (See Note 3 for further discussion of regulatory assets and liabilities).
The preparation of financial statements in conformity with generally accepted accounting principles (GAAP) requires management to make estimates and assumptions that affect the reported amounts of
74
THE EMPIRE DISTRICT ELECTRIC COMPANY
NOTES TO CONSOLIDATED FINANCIAL STATEMENTS (Continued)
assets and liabilities and disclosure of contingent assets and liabilities at the date of the financial statements. Estimates also affect the reported amounts of revenues and expenses during the period. Areas in the financial statements significantly affected by estimates and assumptions include unbilled utility revenues, collectibility of accounts receivable, depreciable lives, asset impairment and goodwill impairment evaluations, employee benefit obligations, contingent liabilities, asset retirement obligations, the fair value of stock based compensation, tax provisions and derivatives. Actual amounts could differ from those estimates.
For our utility operations, we use cycle billing and accrue estimated, but unbilled, revenue for services provided between the last bill date and the period end date. Unbilled revenues represent the estimate of receivables for energy and natural gas services delivered, but not yet billed to customers. The accuracy of our unbilled revenue estimate is affected by factors including fluctuations in energy demands, weather, line losses and changes in the composition of customer classes.
Municipal franchise taxes are collected for and remitted to their respective entities and are included in operating revenues and other taxes in the Consolidated Statements of Income. Municipal franchise taxes of $10.6 million, $10.2 million and $10.2 million were recorded for each of the years ended December 31, 2010, 2009 and 2008, respectively.
Accounts receivable are recorded at the tariffed rates for customer usage, including applicable taxes and fees and do not bear interest. We review the outstanding accounts receivable monthly, as well as the bad debt write-offs experienced in the past, and establish an allowance for doubtful accounts. Account balances are charged off against the allowance when management determines it is probable the receivable will not be recovered
The costs of additions to utility property and replacements for retired property units are capitalized. Costs include labor, material, an allocation of general and administrative costs, and an allowance for funds used during construction (AFUDC). The original cost of units retired or disposed of and the costs of removal are charged to accumulated depreciation, unless the removed property constitutes an operating unit or system. In this case a gain or loss is recognized upon the disposal of the asset. Maintenance expenditures and the removal of minor property items are charged to income as incurred. A liability is created for any additions to electric or gas utility property that are paid for by advances from developers. For a period of five years the Company refunds, to the developer, a pro rata amount of the original cost of the extension for each new customer added to the extension. Nonrefundable payments at the end of the five year period are applied as a reduction to the cost of the plant in service. The liability as of December 31, 2010 and 2009 was $8.3 million and $9.7 million, respectively.
As of December 31, 2010 and 2009, we had recorded accrued cost of removal of $58.8 million and $49.8 million, respectively, for our electric operating segment. This represents an estimated cost of dismantling and removing plant from service upon retirement, accrued as part of our depreciation rates. Pursuant to our 2005 Missouri rate order, we accrue cost of removal in depreciation rates for mass property (including transmission, distribution and general plant assets). These accruals are not considered
75
THE EMPIRE DISTRICT ELECTRIC COMPANY
NOTES TO CONSOLIDATED FINANCIAL STATEMENTS (Continued)
an asset retirement obligation under the guidance provided on asset retirement obligations within the ASC. We reclassify the accrued cost of dismantling and removing plant from service upon retirement from accumulated depreciation to a regulatory liability. We have a similar cost of removal regulatory liability for our gas operating segment. This amount at December 31, 2010 and 2009 was $3.9 million and $3.3 million, respectively. These amounts are net of our actual cost of removal expenditures.
We record the estimated fair value of legal obligations associated with the retirement of tangible long-lived assets in the period in which the liabilities are incurred and capitalize a corresponding amount as part of the book value of the related long-lived asset. In subsequent periods, we are required to adjust asset retirement obligations based on changes in estimated fair value, and the corresponding increases in asset book values are depreciated over the useful life of the related asset. Uncertainties as to the probability, timing or cash flows associated with an asset retirement obligation affect our estimate of fair value.
We have identified asset retirement obligations associated with the future removal of certain river water intake structures and equipment at the Iatan Power Plant, in which we have a 12% ownership. We also have a liability for future containment of an ash landfill at the Riverton Power Plant along with a liability for asset retirement obligations associated with the removal of asbestos located at the Riverton and Asbury Plants. In addition, we have a liability for the removal and disposal of Polychlorinated Biphenyls (PCB) contaminants associated with our transformers and substation equipment. These liabilities have been estimated based upon either third party costs or historical review of expenditures for the removal of similar past liabilities. The potential costs of these future expenditures are based on engineering estimates of third party costs to remove the assets in satisfaction of the associated obligations. This liability will be accreted over the period up to the estimated settlement date.
All of our recorded asset retirement obligations have been estimated as of the expected retirement date, or settlement date, and have been discounted using a credit adjusted risk-free rate ranging from 4.5% to 5.52% depending on the settlement date. Revisions to these liabilities could occur due to changes in the cost estimates, anticipated timing of settlement or federal or state regulatory requirements.
The balances at the end of 2009 and 2010 are shown below.
| (000's) |
Liability Balance 12/31/09 |
Liabilities Recognized |
Liabilities Settled |
Accretion | Cash Flow Revisions |
Liability Balance at 12/31/10 |
|||||||||||||
|---|---|---|---|---|---|---|---|---|---|---|---|---|---|---|---|---|---|---|---|
Asset Retirement Obligation |
$ | 3,607 | $ | — | $ | — | $ | 150 | $ | — | $ | 3,757 | |||||||
| (000's) |
Liability Balance 12/31/08 |
Liabilities Recognized |
Liabilities Settled |
Accretion | Cash Flow Revisions |
Liability Balance at 12/31/09 |
|||||||||||||
|---|---|---|---|---|---|---|---|---|---|---|---|---|---|---|---|---|---|---|---|
Asset Retirement Obligation |
$ | 3,468 | $ | — | $ | — | $ | 139 | $ | — | $ | 3,607 | |||||||
Upon adoption of the standards on the retirement of long lived assets and conditional asset retirement obligations, we recorded a liability and regulatory asset because we expect to recover these costs of removal in electric and gas rates either through depreciation accruals or direct expenses. We also defer the liability accretion and depreciation expense as a regulatory asset. At December 31, 2010 and 2009, our regulatory assets relating to asset retirement obligations totaled $3.4 million and $3.3 million, respectively.
Also as noted previously under property, plant and equipment, we reclassify the accrued cost of dismantling and removing plant from service upon retirement, which is not considered an asset retirement
76
THE EMPIRE DISTRICT ELECTRIC COMPANY
NOTES TO CONSOLIDATED FINANCIAL STATEMENTS (Continued)
obligation under this guidance, from accumulated depreciation to a regulatory liability. This balance sheet reclassification has no impact on results of operations.
Provisions for depreciation are computed at straight-line rates in accordance with GAAP consistent with rates approved by regulatory authorities. These rates are applied to the various classes of utility assets on a composite basis. Provisions for depreciation for our other segment is computed at straight-line rates over the estimated useful life of the properties. (See Note 2 for additional details regarding depreciation rates).
In accordance with our previous rate orders, and our 2010 rate order from the MPSC, we recorded approximately $7.5 million, $4.5 million, and $8.2 million of regulatory amortization during 2010, 2009, and 2008, respectively. This amortization included in our rates was granted in the Experimental Regulatory Plan approved by the MPSC on August 2, 2005. It provided additional cash flow to enhance the financial support for our generation expansion plan. It is related to our investment in Iatan 2 and also includes our Riverton V84.3A2 combustion turbine (Riverton Unit 12) and environmental improvement and upgrades at Asbury and Iatan 1. This amortization is included as depreciation and amortization expense and in accumulated depreciation and amortization on the consolidated balance sheet.
Allowance for Funds Used During Construction
As provided in the FERC regulatory Uniform System of Accounts, utility plant is recorded at original cost, including an allowance for funds used during construction (AFUDC) when first placed in service. The AFUDC is a utility industry accounting practice whereby the cost of borrowed funds and the cost of equity funds applicable to our construction program are capitalized as a cost of construction. This accounting practice offsets the effect on earnings of the cost of financing current construction, and treats such financing costs in the same manner as construction charges for labor and materials.
AFUDC does not represent current cash income. Recognition of this item as a cost of utility plant is in accordance with regulatory rate practice under which such plant costs are permitted as a component of rate base and the provision for depreciation.
In accordance with the methodology prescribed by the FERC, we utilized aggregate rates (on a before-tax basis) of 7.5% for 2010, 7.0% for 2009 and 7.8% for 2008, compounded semiannually, in determining AFUDC for all of our projects except Iatan 2. The specific Iatan 2 AFUDC rate is a result of our Experimental Regulatory Plan approved by the MPSC on August 2, 2005. In this agreement, we were allowed to receive the regulatory amortization discussed above, in rates prior to the completion of Iatan 2. As a result, the equity portion of our AFUDC rate for the Iatan 2 project was reduced by 2.5 percentage points. (See Note 3 for additional discussion of our regulatory plan.)
Asset Impairments (excluding goodwill)
We review long-lived assets for impairment whenever events or changes in circumstances indicate that the carrying amount of an asset may not be recoverable. To the extent that certain assets may be impaired, analysis is performed based on undiscounted forecasted cash flows to determine the impairment amount. None of our assets were impaired as of December 31, 2010 and 2009.
77
THE EMPIRE DISTRICT ELECTRIC COMPANY
NOTES TO CONSOLIDATED FINANCIAL STATEMENTS (Continued)
As of December 31, 2010, the consolidated balance sheet included $39.5 million of goodwill. All of this goodwill was derived from our gas acquisition and recorded in our gas segment, which is also the reporting unit for goodwill testing purposes. Accounting guidance requires us to test goodwill for impairment on an annual basis or whenever events or circumstances indicate possible impairment. Absent an indication of fair value from a potential buyer or a similar specific transaction, a combination of the market and income approaches is used to estimate the fair value of goodwill.
We use the market approach which estimates fair value of the gas reporting unit by comparing certain financial metrics to comparable companies. Comparable companies whose securities are actively traded in the public market are judgmentally selected by management based on operational and economic similarities. We utilize EBITDA (earnings before interest, taxes, depreciation, and amortization) multiples of the comparable companies in relation to the EBITDA results of the gas reporting unit to determine an estimate of fair value.
We also utilize a valuation technique under the income approach which estimates the discounted future cash flows of operations. Our procedures include developing a baseline test and performing sensitivity analysis to calculate a reasonable valuation range. The sensitivities are derived from altering those assumptions which are subjective in nature and inherent to a discounted cash flows calculation. Other qualitative factors and comparisons to industry peers are also used to further support the assumptions and ultimately the overall evaluation. A key qualitative assumption considered in our evaluation is the impact of regulation, including rate regulation and cost recovery for the gas reporting unit. Some of the key quantitative assumptions included in our tests involve: regulatory rate design and results; the discount rate; the growth rate; capital spending rates and terminal value calculations. We believe it is unlikely that a change to one of these key assumptions, by itself, would be significant enough to result in an impairment charge. However, if significant negative changes occurred to multiple key assumptions, an impairment charge could result. With the exception of the capital spending rate, the key assumptions noted are significantly determined by market factors and significant changes in market factors that impact the gas reporting unit would likely be mitigated by our current and future regulatory rate design to some extent. Other risks and uncertainties affecting these assumptions include: management's identification of impairment indicators, changes in business, industry, laws, technology and economic conditions. Actual results for the gas reporting unit indicate a recent decline in gas customer growth and demand, but this was anticipated in our assumptions for purposes of the discounted cash flow calculation. Our forecasts anticipate the customer contraction will minimize in the near future and return to positive customer growth within the next few years.
We weight the results of the two approaches discussed above in order to estimate the fair value of the gas reporting unit. Our annual test performed as of October 31, 2010 indicated the estimated fair market value of the gas reporting unit to be 10-15% higher than its carrying value at that time. While we believe the assumptions utilized in our analysis were reasonable, significant adverse developments in future periods could negatively impact goodwill impairment considerations, which could adversely impact earnings.
Electric Segment
Fuel and purchased power costs are recorded at the time the fuel is used, or the power purchased. This amount is adjusted to reflect regulatory treatment for our Missouri and Kansas fuel adjustment mechanisms discussed below.
78
THE EMPIRE DISTRICT ELECTRIC COMPANY
NOTES TO CONSOLIDATED FINANCIAL STATEMENTS (Continued)
The MPSC authorized a fuel adjustment clause (FAC) for our Missouri customers effective September 1, 2008. The MPSC established a base cost for the recovery of fuel and purchased power expenses used to supply energy. The FAC permits the distribution to customers of 95% of the changes in fuel and purchased power costs prudently incurred above or below the base cost. Off-system sales margins are also part of the recovery of fuel and purchased power costs. As a result, nearly all of the off-system sales margin flows back to the customer. Rates related to the fuel adjustment clause are modified twice a year subject to the review and approval by the MPSC. In accordance with the ASC guidance for regulated operations, 95% of the difference between the actual costs of fuel and purchased power and the base cost of fuel and purchased power recovered from our customers is recorded as an adjustment to fuel and purchased power expense with a corresponding regulatory asset or regulatory liability. If the actual fuel and purchased power costs are higher or lower than the base fuel and purchased power costs billed to customers, 95% of these amounts will be recovered or refunded to our customers when the fuel adjustment clause is modified.
In our Kansas jurisdiction, the costs of fuel are recovered from customers through a fuel adjustment clause, based upon estimated fuel costs and purchased power. The adjustments are subject to audit and final determination by regulators. The difference between the costs of fuel used and the cost of fuel recovered from our Kansas customers is recorded as a regulatory asset or a regulatory liability if the actual costs are higher or lower than the costs billed to customers, in accordance with the ASC guidance for regulated operations.
Similar fuel recovery mechanisms are in place for our Oklahoma, Arkansas and the FERC jurisdictions. We buy and sell power through the SPP RTO energy imbalance services market (EIS). We net settle these market transactions on an hourly basis.
At December 31, 2010, our Missouri and Kansas fuel and purchased power costs were under-recovered by $5.0 million, which is reflected as a regulatory asset.
We receive the renewable attributes associated with the power purchased through our purchased power agreements with Elk River Windfarm LLC and Cloud County Windfarm, LLC. These renewable attributes are converted into renewable energy credits, which are considered inventory, and recorded at zero cost (See Note 11).
Effective March 1, 2005, the MPSC approved a Stipulation and Agreement granting us authority to manage our SO2 allowance inventory in accordance with our SO2 Allowance Management Policy (SAMP). The SAMP allows us to exchange banked allowances for future vintage allowances and/or monetary value and, in extreme market conditions, to sell SO2 allowances outright for monetary value. We have not yet exchanged or sold any allowances. We classify our allowances as inventory and they are recorded at cost. The banked allowances are recorded at zero cost. The allowances are removed from inventory on a FIFO basis. We consider used allowances to be a part of fuel expense (See Note 11).
Gas Segment
Fuel expense for our gas segment is recognized when the natural gas is delivered to our customers, based on the current cost recovery allowed in rates. A Purchased Gas Adjustment (PGA) clause allows EDG to recover from our customers, subject to audit and final determination by regulators, the cost of purchased gas supplies and related carrying costs associated with the Company's use of natural gas financial instruments to hedge the purchase price of natural gas. This PGA clause allows us to make rate changes periodically (up to four times) throughout the year in response to weather conditions and supply demands, rather than in one possibly extreme change per year.
79
THE EMPIRE DISTRICT ELECTRIC COMPANY
NOTES TO CONSOLIDATED FINANCIAL STATEMENTS (Continued)
We calculate the PGA factor based on our best estimate of our annual gas costs and volumes purchased for resale. The calculated factor is reviewed by the MPSC staff and approved by the MPSC. PGA factor elements considered include cost of gas supply, storage costs, hedging contracts, revenue and refunds, prior period adjustments and transportation costs.
Pursuant to the provisions of the PGA clause, the difference between actual costs incurred and costs recovered through the application of the PGA (including costs, cost reductions and carrying costs associated with the use of financial instruments), are reflected as a regulatory asset or liability. The balance is amortized as amounts are reflected in customer billings.
We utilize derivatives to help manage our natural gas commodity market risk resulting from purchasing natural gas, to be used as fuel in our electric business or sold in our natural gas business, on the volatile spot market and to manage certain interest rate exposure.
Electric Segment
Pursuant to the ASC guidance on accounting for derivative instruments and hedging activities, derivatives are required to be recognized on the balance sheet at their fair value. On the date a derivative contract is entered into, the derivative is designated as (1) a hedge of a forecasted transaction or of the variability of cash flows to be received or paid related to a recognized asset or liability ("cash-flow" hedge); or (2) an instrument that is held for non-hedging purposes (a "non-hedging" instrument). Changes in the fair value of a derivative that is highly effective and designated and qualifies as a cash-flow hedge are recorded in comprehensive income until earnings are affected by the variability of cash flows (e.g., when periodic settlements on a variable-rate asset or liability are recorded in earnings). Changes in the fair value of non-designated derivative instruments and any ineffective portion of a qualified hedge are reported in current-period earnings in fuel expense. Effective September 1, 2008, in conjunction with the implementation of the Missouri fuel adjustment clause in the July 2008 MPSC rate order, the mark to market unrealized losses or gains from new derivatives used to hedge our fuel costs were recorded in regulatory assets or liabilities. This is in accordance with the ASC guidance on regulated operations, given that those regulatory assets and liabilities are probable of recovery through our fuel adjustment mechanism. Unrealized gains and losses from cash flow hedges existing at September 1, 2008 continued to be recorded through comprehensive income through September 30, 2010. As of December 31, 2010, the remaining hedges we entered into prior to September 1, 2008 were de-designated. Given that upon settlement, the realized gain or loss would be recorded as fuel expense and be subject to the fuel adjustment clause, we have reclassified the unrealized loss on these hedges from comprehensive income to a regulatory asset. These hedges, along with any hedges entered into since September 1, 2008, will be accounted for in accordance with the ASC guidance on regulated operations as described above.
We also enter into fixed-price forward physical contracts for the purchase of natural gas, coal and purchased power. These contracts, if they meet the definition of a derivative, are not subject to derivative accounting because they are considered to be normal purchase normal sales (NPNS) transactions. If these transactions don't qualify for NPNS treatment, they would be marked to market for each reporting period through income.
Gas Segment
Financial hedges for our natural gas business are recorded at fair value on our balance sheet. Because we have a commission approved natural gas cost recovery mechanism (PGA), we record the
80
THE EMPIRE DISTRICT ELECTRIC COMPANY
NOTES TO CONSOLIDATED FINANCIAL STATEMENTS (Continued)
mark-to-market gain/loss on natural gas financial hedges each reporting period to a regulatory asset/liability account. The regulatory asset/liability account tracks the difference between revenues billed to customers for natural gas costs and actual natural gas expense which is trued up at the end of August each year and included in the Actual Cost Adjustment (ACA) factor to be billed to customers during the next year. This is consistent with the ASC guidance on regulated operations, in that we will be recovering our costs after the annual true up period (subject to a prudency review by the MPSC).
Cash flows from hedges for both electric and gas segments are classified within cash flows from operations.
Pension and Other Postretirement Benefits
We recognize expense related to pension and other postretirement benefits as earned during the employee's period of service. Related assets and liabilities are established based upon the funded status of the plan compared to the projected benefit obligation. Our pension and OPEB expense or benefit includes amortization of previously unrecognized net gains or losses. Additional income or expense may be recognized when our unrecognized gains or losses as of the most recent measurement date exceed 10% of our postretirement benefit obligation or fair value of plan assets, whichever is greater. For pension benefits and OPEB benefits, unrecognized net gains or losses as of the measurement date are amortized into actuarial expense over ten years.
Pensions
In our 2005 electric Missouri rate case, the MPSC ruled the Company would be allowed to recover pension costs consistent with our GAAP policy noted above. In accordance with the rate order, we prospectively calculated the value of plan assets using a market-related value method as allowed by the ASC guidance on pension benefits. As a result, we are allowed to record the Missouri portion of any costs above or below the amount included in rates as a regulatory asset or liability, respectively. Therefore, the deferral of these costs began in the second quarter of 2005. In our 2006 Kansas rate case, the KCC also ruled that the Company would be allowed to change the recognition of pension costs, deferring the Kansas portion of any costs above or below the amount included in the rate case as a regulatory asset or liability.
In the Company's agreement with the MPSC regarding the purchase of Missouri Gas by EDG, the Company was allowed to adopt this pension cost recovery methodology for EDG as well. Also, it was agreed that the effects of purchase accounting entries related to pension and other postretirement benefits would be recoverable in future rate proceedings. Thus the fair value adjustment acquisition entries have been recorded as regulatory assets, as these amounts are probable of recovery in future rates. The regulatory asset is reduced by an amount equal to the difference between the regulatory costs and the estimated GAAP costs. The difference between this total and the costs being recovered from customers is deferred as a regulatory asset or liability in accordance with the ASC guidance on regulated operations, and recovered over a period of five years.
Other Postretirement Benefits (OPEB)
In our 2006 Missouri rate case, the MPSC approved regulatory treatment for our OPEB costs similar to the treatment described above for pension costs. In our 2010 Kansas rate case, the KCC also approved regulatory treatment for our OPEB costs. This includes the use of a market-related value of assets, the amortization of unrecognized gains or losses into actuarial expense over ten years and the recognition of regulatory assets and liabilities as described above.
81
THE EMPIRE DISTRICT ELECTRIC COMPANY
NOTES TO CONSOLIDATED FINANCIAL STATEMENTS (Continued)
In accordance with the guidance provided in the ASC on the Medicare Prescription Drug, Improvement and Modernization Act of 2003, the accumulated postretirement benefit obligation (APBO) and net cost recognized for OPEB reflects the effects of the Medicare Prescription Drug, Improvement and Modernization Act of 2003 (the Act). The Act provides for a federal subsidy, beginning in 2006, of 28% of prescription drug costs between $250 and $5,000 for each Medicare-eligible retiree who does not join Medicare Part D, to companies whose plans provide prescription drug benefits to their retirees that are "actuarially equivalent" to the prescription drug benefits provided under Medicare. Equivalency must be certified annually by the Federal Government. Our plan provides prescription drug benefits that are "actuarially equivalent" to the prescription drug benefits provided under Medicare and have been certified as such.
Additional guidance in the ASC on employers' accounting for defined benefit pension and other postretirement plans requires an employer to recognize the over funded or under funded status of a defined benefit postretirement plan (other than a multiemployer plan) as an asset or liability in its statement of financial position and to recognize changes in that funded status in the year in which the changes occur through comprehensive income of a business entity. The guidance also requires an employer to measure the funded status of a plan as of the date of its year-end statement of financial position, with limited exceptions. Pension and other postretirement employee benefits tracking mechanisms are utilized to allow for future rate recovery of the obligations. We record these as regulatory assets on the balance sheet rather than as reductions of equity through comprehensive income (See Note 8).
Unamortized Debt Discount, Premium and Expense
Discount, premium and expense associated with long-term debt are amortized over the lives of the related issues. Costs, including gains and losses, related to refunded long-term debt are amortized over the lives of the related new debt issues, in accordance with regulatory rate practices.
We are primarily self-insured for workers' compensation claims, general liabilities, benefits paid under employee healthcare programs and long-term disability benefits. Accruals are primarily based on the estimated undiscounted cost of claims. We self-insure up to certain limits that vary by segment and type of risk. Periodically, we evaluate the level of insurance coverage over the self insured limits and adjust insurance levels based on risk tolerance and premium expense. We carry excess liability insurance for workers' compensation and public liability claims for our electric segment. In order to provide for the cost of losses not covered by insurance, an allowance for injuries and damages is maintained based on our loss experience. Our gas segment is covered by excess liability insurance for public liability claims, and workers' compensation claims are covered by a guaranteed cost policy (See Note 11).
At December 31, 2010, the balance of other noncurrent liabilities is primarily comprised of a $26.6 million payment we expect to flow through to our customers, as well as accruals for self insurance and customer advances for construction. Our hydroelectric generating plant (FERC Project No. 2221), located on the White River at Ozark Beach, Missouri, has a generating capacity of 16 megawatts. As part of the Energy and Water Development Appropriations Act of 2006 (the Appropriations Act), the level of Bull Shoals Lake will be increased an average of 5 feet which will reduce the generation at Ozark Beach. The loss in this facility would require us to replace it with additional generation from our gas-fired and coal-fired units or with purchased power. The Appropriations Act required the Southwest Power Administration (SWPA), in coordination with us and our relevant public service commissions, to determine
82
THE EMPIRE DISTRICT ELECTRIC COMPANY
NOTES TO CONSOLIDATED FINANCIAL STATEMENTS (Continued)
our economic detriment assuming a January 1, 2011 implementation date. On September 16, 2010, we received a $26.6 million payment from the SWPA recognizing the economic detriment created by the legislation. The $26.6 million payment will have no material impact on net income as we expect the benefits will flow through to our customers. In addition, the SWPA has delayed the implementation of the new minimum flows until 2016.
Cash and cash equivalents include cash on hand and temporary investments purchased with an initial maturity of three months or less. It also includes checks and electronic funds transfers that have been issued but have not cleared the bank, which are also reflected in current accrued liabilities and were $14.5 million and $14.1 million at December 31, 2010 and 2009, respectively.
Fuel, materials and supplies consist primarily of coal, natural gas in storage and materials and supplies, which are reported at average cost. These balances are as follows (in thousands):
| |
2010 | 2009 | |||||
|---|---|---|---|---|---|---|---|
Electric fuel inventory |
$ | 17,648 | $ | 15,885 | |||
Natural gas inventory |
4,470 | 5,404 | |||||
Materials and supplies |
23,439 | 22,684 | |||||
TOTAL |
$ | 45,557 | $ | 43,973 | |||
Deferred tax assets and liabilities are recognized for the tax consequences of transactions that have been treated differently for financial reporting and tax return purposes, measured using statutory tax rates (See Note 9).
Investment tax credits utilized in prior years were deferred and are being amortized over the useful lives of the properties to which they relate. Remaining unamortized investment tax credits are being amortized over their lives of up to approximately 52 years.
A December 2009 award from an arbitration panel ordered KCP&L to renegotiate with the IRS a previous $125 million advanced coal investment tax credit granted to our Iatan 2 plant. The IRS executed a revised memorandum of understanding (MOU) on September 7, 2010, which granted us our share, $17.7 million, of advanced coal investment tax credits in accordance with the arbitration panel's order. We utilized $5.1 million of these credits to reduce our 2010 tax payments and 2010 tax liability and these are reflected as a reduction to accrued taxes. The tax credit will have no significant income statement impact as the credits will flow to our customers as we amortize the tax credits over the life of the plant.
Accounting for Uncertainty in Income Taxes
In 2006, the FASB issued guidance which clarifies the accounting for uncertainty in income taxes recognized in an enterprise's financial statements in accordance with the ASC guidance on accounting for income taxes. We file consolidated income tax returns in the U.S. federal and state jurisdictions. With few exceptions, we are no longer subject to U.S. federal, state and local income tax examinations by tax authorities for years before 2007. At December 31, 2010 and 2009, our balance sheet included approximately $0.4 million and $0.9 million, respectively, of unrecognized tax benefits which would affect
83
THE EMPIRE DISTRICT ELECTRIC COMPANY
NOTES TO CONSOLIDATED FINANCIAL STATEMENTS (Continued)
our effective tax rate if recognized. We do not expect any material changes to unrecognized tax benefits within the next twelve months. We recognize interest accrued and penalties related to unrecognized tax benefits in other expenses.
Computations of Earnings Per Share
The ASC guidance on earnings per share requires dual presentation of basic and diluted earnings per share. Basic earnings per share does not include potentially dilutive securities and is computed by dividing net income by the weighted average number of common shares outstanding. Diluted earnings per share assumes the issuance of common shares pursuant to the Company's stock-based compensation plans at the beginning of each respective period, or at the date of grant or award if later. Shares attributable to stock options and performance-based restricted stock are excluded from the calculation of diluted earnings per share if the effect would be antidilutive.
| |
2010 | 2009 | 2008 | |||||||||
|---|---|---|---|---|---|---|---|---|---|---|---|---|
Weighted Average Number Of Shares |
||||||||||||
Basic |
40,544,802 | 34,923,526 | 33,820,750 | |||||||||
Dilutive Securities: |
||||||||||||
Performance-based restricted stock awards |
14,991 | 20,513 | 23,680 | |||||||||
Dividend equivalents |
12,558 | 12,122 | 10,981 | |||||||||
Employee stock purchase plan |
7,170 | 103 | 4,637 | |||||||||
Stock options |
— | — | — | |||||||||
Total dilutive securities |
34,719 | 32,738 | 39,298 | |||||||||
Diluted weighted average number of shares |
40,579,521 | 34,956,264 | 33,860,048 | |||||||||
Antidilutive Shares |
74,800 | 117,178 | — | |||||||||
Potentially dilutive shares are not expected to have a material impact unless significant appreciation of the Company's stock price occurs.
We have several stock-based compensation plans, which are described in more detail in Note 4. In accordance with the ASC guidance on stock-based compensation, we recognized compensation expense over the requisite service period of all stock-based compensation awards based upon the fair-value of the award as of the date of issuance (See Note 4).
Recently Issued and Proposed Accounting Standards
Fair Value: In January 2010, the FASB amended the fair value measurements and disclosures guidance to require additional disclosures about fair value measurements. The revised guidance requires new disclosures about the transfers in and out of Level 1 and 2 measurements, including descriptions of the reasons for the transfers. Additionally, the reconciliation of Level 3 measurements now requires separate presentation of sales, issuances and settlements. This guidance for the Level 1 and 2 measurements was adopted on January 1, 2010 and did not have an effect on our results of operations, financial position or liquidity. The guidance on the Level 3 measurements is effective for periods beginning after December 15, 2010. As this guidance provides only disclosure requirements, the adoption of this standard did not impact our results of operations, cash flows or financial position (See Note 15).
84
THE EMPIRE DISTRICT ELECTRIC COMPANY
NOTES TO CONSOLIDATED FINANCIAL STATEMENTS (Continued)
Consolidation: In June 2009, the FASB amended the accounting guidance for consolidations. This amendment is effective for annual periods beginning after November 15, 2009. The amendment requires an entity to complete a qualitative analysis when determining who must consolidate a variable interest entity (VIE). Additionally, the amendment requires additional disclosures, and an ongoing reassessment of who must consolidate a VIE. A controlling financial interest is required for a VIE and this is evidenced by either a voting interest greater than 50% or a risk and reward model that identifies EDE as the primary beneficiary of a VIE.
Upon adoption of the guidance, we concluded that the consolidation of the Empire District Electric Trust I was appropriate and we reflected it in our consolidated balance sheets in the first quarter of 2010. Subsequently, on June 28, 2010, we redeemed all 2 million outstanding shares of our 8.5% trust preferred securities held by the Trust.
We also evaluated our long-term purchase power agreements to determine if we hold a variable interest. This evaluation identified our purchase power agreement with Plum Point Energy Associates, LLC (PPEA, LLC) for capacity with Plum Point Energy Station, as a variable interest. For this contract we considered operations and maintenance of the power plant to be the most significant activity. In addition, we do not have control over the operation and maintenance of the power plant. Additionally, we have not provided debt or equity investments in PPEA, LLC, we receive less than the majority of the output of the facility under the contract and do not provide any other financial support through liquidity arrangements, guarantees or other commitments other than the purchase power agreement described in Note 11. Based on the consideration of these factors, we do not consider ourselves to be the primary beneficiary of this VIE. The adoption of this standard did not have any impact on our financial statements.
85
THE EMPIRE DISTRICT ELECTRIC COMPANY
NOTES TO CONSOLIDATED FINANCIAL STATEMENTS (Continued)
2. Property, Plant and Equipment
Our total property, plant and equipment are summarized below (in thousands).
| |
December 31, | |||||||
|---|---|---|---|---|---|---|---|---|
| |
2010 | 2009 | ||||||
Electric plant |
||||||||
Production |
$ | 1,015,040 | $ | 690,768 | ||||
Transmission |
220,514 | 203,436 | ||||||
Distribution |
682,175 | 651,657 | ||||||
General(1) |
83,413 | 74,088 | ||||||
Electric plant |
2,001,142 | 1,619,949 | ||||||
Less accumulated depreciation and amortization(2) |
575,061 | 542,226 | ||||||
Electric plant net of depreciation and amortization |
1,426,081 | 1,077,723 | ||||||
Construction work in progress |
9,214 | 301,534 | ||||||
Net electric plant |
1,435,295 | 1,379,257 | ||||||
Gas plant |
63,581 | 58,180 | ||||||
Less accumulated depreciation and amortization |
8,994 | 6,854 | ||||||
Gas plant net of accumulated depreciation |
54,587 | 51,326 | ||||||
Construction work in progress |
6 | 436 | ||||||
Net gas plant |
54,593 | 51,762 | ||||||
Water plant |
11,128 | 10,891 | ||||||
Less accumulated depreciation and amortization |
3,855 | 3,664 | ||||||
Water plant net of depreciation and amortization |
7,273 | 7,227 | ||||||
Construction work in progress |
40 | 5 | ||||||
Net water plant |
7,313 | 7,232 | ||||||
Other |
||||||||
Fiber |
32,264 | 29,564 | ||||||
Less accumulated depreciation and amortization |
10,453 | 8,842 | ||||||
Non-regulated net of depreciation and amortization |
21,811 | 20,722 | ||||||
Construction work in progress |
77 | 37 | ||||||
Net non-regulated property |
21,888 | 20,759 | ||||||
TOTAL NET PLANT AND PROPERTY |
$ | 1,519,089 | $ | 1,459,010 | ||||
- (1)
- Includes
intangible property of $20.1 and $12.1 million as of December 31, 2010 and 2009, respectively, primarily related to capitalized
software and investments in facility upgrades owned by other utilities. Accumulated amortization related to this property in 2010 and 2009 was $9.2 and $8.5 million respectively.
- (2)
- Includes regulatory amortization of $30.7 million and $23.1 million as of December 30, 2010 and 2009, respectively.
86
THE EMPIRE DISTRICT ELECTRIC COMPANY
NOTES TO CONSOLIDATED FINANCIAL STATEMENTS (Continued)
The table below summarizes the total provision for depreciation and the depreciation rates for continuing operations, both capitalized and expensed, for the years ended December 31 (in thousands):
| |
2010 | 2009 | 2008 | ||||||||
|---|---|---|---|---|---|---|---|---|---|---|---|
Provision for depreciation |
|||||||||||
Regulated — Electric and Water |
$ | 49,254 | $ | 44,973 | $ | 42,389 | |||||
Regulated — Gas |
3,046 | 2,072 | 2,016 | ||||||||
Non-Regulated |
1,641 | 1,443 | 1,319 | ||||||||
TOTAL |
53,941 | 48,488 | 45,724 | ||||||||
Amortization(1) |
8,347 | 5,159 | 9,132 | ||||||||
TOTAL |
$ | 62,288 | $ | 53,647 | $ | 54,856 | |||||
- (1)
- Includes $7.5 million, $4.5 million, and $8.2 million of regulatory amortization for 2010, 2009 and 2008, respectively. This was granted by the MPSC effective January 1, 2007 and updated August 23, 2008, and September 10, 2010.
| |
2010 | 2009 | 2008 | ||||||||
|---|---|---|---|---|---|---|---|---|---|---|---|
Annual depreciation rates |
|||||||||||
Electric and water |
2.8 | % | 2.9 | % | 3.0 | % | |||||
Gas |
5.1 | % | 3.7 | % | 3.7 | % | |||||
Non-Regulated |
5.3 | % | 5.0 | % | 4.8 | % | |||||
TOTAL COMPANY |
2.9 | % | 3.0 | % | 3.0 | % | |||||
The table below sets forth the average depreciation rate for each class of assets for each period presented:
| |
2010 | 2009 | 2008 | ||||||||
|---|---|---|---|---|---|---|---|---|---|---|---|
Annual Weighted Average Depreciation Rate |
|||||||||||
Electric fixed assets: |
|||||||||||
Production plant |
2.0 | % | 2.2 | % | 2.2 | % | |||||
Transmission plant |
2.4 | % | 2.4 | % | 2.3 | % | |||||
Distribution plant |
3.6 | % | 3.6 | % | 3.6 | % | |||||
General plant |
6.2 | % | 6.1 | % | 6.2 | % | |||||
Water |
2.7 | % | 2.7 | % | 2.8 | % | |||||
Gas |
5.1 | % | 3.7 | % | 3.7 | % | |||||
Non-regulated |
5.3 | % | 5.0 | % | 4.8 | % | |||||
3. Regulatory Matters
We continually assess the need for rate relief in all of the jurisdictions we serve and file for such relief when necessary.
Our rates for retail electric and natural gas services (other than specially negotiated retail rates for industrial or large commercial customers, which are subject to regulatory review and approval) are determined on a "cost of service" basis. Rates are designed to provide, after recovery of allowable operating expenses, an opportunity for us to earn a reasonable return on "rate base." "Rate base" is
87
THE EMPIRE DISTRICT ELECTRIC COMPANY
NOTES TO CONSOLIDATED FINANCIAL STATEMENTS (Continued)
generally determined by reference to the original cost (net of accumulated depreciation and amortization) of utility plant in service, subject to various adjustments for deferred taxes, our regulatory liability for cost of removal, and other items. Over time, rate base is increased by additions to utility plant in service and reduced by depreciation, amortization and retirement of utility plant and write-off's as ordered by the utility commissions. In general, a request of new rates is made on the basis of a "rate base" as of a date prior to the date of the request and allowable operating expenses for a 12-month test period ended prior to the date of the request. Although the current rate making process provides recovery of some future changes in rate base and operating costs, it does not reflect all changes in costs for the period in which new retail rates will be in place. This results in a lag between the time we incur costs and the time when we can start recovering the costs through rates.
The following table sets forth information regarding electric and water rate increases since January 1, 2008:
Jurisdiction
|
Date Requested |
Annual Increase Granted |
Percent Increase Granted |
Date Effective |
||||||||
|---|---|---|---|---|---|---|---|---|---|---|---|---|
Missouri — Electric |
October 29, 2009 | $ | 46,800,000 | 13.40 | % | September 10, 2010 | ||||||
Oklahoma — Electric |
March 25, 2010 | $ | 1,456,979 | 15.70 | % | September 1, 2010 | ||||||
Kansas — Electric |
November 4, 2009 | $ | 2,800,000 | 12.4 | % | July 1, 2010 | ||||||
Missouri — Gas |
June 5, 2009 | $ | 2,600,000 | 4.37 | % | April 1, 2010 | ||||||
Missouri — Electric |
October 1, 2007 | $ | 22,040,395 | 6.70 | % | August 23, 2008 | ||||||
Electric Segment
Missouri
2010 Rate Case
On September 28, 2010, we filed a rate increase request with the MPSC for an annual increase in base rates for our Missouri electric customers in the amount of $36.5 million, or 9.2% to recover the Iatan 2 costs and other cost of service items not included in the 2009 Missouri rate case (see below).
2009 Rate Case
On October 29, 2009, we filed a request with the MPSC for an annual increase in base rates for our Missouri electric customers in the amount of $68.2 million, or 19.6%. This request was primarily designed to allow us to recover capital expenditures associated with environmental upgrades at Iatan 1 and our investment in new generating units at Iatan 2 and the Plum Point Generating Station. As a result of the delay in the Iatan 2 project, however, we agreed to not seek a permanent increase in this rate case for any costs associated with the Iatan 2 unit with the exception of that portion of the Iatan common plant needed to operate Iatan 1.
A stipulated agreement was filed on May 12, 2010, calling for an annual increase of $46.8 million, provided the Plum Point Generating Station met its in-service criteria by August 15, 2010. If the in-service criteria were not met by such date, a base rate increase of $33.1 million was stipulated. The Plum Point Generating Station completed its in-service criteria testing on August 12, 2010, with an in-service date of August 13, 2010, thus new rates, providing for the full increase of $46.8 million, were effective September 10, 2010. The $46.8 million authorized increase in annual revenues includes $36.8 million in base rate revenue and $10 million in regulatory amortization. The regulatory amortization, which is treated as additional book depreciation for rate-making purposes and is reflected in the financial statements, was
88
THE EMPIRE DISTRICT ELECTRIC COMPANY
NOTES TO CONSOLIDATED FINANCIAL STATEMENTS (Continued)
granted to provide additional cash flow through rates. This regulatory amortization is related to our investments in facilities and environmental upgrades completed during the recent construction cycle. As agreed in our regulatory plan, we will use construction accounting for our Iatan 2 project. See Note 11. We have also agreed to commence an eighteen year amortization of a deferred asset related to the tax benefits of cost of removal. These tax benefits were flowed through to customers from 1981 to 2008 and totaled approximately $11.1 million. We had previously recorded a regulatory asset expecting to recover these benefits from customers in future periods. We estimated the portion of the amortization period where rate recovery would no longer be probable for this item and wrote off approximately $1.2 million in the first quarter of 2010. Amortization of the remaining regulatory tax asset will begin in 2012, which is also when we expect to be able to request rate recovery of the asset. See Note 9.
2007 Rate Case
The MPSC issued an order on July 30, 2008 in response to a request filed with the MPSC on October 1, 2007 for an annual increase in base rates for our Missouri electric customers. This order granted an annual increase in revenues for our Missouri electric customers in the amount of $22.0 million, or 6.7%, based on a 10.8% return on equity. The new rates went into effect August 23, 2008.
The order contained two components. The first component provided an addition to base rates of approximately $27.7 million. This increase in base rates was partially offset by a $5.7 million reduction to regulatory amortization, which is the second component to support certain credit metrics of the overall change in revenue authorized by the MPSC. Regulatory amortization provided us additional cash through rates during our construction cycle. This construction, which was part of our long-range plan to ensure reliability, included the facilities at the Riverton Power Plant and Iatan 2 Power Plant, as well as environmental improvements at the Asbury Power Plant and at Iatan 1. The regulatory amortization as a result of this case was approximately $4.5 million annually and was recorded as depreciation expense.
The MPSC also authorized a fuel adjustment clause for our Missouri customers effective September 1, 2008. The MPSC established a base cost for the recovery of fuel and purchased power expenses used to supply energy. The clause permits the distribution to customers of 95% of the changes in fuel and purchased power costs above or below the base cost. Off-system sales margins are also part of the recovery of fuel and purchased power costs. As a result, the off-system sales margin flows back to the customer. Rates related to the recovery of fuel and purchased power costs are modified twice a year subject to the review and approval by the MPSC. In accordance with accounting guidance for regulated activities, 95% of the difference between the actual cost of fuel and purchased power and the base cost of fuel and purchased power recovered from our customers is recorded as an adjustment to fuel and purchased power expense with a corresponding regulatory asset or a regulatory liability. If the actual fuel and purchased power costs are higher or lower than the base fuel and purchased power costs billed to customers, 95% of these amounts will be recovered or refunded to our customers when the fuel adjustment clause is modified.
The MPSC order in the rate case approved a Stipulation and Agreement providing for the recovery of deferred expenses of approximately $14.2 million over a five year period for the 2007 ice storms. In addition, the MPSC order required the implementation of a two-way tracking mechanism for recovery of the costs relating to the new MPSC rules on infrastructure inspection and vegetation management. The mechanism authorized by the MPSC created a regulatory liability in any year we spend less than the target amount, which has been set at $8.6 million for our Missouri jurisdiction, and a regulatory asset if we spend more than the target amount. Any regulatory asset and liability amounts created using the tracking mechanism will then be netted against each other and taken into account in our next rate case. The MPSC also approved Stipulations and Agreements providing for the continuation of the pension and other
89
THE EMPIRE DISTRICT ELECTRIC COMPANY
NOTES TO CONSOLIDATED FINANCIAL STATEMENTS (Continued)
post-retirement employee benefits tracking mechanism established in our 2006 and 2007 Missouri rate orders.
The MPSC issued its Report and Order on July 30, 2008, effective August 9, 2008. The OPC and intervenors Praxair, Inc. and Explorer Pipeline Company filed applications for rehearing with the MPSC regarding this order. On August 12, 2008, the MPSC issued its Order Granting Expedited Treatment and Approving Compliance Tariff Sheets, effective August 23, 2008, in which the MPSC approved our tariff sheets containing our base rates for service rendered on and after August 23, 2008, and approved our fuel adjustment clause tariff sheets effective September 1, 2008. On September 3, 2008, the MPSC denied all pending applications for rehearing.
On October 2, 2008, the OPC and intervenors Praxair, Inc. and Explorer Pipeline Company filed Petitions for Writ of Review with the Cole County Circuit Court. These actions were consolidated into one proceeding, briefs were filed and the Cole County Circuit Court heard oral arguments on September 29, 2009. The Cole County Circuit Court issued a ruling on December 31, 2009, affirming the Commission's Report and Order. OPC, Praxair and Explorer Pipeline filed appeals with the Western District Court of Appeals. Explorer Pipeline was dismissed from the pending appeal on October 18, 2010.
2006 Rate Case
In December 2008, the OPC and intervenors Praxair, Inc. and Explorer Pipeline Company filed Petitions for Writ of Review with the Cole County Circuit Court challenging the tariffs resulting from our 2006 Missouri rate case that went into effect January 1, 2007. The Cole County Circuit Court issued a ruling on December 8, 2009, affirming the Commission's Report and Order. OPC, Praxair and Explorer Pipeline filed appeals with the Western District Court of Appeals. On October 26, 2010, the Western District Court of Appeals affirmed the Commission's Report and Order. Praxair, Inc. and Explorer Pipeline Company filed with the Western District Court of Appeals a Motion for Rehearing and an Application for Transfer to the Supreme Court. On December 7, 2010, the Western District Court of Appeals overruled the Motion for Rehearing and denied the Application for Transfer to the Supreme Court. Praxair, Inc. then asked the Missouri Supreme Court to transfer the case to that court. On January 25, 2011, the request was denied.
Kansas
On November 4, 2009, we filed a request with the KCC for an annual increase in base rates for our Kansas electric customers in the amount of $5.2 million, or 24.6%. This request was primarily to allow us to recover capital expenditures associated with environmental upgrades at Iatan 1 completed in 2009 and at our Asbury plant completed in 2008 and our investment in new generating units at Iatan 2, the Plum Point Generating Station and our Riverton 12 unit that went on line in 2007. A stipulated agreement was filed on May 4, 2010, and approved by the KCC on June 25, 2010, calling for a $2.8 million, or 12.4%, increase in base rates effective July 1, 2010. We will defer depreciation and operating and maintenance expense on both Plum Point and Iatan 2 from their respective in-service dates until the effective date for rates from the next Kansas case, expected to be an abbreviated rate case that will be filed within the next year. These deferrals will be recovered over a 3 – 5 year period as determined in that next case. We will record AFUDC on all Plum Point and Iatan 2 capital expenditures incurred after January 31, 2010.
Oklahoma
On March 25, 2010, we requested a capital cost recovery rider (CCRR) at the Oklahoma Corporation Commission (OCC). The rider was designed to recover the carrying costs on our capital investment for
90
THE EMPIRE DISTRICT ELECTRIC COMPANY
NOTES TO CONSOLIDATED FINANCIAL STATEMENTS (Continued)
generation, transmission and distribution assets that have been added to the system since our last Oklahoma general rate case (May 2003), as well as investments made on an ongoing basis. As requested, the operation of the CCRR would have increased our operating revenue by approximately $3 million, or approximately 33%, in Oklahoma in a series of three steps to be followed with a general rate case in 2011. On August 30, 2010, we were granted a two-phase Capital Reliability Rider (CRR) by the OCC. The first phase of the rider was put into place for Oklahoma customers for usage on and after September 1, 2010, and results in an overall annual base revenue increase of approximately $1.5 million, or 15.7%. In total, the CRR revenue has been specifically limited by the OCC to an overall annual revenue increase of $2.6 million, or 27.67% increase. On January 28, 2011 we requested the approval by the OCC of the phase 2 rates of the CRR. We requested an additional $1.1 million, which brings the total annual revenue under the OCC to approximately $2.5 million. We will file a general rate case within six months of the commercial operation date of Iatan 2 (which was December 31, 2010) to replace the CRR with permanent rates.
Arkansas
On August 19, 2010, we filed a rate increase request with the Arkansas Public Service Commission (APSC) for an annual increase in base rates for our Arkansas electric customers in the amount of $3.2 million, or 27.3%. On February 2, 2011 we entered into a unanimous settlement agreement with the parties involved. The settlement includes a general rate increase of $2.1 million, or 19%. The settlement calls for the implementation of a new tariff, the Transmission Cost Recovery Rider (TCR) designed to track changes in the cost of transmission charges from the Southwest Power Pool, Inc. The existing Energy Cost Recovery Rider was also modified to include the recovery of the costs associated with certain air quality control materials. A hearing on the settlement has been scheduled for March 8, 2011 at the APSC.
FERC
On March 12, 2010, we filed GFR tariffs with the FERC which we propose to be utilized for our wholesale customers. On May 28, 2010, the FERC issued an order that conditionally approved our GFR filing subject to refund effective June 1, 2010. As of December 31, 2010 we estimate approximately $0.6 million of this amount will be subject to refund and have reduced our revenue accordingly. On June 30, 2010, three of our on-system wholesale customers were granted intervention in the GFR rate case. Also on May 28, 2010, we filed a notice with the FERC requesting termination of the current bundled service agreements for our wholesale customers effective July 31, 2010. On July 28, 2010, the FERC issued an order accepting and suspending the proposed terminations for a nominal period to become effective July 31, 2010, subject to refund. The FERC's order also consolidated the GFR and termination proceedings. On September 15, 2010, the parties agreed to a settlement in principle and are now working to finalize the terms of the settlement.
Gas Segment
On June 5, 2009, we filed a request with the MPSC for an annual increase in base rates for our Missouri gas customers in the amount of $2.9 million, or 4.9%. In this filing, we requested recovery of the ongoing cost of operating and maintaining our 1,200-mile gas distribution system and a return on equity of 11.3%. On February 24, 2010, the MPSC unanimously approved an agreement among the Office of the Public Counsel (OPC), the MPSC staff and Empire for an increase of $2.6 million. Pursuant to the Agreement, new rates went into effect on April 1, 2010.
91
THE EMPIRE DISTRICT ELECTRIC COMPANY
NOTES TO CONSOLIDATED FINANCIAL STATEMENTS (Continued)
Electric Segment
SPP-RTO
Energy Imbalance Services: On February 1, 2007, the Southwest Power Pool (SPP) regional transmission organization (RTO) launched its energy imbalance services market (EIS). In general, the SPP RTO EIS market provides real time energy for most participating members within the SPP regional footprint. Imbalance energy prices are based on market bids and status/availability of dispatchable generation and transmission within the SPP market footprint. In addition to energy imbalance service, the SPP RTO performs a real time security-constrained economic dispatch of all generation voluntarily offered into the EIS market to the market participants to also serve the native load.
Day-Ahead Market: The SPP and its members have been evaluating the costs and benefits on expanding the EIS market into a full day ahead energy market with a co-optimized ancillary services market, which will include the consolidation of all SPP balancing authorities, including ours, into a single SPP balancing authority. On April 28, 2009, the SPP Regional State Committee (SPP RSC), whose members include state commissioners from our four state commissions, and the SPP Board of Directors (SPP BOD) endorsed a cost benefit report that recommended the SPP RTO move forward with the development of a day-ahead market with unit commitment and co-optimized ancillary services market (Day-Ahead Market) and implement the complete Day-Ahead Market as soon as practical, which is anticipated in late 2013 or early 2014. As part of the Day-Ahead Market, the SPP RTO will create, prior to implementation of such market, a single NERC approved balancing authority to take over balancing authority responsibilities for its members, including us, which is expected to provide operational and economic benefits for our customers. The implementation of the Day-Ahead Market will replace the existing EIS market, which to date has, and is expected to continue to, provide benefits for our customers.
SPP Regional Transmission Development: On August 15, 2008, the SPP filed with the FERC proposed revisions to its open access transmission pro forma tariff (OATT) to establish a process for including a "balanced portfolio" of economic transmission upgrades in the annual SPP Transmission Expansion Plan. The cost of such upgrades will be recovered through a regional rate allocated to SPP members based on their load ratio share within SPP's market area of the balanced portfolio's cost. On October 16, 2008, the FERC accepted the balanced portfolio approach, which sets forth the selection process of a group of projects and regional cost allocation rules based on projected benefits and allocated costs over a ten year period. The plan will be balanced if the portfolio is cost beneficial for each zone, including ours, within the SPP. A balanced portfolio could include projects below the 345 kv level (which is the bright line voltage level for projects to be included in the portfolio) to increase benefits to a particular zone to achieve balance of benefits and costs over the ten year study period. On April 28, 2009, the SPP RSC and the SPP BOD approved the first set of balanced portfolio extra high voltage transmission projects to be constructed within the SPP region. The transmission expansion projects, totaling over $840 million, include projects in Missouri, Kansas, Arkansas, Oklahoma, Nebraska and Texas. We anticipate this set of transmission expansion projects will provide long term benefits to our customers. While we do not project our allocated costs for the balanced portfolio projects to be material, we expect that the costs will be recoverable in future rates. Also on April 28, 2009, the SPP RSC and BOD approved a new report that recommended restructuring of the SPP's regional planning processes, which would establish an integrated planning process for reliability, transmission service and economic transmission projects, based on a new set of planning principles that focus on the construction of a more robust transmission system large enough in both scale and geography to provide flexibility to meet SPP members' and customers' future needs. We will continue to actively participate in the development of these new processes as well as cost allocation and
92
THE EMPIRE DISTRICT ELECTRIC COMPANY
NOTES TO CONSOLIDATED FINANCIAL STATEMENTS (Continued)
recovery issues with members, prospective customers and the state commission representatives to the SPP RSC.
On October 27, 2009, the SPP BOD endorsed a new transmission cost allocation method to replace the existing FERC accepted cost allocation method for new transmission facilities needed to continue to reliably and economically serve SPP customers, including ours, well into the future. On April 19, 2010, SPP filed revisions to its OATT to adopt a new highway/byway cost allocation methodology which require SPP BOD approved transmission projects of 300 kV or larger to be funded by the region at 100%, transmission projects between 100 kV and 300 kV to receive 33% regional funding with individual constructing zones to pay 67% of those projects built within the zone. For projects under 100kV, the constructing zones would pay 100% of the cost. On May 17, 2010, we filed a joint protest at the FERC with other SPP members based on our disagreement with the SPP on the allocation percentages and various other issues. On June 17, 2010, the FERC unconditionally approved the new highway/byway cost allocation method. We and other members of the SPP filed a Request for Rehearing on July 19, 2010. It is uncertain as to when or if the FERC will rule on our Request for Rehearing. To date, the SPP's BOD has approved $1.4 billion in highway/byway projects to be constructed over the next several years. As these projects are constructed, we will be allocated a share of the costs of the projects pursuant to the FERC accepted cost allocation method. We expect that these costs will be recoverable in future rates.
In a related but separate filing, on May 17, 2010, the SPP filed revisions to its OATT to incorporate a modified transmission planning process, the Integrated Transmission Plan (ITP) that the SPP will use to determine its near and long term transmission needs to meet reliability and provide economic benefits throughout the SPP region. On June 7, 2010, we made a joint protest filing at the FERC regarding the ITP filing which expressed our concerns over the lack of explicit provisions in the SPP OATT to protect SPP customers from the approval of transmission projects that may not sufficiently benefit the SPP region. On July 15, 2010, the FERC issued an order conditionally accepting SPP proposed ITP planning process and tariff provisions to be effective on July 17, 2010, and ordered SPP to make a compliance filing by August 15, 2010, on the timing of ITP business practices and factors to be considered for changing the allocation of costs methods for dual winding high voltage transformers. We and the other parties to the SPP ITP jointly filed a formal Request for Rehearing at the FERC on the ITP order on August 13, 2010. On September 7, 2010, the FERC granted our Request For Rehearing to allow additional time for FERC's further consideration.
FERC Market Power Order
As part of our market based pricing authority from the FERC, we are required to conduct a market power analysis within our service territory and within the SPP RTO region every three years. We filed our triennial market power analysis with the FERC on July 30, 2009, concluding there were no material changes to our market position. As a result, we did not anticipate any changes to our existing market based rate authority. On July 13, 2010, the FERC issued an order accepting our triennial market power analysis and authorized the continuation of our market based rate authority for wholesale transactions outside our service territory.
Other FERC Activity
On May 21, 2009, the FERC issued an order clarifying that, going forward, small public utilities that have been granted waiver of Order No. 889 (Open Access Same Time Information Systems (OASIS) requirement) and the Standards of Conduct for transmission operations, which includes us, are required to submit a notification filing if there has been a material change in facts that may affect the basis on which a public utility's waiver was premised. The Standards of Conduct generally govern the communications
93
THE EMPIRE DISTRICT ELECTRIC COMPANY
NOTES TO CONSOLIDATED FINANCIAL STATEMENTS (Continued)
between our day to day transmission operations personnel and our day to day wholesale marketing and sales personnel. We submitted our filing on July 13, 2009 in which we stated our belief that continuation of our waiver, issued in 1997 and reaffirmed in 2004, was appropriate and reasonable. Based on the May 21, 2009 order, it is possible that the FERC will revoke our waiver which would impact communication between our transmission and wholesale marketing and sales functions and operations within our organization. As part of our filing, we sought a twelve month extension in order to comply with the Standard of Conduct requirements in the event the FERC determined that revoking our waiver was appropriate. The FERC's decision on this and other Standard of Conduct waiver filings is pending. As of July 19, 2010, we have voluntarily taken steps to allow us to comply with a FERC order with minimal additional impact.
On June 17, 2010, FERC issued a Notice of Proposed Rulemaking (NOPR) proposing to amend the transmission planning and cost allocation requirements established in Order No. 890 to ensure that FERC-jurisdictional services are provided on a basis that is just, reasonable and not unduly discriminatory or preferential. With respect to transmission planning, FERC said that the proposed rule would: (1) provide that local and regional transmission planning processes account for transmission needs driven by public policy requirements established by state or federal laws or regulations; (2) improve coordination between neighboring transmission planning regions with respect to interregional facilities; and (3) remove from FERC-approved tariffs or agreements a right of first refusal created by those documents that provides an incumbent transmission provider with an undue advantage over a non-incumbent transmission developer. Neither incumbent nor non-incumbent transmission facility developers should, as a result of a FERC-approved tariff or agreement, receive different treatment in a regional transmission planning process, FERC contended. Further, both should share similar benefits and obligations commensurate with that participation, including the right, consistent with state or local laws or regulations, to construct and own a facility that it sponsors in a regional transmission planning process and that is selected for inclusion in the regional transmission plan. With respect to cost allocation, the proposed rule would establish a closer link between transmission planning processes and cost allocation and would require cost allocation methods for intraregional and interregional transmission facilities to satisfy newly established cost allocation principles. We participated in the development of comments by the SPP RTO which were filed at FERC on September 29, 2010. We will continue to monitor the NOPR as it may affect our existing rights to construct transmission facilities in our service territory as well as high voltage transmission expansion and cost allocation that will affect our cost of delivery service to our customers.
Gas Segment
Non-residential gas customers whose annual usage exceeds certain amounts may purchase natural gas from a source other than EDG. EDG does not have a non-regulated energy marketing service that sells natural gas in competition with outside sources. EDG continues to receive non-gas related revenues for distribution and other services if natural gas is purchased from another source by our eligible customers.
In accordance with ASC guidance on regulated operations, we currently have deferred approximately $1.5 million of expense related to rate cases under other non-current assets and deferred charges. These amounts will be amortized over varying periods based upon the completion of the specific cases. Based on past history, we expect all these expenses to be recovered in rates.
94
THE EMPIRE DISTRICT ELECTRIC COMPANY
NOTES TO CONSOLIDATED FINANCIAL STATEMENTS (Continued)
Regulatory Assets and Liabilities and Other Deferred Credits
The Missouri Public Service Commission (MPSC) approved a regulatory plan in 2005, allowing construction accounting. Construction accounting, for the purposes of this regulatory plan, is specific to Iatan 1 and Iatan 2 and allows us to defer certain charges as regulatory assets. These deferred charges include depreciation, operations and maintenance and carrying costs related to operation of the facilities until the facilities are ultimately included in our rates. The regulatory plan also requires us to continue to defer the fuel and purchased power expense impacts of Iatan 2, which were approximately $3.1 million for the year and are recorded in Non-Current Regulatory Liabilities. Construction accounting began for Iatan 2 which met its in-service criteria on August 26, 2010. In addition, in our recently completed Missouri rate case, construction accounting was approved for Plum Point, which met its in-service criteria on August 13, 2010. Construction accounting for Plum Point applies only to construction costs incurred subsequent to February 28, 2010. All of these deferrals begin at the in-service dates and will be amortized over the life of the plants once they are included in our rates, which we estimate to be upon completion of our Missouri rate case filed on September 28, 2010. (See Note 11 for additional details). The following table sets forth the costs related to construction accounting (in thousands):
Balances as of December 31, 2010
|
Deferred Carrying Charges |
Deferred O&M |
Depreciation | Total | ||||||||||
|---|---|---|---|---|---|---|---|---|---|---|---|---|---|---|
Iatan 1 |
$ | 2,779 | 1,388 | 1,682 | $ | 5,849 | ||||||||
Iatan 2 |
$ | 1,770 | 1,643 | 1,111 | $ | 4,524 | ||||||||
Plum Point |
$ | 33 | 70 | 45 | $ | 148 | ||||||||
Total |
$ | 10,521 | ||||||||||||
Changes to regulatory assets and liabilities regarding their rate base inclusion or amortizable lives since December 31, 2009 include the amortization of Iatan 1 construction accounting costs effective September 10, 2010, of approximately $0.1 million per year, over the life of the plant, amortization of vegetation tracker costs in Missouri over five years, the write off of approximately $1.2 million of tax amortization in the first quarter of 2010 for which we estimated rate recovery would no longer be probable and amortization of ice storm costs in Kansas. See Note 9 — Income Taxes for additional information.
95
THE EMPIRE DISTRICT ELECTRIC COMPANY
NOTES TO CONSOLIDATED FINANCIAL STATEMENTS (Continued)
The following table sets forth the components of our regulatory assets and regulatory liabilities on our consolidated balance sheet (in thousands).
| |
December 31, | ||||||
|---|---|---|---|---|---|---|---|
| |
2010 | 2009 | |||||
Regulatory Assets: |
|||||||
Under recovered purchased gas costs — gas segment — current |
$ | — | $ | 434 | |||
Under recovered electric fuel and purchased power costs — current |
4,974 | 338 | |||||
Regulatory assets, current(1) |
4,974 | 772 | |||||
Pension and other postretirement benefits(2) |
92,192 | 81,171 | |||||
Income taxes |
50,188 | 49,230 | |||||
Storm costs(3) |
7,733 | 11,673 | |||||
Unamortized loss on reacquired debt |
13,099 | 12,167 | |||||
Unamortized loss on interest rate derivative |
1,776 | 2,091 | |||||
Asbury five-year maintenance |
948 | 1,401 | |||||
Deferred Iatan construction accounting costs |
10,521 | 2,732 | |||||
Asset retirement obligation |
3,412 | 3,264 | |||||
Under recovered electric fuel and purchased power costs |
— | 662 | |||||
Under recovered purchased gas costs — gas segment |
439 | — | |||||
Unsettled derivative losses — electric segment |
3,166 | 335 | |||||
Customer programs |
2,119 | 1,255 | |||||
System reliability — vegetation management |
3,338 | 1,636 | |||||
Other |
473 | 637 | |||||
Regulatory assets, long-term |
189,404 | 168,254 | |||||
TOTAL REGULATORY ASSETS |
$ | 194,378 | $ | 169,026 | |||
Regulatory Liabilities |
|||||||
Over recovered purchased gas costs — gas segment — current |
$ | 1,243 | $ | — | |||
Regulatory liabilities, current(5) |
1,243 |
— |
|||||
Costs of removal |
62,756 | 53,083 | |||||
Income taxes |
12,715 | 20,678 | |||||
Unamortized gain on interest rate derivative |
3,881 | 4,051 | |||||
Pension and other postretirement benefits(4) |
4,604 | 6,415 | |||||
Deferred construction accounting costs — fuel |
3,126 | — | |||||
Over recovered electric fuel and purchased power costs(5) |
155 | 1,344 | |||||
Over recovered purchased gas costs — gas segment |
— | 1,874 | |||||
Other |
342 | 88 | |||||
Regulatory liabilities, long-term |
87,579 | 87,533 | |||||
TOTAL REGULATORY LIABILITIES |
$ | 88,822 | $ | 87,533 | |||
- (1)
- Reflects
under recovered costs expected to be recovered within the next 12 months in Missouri rates.
- (2)
- Primarily reflects regulatory assets resulting from the unfunded portion of our pension and OPEB liabilities and regulatory accounting for EDG acquisition costs. Approximately $0.5 million in pension and other postretirement benefit costs have been recognized since January 1, 2010 to reflect the
96
THE EMPIRE DISTRICT ELECTRIC COMPANY
NOTES TO CONSOLIDATED FINANCIAL STATEMENTS (Continued)
amortization of the regulatory assets that were recorded at the time of the EDG acquisition of the Aquila, Inc. gas properties.
- (3)
- Primarily
reflects ice storm costs incurred in 2007.
- (4)
- Includes
the effect of costs incurred that are more or less than those allowed in rates for the Missouri (EDE and EDG) and Kansas (EDE) portion of pension
and other postretirement benefit costs. Since January 1, 2010, regulatory liabilities and corresponding expenses have been reduced by approximately $0.9 million as a result of ratemaking
treatment.
- (5)
- Primarily consists of Missouri over recovered fuel and purchased power costs for the current accumulation period September 2010 through February 2011.
Unamortized losses on debt and losses on interest rate derivatives are not included in rate base, but are included in our capital structure for rate base purposes. The remainder of our regulatory assets are not included in rate base, generally because they are not cash items or they are earning carrying costs. However, as of December 31, 2010, the costs of all of our regulatory assets are currently being recovered except for the deferred Iatan 2 and Plum Point costs discussed above, and approximately $84.4 million of pension and other postretirement costs primarily related to the unfunded liabilities for future pension and OPEB costs. The amount and timing of recovery of this item will be based on the changing funded status of the pension and OPEB plans in future periods.
The regulatory income tax assets and liabilities are generally amortized over the average depreciable life of the related assets. The loss on reacquired debt and the loss and gain on interest rate derivatives are amortized over the life of the related new debt issue, which currently ranges from 4 to 26 years. The unrecovered fuel costs are generally recovered within a year following their recognition. Ice storm costs and the Asbury five-year maintenance costs are recovered over five years. Pension and other postretirement benefit tracking mechanisms are recovered over a five year period. The cost of removal regulatory liability is amortized as removal costs are incurred.
4. Common Stock
We successfully completed an equity distribution program during the second quarter of 2010 and used the net proceeds to repay short-term debt and for general corporate purposes, including the funding of our construction program. During 2010, we issued and sold 2,870,985 shares of our common stock pursuant to this equity distribution program, at an average price per share of $18.41, resulting in net proceeds to us of approximately $51.3 million. Since inception of the program on February 25, 2009, in the aggregate, we issued and sold 6,535,216 shares pursuant to the program, at an average price per share of $18.36, resulting in net proceeds to us of approximately $116.0 million. Sales of the shares pursuant to the equity distribution agreement were made at market prices or as otherwise agreed with UBS, our underwriter.
We have several stock-based awards and programs, which are described below. Performance based restricted stock awards, stock options and their related dividend equivalents are valued as liability awards, in accordance with fair value guidelines. We allow employees to elect to have taxes in excess of the minimum statutory requirements withheld from their awards and, therefore, the awards are classified as liability instruments under the ASC guidance on share based payment. Awards treated as liability instruments must be revalued each period until settled, and cost is accrued over the requisite service period and adjusted to fair value at each reporting period until settlement or expiration of the award.
97
THE EMPIRE DISTRICT ELECTRIC COMPANY
NOTES TO CONSOLIDATED FINANCIAL STATEMENTS (Continued)
We recognized the following amounts in compensation expense and tax benefits for all of our stock-based awards and programs for the applicable years ended December 31 (in thousands):
| |
2010 | 2009 | 2008 | |||||||
|---|---|---|---|---|---|---|---|---|---|---|
Compensation expense |
$ | 3,193 | $ | 2,292 | $ | 1,841 | ||||
Tax benefit recognized |
1,160 | 819 | 659 | |||||||
Our 2006 Stock Incentive Plan (the 2006 Incentive Plan) was adopted by shareholders at the annual meeting on April 28, 2005 and provides for grants of up to 650,000 shares of common stock through January 2016. The 2006 Stock Incentive Plan permits grants of stock options and restricted stock to qualified employees and permits Directors and, if approved by the Compensation Committee of the Board of Directors, qualified employees to receive common stock in lieu of cash. Certain executive officers and other senior managers applied to receive annual incentive awards related to 2008, 2009, and 2010 performance in the form of Empire common stock rather than cash. These requests were granted by the Compensation Committee of the Board of Directors under the terms of our 2006 Stock Incentive Plan. The terms and conditions of any option or stock grant are determined by the Board of Directors Compensation Committee, within the provisions of these Stock Incentive Plans.
Performance-Based Restricted Stock Awards
Performance-based restricted stock awards are granted to qualified individuals consisting of the right to receive a number of shares of common stock at the end of the restricted period assuming performance criteria are met. The performance measure for the award is the total return to our shareholders over a three-year period compared with an investor-owned utility peer group. The threshold level of performance under the 2008, 2009 and 2010 grants was set at the 20th percentile level of the peer group, target at the 50th percentile level, and the maximum at the 80th percentile level. Shares would be earned at the end of the three-year performance period as follows: 100% of the target number of shares if the target level of performance is reached, 50% if the threshold is reached, and 200% if the percentile ranking is at or above the maximum, with the number of shares interpolated between these levels. However, no shares would be payable if the threshold level is not reached. As noted previously, all performance-based restricted stock awards are classified as liability instruments, which must be revalued each period until settled. The fair value of the outstanding restricted stock awards was estimated as of December 31, 2010, 2009 and 2008 using a Monte Carlo option valuation model. The assumptions used in the model for each grant year are noted in the following table:
| |
Fair Value of Grants Outstanding at December 31, | |||||
|---|---|---|---|---|---|---|
| |
2010 | 2009 | 2008 | |||
Risk-free interest rate |
0.30% to 0.62% | 0.47% to 1.08% | 0.37% to 0.66% | |||
Expected volatility of Empire stock |
26.9% | 28.8% | 26.6% | |||
Expected volatility of peer group stock |
21.7% to 82.7% | 22.1% to 80.9% | 20.5% to 68.7% | |||
Expected dividend yield on Empire stock |
6.5% | 7.6% | 6.4% | |||
Expected forfeiture rates |
3% | 3% | 3% | |||
Plan cycle |
3 years | 3 years | 3 years | |||
Fair value percentage |
138.0% to 193.7% | 87.0% to 132.0% | 99.0% to 124.0% | |||
Weighted average fair value per share |
$37.17 | $21.00 | $19.23 | |||
98
THE EMPIRE DISTRICT ELECTRIC COMPANY
NOTES TO CONSOLIDATED FINANCIAL STATEMENTS (Continued)
Non-vested restricted stock awards (based on target number) as of December 31, 2010, 2009 and 2008 and changes during the year ended December 31, 2010, 2009 and 2008 were as follows:
| |
2010 | 2009 | 2008 | ||||||||||||||||
|---|---|---|---|---|---|---|---|---|---|---|---|---|---|---|---|---|---|---|---|
| |
Number of Shares |
Weighted Average Grant Date Fair Value |
Number of Shares |
Weighted Average Grant Date Fair Value |
Number Of Shares |
Weighted Average Grant Date Fair Value |
|||||||||||||
Outstanding at January 1, |
52,200 | $ | 21.57 | 52,300 | $ | 22.64 | 43,400 | $ | 23.02 | ||||||||||
Granted |
13,000 | $ | 18.36 | 13,500 | $ | 18.12 | 21,000 | $ | 21.92 | ||||||||||
Awarded |
(15,104 | ) | $ | 23.81 | (12,394 | ) | $ | 22.23 | (6,486 | ) | $ | 22.77 | |||||||
Not awarded |
(2,596 | ) | $ | — | (1,206 | ) | $ | — | (5,614 | ) | $ | — | |||||||
Nonvested at December 31, |
47,500 | $ | 19.86 | 52,200 | $ | 21.57 | 52,300 | $ | 22.64 | ||||||||||
At December 31, 2010 and 2009, unrecognized compensation expense related to estimated outstanding awards was $0.4 million and $0.4 million, respectively.
Stock options are issued with an exercise price equal to the fair market value of the shares on the date of grant, become exercisable after three years and expire ten years after the date granted. Participants' options that are not vested become forfeited when participants leave Empire except for terminations of employment under certain specified circumstances. Dividend equivalent awards are also issued to the recipients of the stock options under which dividend equivalents will be accumulated for the three-year period until the option becomes exercisable. Dividend equivalents cease to be accumulated on the date that a participant leaves Empire, and the accumulated dividend equivalents are forfeited when a participant leaves the Company, except for terminations of employment under certain specified circumstances. The fair value per dividend equivalent grants for 2010, 2009 and 2008 outstanding at December 31, 2010, were $3.79, $3.83 and $3.84, respectively.
The dividend equivalents are accumulated for the three-year period and are converted to shares of common stock based on the fair market value of the shares on the date converted. As per Section 409A of the Internal Revenue Code, added by the American Jobs Creation Act of 2004, the dividend equivalent awards vest and are payable in fully vested shares of our common stock on the third anniversary of the grant date (conversion date) or at a change in control and not dependent upon the exercise of the related option.
99
THE EMPIRE DISTRICT ELECTRIC COMPANY
NOTES TO CONSOLIDATED FINANCIAL STATEMENTS (Continued)
As noted previously, all outstanding stock option awards are classified as liability instruments, which must be revalued each period until settled. Stock option grants vest upon satisfaction of service conditions. The cost of the awards is generally recognized over the requisite (explicit) service period. The fair value of the outstanding options was estimated as of December 31, 2010, 2009 and 2008, under a Black-Scholes methodology. The assumptions used in the valuations are shown below:
| |
Fair Value of Grants Outstanding at December 31, | |||||
|---|---|---|---|---|---|---|
| |
2010 | 2009 | 2008 | |||
Risk-free interest rate |
0.45% to 2.34% | 1.11% to 2.98% | 0.85% to 1.70% | |||
Dividend yield |
6.5% | 7.6% | 6.4% | |||
Expected volatility |
23.0% | 24.0% | 24.0% | |||
Expected life in months |
78 | 78 | 78 | |||
Market value |
$22.20 | $18.73 | $17.60 | |||
Weighted average fair value per option |
$2.02 | $0.97 | $0.78 | |||
A summary of option activity under the plan during the years ended December 31, 2010, 2009 and 2008 is presented below:
| |
2010 | 2009 | 2008 | ||||||||||||||||
|---|---|---|---|---|---|---|---|---|---|---|---|---|---|---|---|---|---|---|---|
| |
Options | Weighted Average Exercise Price |
Options | Weighted Average Exercise Price |
Options | Weighted Average Exercise Price |
|||||||||||||
Outstanding at January 1, |
232,600 | $ | 22.19 | 205,600 | $ | 22.73 | 149,200 | $ | 23.04 | ||||||||||
Granted |
34,800 | $ | 18.36 | 27,000 | $ | 18.12 | 56,400 | $ | 21.92 | ||||||||||
Exercised |
— | $ | — | — | $ | — | — | $ | — | ||||||||||
Outstanding at December 31, |
267,400 | $ | 21.69 | 232,600 | $ | 22.19 | 205,600 | $ | 22.73 | ||||||||||
Exercisable, end of year |
149,200 | $ | 23.04 | 85,000 | $ | 22.46 | 43,300 | $ | 22.67 | ||||||||||
The aggregate intrinsic value at December 31, 2010 was $0.3 million and immaterial for both 2009 and 2008. The intrinsic value of the unexercised options is the difference between the Company's closing stock price on the last day of the period and the exercise price multiplied by the number of in-the-money options, had all option holders exercised their options on the last day of the period.
The range of exercise prices for the options outstanding at December 31, 2010 was $18.12 to $23.81. The weighted-average remaining contractual life of outstanding options at December 31, 2010, 2009 and 2008 was 6.6, 6.6 and 7.1 years, respectively. As of December 31, 2010, this includes 149,200 shares at the weighted average price of $23.04, which are vested and exercisable. All others are non-vested. As of December 31, 2010 and 2009, there was $0.2 and $0.2 million, respectively, of unrecognized compensation expense related to non-vested options and related dividend equivalents granted under the plan.
100
THE EMPIRE DISTRICT ELECTRIC COMPANY
NOTES TO CONSOLIDATED FINANCIAL STATEMENTS (Continued)
Our Employee Stock Purchase Plan (ESPP) permits the grant to eligible employees of options to purchase common stock at 90% of the lower of market value at date of grant or at date of exercise. The lookback feature of this plan is valued at 90% of the Black-Scholes methodology plus 10% of the maximum subscription price. As of December 31, 2010, there were 331,021 shares available for issuance in this plan.
| |
2010 | 2009 | 2008 | |||||||
|---|---|---|---|---|---|---|---|---|---|---|
Subscriptions outstanding at December 31, |
71,326 | 68,591 | 48,413 | |||||||
Maximum subscription price |
$ | 16.06 | (1) | $ | 14.62 | $ | 18.57 | |||
Shares of stock issued |
66,723 | 44,265 | 38,803 | |||||||
Stock issuance price |
$ | 14.62 | $ | 14.10 | $ | 18.61 | ||||
- (1)
- Stock will be issued on the closing date of the purchase period, which runs from June 1, 2010 to May 31, 2011.
Assumptions for valuation of these shares are shown in the table below.
| |
2010 | 2009 | 2008 | |||||||
|---|---|---|---|---|---|---|---|---|---|---|
Weighted average fair value of grants |
$ | 2.28 | $ | 3.26 | $ | 3.46 | ||||
Risk-free interest rate |
0.35 | % | 0.48 | % | 2.17 | % | ||||
Dividend yield |
7.20 | % | 7.90 | % | 6.20 | % | ||||
Expected volatility(1) |
17.00 | % | 40.00 | % | 26.00 | % | ||||
Expected life in months |
12 | 12 | 12 | |||||||
Grant date |
6/1/10 | 6/1/09 | 6/2/08 | |||||||
- (1)
- One-year historic volatility
Our Stock Unit Plan for directors (Stock Unit Plan) provides a stock-based compensation program for directors. This plan enhances our ability to attract and retain competent and experienced directors and allows the directors the opportunity to accumulate compensation in the form of common stock units. The Stock Unit Plan also provides directors the opportunity to convert previously earned cash retirement benefits to common stock units. All eligible directors who had benefits under the prior cash retirement plan converted their cash retirement benefits to common stock units.
A total of 400,000 shares are authorized under this plan. Each common stock unit earns dividends in the form of common stock units and can be redeemed for shares of common stock. The number of units granted annually is computed by dividing an annual credit (determined by the Compensation Committee) by the fair market value of our common stock on January 1 of the year the units are granted. Common stock unit dividends are computed based on the fair market value of our stock on the dividend's record date. We record the related compensation expense at the time we make the accrual for the directors' benefits as the directors provide services. At December 31, 2010 and 2009, there were 139,912 and 112,895
101
THE EMPIRE DISTRICT ELECTRIC COMPANY
NOTES TO CONSOLIDATED FINANCIAL STATEMENTS (Continued)
shares accrued to directors' accounts, respectively; and 311,523 and 317,870 shares available for issuance under this plan, respectively.
| |
2010 | 2009 | 2008 | |||||||
|---|---|---|---|---|---|---|---|---|---|---|
Units accrued for service and dividends |
33,364 | 33,024 | 20,979 | |||||||
Units redeemed for common stock |
6,347 | 34,853 | 3,484 | |||||||
Our Employee 401(k) Plan and ESOP (the 401(k) Plan) allows participating employees to defer up to 25% of their annual compensation up to an Internal Revenue Service specified limit. We match 50% of each employee's deferrals by contributing shares of our common stock, with such matching contributions not to exceed 3% of the employee's eligible compensation. We record the compensation expense at the time the quarterly matching contributions are made to the plan. At December 31, 2010 and 2009, there were 104,601 and 169,431 shares available to be issued, respectively.
| |
2010 | 2009 | 2008 | |||||||
|---|---|---|---|---|---|---|---|---|---|---|
Shares contributed |
64,830 | 73,408 | 59,253 | |||||||
Holders of our common stock are entitled to dividends, if, as, and when declared by the Board of Directors, out of funds legally available therefore subject to the prior rights of holders of any outstanding cumulative preferred stock and preference stock. Payment of dividends is determined by our Board of Directors after considering all relevant factors, including the amount of our retained earnings, which is essentially our accumulated net income less dividend payouts. As of December 31, 2010, our retained earnings balance was $5.5 million, compared to $10.1 million at December 31, 2009 after paying out $52.0 million in dividends during 2010. A reduction of our dividend per share, partially or in whole, could have an adverse effect on our common stock price. On February 3, 2011, the Board of Directors declared a quarterly dividend of $0.32 per share on common stock payable March 15, 2011 to holders of record as of March 1, 2011.
Under Kansas corporate law, our Board of Directors may only declare and pay dividends out of our surplus or, if there is no surplus, out of our net profits for the fiscal year in which the dividend is declared or the preceding fiscal year, or both. Our surplus, under Kansas law, is equal to our retained earnings plus accumulated other comprehensive income/(loss), net of income tax. However, Kansas law does permit, under certain circumstances, our Board of Directors to transfer amounts from capital in excess of par value to surplus. In addition, Section 305(a) of the Federal Power Act (FPA) prohibits the payment by a utility of dividends from any funds "properly included in capital account". There are no additional rules or regulations issued by the FERC under the FPA clarifying the meaning of this limitation. However, several decisions by the FERC on specific dividend proposals suggest that any determination would be based on a fact-intensive analysis of the specific facts and circumstances surrounding the utility and the dividend in question, with particular focus on the impact of the proposed dividend on the liquidity and financial condition of the utility.
In addition, the EDE Mortgage and our Restated Articles contain certain dividend restrictions. The most restrictive of these is contained in the EDE Mortgage, which provides that we may not declare or pay any dividends (other than dividends payable in shares of our common stock) or make any other distribution on, or purchase (other than with the proceeds of additional common stock financing) any
102
THE EMPIRE DISTRICT ELECTRIC COMPANY
NOTES TO CONSOLIDATED FINANCIAL STATEMENTS (Continued)
shares of, our common stock if the cumulative aggregate amount thereof after August 31, 1944 (exclusive of the first quarterly dividend of $98,000 paid after said date) would exceed the sum of $10.75 million and the earned surplus (as defined in the EDE Mortgage) accumulated subsequent to August 31, 1944, or the date of succession in the event that another corporation succeeds to our rights and liabilities by a merger or consolidation. On March 11, 2008, we amended the EDE Mortgage in order to provide us with more flexibility to pay dividends to our shareholders by increasing the basket available to pay dividends by $10.75 million, as described above. As of December 31, 2010, this restriction did not prevent us from issuing dividends.
5. Preferred and Preference Stock
We have 2.5 million shares of preference stock authorized, including 0.5 million shares of Series A Participating Preference Stock, none of which have been issued. We have 5 million shares of $10.00 par value cumulative preferred stock authorized. There was no preferred stock issued and outstanding at December 31, 2010 or 2009.
Preference Stock Purchase Rights
Our shareholder rights plan provided each of the common stockholders one Preference Stock Purchase Right (Right) for each share of common stock owned. The shareholder rights plan, dated as of July 26, 2000, expired on July 25, 2010, pursuant to its terms. There were 38.0 million rights outstanding at December 31, 2009. As a result of the expiration, no rights were outstanding at December 31, 2010.
103
THE EMPIRE DISTRICT ELECTRIC COMPANY
NOTES TO CONSOLIDATED FINANCIAL STATEMENTS (Continued)
6. Long-Term Debt
At December 31, 2010 and 2009, the balance of long-term debt outstanding was as follows (in thousands):
| |
2010 | 2009 | |||||||
|---|---|---|---|---|---|---|---|---|---|
Note payable to securitization trust(1) |
$ | — | $ | 50,000 | |||||
First mortgage bonds (EDE): |
|||||||||
61/2% Series due 2010 |
— | 50,000 | |||||||
7.20% Series due 2016 |
25,000 | 25,000 | |||||||
5.3% Pollution Control Series due 2013(2) |
8,000 | 8,000 | |||||||
5.2% Pollution Control Series due 2013(2) |
5,200 | 5,200 | |||||||
5.875% Series due 2037(3) |
80,000 | 80,000 | |||||||
6.375% Series due 2018(3) |
90,000 | 90,000 | |||||||
4.65% Series due 2020(3) |
100,000 | — | |||||||
5.20% Series due 2040(3) |
50,000 | — | |||||||
7.0% Series due 2024(4) |
74,854 | 74,975 | |||||||
First mortgage bonds (EDG): |
|||||||||
6.82% Series due 2036(3) |
55,000 | 55,000 | |||||||
|
488,054 | 388,175 | |||||||
Senior Notes, 7.05% Series due 2022(2) |
— | 48,522 | |||||||
Senior Notes, 41/2% Series due 2013(3) |
98,000 | 98,000 | |||||||
Senior Notes, 6.70% Series due 2033(3) |
62,000 | 62,000 | |||||||
Senior Notes, 5.80% Series due 2035(3) |
40,000 | 40,000 | |||||||
Other |
6,932 | 5,254 | |||||||
Less unamortized net discount |
(1,033 | ) | (774 | ) | |||||
|
693,953 | 691,177 | |||||||
Less current obligations of long-term debt |
(614 | ) | (50,587 | ) | |||||
Less current obligations under capital lease |
(267 | ) | (434 | ) | |||||
Total long-term debt |
$ | 693,072 | $ | 640,156 | |||||
- (1)
- Represented
by our Junior Subordinated Debentures, 81/2% Series due 2031.
- (2)
- We
may redeem some or all of the notes at any time at 100% of their principal amount, plus accrued and unpaid interest to the redemption date.
- (3)
- We
may redeem some or all of the notes at any time at 100% of their principal amount, plus a make-whole premium, plus accrued and unpaid
interest to the redemption date.
- (4)
- We may redeem some or all of the bonds at any time on or after April 1, 2012, at 100% of the principal amount of the bonds plus accrued and unpaid interest to the redemption date.
On August 25, 2010, we issued $50 million principal amount of 5.20% first mortgage bonds due September 1, 2040. The net proceeds (after payment of expenses) of approximately $49.1 million were used to redeem $48.3 million aggregate principal amount of our Senior Notes, 7.05% Series due 2022 on August 27, 2010.
104
THE EMPIRE DISTRICT ELECTRIC COMPANY
NOTES TO CONSOLIDATED FINANCIAL STATEMENTS (Continued)
On May 28, 2010, we issued $100 million principal amount of 4.65% first mortgage bonds due June 1, 2020. The net proceeds (after payment of expenses) of approximately $98.8 million, were used to redeem all 2 million outstanding shares of our 8.5% trust preferred securities, totaling $50 million, on June 28, 2010, and to repay short-term debt which was incurred, in part, to fund the repayment, at maturity, of our 6.5% first mortgage bonds due 2010.
On March 27, 2009, we issued $75 million principal amount of 7% first mortgage bonds due April 1, 2024. The net proceeds (after payment of expenses) of approximately $72.6 million were used to repay short-term debt incurred, in part, to fund our current construction program.
On May 16, 2008, we issued $90 million principal amount of first mortgage bonds. The net proceeds of approximately $89.4 million, less $0.4 million of legal and other financing fees, were added to our general funds and used primarily to pay down short-term indebtedness incurred, in part, as a result of our on-going construction program.
On January 28, 2011, we filed a $400 million shelf registration statement with the SEC covering our common stock, unsecured debt securities, preference stock, and first mortgage bonds. This shelf registration statement became effective on February 7, 2011. We plan to use proceeds under this shelf to fund capital expenditures, refinancings of existing debt or general corporate needs during the effective period. The issuance of securities under this shelf is subject to the receipt of local regulatory approvals.
The principal amount of all series of first mortgage bonds outstanding at any one time under the EDE Mortgage is limited by terms of the mortgage to $1 billion. Substantially all of the property, plant and equipment of The Empire District Electric Company (but not its subsidiaries) is subject to the lien of the EDE Mortgage. Restrictions in the EDE mortgage bond indenture could affect our liquidity. The EDE Mortgage contains a requirement that for new first mortgage bonds to be issued, our net earnings (as defined in the EDE Mortgage) for any twelve consecutive months within the fifteen months preceding issuance must be two times the annual interest requirements (as defined in the EDE Mortgage) on all first mortgage bonds then outstanding and on the prospective issue of new first mortgage bonds. Our earnings for the year ended December 31, 2010 would permit us to issue approximately $362.3 million of new first mortgage bonds based on this test with an assumed interest rate of 6.0%. In addition to the interest coverage requirement, the EDE Mortgage provides that new bonds must be issued against, among other things, retired bonds or 60% of net property additions. At December 31, 2010, we had retired bonds and net property additions which would enable the issuance of at least $634.0 million principal amount of bonds if the annual interest requirements are met. As of December 31, 2010, we are in compliance with all restrictive covenants of the EDE Mortgage.
The principal amount of all series of first mortgage bonds outstanding at any one time under the EDG Mortgage is limited by terms of the mortgage to $300 million. Substantially all of the property, plant and equipment of The Empire District Gas Company is subject to the lien of the EDG Mortgage. The EDG Mortgage contains a requirement that for new first mortgage bonds to be issued, the amount of such new first mortgage bonds shall not exceed 75% of the cost of property additions acquired after the date of the Missouri Gas acquisition. The mortgage also contains a limitation on the issuance by EDG of debt (including first mortgage bonds, but excluding short-term debt incurred in the ordinary course under working capital facilities) unless, after giving effect to such issuance, EDG's ratio of EBITDA (defined as net income plus interest, taxes, depreciation, amortization and certain other non-cash charges) to interest charges for the most recent four fiscal quarters is at least 2.0 to 1. As of December 31, 2010, this test would allow us to issue approximately $8.3 million principal amount of new first mortgage bonds.
The carrying amount of our total debt exclusive of capital leases at December 31, 2010 was $689 million compared to a fair market value of approximately $697 million. The carrying amount of our
105
THE EMPIRE DISTRICT ELECTRIC COMPANY
NOTES TO CONSOLIDATED FINANCIAL STATEMENTS (Continued)
total debt exclusive of capital leases as of December 31, 2009 was $688 million, compared to a fair value of approximately $695 million. These estimates were based on the quoted market prices for the same or similar issues or on the current rates offered to us for debt of the same remaining maturities. The estimated fair market value may not represent the actual value that could have been realized as of year-end or that will be realizable in the future.
| |
Payments Due By Period | ||||||||||
|---|---|---|---|---|---|---|---|---|---|---|---|
Long-Term Debt Payout Schedule (Excluding Unamortized Discount (in thousands) |
Total | Regulated Entity Debt Obligations |
Capital Lease Obligations |
||||||||
2011 |
$ | 881 | $ | 614 | $ | 267 | |||||
2012 |
917 | 641 | 276 | ||||||||
2013 |
111,908 | 111,615 | 293 | ||||||||
2014 |
267 | — | 267 | ||||||||
2015 |
286 | — | 286 | ||||||||
Thereafter |
580,727 | 576,854 | 3,873 | ||||||||
Total long-term debt obligations |
694,986 | $ | 689,724 | $ | 5,262 | ||||||
Less current obligations and unamortized discount |
1,914 | ||||||||||
Total long-term debt |
$ | 693,072 | |||||||||
7. Short-Term Borrowings
At December 31, 2010, total short-term borrowings consisted of $24.0 million in commercial paper and no borrowings from our line of credit. Short-term borrowings outstanding averaged $36.3 million and $68.9 million daily during 2010 and 2009, respectively, with the highest month-end balances being $74.0 million and $123.0 million, respectively. The weighted average interest rates during 2010 and 2009 were 1.74% and 1.63% in each period. The weighted average interest rate of borrowings outstanding at December 31, 2010 and 2009 was 1.15% and 1.05%, respectively.
On January 26, 2010, we entered into the Second Amended and Restated Unsecured Credit Agreement which amended and restated our unsecured revolving credit facility. This agreement extends the termination date of the revolving credit facility from July 15, 2010 to January 26, 2013. In addition, the pricing and fees under the facility were amended. Interest on borrowings under the facility accrues at a rate equal to, at our option, (i) the highest of (A) the bank's prime commercial rate, (B) the federal funds effective rate plus 0.5% or (C) one month LIBOR plus 1.0%, plus a margin or (ii) one month, two month or three month LIBOR, in each case, plus a margin. Each margin is based on our current credit ratings and the pricing schedule in the facility. As of the date hereof, and based on our current credit ratings, the LIBOR margin under the facility increased from 0.80% to 2.70%. A facility fee is payable quarterly on the full amount of the commitments under the facility and a usage fee is payable on the full amount of the commitments under the facility for any period in which we have drawn less than 33% of the total revolving commitments under the facility, in each case based on our current credit ratings. In addition, upon entering into the amended and restated facility, we paid an upfront fee to the revolving credit banks of $900,000 in the aggregate. The aggregate amount of the revolving commitments remained unchanged at $150 million and there were no other material changes to the terms of the facility.
The facility is used for working capital, general corporate purposes and to back-up our use of commercial paper. This facility requires our total indebtedness to be less than 62.5% of our total capitalization at the end of each fiscal quarter and our EBITDA (defined as net income plus interest, taxes,
106
THE EMPIRE DISTRICT ELECTRIC COMPANY
NOTES TO CONSOLIDATED FINANCIAL STATEMENTS (Continued)
depreciation and amortization) to be at least two times our interest charges for the trailing four fiscal quarters at the end of each fiscal quarter. Failure to maintain these ratios will result in an event of default under the credit facility and will prohibit us from borrowing funds thereunder. As of December 31, 2010, we are in compliance with these ratios. Our total indebtedness is 52.2% of our total capitalization as of December 31, 2010 and our EBITDA is 5.0 times our interest charges. This credit facility is also subject to cross-default if we default on in excess of $10 million in the aggregate on our other indebtedness. This arrangement does not serve to legally restrict the use of our cash in the normal course of operations. There were no outstanding borrowings under this agreement at December 31, 2010. However, $24.0 million was used to back up our outstanding commercial paper.
On March 11, 2009, we entered into a $50 million unsecured credit agreement. This agreement, which terminated on July 15, 2010, provided for $50 million of revolving loans to be available to us for working capital, general corporate purposes and to back-up our use of commercial paper and was in addition to, and had substantially identical covenants and terms as (other than pricing) our Second Amended and Restated Unsecured Credit Agreement dated January 26, 2010 discussed above.
8. Retirement Benefits
We record retirement benefits in accordance with the ASC guidance on accounting for pension and other postretirement benefits, and have recorded the appropriate liabilities to reflect the unfunded status of our benefit plans, with offsetting entries to a regulatory asset, because we believe it is probable the unfunded amount of these plans will be afforded rate recovery. The tax effects of these entries are reflected as deferred tax assets and liabilities and regulatory liabilities.
Annually we evaluate the discount rate, retirement age, compensation rate increases, expected return on plan assets and healthcare cost trend rate assumptions related to pension benefit and post-retirement medical plan. We utilize an interest rate yield curve to determine an appropriate discount rate. The yield curve is constructed based on the yields on over 500 high-quality, non-callable corporate bonds with maturities between zero and thirty years. A theoretical spot rate curve constructed from this yield curve is then used to discount the annual benefit cash flows of the Empire pension plan and develop a single point discount rate matching the plan's payout structure. In evaluating these assumptions, many factors are considered, including, current market conditions, asset allocations, changes in demographics and the views of leading financial advisors and economists. In evaluating the expected retirement age assumption, we consider the retirement ages of past employees eligible for pension and medical benefits together with expectations of future retirement ages. It is reasonably possible that changes in these assumptions will occur in the near term and, due to the uncertainties inherent in setting assumptions, the effect of such changes could be material to the Company's consolidated financial statements. A roll forward technique is used to value the year ending pension obligations. The roll forward technique values the year-end obligation by rolling forward the beginning-of-year obligation using the demographic assumptions shown below. The economic assumptions are updated as of the end of the year. All of the benefit plans have been measured as of December 31, 2010, consistent with previous years. See Note 1.
Our noncontributory defined benefit pension plan includes all employees meeting minimum age and service requirements. The benefits are based on years of service and the employee's average annual basic earnings. Annual contributions to the plan are at least equal to the minimum funding requirements of ERISA. We also have a supplemental retirement program ("SERP") for designated officers of the Company, which we fund from Company funds as the benefits are paid.
107
THE EMPIRE DISTRICT ELECTRIC COMPANY
NOTES TO CONSOLIDATED FINANCIAL STATEMENTS (Continued)
Market conditions in 2009 and 2010 have positively impacted the return on pension plan assets; however plan costs have also increased. As a result, our net pension liability increased $4.5 million and $0.3 million in 2010 and 2009, respectively. This increase was recorded as an increase in regulatory assets as we believe it is probable of recovery through customer rates based on rate orders received in our jurisdictions. We expect future pension funding commitments to increase to at least the level of our accrued cost, as required by our regulator. Our contribution is estimated to be approximately $18.2 million for 2011. For 2012, we will also be required to fund at least our accrued cost. The actual minimum funding requirements will be determined based on the results of the actuarial valuations and, in the case of 2012, the performance of our pension assets during 2011.
Expected benefit payments are as follows (in millions):
Year
|
Payments from Trust | Payments from Company Funds |
|||||
|---|---|---|---|---|---|---|---|
2011 |
$ | 8.1 | $ | 0.1 | |||
2012 |
8.8 | 0.1 | |||||
2013 |
9.4 | 0.1 | |||||
2014 |
10.1 | 0.1 | |||||
2015 |
10.8 | 0.1 | |||||
2016 – 2020 |
$ | 62.8 | $ | 0.8 | |||
Other Postretirement Benefits (OPEB)
We provide certain healthcare and life insurance benefits to eligible retired employees, their dependents and survivors through trusts we have established. Participants generally become eligible for retiree healthcare benefits after reaching age 55 with 5 years of service.
Market conditions in 2009 and 2010 also had a positive impact on the return on OPEB plan assets; however plan costs have increased as well. Our net liability increased $4.3 million and $0.4 million in 2010 and 2009, respectively. The increase was recorded as an increase in regulatory assets as we believe it is probable of recovery through customer rates based on rate orders received in our jurisdictions. Our funding policy is to contribute annually an amount at least equal to the actuarial cost of postretirement benefits. We expect to be required to fund approximately $4.9 million in 2011.
Estimated benefit payments are as follows (in millions):
Year
|
Payments from Trust | Expected Federal Subsidy |
Payments from Company Funds |
|||||||
|---|---|---|---|---|---|---|---|---|---|---|
2011 |
$ | 2.4 | $ | 0.3 | $ | 0.1 | ||||
2012 |
2.7 | 0.3 | 0.1 | |||||||
2013 |
3.1 | 0.4 | 0.1 | |||||||
2014 |
3.4 | 0.4 | 0.2 | |||||||
2015 |
3.7 | 0.5 | 0.2 | |||||||
2016 – 2020 |
$ | 23.4 | $ | 3.2 | $ | 0.9 | ||||
108
THE EMPIRE DISTRICT ELECTRIC COMPANY
NOTES TO CONSOLIDATED FINANCIAL STATEMENTS (Continued)
The following tables set forth the Company's benefit plans' projected benefit obligations, the fair value of the plans' assets and the funded status (in thousands).
Reconciliation of Projected Benefit Obligations:
| |
Pension | SERP | OPEB | ||||||||||||||||
|---|---|---|---|---|---|---|---|---|---|---|---|---|---|---|---|---|---|---|---|
| |
2010 | 2009 | 2010 | 2009 | 2010 | 2009 | |||||||||||||
Benefit obligation at beginning of year |
$ | 169,055 | $ | 154,377 | $ | 2,575 | $ | 2,337 | $ | 69,911 | $ | 61,950 | |||||||
Service cost |
4,887 | 4,612 | 70 | 61 | 2,138 | 1,830 | |||||||||||||
Interest cost |
10,115 | 9,876 | 153 | 148 | 4,329 | 3,907 | |||||||||||||
Net actuarial (gain)/loss |
10,946 | 8,092 | 160 | 92 | 6,454 | 3,881 | |||||||||||||
Plan participant's contribution |
— | — | — | — | 949 | 832 | |||||||||||||
Benefits and expenses paid |
(8,163 | ) | (7,902 | ) | (63 | ) | (63 | ) | (2,966 | ) | (2,885 | ) | |||||||
Federal subsidy |
— | — | — | — | 123 | 396 | |||||||||||||
Benefit obligation at end of year |
$ | 186,840 | $ | 169,055 | $ | 2,895 | $ | 2,575 | $ | 80,938 | $ | 69,911 | |||||||
Reconciliation of Fair Value of Plan Assets:
| |
Pension | SERP | OPEB | ||||||||||||||||
|---|---|---|---|---|---|---|---|---|---|---|---|---|---|---|---|---|---|---|---|
| |
2010 | 2009 | 2010 | 2009 | 2010 | 2009 | |||||||||||||
Fair value of plan assets at beginning of year |
$ | 107,076 | $ | 92,730 | $ | — | $ | — | $ | 50,036 | $ | 42,483 | |||||||
Actual return on plan assets — gain/(loss) |
11,740 | 19,748 | — | — | 4,825 | 6,799 | |||||||||||||
Employer contribution |
9,700 | 2,500 | — | — | 3,681 | 2,333 | |||||||||||||
Benefits paid |
(8,163 | ) | (7,902 | ) | — | — | (2,845 | ) | (2,753 | ) | |||||||||
Plan participant's contribution |
— | — | — | — | 917 | 803 | |||||||||||||
Federal subsidy |
— | — | — | — | 116 | 371 | |||||||||||||
Fair value of plan assets at end of year |
$ | 120,353 | $ | 107,076 | $ | — | $ | — | $ | 56,730 | $ | 50,036 | |||||||
Reconciliation of Funded Status:
| |
Pension | SERP | OPEB | ||||||||||||||||
|---|---|---|---|---|---|---|---|---|---|---|---|---|---|---|---|---|---|---|---|
| |
2010 | 2009 | 2010 | 2009 | 2010 | 2009 | |||||||||||||
Fair value of plan assets |
$ | 120,353 | $ | 107,076 | $ | — | $ | — | $ | 56,730 | $ | 50,036 | |||||||
Projected benefit obligations |
(186,840 | ) | (169,055 | ) | (2,895 | ) | (2,575 | ) | (80,938 | ) | (69,911 | ) | |||||||
Funded status |
$ | (66,487 | ) | $ | (61,979 | ) | $ | (2,895 | ) | $ | (2,575 | ) | $ | (24,208 | ) | $ | (19,875 | ) | |
The employee pension plan accumulated benefit obligation at December 31, 2010 and 2009 is presented in the following table (in thousands):
| |
Pension Benefits | SERP | |||||||||||
|---|---|---|---|---|---|---|---|---|---|---|---|---|---|
| |
2010 | 2009 | 2010 | 2009 | |||||||||
Accumulated benefit obligation |
$ | 164,340 | $ | 146,826 | $ | 2,431 | $ | 1,864 | |||||
109
THE EMPIRE DISTRICT ELECTRIC COMPANY
NOTES TO CONSOLIDATED FINANCIAL STATEMENTS (Continued)
Amounts recognized in the balance sheet consist of (in thousands):
| |
Pension | SERP | OPEB | ||||||||||||||||
|---|---|---|---|---|---|---|---|---|---|---|---|---|---|---|---|---|---|---|---|
| |
2010 | 2009 | 2010 | 2009 | 2010 | 2009 | |||||||||||||
Other current liabilities |
$ | — | $ | — | $ | 64 | $ | 62 | $ | 121 | $ | 127 | |||||||
Pension and other postretirement benefit obligation |
$ | 66,487 | $ | 61,979 | $ | 2,831 | $ | 2,513 | $ | 24,087 | $ | 19,748 | |||||||
Net periodic benefit pension cost for 2010, 2009 and 2008, some of which is capitalized as a component of labor cost and some of which is deferred as a regulatory asset (see Note 3), is comprised of the following components (in thousands):
Net Periodic Pension Benefit Cost:
| |
Pension | OPEB | |||||||||||||||||
|---|---|---|---|---|---|---|---|---|---|---|---|---|---|---|---|---|---|---|---|
| |
2010 | 2009 | 2008 | 2010 | 2009 | 2008 | |||||||||||||
Service cost |
$ | 4,887 | $ | 4,612 | $ | 3,568 | $ | 2,138 | $ | 1,830 | $ | 1,651 | |||||||
Interest cost |
10,115 | 9,876 | 9,048 | 4,329 | 3,907 | 3,617 | |||||||||||||
Expected return on plan assets |
(9,847 | ) | (10,379 | ) | (10,729 | ) | (3,844 | ) | (3,843 | ) | (3,750 | ) | |||||||
Amortization of prior service cost(1) |
531 | 604 | 744 | (1,011 | ) | (1,011 | ) | (1,011 | ) | ||||||||||
Amortization of actuarial loss(1) |
3,996 | 3,182 | 1,693 | 1,499 | 869 | 511 | |||||||||||||
Net periodic benefit cost |
$ | 9,682 | $ | 7,895 | $ | 4,324 | $ | 3,111 | $ | 1,752 | $ | 1,018 | |||||||
Net Periodic Pension Benefit Cost:
| |
SERP | |||||||||
|---|---|---|---|---|---|---|---|---|---|---|
| |
2010 | 2009 | 2008 | |||||||
Service cost |
$ | 70 | $ | 61 | $ | 57 | ||||
Interest cost |
153 | 148 | 137 | |||||||
Expected return on plan assets |
— | — | — | |||||||
Amortization of prior service cost(1) |
(8 | ) | (8 | ) | (8 | ) | ||||
Amortization of actuarial loss(1) |
96 | 103 | 132 | |||||||
Net periodic benefit cost |
$ | 311 | $ | 304 | $ | 318 | ||||
- (1)
- Amounts are amortized from our regulatory asset originally recorded upon recognizing our net pension liability on the balance sheet.
The tables below present the activity in the regulatory asset accounts for the year (in thousands).
| |
|
Amount Recognized | ||||||||||||||
|---|---|---|---|---|---|---|---|---|---|---|---|---|---|---|---|---|
Regulatory Assets
|
Beginning Balance 12/31/09 |
Current Year Actuarial (Gain)/Loss |
Amortization of Actuarial Loss |
Amortization of Prior Service (Cost)/Credit |
Ending Balance 12/31/10 |
|||||||||||
Pension |
$ | 62,524 | 9,053 | (3,996 | ) | (531 | ) | $ | 67,050 | |||||||
SERP |
$ | 1,218 | 161 | (96 | ) | 8 | $ | 1,291 | ||||||||
OPEB |
$ | 11,046 | 5,473 | (1,499 | ) | 1,011 | $ | 16,031 | ||||||||
110
THE EMPIRE DISTRICT ELECTRIC COMPANY
NOTES TO CONSOLIDATED FINANCIAL STATEMENTS (Continued)
The following table presents the amount of net actuarial gains / losses, transition obligations / assets and prior period service costs in regulatory assets not yet recognized as a component of net periodic benefit cost. It also shows the amounts expected to be recognized in the subsequent year. The following table presents those items for the employee pension plan and other benefits plan at December 31, 2010, and the subsequent twelve-month period (in thousands):
| |
Pension Benefits | SERP | OPEB | ||||||||||||||||
|---|---|---|---|---|---|---|---|---|---|---|---|---|---|---|---|---|---|---|---|
| |
2010 | Subsequent Period |
2010 | Subsequent Period |
2010 | Subsequent Period |
|||||||||||||
Net actuarial loss |
$ | 64,005 | $ | 5,411 | $ | 1,338 | $ | 134 | $ | 22,658 | $ | 2,001 | |||||||
Prior service cost (benefit) |
3,045 | 532 | (47 | ) | (8 | ) | (6,627 | ) | (1,011 | ) | |||||||||
Total |
$ | 67,050 | $ | 5,943 | $ | 1,291 | $ | 126 | $ | 16,031 | $ | 990 | |||||||
The measurement date used to determine the pension and other postretirement benefits is December 31. The assumptions used to determine the benefit obligation and the periodic costs are as follows:
Weighted-average assumptions used to determine the benefit obligation as of December 31:
| |
Pension Benefits | OPEB | |||||||||||
|---|---|---|---|---|---|---|---|---|---|---|---|---|---|
| |
2010 | 2009 | 2010 | 2009 | |||||||||
Discount rate |
5.50 | % | 6.00 | % | 5.50 | % | 6.00 | % | |||||
Rate of compensation increase |
4.50 | % | 4.50 | % | 4.50 | % | 4.50 | % | |||||
Weighted-average assumptions used to determine the net benefit cost (income) as of January 1:
| |
Pension Benefits | OPEB | |||||||||||||||||
|---|---|---|---|---|---|---|---|---|---|---|---|---|---|---|---|---|---|---|---|
| |
2010 | 2009 | 2008 | 2010 | 2009 | 2008 | |||||||||||||
Discount rate |
6.00 | % | 6.30 | % | 6.40 | % | 6.00 | % | 6.30 | % | 6.40 | % | |||||||
Expected return on plan assets |
8.00 | % | 8.50 | % | 8.50 | % | 8.00 | % | 7.45 | % | 7.45 | % | |||||||
Rate of compensation increase |
4.50 | % | 4.50 | % | 4.50 | % | 4.50 | % | 4.50 | % | 4.50 | % | |||||||
The expected long-term rate of return assumption was based on historical return and adjusted to estimate the potential range of returns for the current asset allocation.
The assumed 2010 cost trend rate used to measure the expected cost of healthcare benefits and benefit obligation is 8.0%. Each trend rate decreases 0.50% through 2015 to an ultimate rate of 5.0% in 2015 and subsequent years.
The healthcare cost trend rate affects projected benefit obligations. A 1% change in assumed healthcare cost growth rates would have the following effects (in thousands):
| |
1% Increase | 1% Decrease | |||||
|---|---|---|---|---|---|---|---|
Effect on total of service and interest cost |
$ | 1,167 | $ | (925 | ) | ||
Effect on post-retirement benefit obligation |
$ | 11,838 | $ | (9,617 | ) | ||
111
THE EMPIRE DISTRICT ELECTRIC COMPANY
NOTES TO CONSOLIDATED FINANCIAL STATEMENTS (Continued)