Attached files
| file | filename |
|---|---|
| EX-32.2 - EXHIBIT 32.2 - Mahwah Bergen Retail Group, Inc. | exhibit322fy16.htm |
| EX-32.1 - EXHIBIT 32.1 - Mahwah Bergen Retail Group, Inc. | exhibit321fy16.htm |
| EX-31.2 - EXHIBIT 31.2 - Mahwah Bergen Retail Group, Inc. | exhibit312fy16.htm |
| EX-31.1 - EXHIBIT 31.1 - Mahwah Bergen Retail Group, Inc. | exhibit311fy16.htm |
| EX-23 - EXHIBIT 23 - Mahwah Bergen Retail Group, Inc. | exhibit23fy16.htm |
| EX-21 - EXHIBIT 21 - Mahwah Bergen Retail Group, Inc. | exhibit21fy16.htm |
| EX-10.14 - EXHIBIT 10.14 - Mahwah Bergen Retail Group, Inc. | exhibit1014_duaneholloway.htm |
UNITED STATES
SECURITIES AND EXCHANGE COMMISSION
Washington, D.C. 20549
FORM 10-K
(Mark One)
ý | ANNUAL REPORT PURSUANT TO SECTION 13 OR 15(d) OF THE SECURITIES EXCHANGE ACT OF 1934 |
For the fiscal year ended July 30, 2016
or
¨ | TRANSITION REPORT PURSUANT TO SECTION 13 OR 15(d) OF THE SECURITIES EXCHANGE ACT OF 1934 |
Commission file number 0-11736
ASCENA RETAIL GROUP, INC.
(Exact name of registrant as specified in its charter)
Delaware (State or other jurisdiction of incorporation or organization) | 30-0641353 (I.R.S. Employer Identification No.) |
933 MacArthur Boulevard, Mahwah, New Jersey (Address of principal executive offices) | 07430 (Zip Code) |
(551) 777-6700
(Registrant's telephone number, including area code)
Securities registered pursuant to Section 12(b) of the Act:
Title of Each Class | Name of Each Exchange on Which Registered |
Common Stock, $0.01 par value | The NASDAQ Global Select Market |
Securities registered pursuant to Section 12(g) of the Act: None
Indicate by check mark if the registrant is a well-known seasoned issuer, as defined in Rule 405 of the Securities Act. Yes ý No ¨
Indicate by check mark if the registrant is not required to file reports pursuant to Section 13 or Section 15(d) of the Act. Yes ¨ No ý
Indicate by check mark whether the registrant (1) has filed all reports required to be filed by Section 13 or 15(d) of the Securities Exchange Act of 1934 during the preceding 12 months (or for such shorter period that the registrant was required to file such reports), and (2) has been subject to such filing requirements for the past 90 days. Yes ý No ¨
Indicate by check mark whether the registrant has submitted electronically and posted on its corporate Web site, if any, every Interactive Data File required to be submitted and posted pursuant to Rule 405 of Regulation S-T (§ 232.405 of this chapter) during the preceding 12 months (or for such shorter period that the registrant was required to submit and post such files). Yes ý No ¨
Indicate by check mark if disclosure of delinquent filers pursuant to Item 405 of Regulation S-K (§ 229.405 of this chapter) is not contained herein, and will not be contained, to the best of registrant's knowledge, in definitive proxy or information statements incorporated by reference in Part III of this Form 10-K or any amendment to this Form 10-K. ¨
Indicate by check mark whether the registrant is a large accelerated filer, an accelerated filer, a non-accelerated filer, or a smaller reporting company. See the definitions of “large accelerated filer,” “accelerated filer” and “smaller reporting company” in Rule 12b-2 of the Exchange Act.
Large accelerated filer x | Accelerated filer ¨ |
Non-accelerated filer ¨ (Do not check if a smaller reporting company) | Smaller reporting company ¨ |
Indicate by check mark whether the registrant is a shell company (as defined in Rule 12b-2 of the Act).Yes ¨ No ý
The aggregate market value of the voting stock held by non-affiliates of the registrant was approximately $1.5 billion as of January 23, 2016, based on the last reported sales price on the NASDAQ Global Select Market on that date. As of September 14, 2016, 194,213,926 shares of voting common shares were outstanding.
Portions of the registrant's Proxy Statement for the Annual Meeting of Stockholders to be held on December 8, 2016 are incorporated into Part III of this Form 10-K.
ASCENA RETAIL GROUP, INC.
FORM 10-K
FISCAL YEAR ENDED JULY 30, 2016
TABLE OF CONTENTS
Page | |||||
PART I | |||||
Item 1. | Business | ||||
Item 1A. | Risk Factors | ||||
Item 1B. | Unresolved Staff Comments | ||||
Item 2. | Properties | ||||
Item 3. | Legal Proceedings | ||||
PART II | |||||
Item 5. | Market for Registrant’s Common Equity, Related Stockholder Matters and Issuer Purchases of Equity Securities | ||||
Item 6. | Selected Financial Data | ||||
Item 7. | Management’s Discussion and Analysis of Financial Condition and Results of Operations | ||||
Item 7A. | Quantitative and Qualitative Disclosures About Market Risk | ||||
Item 8. | Financial Statements and Supplementary Data | ||||
Item 9. | Changes in and Disagreements with Accountants on Accounting and Financial Disclosure | ||||
Item 9A. | Controls and Procedures | ||||
Item 9B. | Other Information | ||||
PART III | |||||
Item 10. | Directors, Executive Officers and Corporate Governance | ||||
Item 11. | Executive Compensation | ||||
Item 12. | Security Ownership of Certain Beneficial Owners and Management and Related Stockholder Matters | ||||
Item 13. | Certain Relationships and Related Transactions, and Director Independence | ||||
Item 14. | Principal Accounting Fees and Services | ||||
PART IV | |||||
Item 15. | Exhibits, Financial Statement Schedules | ||||
2
SPECIAL NOTE REGARDING FORWARD-LOOKING STATEMENTS
This Annual Report on Form 10-K, including the section labeled Management’s Discussion and Analysis of Financial Condition and Results of Operations, contains forward-looking statements that should be read in conjunction with the consolidated financial statements, notes to the consolidated financial statements and the risk factors that we have included elsewhere in this report. These forward-looking statements are based on our current expectations, assumptions, estimates and projections about our business and our industry, and involve known and unknown risks, uncertainties and other factors that may cause our results, level of activity, performance or achievements to be materially different from any future results, level of activity, performance or achievements expressed or implied in, or contemplated by, the forward-looking statements. We generally identify these statements by words or phrases such as “believe,” “anticipate,” “expect,” “intend,” “plan,” “may,” “should,” “estimate,” “predict,” “project,” “potential,” “continue,” "remains optimistic," or the negative of such terms or other similar expressions.
Our actual results may differ significantly from the results discussed in the forward-looking statements. Factors that might cause such a difference include those discussed below under Item 1A. Risk Factors, and other factors discussed in this Annual Report on Form 10-K and other reports we file with the Securities and Exchange Commission. We disclaim any intent or obligation to update or revise any forward-looking statements as a result of developments occurring after the period covered by this report.
WEBSITE ACCESS TO COMPANY REPORTS
We maintain our corporate Internet website at www.ascenaretail.com. The information on our Internet website is not incorporated by reference into this report. We make available, free of charge through publication on our Internet website, a copy of our Annual Reports on Form 10-K, our quarterly reports on Form 10-Q and our current reports on Form 8-K, including any amendments to those reports, as filed with or furnished to the Securities and Exchange Commission (“SEC”) pursuant to Section 13(a) or Section 15(d) of the Securities Exchange Act of 1934, as soon as reasonably practicable after they have been so filed or furnished. Information relating to corporate governance at Ascena Retail Group, Inc., including our Code of Ethics for the Chief Executive Officer and Senior Financial Officers, information concerning our directors, committees of the Board of Directors, including committee charters, and transactions in Ascena Retail Group, Inc. securities by directors and executive officers, is also available at our website.
In this Form 10-K, references to “ascena,” “ourselves,” “we,” “us,” “our” or “Company” or other similar terms refer to Ascena Retail Group, Inc. and its subsidiaries, unless the context indicates otherwise. The Company utilizes a 52-53 week fiscal year ending on the last Saturday in July. As such, fiscal year 2016 ended on July 30, 2016 and reflected a 53-week period (“Fiscal 2016”); fiscal year 2015 ended on July 25, 2015 and reflected a 52-week period (“Fiscal 2015”); and fiscal year 2014 ended on July 26, 2014 and reflected a 52-week period (“Fiscal 2014”). All references to “Fiscal 2017” refer to our 52-week period that will end on July 29, 2017.
PART I
Item 1. Business.
General
The Company is a leading national specialty retailer of apparel for women and tween girls. The Company operates, through its 100% owned subsidiaries, ecommerce operations and approximately 4,900 stores throughout the United States, Canada and Puerto Rico. The Company had annual revenue for the fiscal year ended July 30, 2016 of approximately $7.0 billion. The Company and its subsidiaries are collectively referred to herein as the “Company,” “ascena,” “we,” “us,” “our” and “ourselves,” unless the context indicates otherwise.
Acquisition of ANN INC.
On August 21, 2015, the Company acquired 100% of the outstanding common stock of ANN INC. ("ANN"), a retailer of women’s apparel, shoes and accessories sold primarily under the Ann Taylor and LOFT brands, for an aggregate purchase price of approximately $2.1 billion (the "ANN Acquisition"). The purchase price consisted of approximately $1.75 billion in cash and the issuance of 31.2 million shares of the Company's common stock valued at approximately $345 million, based on the Company's stock price on the date of the acquisition, as more fully described in Note 5 to the accompanying consolidated financial statements. The cash portion of the purchase price was funded with borrowings under a $1.8 billion seven-year, variable-rate term loan described in Note 11 to the accompanying consolidated financial statements. The acquisition is intended to diversify our portfolio of brands that serve the needs of women of different ages, sizes and demographics. ANN's operating results for the post-acquisition period from August 22, 2015 to July 30, 2016 are included in the accompanying consolidated statement of operations for Fiscal 2016.
3
Our Brands and Products
The Company classifies its businesses into six reportable segments: ANN, Justice, Lane Bryant, maurices, dressbarn and Catherines.
ANN
The ANN segment includes 1,022 specialty retail and outlet stores, ecommerce operations and certain licensed franchises in international territories which allow customers to shop in more than 100 countries worldwide. The ANN segment offers modern feminine classics and versatile fashion choices, sold primarily under the Ann Taylor and LOFT brands. ANN focuses on providing a wide selection of fashion and everyday essentials to help women look their best and feel confident. ANN retail stores are located in mall locations, lifestyle centers and outlet centers.
Justice
The Justice segment includes 937 specialty retail and outlet stores, ecommerce operations and certain licensed franchises in international territories. The Justice brand offers fashionable apparel to girls who are ages 6 to 12 in an environment designed to match the energetic lifestyle of tween girls. Justice creates, designs and develops its own exclusive Justice branded merchandise in-house. This allows Justice to maintain creative control and respond as quickly as fashion trends dictate. The Justice merchandise mix represents the broad assortment that its girl wants in her store - a mix of apparel, accessories, footwear, intimates and lifestyle products, such as cosmetics, bedroom furnishings and electronics, to meet all of her needs. Justice retail stores are located in mall locations, strip shopping centers, lifestyle centers and outlet centers.
Lane Bryant
The Lane Bryant segment includes 772 specialty retail and outlet stores, and ecommerce operations. Lane Bryant is a widely recognized brand name in plus-size fashion with stores concentrated in suburban and small towns, offering fashionable and sophisticated apparel at a moderate price point to female customers in plus-sizes 14-28 through its namesake and Cacique private labels, along with select national brands. Merchandise assortment offerings include intimate apparel, wear-to-work and casual sportswear, accessories, select footwear and social occasion apparel. Lane Bryant retail stores are located in mall locations, strip shopping centers, lifestyle centers and outlet centers.
maurices
The maurices segment includes 993 specialty retail and outlet stores, and ecommerce operations, offering up-to-date core and plus-size fashion apparel. maurices stores are concentrated in small markets (approximately 25,000 to 150,000 people), and cater to local market preferences through a core merchandise assortment that is refined to reflect individual store demands. Through its proprietary label, the maurices product line encompasses women’s casual clothing, career wear, dressy apparel, active wear and accessories. maurices retail stores are typically located near large discount and department stores to capitalize on the traffic those retailers generate, while differentiating itself by offering a wider selection of style, color and current fashion, along with an elevated shopping experience.
dressbarn
The dressbarn segment includes 809 specialty retail and outlet stores, and ecommerce operations, offering moderate-to-better quality career, special occasion and casual fashion for working women in a comfortable, easy-to-shop environment staffed by friendly, service oriented associates. dressbarn’s individual store assortments vary depending on local demographics, seasonality and past sales patterns. dressbarn retail stores are located primarily in convenient strip shopping centers in major trading and high-density markets and in surrounding suburban areas.
Catherines
The Catherines segment includes 373 specialty retail stores and ecommerce operations, offering a full range of plus sizes (16-34) and extended sizes (28-34). Catherines offers classic apparel and accessories to female customers in the moderate price range for wear-to-work and casual lifestyles. Catherines retail stores are concentrated in suburban and small towns and are primarily located in strip shopping centers.
4
The tables below present net sales and operating income (loss) by segment for the last three fiscal years:
Fiscal 2016 | Fiscal 2015 | Fiscal 2014 | ||||||||||
Net sales: | (millions) | |||||||||||
ANN (a) | $ | 2,330.9 | $ | — | $ | — | ||||||
Justice | 1,106.3 | 1,276.8 | 1,384.3 | |||||||||
Lane Bryant | 1,130.3 | 1,095.9 | 1,080.0 | |||||||||
maurices | 1,101.3 | 1,060.6 | 971.4 | |||||||||
dressbarn | 993.3 | 1,023.6 | 1,022.5 | |||||||||
Catherines | 333.3 | 346.0 | 332.4 | |||||||||
Total net sales | $ | 6,995.4 | $ | 4,802.9 | $ | 4,790.6 | ||||||
Fiscal 2016 | Fiscal 2015 | Fiscal 2014 | ||||||||||
Operating income (loss): | (millions) | |||||||||||
ANN (a) | $ | 13.3 | $ | — | $ | — | ||||||
Justice | 29.0 | (62.8 | ) | 99.3 | ||||||||
Lane Bryant | 20.6 | (308.0 | ) | (4.3 | ) | |||||||
maurices | 105.6 | 125.9 | 86.0 | |||||||||
dressbarn | (13.6 | ) | 10.7 | 39.4 | ||||||||
Catherines | 16.3 | 31.0 | 24.4 | |||||||||
Unallocated acquisition and integration expenses | (77.4 | ) | (31.7 | ) | (34.0 | ) | ||||||
Total operating income (loss) | $ | 93.8 | $ | (234.9 | ) | $ | 210.8 | |||||
_______
(a) | The results of ANN for the post-acquisition period from August 22, 2015 to July 30, 2016 are included within the Company's consolidated results of operations for Fiscal 2016. |
Over the past five fiscal years, our sales have grown to approximately $7.0 billion in Fiscal 2016 from $3.4 billion in Fiscal 2012. This growth has been a result of both our acquisitions and organic growth. We currently operate approximately 4,900 stores throughout the United States, Canada and Puerto Rico. We have diversified our business by brand, price point and target consumer as well as by geography throughout North America. Our ANN, Justice and maurices segments now operate 13 stores, 42 stores and 35 stores, respectively, in Canada. We will continue evaluating other international opportunities for our family of brands. In addition to our store presence, we sell merchandise through our primary ecommerce websites: anntaylor.com; LOFT.com; louandgrey.com; shopjustice.com; lanebryant.com; cacique.com; maurices.com; dressbarn.com and catherines.com.
Over the past five fiscal years, we have invested approximately $4.1 billion in acquisitions, capital improvements, supply chain integration and technology infrastructure improvements, which were funded through cash, debt and the issuance of common stock. We intend to continue to execute our long-term strategies, which include, among other things, growth through selective acquisitions, investment in our operational infrastructure and expansion of our omni-channel businesses and technology platforms.
Seasonality of Business
Our individual segments are typically affected by seasonal sales trends primarily resulting from the timing of holiday and back-to-school shopping periods. In particular, sales at Justice tend to be significantly higher during the fall season, which occurs during the first and second quarters of our fiscal year, as this includes the back-to-school period and the December holiday season. Our Lane Bryant, dressbarn and Catherines segments tend to experience higher sales during the spring season, which include the Easter and Mother's Day holidays. Our ANN and maurices segments have relatively balanced sales across the Fall and Spring seasons. As a result, our operational results and cash flows may fluctuate materially in any quarterly period depending on, among other things, increases or decreases in comparable store sales, adverse weather conditions, shifts in the timing of certain holidays and changes in merchandise mix.
Omni-channel
The Company continues to invest in our technology platforms to support the growth of our omni-channel strategy, with different brands at different stages of implementation. ANN launched the first phase of their omni-channel initiative in calendar 2012 and has added various enhancements and functionalities since then. Justice and maurices launched their new ecommerce platforms in Fiscal 2016 and our other brands expect to roll out these platforms in Fiscal 2017. Our ecommerce platforms allow the brands
5
to (i) enhance the customer shopping experience inside and outside our stores, (ii) integrate our marketing efforts to increase in-store and online traffic, (iii) improve product availability and fulfillment efficiency and (iv) enhance our capability to collect and analyze customer transaction data to support strategic decisions.
As our omni-channel strategy continues to mature, it is increasingly difficult to distinguish between store sales and ecommerce sales due to the following:
• | Stores increase ecommerce sales by providing customers opportunities to view, touch and/or try on physical merchandise before ordering online; |
• | Particular colors or sizes of merchandise not available in a store can be ordered online by our store associates and shipped from our ecommerce fulfillment center or another store directly to the customer; |
• | Our websites increase store sales as in-store customers have often pre-shopped online before shopping in the store, including verification of which stores have merchandise in stock; |
• | Ecommerce sales can be returned to our stores, creating mismatches between revenues and returns between the two channels; |
• | Increased integration of brand specific merchandise planning, procurement and allocation functions serving stores and ecommerce channels together; and |
• | The Company's marketing and loyalty programs become increasingly integrated to maintain customer relationships and improve traffic and conversion rates both in-store and online. |
Our segments sell products online through their ecommerce sites:
• | ANN segment – www.anntaylor.com, www.LOFT.com and www.louandgrey.com |
• | Justice segment – www.shopjustice.com |
• | Lane Bryant segment – www.lanebryant.com and www.cacique.com |
• | maurices segment – www.maurices.com |
• | dressbarn segment – www.dressbarn.com |
• | Catherines segment – www.catherines.com |
Store Locations
Our stores are typically open seven days a week and most evenings. As of July 30, 2016, we operated approximately 4,900 stores in 49 states, the District of Columbia, Canada and Puerto Rico. ANN has stores in 47 states, the District of Columbia, Canada and Puerto Rico as well as six international franchise stores. Justice has stores in 48 states and Canada as well as 68 international franchise stores, while maurices has stores in 45 states and Canada. dressbarn, Lane Bryant and Catherines have stores located in 48, 47 and 44 states, respectively.
During Fiscal 2016, no store accounted for more than 1% of our total sales. The table below indicates the type of shopping facility in which our stores were located as of July 30, 2016:
Type of Facility | ANN | Justice | Lane Bryant | maurices | dressbarn | Catherines | Total | ||||||||
Strip Shopping Centers | 56 | 209 | 383 | 568 | 600 | 362 | 2,178 | ||||||||
Enclosed Malls | 348 | 518 | 190 | 349 | 52 | 6 | 1,463 | ||||||||
Outlet Malls and Outlet Strip Centers | 265 | 113 | 115 | 56 | 157 | 2 | 708 | ||||||||
Lifestyle Centers and Downtown Locations | 353 | 97 | 84 | 20 | — | 3 | 557 | ||||||||
Total | 1,022 | 937 | 772 | 993 | 809 | 373 | 4,906 | ||||||||
As of July 30, 2016, our stores had a total of 26.9 million square feet, consisting of ANN with 5.8 million square feet, Justice with 3.9 million square feet, Lane Bryant with 4.3 million square feet, maurices with 5.1 million square feet, dressbarn with 6.3 million square feet and Catherines with 1.5 million square feet. All of our store locations are leased. Some of our leases contain renewal options and termination clauses, particularly in the early years of a lease, which are exercisable if specified sales volumes are not achieved.
6
Store Count by Segment
Fiscal 2016 | |||||||||||||||||||||
ANN | Justice | Lane Bryant | maurices | dressbarn | Catherines | Total | |||||||||||||||
Beginning of Period | — | 978 | 765 | 951 | 824 | 377 | 3,895 | ||||||||||||||
Stores added from ANN Acquisition | 1,039 | — | — | — | — | — | 1,039 | ||||||||||||||
Opened | 21 | 8 | 30 | 52 | 15 | 3 | 129 | ||||||||||||||
Closed | (38 | ) | (49 | ) | (23 | ) | (10 | ) | (30 | ) | (7 | ) | (157 | ) | |||||||
End of Period | 1,022 | 937 | 772 | 993 | 809 | 373 | 4,906 | ||||||||||||||
Fiscal 2015 | ||||||||||||||||||
Justice | Lane Bryant | maurices | dressbarn | Catherines | Total | |||||||||||||
Beginning of Period | 997 | 771 | 922 | 820 | 386 | 3,896 | ||||||||||||
Opened | 30 | 35 | 41 | 34 | — | 140 | ||||||||||||
Closed | (49 | ) | (41 | ) | (12 | ) | (30 | ) | (9 | ) | (141 | ) | ||||||
End of Period | 978 | 765 | 951 | 824 | 377 | 3,895 | ||||||||||||
Trademarks
Our principal owned trademarks include:
ANN TAYLOR®, LOFT®, ANN TAYLOR LOFT®, LOU & GREY®, JUSTICE®, LANE BRYANT®, LANE BRYANT OUTLET®, CACIQUE®, RIGHT FIT®, MAURICES®, DRESSBARN®, CATHERINES®, CATHERINES PLUS SIZES®, MAGGIE BARNES®, LIZ&ME®, SERENADA®, DRESSBAR®, 6th & LANE® and MAURICES IN MOTION®.
We have U.S. Certificates of Registration of Trademark and trademark applications pending for the operating names of our stores and our major private label merchandise brands. We believe our ANN TAYLOR®, LOFT®, ANN TAYLOR LOFT®, LOU & GREY®, JUSTICE®, LANE BRYANT®, LANE BRYANT OUTLET®, CACIQUE®, RIGHT FIT®, MAURICES®, DRESSBARN®, CATHERINES® and CATHERINES PLUS SIZES® trademarks are material to the continued success of our business. Accordingly, we intend to maintain our trademarks and related registrations and vigorously protect them against infringement.
Product Licensing
We earn licensing revenue through international franchise stores along with advertising and other marketing initiatives with partner companies. Licensing revenue is less than 1% of our consolidated annual net sales. As of July 30, 2016, ANN had six international franchise stores and Justice had 68 international franchise stores. We continue to explore other partnership opportunities to support our long-term growth.
International Operations
As of July 30, 2016, our ANN segment had 13 company-operated stores in Canada; our Justice segment had 42 company-operated stores in Canada; and our maurices segment had 35 company-operated stores in Canada. We continue to assess further Canadian expansion, as well as other international opportunities for our family of brands.
Sourcing
The Company's brands source their products through a variety of sourcing channels. Factors affecting the selection of sourcing channels include cost, speed-to-market, merchandise selection, vendor capacity and fashion trends.
The Company's sourcing entity operates under the name Ascena Global Sourcing (“AGS”). Through AGS’s offices in Seoul, South Korea, Shanghai, China and Hong Kong, AGS maintains direct relationships with manufacturing partners, enabling AGS to control the quality of goods, while achieving speed to market and favorable pricing. AGS has registered various trademarks related to the Company’s brands in foreign countries to the degree necessary to protect these marks, although there may be restrictions on the use of these marks in a limited number of foreign jurisdictions.
7
In addition, the Company also sources some of its merchandise through third-party buying agents based mainly in Asia. The Company partners with these third-party buying agents to leverage their insight into fashion trends and customer preferences, which is then considered when making product development and fast-fashion decisions. We believe, in certain instances, this buying-agent sourcing network provides favorable cost, quality and/or flexibility for our merchandise selection.
Merchandising and Design
We continue to focus on building our merchandising and design functions to align with our market positions and support our direct souring model. Our merchandising and design teams determine the selection and needs of inventory for the upcoming season in response to fast changing fashion trends and customer preferences. Over the last few years, we made substantial investment in acquiring and retaining merchandising and design talent, which has resulted in improved merchandise selection and better inventory management.
Office and Distribution Centers
For a detailed discussion of our office and distribution centers, see Part I, Item 2 “Properties” in this Annual Report on Form 10-K.
Information Technology Systems
We continue to make ongoing investments in our information technology systems to support our omni-channel strategy, merchandise procurement, inventory management and supply chain integration. Our information technology systems make the design, marketing, importing and distribution of our products more efficient by providing common platforms for, among other things, order processing, product and design information, and financial information. During Fiscal 2016, the Company completed the consolidation of Lane Bryant's and Catherines' financial systems and processes onto the Company's platforms. Justice and maurices launched their new ecommerce platforms in Fiscal 2016 and we expect other brands to roll onto these platforms in Fiscal 2017.
Advertising and Marketing
We use a combination of broad-based and targeted marketing and advertising strategies to effectively define, evolve, and promote our brands. These strategies are designed to deliver a personalized and relevant shopping experience for our customers and include customer research, advertising and promotional events, window and in-store marketing materials, direct mail marketing, Internet and social media marketing, lifestyle magazines, catazines and other means of communication. Also, as a result of the growth of our omni-channel strategy, we increasingly focus on personalized email communications and social media marketing.
Customer Relationship Management
We are focused on building our customer relationships and promoting customer loyalty through various programs including brand specific loyalty points and credit card programs. Such programs allow us to better understand our customers’ needs and expectations, deliver a more targeted and personalized omni-channel shopping experience and further enhance the efficiency of our marketing programs. Customers enrolled in our loyalty points programs earn reward points by shopping at our brands which are redeemable toward future purchases. Our brands also offer credit card programs to eligible customers in the U.S. To encourage customers to apply for a credit card, we provide a discount to approved card members on all purchases made with a new card on the day of application acceptance. Rewards points are then earned on purchases made with the credit card at that brand. In addition, under the co-branded credit card program, certain of our brands offer the customer the option of earning additional reward points for purchases made at any other business in which the card is accepted.
Community Service
ascena and its family of brands have a rich history of giving. This is demonstrated through ascena cares, which reflects our culture and the extraordinary philanthropic efforts taking place within our organization. Together, we have a shared commitment for making the world a better place for the women and girls we serve, for the communities where we live and work and for our dedicated associates. The Company is also proud to sponsor the Roslyn S. Jaffe Awards, in which monetary grants are awarded to female social entrepreneurs who are making a meaningful difference for women and children. Whether through collective partnerships or individual brand outreach efforts, at ascena we support the women who buy, make and sell our products. More information about the history of our charitable giving, including the charities we support, is available at www.ascenacares.com.
8
Competition
The retail apparel industry is highly competitive and fragmented, with numerous competitors, including department stores, off-price retailers, specialty stores, discount stores, mass merchandisers and Internet-based retailers, many of which have substantially greater financial, marketing and other resources than us. Many of our competitors are able to engage in aggressive promotions, including reducing their selling prices. Some of our competitors are Walmart, Macy’s, JCPenney, Kohl’s, Old Navy, Target, TJX Companies and Amazon. Other competitors may move into the markets that we serve. Our business is vulnerable to demand and pricing shifts, and to changes in customer tastes and preferences. If we fail to compete successfully, we could face lower net sales and may need to offer greater discounts to our customers, which could result in decreased profitability. We believe that we have established and reinforced our image as a source of fashion and value by focusing on our target customers and by offering up-to-date fashion, superior customer service and shopping convenience across our multiple sales channels.
Merchandise Vendors
We purchase our merchandise from many domestic and foreign suppliers. We have no long-term purchase commitments or arrangements with any of our suppliers, and believe that we are not dependent on any one supplier as no third-party supplier accounts for more than 10% of our merchandise purchases. We believe that we have good working relationships with our suppliers.
Employees
As of July 30, 2016, we had approximately 66,000 employees, 50,000 of whom worked on a part-time basis. We typically add temporary employees during peak selling periods, which vary throughout the year at each of our brands, and adjust the hours they work to coincide with holiday shopping patterns. Except for approximately 70 employees of Lane Bryant that were represented by unions at the end of Fiscal 2016, none of our other employees are covered by any collective bargaining agreement. We consider our employee and union relations to be good.
Executive Officers of the Registrant
The following table sets forth the name, age and position of our Executive Officers:
Name | Age | Positions | ||
Elliot S. Jaffe | 90 | Co-founder and Non-Executive Chairman of the Board | ||
David Jaffe | 57 | President and Chief Executive Officer | ||
John Pershing | 45 | Executive Vice President, Chief Human Resources Officer | ||
Duane D. Holloway | 44 | Executive Vice President, General Counsel and Assistant Secretary | ||
Robb Giammatteo | 44 | Executive Vice President and Chief Financial Officer | ||
Ernest LaPorte | 64 | Senior Vice President, Chief Accounting Officer | ||
Mr. Elliot S. Jaffe, our co-founder and Non-Executive Chairman of the Board, was Chief Executive Officer of our company from 1966 until 2002.
Mr. David Jaffe became President and Chief Executive Officer in 2002 and has served as a member of the Board of Directors since 2001. Previously he had been Vice Chairman, Chief Operating Officer. He joined Company in 1992 as Vice President - Business Development and became Senior Vice President in 1995 and Executive Vice President in 1996. Mr. Jaffe is the son of Elliot S. and Roslyn S. Jaffe. Mrs. Jaffe, our co-founder, serves as Secretary of our Company.
Mr. John Pershing became Executive Vice President, Chief Human Resources Officer in 2015. He joined the Company in 2011 as Senior Vice President, Human Resources of both the corporate shared services group and dressbarn. Prior to joining the Company, Mr. Pershing spent over 20 years at Best Buy in a variety of leadership roles and was most recently Executive Vice President, Human Capital.
Mr. Duane D. Holloway joined the Company in January 2016 as Senior Vice President, General Counsel and Assistant Secretary and became Executive Vice President, General Counsel and Assistant Secretary in July 2016. Prior to joining the Company, Mr. Holloway served as Vice President, Deputy General Counsel with CoreLogic, Inc., a leading publicly-traded real estate data, analytics and services company. Prior to CoreLogic, he held numerous leadership roles with publicly-traded Caesars Entertainment Corporation.
9
Mr. Robb Giammatteo became Executive Vice President and Chief Financial Officer in 2015. He joined the Company in 2013 as the Senior Vice President of FP&A and Investor Relations. Prior to joining the Company, Mr. Giammatteo was the Vice President of Corporate FP&A at VF Corporation, and before that, the Divisional CFO of VF Outlet. Prior to VF, he spent several years in a variety of financial leadership roles at Limited Brands and General Motors.
Mr. Ernest LaPorte joined the Company in September 2014 as Senior Vice President and Chief Accounting Officer. Prior to joining the Company, Mr. LaPorte was Senior Vice President, Controller at Saks Incorporated from 2007 to 2014. Prior to Saks, Mr. LaPorte was Vice President of Finance and Principal Accounting Officer at the Movado Group, Inc. from 2005 to 2007 and preceding that held several positions at Barnes & Noble, Inc. from 1999 to 2005. Mr. LaPorte began his career in public accounting and is a CPA.
Item 1A. Risk Factors.
There are risks associated with an investment in our securities. The following risk factors should be read carefully in connection with evaluating our business and the forward-looking statements contained in this Annual Report on Form 10-K. Any of the following risks could materially adversely affect our business, our prospects, our operational results, our financial condition, our liquidity, the trading prices of our securities, and the actual outcome of matters as to which forward-looking statements are made in this report. Before making an investment decision, you should carefully consider the risks and uncertainties described below together with all of the other information included or incorporated by reference in this report. We may also be adversely affected by additional risks not presently known to us or that we currently believe are immaterial.
Our business is dependent upon our ability to accurately predict fashion trends and customer preferences in a timely manner.
Fashion apparel trends and customer preferences are volatile and tend to change rapidly, particularly for women and tween girls. Our success depends largely on our ability to anticipate and respond to changing merchandise trends and consumer preferences in a timely manner. Accordingly, any failure by us to anticipate, identify and respond to changing fashion trends could adversely affect consumer acceptance of the merchandise in our stores, which in turn could adversely affect our business and our image with our customers. Because we enter into agreements for the manufacture and purchase of merchandise well in advance of the applicable selling season, we are vulnerable to changes in consumer preferences and demand, price shifting, and the optimal selection and timing of merchandise purchases. If we miscalculate either the demand for our merchandise or our customers’ tastes or purchasing habits, we may be required to sell a significant amount of unsold inventory at below average markups over cost, or below cost, which would have an adverse effect on our operational results, financial position and cash flows.
In connection with the ANN Acquisition, we incurred significant additional indebtedness, which could adversely affect us.
We substantially increased our indebtedness in connection with the completion of the ANN Acquisition, which could have the effect, among other things, of reducing our flexibility to respond to changing business and economic conditions and further increasing our interest expense. We also incurred various costs and expenses associated with our financings. The amount of cash flows required to pay interest on our increased indebtedness levels resulting from the ANN Acquisition, and thus the demands on our cash resources, will be greater than the amount of cash flows required to service our indebtedness prior to the transaction. The increased levels of indebtedness could also reduce funds available for working capital, capital expenditures, acquisitions and other general corporate purposes and may create competitive disadvantages for us relative to other companies with lower debt levels. If we do not achieve the expected benefits and cost savings from the acquisition, or if the financial performance of the combined company does not meet current expectations, our ability to service our indebtedness may be adversely impacted.
The indebtedness incurred in connection with the acquisition bears interest at variable interest rates. If interest rates increase, variable rate debt will create higher debt service requirements, which could adversely affect our cash flows.
In addition, our credit ratings affect the cost and availability of future borrowings and, accordingly, our cost of capital. Our ratings reflect each rating organization’s opinion of our financial strength, operating performance and ability to meet our debt obligations. In connection with the debt financing, we received ratings from S&P and Moody’s. There can be no assurance that we will maintain particular ratings in the future.
Moreover, we may be required to raise substantial additional financing to fund working capital, capital expenditures or acquisitions or for other general corporate requirements. Our ability to arrange additional financing will depend on, among other factors, our financial position and performance, as well as prevailing market conditions and other factors beyond our control. We cannot be assured that we will be able to obtain additional financing on terms acceptable to us or at all.
10
To service our indebtedness after the ANN Acquisition, we will require a significant amount of cash and our ability to generate cash depends on many factors beyond our control.
Our ability to make cash payments on our indebtedness as a result of the ANN Acquisition, as well as our ability to fund planned capital expenditures and operating or strategic initiatives will depend on our ability to generate significant operating cash flow in the future, which is, to a significant extent, subject to general economic, financial, competitive, legislative, regulatory and other factors that will be beyond our control.
Our business may not generate sufficient cash flow from operations to enable us to pay our indebtedness or fund our other liquidity needs. In any such circumstance, we may need to refinance all or a portion of our indebtedness, on or before maturity, or incur additional debt subject to the restrictions of our borrowing agreements. We may not be able to refinance any indebtedness or incur additional debt on commercially reasonable terms or at all. If we cannot service our indebtedness or incur additional debt, we may have to take actions such as selling assets, seeking additional equity or reducing or delaying capital expenditures, strategic acquisitions and investments. Any such action, if necessary, may not be effected on commercially reasonable terms or at all. The instruments governing our indebtedness may restrict our ability to sell assets and our use of the proceeds from such sales.
If we are unable to generate sufficient cash flow or are otherwise unable to obtain funds necessary to meet required payments of principal and interest on our indebtedness, we could be in default under the terms of the agreements governing such indebtedness. In the event of such default, the holders of such indebtedness could elect to declare all the funds borrowed thereunder to be due and payable, together with accrued and unpaid interest, and the lenders under the term facility, the revolving facility and other indebtedness, or any replacement facilities in respect thereof, could elect to terminate their commitments thereunder, cease making further loans and institute foreclosure proceedings against the Company’s assets, and we could be forced into bankruptcy or liquidation.
Our Amended Revolving Credit Agreement and our Term Loan contain various covenants that impose restrictions on the Company and certain of its subsidiaries that may affect their ability to operate their businesses.
The Amended Revolving Credit Agreement and the Term Loan contain various affirmative and negative covenants that may, subject to certain significant exceptions, restrict the ability of the Company and certain of its subsidiaries to, among other things, have liens on their property, change the nature of their business, transact business with affiliates and/or merge or consolidate with any other person or sell or convey certain of their assets to any one person. In addition, the agreements that govern the financings contain financial covenants that, under certain circumstances, will require the Company to maintain certain financial ratios. The ability of the Company and its subsidiaries to comply with these provisions may be affected by our operating results as well as events beyond their control. Failure to comply with these covenants could result in an event of default, which, if not cured or waived, could accelerate the Company’s repayment obligations.
Inability to access liquidity or capital markets could adversely affect the Company's business, operational results, financial position or cash flows.
Changes in the credit and capital markets, including market disruptions, limited liquidity and interest rate fluctuations, may increase the cost of financing or restrict the Company’s access to potential sources of future liquidity. As a result of general unpredictability in the global financial markets, there can be no assurance that our liquidity will not be affected or that our capital resources will at all times be sufficient to satisfy our liquidity needs. Although we believe that our existing cash and cash equivalents, cash provided by operations, and our availability under our $600 million Amended and Restated Credit Agreement will be adequate to satisfy our capital needs for the foreseeable future, any renewed tightening of the credit markets could make it more difficult for us to access funds, enter into an agreement for new indebtedness or obtain funding through the issuance of our securities. Our borrowing agreements also have financial convents and certain restrictions which, if not met, may limit our ability to access funds.
In addition, we also have cash and cash equivalents on deposit at overseas financial institutions as well as at FDIC-insured financial institutions that are currently in excess of FDIC-insured limits. As a result, we cannot be assured that we will not experience losses with respect to cash on deposit at these financial institutions.
Our ability to successfully integrate new acquisitions.
The success of ascena's businesses continues to depend on our ability to integrate and manage our expanding operations, to realize opportunities for revenue growth and to eliminate redundant and excess costs. Achieving the anticipated benefits of previous and future acquisitions, including the ANN Acquisition, may present a number of significant risks and considerations, including, but not limited to:
• | unsuccessful, delayed or more costly integration; |
11
• | demands on management related to the increase in our size and the loss of key employees; |
• | the diversion of management’s attention from the management of daily operations to the integration of operations; |
• | expected cost savings not being achieved in full, or taking longer or requiring greater investment to achieve; and |
• | not achieving the anticipated omni-channel growth potential. |
Our ability to successfully implement and optimize our omni-channel retail strategy and maintain a relevant and reliable omni-channel experience for our customers.
We are committed to growing our business through our omni-channel retail strategy. Our goal is to offer our customer seamless access to our brands and merchandise whenever and wherever they choose to shop. Accordingly, our success also depends on our ability to anticipate and implement innovations in sales and marketing strategies to appeal to existing and potential customers who increasingly rely on multiple portals, including mobile technologies, to meet their shopping needs. Failure to enhance our technology and marketing efforts to align with our customers’ shopping preferences could significantly impair our ability to meet our strategic business and financial goals. Failing to successfully implement and optimize our omni-channel retail strategy could have a material adverse effect on our business, operational results, financial position and cash flows.
We face challenges to grow our business and to manage our growth.
The success of our growth strategy depends upon a number of factors, including, among others, the identification of suitable markets and sites for new stores, implementation of our omni-channel strategy, ability to maintain the appropriate store fleet size given the growth of the ecommerce business and its diversion of sales from brick-and-mortar stores, negotiation of leases on acceptable terms, construction or renovation of sites in a timely manner at acceptable costs and maintenance of the productivity of our existing store base. We also must be able to effectively renew our existing store leases. We must be able to hire, train and retain competent managers and personnel and manage the systems and operational components of our growth. Our failure to open new stores on a timely basis, obtain acceptance in markets in which we currently have limited or no presence, attract qualified management and personnel or appropriately adjust operational systems and procedures could have an adverse effect on our growth prospects. In addition, the challenges of declining store traffic and the inability to achieve acceptable results in new and existing store could lead to store closures and/or asset impairment charges, which could negatively impact our operational results, financial position and cash flows.
We depend on strip shopping center and mall traffic and our ability to identify suitable store locations.
Many of our stores are located in strip shopping centers, shopping malls and other retail centers that, historically, have benefited from their proximity to “anchor” retail tenants, generally large department stores, and other attractions, which generate consumer traffic in the vicinity of our stores. Strip shopping center and mall traffic may be adversely affected by, among other things, economic downturns, the closing of or continued decline of anchor stores that drive consumer traffic or changes in customer shopping preferences. A decline in the popularity of strip shopping center or mall shopping among our target customers could have a material adverse effect on customer traffic and our operational results. In order to leverage customer traffic and the shopping preferences of our customers, we need to maintain or acquire stores in desirable consumer locations where competition for suitable store locations is intense.
In addition, continued consolidation in the commercial retail real estate market could affect our ability to successfully negotiate favorable rental terms for our stores in the future. Should significant consolidation continue, a large portion of our store base could be concentrated with one or fewer landlords that could then be in a position to dictate unfavorable terms to us due to their significant negotiating leverage. If we are unable to negotiate favorable lease terms with these landlords, this could affect our ability to profitably operate our stores, which in turn could have a material effect on our business, operational results, financial condition and cash flows.
Existing and increased competition and fundamental shifts in the women’s and girls' retail apparel industry may reduce our net revenues, profits and market share.
The women’s and girls' retail apparel industry is highly competitive. Although the Company is one of the nation’s largest specialty retailers, we have numerous and varied competitors at the national and local level, primarily consisting of department stores, off-price retailers, other specialty stores, discount stores, mass merchandisers, Internet and mail-order retailers, some of whom have advantages over us, including substantially greater financial, marketing or promotional resources. Many retailers, such as department stores, also offer a broader selection of merchandise than we offer and continue to be promotional and reduce their selling prices, and in some cases are expanding into markets in which we have a significant presence. As a result of this competition, we may experience pricing pressures, increased marketing expenditures and loss of market share, which could have a material adverse effect on our business, operational results, financial position and cash flows.
12
In addition, the growth and prominence of fast-fashion and value-fashion retailers and expansion of off-price retailers have fundamentally shifted customers’ expectations of affordable pricing of well-known brands and exacerbated the continued promotional pressure. The rise of these retailers as well as the shift in shopping preferences from brick-and-mortar stores to the ecommerce channel, where online-only businesses or those with robust ecommerce capabilities continue to grow, have increased the difficulty of maintaining and gaining market share. A downturn or an uncertain outlook in the women’s and girls’ specialty retail sector in which our brands sell their products could have a material adverse effect on our business, operational results, financial position and cash flows.
Our ability to maintain our brand image, engage new and existing customers and gain market share.
Our ability to maintain our brand image and reputation is integral to our business as well as the implementation of strategies to expand it. Maintaining, promoting and growing our brands will depend largely on the success of our design, merchandising and marketing efforts and our ability to provide a consistent, high-quality customer experience. In addition, while most of our brands are mature and we have extensive customer lists, our success depends, in part, on our ability to keep existing customers while engaging and attracting new customers to shop our brands. Our business and results of operations could be adversely affected if we fail to achieve these objectives for any of our brands and failure to achieve consistent, positive performance at several of our brands simultaneously could have an adverse effect on our sales and profitability. In addition, our ability to address the challenges of declining store traffic, including at strip shopping centers, shopping malls, outlet centers and other retail centers, in a highly promotional, low growth environment may impact our ability to maintain and gain market share and also impact our business, operational results, financial position and cash flows.
Our business depends on effective marketing, advertising and promotional programs.
Customer traffic and demand for our merchandise is influenced by our advertising, marketing and promotional activities, the name recognition and reputation of our brands, and the location and service offered in our stores. Although we use marketing, advertising and promotional programs to attract customers through various media, including social media, database marketing and print, our competitors may spend more or use different approaches, which could provide them with a competitive advantage. Our promotional activity and other programs may not be effective, may be perceived negatively or could require increased expenditures, which could adversely impact our business, operational results, financial position and cash flows.
We depend on key personnel in order to support our existing business and future expansion and may not be able to retain or replace these employees or recruit additional qualified personnel.
Our success and our ability to execute our business strategy depend largely on the efforts of our current management teams at the Company and the respective brands. Executives at the Company and the brands have substantial experience in the retail business and have made significant contributions to the growth and success of our business. The loss of the services of one or more of our key personnel could have a material adverse effect on our business, as we may not be able to find suitable management personnel to replace departing executives on a timely basis. Competition for key personnel in the retail industry is intense, and our operations could be adversely affected if we fail to attract, hire, motivate and retain qualified personnel or if we fail to attract additional qualified individuals.
Our performance also depends in large part on the talents and contributions of engaged and skilled associates in all areas of the Company. If we are unable to identify, hire, develop, motivate and retain talented individuals, we may be unable to compete effectively which could adversely impact our business, operational results, financial position and cash flows.
We rely on foreign sources of production.
We purchase a significant portion of our merchandise directly from foreign markets, including Asia, the Middle East and Africa, and indirectly through domestic vendors with foreign sources. We face a variety of risks generally associated with doing business in foreign markets and importing merchandise from abroad, including, but not limited to:
• | financial or political instability or terrorist acts in any of the countries in which our merchandise is manufactured, or the channels through which it passes; |
• | fluctuations in the value of the U.S. Dollar against foreign currencies or restrictions on the transfer of funds to and from foreign countries; |
• | inability of our manufacturers to comply with local laws, including labor laws, health and safety laws or labor practices; |
• | increased security and regulatory requirements and inspections applicable to imported goods; |
13
• | imposition or increases of duties, taxes and other charges on imports or exports; |
• | imposition of new legislation relating to import quotas or other restrictions that may limit the quantity of our merchandise that may be imported into the United States from countries in regions where we do business; |
• | impact of natural disasters, extreme weather, public health concerns or other catastrophes on our foreign sourcing offices and vendor manufacturing operations; |
• | delays in shipping due to port security or congestion issues, labor disputes or shortages, local business practices, vendor compliance with applicable import regulations or weather conditions; |
• | violations under the U.S. Foreign Corrupt Practices Act or similar laws or regulations; and |
• | increased costs of transportation. |
New initiatives may be proposed that may have an impact on the trading status of certain countries and may include retaliatory duties or other trade sanctions that, if enacted, could increase the cost of products purchased from suppliers in such countries or restrict the importation of products from such countries. The future performance of our business depends on foreign suppliers, and may be adversely affected by the factors listed above, all of which are beyond our control. The foregoing may result in our inability to obtain sufficient quantities of merchandise or increase our costs.
We require our independent manufacturers to operate in compliance with applicable laws and regulations and our internal requirements. Our vendor code of conduct, guidelines and other compliance programs promote ethical business practices, and we monitor compliance with them; however, we do not control these manufacturers, their labor practices, the health and safety conditions of their facilities, or their sources of raw materials. Any violation of labor, health, environmental, safety (e.g., building and fire codes) or other laws by any of the independent manufacturers that we use could damage our reputation and could have a material adverse effect on our business.
Any of the aforementioned risks, independently or in combination with others, could have an adverse effect on our operational results, financial position and cash flows.
Our business could suffer as a result of a third-party manufacturer’s inability to produce goods for us on time and to our specifications.
We do not own or operate any manufacturing facilities and therefore depend upon independent third-parties for the manufacture of all of the goods that we sell. Both domestic and international manufacturers produce these goods. The Company is at risk for increases in manufacturing costs, and we cannot be certain that we will not experience operational difficulties with these third-party manufacturers, such as reductions in the availability of production capacity, errors in complying with merchandise specifications, insufficient quality control and failure to meet production deadlines. In addition, we cannot predict the impact of world-wide events, including inclement weather, natural or man-made disasters, public health issues, strikes, acts of terror or political, social or economic conditions on our major suppliers. Our suppliers could also face economic pressures as a result of rising wages and inflation or experience difficulty obtaining adequate credit or access to liquidity to finance their operations, which could lead to vendor consolidation. A manufacturer's failure to continue to work with us, ship orders in a timely manner or to meet our safety, quality and social compliance standards could result in supply shortages, failure to meet customer expectations and damage to our brands, which could have a material adverse impact on our business, operational results, financial position and cash flows.
Our business could suffer if we need to replace manufacturers.
We compete with other companies for the production capacity of our manufacturers and import quota capacity. Many of our competitors have greater financial and other resources than we have and thus may have an advantage in the competition for production capacity. If we experience a significant increase in demand, or if an existing manufacturer of the goods that we sell must be replaced, we may have to increase purchases from our other third-party manufacturers and we cannot guarantee we will be able to do so at all or on terms that are acceptable to us. This may negatively affect our operational results. We enter into a number of purchase order commitments each season specifying a time for delivery, method of payment, design and quality specifications and other standard industry provisions, but we do not have long-term contracts with any manufacturer.
Our business could suffer if one of the manufacturers of the goods that we sell fails to use acceptable labor practices.
We require manufacturers of the goods that we sell to operate in compliance with applicable laws and regulations. While our internal and vendor operating guidelines promote ethical business practices and our staff and our agents periodically visit and monitor the operations of our independent manufacturers, we do not control these manufacturers or their labor practices. The violation of local labor, employment or other laws or regulations by an independent third-party manufacturer used by us, or the divergence of an independent third-party manufacturer’s labor practices from those generally accepted as ethical in the United
14
States, could disrupt the shipment of products to our stores, force us to locate alternative manufacturing sources, reduce demand for our merchandise, damage our reputation or expose us to potential liability, which may result in a decrease in customer traffic to our stores or ecommerce websites that could adversely affect our operational results. Publicity regarding violation of the foregoing guidelines or practices or other social/compliance standards by any of our third-party manufacturers could have a material adverse impact on our business, operational results, financial position and cash flows.
Our business would suffer a material adverse effect if our distribution or fulfillment centers were shut down or disrupted.
Nearly all of the merchandise we purchase is shipped directly to our distribution and fulfillment centers, where it is prepared for shipment to the appropriate stores or to the customer directly through our ecommerce channel. As a result of damage to, or prolonged interruption of, operations at any of these facilities due to a work stoppage, supply chain disruption, inclement weather, natural or man-made disasters, system failures, slowdowns or strikes, acts of terror or other unforeseen events, we could incur significantly higher costs and longer lead times associated with distributing our products to our stores or customers during the time it takes for us to reopen or replace any of these facilities, which in turn could have a material adverse effect on our financial position, operational results and cash flows.
Although we maintain business interruption and property insurance for these facilities, management cannot be assured that our insurance coverage will be sufficient, or that insurance proceeds will be timely paid to us, if distribution or fulfillment centers are shut down or interrupted for any unplanned reason.
Our business could suffer as a result of increases in the price of raw materials, labor, energy and freight.
Raw materials used to manufacture our merchandise are subject to availability constraints and price volatility caused by high or low demand for fabrics, labor conditions, transportation or freight costs, currency fluctuations, weather conditions, supply conditions, government regulations, economic inflation, market speculation and other unpredictable factors. Increases in the demand for and price of cotton, wool and other raw materials used in the production of fabric and accessories, as well as increases in labor and energy costs or shortages of skilled labor, could result in increases for the costs of our products as well as their distribution to our distribution centers, retail locations and to our customers. Additionally, freight costs are impacted by changes in fuel prices. Fuel prices affect freight costs on inbound freight from vendors to the distribution centers, outbound freight from the distribution centers to our stores and shipments directly to our customers. Higher product costs could have a negative effect on our gross profit margin and increased selling prices could have a negative effect on our sales volume.
We may experience disruptions at ports used to import our products from Asia and other regions.
We currently ship the vast majority of our products by ocean. If a disruption occurs in the operation of ports through which our products are imported, we and our vendors may have to ship some or all of our products from Asia or other regions by air freight or to alternative shipping destinations in the United States. Shipping by air is significantly more expensive than shipping by ocean and our profitability could be reduced. Similarly, shipping to alternative destinations in the United States could lead to increased lead times and costs for our products. A disruption at ports (domestic or abroad) through which our products are imported could have a material adverse effect on our operational results, financial position and cash flows.
Risks associated with ecommerce sales.
The successful operation of our ecommerce business depends on our ability to maintain the efficient and continuous operation of our ecommerce websites and our associated fulfillment operations, and to provide a shopping experience that will generate orders and return visits to our sites. Our ecommerce services are subject to numerous risks, including:
• | computer system failures, including but not limited to, inadequate system capacity, human error, change in programming, website downtimes, system upgrades or migrations, Internet service or power outages; |
• | cyber incidents, including but not limited to, security breaches and computer viruses; |
• | reliance on third-party computer hardware/software fulfillment and delivery providers; |
• | unfavorable federal or state regulations or laws; |
• | violations of federal, state or other applicable laws, including those related to online privacy; |
• | disruptions in telecommunication systems, power outages or other technical failures; |
• | credit card fraud; |
• | constantly evolving technology; |
• | liability for online content; and |
• | natural or man-made disasters or adverse weather conditions. |
15
The Company's failure to successfully address and respond to any one or more of these risks could damage the reputation of our brands and have a material adverse effect on our business, operational results, financial position and cash flows.
Our business could suffer if our information technology systems fail to operate effectively, are disrupted or compromised.
We rely on our existing information technology systems in operating and monitoring all major aspects of our business, including sales, warehousing, distribution, purchasing, inventory control, merchandise planning and replenishment, and financial systems. We regularly make investments to upgrade, enhance or replace these systems, as well as leverage new technologies to support our growth strategies. Any delays or difficulties transitioning to new systems or integrating them with current systems in an orderly and timely fashion could have a material adverse effect on our operational results, financial position and cash flows.
The reliability and capacity of our information technology systems (including third-party hardware and software systems or services) are critical to our continued operations. Despite our precautionary efforts, our information technology systems are vulnerable from time to time to damage or interruption from, among other things, natural or man-made disasters, technical malfunctions, inadequate systems capacity, power outages, computer viruses and security breaches, which may require significant investment to fix or replace, and we may suffer loss of critical data and interruptions or delays to our operations in the interim. While, to our knowledge, we have not experienced any material loss or other unauthorized disclosure of confidential or personally identifiable information (“PII”) as a result of a security breach, or cyber-attack, such an event could adversely affect our business and operations, including our reputation and our relationships with our customers, employees and investors, expose us to risks of litigation and liability, and could impact our operational results, financial position and cash flows.
While we believe that we are diligent in selecting vendors, systems and services to assist us in maintaining the integrity of our information technology systems, we realize that there are risks and that no guarantee can be made that future disruptions, service outages, service failures or unauthorized intrusions will not occur. Certain of our information technology support functions are performed by third-parties in overseas locations. Failure by any of these third-parties to implement and/or manage our information systems and infrastructure effectively and securely could impact our operational results, financial position, and cash flows.
In addition, our ability to continue to operate our business without significant interruption in the event of a disaster or other disruption depends, in part, on the ability of our information technology systems to operate in accordance with our disaster recovery and business continuity plans. Any disruptions affecting our information systems could impact our operational results, financial position and cash flows.
We are subject to cybersecurity risks and may incur increased expenses to mitigate our exposure.
Our business and that of our third-party service providers employ systems and websites that allow us to process credit card transactions containing PII, perform online ecommerce and social media activities, and store and transmit proprietary or confidential customer, employee, job applicant and other personal confidential information. Security and/or privacy breaches, acts of vandalism or terror, computer viruses, misplaced or lost data, programming, and/or human error or other similar events could expose us to a risk of loss or misuse of this information, litigation and potential liability. We may not have the resources or technical sophistication to anticipate or prevent rapidly evolving types of cyber-attacks or intrusions. Attacks may be targeted at us, our customers, or others who have entrusted us with information. Actual or anticipated attacks may cause us to incur significant and additional costs, including, but not limited to the costs to deploy additional personnel and protection technologies, training employees, engaging third-party experts and consultants and compliance costs associated with various applicable laws or industry standards regarding use and/or unauthorized disclosure of PII. We may also incur significant remediation costs, including liability for stolen client or employee information, repairing system damage or providing credit monitoring or other benefits to affected clients or employees. Advances in computer capabilities, new technological discoveries or other developments may result in the technology used by us to protect transaction or other data from being breached or compromised. In addition, data and security breaches can also occur as a result of non-technical issues, including breach by us or by our third-party service providers that result in the unauthorized release of personal or confidential information. Although we maintain cyber-security insurance there can be no assurance that our insurance coverage will cover the particular cyber incident at issue or that such coverage will be sufficient, or that insurance proceeds will be paid to us in a timely manner.
The protection of customer, employee and Company data is critical. The regulatory environment surrounding information security and privacy is demanding, with the frequent imposition of new and changing requirements. In addition, customers have a high expectation that we will adequately protect their personal information. Any actual or perceived misappropriation or breach involving this data could attract negative media attention, cause harm to our reputation or result in liability (including but not limited to fines, penalties or lawsuits), any of which could have a material adverse effect on our operational results, financial position and cash flows.
16
We may be exposed to risks and costs associated with customer payment methods, including credit card fraud and identity theft, which would cause us to incur unexpected expenses and loss of revenues.
In the standard course of business, we process customer information, including payment information, through our stores and ecommerce sites. There is an increased concern over the security of PII transmitted over the Internet, consumer identity theft and user privacy. We endeavor to protect consumer identity and payment information through the implementation of security technologies, processes and procedures. It is possible that an individual or group could defeat our security measures and access sensitive consumer information. Actual or anticipated attacks may cause us to incur increased costs, including costs to deploy additional personnel and protection technologies, train employees, and engage third-party experts and consultants. Incidents which result in exposure of customer data will be handled in accordance with applicable laws and regulations. Exposure of customer data through any means could materially harm the Company by, but not limited to, reputational damage, regulatory fines and costs of litigation.
On October 1, 2015 the payment cards industry began shifting liability for certain debit and credit card transactions to retailers who do not accept Europay, MasterCard and Visa (“EMV”) chip technology transactions. Until we are able to fully implement and certify the EMV chip technology in our stores, we may be liable for chargebacks related to counterfeit transactions generated through EMV chip enabled cards, which could negatively impact our operational results, financial position and cash flows.
Our business could suffer if parties with whom the Company does business are subject to insolvency risks or may otherwise become unable or unwilling to perform their obligations to the Company.
The Company is party to contracts, transactions and business relationships with various third parties, including vendors, suppliers, service providers and lenders, pursuant to which such third parties have performance, payment and other obligations to the Company. In some cases, the Company depends upon such third parties to provide essential products, services or other benefits, advertising, software development and support, logistics, and other agreements for goods and services in order to operate the Company’s business in its ordinary course. Adverse economic, industry or market conditions could result in an increased risk to the Company associated with the potential financial distress or insolvency of such third parties. If any of these third parties were to become subject to bankruptcy, receivership or similar proceedings, the rights and benefits of the Company in relation to its contracts, transactions and business relationships with such third parties could be terminated, modified in a manner adverse to the Company, or otherwise impaired. The Company cannot make any assurance that it would be able to arrange alternate or replacement contracts, transactions or business relationships on terms as favorable as the Company’s existing contracts, transactions or business relationships, if at all. Any inability on the part of the Company to do so could negatively affect the Company’s business, operational results, financial position and cash flows.
General economic conditions may adversely affect our business.
Our performance is subject to macroeconomic conditions and their impact on levels of consumer spending. Some of the factors negatively impacting discretionary consumer spending include general economic conditions, volatility in national and international financial markets, consumer confidence, fiscal and monetary policies of government, high unemployment, lower wage levels, increased taxation, high consumer debt, reductions in net worth based on severe market declines (such as in residential real estate markets), higher fuel, energy and other prices, tax policies, increasing interest rates, severe weather conditions, the threat of or actual terrorist attacks, military conflicts and the domestic or international political environment. In addition, any significant volatility in our financial markets could also negatively impact the levels of future discretionary consumer spending. Such macroeconomic and other factors could have a negative effect on consumer spending in the U.S., which in turn could have a material effect on our business, operational results, financial condition and cash flows.
Impairment to the carrying value of our goodwill or other intangible assets could result in significant non-cash charges.
As described in Note 6 to the accompanying consolidated financial statements included elsewhere herein, as of July 30, 2016, we had approximately $2.5 billion of goodwill and other intangible assets related to the acquisitions of maurices in January 2005, Tween Brands in November 2009, Lane Bryant and Catherines in June 2012 and ANN in August 2015. Current and future economic conditions, as well as the other risks noted in this Item 1A, may adversely impact our brands' ability to attract new customers, retain existing customers, maintain sales volumes and maintain margins. As discussed in our Critical Accounting Policies included elsewhere herein, these events could materially reduce our brands' profitability and cash flow which could, in turn, lead to a further impairment of our goodwill and other intangible assets, in addition to the impairment losses of $306.4 million recorded during Fiscal 2015 to write down the carrying value of Lane Bryant's goodwill and intangible asset to their fair values. Furthermore, significant negative industry or general economic trends, disruptions to our business and unexpected significant changes or planned changes in our use of the assets may result in additional impairments to our goodwill, intangible assets and other long-lived assets. Any impairment could have a material effect on our operational results and financial condition.
17
Our gross margins could be adversely affected if we are unable to manage our inventory effectively.
Fluctuations in the global apparel retail markets impact the levels of inventory owned by apparel retailers, as merchandise usually must be ordered well in advance of the applicable selling season and frequently before apparel trends are confirmed by customer purchases. In addition, the nature of the global apparel retail business requires us to carry a significant amount of inventory, especially prior to the peak holiday selling season when we build up our inventory levels. As a result, we are vulnerable to demand and pricing shifts and to suboptimal selection and timing of merchandise purchases. In the past, we have not always predicted our customers’ preferences and acceptance levels of our trend items with accuracy. If sales do not meet expectations, too much inventory may cause excessive markdowns and, therefore, lower than planned margins. Conversely, if we underestimate demand for our merchandise, we may experience inventory shortages resulting in missed sales and lost revenues. Either of these events could significantly affect our operating results and brand image and loyalty. Our margins may also be impacted by changes in our merchandise mix, a shift toward merchandise with lower selling prices or changes to our pricing structure. These changes could have a material effect on our business, operational results, financial condition and cash flows.
We have key strategic initiatives designed to optimize our inventory levels and increase the efficiency and responsiveness of our supply chain, including what we refer to as our seamless inventory and responsive supply chain initiatives. Aspects of seamless inventory include timelier matching of product supply and demand across markets and channels to reduce stranded inventory. Aspects of responsive supply chain include more vendor fabric platforming, product demand testing and in-season rapid response to demand. These initiatives involve significant systems and operational changes and we have limited experience operating in this manner. If we are unable to implement these initiatives successfully, we may not realize the return on our investments that we anticipate, and our operating results could be adversely affected.
Increases in labor costs, including wages and employee healthcare costs, could impact the Company's operational results, financial position and cash flows.
The Company's expenses relating to wages and employee healthcare costs are significant. Unfavorable changes in labor costs could negatively affect the Company's operational results, financial position and cash flows. Our wage rates may increase in the foreseeable future and are subject to various factors such as unemployment levels, prevailing wage rates, minimum wage requirements and economic conditions. A significant number of states in which we do business have recently increased or are considering increasing the minimum wage, and there is a possibility that Congress will increase the federal minimum wage. In addition, healthcare costs have risen significantly in recent years, and recent legislative and private sector initiatives regarding healthcare reform could result in significant changes to the U.S. healthcare system. Due to the breadth and complexity of the healthcare reform legislation and the lack of implementing regulations and interpretive guidance, the Company is not able to fully determine the impact that healthcare reform will have in the future on the Company-sponsored medical plans.
We are pursuing a strategy of international expansion.
We intend to expand our operations and presence in existing and new countries in the future. Currently, several of our brands have expanded their presence into Canada as well as certain countries in the Middle East, Southeast Asia, Central America and South America, either through their own retail operations or through franchise or other licensing operations.
As we expand internationally, we may incur significant costs associated with the start-up and maintenance of foreign operations. Costs may include, but are not limited to, obtaining locations for stores, setting up foreign offices, hiring experienced management and maintaining good relations with associates. We may be unable to open and operate new stores successfully, or we may face operational issues that delay our intended pace of international store growth. In any such case, our expansion may be limited, unless we can:
• | identify suitable markets and sites for store locations; |
• | address the different operational characteristics present in each country to which we expand, including employment and labor, transportation, logistics, finance, real estate, lease provisions and local reporting or legal requirements; |
• | negotiate acceptable lease terms, in some cases in locations in which the relative rights and obligations of landlords and tenants differ significantly from the customs and practices in the U.S.; |
• | hire, train and retain competent store personnel; |
• | gain and retain acceptance from foreign customers who may have different preferences and purchasing trends; |
• | manage inventory effectively to meet the needs of new and existing stores on a timely basis; |
• | expand infrastructure to accommodate growth; |
• | manage foreign government regulations; |
• | manage foreign currency exchange risk effectively; and |
18
• | achieve acceptable operating margins from new stores. |
In addition, franchised stores are independently owned and operated, and franchisees are not our employees. Consequently, franchisees may not operate in accordance with our standards or requirements or in a manner consistent with applicable law. The quality of franchised operations may be diminished by any number of factors beyond our control. The failure of our franchisees to operate franchises successfully could have a material adverse effect on our reputation, operational results, financial position and cash flow.
Other challenges may include facing established competitors, as well as general economic conditions in specific countries or markets, disruptions or delays in shipments, changes in diplomatic and trade relationships and political instability. In addition, international expansion may divert financial, operational and managerial resources from our existing operations and/or result in increased costs, which could adversely impact our financial condition and results of operations. Failure to implement our international expansion plan consistent with our internal expectations, whether as a result of one or more of the factors listed above or other factors, could adversely affect our ability to achieve the objectives that we have established.
As we continue to expand our international operations, we are subject to certain U.S. laws, including the Foreign Corrupt Practices Act, as well as compliance with the laws of foreign countries in which we operate. Violations of these laws could subject us to sanctions or other fines or penalties that would have an adverse effect on our reputation, operational results, financial position and cash flows.
Our business may be affected by regulatory, administrative and litigation developments.
Laws and regulations at the local, state, federal and international levels frequently change, and the ultimate cost of compliance cannot be reasonably estimated. In addition, we cannot predict the impact that may result from regulatory or administrative changes. Changes in regulations, the imposition of additional regulations, or the enactment of any new or more stringent legislation that impacts employment and labor, trade, advertising and marketing practices, product safety, transportation and logistics, healthcare, tax, accounting, privacy, operations or environmental issues, among others, could have an adverse impact on our operational results, financial position and cash flows.
While it is our policy and practice to comply with all legal and regulatory requirements and our procedures and internal controls are designed to promote such compliance, we cannot assure that all of our operations will at all times comply with all such legal and regulatory requirements. A finding that we or our vendors or agents are out of compliance with applicable laws and regulations could subject us to civil remedies or criminal sanctions, which could have a material adverse effect on our business, reputation and stock price. In addition, even the claim of a violation of applicable laws or regulations could negatively affect our reputation. We are also involved from time to time in litigation arising primarily in the ordinary course of business. Litigation matters may include, among other things, employment, commercial, intellectual property, advertising or shareholder claims, and any adverse decision in any such litigation could adversely impact our brands, results of operations and cash flows.
Failure to comply with Section 404 of the Sarbanes-Oxley Act of 2002 could negatively impact our business, the price of our common stock and market confidence in our reported financial information.
We must continue to document, test, monitor and enhance our internal control over financial reporting in order to satisfy the requirements of Section 404 of the Sarbanes-Oxley Act of 2002. We cannot be assured that our disclosure controls and procedures and our internal control over financial reporting required under Section 404 of the Sarbanes-Oxley Act will prove to be adequate in the future. Any failure to maintain the effectiveness of our disclosure controls or our internal control over financial reporting or to comply with the requirements of the Sarbanes-Oxley Act could have a material adverse impact on our business, operational results, financial position and cash flows as well as on the price of our common stock.
Changes to accounting rules and regulations may adversely affect our operational results, financial position and cash flows.
The adoption of new accounting rules and regulations and varying interpretations of existing accounting rules and regulations have occurred in the past and may occur in the future. For instance, accounting regulatory authorities have issued guidance that requires lessees to recognize a right-of-use asset and a corresponding lease liability on the lessees’ balance sheet for all leases with terms of 12 months or more. The Company is currently evaluating this guidance, which becomes effective for fiscal years beginning after December 15, 2018 and interim periods therein, and the impact it will have on the Company’s consolidated financial statements. In addition, as discussed in Note 4 to our consolidated financial statements included elsewhere herein, accounting authorities issued a new revenue standard and the Company is still evaluating the impact of this new standard. These and other future changes to accounting rules or regulations, or the questioning of current accounting practices, may adversely affect our operational results, financial position and cash flows.
19
We may be unable to protect our trademarks and other intellectual property rights.
We believe that our trademarks and service marks are important to our success and our competitive position due to their name recognition with our customers. We devote substantial resources to the establishment and protection of our trademarks and service marks on a worldwide basis, including in the countries in which we have business operations or plan to have business operations. Because we have not registered all of our trademarks in all categories, or in all foreign countries in which we currently, or may in the future, source or offer our merchandise, our international expansion and our merchandising of products using these marks could be negatively impacted. We are not aware of any material claims of infringement or material challenges to our right to use any of our trademarks in the United States or Canada. Nevertheless, the actions we have taken, including to establish and protect our trademarks and service marks, may not be adequate to prevent others from imitating our products or to prevent others from seeking to block sales of our products. Also, others may assert proprietary rights in our intellectual property and we may not be able to successfully resolve these types of conflicts to our satisfaction. In addition, the laws of certain foreign countries may not protect our proprietary rights to the same extent as do the laws of the United States. Any litigation regarding our trademarks could be time-consuming and costly. The loss of exclusive use of our trademarks could have a material adverse effect on our operational results, financial position and cash flows.
We may suffer negative publicity and our business may be harmed if we need to recall any product we sell or if we fail to comply with applicable product safety laws.
The products our brands sell are regulated by many different governmental bodies, including but not limited to the Consumer Product Safety Commission and the Food and Drug Administration in the U.S., Health Canada in Canada, and similar state, provincial and international regulatory authorities. Although we generally test the products sold in our brands’ stores and on our brands’ websites, selected products still could present safety problems of which our brands are not aware. This could lead one or more of our brands to recall selected products, either voluntarily or at the direction of a governmental authority, and may lead to a lack of consumer acceptance or loss of consumer trust. Product safety concerns, recalls, defects or errors could result in the rejection of our products by customers, damage to our reputation, lost sales, product liability litigation and increased costs, any or all of which could harm our business and have a material adverse effect on our financial position, operational results and cash flows.
The cost of compliance with current requirements and any future requirements of federal, state or international regulatory authorities could have a material adverse effect on our financial position, operational results and cash flows. Examples of these requirements include regulatory testing, certification, packaging, labeling, advertising and reporting requirements affecting broad categories of consumer products. In addition, any failure of one or more of our brands to comply with such requirements could result in significant penalties, require one or more of our brands to recall products and harm our reputation, any or all of which could have a material adverse effect on our business, operational results, financial position and cash flows.
Our business could suffer a material adverse effect from extreme or unseasonable weather conditions.
Extreme weather conditions in the areas in which the Company's stores are located could negatively affect the Company's business, operational results, financial position and cash flows. Frequent or unusually heavy snowfall, ice storms, rainstorms or other extreme weather conditions over an extended period could make it difficult for our customers to travel to our stores, and may cause a disruption in the shipment or receipt of our merchandise, which could negatively impact the Company's operational results. The Company's business is also susceptible to unseasonable weather conditions, which could influence customer trends, consumer traffic and shopping habits. For example, extended periods of unseasonably warm temperatures during the winter season or cool temperatures during the summer season could reduce demand and thereby would have an adverse effect on our operational results, financial position and cash flows.
Acts of terrorism, effects of war, public health, man-made and natural disasters, other catastrophes or political unrest could have a material adverse effect on our business.
The threat, or actual acts, of terrorism continue to be a significant risk to the global economy. Terrorism and potential military responses, political unrest, natural disasters, pandemics and other health issues have disrupted or could in the future disrupt commerce, impact our ability to operate our stores, offices or distribution and fulfillment centers in the affected areas or impact our ability to provide critical functions or services necessary to the operation of our business. A disruption of commerce, or an inability to recover critical functions or services from such a disruption, could interfere with the production, shipment or receipt of our merchandise in a timely manner or increase our costs to do so, which could have a material adverse impact on our operational results, financial position and cash flows. In addition, any of the above disruptions could undermine consumer confidence, which could negatively impact consumer spending or customer traffic, and thus have an adverse effect on our operational results.
20
Our ability to mitigate the adverse impact of any of the above disruptions also depends, in part, upon the effectiveness of our disaster preparedness and response planning as well as business continuity planning. However, we cannot be certain that our plans will be adequate or implemented properly in the event of an actual disaster or other catastrophic situation. In addition, although we maintain insurance coverage, there can be no assurance that our insurance coverage will be sufficient, or that insurance proceeds will be timely paid to us.
Our stock price may be volatile.
Our common stock is quoted on the NASDAQ Global Select Market. Our stock price, like that of other retail companies, is subject to significant volatility due to many factors, including, but not limited to, general economic conditions, stock and credit market conditions, our operating performance and public perception of the prospects for our brands or for the women’s or girls' apparel industries in general, quarter to quarter variations in our actual or anticipated financial results and investor sentiment. In addition, the stock market has experienced price and volume fluctuations that have affected the market price of many retail and other stocks and that have often been unrelated or disproportionate to the operating performance of these companies.
If we are unable to meet market expectations, particularly with respect to sales, operating margins, net income and earnings per share, it could result in a decline in the market value of our stock. Further, if the analysts that regularly follow the Company’s performance lower their ratings or lower their projections for future growth and financial performance, the Company’s stock price could be adversely impacted.
We may experience fluctuations in our tax obligations and effective tax rate.
We are subject to income taxes in the United States and numerous international jurisdictions. In addition, our merchandise is subject to import and excise duties and/or sales or value-added taxes in certain jurisdictions. We record tax expense based on our estimates of future tax payments, which include reserves for estimates of probable settlements of international and domestic tax audits, including uncertain tax positions. At any one time, many tax years are subject to audit by various taxing jurisdictions. The results of these audits and negotiations with taxing authorities may affect the ultimate settlement of these issues. As a result, we expect that throughout the year there could be ongoing variability in our quarterly tax rates as taxable events occur and reserves are re-evaluated. Further, our effective tax rate in a given financial statement period may be materially impacted by changes in the mix and level of earnings by taxing jurisdictions or by changes to existing tax rules or regulations or interpretations thereof.
Item 1B. Unresolved Staff Comments.
None.
Item 2. Properties.
Retail Store Space
We lease space for all our retail stores in various domestic and international locations. Store leases generally have an initial term of ten years with one or more options to extend the lease. The table below, covering all open store locations leased by us on July 30, 2016, indicates the number of leases expiring during the period indicated and the number of expiring leases with and without renewal options:
Fiscal Years | Leases Expiring | Number with Renewal Options | Number without Renewal Options | |||
2017 | 855 | 225 | 630 | |||
2018 | 879 | 488 | 391 | |||
2019 | 665 | 418 | 247 | |||
2020 | 418 | 249 | 169 | |||
2021 | 438 | 235 | 203 | |||
2022 and thereafter | 1,651 | 687 | 964 | |||
Total | 4,906 | 2,302 | 2,604 | |||
Our store leases generally provide for a base rent per square foot per annum. Certain leases have formulas requiring the payment of additional rent as a percentage of sales, generally when sales reach specified levels. Our aggregate minimum rentals under
21
operating leases in effect at July 30, 2016 and excluding locations acquired after July 30, 2016, are approximately $613.3 million for Fiscal 2017. In addition, we are typically responsible under our store leases for our pro rata share of maintenance expenses and common area charges in strip shopping centers, outlet centers and malls.
Certain of the store leases have termination clauses, providing us greater flexibility to close under-performing stores. In particular, certain leases have termination clauses during the first few years of the lease if certain specified sales volumes are not achieved. In addition, others leases provide co-tenancy requirement clauses allowing us to terminate if they are not being met.
Our investment in new stores consists primarily of inventory, leasehold improvements, fixtures and equipment, and information technology. We generally receive tenant improvement allowances from landlords to offset a portion of these initial investments in leasehold improvements.
Corporate Office Space
The Company owns both a 151,000 square foot building which serves as the corporate office for the dressbarn brand and a 51,000 square foot building adjacent to the dressbarn building which serves as the corporate office for ascena. These buildings are located in Mahwah, NJ.
The Company acquired leased corporate office facilities of approximately 308,000 square feet in New York City, NY and approximately 42,000 square feet in Milford, CT through the ANN Acquisition. The Company owns Justice’s corporate office facilities in New Albany, Ohio totaling approximately 280,000 square feet, along with 145,000 square feet in Bensalem, Pennsylvania which mainly houses the corporate offices of Catherines. The Company leases approximately 135,000 square feet in Columbus, Ohio that serves as Lane Bryant’s corporate headquarters.
During Fiscal 2016, the Company completed construction of its previously announced 200,000 square foot building located in Duluth, MN which now serves as maurices' corporate headquarters and as well as a home for a portion of the Company's shared services operations.
Internationally, the Company owns office space in Hong Kong and lease office space in Shanghai, China and Seoul, South Korea to support our sourcing operations. During Fiscal 2014, the Company purchased additional office space in Hong Kong to support our growing sourcing operations.
The Company owns a corporate office building in Etna Township, Ohio, adjacent to our distribution center, of approximately 168,000 square feet to house a portion of the Company's shared services operations.
Distribution and Fulfillment Center
The Company owns a 695,000 square foot distribution center in Etna Township, Ohio where it completed the centralization of the Company's Justice, Lane Bryant, maurices, dressbarn and Catherines ("legacy") brands' brick-and-mortar store distribution into a single location during Fiscal 2015. The Company owns a 903,000 square foot fulfillment center in Greencastle, Indiana where it completed the centralization of the distribution and fulfillment operations for the ecommerce operations of the Company's legacy brands into a single location during Fiscal 2015.
During Fiscal 2016, as a result of the ANN Acquisition, the Company acquired a 256,000 square foot distribution center in Louisville, Kentucky. The Company fully integrated ANN's ecommerce fulfillment into our Greencastle facility in August 2016 and is in the process of consolidating ANN's brick-and-mortar store distribution into our Etna facility, which is expected to be completed during Fiscal 2017.
During Fiscal 2016, the Company entered into a ten-year lease for a 583,000 square foot distribution center in Riverside, California to serve as the receiving and west coast distribution hub for the Company's merchandise sourced from Asia. The Riverside facility is expected to begin operations during Fiscal 2017.
Item 3. Legal Proceedings.
Information regarding legal proceedings is incorporated by reference from Note 14 to the accompanying consolidated financial statements.
22
PART II
Item 5. Market for Registrant’s Common Equity, Related Stockholder Matters and Issuer Purchases of Equity Securities.
Market Prices of Common Stock
The common stock of Ascena Retail Group, Inc. is quoted on the NASDAQ Global Select Market under the ticker symbol “ASNA.”
The table below sets forth the high and low prices as reported on the NASDAQ Global Select Market for the last eight fiscal quarters.
Fiscal 2016 | Fiscal 2015 | |||||||
Fiscal | High | Low | High | Low | ||||
First Quarter | $14.20 | $10.73 | $17.54 | $11.85 | ||||
Second Quarter | $13.98 | $7.56 | $13.51 | $10.52 | ||||
Third Quarter | $11.06 | $6.48 | $15.36 | $11.52 | ||||
Fourth Quarter | $9.44 | $6.59 | $17.41 | $12.56 | ||||
Number of Holders of Record
As of September 14, 2016, we had approximately 4,471 holders of record of our common stock.
Dividend Policy
We have never declared or paid cash dividends on our common stock. However, payment of dividends is within the discretion and are payable when declared by our Board of Directors. Payments of dividends are limited by our borrowing arrangements as described in Note 11 to the accompanying consolidated financial statements.
Performance Graph
The following graph illustrates, for the period from August 1, 2011 through July 30, 2016, the cumulative total shareholder return of $100 invested (assuming that all dividends, if any, were reinvested) in (1) our common stock, (2) the S&P Composite-500 Stock Index and (3) the S&P Specialty Apparel Retailers Index.
The comparisons in this table are required by the rules of the SEC and, therefore, are not intended to forecast, or be indicative of, possible future performance of our common stock.
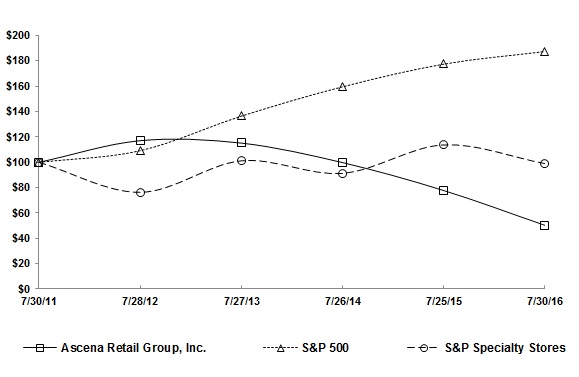
Securities Authorized for Issuance under Equity Compensation Plans
The information set forth in Item 12 of Part III of this Annual Report on Form 10-K is incorporated by reference herein.
23
Issuer Purchases of Equity Securities (a)
The following table provides information about the Company’s repurchases of common stock during the quarter ended July 30, 2016.
Period | Total Number of Shares Purchased | Average Price Paid per Share | Total Number of Shares Purchased as Part of Publicly Announced Plans or Programs(a) | Approximate Dollar Value of Shares that May Yet Be Purchased Under the Plans or Programs (a) | |||||||||
Month # 1 (April 24, 2016 – May 21, 2016) | — | $— | — | $181 million | |||||||||
Month # 2 (May 22, 2016 – June 25, 2016) | — | $— | — | $181 million | |||||||||
Month # 3 (June 26, 2016 – July 30, 2016) | — | $— | — | $181 million | |||||||||
(a) In December 2015, the Company’s Board of Directors authorized a $200 million share repurchase program (the “2016 Stock Repurchase Program”), which replaced and canceled the share repurchase program originally announced in Fiscal 2010, as amended in Fiscal 2011, which had a remaining availability of approximately $90 million. Under the 2016 Stock Repurchase Program, purchases of shares of common stock may be made at the Company’s discretion from time to time, subject to overall business and market conditions. Currently, share repurchases in excess of $100 million are subject to certain restrictions under the terms of the Company's borrowing agreements, as more fully described in Note 11 to the consolidated financial statements. Purchases will be made at prevailing market prices, through open market purchases or in privately negotiated transactions and will be subject to applicable SEC rules.
Item 6. Selected Financial Data.
This selected financial data should be read in conjunction with Item 7 — "Management's Discussion and Analysis of Financial Condition and Results of Operations" and Item 8 — "Financial Statements and Supplementary Data" included in this Annual Report on Form 10-K. Historical results may not be indicative of future results.
24
Item 7. Management’s Discussion and Analysis of Financial Condition and Results of Operations (“MD&A”).
The following discussion should be read in conjunction with our audited consolidated financial statements and related notes thereto, which are included elsewhere in this Annual Report on Form 10-K for Fiscal 2016 (“Fiscal 2016 10-K”). We utilize a 52-53 week fiscal year that ends on the last Saturday in July. As such, fiscal year 2016 ended on July 30, 2016 and reflected a 53-week period (“Fiscal 2016”); fiscal year 2015 ended on July 25, 2015 and reflected a 52-week period (“Fiscal 2015”); and fiscal year 2014 ended on July 26, 2014 and reflected a 52-week period (“Fiscal 2014”). All references to “Fiscal 2017” refer to our 52-week period that will end on July 29, 2017.
INTRODUCTION
MD&A is provided as a supplement to the accompanying consolidated financial statements and footnotes to help provide an understanding of our operational results, financial condition, liquidity and changes in financial condition. MD&A is organized as follows:
• | Overview. This section includes recent developments, our objectives and risks, and a summary of our financial performance for Fiscal 2016. In addition, this section includes a discussion of transactions affecting comparability that we believe are important in understanding our operational results and financial condition, and in anticipating future trends. |
• | Results of operations. This section provides an analysis of our operational results for Fiscal 2016, Fiscal 2015 and Fiscal 2014. |
• | Financial condition and liquidity. This section provides an analysis of our cash flows for Fiscal 2016, Fiscal 2015 and Fiscal 2014, as well as a discussion of our financial condition and liquidity as of July 30, 2016. The discussion of our financial condition and liquidity includes (i) our available financial capacity under our revolving credit agreement, (ii) a summary of our outstanding debt and commitments as of July 30, 2016, (iii) a summary of our capital spending, and (iv) a summary of our contractual and other obligations as of July 30, 2016. |
• | Market risk management. This section discusses how we manage our risk exposures related to interest rates, foreign currency exchange rates and our investments, as well as the underlying market conditions as of July 30, 2016. |
• | Critical accounting policies. This section discusses accounting policies considered to be important to our operational results and financial condition, which require significant judgment and estimation on the part of management in their application. In addition, all of our significant accounting policies, including our critical accounting policies, are summarized in Note 3 to our accompanying consolidated financial statements. |
• | Recently issued accounting pronouncements. This section discusses the potential impact to our reported operational results and financial condition of accounting standards that have been recently issued. |
OVERVIEW
Acquisition of ANN INC.
On August 21, 2015, the Company acquired 100% of the outstanding common stock of ANN INC. (the "ANN Acquisition"), a retailer of women’s apparel, shoes and accessories sold primarily under the Ann Taylor and LOFT brands, for an aggregate purchase price of approximately $2.1 billion. The purchase price consisted of approximately $1.75 billion in cash and the issuance of 31.2 million shares of the Company's common stock valued at approximately $345 million, based on the Company's stock price on the date of the acquisition, as more fully described in Note 5 to the accompanying consolidated financial statements. The cash portion of the purchase price was funded with borrowings under a $1.8 billion seven-year, variable-rate term loan described in Note 11 to the accompanying consolidated financial statements. The acquisition is intended to diversify our portfolio of brands that serve the needs of women of different ages, sizes and demographics. ANN's operating results for the post-acquisition period from August 22, 2015 to July 30, 2016 are included in the accompanying consolidated statements of operations for Fiscal 2016.
Enterprise-wide Transformation Project
In the second half of Fiscal 2016, the Company engaged a leading global professional services company to assess the Company's operations and identify and review strategic initiatives to support our long-term growth. In August 2016, we completed the initial benchmarking phase of our engagement and are in the process of selecting and planning workstreams to address opportunities
25
ASCENA RETAIL GROUP, INC.
MANAGEMENT’S DISCUSSION AND ANALYSIS OF
FINANCIAL CONDITION AND RESULTS OF OPERATIONS – (Continued)
with efficiency as well as enterprise capabilities. The operational assessment is expected to continue during the first quarter of Fiscal 2017. As a result, the Company is unable to estimate the financial impact of the project at this time.
Objectives and Initiatives
Our core strengths include a portfolio of value-oriented, lifestyle brands serving the female customer at various levels of maturity and sizes. This portfolio of brands is well-complemented by a strong and experienced management team and a disciplined investment philosophy. Despite the various risks associated with the current global economic environment as further discussed below, we believe our core strengths will allow us to continue to execute our strategy for long-term sustainable growth in revenue, net income and operating cash flow.
Over the past few years, we have identified a number of ongoing key initiatives aimed at positioning the Company for enhanced growth and value creation by increasing our profitability through comparable sales growth, gross margin rate improvement and expense rate leverage resulting from synergies achieved through integration of newly acquired businesses. We remain committed to our long-term growth initiatives and ongoing expense management discipline. While dilutive to our earnings in the short-term, we continue to expect that the investments we have completed will create long-term shareholder value.
These objectives and initiatives include, but are not limited to, the following:
Distribution and Fulfillment
As previously disclosed, our Justice, Lane Bryant, maurices, dressbarn and Catherines ("legacy") brands' distribution and fulfillment was centralized during Fiscal 2015 into our brick-and-mortar store distribution facility in Etna, Ohio and our ecommerce fulfillment facility in Greencastle, Indiana which has resulted in a reduction of our per-unit processing cost. Additionally, the Company completed the integration of ANN's ecommerce fulfillment into our Greencastle facility in August 2016 and is in the process of consolidating ANN's brick-and-mortar distribution from Louisville into our Etna facility. The Etna consolidation is expected to be completed during Fiscal 2017.
During Fiscal 2016, the Company entered into a ten-year lease for a 583,000 square foot distribution center in Riverside, California to serve as the receiving and west coast distribution hub for the Company's merchandise coming from Asia. The Riverside facility is expected to begin operations during Fiscal 2017.
We believe that the integration of ANN's distribution operations into Etna and Greencastle and the opening of the Riverside distribution center will result in a further reduction of our per-unit processing cost.
Transportation
During Fiscal 2017, with the addition of ANN, we expect to continue to realize savings associated with our shipping contracts. These savings will be enabled as a result of the centralization of our brands' distribution and fulfillment activity.
Sourcing
The Company's brands source their products through a variety of sourcing channels. Factors affecting the selection of sourcing channels include cost, speed-to-market, merchandise selection, vendor capacity and fashion trends.
We have internal sourcing operations under the name Ascena Global Sourcing ("AGS"). During Fiscal 2016, we continued our investment in personnel at AGS, and within the merchandising and design function at certain of our brands. Additionally, the Company currently sources some of its merchandise through third-party buying agents based mainly in Asia.
Non-merchandise Procurement
During Fiscal 2016, we continued our efforts to leverage our volume of non-merchandise related goods and services purchases to negotiate favorable pricing. As part of these efforts, we are consolidating suppliers of our brands across multiple areas, including information technology support contracts, facilities, marketing arrangements, and general services and suppliers, among others.
26
ASCENA RETAIL GROUP, INC.
MANAGEMENT’S DISCUSSION AND ANALYSIS OF
FINANCIAL CONDITION AND RESULTS OF OPERATIONS – (Continued)
Omni-channel Expansion
We continue to invest in our technology platforms to support the growth of our omni-channel strategy, with different brands at different stages of implementation. ANN launched the first phase of their omni-channel initiative in calendar 2012 and has added various enhancements and functionalities since then. Justice and maurices launched their new ecommerce platforms in Fiscal 2016 and we expect other brands to roll onto these platforms in Fiscal 2017. Our ecommerce platforms allow the brands to (i) enhance the customer shopping experience inside and outside our stores, (ii) integrate our marketing efforts to increase in-store and online traffic, (iii) improve product availability and fulfillment efficiency and (iv) enhance our capability to collect and analyze customer transaction data to support strategic decisions.
Seasonality of Business
Our individual segments are typically affected by seasonal sales trends primarily resulting from the timing of holiday and back-to-school shopping periods. In particular, sales at Justice tend to be significantly higher during the fall season, which occurs during the first and second quarters of our fiscal year, as this includes the back-to-school period and the December holiday season. Our Lane Bryant, dressbarn, and Catherines segments tend to experience higher sales during the spring season, which include the Easter and Mother's Day holidays. Our ANN and maurices segments have relatively balanced sales across the Fall and Spring seasons. As a result, our operational results and cash flows may fluctuate materially in any quarterly period depending on, among other things, increases or decreases in comparable store sales, adverse weather conditions, shifts in the timing of certain holidays and changes in merchandise mix.
Summary of Financial Performance
General Economic Conditions
Our performance is subject to macroeconomic conditions and their impact on levels and patterns of consumer spending. Some of the factors that could negatively impact discretionary consumer spending include general economic conditions, high unemployment, lower wage levels, reductions in net worth, higher energy and other prices, increasing interest rates and low consumer confidence. These factors above could have a negative effect on our operations, which in turn could have a material effect on our business, operational results, financial condition and cash flows.
The U.S. economy continued to show mixed signs of recovery during Fiscal 2016. Within the retail sector, consumer sentiment in certain industries such as automotive and home improvements was generally positive, while the apparel industry appeared to be more challenging and inconsistent from month-to-month and company-to-company. Uncertainty around the U.S. Presidential election and the mixed economic environment could cause inconsistent sales trends to continue through the first quarter of Fiscal 2017. Our brands will continue to monitor the respective spending patterns of their consumers and adjust their operating strategies as necessary to mitigate these challenges and maximize operating performance.
Omni-channel Strategy
As our omni-channel strategy continues to mature, it is increasingly difficult to distinguish between store sales and ecommerce sales due to the following:
• | Stores increase ecommerce sales by providing customers opportunities to view, touch and/or try on physical merchandise before ordering online; |
• | Particular colors or sizes of merchandise not available in a store can be ordered online by our store associates and shipped from our ecommerce fulfillment center or another store directly to the customer; |
• | Our websites increase store sales as in-store customers have often pre-shopped online before shopping in the store, including verification of which stores have merchandise in stock; |
• | Ecommerce sales can be returned to our stores, creating mismatches between revenues and returns between the two channels; |
• | Increased integration of brand specific merchandise planning, procurement and allocation functions serving stores and ecommerce channels together; and |
• | The Company's marketing and loyalty programs become increasingly integrated to maintain customer relationship and improve traffic and conversion rate both in-store and online. |
27
ASCENA RETAIL GROUP, INC.
MANAGEMENT’S DISCUSSION AND ANALYSIS OF
FINANCIAL CONDITION AND RESULTS OF OPERATIONS – (Continued)
We believe our ecommerce operations are interdependent with our brick-and-mortar store sales, and as a result, we only report combined comparable sales. Effective with the first quarter of Fiscal 2016, we ceased reporting store comparable sales and ecommerce sales separately.
Operating Results
Our Fiscal 2016 operating results reflected (i) ANN's operating income of $13.3 million for the post-acquisition period from August 22, 2015 to July 30, 2016, including approximately $165 million of purchase accounting adjustments; (ii) improved operating results at Justice; (iii) Acquisition and integration expenses and (iv) a challenging retail environment with inconsistent consumer spending patterns.
In order to mitigate the negative impacts on our operating performance, where possible, we continue to adjust our brands' operating strategies including implementing the omni-channel strategy, refining inventory assortment, developing our hybrid sourcing model, leveraging our economies of scale and improving supply chain efficiencies.
Operating highlights for Fiscal 2016 are as follows:
• | Net sales for Fiscal 2016 increased $2.193 billion, or 45.6%, primarily due to the effect of the ANN Acquisition. For the legacy ascena brands, net sales were down 2.9%; |
• | Comparable sales for the legacy ascena brands decreased by 5%, mainly caused by the anticipated decrease at Justice related principally to its new selling strategy. Comparable sales were down at all of our segments, with the exception of Lane Bryant which had a 1% increase in comparable sales during Fiscal 2016; |
• | Gross margin rate increased by 60 basis points to 56.2% primarily due to higher margin rates at Justice. Gross Margin was negatively impacted in Fiscal 2016 by approximately $130 million of non-cash expenses for purchase accounting adjustments; |
• | BD&O, SG&A and Depreciation and amortization expense were negatively impacted by $35 million of non-cash purchase accounting adjustments, bringing the total non-cash purchase accounting adjustments, when combined with the $130 million discussed above, to $165 million; |
• | $77.4 million of Acquisition and integration expenses for Fiscal 2016, compared to $31.7 million for Fiscal 2015; and |
• | Net loss per diluted share of $0.06 in Fiscal 2016, compared to net loss per diluted share of $1.46 for Fiscal 2015. |
Liquidity highlights are as follows:
• | We were in a net debt position (total debt less cash and cash equivalents and short-term investments) of $1.275 billion as of the end of Fiscal 2016, compared to a net cash and investments position of $147.5 million as of the end of Fiscal 2015 primarily due to the term loan debt from the ANN Acquisition and our use of cash to support our capital expenditures; |
• | Cash from operations was $445.4 million for Fiscal 2016, compared to $431.3 million for Fiscal 2015; |
• | We used $1.495 billion of cash, net of cash acquired, for the ANN Acquisition and $366.5 million for capital expenditures for Fiscal 2016, compared to $312.5 million for capital expenditures for Fiscal 2015; |
• | We used $18.6 million of available cash to purchase shares of our common stock for Fiscal 2016; |
• | We borrowed $1.8 billion during the first quarter of Fiscal 2016 to fund the ANN Acquisition. We repurchased $72.0 million of the term loan for $68.4 million, made scheduled principal payments of $9.0 million and ended the year with an outstanding term loan principal balance of $1.719 billion; and |
• | Net repayments under our revolving credit agreement totaled $116.0 million for Fiscal 2016, compared to net repayments of $56.0 million for Fiscal 2015. |
28
ASCENA RETAIL GROUP, INC.
MANAGEMENT’S DISCUSSION AND ANALYSIS OF
FINANCIAL CONDITION AND RESULTS OF OPERATIONS – (Continued)
Transactions Affecting Comparability of Results of Operations and Financial Condition
The comparability of the Company's operational results for the periods presented herein has been affected by certain transactions. A summary of the effect of these items on pretax income for each applicable period presented is noted below:
Fiscal Years Ended | |||||||||||
July 30, 2016 | July 25, 2015 | July 26, 2014 | |||||||||
(millions) | |||||||||||
Purchase accounting adjustments related to the ANN Acquisition: | |||||||||||
Non-cash inventory expense associated with the purchase accounting write-up of ANN's inventory to fair market value | $ | (126.9 | ) | $ | — | $ | — | ||||
Depreciation and amortization related to the ANN purchase accounting adjustments to property and equipment and customer relationships (a) | (30.8 | ) | — | — | |||||||
Impact of ANN purchase accounting adjustments on deferred revenue (a) | (3.2 | ) | — | — | |||||||
Impact of ANN purchase accounting adjustments for leases (a) | (4.3 | ) | — | — | |||||||
Acquisition and integration expenses (b) | (77.4 | ) | (31.7 | ) | (34.0 | ) | |||||
Gain on extinguishment of debt (see Note 11) | 0.8 | — | — | ||||||||
Impairment of Lane Bryant's goodwill and intangible assets (see Note 6) | — | (306.4 | ) | — | |||||||
Impairment of maurices' intangible assets (see Note 6) | — | — | (13.0 | ) | |||||||
Justice Pricing Lawsuits (see Note 14) | — | (50.8 | ) | — | |||||||
Accelerated depreciation associated with the Company’s supply chain and technology integration efforts and the closure of Brothers (c) (see Note 8) | — | (6.5 | ) | (8.6 | ) | ||||||
Certain costs related to the closure of Brothers (c) | — | (1.9 | ) | — | |||||||
(a) The remaining unamortized purchase accounting adjustments arising from the ANN Acquisition which will impact ANN's operating results in future periods are approximately $104 million with approximately $45 million to be recognized during Fiscal 2017.
(b) Fiscal 2016 primarily represented costs related to the acquisition and integration of ANN. Fiscal 2015 and Fiscal 2014 primarily represented costs related to the integration of the Company's supply chain and information technology platforms.
(c) Brothers was a separate boys apparel brand operating within the Justice segment and represented an immaterial portion of the Justice segment. During the third quarter of Fiscal 2015, the Company announced it was exiting the brand, which was completed by the end of Fiscal 2015.
29
ASCENA RETAIL GROUP, INC.
MANAGEMENT’S DISCUSSION AND ANALYSIS OF
FINANCIAL CONDITION AND RESULTS OF OPERATIONS – (Continued)
RESULTS OF OPERATIONS
Fiscal 2016 Compared to Fiscal 2015
The following table summarizes our operational results and expresses the percentage relationship to net sales of certain financial statement captions:
Fiscal Years Ended | |||||||||||||||
July 30, 2016 | July 25, 2015 | $ Change | % Change | ||||||||||||
(millions, except per share data) | |||||||||||||||
Net sales | $ | 6,995.4 | $ | 4,802.9 | $ | 2,192.5 | 45.6 | % | |||||||
Cost of goods sold | (3,066.7 | ) | (2,133.7 | ) | (933.0 | ) | 43.7 | % | |||||||
Cost of goods sold as % of net sales | 43.8 | % | 44.4 | % | |||||||||||
Gross margin | 3,928.7 | 2,669.2 | 1,259.5 | 47.2 | % | ||||||||||
Gross margin as % of net sales | 56.2 | % | 55.6 | % | |||||||||||
Other operating expenses: | |||||||||||||||
Buying, distribution and occupancy expenses | (1,286.5 | ) | (856.9 | ) | (429.6 | ) | 50.1 | % | |||||||
Buying, distribution and occupancy expenses as % of net sales | 18.4 | % | 17.8 | % | |||||||||||
Selling, general and administrative expenses | (2,112.3 | ) | (1,490.9 | ) | (621.4 | ) | 41.7 | % | |||||||
SG&A expenses as % of net sales | 30.2 | % | 31.0 | % | |||||||||||
Acquisition and integration expenses | (77.4 | ) | (31.7 | ) | (45.7 | ) | 144.2 | % | |||||||
Impairment of goodwill | — | (261.7 | ) | 261.7 | (100.0 | )% | |||||||||
Impairment of intangible assets | — | (44.7 | ) | 44.7 | (100.0 | )% | |||||||||
Depreciation and amortization expense | (358.7 | ) | (218.2 | ) | (140.5 | ) | 64.4 | % | |||||||
Total other operating expenses | (3,834.9 | ) | (2,904.1 | ) | (930.8 | ) | 32.1 | % | |||||||
Operating income (loss) | 93.8 | (234.9 | ) | 328.7 | (139.9 | )% | |||||||||
Operating income (loss) as % of net sales | 1.3 | % | (4.9 | )% | |||||||||||
Interest expense | (103.3 | ) | (6.0 | ) | (97.3 | ) | NM | ||||||||
Interest and other income, net | 0.4 | 0.3 | 0.1 | 33.3 | % | ||||||||||
Gain on extinguishment of debt | 0.8 | — | 0.8 | NM | |||||||||||
Loss before (provision) benefit for income taxes | (8.3 | ) | (240.6 | ) | 232.3 | (96.6 | )% | ||||||||
(Provision) benefit for income taxes | (3.6 | ) | 3.8 | (7.4 | ) | (194.7 | )% | ||||||||
Effective tax rate (a) | (43.4 | )% | 1.6 | % | |||||||||||
Net loss | $ | (11.9 | ) | $ | (236.8 | ) | $ | 224.9 | (95.0 | )% | |||||
Net loss per common share: | |||||||||||||||
Basic | $ | (0.06 | ) | $ | (1.46 | ) | $ | 1.40 | (95.9 | )% | |||||
Diluted | $ | (0.06 | ) | $ | (1.46 | ) | $ | 1.40 | (95.9 | )% | |||||
_________
(a) Effective tax rate is calculated by dividing the (provision) benefit for income taxes by the loss before the (provision) benefit for income taxes.
(NM) Not meaningful.
Net Sales. Net sales increased by $2.193 billion, or 45.6%, to $6.995 billion in Fiscal 2016 from $4.803 billion in Fiscal 2015. The increase was primarily due to the effect of the ANN Acquisition. For the legacy ascena brands, on a consolidated basis, for Fiscal 2016 compared to Fiscal 2015, comparable sales decreased by $214.0 million, or 5%, to $4.233 billion from $4.447 billion mainly as a result of anticipated sales declines at Justice principally related to its new, less promotional selling model. Non-comparable sales decreased by $0.2 million, or essentially flat, to $206.0 million from $206.2 million. Wholesale, licensing and other revenues decreased by $6.6 million, or 4%, to $143.4 million from $150.0 million. Net sales for the legacy ascena brands also included incremental revenues of approximately $82 million due to the inclusion of the 53rd week in Fiscal 2016.
30
ASCENA RETAIL GROUP, INC.
MANAGEMENT’S DISCUSSION AND ANALYSIS OF
FINANCIAL CONDITION AND RESULTS OF OPERATIONS – (Continued)
Net sales and comparable store sales data for our six business segments is presented below.
Fiscal Years Ended | |||||||||||||||
July 30, 2016 | July 25, 2015 | $ Change | % Change | ||||||||||||
(millions) | |||||||||||||||
Net sales: | |||||||||||||||
ANN | $ | 2,330.9 | $ | — | $ | 2,330.9 | NM | ||||||||
Justice | 1,106.3 | 1,276.8 | (170.5 | ) | (13.4 | )% | |||||||||
Lane Bryant | 1,130.3 | 1,095.9 | 34.4 | 3.1 | % | ||||||||||
maurices | 1,101.3 | 1,060.6 | 40.7 | 3.8 | % | ||||||||||
dressbarn | 993.3 | 1,023.6 | (30.3 | ) | (3.0 | )% | |||||||||
Catherines | 333.3 | 346.0 | (12.7 | ) | (3.7 | )% | |||||||||
Total net sales | $ | 6,995.4 | $ | 4,802.9 | $ | 2,192.5 | 45.6 | % | |||||||
Comparable sales (a)(b) | (5 | )% | |||||||||||||
_______
(a) Comparable sales represent combined store comparable sales and ecommerce sales. Store comparable sales generally refers to the growth of sales in only stores open in the current period and comparative period in the prior year (including stores relocated within the same shopping center and stores with minor square footage additions). Stores that close during the fiscal year are excluded from store comparable sales beginning with the fiscal month the store actually closes. Ecommerce sales generally refer to growth of sales from the Company's ecommerce channel. The Company believes our ecommerce operations are interdependent with our brick-and-mortar store sales and we no longer feel that separate ecommerce and brick-and-mortar sales information is meaningful. Considering our customer cross channel behaviors, we believe that reporting one comparable sales metric is a more meaningful presentation.
(b) Sales for the newly acquired ANN segment and incremental revenues of approximately $82 million due to the inclusion of the 53rd week in Fiscal 2016 are excluded from the calculation of comparable sales.
(NM) Not meaningful.
ANN net sales of $2.331 billion represented ANN's net sales for the post-acquisition period from August 22, 2015 to July 30, 2016.
Justice net sales performance primarily reflects:
• | a decrease of $150.8 million, or 13%, in comparable sales during Fiscal 2016 mainly as a result of an anticipated decrease in customer transactions, which was caused by the less promotional selling model; |
• | incremental revenues of $24.9 million due to the inclusion of the 53rd week in Fiscal 2016; |
• | a $28.8 million decrease in non-comparable stores sales, caused by 41 net store closures during Fiscal 2016; and |
• | a $15.8 million decrease in wholesale, licensing operations and other revenues. |
Lane Bryant net sales performance primarily reflects:
• | an increase of $12.7 million, or 1%, in comparable sales during Fiscal 2016; |
• | incremental revenues of $18.2 million due to the inclusion of the 53rd week in Fiscal 2016; |
• | a $2.7 million decrease in non-comparable stores sales, as the positive effect of 30 new store openings was more than offset by 23 store closings in Fiscal 2016; and |
• | a $6.2 million increase in other revenues. |
maurices net sales performance primarily reflects:
• | a decrease of $16.2 million, or 2%, in comparable sales during Fiscal 2016; |
• | incremental revenues of $18.0 million due to the inclusion of the 53rd week in Fiscal 2016; |
• | a $36.0 million increase in non-comparable stores sales, caused by 42 net store openings during Fiscal 2016; and |
31
ASCENA RETAIL GROUP, INC.
MANAGEMENT’S DISCUSSION AND ANALYSIS OF
FINANCIAL CONDITION AND RESULTS OF OPERATIONS – (Continued)
• | a $2.9 million increase in other revenues. |
dressbarn net sales performance primarily reflects:
• | a decrease of $45.5 million, or 5%, in comparable sales during Fiscal 2016; |
• | incremental revenues of $16.5 million due to the inclusion of the 53rd week in Fiscal 2016; |
• | a $0.9 million decrease in non-comparable stores sales, as the positive effect of 15 new store openings was more than offset by 30 store closings in Fiscal 2016; and |
• | a $0.4 million decrease in other revenues. |
Catherines net sales performance primarily reflects:
• | an decrease of $14.2 million, or 4%, in comparable sales during Fiscal 2016; |
• | incremental revenues of $4.8 million due to the inclusion of the 53rd week in Fiscal 2016; |
• | a $3.8 million decrease in non-comparable stores sales, caused by 4 net store closures during Fiscal 2016; and |
• | a $0.5 million increase in other revenues. |
Gross Margin, which represents the difference between net sales and cost of goods sold, expressed as a percentage of net sales, increased by 60 basis points to 56.2% in Fiscal 2016 from 55.6% in Fiscal 2015. Gross margin was negatively impacted in Fiscal 2016 by approximately $130 million of non-cash expenses for purchase accounting adjustments, primarily related to the amortization of the purchase accounting write-up of ANN's inventory to fair market value. The gross margin rate for the legacy ascena brands increased by 290 basis points from 55.6% to 58.5% primarily due to the less promotional selling model at Justice.
Gross margin as a percentage of net sales is dependent upon a variety of factors, including changes in the relative sales mix among brands, changes in the mix of products sold, the timing and level of promotional activities and fluctuations in material costs. These factors, among others, may cause cost of goods sold as a percentage of net revenues to fluctuate from year to year.
Buying, Distribution and Occupancy ("BD&O") Expenses consist of store occupancy and utility costs (excluding depreciation) and all costs associated with the buying and distribution functions.
BD&O expenses increased by $429.6 million, or 50.1%, to $1,286.5 million in Fiscal 2016 from $856.9 million in Fiscal 2015. BD&O expenses as a percentage of net sales increased by 60 basis points to 18.4% in Fiscal 2016 from 17.8% in Fiscal 2015. The increase in BD&O expenses was primarily attributable to the addition of $423.4 million related to ANN. The increase of $6.2 million from the legacy ascena brands was primarily due to increases in buying-related costs resulting from the expansion of merchandising and design functions, offset in part by synergy savings resulting from the supply chain integration of our ecommerce distribution facilities into one distribution center in Greencastle, Indiana that was completed in the third quarter of Fiscal 2015.
Selling, General and Administrative (“SG&A”) Expenses consist of compensation and benefit-related costs for sales and store operations personnel, administrative personnel and other employees not associated with the functions described above under BD&O expenses. SG&A expenses also include advertising and marketing costs, information technology and communication costs, supplies for our stores and administrative facilities, insurance costs, legal costs and costs related to other administrative services.
SG&A expenses increased by $621.4 million, or 41.7%, to $2.112 billion in Fiscal 2016 from $1.491 billion in Fiscal 2015. SG&A expenses as a percentage of net sales decreased by 80 basis points to 30.2% in Fiscal 2016 from 31.0% in Fiscal 2015. The increase in SG&A expenses was due to the addition of $634.1 million related to ANN. The decrease of $12.7 million from the legacy ascena brands was primarily due to the establishment of a legal reserve in Fiscal 2015 of approximately $51 million in connection with the Justice pricing lawsuits in Fiscal 2015 and lower store-related expenses mainly at Justice, offset in part by incremental marketing investments mainly at Lane Bryant and maurices as well as general administrative increases.
Impairment of Goodwill represents the impairment loss recognized during Fiscal 2015 to write down the carrying value of Lane Bryant's goodwill to its implied fair value, as more fully described in Note 6 to the accompanying consolidated financial statements.
32
ASCENA RETAIL GROUP, INC.
MANAGEMENT’S DISCUSSION AND ANALYSIS OF
FINANCIAL CONDITION AND RESULTS OF OPERATIONS – (Continued)
Impairment of Intangible Assets represents the impairment loss recognized to write down the carrying value of the Lane Bryant trade name to its implied fair value during Fiscal 2015, as more fully described in Note 6 to the accompanying consolidated financial statements.
Depreciation and Amortization Expense increased by $140.5 million, or 64.4%, to $358.7 million in Fiscal 2016 from $218.2 million in Fiscal 2015, with $128.0 million due to the addition of ANN. The remaining increase of $12.5 million from the legacy ascena brands primarily resulted from higher depreciation of Company-owned information technology assets placed into service during Fiscal 2015 offset in part by accelerated depreciation of $5.9 million for the store assets related to Brothers, which was completed in Fiscal 2015.
Operating Income (Loss). Operating results increased by $328.7 million, to an operating income of $93.8 million in Fiscal 2016 from an operating loss of $234.9 million in Fiscal 2015 primarily due to $306.4 million of impairment losses recognized during Fiscal 2015 at Lane Bryant to write down its goodwill and trade name to their respective fair values and the establishment of a legal reserve of approximately $51 million in connection with the Justice pricing lawsuits recognized during Fiscal 2015, offset in part by a $45.7 million increase in Acquisition and integration expenses in Fiscal 2016. The operating results also reflected operating income of $13.3 million for ANN, which included approximately $165 million of non-cash expenses for purchase accounting adjustments. These results are discussed in more detail on a brand-by-brand basis below.
Operating results for our six business segments is presented below.
Fiscal Years Ended | |||||||||||||||
July 30, 2016 | July 25, 2015 | $ Change | % Change | ||||||||||||
(millions) | |||||||||||||||
Operating income (loss): | |||||||||||||||
ANN | $ | 13.3 | $ | — | 13.3 | NM | |||||||||
Justice | 29.0 | (62.8 | ) | 91.8 | (146.2 | )% | |||||||||
Lane Bryant | 20.6 | (308.0 | ) | 328.6 | (106.7 | )% | |||||||||
maurices | 105.6 | 125.9 | (20.3 | ) | (16.1 | )% | |||||||||
dressbarn | (13.6 | ) | 10.7 | (24.3 | ) | (227.1 | )% | ||||||||
Catherines | 16.3 | 31.0 | (14.7 | ) | (47.4 | )% | |||||||||
Unallocated acquisition and integration expenses | (77.4 | ) | (31.7 | ) | (45.7 | ) | 144.2 | % | |||||||
Total operating income (loss) | $ | 93.8 | $ | (234.9 | ) | $ | 328.7 | (139.9 | )% | ||||||
_______
(NM) Not meaningful.
ANN operating income of $13.3 million is for the post-acquisition period from August 22, 2015 to July 30, 2016. The operating results for Fiscal 2016 were impacted by approximately $165 million of non-cash purchase accounting adjustments.
Justice operating results improved by $91.8 million. The operating results reflect a significant reduction in promotional activity, supported by execution of the new Justice strategy, which is based on a hybrid of everyday low price merchandise, along with full ticket fashion merchandise, supported by focused, category-level promotions. The decrease in sales for Fiscal 2016 was more than offset by an increase of approximately 980 basis points in gross margin rate resulting from an increased mix of full-ticket selling and tighter inventory management. BD&O and SG&A expenses decreased as a result of store closures related to ongoing market optimization and lower variable expenses associated with the decrease in sales volume. SG&A expenses also decreased due to the establishment of a legal reserve in Fiscal 2015 of approximately $51 million in connection with the Justice pricing lawsuits. Depreciation expense increased primarily as a result of higher allocated depreciation of Company-owned information technology assets placed into service during Fiscal 2015.
Lane Bryant operating results improved by $328.6 million primarily as a result of the $306.4 million of impairment losses recognized during Fiscal 2015 to write down the carrying values of the brand's goodwill and trade name to their fair values, as more fully described in Note 6 to the accompanying consolidated financial statements. Before the impact of the impairment charges, operating results improved by $22.2 million mainly as a result of increases in sales and improved gross margin rate related to reduced promotional selling and tighter seasonal inventory management. SG&A expenses increased primarily due to higher
33
ASCENA RETAIL GROUP, INC.
MANAGEMENT’S DISCUSSION AND ANALYSIS OF
FINANCIAL CONDITION AND RESULTS OF OPERATIONS – (Continued)
marketing expenses associated with the current year marketing campaigns, offset in part by the elimination of duplicative corporate overhead as the Company completed its migration to common information technology platforms in the first quarter of Fiscal 2016.
maurices operating income decreased by $20.3 million as increases in sales from new store growth and improved gross margin rate were more than offset by negative comparable sales, along with increases in BD&O, SG&A and depreciation expenses. The gross margin rate benefited from an increased internally-sourced product mix resulting in a higher mark-on, offset in part by higher promotional markdowns. BD&O and SG&A expenses were higher due to general administrative increases and strategic investments expected to drive future growth, including new stores and incremental marketing investments. Depreciation expense increased mainly due to higher allocated depreciation of Company-owned information technology assets placed into service during Fiscal 2015.
dressbarn operating results decreased by $24.3 million mainly as an increase in gross margin rate was more than offset by lower sales volume and an increase in SG&A expenses. The increase in gross margin rate was primarily due to a higher mark-on and lower promotional markdowns resulting from tighter inventory management and reduced promotional selling. The increase in SG&A expenses was primarily due to general administrative increases and higher store asset impairment charges resulting from lower-than-expected operating performance of certain retail locations.
Catherines operating income decreased by $14.7 million mainly due to a reduced flow-through of margin dollars on a lower sales volume. Also contributing to the decrease in operating income was an increase in SG&A expenses and an increase in allocated depreciation of Company-owned information technology assets placed into service during Fiscal 2015.
Unallocated Acquisition and Integration Expenses of $77.4 million for Fiscal 2016 primarily represents costs related to the ANN acquisition consisting of $20.8 million of legal, consulting and investment banking-related transaction costs, $17.3 million of integration costs to combine the operations and infrastructures of the ANN business into the Company's and $37.5 million of severance and retention-related expenses. The $31.7 million for Fiscal 2015 related primarily to the Company's supply chain and technology integration, which was substantially completed by the end of Fiscal 2015.
Interest Expense increased by $97.3 million to $103.3 million for Fiscal 2016 as a result of the $1.8 billion seven-year, variable-rate term loan obtained to finance the ANN Acquisition on August 21, 2015. Interest expense included the non-cash amortization of $11.3 million related to the original issue discount and debt issuance costs.
Gain on extinguishment of debt. During Fiscal 2016, the Company repurchased $72.0 million of the outstanding principal balance of the Term Loan at an aggregate cost of $68.4 million through open market transactions, resulting in a $0.8 million pre-tax gain, net of the proportional write-off of unamortized original discount and debt issuance costs of $2.8 million.
(Provision) Benefit for Income Taxes represents federal, foreign, state and local income taxes. The provision (benefit) for income taxes increased by $7.4 million, or 194.7%, to a provision of $3.6 million in Fiscal 2016 from a benefit of $3.8 million in Fiscal 2015. In Fiscal 2016, we had a pretax loss of $8.3 million, compared to a pretax loss of $240.6 million for Fiscal 2015. Our effective tax rate was negative 43.4% for Fiscal 2016. The Company recorded a tax provision in Fiscal 2016 despite the net loss for the period primarily due to state and local taxes and certain expenses which are non-deductible for income tax purposes. The 1.6% effective tax rate for Fiscal 2015 is lower than the Company's Federal statutory rate as a result of the goodwill impairment loss for Lane Bryant which was treated as a permanent non-deductible item, offset in part by an approximate $13 million tax benefit related to the retirement agreement for the former President and CEO of Justice whereby previously non-deductible permanent items for income tax purposes in previous fiscal years, became fully deductible in Fiscal 2015.
Net Loss decreased by $224.9 million, or 95.0%, to $11.9 million in Fiscal 2016 from $236.8 million in Fiscal 2015, primarily due to a higher level of operating results as previously discussed, offset in part by an increase in acquisition and integration expenses and interest expense for Fiscal 2016.
Net Loss per Diluted Common Share decreased by $1.40, or 95.9%, to $0.06 per share in Fiscal 2016 from $1.46 per share in Fiscal 2015 primarily as a result of the decrease in net loss, as previously discussed.
34
ASCENA RETAIL GROUP, INC.
MANAGEMENT’S DISCUSSION AND ANALYSIS OF
FINANCIAL CONDITION AND RESULTS OF OPERATIONS – (Continued)
Fiscal 2015 Compared to Fiscal 2014
The following table summarizes our operational results and expresses the percentage relationship to net sales of certain financial statement captions:
Fiscal Years Ended | |||||||||||||||
July 25, 2015 | July 26, 2014 | $ Change | % Change | ||||||||||||
(millions, except per share data) | |||||||||||||||
Net sales | $ | 4,802.9 | $ | 4,790.6 | $ | 12.3 | 0.3 | % | |||||||
Cost of goods sold | (2,133.7 | ) | (2,130.6 | ) | (3.1 | ) | 0.1 | % | |||||||
Cost of goods sold as % of net sales | 44.4 | % | 44.5 | % | |||||||||||
Gross margin | 2,669.2 | 2,660.0 | 9.2 | 0.3 | % | ||||||||||
Gross margin as % of net sales | 55.6 | % | 55.5 | % | |||||||||||
Other operating expenses: | |||||||||||||||
Buying, distribution and occupancy expenses | (856.9 | ) | (832.3 | ) | (24.6 | ) | 3.0 | % | |||||||
Buying, distribution and occupancy expenses as % of net sales | 17.8 | % | 17.4 | % | |||||||||||
Selling, general and administrative expenses | (1,490.9 | ) | (1,376.3 | ) | (114.6 | ) | 8.3 | % | |||||||
SG&A expenses as % of net sales | 31.0 | % | 28.7 | % | |||||||||||
Acquisition and integration expenses | (31.7 | ) | (34.0 | ) | 2.3 | (6.8 | )% | ||||||||
Impairment of goodwill | (261.7 | ) | — | (261.7 | ) | NM | |||||||||
Impairment of intangible assets | (44.7 | ) | (13.0 | ) | (31.7 | ) | 243.8 | % | |||||||
Depreciation and amortization expense | (218.2 | ) | (193.6 | ) | (24.6 | ) | 12.7 | % | |||||||
Total other operating expenses | (2,904.1 | ) | (2,449.2 | ) | (454.9 | ) | 18.6 | % | |||||||
Operating (loss) income | (234.9 | ) | 210.8 | (445.7 | ) | (211.4 | )% | ||||||||
Operating (loss) income as % of net sales | (4.9 | )% | 4.4 | % | |||||||||||
Interest expense | (6.0 | ) | (6.5 | ) | 0.5 | (7.7 | )% | ||||||||
Interest income and other income (expense), net | 0.3 | (0.8 | ) | 1.1 | (137.5 | )% | |||||||||
(Loss) income from continuing operations before benefit (provision) for income taxes | (240.6 | ) | 203.5 | (444.1 | ) | (218.2 | )% | ||||||||
Benefit (provision) for income taxes from continuing operations | 3.8 | (65.3 | ) | 69.1 | (105.8 | )% | |||||||||
Effective tax rate (a) | 1.6 | % | 32.1 | % | |||||||||||
(Loss) income from continuing operations | (236.8 | ) | 138.2 | (375.0 | ) | (271.3 | )% | ||||||||
Loss from discontinued operations, net of taxes (b) | — | (4.8 | ) | 4.8 | (100.0 | )% | |||||||||
Net (loss) income | $ | (236.8 | ) | $ | 133.4 | $ | (370.2 | ) | (277.5 | )% | |||||
Net (loss) income per common share - basic: | |||||||||||||||
Continuing operations | $ | (1.46 | ) | $ | 0.86 | $ | (2.32 | ) | (269.8 | )% | |||||
Discontinued operations | — | (0.03 | ) | 0.03 | (100.0 | )% | |||||||||
Total net (loss) income per basic common share | $ | (1.46 | ) | $ | 0.83 | $ | (2.29 | ) | (275.9 | )% | |||||
Net (loss) income per common share - diluted: | |||||||||||||||
Continuing operations | $ | (1.46 | ) | $ | 0.84 | $ | (2.30 | ) | (273.8 | )% | |||||
Discontinued operations | — | (0.03 | ) | 0.03 | (100.0 | )% | |||||||||
Total net (loss) income per diluted common share | $ | (1.46 | ) | $ | 0.81 | $ | (2.27 | ) | (280.2 | )% | |||||
_________
(a) Effective tax rate is calculated by dividing the (benefit) provision for income taxes by the (loss) income from continuing operations before the (benefit) provision for income taxes.
(b) Loss from discontinued operations is presented net of a $3.3 million income tax benefit for the year ended July 26, 2014.
(NM) Not meaningful.
35
ASCENA RETAIL GROUP, INC.
MANAGEMENT’S DISCUSSION AND ANALYSIS OF
FINANCIAL CONDITION AND RESULTS OF OPERATIONS – (Continued)
Net Sales. Net sales increased by $12.3 million, or 0.3%, to $4.803 billion in Fiscal 2015 from $4.791 billion in Fiscal 2014. On a consolidated basis, for Fiscal 2015 compared to Fiscal 2014, comparable sales decreased by $45.9 million, or 1%, to $4.325 billion from $4.371 billion; non-comparable sales increased by $61.5 million, or 23%, to $327.9 million from $266.4 million; and wholesale, licensing and other revenues decreased by $3.3 million, or 2%, to $150.0 million from $153.3 million.
Net sales and comparable store sales data for our five business segments is presented below.
Fiscal Years Ended | |||||||||||||||
July 25, 2015 | July 26, 2014 | $ Change | % Change | ||||||||||||
(millions) | |||||||||||||||
Net sales: | |||||||||||||||
Justice | $ | 1,276.8 | $ | 1,384.3 | $ | (107.5 | ) | (7.8 | )% | ||||||
Lane Bryant | 1,095.9 | 1,080.0 | 15.9 | 1.5 | % | ||||||||||
maurices | 1,060.6 | 971.4 | 89.2 | 9.2 | % | ||||||||||
dressbarn | 1,023.6 | 1,022.5 | 1.1 | 0.1 | % | ||||||||||
Catherines | 346.0 | 332.4 | 13.6 | 4.1 | % | ||||||||||
Total net sales | $ | 4,802.9 | $ | 4,790.6 | $ | 12.3 | 0.3 | % | |||||||
Comparable sales (a) | (1 | )% | |||||||||||||
_______
(a) Comparable sales represent combined store comparable sales and ecommerce sales. Store comparable sales generally refers to the growth of sales in only stores open in the current period and comparative period in the prior year (including stores relocated within the same shopping center and stores with minor square footage additions). Stores that close during the fiscal year are excluded from store comparable sales beginning with the fiscal month the store actually closes. Ecommerce sales generally refer to growth of sales from the Company's ecommerce channel. The Company believes our ecommerce operations are interdependent with our brick-and-mortar store sales and we no longer feel that separate ecommerce and brick-and-mortar sales information is meaningful. Considering our customer cross channel behaviors, we believe that reporting one comparable sales metric is a more meaningful presentation.
Justice net sales performance primarily reflects:
• | a decrease of $118.1 million, or 10%, in comparable sales during Fiscal 2015 mainly as a result of decreased store performance which was negatively impacted by reduced promotional activity; |
• | a $16.7 million increase in non-comparable stores sales, as the positive effect of 30 new store openings was offset in part by 49 store closings in Fiscal 2015; and |
• | a $6.1 million decrease in wholesale, licensing operations and other revenues. |
Lane Bryant net sales performance primarily reflects:
• | an increase of $19.7 million, or 2%, in comparable sales during Fiscal 2015; |
• | a $2.7 million decrease in non-comparable stores sales, caused by 6 net store closures during Fiscal 2015; and |
• | a $1.1 million decrease in other revenues. |
maurices net sales performance primarily reflects:
• | an increase of $49.5 million, or 5%, in comparable sales during Fiscal 2015; |
• | a $40.4 million increase in non-comparable stores sales, primarily driven by an increase related to 29 net new store openings in Fiscal 2015; and |
• | a $0.7 million decrease in other revenues. |
dressbarn net sales performance primarily reflects:
• | a decrease of $12.8 million, or 1%, in comparable sales during Fiscal 2015; |
• | an $11.3 million increase in non-comparable stores sales, caused by 4 net store openings in Fiscal 2015; and |
36
ASCENA RETAIL GROUP, INC.
MANAGEMENT’S DISCUSSION AND ANALYSIS OF
FINANCIAL CONDITION AND RESULTS OF OPERATIONS – (Continued)
• | a $2.6 million increase in other revenues. |
Catherines net sales performance primarily reflects:
• | an increase of $15.8 million, or 5%, in comparable sales during Fiscal 2015; |
• | a $4.2 million decrease in non-comparable stores sales, primarily driven by a decrease related to 9 store closings in Fiscal 2015; and |
• | a $2.0 million increase in other revenues. |
Gross Margin, which represents the difference between net sales and cost of goods sold, expressed as a percentage of net sales, was essentially flat, as higher margin rates at Lane Bryant, maurices and Catherines were offset by a lower margin rate at Justice.
Gross margin as a percentage of net sales is dependent upon a variety of factors, including changes in the relative sales mix among brands, changes in the mix of products sold, the timing and level of promotional activities and fluctuations in material costs. These factors, among others, may cause cost of goods sold as a percentage of net revenues to fluctuate from year to year.
Buying, Distribution and Occupancy ("BD&O") Expenses consist of store occupancy and utility costs (excluding depreciation) and all costs associated with the buying and distribution functions.
BD&O expenses increased by $24.6 million, or 3.0%, to $856.9 million in Fiscal 2015 from $832.3 million in Fiscal 2014. BD&O expenses as a percentage of net sales increased by 40 basis points to 17.8% in Fiscal 2015 from 17.4% in Fiscal 2014. The increase in BD&O expenses, both in dollars and as a percentage of net sales, was primarily due to increases in buying-related costs resulting from the expansion of the merchandising and design functions throughout Fiscal 2014, higher store-occupancy costs, and higher fulfillment expense supporting the double-digit increase in ecommerce sales volume. Store occupancy costs were higher due to new store growth at maurices during the past twelve months, lease renewals, property taxes and other store-related costs. These increases in BD&O expenses were offset in part by synergy savings related to the supply chain integration at Etna, Ohio and Greencastle, Indiana.
Selling, General and Administrative (“SG&A”) Expenses consist of compensation and benefit-related costs for sales and store operations personnel, administrative personnel and other employees not associated with the functions described above under BD&O expenses. SG&A expenses also include advertising and marketing costs, information technology and communication costs, supplies for our stores and administrative facilities, insurance costs, legal costs, and costs related to other administrative services.
SG&A expenses increased by $114.6 million, or 8.3%, to $1.491 billion in Fiscal 2015 from $1.376 billion in Fiscal 2014. SG&A expenses as a percentage of net sales increased by 230 basis points to 31.0% in Fiscal 2015 from 28.7% in Fiscal 2014 as the dollar increases described below had a deleveraging effect when combined with the essentially flat sales. The increase in SG&A expenses was partly due to the establishment of a legal reserve of approximately $51 million in connection with the Justice pricing lawsuits. The remainder of the increase in SG&A expenses in terms of dollars was primarily due to (i) increases in store-related payroll costs and other store expenses resulting from the new store growth, (ii) higher marketing costs related to discrete marketing campaigns, (iii) higher administrative payroll costs, (iv) higher store asset impairment charges resulting from the lower-than-expected operating performance of certain retail locations, primarily at Justice and (v) higher expenses related to the Company's information technology initiatives, including ongoing support for our new merchandising system, point of sale system and ecommerce platforms.
Impairment of Goodwill represents the impairment loss recognized during Fiscal 2015 to write down the carrying value of Lane Bryant's goodwill to its implied fair value, as more fully described in Note 6 to the accompanying consolidated financial statements.
Impairment of Intangible Assets represents the impairment loss recognized to write down the carrying value of the Lane Bryant trade name to its implied fair value during Fiscal 2015 and the impairment loss recognized to write off the entire carrying value of maurices' Studio Y trade name during Fiscal 2014, as more fully described in Note 6 to the accompanying consolidated financial statements.
Depreciation and Amortization Expense increased by $24.6 million, or 12.7%, to $218.2 million in Fiscal 2015 from $193.6 million in Fiscal 2014. The increase was due to (i) new store openings during the last twelve months, (ii) our expanded distribution and
37
ASCENA RETAIL GROUP, INC.
MANAGEMENT’S DISCUSSION AND ANALYSIS OF
FINANCIAL CONDITION AND RESULTS OF OPERATIONS – (Continued)
fulfillment centers in Ohio and Indiana being placed into service in the third quarter of Fiscal 2014, (iii) the relocation of our corporate offices to Mahwah, New Jersey in the third quarter of Fiscal 2014 and (iv) accelerated depreciation of $5.9 million for store assets related to the closure of Brothers, which was completed by the end of Fiscal 2015.
Operating (Loss) Income. Operating profit decreased by $445.7 million, to an operating loss of $234.9 million in Fiscal 2015 from operating income of $210.8 million in Fiscal 2014, primarily due to the $306.4 million of impairment losses recognized during Fiscal 2015 to write down the carrying values of Lane Bryant's goodwill and trade name to their respective fair values, the establishment of a legal reserve of approximately $51 million in connection with the Justice pricing lawsuits and a decrease in revenues and profitability at our Justice brand. These results are discussed in more detail on a brand-by-brand basis below.
Operating results for our five business segments is presented below.
Fiscal Years Ended | |||||||||||||||
July 25, 2015 | July 26, 2014 | $ Change | % Change | ||||||||||||
(millions) | |||||||||||||||
Operating (loss) income: | |||||||||||||||
Justice | $ | (62.8 | ) | $ | 99.3 | $ | (162.1 | ) | (163.2 | )% | |||||
Lane Bryant | (308.0 | ) | (4.3 | ) | (303.7 | ) | 7,062.8 | % | |||||||
maurices | 125.9 | 86.0 | 39.9 | 46.4 | % | ||||||||||
dressbarn | 10.7 | 39.4 | (28.7 | ) | (72.8 | )% | |||||||||
Catherines | 31.0 | 24.4 | 6.6 | 27.0 | % | ||||||||||
Unallocated acquisition and integration expenses | (31.7 | ) | (34.0 | ) | 2.3 | (6.8 | )% | ||||||||
Total operating (loss) income | $ | (234.9 | ) | $ | 210.8 | $ | (445.7 | ) | (211.4 | )% | |||||
Justice operating results decreased by $162.1 million as a result of a decrease in sales, a 280 basis point decline in gross margin rate and increases in BD&O, SG&A and depreciation expenses. The decrease in gross margin rate was mainly attributable to aggressive promotional activity resulting from the negative sales trend experienced during Fiscal 2015. BD&O expenses increased largely as a result of higher store occupancy costs and higher fulfillment expense related to the ecommerce sales growth. The increase in SG&A expenses was primarily attributable to the establishment of a legal reserve of approximately $51 million in connection with the Justice pricing lawsuits (see Note 14 to the accompanying consolidated financial statements) and higher store asset impairment charges resulting from the lower-than-expected operating performance of certain retail locations, offset in part by a decrease in administrative-payroll costs related to incentive compensation. Depreciation expense increased primarily as a result of higher allocated depreciation of Company-owned facilities placed into service during the third quarter of Fiscal 2014 and accelerated depreciation of $5.9 million during the second half of Fiscal 2015 related to the closure of Brothers. In the latter part of Fiscal 2015, Justice began execution of a plan to stabilize and turnaround its business. The plan focused on (i) improving inventory management, (ii) shifting its marketing strategy with the aim to reduce the number of promotional offers and (iii) refining its inventory assortment.
Lane Bryant operating loss increased by $303.7 million primarily as a result of the $306.4 million of impairment losses recognized during Fiscal 2015 to write down the carrying values of the brand's goodwill and trade name to their fair values, as more fully described in Note 6 to the accompanying consolidated financial statements. Before the impact of the impairment charges, the operating loss decreased by $2.7 million as increases in sales and gross margin rate and a decrease in BD&O expenses were offset in part by increases in SG&A and depreciation expenses.
maurices operating income increased by $39.9 million as increases in sales and gross margin rate were offset in part by increases in BD&O, SG&A and depreciation expenses. The gross margin rate benefited from lower product costs achieved through sourcing more product internally and a decrease in promotional activity resulting from the strong positive sales trend. The increase in BD&O expenses was mainly due to increases in buying-related costs resulting from the expansion of the merchandising and design functions throughout Fiscal 2014, increases in store occupancy expenses, which resulted largely from new store growth, and higher fulfillment expense supporting the increase in ecommerce sales growth. The increase in SG&A expenses was primarily due to an increase in store-related payroll and other costs resulting from the new store growth, as well as higher marketing costs related to
38
ASCENA RETAIL GROUP, INC.
MANAGEMENT’S DISCUSSION AND ANALYSIS OF
FINANCIAL CONDITION AND RESULTS OF OPERATIONS – (Continued)
increased digital marketing efforts to support the ecommerce growth. These factors were offset in part by synergy savings resulting from the integration of its ecommerce operations into the Company's distribution center in Greencastle, Indiana during the second half of Fiscal 2015. The increase in depreciation expense resulted mainly from new store growth and higher allocated depreciation of Company-owned facilities, which were placed into service during Fiscal 2014.
dressbarn operating income decreased by $28.7 million primarily as a result of increases in BD&O, SG&A and depreciation expenses. BD&O expenses increased due to the expansion of the merchandising and design functions and an increase in store occupancy costs which resulted from higher rent associated with lease renewals, new stores and higher property taxes. The increase in SG&A expenses was primarily due to higher marketing costs associated with its DRESSBAR marketing campaign during the second half of Fiscal 2015. The increase in depreciation expense resulted from higher allocated depreciation of Company-owned facilities, which were placed into service during Fiscal 2014.
Catherines operating income increased by $6.6 million as an increase in sales and gross margin rate and a decrease in BD&O expenses were offset in part by an increase in SG&A expenses. The gross margin rate increased as a result of sourcing more products internally. The decrease in BD&O expenses, both in dollars and as a percentage of net sales, resulted mainly from synergy savings from the supply chain integration. The increase in SG&A expenses was primarily due to higher marketing costs and higher expenses related to the Company's information technology initiatives.
Unallocated Acquisition and Integration Expenses of $31.7 million in Fiscal 2015 and $34.0 million in Fiscal 2014 related mainly to the Company's supply chain and technology integration efforts. During Fiscal 2015 we (i) completed the centralization of all of the legacy brands brick-and-mortar store distribution into one location in Etna, Ohio, (ii) completed the centralization of all of the legacy brands ecommerce fulfillment into one location in Greencastle, Indiana and (iii) principally completed the migration to our common information technology platforms for our legacy brands. The expenses for Fiscal 2015 also included $7.0 million of transaction costs incurred prior to the closing of the ANN Acquisition and represented legal, consulting and investment banking-related costs that were direct, incremental costs of the acquisition.
Interest Expense decreased by $0.5 million, or 7.7%, to $6.0 million for Fiscal 2015 from $6.5 million for Fiscal 2014, primarily as a result of lower average borrowings outstanding and a lower effective interest rate during Fiscal 2015.
(Benefit) Provision for Income Taxes represents federal, foreign, state and local income taxes. The provision for income taxes from continuing operations decreased by $69.1 million, or 105.8%, to a benefit of $3.8 million in Fiscal 2015 from a provision of $65.3 million in Fiscal 2014, primarily as a result of a pretax loss of $240.6 million for Fiscal 2015, compared to a pretax income of $203.5 million for Fiscal 2014. The 1.6% effective tax rate for Fiscal 2015 is lower than the Company's Federal statutory rate as a result of the goodwill impairment loss for Lane Bryant which was treated as a permanent non-deductible item, offset in part by an approximate $13 million tax benefit related to the retirement agreement for the former President and CEO of Justice whereby previously non-deductible permanent items for income tax purposes in previous fiscal years became fully deductible in Fiscal 2015. The 32.1% effective tax rate for Fiscal 2014 is lower than the Company's Federal statutory rate as a result of the Company’s indefinitely reinvested foreign earnings related to our Canadian store expansion.
Net (Loss) Income decreased by $370.2 million, or 277.5%, to a net loss of $236.8 million in Fiscal 2015 from net income of $133.4 million in Fiscal 2014, primarily due to a lower level of operating results as previously discussed, offset in part by a decrease in the provision for income taxes for Fiscal 2015.
Net (Loss) Income per Diluted Common Share decreased by $2.27, or 280.2%, to a net loss of $1.46 per share in Fiscal 2015 from net income of $0.81 per share in Fiscal 2014 primarily as a result of the decrease in net income, as previously discussed.
39
ASCENA RETAIL GROUP, INC.
MANAGEMENT’S DISCUSSION AND ANALYSIS OF
FINANCIAL CONDITION AND RESULTS OF OPERATIONS – (Continued)
FINANCIAL CONDITION AND LIQUIDITY
Financial Condition
July 30, 2016 | July 25, 2015 | $ Change | ||||||||||
(millions) | ||||||||||||
Cash and cash equivalents | $ | 371.8 | $ | 240.6 | $ | 131.2 | ||||||
Short-term investments (a) | 1.8 | 13.4 | (11.6 | ) | ||||||||
Total debt | (1,648.5 | ) | (106.5 | ) | (1,542.0 | ) | ||||||
Net (debt) cash and investments (b) | $ | (1,274.9 | ) | $ | 147.5 | $ | (1,422.4 | ) | ||||
Equity | $ | 1,863.3 | $ | 1,518.1 | $ | 345.2 | ||||||
________
(a) | Short-term investments include restricted cash of $1.8 million as of July 30, 2016 and $13.4 million as of July 25, 2015 which are included within Prepaid expenses and other current assets in the accompanying consolidated financial statements. |
(b) | “Net debt” is defined as total debt less cash and cash equivalents and short-term investments. |
The Company is in a net debt position as of July 30, 2016, as compared to a net cash and investments position as of July 25, 2015. In addition to the ANN Acquisition debt, the change from July 25, 2015 was due to our use of cash to support our capital expenditures (as discussed below under "Capital Spending”). These factors were offset in part by our cash provided by operations during Fiscal 2016. The increase in equity was primarily due to the common shares issued in connection with the ANN Acquisition.
Cash Flows
Fiscal 2016 Compared to Fiscal 2015
The table below summarizes our cash flows for the years presented as follows:
Fiscal Years Ended | ||||||||
July 30, 2016 | July 25, 2015 | |||||||
(millions) | ||||||||
Net cash provided by operating activities | $ | 445.4 | $ | 431.3 | ||||
Net cash used in investing activities | (1,835.7 | ) | (298.1 | ) | ||||
Net cash provided by (used in) financing activities | 1,521.5 | (49.5 | ) | |||||
Net increase in cash and cash equivalents | $ | 131.2 | $ | 83.7 | ||||
Net Cash Provided by Operating Activities. Net cash provided by operating activities was $445.4 million for Fiscal 2016, compared with $431.3 million during Fiscal 2015. Cash provided by operations increased during Fiscal 2016 as higher net income before non-cash expenses such as depreciation and amortization expense, goodwill and intangible asset impairment charges and the amortization of the acquisition-related inventory write-up was mostly offset by an approximately $44 million payment made to a former Justice executive, an approximately $51 million escrow payment for the proposed Justice pricing litigation settlement and the payment of approximately $95 million of employee-related obligations assumed in the ANN Acquisition.
Net Cash Used in Investing Activities. Net cash used in investing activities for Fiscal 2016 was $1.836 billion, compared with $298.1 million for Fiscal 2015. Net cash used in investing activities in Fiscal 2016 consisted primarily of $1.495 billion of cash paid in the ANN Acquisition, net of cash acquired, and $366.5 million of capital expenditures, offset in part by $25.4 million of net proceeds from the sale of investments. Net cash used in investing activities in Fiscal 2015 was $298.1 million, consisting primarily of cash used for capital expenditures of $312.5 million, partially offset by proceeds from the sale of assets of $8.9 million and net proceeds from the sale of investments of $5.5 million.
Net Cash Provided by (Used in) Financing Activities. Net cash provided by financing activities was $1.522 billion during Fiscal 2016, consisting primarily of $1.8 billion of borrowing under our new term loan, offset in part by net repayments of debt under
40
ASCENA RETAIL GROUP, INC.
MANAGEMENT’S DISCUSSION AND ANALYSIS OF
FINANCIAL CONDITION AND RESULTS OF OPERATIONS – (Continued)
our amended revolving credit agreement of $116.0 million, $77.4 million of redemptions and principal repayments of our term loan debt and $42.6 million of payments made for deferred financing costs related to the new borrowing arrangements entered into during the first quarter of Fiscal 2016. Net cash used in financing activities for Fiscal 2015 was $49.5 million, consisting primarily of $56.0 million of repayments of debt (net of borrowings) and proceeds relating to our stock-based compensation plans.
Fiscal 2015 Compared to Fiscal 2014
The table below summarizes our cash flows for the years presented as follows:
Fiscal Years Ended | ||||||||
July 25, 2015 | July 26, 2014 | |||||||
(millions) | ||||||||
Net cash provided by operating activities | $ | 431.3 | $ | 374.7 | ||||
Net cash used in investing activities | (298.1 | ) | (462.7 | ) | ||||
Net cash (used in) provided by financing activities | (49.5 | ) | 58.5 | |||||
Net increase (decrease) in cash and cash equivalents | $ | 83.7 | $ | (29.5 | ) | |||
Net Cash Provided by Operating Activities. Net cash provided by operating activities was $431.3 million for Fiscal 2015, compared with $374.7 million during Fiscal 2014. The increase was driven by lower inventory purchases in Fiscal 2015 resulting from lower planned inventory levels, lower cash payments for income taxes and cash outflows in Fiscal 2014 associated with the discontinued operations. These factors were offset in part by lower net income before non-cash expenses, such as depreciation and amortization expense, stock-based compensation expense and the goodwill and intangible asset impairment charges.
Net Cash Used in Investing Activities. Net cash used in investing activities for Fiscal 2015 was $298.1 million, compared with $462.7 million for Fiscal 2014. Net cash used in investing activities in Fiscal 2015 consisted primarily of cash used for capital expenditures of $312.5 million, offset in part by $8.9 million of proceeds from the sale of assets and net proceeds from the sale of investments of $5.5 million. Net cash used in investing activities in Fiscal 2014 was $462.7 million, consisting almost entirely of cash used for capital expenditures of $477.5 million, partially offset by proceeds from the sale of assets of $42.2 million.
Net Cash (Used in) Provided by Financing Activities. Net cash used in financing activities was $49.5 million during Fiscal 2015, consisting primarily of $56.0 million of repayments of debt (net of borrowings) and proceeds relating to our stock-based compensation plans. Net cash provided by financing activities for Fiscal 2014 was $58.5 million, consisting primarily of $36.4 million in borrowings of debt (net of repayments) and proceeds relating to our stock-based compensation plans.
Capital Spending
In Fiscal 2016, we had $366.5 million in capital expenditures, which included both routine spending in connection with ongoing investments in our retail store network, construction and renovation of our existing portfolio of retail stores as well as spending for non-routine capital investments in our technology and supply chain infrastructure and investments in corporate office facilities to support our growing operations. The most significant non-routine initiatives are described below.
During Fiscal 2016, the Company launched Justice and maurices onto their new ecommerce platforms in connection with our omni-channel initiative. The Company believes that this omni-channel initiative will enhance our customer’s shopping experience across all of the Company's various shopping channels. These initiatives will allow the brands to (i) improve website and mobile functionality, (ii) improve product availability online, (iii) offer flexible customer loyalty programs and (iv) offer an enhanced customer service experience inside and outside our stores. This phased transition of brands onto the platforms is expected to continue through Fiscal 2017.
In addition, during Fiscal 2016, the Company (i) continued integration activity related to the ANN Acquisition, such as integration of their distribution operations into our existing network, (ii) leased and began fit-out of our new Riverside distribution center, (iii) completed our new maurices headquarters in Duluth, MN and (iv) completed our migration to common information technology platforms for its Company-wide point-of-sales systems, merchandise systems, warehouse management systems and financial systems.
41
ASCENA RETAIL GROUP, INC.
MANAGEMENT’S DISCUSSION AND ANALYSIS OF
FINANCIAL CONDITION AND RESULTS OF OPERATIONS – (Continued)
The Company currently expects to begin operations at its new Riverside facility early in calendar 2017. Further, the Company expects the remaining incremental capital requirements for all of the projects discussed above to be approximately $75 million, which will be principally incurred during Fiscal 2017. Lastly, the Company expects that total capital spending for Fiscal 2017, including both routine spending and the projects discussed above, will be approximately $300 million. Our routine and non-routine capital requirements are expected to be funded primarily with available cash and cash equivalents, operating cash flows and, to the extent necessary, borrowings under the Company’s Amended Revolving Credit Agreement which is discussed below.
Liquidity
Our primary sources of liquidity are the cash flow generated from our operations, remaining availability under our Amended Revolving Credit Agreement after taking into account outstanding borrowings, letters of credit and the collateral limitation, available cash and cash equivalents and other available financing options. These sources of liquidity are used to fund our ongoing cash requirements, including working capital requirements, retail store expansion, construction and renovation of stores, any future dividend requirements, investment in technology and supply chain infrastructure, acquisitions, debt servicing requirements, stock repurchases, contingent liabilities (including uncertain tax positions) and other corporate activities. Management believes that our existing sources of liquidity will be sufficient to support our operating needs, capital requirements and any debt service requirements for the foreseeable future.
As of July 30, 2016, approximately $199 million, or 53%, of our available cash and cash equivalents was held overseas by our foreign subsidiaries. For the Company to have access to those cash and cash equivalents in the U.S, we would incur a current U.S. tax liability of between 15% to 20% of the cash repatriated. A U.S. tax liability has been previously provided for in the provision for income taxes for the portion that is not permanently reinvested as discussed in Note 13, and is currently classified within Deferred income taxes on the accompanying consolidated balance sheets. We continue to assess options for the use of our overseas cash and cash equivalents.
As of July 30, 2016, we had no borrowings outstanding under the Amended Revolving Credit Agreement. After taking into account the $25.9 million in outstanding letters of credit, the Company had $441.6 million of its availability under the Amended Revolving Credit Agreement.
Debt
In connection with the ANN Acquisition, in August 2015, the Company amended its Revolving Credit Agreement (the "Amended Revolving Credit Agreement") and entered into a $1.8 billion seven-year term loan (the "Term Loan"). For a detailed description of the terms and restrictions under the Amended Revolving Credit Agreement and the Term Loan, see Note 11 to the accompanying consolidated financial statements.
Amended Revolving Credit Agreement
We believe that our Amended Revolving Credit Agreement is adequately diversified with no undue concentrations in any one financial institution. As of July 30, 2016 there were seven financial institutions participating in the Amended Revolving Credit Facility, with no one participant maintaining a maximum commitment percentage in excess of 25%. Management has no reason at this time to believe that the participating institutions will be unable to fulfill their obligations to provide financing in accordance with the terms of the Amended Revolving Credit Agreement in the event of our election to draw funds in the foreseeable future. The Company was in compliance with all financial covenants contained in the Amended Revolving Credit Agreement as of July 30, 2016.
Term Loan
During Fiscal 2016, the Company repurchased $72.0 million of the outstanding principal balance of the Term Loan at an aggregate cost of $68.4 million through open market transactions, resulting in a $0.8 million pre-tax gain, net of the proportional write-off of unamortized original discount and debt issuance costs of $2.8 million. Such net gain has been recorded as Gain on extinguishment of debt in the consolidated statements of operations. We may from time to time seek to retire or purchase our outstanding debt
42
ASCENA RETAIL GROUP, INC.
MANAGEMENT’S DISCUSSION AND ANALYSIS OF
FINANCIAL CONDITION AND RESULTS OF OPERATIONS – (Continued)
through open market transactions, privately negotiated transactions or otherwise depending on prevailing market conditions and our liquidity requirements, subject to any restrictions under our debt arrangements, among other factors.
In addition to the repurchases discussed above, the Company made all scheduled quarterly principal payments in Fiscal 2016 totaling $9 million. Further, in August 2016, the Company repaid $100 million, which was applied to the remaining scheduled quarterly payments due in the second half of calendar 2016 and all scheduled payments for calendar 2017, such that the Company is not required to make its next quarterly scheduled payment until February 2018.
The Company expects to incur cash interest expense of approximately $85 million on the Term Loan during Fiscal 2017 based on the interest rates in effect as of July 30, 2016 and the outstanding balance after consideration of the $100 million repayment in August 2016. Such interest and principal payments are expected to be funded with our cash flows from operations.
Common Stock Repurchase Program
In December 2015, the Company’s Board of Directors authorized a $200 million share repurchase program (the “2016 Stock Repurchase Program”), which replaced and canceled any outstanding share repurchase programs. In the second quarter of Fiscal 2016, 2.1 million shares of common stock were repurchased by the Company at an aggregate cost of $18.6 million under the 2016 Stock Repurchase Program. The remaining availability under the 2016 Stock Repurchase Program was approximately $181.4 million at July 30, 2016. Under the 2016 Stock Repurchase Program, purchases of shares of common stock may be made at the Company’s discretion from time to time, subject to overall business and market conditions. Currently, share repurchases in excess of $100 million are subject to certain restrictions under the terms of the Company's borrowing agreements, as more fully described in Note 11 to the consolidated financial statements.
We may from time to time continue to repurchase additional shares depending on prevailing market conditions and our liquidity requirements, subject to any restrictions under our debt agreements, among other factors.
CONTRACTUAL AND OTHER OBLIGATIONS
Firm Commitments
The following table summarizes certain of the Company's aggregate contractual obligations as of July 30, 2016, and the estimated timing and effect that such obligations are expected to have on the Company's liquidity and cash flows in future periods. The Company expects to fund the firm commitments with operating cash flow generated in the normal course of business and, if necessary, availability under its Amended Revolving Credit Agreement.
Payments Due by Period | ||||||||||||||||||||
Contractual Obligations | Fiscal 2017 | Fiscal 2018- 2019 | Fiscal 2020- 2021 | Fiscal 2022 and Thereafter | Total | |||||||||||||||
(millions) | ||||||||||||||||||||
Long-term debt | $ | 54.0 | $ | 180.0 | $ | 180.0 | $ | 1,305.0 | $ | 1,719.0 | ||||||||||
Interest payments on long-term debt | 89.2 | 165.0 | 146.1 | 70.9 | 471.2 | |||||||||||||||
Operating leases | 613.3 | 979.2 | 712.8 | 745.8 | 3,051.1 | |||||||||||||||
Inventory purchase commitments | 932.3 | — | — | — | 932.3 | |||||||||||||||
Other commitments | 49.5 | 29.9 | 22.4 | — | 101.8 | |||||||||||||||
Total | $ | 1,738.3 | $ | 1,354.1 | $ | 1,061.3 | $ | 2,121.7 | $ | 6,275.4 | ||||||||||
The following is a description of the Company's material, firmly committed contractual obligations as of July 30, 2016:
• | Long-term debt represents mandatory repayments of outstanding borrowings under our borrowing agreements as of July 30, 2016. In August 2016, the Company repaid $100 million, which was applied to the remaining mandatory quarterly repayments due in the second half of calendar 2016 and all required repayments for calendar 2017, such that the Company is not required to make its next quarterly repayment until calendar 2018. The table above does not reflect the effect of the $100 million payment. |
43
ASCENA RETAIL GROUP, INC.
MANAGEMENT’S DISCUSSION AND ANALYSIS OF
FINANCIAL CONDITION AND RESULTS OF OPERATIONS – (Continued)
• | Interest payments on long-term debt represent interest payments related to our borrowing agreements. Interest payments on our Amended Revolving Credit Agreement, if any, were calculated based on the outstanding balance and the interest rates in effect as of July 30, 2016, as if the borrowings remain outstanding until mandatory repayment is required at expiration in August 2020. Interest payments on our Term Loan were calculated based on the interest rates in effect as of July 30, 2016 and the estimated outstanding balance, giving effect to the contractual repayments in future periods. In addition, such amounts do not reflect the August 2016 principal repayment of $100 million discussed above; |
• | Operating lease obligations represent the estimated minimum lease rental payments for the Company's real estate and operating equipment in various locations around the world and do not include incremental rentals based on a percentage of sales. Although such amounts are generally non-cancelable, certain leases are cancelable if specified sales levels are not achieved or co-tenancy requirements are not being satisfied. All future minimum rentals under these cancelable leases have been included in the above table. In addition to such amounts, the Company is normally required to pay taxes, insurance and occupancy costs relating to its leased real estate properties, which are not included in the table above; and |
• | Inventory purchase commitments represent the Company's agreements to purchase fixed or minimum quantities of goods at determinable prices. While a portion of these commitments may be canceled at the Company's option up to 30 days prior to the vendor’s scheduled shipment date, such commitments are generally not canceled and are included in the table above. |
• | Other commitments represent contractual payments primarily related to information technology services. While these commitments may be canceled at the Company's option for a termination fee, such commitments are generally not canceled and are included in the table above. |
Excluded from the above contractual obligations table is the non-current liability for unrecognized tax benefits of $56.8 million as of July 30, 2016. This liability for unrecognized tax benefits has been excluded from the above table because the Company cannot make a reliable estimate of the period in which the liability will be settled, if ever.
The above table also excludes the following: (i) non-debt related amounts included in current liabilities in the consolidated balance sheet as of July 30, 2016, as these items will be paid within one year; and (ii) non-current liabilities that have no cash outflows associated with them (e.g., deferred revenue) or the cash outflows associated with them are uncertain or do not represent a "purchase obligation" as the term is used herein (e.g., deferred taxes and other miscellaneous items).
The Company also has certain contractual arrangements that would require it to make payments if certain circumstances occur. See Notes 14 and 17 to the accompanying consolidated financial statements for a description of the Company's contingent commitments not included in the above table, including obligations under employment agreements.
Off-Balance Sheet Arrangements
The Company's off-balance sheet firm commitments, which include outstanding letters of credit amounted to approximately $25.9 million as of July 30, 2016. The Company does not maintain any other off-balance sheet arrangements, transactions, obligations or other relationships with unconsolidated entities that would be expected to have a material current or future effect on its operational results, financial condition and cash flows.
MARKET RISK MANAGEMENT
The Company is exposed to a variety of market-based risks, representing our potential exposure to losses arising from adverse changes in market rates and prices. These market risks include, but are not limited to, changes in foreign currency exchange rates relating to our Canadian operations, changes in interest rates, and changes in both the value and liquidity of our cash and cash equivalents. Consequently, in the normal course of business, we employ a number of established policies and procedures to manage such risks, including considering, at times, the use of derivative financial instruments to hedge such risks. However, as a matter of policy, we do not enter into derivative financial instruments for speculative or trading purposes. As of the end of Fiscal 2016, the Company did not have any outstanding derivative financial instruments.
44
ASCENA RETAIL GROUP, INC.
MANAGEMENT’S DISCUSSION AND ANALYSIS OF
FINANCIAL CONDITION AND RESULTS OF OPERATIONS – (Continued)
Foreign Currency Risk Management
We currently do not have any significant risks to the fluctuation of foreign currency exchange rates. Purchases of inventory for resale in our retail stores and ecommerce operations normally are transacted in U.S. dollars. In addition, our 100% owned international retail operations represent approximately 1% of our consolidated revenues for Fiscal 2016. In the future, if our international operations continue to expand, we may consider the use of forward foreign currency exchange contracts to manage any significant risks to changes in foreign currency exchange rates.
Interest Rate Risk Management
As of July 30, 2016, our Company had $1.719 billion in variable-rate debt outstanding under our borrowing agreements. Accordingly, we remain subject to changes in interest rates. For each 0.125% increase or decrease in interest rates, the Company’s interest expense would increase or decrease by approximately $2.1 million, and net income would decrease or increase, respectively, by approximately $1.3 million. See Note 11 to our consolidated financial statements for a summary of the terms and conditions of our borrowing agreements.
Investment Risk Management
As of July 30, 2016, our Company had cash and cash equivalents of $371.8 million. The Company's short-term investments of $1.8 million included restricted cash.
We maintain cash deposits and cash equivalents with well-known and stable financial institutions; however, there were significant amounts of cash and cash equivalents on deposit at overseas financial institutions as well as FDIC-insured financial institutions that were in excess of FDIC-insured limits at the end of Fiscal 2016. This represents a concentration of credit risk. While there have been no losses recorded on deposits of cash and cash equivalents to date, we cannot be assured we will not experience losses on our deposits in the future.
CRITICAL ACCOUNTING POLICIES
The SEC's Financial Reporting Release No. 60, "Cautionary Advice Regarding Disclosure About Critical Accounting Policies" ("FRR 60"), suggests companies provide additional disclosure and commentary on those accounting policies considered most critical. FRR 60 considers an accounting policy to be critical if it is important to the Company's operational results and financial position and requires significant judgment and estimates on the part of management in its application. The Company's estimates are often based on complex judgments, probabilities and assumptions that management believes to be reasonable, but that are inherently uncertain and unpredictable. It is also possible that other professionals, applying reasonable judgment to the same facts and circumstances, could develop and support a range of alternative estimated amounts. The Company believes that the following list represents its critical accounting policies as contemplated by FRR 60. For a discussion of all of the Company's significant accounting policies, see Notes 3 and 4 to the accompanying consolidated financial statements.
Inventories
Retail Inventory Method
We hold inventory for sale through our retail stores and ecommerce sites. All of the Company's segments, other than ANN discussed below, use the retail method of accounting, under which inventory is stated at the lower of cost, on a First In, First Out (“FIFO”) basis, or market. Under the retail inventory method, the valuation of inventory at cost and the resulting gross margin are calculated by applying a calculated cost to retail ratio to the retail value of inventory. Inherent in the retail method are certain significant management judgments and estimates including, among others, initial merchandise markup, markdowns and shrinkage, which significantly impact the ending inventory valuation at cost as well as the resulting gross margins.
The Company continuously reviews its inventory levels to identify slow-moving merchandise and markdowns necessary to clear slow-moving merchandise, which reduces the cost of inventories to its estimated net realizable value. Consideration is given to a number of quantitative and qualitative factors, including current pricing levels and the anticipated need for subsequent markdowns, aging of inventories, historical sales trends, and the impact of market trends and economic conditions. Estimates of markdown
45
ASCENA RETAIL GROUP, INC.
MANAGEMENT’S DISCUSSION AND ANALYSIS OF
FINANCIAL CONDITION AND RESULTS OF OPERATIONS – (Continued)
requirements may differ from actual results due to changes in quantity, quality and mix of products in inventory, as well as changes in consumer preferences, market and economic conditions. The Company’s historical estimates of these costs and its markdown provisions have not differed materially from actual results.
Reserves for inventory shrinkage, representing the risk of physical loss of inventory, are estimated based on historical experience and are adjusted based upon physical inventory counts.
Weighted-average Cost Method
The ANN segment uses the weighted-average cost method to value inventory, under which inventory is valued at the lower of average cost or market, at the individual item level. Inventory cost is adjusted when the current selling price or future estimated selling price is less than cost.
Reserves for inventory shrinkage, representing the risk of physical loss of inventory, are estimated based on historical experience and are adjusted based upon physical inventory counts.
Impairment of Goodwill and Other Intangible Assets
Goodwill and certain other intangible assets deemed to have indefinite useful lives are not amortized. Rather, goodwill and such indefinite-lived intangible assets are assessed for impairment at least annually based on comparisons of their respective fair values to their carrying values.
Goodwill impairment is determined using a two-step process. The first step of the goodwill impairment test is to identify potential impairment by comparing the fair value of a reporting unit with its net book value (or carrying amount), including goodwill as described in Note 3 to the accompanying consolidated financial statements.
Determining the fair value of a reporting unit under the first step of the goodwill impairment test and determining the fair value of individual assets and liabilities of a reporting unit (including unrecognized intangible assets) under the second step of the goodwill impairment test is judgmental in nature and often involves the use of significant estimates and assumptions. Similarly, estimates and assumptions are used in determining the fair value of other intangible assets. These estimates and assumptions could have a significant impact on whether or not an impairment charge is recognized and the magnitude of any such charge. To assist management in the process of determining goodwill impairment, the Company reviews and considers appraisals from independent valuation firms. Estimates of fair value are primarily determined using discounted cash flows, market comparisons and recent transactions. These approaches use significant estimates and assumptions, including projected future cash flows (including timing), discount rates reflecting the risks inherent in future cash flows, perpetual growth rates and determination of appropriate market comparables.
The impairment test for other indefinite-lived intangible assets consists of a comparison of the fair value of the intangible asset with its carrying value. The fair value of indefinite-lived intangible assets is primarily determined using the relief-from-royalty approach. Estimating the fair value is judgmental in nature, and often involves the use of significant estimates and assumptions, which could have a significant impact on whether or not an impairment charge is recognized and the magnitude of any such charge.
Fiscal 2016 Annual Impairment Assessment
During the fourth quarter of Fiscal 2016, the Company performed its annual impairment assessment (the "Fiscal 2016 Valuation"). While the fair values of Justice, maurices and Catherines were all significantly in excess of their respective book values, the fair value of the Company's Lane Bryant and ANN reporting units exceeded their book value by less than 20% and are discussed in more detail below.
Lane Bryant
For Lane Bryant, the Fiscal 2016 Valuation indicated that its fair value exceeded its carrying value by approximately 16%.
46
ASCENA RETAIL GROUP, INC.
MANAGEMENT’S DISCUSSION AND ANALYSIS OF
FINANCIAL CONDITION AND RESULTS OF OPERATIONS – (Continued)
Significant assumptions underlying the discounted cash flows included: a weighted average cost of capital ("WACC") rate of 12.0% which was determined from relevant market comparisons and adjusted for specific risks; operating income margin of mid-to-high single digits and a terminal growth rate of 2%. Material changes in these assumptions could have a significant impact on the valuation model. As an example, the impact of a hypothetical change in each of the significant assumptions is described below. In quantifying the impact, we changed only the specific assumption and held all other assumptions constant. A hypothetical 1% change in WACC rate would increase/decrease the fair value by approximately $60 million. A hypothetical 1% change in the operating income percentages in all periods would increase/decrease the fair value by approximately $75 million. Finally, a hypothetical 1% change in the terminal growth rate would increase/decrease the fair value by approximately $40 million.
Additionally, if we experience sustained periods of unexpected changes in consumer spending, it could adversely impact the long-term revenue assumptions used in our Fiscal 2016 Valuation. Such trends may have a negative impact on some of the other key assumptions used in the Fiscal 2016 Valuation, including anticipated gross margin and operating income margin as well as the WACC rate. These assumptions are highly judgmental and subject to change. Such changes, if material, may require us to incur impairment charges for goodwill and/or other indefinite-lived intangible assets in future periods.
ANN
For the newly acquired ANN business, the Fiscal 2016 Valuation indicated that its fair value exceeded its carrying value by approximately 12%.
Significant assumptions underlying the discounted cash flows included: a WACC rate of 11.5% which was determined from relevant market comparisons and adjusted for specific risks; operating income margin of mid-to-high single digits and a terminal growth rate of 2%. Material changes in these assumptions could have a significant impact on the valuation model. As an example, the impact of a hypothetical change in each of the significant assumptions is described below. In quantifying the impact, we changed only the specific assumption and held all other assumptions constant. A hypothetical 1% change in WACC rate would increase/decrease the fair value by approximately $160 million. A hypothetical 1% change in the operating income percentages in all periods would increase/decrease the fair value by approximately $175 million. Finally, a hypothetical 1% change in the terminal growth rate would increase/decrease the fair value by approximately $100 million.
Additionally, if we experience sustained periods of unexpected changes in consumer spending or are unable to realize the significant amount of synergies expected from the acquisition, it could adversely impact the long-term assumptions used in our Fiscal 2016 Valuation. Such trends may have a negative impact on some of the other key assumptions used in the Fiscal 2016 Valuation, including anticipated gross margin and operating income margin as well as the WACC rate. These assumptions are highly judgmental and subject to change. Such changes, if material, may require us to incur impairment charges for goodwill and/or other indefinite-lived intangible assets in future periods.
Impairment of Long-Lived Assets
Property and equipment, along with other long-lived assets, are evaluated for impairment periodically whenever events or changes in circumstances indicate that their related carrying amounts may not be recoverable. In evaluating long-lived assets, including finite-lived intangible assets, for recoverability, we use our best estimate of future cash flows expected to result from the use of the asset and its eventual disposition. To the extent that estimated future undiscounted net cash flows attributable to the asset are less than the carrying amount, an impairment loss is recognized equal to the difference between the carrying value of such asset and its fair value, considering external market participant assumptions. Assets to be disposed of, and for which there is a committed plan of disposal, are reported at the lower of carrying value or fair value less costs to sell.
In determining future cash flows, the Company takes various factors into account, including changes in merchandising strategy, the emphasis on retail store cost controls, the effects of macroeconomic trends such as consumer spending, and the impacts of more experienced retail store managers and increased local advertising. Since the determination of future cash flows is an estimate of future performance, there may be future impairments in the event that future cash flows do not meet expectations.
During Fiscal 2016, Fiscal 2015 and Fiscal 2014, the Company recorded non-cash impairment charges of $13.3 million, $10.8 million and $4.2 million, respectively, to reduce the net carrying value of certain long-lived tangible assets to their estimated fair
47
ASCENA RETAIL GROUP, INC.
MANAGEMENT’S DISCUSSION AND ANALYSIS OF
FINANCIAL CONDITION AND RESULTS OF OPERATIONS – (Continued)
value. There have been no impairment losses recorded on the Company’s finite-lived intangible assets for any of the periods presented. See Note 8 to the accompanying consolidated financial statements for further discussion.
Insurance Reserves
For a complete discussion of the Company's underlying assumptions and judgments for insurance reserves, see Note 3 to the accompanying consolidated financial statements.
Stock Options
Stock options are granted to certain of its employees and non-employee directors with exercise prices equal to the fair market value at the date of grant. The Company uses the Black-Scholes option-pricing model to estimate the fair value of stock options granted, which requires the input of subjective assumptions. The key factors influencing the estimation process include the expected term of the option, the expected stock price volatility factor, the expected forfeiture rate, the expected dividend yield and risk-free interest rate, among others. Generally, once stock option values are determined, current accounting practices do not permit them to be changed, even if the estimates used are different from the actuals. Determining the fair value of stock-based compensation at the date of grant requires significant judgment by management, including estimates of the above Black-Scholes assumptions. In addition, judgment is required in estimating the number of stock-based awards that are expected to be forfeited. If actual results differ significantly from these estimates, if management changes its assumptions for future stock-based award grants, or if there are changes in market conditions, stock-based compensation expense and the Company's operational results could be materially impacted.
Cash Long-Term Incentive Plans
The Company maintains a long-term cash incentive program ("Cash LTIP") which entitles the holder to a cash payment equal to a target amount earned at the end of a performance period and is subject to (a) the grantee’s continuing employment and (b) the Company’s achievement of certain performance goals over a one, two or three-year performance period. Compensation expense for the Cash LTIP is recognized over the related performance periods based on the expected achievement of the performance goals, which involves judgment on the part of management.
Income Taxes
For a complete discussion of the Company's underlying assumptions and judgments for income taxes, see Notes 3 and 13 to the accompanying consolidated financial statements.
Contingencies
The Company is, from time to time, involved in routine litigation incidental to the conduct of our business, including litigation instituted by persons injured upon premises under our control; litigation regarding the merchandise that we sell, including our advertising and marketing practices and product and safety concerns; litigation with respect to various employment matters, including wage and hour litigation; litigation with present or former employees; and litigation regarding intellectual property rights. Although such litigation is routine and incidental to the conduct of our business, as with any business of our size which has a significant number of employees and sells a significant amount of merchandise, such litigation could result in large monetary awards. We record a liability for such contingencies to the extent that we conclude their occurrence is probable and the related losses are estimable. In addition, if it is reasonably possible that an unfavorable settlement of a contingency could materially exceed the established liability, we disclose the estimated impact on our operational results, financial condition and cash flows. Management considers many factors in making these assessments. As the ultimate resolution of contingencies is inherently unpredictable, these assessments can involve a series of complex judgments about future events including, but not limited to, court rulings, negotiations between affected parties and governmental actions. As a result, the accounting for loss contingencies relies heavily on estimates and assumptions.
48
RECENTLY ISSUED ACCOUNTING PRONOUNCEMENTS
See Note 4 to the accompanying consolidated financial statements for a description of certain recently issued or proposed accounting standards which may impact our financial statements in future reporting periods.
Item 7A. Quantitative and Qualitative Disclosures about Market Risk.
For a discussion of our exposure to, and management of our market risks, see “Market Risk Management” in Item 7 included elsewhere in this Annual Report on Form 10-K.
Item 8. Financial Statements and Supplementary Data.
The Consolidated Financial Statements of Ascena Retail Group, Inc. and subsidiaries are filed together with this report: See “Exhibits, Financial Statement Schedules,” Item 15.
Item 9. Changes in and Disagreements with Accountants on Accounting and Financial Disclosure.
None.
Item 9A. Controls and Procedures.
(a) Evaluation of Disclosure Controls and Procedures.
The Company maintains disclosure controls and procedures that are designed to provide reasonable assurance that information required to be disclosed in the reports that the Company files or submits under the Securities and Exchange Act of 1934, as amended (the “Exchange Act”) is recorded, processed, summarized and reported within the time periods specified in the SEC’s rules and forms, and that such information is accumulated and communicated to the Company’s management, including its Chief Executive Officer and Chief Financial Officer, as appropriate, to allow timely decisions regarding required disclosures.
The Company carried out an evaluation, under the supervision and with the participation of its management, including its Chief Executive Officer and Chief Financial Officer, of the effectiveness of the design and operation of the Company’s disclosure controls and procedures pursuant to Rules 13(a)-15(e) and 15(d)-15(e) of the Exchange Act. Based on that evaluation, the Chief Executive Officer and Chief Financial Officer concluded that the Company’s disclosure controls and procedures are effective at the reasonable assurance level as of the fiscal year end covered by this Annual Report on Form 10-K.
(b) Management’s Assessment of Internal Control over Financial Reporting.
Management is responsible for establishing and maintaining adequate internal control over financial reporting, as defined in Exchange Act Rule 13a-15(f). Internal control over financial reporting is designed to provide reasonable assurance regarding the reliability of financial reporting and preparation of financial statements for external purposes in accordance with U.S. Generally Accepted Accounting Principles. Internal control over financial reporting includes maintaining records that in reasonable detail accurately and fairly reflect our transactions; providing reasonable assurance that transactions are recorded as necessary for preparation of our financial statements; providing reasonable assurance that receipts and expenditures of the Company's assets are made in accordance with management authorization; and providing reasonable assurance that unauthorized acquisition, use or disposition of the Company's assets that could have a material effect on our financial statements would be prevented or detected on a timely basis. Because of its inherent limitations, internal control over financial reporting is not intended to provide absolute assurance that a misstatement of our financial statements would be prevented or detected. Further, the evaluation of the effectiveness of internal control over financial reporting was made as of a specific date, and continued effectiveness in future periods is subject to the risks that controls may become inadequate because of changes in conditions or that the degree of compliance with the policies and procedures may decline.
Under the supervision and with the participation of our management, including our Chief Executive Officer and Chief Financial Officer, the Company conducted an evaluation of the effectiveness of our internal control over financial reporting as of the end of the fiscal year covered by this report based on the framework issued by the Committee of Sponsoring Organizations of the Treadway Commission ("COSO") in Internal Control-Integrated Framework (2013). Based on this evaluation, management concluded that the Company's internal control over financial reporting were effective at the reasonable assurance level as of the fiscal year end covered by this Annual Report on Form 10-K.
49
Deloitte & Touche LLP, the Company's independent registered public accounting firm, has issued an attestation report on the Company's internal control over financial reporting. The report is included elsewhere herein.
(c) Changes in Internal Control Over Financial Reporting.
There has been no change in the Company’s internal control over financial reporting during the fiscal quarter ended July 30, 2016 that has materially affected, or is reasonably likely to materially affect, the Company’s internal control over financial reporting.
Item 9B. Other Information.
None.
PART III
Item 10. Directors, Executive Officers and Corporate Governance.
Information with respect to this item is incorporated by reference from our definitive Proxy Statement to be filed with the SEC within 120 days after the end of our fiscal year. We have adopted a Code of Ethics for the Chief Executive Officer and Senior Financial Officers. The Code of Ethics for the Chief Executive Officer and Senior Financial Officers is posted on our website, www.ascenaretail.com, then “For Investors,” then under the Investors Relations pull-down menu, click on "Corporate Governance," then click the link for the “Code of Ethics for Senior Financial Officers.” We intend to satisfy the disclosure requirement regarding any amendment to, or a waiver of, a provision of the Code of Ethics by posting such information on our website. We undertake to provide to any person a copy of this Code of Ethics upon request to our Secretary at our principal executive offices, 933 MacArthur Boulevard, Mahwah, NJ 07430.
Item 11. Executive Compensation.
Information with respect to this item is incorporated by reference from our definitive Proxy Statement to be filed with the SEC within 120 days after the end of our fiscal year.
Item 12. Security Ownership of Certain Beneficial Owners and Management and Related Stockholder Matters.
Securities Authorized for Issuance under Equity Compensation Plans
The following table summarizes our equity compensation plans as of July 30, 2016 regarding compensation plans under which the Company’s equity securities are authorized for issuance:
(a) | (b) | (c) | ||||||||
Plan Category | Number of Securities to be Issued upon Exercise of Outstanding Options | Weighted-Average Exercise Price of Outstanding Options | Number of Securities Remaining Available for Future Issuance Under Equity Compensation Plans (Excluding Securities Reflected in Column(a)) | |||||||
Equity compensation plans approved by security holders | 14,813,432 | $ | 14.33 | 23,621,126 | ||||||
Equity compensation plans not approved by security holders | — | — | — | |||||||
Total | 14,813,432 | $ | 14.33 | 23,621,126 | ||||||
_______
(a) In November 2015, the Board of Directors approved the amendment and restatement of the Company’s 2010 Stock Incentive Plan, as amended in December 2012 (the "2010 Stock Incentive Plan"). The amended and restated 2010 Stock Incentive Plan (the “2016 Omnibus Incentive Plan”) was approved by the Company’s shareholders and became effective on December 10, 2015. All of the securities remaining available for future issuance set forth in column (c) may be in the form of options, restricted stock, restricted stock units, performance awards or other stock-based awards under the Company’s 2016 Omnibus Incentive Plan.
Other Information with respect to security ownership of certain beneficial owners and management is incorporated by reference from our definitive Proxy Statement to be filed with the SEC within 120 days after the end of our fiscal year.
50
Item 13. Certain Relationships and Related Transactions, and Director Independence.
Information with respect to this item is incorporated by reference from our definitive Proxy Statement to be filed with the SEC within 120 days after the end of our fiscal year.
Item 14. Principal Accounting Fees and Services.
Information with respect to this item is incorporated by reference from our definitive Proxy Statement to be filed with the SEC within 120 days after the end of our fiscal year.
PART IV
Item 15. Exhibits, Financial Statement Schedules
(a)1., 2. Financial Statements and Financial Statement Schedules, see index on page F-1.
51
ITEM 15. (b) LIST OF EXHIBITS
The following exhibits are filed as part of this Report and except Exhibits 21, 23, 31.1, 31.2, 32.1 and 32.2 are all incorporated by reference from the sources shown.
Exhibit Number | Description | |
2.1 | Agreement and Plan of Merger, dated as of May 1, 2012, among the Company, Colombia Acquisition Corp. and Charming Shoppes, Inc. is incorporated by reference to Exhibit 2.1 to the Form 8-K filed on May 2, 2012. | |
2.2 | Agreement and Plan of Merger, dated as of May 17, 2015, among the Company, Avian Acquisition Corp. and ANN INC., is incorporated by reference to Exhibit 2.1 to the Form 8-K filed on May 18, 2015. | |
3(i).1 | Second Amended and Restated Certificate of Incorporation of Ascena Retail Group, Inc. is incorporated by reference to Annex II to the Proxy Statement dated November 18, 2010. | |
3(i).2 | Certificate of Amendment of Second Amended and Restated Certificate of Incorporation of Ascena Retail Group, Inc. is incorporated by reference to Exhibit 3.1 to the Form 8-K filed on January 3, 2011. | |
3(ii).1 | By-Laws of Ascena Retail Group, Inc., as amended and restated, are incorporated by reference to Exhibit 3.1 to the Form 8-K filed on March 6, 2015. | |
3(ii).2 | Amendment to Amended and Restated By-Laws of Ascena Retail Group, Inc., adopted November 2, 2015, is incorporated by reference to Exhibit 3.1 to the Form 8-K filed on November 3, 2015. | |
10.1 | 2016 Omnibus Incentive Plan is incorporated by reference to Annex A to the Proxy Statement dated November 3, 2015.* | |
10.2 | Amended and Restated Executive 162(m) Bonus Plan, effective as of December 12, 2013, is incorporated by reference to Annex A to the Proxy Statement dated November 5, 2013.* | |
10.3 | Employment Agreement dated May 2, 2002 with Elliot S. Jaffe is incorporated by reference to Exhibit 10(u)(u) to the Form 10-K filed for the fiscal year ended July 27, 2002.* | |
10.4 | Amendment dated July 10, 2006 to Employment Agreement dated May 2, 2002 with Elliot S. Jaffe is incorporated by reference to Exhibit 99.1 to the Form 8-K filed on July 13, 2006.* | |
10.5 | Employment Agreement dated March 5, 2014 with David Jaffe is incorporated by reference to Exhibit 10.1 to the Form 8-K filed on March 6, 2014.* | |
10.6 | Employment Letter dated January 23, 2015 with John Pershing is incorporated by reference to Exhibit 10.6 to the Form 10-K filed for the fiscal year ended July 25, 2015.* | |
10.7 | Employment Letter dated July 20, 2015 with Robb Giammatteo is incorporated by reference to Exhibit 10.7 to the Form 10-K filed for the fiscal year ended July 25, 2015.* | |
10.8 | Employment Letter dated July 26, 2005 with Gene Wexler is incorporated by reference to Exhibit 10.25 to the Form 10-K filed for the fiscal year ended July 30, 2005.* | |
10.9 | Supplemental Retirement Benefit Agreement dated August 29, 2006 with Mrs. Roslyn Jaffe is incorporated by reference to Exhibit 99.1 to the Form 8-K filed on August 30, 2006.* | |
10.10 | Amendment and Restatement of the Company's Executive Severance Plan effective as of December 9, 2015, is incorporated by reference to Exhibit 10.1 to the Form 8-K filed on December 11, 2015.* | |
10.11 | Form of Indemnification Agreement, adopted January 1, 2011, for Members of the Board of Directors and certain executive officers is incorporated by reference to Exhibit 10.24 to the Form 10-K filed for the fiscal year ended July 30, 2011.* | |
10.12 | Amendment and Restatement Agreement dated as of July 24, 2015 and effective as of August 21, 2015, among the Company, the Borrowing Subsidiaries, the Loan Parties, the Lenders and JPMorgan Chase Bank, N.A., as Administrative Agent, is incorporated by reference to Exhibit 10.1 to the Form 8-K filed on August 27, 2015. | |
52
Exhibit Number | Description | |
10.13 | Term Credit Agreement dated as of August 21, 2015 among the Company, AnnTaylor Retail, Inc., the Lenders and Goldman Sachs Bank USA, as Administrative Agent, is incorporated by reference to Exhibit 10.2 to the Form 8-K filed on August 27, 2015. | |
10.14 | Employment Letter dated December 4, 2015 with Duane D. Holloway, filed herewith as Exhibit 10.14.* | |
14 | Code of Ethics for the Chief Executive Officer and Senior Financial Officers is incorporated by reference to Exhibit 14 to the Form 10-K filed for the fiscal year ended July 26, 2003. | |
21 | Subsidiaries of the Registrant, filed herewith. | |
23 | Consent of Independent Registered Public Accounting Firm, filed herewith. | |
31.1 | Section 302 Certification of President and Chief Executive Officer, filed herewith. | |
31.2 | Section 302 Certification of Chief Financial Officer, filed herewith. | |
32.1 | Section 906 Certification of President and Chief Executive Officer, filed herewith.** | |
32.2 | Section 906 Certification of Chief Financial Officer, filed herewith.** | |
101.INS | XBRL Instance Document† | |
101.SCH | XBRL Taxonomy Extension Schema Document† | |
101.CAL | XBRL Taxonomy Extension Calculation Linkbase Document† | |
101.DEF | XBRL Taxonomy Extension Definition Linkbase Document† | |
101.LAB | XBRL Taxonomy Extension Label Linkbase Document† | |
101.PRE | XBRL Taxonomy Extension Presentation Linkbase Document† | |
*Each of these exhibits constitutes a management contract, compensatory plan or arrangement required to be filed as an exhibit pursuant to Item 15 (b) of this report.
**This certification accompanies each report pursuant to Section 906 of the Sarbanes-Oxley Act of 2002 and shall not, except to the extent required by the Sarbanes-Oxley Act of 2002, be deemed filed by the Company for purposes of Section 18 of the Securities Exchange Act of 1934, as amended.
†Pursuant to Rule 402 of Regulation S-T, the Interactive Data Files on Exhibit 101 hereto are deemed not filed or part of a registration statement or prospectus for purposes of Section 11 of the Securities Act of 1933, as amended, are deemed not filed for purposes of Section 18 of the Securities and Exchange Act of 1934, as amended, and otherwise are not subject to liability under those sections.
ITEM 15. (c) FINANCIAL STATEMENT SCHEDULES
None.
53
SIGNATURES
Pursuant to the requirements of Section 13 or 15(d) of the Securities Act of 1934, the registrant has duly caused this report to be signed on its behalf by the undersigned, thereunto duly authorized.
Ascena Retail Group, Inc. | |||
Date: September 19, 2016 | by | /s/ DAVID JAFFE | |
David Jaffe | |||
President and Chief Executive Officer | |||
Pursuant to the requirements of the Securities Exchange Act of 1934, this report has been signed below by the following persons on behalf of the registrant and in the capacities and on the dates indicated.
Signature | Title | Date | ||
/s/ ELLIOT S. JAFFE | ||||
Elliot S. Jaffe | Non-Executive Chairman of the Board and Founder | September 19, 2016 | ||
/s/ DAVID JAFFE | ||||
David Jaffe | Director, President and Chief Executive Officer (Principal Executive Officer) | September 19, 2016 | ||
/s/ KATIE J. BAYNE | ||||
Katie J. Bayne | Director | September 19, 2016 | ||
/s/ KATE BUGGELN | ||||
Kate Buggeln | Director | September 19, 2016 | ||
/s/ STEVEN L. KIRSHENBAUM | ||||
Steven L. Kirshenbaum | Director | September 19, 2016 | ||
/s/ KATHERINE L. KRILL | ||||
Katherine L. Krill | Director | September 19, 2016 | ||
/s/ RANDY L. PEARCE | ||||
Randy L. Pearce | Director | September 19, 2016 | ||
/s/ CARL S. RUBIN | ||||
Carl S. Rubin | Director | September 19, 2016 | ||
/s/ ROBB GIAMMATTEO | ||||
Robb Giammatteo | Executive Vice President and Chief Financial Officer (Principal Financial Officer) | September 19, 2016 | ||
/s/ ERNEST LAPORTE | ||||
Ernest LaPorte | Senior Vice President and Chief Accounting Officer (Principal Accounting Officer) | September 19, 2016 | ||
54
ASCENA RETAIL GROUP, INC.
INDEX TO CONSOLIDATED FINANCIAL STATEMENTS AND SUPPLEMENTARY INFORMATION
Page | |
Consolidated Financial Statements: | |
Consolidated Balance Sheets | F-2 |
Consolidated Statements of Operations | F-3 |
Consolidated Statements of Comprehensive (Loss) Income | F-4 |
Consolidated Statements of Cash Flows | F-5 |
Consolidated Statements of Equity | F-6 |
Notes to Consolidated Financial Statements | F-7 |
Reports of Independent Registered Public Accounting Firm | F-41 |
Supplementary Information: | |
Quarterly Financial Information (Unaudited) | F-43 |
Selected Financial Information | F-44 |
All schedules are omitted because either they are not applicable or the required information is shown in the consolidated financial statements or notes thereto.
F-1
ASCENA RETAIL GROUP, INC.
CONSOLIDATED BALANCE SHEETS
July 30, 2016 | July 25, 2015 | |||||||
(millions, except per share data) | ||||||||
ASSETS | ||||||||
Current assets: | ||||||||
Cash and cash equivalents | $ | 371.8 | $ | 240.6 | ||||
Inventories | 649.3 | 489.3 | ||||||
Deferred tax assets | — | 88.5 | ||||||
Prepaid expenses and other current assets | 218.9 | 131.5 | ||||||
Total current assets | 1,240.0 | 949.9 | ||||||
Property and equipment, net | 1,630.1 | 1,170.0 | ||||||
Goodwill | 1,279.3 | 319.7 | ||||||
Other intangible assets, net | 1,268.7 | 388.3 | ||||||
Other assets | 88.2 | 78.3 | ||||||
Total assets | $ | 5,506.3 | $ | 2,906.2 | ||||
LIABILITIES AND EQUITY | ||||||||
Current liabilities: | ||||||||
Accounts payable | $ | 429.4 | $ | 238.8 | ||||
Accrued expenses and other current liabilities | 413.7 | 403.2 | ||||||
Deferred income | 110.0 | 64.1 | ||||||
Income taxes payable | 6.6 | 11.6 | ||||||
Current portion of long-term debt | 54.0 | — | ||||||
Total current liabilities | 1,013.7 | 717.7 | ||||||
Long-term debt | 1,594.5 | 106.5 | ||||||
Lease-related liabilities | 387.1 | 241.4 | ||||||
Deferred income taxes | 442.2 | 181.8 | ||||||
Other non-current liabilities | 205.5 | 140.7 | ||||||
Total liabilities | 3,643.0 | 1,388.1 | ||||||
Commitments and contingencies (Note 14) | ||||||||
Equity: | ||||||||
Common stock, par value $0.01 per share; 194.2 and 163.2 million shares issued and outstanding | 1.9 | 1.6 | ||||||
Additional paid-in capital | 1,050.3 | 669.8 | ||||||
Retained earnings | 828.8 | 859.3 | ||||||
Accumulated other comprehensive loss | (17.7 | ) | (12.6 | ) | ||||
Total equity | 1,863.3 | 1,518.1 | ||||||
Total liabilities and equity | $ | 5,506.3 | $ | 2,906.2 | ||||
See accompanying notes.
F-2
ASCENA RETAIL GROUP, INC.
CONSOLIDATED STATEMENTS OF OPERATIONS
Fiscal Years Ended | ||||||||||||
July 30, 2016 | July 25, 2015 | July 26, 2014 | ||||||||||
(millions, except per share data) | ||||||||||||
Net sales | $ | 6,995.4 | $ | 4,802.9 | $ | 4,790.6 | ||||||
Cost of goods sold | (3,066.7 | ) | (2,133.7 | ) | (2,130.6 | ) | ||||||
Gross margin | 3,928.7 | 2,669.2 | 2,660.0 | |||||||||
Other operating expenses: | ||||||||||||
Buying, distribution and occupancy expenses | (1,286.5 | ) | (856.9 | ) | (832.3 | ) | ||||||
Selling, general and administrative expenses | (2,112.3 | ) | (1,490.9 | ) | (1,376.3 | ) | ||||||
Acquisition and integration expenses | (77.4 | ) | (31.7 | ) | (34.0 | ) | ||||||
Impairment of goodwill | — | (261.7 | ) | — | ||||||||
Impairment of intangible assets | — | (44.7 | ) | (13.0 | ) | |||||||
Depreciation and amortization expense | (358.7 | ) | (218.2 | ) | (193.6 | ) | ||||||
Total other operating expenses | (3,834.9 | ) | (2,904.1 | ) | (2,449.2 | ) | ||||||
Operating income (loss) | 93.8 | (234.9 | ) | 210.8 | ||||||||
Interest expense | (103.3 | ) | (6.0 | ) | (6.5 | ) | ||||||
Interest income and other income (expense), net | 0.4 | 0.3 | (0.8 | ) | ||||||||
Gain on extinguishment of debt | 0.8 | — | — | |||||||||
(Loss) income from continuing operations before (provision) benefit for income taxes | (8.3 | ) | (240.6 | ) | 203.5 | |||||||
(Provision) benefit for income taxes from continuing operations | (3.6 | ) | 3.8 | (65.3 | ) | |||||||
(Loss) income from continuing operations | (11.9 | ) | (236.8 | ) | 138.2 | |||||||
Loss from discontinued operations, net of taxes (a) | — | — | (4.8 | ) | ||||||||
Net (loss) income | $ | (11.9 | ) | $ | (236.8 | ) | $ | 133.4 | ||||
Net (loss) income per common share - basic: | ||||||||||||
Continuing operations | $ | (0.06 | ) | $ | (1.46 | ) | $ | 0.86 | ||||
Discontinued operations | — | — | (0.03 | ) | ||||||||
Total net (loss) income per basic common share | $ | (0.06 | ) | $ | (1.46 | ) | $ | 0.83 | ||||
Net (loss) income per common share – diluted: | ||||||||||||
Continuing operations | $ | (0.06 | ) | $ | (1.46 | ) | $ | 0.84 | ||||
Discontinued operations | — | — | (0.03 | ) | ||||||||
Total net (loss) income per diluted common share | $ | (0.06 | ) | $ | (1.46 | ) | $ | 0.81 | ||||
Weighted average common shares outstanding: | ||||||||||||
Basic | 192.2 | 162.6 | 160.6 | |||||||||
Diluted | 192.2 | 162.6 | 165.1 | |||||||||
_______
(a) Loss from discontinued operations is presented net of a $3.3 million income tax benefit for the year ended July 26, 2014.
See accompanying notes.
F-3
ASCENA RETAIL GROUP, INC.
CONSOLIDATED STATEMENTS OF COMPREHENSIVE (LOSS) INCOME
Fiscal Years Ended | |||||||||||
July 30, 2016 | July 25, 2015 | July 26, 2014 | |||||||||
(millions) | |||||||||||
Net (loss) income | $ | (11.9 | ) | $ | (236.8 | ) | $ | 133.4 | |||
Other comprehensive loss, net of tax: | |||||||||||
Net actuarial loss on a defined benefit pension plan, net of income tax benefit of $2.5 million | (3.8 | ) | — | — | |||||||
Foreign currency translation adjustment (a) | (1.3 | ) | (10.4 | ) | (1.0 | ) | |||||
Total other comprehensive loss | (5.1 | ) | (10.4 | ) | (1.0 | ) | |||||
Total comprehensive (loss) income | $ | (17.0 | ) | $ | (247.2 | ) | $ | 132.4 | |||
_______
(a) No tax benefits have been provided in any period primarily due to the Company's indefinite reinvestment assertion for foreign earnings.
See accompanying notes.
F-4
ASCENA RETAIL GROUP, INC.
CONSOLIDATED STATEMENTS OF CASH FLOWS
Fiscal Years Ended | |||||||||||
July 30, 2016 | July 25, 2015 | July 26, 2014 | |||||||||
(millions) | |||||||||||
Cash flows from operating activities: | |||||||||||
Net (loss) income | $ | (11.9 | ) | $ | (236.8 | ) | $ | 133.4 | |||
Adjustments to reconcile net (loss) income to net cash provided by operating activities: | |||||||||||
Depreciation and amortization expense | 358.7 | 218.2 | 193.6 | ||||||||
Deferred income tax benefit | (26.8 | ) | (6.6 | ) | (17.8 | ) | |||||
Deferred rent and other occupancy costs | (74.4 | ) | (39.1 | ) | (38.2 | ) | |||||
Gain on extinguishment of debt | (0.8 | ) | — | — | |||||||
Gain on sale of assets | — | (1.6 | ) | — | |||||||
Amortization of acquisition-related inventory write-up | 126.9 | — | — | ||||||||
Non-cash stock-based compensation expense | 26.2 | 18.2 | 30.6 | ||||||||
Non-cash impairment of tangible assets | 13.3 | 10.8 | 4.2 | ||||||||
Non-cash impairment of goodwill | — | 261.7 | — | ||||||||
Non-cash impairment of intangible assets | — | 44.7 | 13.0 | ||||||||
Non-cash interest expense, net | 11.3 | 0.9 | 1.3 | ||||||||
Other non-cash income, net | (0.9 | ) | (2.4 | ) | (2.7 | ) | |||||
Excess tax benefits from stock-based compensation | (1.5 | ) | — | (4.2 | ) | ||||||
Changes in operating assets and liabilities: | |||||||||||
Inventories | 111.4 | 63.9 | (12.3 | ) | |||||||
Accounts payable, accrued liabilities and income tax liabilities | (133.6 | ) | 54.2 | 32.8 | |||||||
Deferred income | 7.8 | 7.7 | 10.0 | ||||||||
Lease-related liabilities | 52.5 | 32.6 | 46.2 | ||||||||
Other balance sheet changes, net | (12.8 | ) | 4.9 | 5.0 | |||||||
Changes in net assets related to discontinued operations | — | — | (20.2 | ) | |||||||
Net cash provided by operating activities | 445.4 | 431.3 | 374.7 | ||||||||
Cash flows from investing activities: | |||||||||||
Cash paid for the acquisition of ANN INC., net of cash acquired (Note 5) | (1,494.6 | ) | — | — | |||||||
Capital expenditures | (366.5 | ) | (312.5 | ) | (477.5 | ) | |||||
Proceeds from the sale of assets | — | 8.9 | 42.2 | ||||||||
Purchases of investments | (1.1 | ) | (22.3 | ) | (27.5 | ) | |||||
Proceeds from sales and maturities of investments | 26.5 | 27.8 | 0.1 | ||||||||
Net cash used in investing activities | (1,835.7 | ) | (298.1 | ) | (462.7 | ) | |||||
Cash flows from financing activities: | |||||||||||
Proceeds from term loan, net of original issue discount | 1,764.0 | — | — | ||||||||
Redemptions and principal repayments of term loan | (77.4 | ) | — | — | |||||||
Proceeds from revolver borrowings | 1,510.5 | 832.3 | 1,249.2 | ||||||||
Repayments of revolver borrowings | (1,626.5 | ) | (888.3 | ) | (1,212.8 | ) | |||||
Payment of deferred financing costs | (42.6 | ) | (2.2 | ) | — | ||||||
Purchases and retirements of common stock | (18.6 | ) | — | — | |||||||
Proceeds from stock options exercised and employee stock purchases | 10.6 | 8.7 | 17.9 | ||||||||
Excess tax benefits from stock-based compensation | 1.5 | — | 4.2 | ||||||||
Net cash provided by (used in) financing activities | 1,521.5 | (49.5 | ) | 58.5 | |||||||
Net increase (decrease) in cash and cash equivalents | 131.2 | 83.7 | (29.5 | ) | |||||||
Cash and cash equivalents at beginning of period | 240.6 | 156.9 | 186.4 | ||||||||
Cash and cash equivalents at end of period | $ | 371.8 | $ | 240.6 | $ | 156.9 | |||||
See accompanying notes.
F-5
ASCENA RETAIL GROUP, INC.
CONSOLIDATED STATEMENTS OF EQUITY
Common Stock | Additional Paid-In Capital | Retained Earnings | AOCI | Total Equity | ||||||||||||||||||
Shares | Amount | |||||||||||||||||||||
(millions) | ||||||||||||||||||||||
Balance, July 27, 2013 | 159.5 | $ | 1.6 | $ | 592.8 | $ | 963.2 | $ | (1.2 | ) | $ | 1,556.4 | ||||||||||
Net income | — | — | — | 133.4 | — | 133.4 | ||||||||||||||||
Total other comprehensive loss | — | — | — | — | (1.0 | ) | (1.0 | ) | ||||||||||||||
Shares issued and equity grants made pursuant to stock-based compensation plans | 2.3 | — | 49.4 | — | — | 49.4 | ||||||||||||||||
Other | — | — | — | (0.5 | ) | — | (0.5 | ) | ||||||||||||||
Balance, July 26, 2014 | 161.8 | $ | 1.6 | $ | 642.2 | $ | 1,096.1 | $ | (2.2 | ) | $ | 1,737.7 | ||||||||||
Net loss | — | — | — | (236.8 | ) | — | (236.8 | ) | ||||||||||||||
Total other comprehensive loss | — | — | — | — | (10.4 | ) | (10.4 | ) | ||||||||||||||
Shares issued and equity grants made pursuant to stock-based compensation plans | 1.4 | — | 27.6 | — | — | 27.6 | ||||||||||||||||
Balance, July 25, 2015 | 163.2 | $ | 1.6 | $ | 669.8 | $ | 859.3 | $ | (12.6 | ) | $ | 1,518.1 | ||||||||||
Net loss | — | — | — | (11.9 | ) | — | (11.9 | ) | ||||||||||||||
Common stock issued in connection with the acquisition of ANN INC. (Note 5) | 31.2 | 0.3 | 344.6 | — | — | 344.9 | ||||||||||||||||
Total other comprehensive loss | — | — | — | — | (5.1 | ) | (5.1 | ) | ||||||||||||||
Shares issued and equity grants made pursuant to stock-based compensation plans | 1.9 | — | 35.9 | — | — | 35.9 | ||||||||||||||||
Purchases and retirements of common stock | (2.1 | ) | — | — | (18.6 | ) | (18.6 | ) | ||||||||||||||
Balance, July 30, 2016 | 194.2 | $ | 1.9 | $ | 1,050.3 | $ | 828.8 | $ | (17.7 | ) | $ | 1,863.3 | ||||||||||
See accompanying notes.
F-6
ASCENA RETAIL GROUP, INC.
NOTES TO CONSOLIDATED FINANCIAL STATEMENTS
1. Description of Business
ascena retail group, inc., a Delaware corporation (“ascena” or the “Company”), is a leading national specialty retailer of apparel for women and tween girls. On August 21, 2015, the Company acquired ANN INC. ("ANN"), a retailer of women’s apparel, shoes and accessories sold primarily under the Ann Taylor and LOFT brands (the "ANN Acquisition"). The Company operates, through its 100% owned subsidiaries, ecommerce operations and approximately 4,900 stores throughout the United States, Canada and Puerto Rico. The Company had annual revenues for the fiscal year ended July 30, 2016 of approximately $7.0 billion. The Company and its subsidiaries are collectively referred to herein as the “Company,” “ascena,” “we,” “us,” “our” and “ourselves,” unless the context indicates otherwise.
The Company had the following reportable segments and store counts as of July 30, 2016: ANN 1,022 stores; Justice 937 stores; Lane Bryant 772 stores; maurices 993 stores; dressbarn 809 stores; and Catherines 373 stores.
All of our segments sell fashion merchandise to the women's and girls' apparel market across a wide range of ages, sizes and demographics. Our ANN segment offers modern feminine classics and versatile fashion choices, sold primarily under the Ann Taylor and LOFT brands. Our Justice segment offers fashionable apparel in an environment designed to match the energetic lifestyle of tween girls. Our Lane Bryant segment offers fashionable and sophisticated plus-size apparel, including its exclusive intimates label, Cacique. Our maurices segment offers up-to-date fashion including core and plus-size offerings, with stores concentrated in small markets (approximately 25,000 to 150,000 people). Our dressbarn segment offers moderate-to-better quality career, special occasion and casual fashion for working women. Finally, our Catherines segment offers classic apparel and accessories for wear-to-work and casual lifestyles in a full range of plus sizes.
2. Basis of Presentation
Basis of Consolidation
The consolidated financial statements are prepared in accordance with accounting principles generally accepted in the United States of America (“U.S. GAAP”), and present the financial position, operational results, comprehensive (loss) income and cash flows of the Company and its 100% owned subsidiaries. All significant intercompany balances and transactions have been eliminated in consolidation.
Use of Estimates
The preparation of financial statements in conformity with U.S. GAAP requires management to make estimates and assumptions that affect the amounts reported in the financial statements and footnotes thereto. Actual results could differ materially from those estimates.
Significant estimates inherent in the preparation of the consolidated financial statements include: the determination of the fair values of assets acquired and liabilities assumed in a business combination; the realizability of inventory; reserves for litigation and other contingencies; useful lives and impairments of long-lived tangible assets; evaluation of goodwill and other intangible assets for impairment; accounting for income taxes and related uncertain tax positions; the valuation of stock-based compensation and related expected forfeiture rates; and the self-insured insurance reserves.
Fiscal Year
The Company utilizes a 52-53 week fiscal year ending on the last Saturday in July. As such, fiscal year 2016 ended on July 30, 2016 and reflected a 53-week period (“Fiscal 2016"); fiscal year 2015 ended on July 25, 2015 and reflected a 52-week period (“Fiscal 2015"); and fiscal year 2014 ended on July 26, 2014 and reflected a 52-week period (“Fiscal 2014”). The results of the Company's newly acquired ANN segment for the post-acquisition period from August 22, 2015 to July 30, 2016 have been included in the Company's consolidated statements of operations for Fiscal 2016. All references to “Fiscal 2017” refer to our 52-week period that will end on July 29, 2017.
F-7
ASCENA RETAIL GROUP, INC.
NOTES TO CONSOLIDATED FINANCIAL STATEMENTS - (Continued)
Discontinued Operations
On June 14, 2012, the Company acquired the Figi’s business in connection with the acquisition of the Lane Bryant and Catherines businesses. Contemporaneously with the acquisition of these businesses, the Company announced its intent to sell the acquired Figi’s business. The sale of Figi’s closed during the first quarter of Fiscal 2014 and resulted in pretax charges of $4.6 million to reflect transaction costs and the adjustment of certain liabilities which existed at the date it was sold as well as the operating results for the Figi’s business (including $7.4 million of revenues for the first quarter of Fiscal 2014). These charges have been classified as components of discontinued operations in the accompanying consolidated statements of operations.
3. Summary of Significant Accounting Policies
Revenue Recognition
Revenue is recognized when there is persuasive evidence of an arrangement, delivery has occurred, price has been fixed or is determinable and collectability is reasonably assured.
Retail store revenue is recognized net of estimated returns at the time of sale to consumers. Ecommerce revenue from sales of products ordered through the Company’s retail Internet sites and revenue from direct-mail orders are recognized upon delivery and receipt of the shipment by our customers. Such revenue also is reduced by an estimate of returns.
Reserves for estimated product returns are recorded based on historical return trends and are adjusted for known events, as applicable. Reserves for estimated product returns were $17.3 million and $9.2 million as of the end of Fiscal 2016 and Fiscal 2015, respectively.
Gift cards, gift certificates and merchandise credits (collectively, “gift cards”) issued by the Company are recorded as a deferred income liability until they are redeemed, at which point revenue is recognized. Gift cards do not have expiration dates. The Company recognizes income for unredeemed gift cards when the likelihood of a gift card being redeemed by a customer is remote and the Company determines that it does not have a legal obligation to remit the value of the unredeemed gift card to the relevant jurisdiction as unclaimed or abandoned property. Gift card breakage is recognized in Net sales over time based on the historical redemption patterns and historically has not been material.
Revenue associated with merchandise shipments to other third-party retailers is recognized at the time title passes and risk of loss is transferred to customers, which generally occurs at the date of shipment.
In addition to retail-store, ecommerce and third party sales, the Company's segments recognize revenue from (i) licensing arrangements with franchised stores, (ii) royalty payments received under license agreements for the use of their trade name and (iii) advertising and marketing arrangements with partner companies as they are earned in accordance with the terms of the underlying agreements.
The Company accounts for sales and other related taxes on a net basis, thereby excluding such taxes from revenue.
Cost of Goods Sold
Cost of goods sold (“COGS”) consists of all costs of merchandise (net of purchase discounts and vendor allowances), merchandise acquisition costs (primarily commissions and import fees) and freight to our distribution centers and stores. These costs are determined to be directly or indirectly incurred in bringing an article to its existing condition and location. Additionally, the direct costs associated with shipping goods to customers and adjustments to the carrying value of inventory related to realizability and shrinkage are recorded as components of COGS.
Our COGS and Gross margin may not be comparable to those of other entities. Some entities, like us, exclude costs related to their distribution network, buying function, store occupancy costs and depreciation and amortization expenses from COGS and include them in other operating expenses, whereas other entities include these costs in their COGS.
F-8
ASCENA RETAIL GROUP, INC.
NOTES TO CONSOLIDATED FINANCIAL STATEMENTS - (Continued)
Buying, Distribution and Occupancy Expenses
Buying, distribution and occupancy expenses ("BD&O expenses") consist of store occupancy and utility costs (excluding depreciation), fulfillment expense (as defined below) and all costs associated with the buying and distribution functions.
Selling, General and Administrative Expenses
Selling, general and administrative expenses (“SG&A expenses”) consist of compensation and benefit-related costs for sales and store operations personnel, administrative personnel and other employees not associated with the functions described above under BD&O expenses. SG&A expenses also include advertising and marketing costs, information technology and communication costs, supplies for our stores and administrative facilities, insurance costs, legal costs and costs related to other administrative services.
Acquisition and Integration Expenses
Acquisition and integration expenses consist of transaction expenses representing legal, consulting and investment banking-related costs that are direct, incremental costs incurred prior to the closing of an acquisition, costs to integrate the operations of newly acquired businesses into the Company's existing infrastructure and severance and retention-related expenses from integrating newly acquired businesses.
Shipping and Fulfillment
Shipping and fulfillment fees billed to customers are recorded as revenue. The direct costs associated with shipping goods to customers are recorded as a component of COGS. Costs associated with preparing the merchandise for shipping, such as picking, packing, warehousing and order charges ("fulfillment expense") are recorded as a component of BD&O expenses. Fulfillment expense was approximately $50.5 million in Fiscal 2016, $37.8 million in Fiscal 2015 and $38.0 million in Fiscal 2014.
Marketing and Advertising Costs
Marketing and advertising costs are included in SG&A expenses. Marketing and advertising costs are expensed when the advertisement is first exhibited. Marketing and advertising expenses were $270.6 million for Fiscal 2016, $176.7 million for Fiscal 2015 and $160.1 million for Fiscal 2014. Deferred marketing and advertising costs, which principally relate to advertisements that have not yet been exhibited or services that have not yet been received, were not material at the end of either Fiscal 2016 or Fiscal 2015.
Foreign Currency Translation and Transactions
The operating results and financial position of foreign operations are consolidated using the local currency as the functional currency. Local currency assets and liabilities are translated at the rates of exchange on the balance sheet date, and local currency revenues and expenses are translated at average rates of exchange during the period. The resulting translation gains or losses are included in the consolidated statements of comprehensive (loss) income, and in the consolidated statements of equity as a component of accumulated other comprehensive (loss) income (“AOCI”). Gains and losses on the translation of intercompany loans made to foreign subsidiaries that are of a long-term investment nature also are included within AOCI.
The Company recognizes gains and losses on transactions that are denominated in a currency other than the respective entity's functional currency. Foreign currency transaction gains and losses also result from intercompany loans made to foreign subsidiaries that are not of a long-term investment nature and include amounts realized on the settlement of certain intercompany loans with foreign subsidiaries. Net losses from foreign currency transactions amounted to $1.5 million in Fiscal 2016, $0.9 million in Fiscal 2015 and $1.6 million in Fiscal 2014. Such amounts are recognized in earnings and included as part of Interest income and other income (expense), net in the accompanying consolidated statements of operations.
Stock-Based Compensation
The Company expenses stock-based compensation to employees and non-employee directors based on the grant date fair value of the awards over the requisite service period, adjusted for estimated forfeitures. The Company uses the Black-Scholes valuation method to determine the grant date fair value of its option-based compensation. Shares of restricted stock and restricted stock units are issuable with service-based, market-based or performance-based conditions (collectively, “Restricted Equity Awards”).
F-9
ASCENA RETAIL GROUP, INC.
NOTES TO CONSOLIDATED FINANCIAL STATEMENTS - (Continued)
Compensation expense for Restricted Equity Awards is recognized over the vesting period based on the grant-date fair values of the awards that are expected to vest based upon the service, market and performance-based conditions.
Cash Long-Term Incentive Plans
The Company maintains a long-term cash incentive program ("Cash LTIP") which entitles the holder to a cash payment equal to a target amount earned at the end of a performance period and is subject to (a) the grantee’s continuing employment and (b) the Company’s achievement of certain performance goals over a one, two or three-year performance period. Compensation expense for the Cash LTIP is recognized over the related performance periods based on the expected achievement of the performance goals.
Cash and Cash Equivalents
Cash and cash equivalents include all highly liquid investments with original maturities of 90 days or less and receivables from financial institutions related to credit card purchases due to the high-credit quality and short time frame for settlement of the outstanding amounts.
Concentration of Credit Risk
The Company maintains cash deposits and cash equivalents with well-known and stable financial institutions; however, there were significant amounts of cash and cash equivalents on deposit at overseas financial institutions as well as at financial institutions that were in excess of FDIC-insured limits at July 30, 2016.
Inventories
Retail Inventory Method
We hold inventory for sale through our retail stores and ecommerce sites. All of the Company's segments, other than ANN discussed below, use the retail method of accounting, under which inventory is stated at the lower of cost, on a First In, First Out (“FIFO”) basis, or market. Under the retail inventory method, the valuation of inventory at cost and the resulting gross margin are calculated by applying a calculated cost to retail ratio to the retail value of inventory. Inherent in the retail method are certain significant management judgments and estimates including, among others, initial merchandise markup, markdowns and shrinkage, which significantly impact the ending inventory valuation at cost as well as the resulting gross margins.
The Company continuously reviews its inventory levels to identify slow-moving merchandise and markdowns necessary to clear slow-moving merchandise, which reduces the cost of inventories to its estimated net realizable value. Consideration is given to a number of quantitative and qualitative factors, including current pricing levels and the anticipated need for subsequent markdowns, aging of inventories, historical sales trends, and the impact of market trends and economic conditions. Estimates of markdown requirements may differ from actual results due to changes in quantity, quality and mix of products in inventory, as well as changes in consumer preferences, market and economic conditions. The Company’s historical estimates of these costs and its markdown provisions have not differed materially from actual results.
Reserves for inventory shrinkage, representing the risk of physical loss of inventory, are estimated based on historical experience and are adjusted based upon physical inventory counts.
Weighted-average Cost Method
The ANN segment uses the weighted-average cost method to value inventory, under which inventory is valued at the lower of average cost or market, at the individual item level. Inventory cost is adjusted when the current selling price or future estimated selling price is less than cost.
Reserves for inventory shrinkage, representing the risk of physical loss of inventory, are estimated based on historical experience and are adjusted based upon physical inventory counts.
F-10
ASCENA RETAIL GROUP, INC.
NOTES TO CONSOLIDATED FINANCIAL STATEMENTS - (Continued)
Property and Equipment, Net
Property and equipment, net, is stated at cost less accumulated depreciation. Depreciation is calculated using the straight-line method over the following estimated useful lives:
Buildings and improvements | 5-40 years |
Distribution center equipment and machinery | 3-20 years |
Leasehold improvements | Shorter of the useful life or expected term of the lease |
Furniture, fixtures, and equipment | 2-10 years |
Information technology | 2-10 years |
Certain costs associated with computer software developed or obtained for internal use are capitalized, including internal costs. The Company capitalizes certain costs for employees that are directly associated with internal use computer software projects once specific criteria are met. Costs are expensed for preliminary stage activities, training, maintenance and all other post-implementation stage activities as they are incurred.
Property and equipment, along with other long-lived assets, are evaluated for impairment periodically whenever events or changes in circumstances indicate that their related carrying amounts may not be recoverable. In evaluating long-lived assets for recoverability, including finite-lived intangible assets as described below, the Company uses its best estimate of future cash flows expected to result from the use of the asset and its eventual disposition. To the extent that estimated future undiscounted net cash flows attributable to the asset are less than the carrying amount, an impairment loss is recognized equal to the difference between the carrying value of such asset and its fair value, considering external market participant assumptions. Assets to be disposed of and for which there is a committed plan of disposal are reported at the lower of carrying value or fair value less costs to sell.
Goodwill and Other Intangible Assets, Net
At acquisition, the Company estimates and records the fair value of purchased intangible assets, which primarily consist of certain trade names, customer relationships, favorable leases, proprietary software and franchise rights. The fair value of these intangible assets is estimated based on management's assessment, considering independent third-party appraisals, when necessary. The excess of the purchase consideration over the fair value of net assets acquired is recorded as goodwill.
Goodwill and certain other intangible assets deemed to have indefinite useful lives, including trade names and certain franchise rights, are not amortized. Rather, goodwill and such indefinite-lived intangible assets are assessed for impairment at least annually based on comparisons of their respective fair values to their carrying values.
Goodwill impairment is determined using a two-step process. The first step of the goodwill impairment test is to identify potential impairment by comparing the fair value of a reporting unit with its net book value (or carrying amount), including goodwill. If the fair value of a reporting unit exceeds its carrying amount, goodwill of the reporting unit is considered not to be impaired and performance of the second step of the impairment test is unnecessary. If the carrying amount of a reporting unit exceeds its fair value, the second step of the goodwill impairment test is performed to measure the amount of impairment loss, if any. The second step of the goodwill impairment test compares the implied fair value of the reporting unit's goodwill with the carrying amount of that goodwill. If the carrying amount of the reporting unit's goodwill exceeds the implied fair value of that goodwill, an impairment loss is recognized in an amount equal to that excess. The implied fair value of goodwill is determined in the same manner as the amount of goodwill recognized in a business combination. That is, the fair value of the reporting unit is allocated to all of the assets and liabilities of that unit (including any unrecognized intangible assets) as if the reporting unit had been acquired in a business combination and the fair value was the purchase price paid to acquire the reporting unit.
The impairment test for other indefinite-lived intangible assets consists of a comparison of the fair value of the intangible asset with its carrying value. The fair value of indefinite-lived intangible assets is primarily determined using the relief-from-royalty approach. If the carrying value of the indefinite-lived intangible asset exceeds its fair value, an impairment loss is recognized equal to the excess. In addition, in evaluating finite-lived intangible assets for recoverability, we use our best estimate of future cash flows expected to result from the use of the asset and eventual disposition. To the extent that estimated future undiscounted net cash flows attributable to the asset are less than the carrying amount, an impairment loss is recognized equal to the difference between the carrying value of such asset and its fair value.
F-11
ASCENA RETAIL GROUP, INC.
NOTES TO CONSOLIDATED FINANCIAL STATEMENTS - (Continued)
The Company performs its annual impairment assessment of goodwill and indefinite-lived intangible assets using a quantitative approach on the first day of its fourth quarter of each fiscal year.
Finite-lived intangible assets are amortized over their respective estimated useful lives and, along with other long-lived assets (as discussed above), are evaluated for impairment periodically whenever events or changes in circumstances indicate that their related carrying amounts may not be recoverable. Refer to the Company's accounting policy for long-lived asset impairment as described earlier under the caption "Property and Equipment, Net."
Insurance Reserves
The Company uses a combination of insurance and self-insurance mechanisms to provide for the potential liabilities for workers’ compensation and employee healthcare benefits. Liabilities associated with these risks are estimated, in part, by considering historical claims experience, demographic factors, severity factors and other actuarial assumptions. Such liabilities are capped through the use of stop-loss contracts with insurance companies. The estimated accruals for these liabilities could be significantly affected if future occurrences and claims differ from these assumptions and historical trends. As of July 30, 2016 and July 25, 2015, these reserves were $70.4 million and $48.5 million, respectively. The Company is subject to various claims and contingencies related to insurance and other matters arising out of the normal course of business. The Company is self-insured for expenses related to its employee medical and dental plans, and its workers’ compensation plan, up to certain thresholds. Claims filed, as well as claims incurred but not reported, are accrued based on management’s estimates, using information received from plan administrators, historical analysis and other relevant data. The Company’s stop-loss insurance coverage limit for individual claims under these policies is $350,000. The Company believes its accruals for claims and contingencies are adequate based on information currently available. However, it is possible that actual results could differ significantly from the recorded accruals for claims and contingencies.
Income Taxes
Income taxes are provided using the asset and liability method. Under this method, income taxes (i.e., deferred tax assets and liabilities, current taxes payable/refunds receivable and tax expense) are recorded based on amounts refundable or payable in the current year, and include the results of any differences between U.S. GAAP and tax reporting. Deferred income taxes reflect the tax effect of certain net operating loss, capital loss and general business credit carry forwards and the net tax effects of temporary differences between the carrying amount of assets and liabilities for financial statement and income tax purposes, as determined under enacted tax laws and rates. The Company accounts for the financial effect of changes in tax laws or rates in the period of enactment.
Valuation allowances are established when management determines that it is more-likely-than-not that some portion or all of a deferred tax asset will not be realized. Tax valuation allowances are analyzed periodically and adjusted as events occur, or circumstances change, that warrant adjustments to those balances.
In determining the income tax provision for financial reporting purposes, the Company establishes a reserve for uncertain tax positions. If the Company considers that a tax position is more-likely-than-not of being sustained upon audit, based solely on the technical merits of the position, it recognizes the tax benefit. The Company measures the tax benefit by determining the largest amount that is greater than 50% likely of being realized upon settlement, presuming that the tax position is examined by the appropriate taxing authority that has full knowledge of all relevant information. These assessments can be complex and the Company often obtains assistance from external advisors. To the extent that the Company’s estimates change or the final tax outcome of these matters is different than the amounts recorded, such differences will impact the income tax provision in the period in which such determinations are made. If the initial assessment fails to result in the recognition of a tax benefit, the Company regularly monitors its position and subsequently recognizes the tax benefit if (i) there are changes in tax law or analogous case law that sufficiently raise the likelihood of prevailing on the technical merits of the position to more-likely-than-not, (ii) the statute of limitation expires or (iii) there is a completion of an audit resulting in a settlement of that tax year with the appropriate agency. Uncertain tax positions are classified as current only when the Company expects to pay cash within the next twelve months. Interest and penalties, if any, are recorded within the (provision) benefit for income taxes in the Company’s accompanying consolidated statements of operations and are classified on the accompanying consolidated balance sheets with the related liability for uncertain tax positions.
F-12
ASCENA RETAIL GROUP, INC.
NOTES TO CONSOLIDATED FINANCIAL STATEMENTS - (Continued)
Leases
The Company leases certain facilities and equipment, including its retail stores. Most of the Company's leases contain renewal options, rent escalation clauses and/or landlord incentives. Rent expense for non-cancelable operating leases with scheduled rent increases and/or landlord incentives is recognized on a straight-line basis over the lease term, beginning with the effective lease commencement date. The effective lease commencement date represents the date on which the Company takes possession of, or controls the physical use of, the leased property. The excess of straight-line rent expense over scheduled payment amounts and landlord incentives is recorded as a deferred rent liability and is classified on the consolidated balance sheets within Lease-related liabilities.
Certain leases provide for contingent rents, which are determined as a percentage of gross sales in excess of specified levels. A contingent rent liability is recognized together with the corresponding rent expense when specified levels have been achieved or when management determines that achieving the specified levels during the fiscal year is probable.
4. Recently Issued Accounting Standards
In March 2016, the Financial Accounting Standards Board ("FASB") issued Accounting Standards Update ("ASU") 2016-09, “Improvements to Employee Share-based Payment Accounting” (“ASU 2016-09”). The guidance simplifies the accounting for employee share-based payment transactions, including the accounting for income taxes, forfeitures, statutory tax withholding requirements and the classification in the statement of cash flows. The guidance is effective for fiscal years beginning after December 15, 2016 and interim periods therein, with early adoption permitted. The Company is currently evaluating the guidance and its impact on the Company's consolidated financial statements.
In February 2016, the FASB issued ASU 2016-02, “Leases” (“ASU 2016-02”). The guidance requires the lessee to recognize the assets and liabilities for the rights and obligations created by leases with terms of 12 months or more. The guidance is effective for fiscal years beginning after December 15, 2018 and interim periods therein, with early adoption permitted. The Company is currently evaluating the guidance and its impact on the Company's consolidated financial statements.
In November 2015, the FASB issued ASU 2015-17, “Income Taxes (Topic 740): Balance Sheet Classification of Deferred Taxes” (“ASU 2015-17”). The guidance requires companies to classify all deferred tax assets and liabilities as non-current on the balance sheet instead of separating deferred taxes into current and non-current amounts. The guidance is effective for fiscal years beginning after December 15, 2016 and interim periods therein. The guidance can be applied either prospectively or retrospectively, with early application permitted. The Company early adopted this guidance in the second quarter of Fiscal 2016 and, as a result, classified all deferred tax assets and liabilities as non-current as of July 30, 2016. As the Company elected to apply this guidance prospectively, no changes were made to the consolidated balance sheet as of July 25, 2015.
In September 2015, the FASB issued ASU 2015-16, "Business Combinations (Topic 805): Simplifying the Accounting for Measurement-Period Adjustments" ("ASU 2015-16"), which eliminates the requirement for an acquirer in a business combination to account for measurement-period adjustments retrospectively. Under this guidance, the acquirer must recognize measurement-period adjustments in the period in which the amounts are determined, including the effect on earnings of any amounts that would have been recorded in previous periods, as if the accounting had been completed at the acquisition date. This guidance is effective for fiscal years beginning after December 15, 2016, with early adoption permitted. The Company elected to early adopt this ASU in the first quarter of Fiscal 2016. During Fiscal 2016, the Company recorded certain measurement-period adjustments for the ANN Acquisition, as more fully described in Note 5.
In July 2015, the FASB issued ASU 2015-11, "Simplifying the Measurement of Inventory" ("ASU 2015-11"), which requires inventory to be measured at the lower of cost and net realizable value. ASU 2015-11 is effective prospectively for fiscal years and interim periods within those fiscal years, beginning after December 15, 2016. The Company does not expect the adoption of the guidance to have a material impact on its consolidated financial statements.
In April 2015, the FASB issued ASU 2015-03, “Interest - Imputation of Interest (Subtopic 835-30): Simplifying the Presentation of Debt Issuance Costs” (“ASU 2015-03”). The guidance requires debt issuance costs to be presented in the balance sheet as a direct deduction from the carrying value of the debt liability. The recognition and measurement for debt issuance costs are not affected and will continue to be recognized over the life of the debt instrument. The guidance is effective for fiscal years beginning after December 15, 2015 and interim periods therein. The guidance is to be applied retrospectively, with early application permitted.
F-13
ASCENA RETAIL GROUP, INC.
NOTES TO CONSOLIDATED FINANCIAL STATEMENTS - (Continued)
The Company early adopted this guidance in the first quarter of Fiscal 2016 and, as a result, reclassified unamortized debt issuance costs of $9.5 million as of July 25, 2015 from Other assets to a reduction of Long-term debt, less current portion in the accompanying consolidated balance sheet.
In May 2014, the FASB issued ASU 2014-09, "Revenue from Contracts with Customers" ("ASU 2014-09"), which supersedes the revenue recognition requirements in FASB Accounting Standards Codification ("ASC") Topic 605, "Revenue Recognition." The guidance requires that an entity recognize revenue in a way that depicts the transfer of promised goods or services to customers in the amount that reflects the consideration to which the entity expects to be entitled to in exchange for those goods and services. The guidance, which was deferred in July 2015, will be effective for annual reporting periods beginning after December 15, 2017, and interim periods therein. The guidance may be applied retrospectively to each period presented or with the cumulative effect recognized as of the initial date of application. The Company is currently evaluating the new standard and its impact on the Company's consolidated financial statements.
5. Acquisition of ANN INC.
On August 21, 2015, the Company acquired 100% of the outstanding common stock of ANN for an aggregate purchase price of approximately $2.1 billion. The purchase price consisted of approximately $1.75 billion in cash and the issuance of 31.2 million shares of the Company's common stock valued at approximately $345 million, based on the Company's stock price on the date of the acquisition. The cash portion of the purchase price was funded with borrowings under a $1.8 billion seven-year, variable-rate term loan described in Note 11. The acquisition is intended to diversify our portfolio of brands that serve the needs of women of different ages, sizes and demographics. The Company expensed $20.8 million of transaction costs during Fiscal 2016 which are included within Acquisition and integration expenses in the Company’s accompanying consolidated statements of operations.
The Company accounted for the ANN Acquisition under the acquisition method of accounting for business combinations. Accordingly, the cost to acquire such assets was allocated to the underlying net assets in proportion to estimates of their respective fair values. The excess of the purchase price over the estimated fair value of the net assets acquired was recorded as goodwill, which consists largely of the synergies and economies of scale expected from integrating ANN's operations. The Company allocated $225.7 million of the goodwill related to the ANN Acquisition to the Company's other reporting units where the anticipated benefits of the acquisition are expected to be achieved, as more fully described in Note 6. Goodwill is non-deductible for income tax purposes.
The allocation of the purchase price to the assets acquired and liabilities assumed, including the amount allocated to goodwill, was subject to change within the measurement period (up to one year from the acquisition date) as additional information that existed at the date of the acquisition related to the values of assets acquired and liabilities assumed is obtained. During Fiscal 2016, the Company recorded certain measurement-period adjustments. While no material adjustments are expected, the purchase price allocation is not yet final as the Company is completing its analysis of the opening balances related to deferred taxes. The allocation will be finalized during the first quarter of Fiscal 2017.
F-14
ASCENA RETAIL GROUP, INC.
NOTES TO CONSOLIDATED FINANCIAL STATEMENTS - (Continued)
The assessment of fair values of assets acquired and liabilities assumed as of August 21, 2015, as adjusted through July 30, 2016, is as follows:
Preliminary Allocation as of the acquisition date | Measurement-Period Adjustments | Preliminary Allocation, as adjusted through July 30, 2016 | |||||||||
(millions) | |||||||||||
Cash and cash equivalents | $ | 257.6 | $ | — | $ | 257.6 | |||||
Inventories | 398.3 | — | 398.3 | ||||||||
Prepaid expenses and other current assets | 100.8 | 17.7 | 118.5 | ||||||||
Property and equipment | 451.0 | 2.3 | 453.3 | ||||||||
Goodwill | 953.2 | 6.4 | 959.6 | ||||||||
Other intangible assets (Note 6): | |||||||||||
Trade names | 815.0 | — | 815.0 | ||||||||
Customer relationships | 51.5 | — | 51.5 | ||||||||
Favorable leases | 49.0 | (10.6 | ) | 38.4 | |||||||
Other assets | 3.5 | — | 3.5 | ||||||||
Total assets acquired | 3,079.9 | 15.8 | 3,095.7 | ||||||||
Accounts payable | 155.6 | — | 155.6 | ||||||||
Accrued expenses and other current liabilities (a) | 197.0 | 12.0 | 209.0 | ||||||||
Deferred income | 46.0 | — | 46.0 | ||||||||
Lease-related liabilities | 176.6 | (1.6 | ) | 175.0 | |||||||
Deferred income taxes | 374.1 | — | 374.1 | ||||||||
Other non-current liabilities | 33.4 | 5.4 | 38.8 | ||||||||
Total liabilities assumed | 982.7 | 15.8 | 998.5 | ||||||||
Total net assets acquired | $ | 2,097.2 | $ | — | $ | 2,097.2 | |||||
_______
(a) | As part of the ANN Acquisition, the Company assumed employee-related obligations of approximately $100 million, including approximately $95 million paid during Fiscal 2016. The remaining approximately $5 million is expected to be paid in the first half of Fiscal 2017. |
The values assigned to the Ann Taylor and LOFT trade names were derived using the relief-from-royalties method under the income approach. This approach is used to estimate the cost savings that accrue for the owner of an intangible asset who would otherwise have to pay royalties or licensing fees on revenues earned through the use of the asset if they had not owned the rights to use the assets. The net after-tax royalty savings are calculated for each year in the remaining economic life of the intangible asset and discounted to present value. The Ann Taylor and LOFT trade names are deemed to have indefinite lives and are not amortized but subject to an impairment assessment annually, or more frequently if events or changes in circumstances indicate that the asset may be impaired.
The value assigned to customer relationships was derived using the multi-period excess earnings method under the income approach. This approach estimates the excess earnings generated over the lives of the customers that existed as of the acquisition date and discounts such earnings to present value. Customer relationships are amortized over five years based on the pattern of revenue expected to be generated from the use of the asset.
The values of favorable and unfavorable leasehold interests are determined by comparing the present value of the contract rent over the remaining lease term with that of the market rent, taking into account the type, size and location of the property. Favorable leasehold interests are included within Other intangible assets and unfavorable leasehold interests are included within Lease-related liabilities in the table above. ANN's historical lease-related liabilities of similar amounts were eliminated through purchase accounting.
The fair value of ANN's inventory as of the acquisition date was determined by using the estimated selling price, adjusted for the estimated costs of disposal and a reasonable profit margin. Approximately $127 million related to the write-up of inventory to its
F-15
ASCENA RETAIL GROUP, INC.
NOTES TO CONSOLIDATED FINANCIAL STATEMENTS - (Continued)
fair value was fully amortized to COGS in the accompanying consolidated statement of operations in Fiscal 2016 as the acquired inventory was sold.
The results of ANN for the post-acquisition periods from August 22, 2015 to July 30, 2016 included in the Company’s accompanying consolidated statement of operations for Fiscal 2016 consist of the following:
For the period from August 22, 2015 to July 30, 2016 | |||
(millions) | |||
Net sales | $ | 2,330.9 | |
Net loss | $ | (40.3 | ) |
The following pro forma information has been prepared as if the ANN Acquisition and the issuance of stock and debt to finance the acquisition had occurred as of the beginning of Fiscal 2015:
Fiscal Years Ended | |||||||
July 30, 2016 | July 25, 2015 | ||||||
(millions, except per share data) (unaudited) | |||||||
Pro forma net sales | $ | 7,119.1 | $ | 7,332.6 | |||
Pro forma net income (loss) | $ | 70.3 | $ | (254.0 | ) | ||
Pro forma net income (loss) per common share: | |||||||
Basic | $ | 0.36 | $ | (1.31 | ) | ||
Diluted | $ | 0.36 | $ | (1.31 | ) | ||
The Fiscal 2016 pro forma amounts reflect the historical operational results for ascena as well as those of ANN for the three-week stub period preceding the close of the transaction on August 21, 2015. The pro forma amounts also reflect the effect of pro forma adjustments of $82.2 million, net of taxes. The adjustments primarily reflect transaction costs and the amortization of the fair value adjustment to inventory, which are currently included in the reported results and are excluded from the Fiscal 2016 pro forma amounts due to their non-recurring nature.
The Fiscal 2015 pro forma amounts reflect the historical operational results for ascena and ANN and the effect of pro forma adjustments of $(87.1) million, net of taxes. These adjustments primarily reflect charges for incremental interest expense related to the term loan and incremental depreciation and amortization expense related to the write-up of ANN’s tangible and intangible assets to fair market value that were not reflected in the historical results.
The pro forma weighted-average number of common shares outstanding for each period assumes that 31.2 million shares of ascena common stock issued in connection with the acquisition had been issued as of the beginning of Fiscal 2015. The pro forma weighted-average number of diluted shares outstanding for Fiscal 2016 includes potentially dilutive shares of 1.2 million, which are excluded from the reported amount due to the net loss reported for the year.
The pro forma financial information is not indicative of the operational results that would have been obtained had the transactions actually occurred as of that date, nor is it necessarily indicative of the Company’s future operational results.
F-16
ASCENA RETAIL GROUP, INC.
NOTES TO CONSOLIDATED FINANCIAL STATEMENTS - (Continued)
6. Goodwill and Other Intangible Assets
Goodwill
The following details the changes in goodwill for each reportable segment:
ANN | Justice | Lane Bryant | maurices | Catherines | Total | |||||||||||||||||||
(millions) | ||||||||||||||||||||||||
Balance at July 26, 2014 | $ | — | $ | 103.6 | $ | 319.1 | $ | 130.7 | $ | 28.0 | $ | 581.4 | ||||||||||||
Impairment losses (a) | — | — | (261.7 | ) | — | — | (261.7 | ) | ||||||||||||||||
Balance at July 25, 2015 | — | 103.6 | 57.4 | 130.7 | 28.0 | 319.7 | ||||||||||||||||||
Acquisition-related activity (Note 5) | 733.9 | 65.8 | 68.6 | 70.0 | 21.3 | 959.6 | ||||||||||||||||||
Balance at July 30, 2016 | $ | 733.9 | $ | 169.4 | $ | 126.0 | $ | 200.7 | $ | 49.3 | $ | 1,279.3 | ||||||||||||
(a) Represents accumulated impairment losses as of July 30, 2016 and July 25, 2015.
As described in Note 5, the Company recorded goodwill of $959.6 million for the ANN Acquisition. During the fourth quarter of Fiscal 2016, the Company assigned $225.7 million of goodwill from our ANN reporting unit to the Company's other reporting units as an analysis of the expected synergies was completed. The allocation of goodwill was based on specific identification or other reasonable allocation methodologies for expected cost savings related to procurement, fulfillment, distribution and shared services. The amount of goodwill assigned to a reporting unit represents the difference between the fair value of that reporting unit before and after the acquisition using a with-and-without analysis that measures the fair values of the expected synergies under the income approach.
Other Intangible Assets
Other intangible assets consist of the following:
July 30, 2016 | July 25, 2015 | |||||||||||||||||||||||
Description | Gross Carrying Amount | Accumulated Amortization | Net | Gross Carrying Amount | Accumulated Amortization | Net | ||||||||||||||||||
Intangible assets subject to amortization: | (millions) | |||||||||||||||||||||||
Proprietary technology | $ | 5.3 | $ | (5.3 | ) | $ | — | $ | 5.8 | $ | (5.8 | ) | $ | — | ||||||||||
Customer relationships | 54.2 | (19.9 | ) | 34.3 | 2.7 | (2.7 | ) | — | ||||||||||||||||
Favorable leases | 38.2 | (7.1 | ) | 31.1 | — | — | — | |||||||||||||||||
Trade names | 5.3 | (5.3 | ) | — | 5.3 | (5.3 | ) | — | ||||||||||||||||
Total intangible assets subject to amortization | 103.0 | (37.6 | ) | 65.4 | 13.8 | (13.8 | ) | — | ||||||||||||||||
Intangible assets not subject to amortization: | ||||||||||||||||||||||||
Brands and trade names | 1,192.4 | — | 1,192.4 | 377.4 | — | 377.4 | ||||||||||||||||||
Franchise rights | 10.9 | — | 10.9 | 10.9 | — | 10.9 | ||||||||||||||||||
Total intangible assets not subject to amortization | 1,203.3 | — | 1,203.3 | 388.3 | — | 388.3 | ||||||||||||||||||
Total intangible assets | $ | 1,306.3 | $ | (37.6 | ) | $ | 1,268.7 | $ | 402.1 | $ | (13.8 | ) | $ | 388.3 | ||||||||||
Amortization
The Company recognized amortization expense on finite-lived intangible assets, excluding favorable leases discussed below, of $17.2 million in Fiscal 2016, $2.4 million in Fiscal 2015 and $2.7 million in Fiscal 2014, which is classified within Depreciation and amortization expense in the accompanying consolidated statements of operations. The Company amortizes customer relationships recognized as part of the ANN Acquisition over five years based on the pattern of revenue expected to be generated from the use of the asset.
F-17
ASCENA RETAIL GROUP, INC.
NOTES TO CONSOLIDATED FINANCIAL STATEMENTS - (Continued)
The expected amortization of customer relationships is as follows:
Expected Amortization | |||
(millions) | |||
2017 | $ | 12.5 | |
2018 | 9.4 | ||
2019 | 7.0 | ||
2020 | 5.4 | ||
Total | $ | 34.3 | |
Favorable leases are amortized into either Buying, distribution and occupancy expenses or Selling, general and administrative expenses over a weighted-average lease term of approximately four years. The Company recognized amortization expense on favorable leases of $7.3 million in Fiscal 2016. The expected amortization for each of the next five fiscal years is as follows: fiscal 2017: $7.2 million; fiscal 2018: $6.8 million; fiscal 2019: $6.3 million; fiscal 2020: $5.8 million; and fiscal 2021 and thereafter: $5.0 million.
Goodwill and Other Indefinite-lived Intangible Assets Impairment Assessment
As discussed in Note 3, the Company performs its annual impairment assessment of goodwill and indefinite-lived intangible assets during the fourth quarter of each fiscal year. The impairment test for other indefinite-lived intangible assets consists of a comparison of the fair value of the intangible asset with its carrying value. If the carrying value of the indefinite-lived intangible asset exceeds its fair value, an impairment loss is recognized equal to the excess. Based on the results of the Company’s annual impairment testing of goodwill and indefinite-lived intangible assets for Fiscal 2016, no impairment charges were deemed necessary.
Fiscal 2015 Lane Bryant Impairment
During the fourth quarter of Fiscal 2015, due to lower-than-expected performance since the acquisition, management lowered certain key assumptions in its long-term projections used in the Fiscal 2015 valuation. As a result, Lane Bryant recorded an impairment loss of $261.7 million to write down the carrying value of its goodwill to its implied fair value, as if the reporting unit had been acquired in a business combination. In addition, Lane Bryant recorded an impairment loss of $44.7 million to write down the carrying value of its trade name to its fair value, which was determined using the relief-from-royalty method (Level 3 measurement). Such impairment losses have been included within Impairment of goodwill and Impairment of intangible assets, respectively, in the accompanying consolidated statements of operations.
Fiscal 2014 Studio Y Impairment
During the fourth quarter of Fiscal 2014, Management at maurices reached a decision to stop selling product under its Studio Y label. As a result, maurices recorded a non-cash impairment charge of $13.0 million to write-off the entire carrying value of the Studio Y trade name. This impairment loss has been included within Impairment of intangible assets in the accompanying consolidated statements of operations.
F-18
ASCENA RETAIL GROUP, INC.
NOTES TO CONSOLIDATED FINANCIAL STATEMENTS - (Continued)
7. Inventories
Inventories substantially consist of finished goods merchandise. Inventory by brand is set forth below:
July 30, 2016 | July 25, 2015 | |||||||
(millions) | ||||||||
ANN | $ | 198.6 | $ | — | ||||
Justice | 107.5 | 136.0 | ||||||
Lane Bryant | 125.8 | 126.5 | ||||||
maurices | 102.0 | 103.8 | ||||||
dressbarn | 86.8 | 93.3 | ||||||
Catherines | 28.6 | 29.7 | ||||||
Total inventories | $ | 649.3 | $ | 489.3 | ||||
8. Property and Equipment
Property and equipment, net, consist of the following:
July 30, 2016 | July 25, 2015 | |||||||
(millions) | ||||||||
Property and Equipment: | ||||||||
Land | $ | 32.0 | $ | 30.4 | ||||
Buildings and improvements | 250.8 | 189.3 | ||||||
Leasehold improvements | 948.7 | 652.7 | ||||||
Furniture, fixtures and equipment | 718.2 | 572.7 | ||||||
Information technology | 572.1 | 356.2 | ||||||
Construction in progress | 155.1 | 148.6 | ||||||
2,676.9 | 1,949.9 | |||||||
Less: accumulated depreciation | (1,046.8 | ) | (779.9 | ) | ||||
Property and equipment, net | $ | 1,630.1 | $ | 1,170.0 | ||||
The increase in property and equipment is mainly due to the ANN Acquisition. In addition, buildings and improvements increased due to costs associated with the construction of a new headquarters building for maurices and certain shared services operations in Duluth, MN which was placed into service in Fiscal 2016. Information technology increased from costs associated with the development of our ecommerce platforms and centralized inventory management systems which were placed into service in Fiscal 2016.
Long-Lived Asset Impairments
The charges below reduced the net carrying value of certain long-lived assets to their estimated fair value, which was determined based on discounted expected cash flows. These impairment charges were primarily related to the lower-than-expected operating performance of certain retail stores. Impairment losses for retail store-related assets and finite-lived intangible assets are included as a component of Selling, general and administrative expenses in the accompanying consolidated statements of operations for all periods. There were no finite-lived intangible asset impairment losses recorded for any of the periods presented.
F-19
ASCENA RETAIL GROUP, INC.
NOTES TO CONSOLIDATED FINANCIAL STATEMENTS - (Continued)
Impairment charges related to long-lived tangible assets by segment are as follows:
Fiscal Years Ended | |||||||||||
July 30, 2016 | July 25, 2015 | July 26, 2014 | |||||||||
(millions) | |||||||||||
Justice | $ | 2.4 | $ | 6.4 | $ | 0.3 | |||||
Lane Bryant | 2.8 | 0.6 | 0.9 | ||||||||
maurices | 2.2 | 2.6 | 1.1 | ||||||||
dressbarn | 5.9 | 1.2 | 1.9 | ||||||||
Total impairment charges | $ | 13.3 | $ | 10.8 | $ | 4.2 | |||||
Depreciation
The Company recognized depreciation expense of $341.5 million in Fiscal 2016, $215.8 million in Fiscal 2015 and $190.9 million in Fiscal 2014, which is classified within Depreciation and amortization expense in the accompanying consolidated statements of operations.
In Fiscal 2015, the Company closed the Brothers brand, a separate brand operating within our Justice segment, which represented less than 1% of the Company's consolidated revenues for all periods presented. As a result, the depreciable lives of certain existing assets were adjusted to reflect a shortened useful life for the assets as a result of the closure. Thus, Fiscal 2015 included incremental depreciation expense for these assets of approximately $5.9 million which increased the net loss by approximately $3.7 million and diluted net loss per common share by approximately $0.02. Substantially all of these assets ceased depreciating during Fiscal 2015.
As a result of the Company’s integration of its supply chain and technology infrastructure, the depreciable lives of certain existing assets were adjusted to reflect a shortened useful life for the assets that were displaced as a result of these projects. Thus, Fiscal 2014 includes incremental depreciation expenses for these assets of approximately $8.6 million. This additional expense reduced income from continuing operations by approximately $5.3 million and diluted net income per common share from continuing operations by approximately $0.03 for Fiscal 2014. Substantially all of these displaced assets ceased depreciating during Fiscal 2014.
9. Prepaid Expenses and Other Current Assets
Prepaid expenses and other current assets consist of the following:
July 30, 2016 | July 25, 2015 | |||||||
(millions) | ||||||||
Prepaid expenses | $ | 132.1 | $ | 45.6 | ||||
Accounts and other receivables | 84.7 | 70.8 | ||||||
Short-term investments | 1.8 | 13.4 | ||||||
Other current assets | 0.3 | 1.7 | ||||||
Total prepaid expenses and other current assets | $ | 218.9 | $ | 131.5 | ||||
F-20
ASCENA RETAIL GROUP, INC.
NOTES TO CONSOLIDATED FINANCIAL STATEMENTS - (Continued)
10. Accrued Expenses and Other Current Liabilities
Accrued expenses and other current liabilities consist of the following:
July 30, 2016 | July 25, 2015 | |||||||
(millions) | ||||||||
Accrued salary, wages and related expenses | $ | 183.8 | $ | 176.9 | ||||
Accrued operating expenses | 161.6 | 202.1 | ||||||
Sales and other taxes payable | 34.1 | 14.2 | ||||||
Other | 34.2 | 10.0 | ||||||
Total accrued expenses and other current liabilities | $ | 413.7 | $ | 403.2 | ||||
11. Debt
Debt consists of the following:
Debt consists of the following: | July 30, 2016 | July 25, 2015 | |||||
(millions) | |||||||
Revolving credit facility | $ | — | $ | 116.0 | |||
Less: unamortized debt issuance costs (a) | (5.8 | ) | (3.8 | ) | |||
(5.8 | ) | 112.2 | |||||
Term loan | 1,719.0 | — | |||||
Less: unamortized debt issuance costs (b) | (30.1 | ) | (5.7 | ) | |||
unamortized original issue discount (b) | (34.6 | ) | — | ||||
1,654.3 | (5.7 | ) | |||||
Less: current portion | (54.0 | ) | — | ||||
Total long-term debt | $ | 1,594.5 | $ | 106.5 | |||
_______
(a) The unamortized debt issuance costs in connection with the Amended Revolving Credit Agreement, as defined below, are amortized on a straight-line basis over the life of the Amended Revolving Credit Agreement.
(b) The original issue discount and debt issuance costs for the term loan are amortized over the life of the term loan using the interest-rate method based on an imputed interest rate of approximately 6.3%.
Amended Revolving Credit Agreement
In August 2015, in connection with the ANN Acquisition, the Company and certain of its domestic subsidiaries amended the revolving credit facility. The amendment increased the aggregate revolving commitments from $500 million to $600 million, with an optional increase of up to $200 million and extended the maturity date to August 2020 (the “Amended Revolving Credit Agreement”). There are no mandatory reductions in aggregate revolving commitments throughout the term of the Amended Revolving Credit Agreement. However, borrowing availability under the Amended Revolving Credit Agreement (the "Availability") is limited by the amount of eligible inventory and receivables as defined in the Amended Revolving Credit Agreement.
The Amended Revolving Credit Agreement may be used for the issuance of letters of credit, to fund working capital requirements and capital expenditures and for general corporate purposes. The Amended Revolving Credit Agreement includes a $350 million letter of credit sub-limit, of which $100 million can be used for standby letters of credit, and a $30 million swing loan sub-limit.
Throughout the term of the Amended Revolving Credit Agreement, the Company can elect to borrow either Alternative Base Rate Borrowings ("ABR Borrowings") or Eurodollar Borrowings. Eurodollar Borrowings bear interest at a variable rate using the
F-21
ASCENA RETAIL GROUP, INC.
NOTES TO CONSOLIDATED FINANCIAL STATEMENTS - (Continued)
LIBOR for such Interest Period plus an applicable margin ranging from 125 basis points to 150 basis points based on the Company’s average availability during the previous fiscal quarter. ABR Borrowings bear interest at a variable rate determined using a base rate equal to the greatest of (i) prime rate, (ii) federal funds rate plus 50 basis points or (iii) one-month LIBOR plus 100 basis points; plus an applicable margin ranging from 25 basis points to 50 basis points based on the average availability during the previous fiscal quarter.
Under the terms of the Amended Revolving Credit Agreement, the unutilized commitment fee ranges from 20 basis points to 25 basis points per annum based on the Company's average utilization during the previous fiscal quarter.
As of July 30, 2016, we had no borrowings outstanding under the Amended Revolving Credit Agreement. After taking into account the $25.9 million in outstanding letters of credit, the Company had $441.6 million of its availability under the Amended Revolving Credit Agreement.
Term Loan
Also in connection with the ANN Acquisition, the Company entered into a $1.8 billion variable-rate term loan (the "Term Loan"), which was issued at a 2% discount and provides for an additional term facility of $200 million. The Company is also eligible to borrow an unlimited amount, as long as the Company maintains a minimum senior secured leverage ratio as defined in the Term Loan (the "Senior Secured Leverage Ratio") among other factors.
The Term Loan matures on August 21, 2022, and has mandatory quarterly repayments of $4.5 million in calendar 2016 and $22.5 million thereafter, with a remaining balloon payment of approximately $1.2 billion required at maturity. During Fiscal 2016, the Company made all scheduled quarterly principal payments totaling $9.0 million. In August 2016, the Company repaid $100 million, which was applied to the remaining scheduled quarterly payments due in the second half of calendar 2016 and all scheduled payments for calendar 2017, such that the Company is not required to make its next quarterly scheduled payment until February 2018. The Company is also required to make mandatory prepayments in connection with certain prepayment events, including (i) commencing with the fiscal year ending July 29, 2017 if the Company has excess cash flow, as defined in the Term Loan, for any fiscal year and the Senior Secured Leverage Ratio for such fiscal year exceeds certain predetermined limits and (ii) from Net Proceeds, as defined in the Term Loan, of asset dispositions and certain casualty events that are greater than $25 million in the aggregate in any fiscal year and not reinvested (or committed to be reinvested) within one year, in each case subject to certain conditions and exceptions. The Company has the right to prepay the Term Loan in any amount and at any time with no prepayment penalties.
At the time of initial borrowings and renewal periods throughout the term of the Term Loan, the Company may elect to borrow either ABR Borrowings or Eurodollar Borrowings. Eurodollar Borrowings bear interest at a variable rate using LIBOR (subject to a floor of 75 basis points) plus an applicable margin of 450 basis points. ABR Borrowings bear interest at a variable rate determined using a base rate (subject to a floor of 175 basis points) equal to the greatest of (i) prime rate, (ii) federal funds rate plus 50 basis points or (iii) LIBOR plus 100 basis points, plus an applicable margin of 350 basis points. As of July 30, 2016, borrowings under the Term Loan consisted entirely of Eurodollar Borrowings at a rate of 5.25%.
During Fiscal 2016, the Company repurchased $72.0 million of the outstanding principal balance of the Term Loan at an aggregate cost of $68.4 million through open market transactions, resulting in $0.8 million in pre-tax gains, net of the proportional write-off of unamortized original discount and debt issuance costs of $2.8 million. Such net gain has been recorded as Gain on extinguishment of debt in the consolidated statements of operations.
Restrictions under the Term Loan and the Amended Revolving Credit Agreement (collectively the "Borrowing Agreements")
Under the Amended Revolving Credit Agreement, the Company is required to maintain a fixed charge coverage ratio, as defined in the Amended Revolving Credit Agreement, of at least 1.00 to 1.00 any time in which the Company is in a covenant period, as defined in the Amended Revolving Credit Agreement (the "Covenant Period"). Such Covenant Period is in effect if Availability is less than the greater of (a) 10% of the Credit Limit (the lesser of total Revolving Commitments and the Borrowing Base) and (b) $45 million for three consecutive business days and ends when Availability is greater than these thresholds for 30 consecutive days. The Covenant Period was not in effect as of July 30, 2016.
The Borrowing Agreements contain customary negative covenants, subject to negotiated exceptions, on (i) liens and guarantees, (ii) investments, (iii) indebtedness, (iv) significant corporate changes including mergers and acquisitions, (v) dispositions and (vi)
F-22
ASCENA RETAIL GROUP, INC.
NOTES TO CONSOLIDATED FINANCIAL STATEMENTS - (Continued)
restricted payments, cash dividends, stock repurchases and certain other restrictive agreements. The Borrowing Agreements also contain customary events of default, such as payment defaults, cross-defaults to certain material indebtedness, bankruptcy and insolvency, the occurrence of a defined change in control, or the failure to observe the negative covenants and other covenants related to the operation of the Company’s business, in each case subject to customary grace periods.
The Company's Amended Revolving Credit Agreement allows us to make restricted payments, including dividends and share repurchases subject to the Company satisfying certain conditions set forth in the Company's Amended Revolving Credit Agreement, notably that at the time of and immediately after giving effect to the restricted payment, (i) there is no default or event of default, and (ii) Availability is not less than 20% of the aggregate revolving commitments. The Company's Term Loan allows us to make restricted payments, including dividends and share repurchases up to a predetermined dollar amount. The dollar amount limitation is waived upon the satisfaction of certain conditions under the Term Loan, notably that at the time of and immediately after giving effect to such restricted payment, (i) there is no default or event of default, and (ii) the total leverage ratio, as defined in the Term Loan agreement, is below predetermined limits. Dividends are payable when declared by our Board of Directors.
The Company’s obligations under the Borrowing Agreements are guaranteed by certain of its domestic subsidiaries (the “Subsidiary Guarantors”). As collateral under the Borrowing Agreements and the guarantees thereof, the Company and the Subsidiary Guarantors have granted to the administrative agents for the benefit of the lenders a first priority lien on substantially all of their tangible and intangible assets, including, without limitation, certain domestic inventory and certain material real estate.
Maturities of Debt
The Company's debt matures as follows:
Fiscal Year | Amount | |||
(millions) | ||||
2017 (a) | $ | 54.0 | ||
2018 (a) | 90.0 | |||
2019 | 90.0 | |||
2020 | 90.0 | |||
2021 | 90.0 | |||
Thereafter | 1,305.0 | |||
Total maturities | $ | 1,719.0 | ||
_______
(a) In August 2016, the Company repaid $100 million, which was applied to the remaining mandatory quarterly repayments due in the second half of calendar 2016 and all required repayments for calendar 2017, such that the Company is not required to make its next quarterly repayment until calendar 2018. The table above does not reflect the effect of the $100 million payment.
12. Fair Value Measurements
Fair Value Measurements of Financial Instruments
Fair value is the price that would be received to sell an asset, or paid to transfer a liability, in an orderly transaction between market participants at the measurement date. In evaluating the fair value measurement techniques for recording certain financial assets and liabilities, there is a three-level valuation hierarchy under which financial assets and liabilities are designated. The determination of the applicable level within the hierarchy of a particular financial asset or liability depends on the lowest level of inputs used that are significant to the fair value measurement as of the measurement date as follows:
Level 1 | Quoted prices for identical instruments in active markets; |
Level 2 | Quoted prices for similar instruments in active markets; quoted prices for identical or similar instruments in markets that are recently traded (not active); and |
Level 3 | Instruments with little, if any, market activity are valued using significant unobservable inputs or valuation techniques. |
F-23
ASCENA RETAIL GROUP, INC.
NOTES TO CONSOLIDATED FINANCIAL STATEMENTS - (Continued)
The carrying values of cash and cash equivalents, accounts and other receivables and accounts payable approximates their estimated fair values due to the short maturities of these instruments.
The carrying amounts and fair values of the Company's available-for-sale investments and Long-term debt are as follows:
Fair Value Measurements | As of July 30, 2016 | As of July 25, 2015 | |||||||||||||||
Carrying Value | Fair Value | Carrying Value | Fair Value | ||||||||||||||
(millions) | |||||||||||||||||
Financial assets: | |||||||||||||||||
Available-for-sale investments (a) | Level 1 | $ | 1.8 | $ | 1.8 | $ | 13.4 | $ | 13.4 | ||||||||
$ | 1.8 | $ | 1.8 | $ | 13.4 | $ | 13.4 | ||||||||||
Financial liabilities: | |||||||||||||||||
Term Loan (b) | Level 2 | $ | 1,719.0 | $ | 1,682.5 | $ | — | $ | — | ||||||||
Revolving credit facility (c) | Level 2 | — | — | 116.0 | 116.0 | ||||||||||||
$ | 1,719.0 | $ | 1,682.5 | $ | 116.0 | $ | 116.0 | ||||||||||
(a) Available-for-sale investments, included within Prepaid expenses and other current assets, consist of restricted cash and are recorded at fair value as of July 30, 2016 and July 25, 2015.
(b) The carrying amount of the Term Loan excludes unamortized original issue discount and debt issuance costs of $64.7 million as of July 30, 2016. The fair value of the Term Loan was determined based on quoted market prices from recent transactions which are considered Level 2 inputs within the fair value hierarchy.
(c) The carrying amount of the revolving credit facility excludes unamortized debt issuance costs of $5.8 million as of July 30, 2016 and $3.8 million as of July 25, 2015.
The Company’s non-financial instruments, which primarily consist of goodwill, intangible assets, and property and equipment, are not required to be measured at fair values on a recurring basis and are reported at their carrying values. However, on a periodic basis whenever events or changes in circumstances indicate that their carrying value may not be recoverable (and at least annually for goodwill and other indefinite-lived intangible assets), non-financial instruments are assessed for impairment and, if applicable, written-down to (and recorded at) fair values. For further discussion of the determination of the fair value of non-financial instruments, see Notes 6 and 8.
13. Income Taxes
Taxes on Income
Domestic and foreign pretax (loss) income from continuing operations are as follows:
Fiscal Years Ended | ||||||||||||
July 30, 2016 | July 25, 2015 | July 26, 2014 | ||||||||||
(millions) | ||||||||||||
Domestic | $ | (56.0 | ) | $ | (303.1 | ) | $ | 144.7 | ||||
Foreign | 47.7 | 62.5 | 58.8 | |||||||||
Total (loss) income from continuing operations before (provision) benefit for income taxes | $ | (8.3 | ) | $ | (240.6 | ) | $ | 203.5 | ||||
F-24
ASCENA RETAIL GROUP, INC.
NOTES TO CONSOLIDATED FINANCIAL STATEMENTS - (Continued)
The provision (benefit) from continuing operations for current and deferred income taxes are as follows:
Fiscal Years Ended | ||||||||||||
July 30, 2016 | July 25, 2015 | July 26, 2014 | ||||||||||
Current: | (millions) | |||||||||||
Federal | $ | 7.7 | $ | (20.8 | ) | $ | 15.2 | |||||
State and local | 10.2 | 8.8 | 13.5 | |||||||||
Foreign | 12.5 | 14.8 | 12.3 | |||||||||
30.4 | 2.8 | 41.0 | ||||||||||
Deferred: | ||||||||||||
Federal | (21.7 | ) | 0.9 | 24.9 | ||||||||
State and local | (3.2 | ) | (6.5 | ) | (0.2 | ) | ||||||
Foreign | (1.9 | ) | (1.0 | ) | (0.4 | ) | ||||||
(26.8 | ) | (6.6 | ) | 24.3 | ||||||||
Total provision (benefit) for income taxes from continuing operations | $ | 3.6 | $ | (3.8 | ) | $ | 65.3 | |||||
Tax Rate Reconciliation
The differences between income taxes expected at the U.S. federal statutory income tax rate of 35% and income taxes provided for continuing operations are as set forth below:
Fiscal Years Ended | |||||||||||
July 30, 2016 | July 25, 2015 | July 26, 2014 | |||||||||
(millions) | |||||||||||
(Benefit) provision for income taxes from continuing operations at the U.S. federal statutory rate | $ | (2.9 | ) | $ | (84.3 | ) | $ | 71.2 | |||
Increase (decrease) due to: | |||||||||||
State and local income taxes, net of federal benefit | 2.4 | 4.1 | 8.8 | ||||||||
Tax benefit related to deferred compensation | — | (13.7 | ) | — | |||||||
Goodwill impairment | — | 91.6 | — | ||||||||
Net change relating to uncertain income tax benefits | 3.3 | (0.7 | ) | (2.3 | ) | ||||||
Indefinitely reinvested foreign earnings | 0.1 | 1.7 | (11.6 | ) | |||||||
Other – net | 0.7 | (2.5 | ) | (0.8 | ) | ||||||
Total provision (benefit) for income taxes from continuing operations | $ | 3.6 | $ | (3.8 | ) | $ | 65.3 | ||||
The Company recorded a tax provision in Fiscal 2016 despite the net loss for the period primarily due to state and local taxes and certain expenses which are non-deductible for income tax purposes. The Company's effective tax rate for Fiscal 2015 is lower than the statutory rate principally as a result of a goodwill impairment loss of $261.7 million as discussed in Note 6, which is treated as a permanent non-deductible item, offset in part by a tax benefit related to previously deferred compensation of approximately $35 million, which became fully deductible in Fiscal 2015 under the terms of the retirement agreement for the former President and CEO of Justice.
Tax Incentives
In connection with the Company’s relocation of its dressbarn and corporate offices to New Jersey, as well as the expansion of its distribution centers in Ohio and Indiana, the Company was approved for various state and local tax incentives. In order to receive these incentives, the Company will generally need to meet certain minimum employment or expenditure commitments, as well as comply with periodic reporting requirements. These incentives, estimated to total approximately $60 million, are expected to be recognized over a 10-15 year period which began in Fiscal 2015. Approximately $2.9 million was recognized in Fiscal 2016 and $2.0 million in Fiscal 2015.
F-25
ASCENA RETAIL GROUP, INC.
NOTES TO CONSOLIDATED FINANCIAL STATEMENTS - (Continued)
Deferred Taxes
Significant components of the Company's net deferred tax assets (liabilities) are as follows:
July 30, 2016 (a) | July 25, 2015 | |||||||
Deferred tax assets: | (millions) | |||||||
Inventories | $ | 31.4 | $ | 18.7 | ||||
Tax credits and net operating loss carryforwards | 38.3 | 18.7 | ||||||
Accrued payroll and benefits | 91.5 | 78.3 | ||||||
Legal reserve | — | 21.0 | ||||||
Share-based compensation | 24.8 | 23.7 | ||||||
Straight-line rent | 57.3 | 45.7 | ||||||
Federal benefit of uncertain tax positions | 19.4 | 14.7 | ||||||
Other | 37.4 | 19.2 | ||||||
Total deferred tax assets | 300.1 | 240.0 | ||||||
Deferred tax liabilities: | ||||||||
Depreciation | 148.9 | 113.0 | ||||||
Amortization | 512.8 | 168.6 | ||||||
Foreign unremitted earnings | 40.1 | 32.8 | ||||||
Other | 22.7 | 14.0 | ||||||
Total deferred tax liabilities | 724.5 | 328.4 | ||||||
Valuation allowance | (12.9 | ) | (4.9 | ) | ||||
Net deferred tax liabilities | $ | (437.3 | ) | $ | (93.3 | ) | ||
_______
(a) $4.9 million of deferred tax assets are included within Other assets.
As of July 30, 2016, we have not provided deferred U.S. income taxes on approximately $42.1 million of undistributed earnings from non-U.S. subsidiaries, as these earnings are indefinitely reinvested. If the Company elects to distribute these foreign earnings in the future, they could be subject to additional income taxes. Determination of the amount of any unrecognized deferred income tax liability is not practicable because such liability, if any, is dependent on circumstances existing if and when remittance occurs.
Net Operating Loss Carry Forwards
As of July 30, 2016, the Company had U.S. Federal net operating loss carryforwards of $40.3 million and state net operating loss carryforwards of $120.1 million that are available to offset future U.S. Federal and state taxable income. The U.S. Federal net operating losses have a twenty-year carryforward period, and expire in Fiscal 2036. The state net operating losses have carryforward periods of five to twenty years, with varying expiration dates and amounts as follows: $21.5 million in one to five years, $15.2 million in six to ten years, $34.7 million in eleven to fifteen years and $48.7 million in sixteen to twenty years.
F-26
ASCENA RETAIL GROUP, INC.
NOTES TO CONSOLIDATED FINANCIAL STATEMENTS - (Continued)
Uncertain Income Tax Benefits
Reconciliation of Liabilities
A reconciliation of the beginning and ending amounts of unrecognized tax benefits, excluding interest and penalties, for each fiscal year is presented below:
Fiscal Years Ended | ||||||||||||
July 30, 2016 | July 25, 2015 | July 26, 2014 | ||||||||||
(millions) | ||||||||||||
Unrecognized tax benefit beginning balance | $ | 34.1 | $ | 29.9 | $ | 31.2 | ||||||
Additions related to the ANN Acquisition | 9.6 | — | — | |||||||||
Additions related to current period tax positions | 2.2 | 1.6 | 1.5 | |||||||||
Additions related to tax positions in prior years | 1.0 | 6.7 | 4.3 | |||||||||
Reductions related to prior period tax positions | (3.0 | ) | (3.2 | ) | — | |||||||
Reductions related to settlements with taxing authorities | — | (0.3 | ) | (1.5 | ) | |||||||
Reductions related to expiration of statute of limitations | (0.7 | ) | (0.6 | ) | (5.6 | ) | ||||||
Unrecognized tax benefit ending balance | $ | 43.2 | $ | 34.1 | $ | 29.9 | ||||||
The Company classifies interest and penalties related to unrecognized tax benefits as part of its provision for income taxes. A reconciliation of the beginning and ending amounts of accrued interest and penalties related to unrecognized tax benefits for each fiscal year is presented below:
Fiscal Years Ended | ||||||||||||
July 30, 2016 | July 25, 2015 | July 26, 2014 | ||||||||||
(millions) | ||||||||||||
Accrued interest and penalties beginning balance | $ | 11.5 | $ | 13.8 | $ | 16.5 | ||||||
Additions related to the ANN Acquisition | 4.3 | — | — | |||||||||
Additions (reductions) charged to expense, net | 1.4 | (2.3 | ) | (2.7 | ) | |||||||
Accrued interest and penalties ending balance | $ | 17.2 | $ | 11.5 | $ | 13.8 | ||||||
The Company’s liability for unrecognized tax benefits (including accrued interest and penalties), which is primarily included in Other non-current liabilities in the accompanying consolidated balance sheets, was $56.8 million as of July 30, 2016 and $40.7 million as of July 25, 2015.
Future Changes in Unrecognized Tax Benefits
The amount of unrecognized tax benefits relating to the Company's tax positions is subject to change based on future events including, but not limited to, the settlements of ongoing audits and/or the expiration of applicable statutes of limitations. Although the outcomes and timing of such events are highly uncertain, the Company anticipates that the balance of the liability for unrecognized tax benefits will decrease by approximately $3.1 million during the next twelve months. However, changes in the occurrence, expected outcomes and timing of those events could cause the Company’s current estimate to change materially in the future. The Company’s portion of gross unrecognized tax benefits that would affect its effective tax rate, including interest and penalties, is $36.8 million.
The Company files tax returns in the U.S. federal and various state, local and foreign jurisdictions. With few exceptions, the Company is no longer subject to examinations by the relevant tax authorities for years prior to Fiscal 2009.
F-27
ASCENA RETAIL GROUP, INC.
NOTES TO CONSOLIDATED FINANCIAL STATEMENTS - (Continued)
14. Commitments and Contingencies
Lease Commitments
The Company leases all of its retail stores. Certain leases provide for additional rents based on percentages of net sales, charges for real estate taxes, insurance and other occupancy costs. Store leases generally have an initial term of approximately ten years with one or more five-year options to extend the lease. Some of these leases have provisions for rent escalations during the initial term.
The Company’s operating lease obligations represent future minimum lease payments under non-cancelable operating leases as of July 30, 2016. The minimum lease payments do not include common area maintenance ("CAM") charges or real estate taxes, which are also required contractual obligations under the operating leases. In the majority of the Company’s operating leases, CAM charges are not fixed and can fluctuate from year to year.
A summary of occupancy costs follows: | Fiscal Years Ended | |||||||||||
July 30, 2016 | July 25, 2015 | July 26, 2014 | ||||||||||
(millions) | ||||||||||||
Base rentals | $ | 608.1 | $ | 404.4 | $ | 395.5 | ||||||
Percentage rentals | 33.7 | 20.5 | 23.2 | |||||||||
Other occupancy costs, primarily CAM and real estate taxes | 210.5 | 143.6 | 133.5 | |||||||||
Total | $ | 852.3 | $ | 568.5 | $ | 552.2 | ||||||
The following is a schedule of future minimum rentals under non-cancelable operating leases as of July 30, 2016:
Fiscal Years | Minimum Operating Lease Payments (a) (b) | ||
(millions) | |||
2017 | $ | 613.3 | |
2018 | 531.9 | ||
2019 | 447.3 | ||
2020 | 388.8 | ||
2021 | 324.0 | ||
Thereafter | 745.8 | ||
Total future minimum rentals | $ | 3,051.1 | |
(a) Net of sublease income, which was not significant in any period.
(b) Although such amounts are generally non-cancelable, certain leases are cancelable if specified sales levels are not achieved or co-tenancy requirements are not being satisfied. All future minimum rentals under such leases have been included in the above table.
Employment Agreements
The Company has employment agreements with certain executives in the normal course of business which provide for compensation and certain other benefits. These agreements also provide for severance payments under certain circumstances.
Other Commitments
The Company enters into various cancelable and non-cancelable commitments during the year. Typically, those commitments are for less than a year in duration and are principally focused on the construction of new retail stores and the procurement of inventory. The Company normally does not maintain any long-term or exclusive commitments or arrangements to purchase merchandise from any single supplier. Preliminary commitments with the Company’s private-label merchandise vendors typically are made five to seven months in advance of planned receipt date. A portion of these merchandise purchase commitments are cancelable up to 30 days prior to the vendor’s scheduled shipment date.
F-28
ASCENA RETAIL GROUP, INC.
NOTES TO CONSOLIDATED FINANCIAL STATEMENTS - (Continued)
In addition, the Company has $25.9 million of outstanding letters of credit as of July 30, 2016.
Legal Matters
Justice Pricing Lawsuits
The Company is a defendant in a number of class action lawsuits that allege, among other claims, that Justice’s promotional practices violated state comparative pricing laws in connection with advertisements promoting a 40% discount.
Mehigan v. Ascena Retail Group, Inc. and Tween Brands, Inc.
On February 12, 2015, Melinda Mehigan and Fonda Kubiak, both consumers, filed a purported class action proceeding (the “Mehigan case”) against Ascena Retail Group, Inc. and Tween Brands, Inc. (doing business as “Justice”) in the United States District Court for the Eastern District of Pennsylvania, on behalf of themselves and all similarly situated consumers who, in the case of Ms. Mehigan in the State of New Jersey, and in the case of Ms. Kubiak in the State of New York, made purchases at Justice from 2009 to 2015 (the “Alleged Class Period”). The lawsuit alleges that Justice violated state comparative pricing laws in connection with advertisements promoting a 40% discount. The plaintiffs further allege false advertising, violation of state consumer protection statutes, breach of contract, breach of express warranty and unfair benefit to Justice. The plaintiffs seek to stop Justice’s allegedly unlawful practice and obtain damages for Justice’s customers in the named states. They also seek interest and legal fees.
On February 17, 2015, the complaint in the Mehigan case was amended to add five more named individual plaintiffs and to add the same allegations against Justice in the States of California, Florida, Illinois and Texas.
On April 8, 2015, the complaint in the Mehigan case was amended a second time seeking to make the case a nationwide purported class action lawsuit. As amended, the case covers Justice customers in 47 states. The excluded states are Hawaii, Alaska and Ohio. During the Alleged Class Period, Justice did not operate any stores in Hawaii or Alaska. A similar class action lawsuit making substantially the same allegations as the Mehigan case was settled in December 2014 in Ohio.
Cowhey v. Tween Brands, Inc.
On February 17, 2015, Carol Cowhey, a consumer, filed a purported class action proceeding (the “Cowhey case”) against Ascena Retail Group, Inc. and Tween Brands, Inc. (doing business as “Justice”) in the Court of Common Pleas in Philadelphia, Pennsylvania on behalf of herself and all other similarly situated consumers who in the State of Pennsylvania made purchases at Justice during the Alleged Class Period. The allegations in the Cowhey case are substantially the same as those in the Mehigan case. The relief sought in the Cowhey case focuses on remedies available under Pennsylvania law, which the plaintiff claims include treble damages. On March 19, 2015, Justice removed the Cowhey case to federal court in the United States District Court for the Eastern District of Pennsylvania.
Consolidation of Mehigan and Cowhey Cases (Rougvie)
On April 8, 2015, the United States District Court for the Eastern District of Pennsylvania consolidated the Cowhey case and the Mehigan case. They are now consolidated for all pre-trial purposes in the federal court in the Eastern District of Pennsylvania.
On June 2, 2015, the court held a Rule 16 Conference and issued a Scheduling Order and Settlement Conference Order. The Scheduling Order sets a fact and expert discovery deadline of December 4, 2015, with trial scheduled for early 2016. In light of the settlement described below, the trial will not go forward.
F-29
ASCENA RETAIL GROUP, INC.
NOTES TO CONSOLIDATED FINANCIAL STATEMENTS - (Continued)
Traynor-Lufkin v. Tween Brands, Inc.
On March 6, 2015, Katie Traynor-Lufkin and three other named plaintiffs, all consumers, filed a purported nationwide class action (the “Traynor-Lufkin case”) against Tween Brands, Inc. (doing business as “Justice”) in the Court of Common Pleas in Cuyahoga County, Ohio. The Traynor-Lufkin case purports to include a class of Justice customers in 47 states. As with the Mehigan case, the Traynor-Lufkin case excludes Hawaii, Alaska and Ohio. During the Alleged Class Period, Justice did not operate any stores in Hawaii or Alaska. In December 2014, Justice settled a similar class action lawsuit in the State of Ohio. The allegations and damages sought in the Traynor-Lufkin case are substantially the same as those in the Mehigan case.
Removal of Traynor-Lufkin Case and Motion to Transfer
On April 7, 2015, Justice removed the Traynor-Lufkin case to the United States District Court for the Northern District of Ohio. On April 13, 2015, Justice filed a motion under 28 U.S.C. § 1408(a) to transfer the Traynor-Lufkin case to the United States District Court for the Eastern District of Pennsylvania. In seeking the transfer, Justice argued that there were already two consolidated actions pending in the Eastern District of Pennsylvania and that a forum in Ohio is not appropriate because no Ohio consumers are involved in the case. The Eastern District of Pennsylvania was advised that the Traynor-Lufkin case was related to Rougvie, and the case was reassigned on May 27, 2015.
Consolidation of Traynor-Lufkin and Rougvie case
On June 18, 2015, the United States District Court for the Eastern District of Pennsylvania consolidated the Cowhey case and the Mehigan case (collectively referred to as Rougvie) and the Traynor-Lufkin matters. The Scheduling and Settlement Conference Orders issued in the Rougvie matter are applicable to all parties in the Traynor-Lufkin and Rougvie cases, including the Company and all of the named plaintiffs in the consolidated actions.
Metoyer v. Tween Brands, Inc.
On May 29, 2015, Theresa Metoyer, a consumer, filed a purported class action against Tween Brands, Inc. in the United States District Court for the Central Division of California, Eastern Division, on behalf of herself and all other similarly situated consumers who made purchases from Justice stores located in California during the four years preceding the filing of the lawsuit. The allegations in the Metoyer case are substantially the same as those in the other Justice pricing lawsuits described above. The relief sought by plaintiff is substantially the same as that sought in the other lawsuits.
On June 18, 2015, Tween Brands, Inc. filed its Answer to the Complaint. The Court issued an Order setting a scheduling conference for August 24, 2015. On August 21, 2015, the Court issued an Order canceling the August 24 conference, directing the parties to file a joint status report, and indicating that the Court would consider resetting a status conference after review of the joint status report. On November 14, 2015, the Court granted the Company’s motion to stay this case in light of the broader settlement described below.
Gallagher v. Tween Brands, Inc.
On June 4, 2015, Robert Gallagher, a consumer, filed a lawsuit against Tween Brands, Inc. in the United States District Court for the Eastern District of Missouri, Eastern Division. This lawsuit includes both national and Missouri purported class actions. The plaintiff seeks monetary damages and reasonable costs and attorneys' fees. On August 27, 2015, the Company filed its Answer to the Complaint. On October 15, 2015, the Court granted the Company’s motion to stay this case in light of the broader settlement described below.
Kallay v. Tween Brands, Inc.
On June 5, 2015, Andrea Kallay, a consumer, filed a purported class action against Tween Brands, Inc. in the United States District Court for the Southern District of Ohio, Eastern Division. This lawsuit includes both national and Wisconsin class actions. The plaintiff seeks monetary damages and reasonable costs and attorneys' fees. On August 28, 2015, the Company filed its Answer to the Complaint. On October 29, 2015, the Court granted the Company’s motion to stay this case in light of the broader settlement described below.
F-30
ASCENA RETAIL GROUP, INC.
NOTES TO CONSOLIDATED FINANCIAL STATEMENTS - (Continued)
Joiner v. Tween Brands, Inc.
On June 1, 2015, Rebecca Joiner, a consumer, filed a purported class action against Tween Brands, Inc. in the United States District Court for the District of Maryland. This lawsuit includes putative national and Maryland classes. The plaintiff seeks monetary damages and reasonable costs and attorney’s fees. On August 28, 2015, the Company filed its Answer to the Complaint. On December 1, 2015, the Court granted the Company’s motion to stay this case in light of the broader settlement described below.
Loor v. Tween Brands, Inc.
On June 11, 2015, Yanetsy Loor, a consumer, filed a purported class action against Tween Brands, Inc. in the United States District Court for the Middle District of Florida. This lawsuit includes putative national and Florida classes. The plaintiff seeks monetary damages and reasonable costs and attorney’s fees. On August 21, 2015, the Company filed its Answer to the Complaint. On December 1, 2015, the Court granted the Company’s motion to stay this case in light of the broader settlement described below.
Legendre v. Tween Brands, Inc.
On June 17, 2015, David Legendre, a consumer, filed a purported class action against Tween Brands, Inc. in the United States District Court for the District of New Jersey. This lawsuit includes both national and New Jersey class actions. The plaintiff seeks monetary damages and reasonable costs and attorney’s fees. On August 28, 2015, the Company filed its Answer to the Complaint. On December 11, 2015, the Court granted the Company’s motion to stay this case in light of the broader settlement described below.
In re Tween Brands, Inc., Marketing & Sales Practices Litigation. MDL No. 2646
On June 1, 2015, Andrea Kallay, the plaintiff in Kallay v. Tween Brands, Inc., filed a Motion to Transfer to the United State District Court for the Southern District of Ohio and for creation of a Multidistrict Litigation (“MDL”) proceeding styled In re: Tween Brands, Inc., Marketing and Sales Practices Litigation, MDL 2646. Responses to the Motion to Transfer were submitted on June 23, 2015. The majority of plaintiffs in the above listed cases filed response motions in support of transfer and consolidation to the Southern District of Ohio. The Rougvie plaintiffs filed a response motion opposing transfer to the Southern District of Ohio and arguing for transfer to the Eastern District of Pennsylvania. Justice filed a Response in Opposition, supporting transfer and consolidation but arguing that the proper venue for the MDL is the Eastern District of Pennsylvania. The JPML held a hearing on July 30, 2015 on the Motion to Transfer and subsequently denied the Motion to Transfer in an Order issued on August 7, 2015.
Settlement Agreed to at July 2, 2015 Mediation and Final Approval
In July 2015, an agreement in principle was reached with the plaintiffs in the Rougvie case to settle the lawsuit on a class basis with all Justice customers who made purchases between January 1, 2012 and February 28, 2015 for approximately $51 million, including payments to members of the class, payment of legal fees and expenses of settlement administration (the "Settlement Agreement"). As such, the Company established a reserve for approximately $51 million during Fiscal 2015.
The proposed Settlement Agreement was filed with the United States District Court for the Eastern District of Pennsylvania for preliminary approval on September 24, 2015, and received preliminary approval by the court on October 27, 2015. The Company paid approximately $51 million representing the agreed settlement amount into an escrow account on November 16, 2015. Formal notice of settlement was sent to the class members on December 1, 2015. The final approval hearing was held on May 20, 2016.
On July 29, 2016, the Court granted the parties’ joint motion for final approval of settlement and dismissed the case with prejudice. In reaching this conclusion, the Court rejected virtually all of the objections to the settlement that had been raised, but did reduce the amount of attorneys’ fees to be paid to plaintiffs’ counsel, which will not affect the overall amount of the settlement. The Court’s decision has been appealed to the United States Court of Appeals for the Third Circuit. Once there is a final non-appealable approval of the Settlement Agreement, it will resolve all claims in all of the outstanding class actions on behalf of customers who made purchases between January 1, 2012 and February 28, 2015.
Recently, potential claims related to purchases made in 2010 and 2011 have been raised, and it is possible that individual class members who excluded themselves from the settlement may seek to pursue their own individual or class claims not subject to the broader settlement. The Company believes it has strong defenses to any such claims and is prepared to defend against them. The Company believes that the liability associated with any such cases would not be material. If the matters described herein do not
F-31
ASCENA RETAIL GROUP, INC.
NOTES TO CONSOLIDATED FINANCIAL STATEMENTS - (Continued)
occur and the pricing lawsuits are not finally resolved, the ultimate resolution of these matters may or may not result in an additional material loss, which cannot be reasonably estimated at this time.
Steven Linares v. ANN INC.
On December 29, 2015, plaintiff, Steven Linares, a former sales associate, filed a class action complaint on behalf of all sales leads, sales associates and stock associates working in California from December 29, 2011 through the present, in Los Angeles County Superior Court. Plaintiff alleges on behalf of the class that ANN did not properly provide overtime pay, minimum wage pay, meal and rest breaks, and waiting time pay, among other claims under the California Business and Professions Code and California Labor Code. The case is in its early stages and formal fact discovery has not yet begun, therefore, we are not able to estimate a range of reasonably possible losses. Mediation is currently scheduled for September 20, 2016.
Other litigation
The Company is involved in routine litigation arising in the normal course of business. In the opinion of management, such litigation is not expected to have a material adverse effect on the Company's consolidated financial statements.
15. Equity
Capital Stock
The Company’s capital stock consists of one class of common stock and one class of preferred stock. There are 360 million shares, of common stock authorized to be issued and 100,000 shares of preferred stock authorized to be issued. There are no shares of preferred stock issued or outstanding.
Common Stock Repurchase Program
In December 2015, the Company’s Board of Directors authorized a $200 million share repurchase program (the “2016 Stock Repurchase Program”), which replaced and canceled the share repurchase program originally announced in Fiscal 2010, as amended in Fiscal 2011, which had a remaining availability of $89.9 million. Under the 2016 Stock Repurchase Program, purchases of shares of common stock may be made at the Company’s discretion from time to time, subject to overall business and market conditions. Currently, share repurchases in excess of $100 million are subject to certain restrictions under the terms of the Company's Borrowing Agreements, as more fully described in Note 11. Repurchased shares are retired and treated as authorized but unissued. The excess of repurchase price over the par value of common stock for the repurchased shares is charged entirely to retained earnings.
Cumulative repurchases under the 2016 Stock Repurchase Program total 2.1 million shares of common stock, all of which were repurchased at an aggregate cost of $18.6 million in Fiscal 2016. No shares of common stock were repurchased in Fiscal 2015 and Fiscal 2014. The remaining availability under the 2016 Stock Repurchase Program was approximately $181.4 million at July 30, 2016.
Net (Loss) Income Per Common Share
Basic net (loss) income per common share is computed by dividing the net (loss) income applicable to common shares after preferred dividend requirements, if any, by the weighted-average number of common shares outstanding during the period. Diluted net (loss) income per common share adjusts basic net (loss) income per common share for the effects of outstanding stock options, restricted stock, restricted stock units and any other potentially dilutive financial instruments, only in the periods in which such effect is dilutive under the treasury stock method.
F-32
ASCENA RETAIL GROUP, INC.
NOTES TO CONSOLIDATED FINANCIAL STATEMENTS - (Continued)
The weighted-average number of common shares outstanding used to calculate basic net (loss) income per common share is reconciled to those shares used in calculating diluted net (loss) income per common share as follows:
Fiscal Years Ended | |||||||||
July 30, 2016 (a) | July 25, 2015 (a) | July 26, 2014 | |||||||
(millions) | |||||||||
Basic | 192.2 | 162.6 | 160.6 | ||||||
Dilutive effect of stock options, restricted stock and restricted stock units | — | — | 4.5 | ||||||
Diluted shares | 192.2 | 162.6 | 165.1 | ||||||
(a) There was no dilutive effect of stock options, restricted stock and restricted stock units in Fiscal 2016 and Fiscal 2015 as the impact of these items was anti-dilutive because of the Company's net loss incurred during the years.
Options to purchase shares of common stock at an exercise price greater than the average market price of the common stock during the reporting period are anti-dilutive, and therefore not included in the computation of diluted net (loss) income per common share. In addition, the Company has outstanding restricted stock units that are issuable only upon the achievement of certain service conditions. Any performance or market-based restricted stock units outstanding are included in the computation of diluted shares only to the extent the underlying performance or market conditions (a) are satisfied prior to the end of the reporting period or (b) would be satisfied if the end of the reporting period was the end of the related contingency period, and the result would be dilutive under the treasury stock method. Potentially dilutive instruments are not included in the computation of net loss per share for Fiscal 2016 and Fiscal 2015 as the impact of those items would have been anti-dilutive due to the net loss incurred for these periods. For Fiscal 2016, Fiscal 2015 and Fiscal 2014, respectively, 17.1 million, 15.8 million and 5.6 million shares of anti-dilutive options and restricted stock units were excluded from the diluted share calculations.
Dividends
The Company has never declared or paid cash dividends on its common stock. However, payment of dividends is within the discretion of, and are payable when declared by, the Company’s Board of Directors. Additionally, payments of dividends are limited by the Company's borrowing arrangements as described in Note 11.
16. Stock-Based Compensation
Omnibus Incentive Plan
In November 2015, the Board of Directors approved the amendment and restatement of the Company’s 2010 Stock Incentive Plan, as amended in December 2012 (the "2010 Stock Incentive Plan"). The amended and restated 2010 Stock Incentive Plan (the “2016 Omnibus Incentive Plan”) was approved by the Company’s shareholders and became effective on December 10, 2015. The 2010 Stock Incentive Plan provided for granting of either incentive stock options or non-qualified options to purchase shares of common stock, as well as the award of shares of restricted stock and other stock awards (including restricted stock units). The 2016 Omnibus Incentive Plan generally incorporates the provisions of the 2010 Stock Incentive Plan and includes certain changes to (i) increase the aggregate number of shares that may be issued under the plan by an additional 19.5 million shares to 70.5 million, (ii) add the ability to grant performance-based cash incentive awards, (iii) retain the ability to grant performance-based stock awards for a period of five years and (iv) extend the term until November 2025.
As of July 30, 2016, there were approximately 23.6 million shares remaining under the 2016 Omnibus Incentive Plan available for future grants. The Company issues new shares of common stock when stock option awards are exercised and restricted stock units vest.
F-33
ASCENA RETAIL GROUP, INC.
NOTES TO CONSOLIDATED FINANCIAL STATEMENTS - (Continued)
Impact on Results
A summary of the total compensation expense and associated income tax benefit recognized related to stock-based compensation arrangements is as follows:
Fiscal Years Ended | ||||||||||||
July 30, 2016 | July 25, 2015 | July 26, 2014 | ||||||||||
(millions) | ||||||||||||
Compensation expense | $ | 26.2 | $ | 18.2 | $ | 30.6 | ||||||
Income tax benefit | $ | (10.1 | ) | $ | (6.8 | ) | $ | (11.5 | ) | |||
Stock Options
Stock option awards outstanding under the Company’s current plans have been granted at exercise prices that are equal to the market value of its common stock on the date of grant. Such options generally vest over a period of three, four or five years and expire at either seven or ten years after the grant date. The Company recognizes compensation expense ratably over the vesting period, net of estimated forfeitures. The Company uses the Black-Scholes option-pricing model to estimate the fair value of stock options granted, which requires the input of both subjective and objective assumptions as follows:
Expected Term — The estimate of expected term is based on the historical exercise behavior of grantees, as well as the contractual life of the option grants.
Expected Volatility — The expected volatility factor is based on the historical volatility of the Company's common stock for a period equal to the expected term of the stock option.
Risk-free Interest Rate — The risk-free interest rate is determined using the implied yield for a traded zero-coupon U.S. Treasury bond with a term equal to the expected term of the stock option.
Expected Dividend Yield — The expected dividend yield is based on the Company's historical practice of not paying dividends on its common stock.
The Company’s weighted-average assumptions used to estimate the fair value of stock options granted during the fiscal years presented were as follows:
Fiscal Years Ended | ||||||||||||
July 30, 2016 | July 25, 2015 | July 26, 2014 | ||||||||||
Expected term (years) | 3.1 | 3.9 | 3.9 | |||||||||
Expected volatility | 35.4 | % | 38.8 | % | 40.0 | % | ||||||
Risk-free interest rate | 1.5 | % | 1.8 | % | 1.5 | % | ||||||
Expected dividend yield | — | % | — | % | — | % | ||||||
Weighted-average grant date fair value | $ | 4.14 | $ | 4.97 | $ | 7.11 | ||||||
F-34
ASCENA RETAIL GROUP, INC.
NOTES TO CONSOLIDATED FINANCIAL STATEMENTS - (Continued)
A summary of the stock option activity under all plans during Fiscal 2016 is as follows:
Number of Shares | Weighted- Average Exercise Price | Weighted- Average Remaining Contractual Terms | Aggregate Intrinsic Value (a) | ||||||||||
(thousands) | (years) | (millions) | |||||||||||
Options outstanding – July 25, 2015 | 14,103.9 | $ | 14.13 | 5.1 | $ | 17.3 | |||||||
Granted | 3,556.3 | 12.89 | |||||||||||
Exercised | (1,305.2 | ) | 6.99 | ||||||||||
Canceled/Forfeited | (1,541.6 | ) | 15.39 | ||||||||||
Options outstanding – July 30, 2016 | 14,813.4 | $ | 14.33 | 4.8 | $ | 0.9 | |||||||
Options vested and expected to vest at July 30, 2016 (b) | 14,667.1 | $ | 14.34 | 4.8 | $ | 0.8 | |||||||
Options exercisable at July 30, 2016 | 8,202.4 | $ | 14.02 | 4.2 | $ | 0.7 | |||||||
______
(a) | The intrinsic value is the amount by which the market price at the end of the period of the underlying share of stock exceeds the exercise price of the stock option. |
(b) | The number of options expected to vest takes into consideration estimated expected forfeitures. |
As of July 30, 2016, there was $21.4 million of total unrecognized compensation cost related to non-vested options, which is expected to be recognized over a remaining weighted-average vesting period of 1.9 years. The total intrinsic value of options exercised during Fiscal 2016, Fiscal 2015 and Fiscal 2014 was approximately $7.3 million, $5.0 million and $17.1 million, respectively. The total fair value of options that vested during Fiscal 2016, Fiscal 2015 and Fiscal 2014, was approximately $13.7 million, $14.2 million and $14.1 million, respectively.
Restricted Equity Awards
The 2010 Stock Plan also allowed for the issuance of shares of restricted stock and restricted stock units (“RSUs”) with service-based, market-based and performance-based conditions (collectively, “Restricted Equity Awards”). In the first quarter of Fiscal 2016, the Compensation Committee of the Board of Directors (the "Compensation Committee") approved the cancellation of the Company's performance-based and market-based Restricted Equity Awards. As a result, the previously unrecognized expense related to the market-based Restricted Equity Awards was expensed in the first quarter of Fiscal 2016. In addition, the previously accrued expense related to the performance-based Restricted Equity Awards was derecognized during the first quarter of Fiscal 2016. Such amounts were de minimis and have been included within Selling, general and administrative expenses in the accompanying consolidated financial statements.
Under the 2016 Omnibus Incentive Plan, shares of Restricted Equity Awards are issuable with service-based, market-based or performance-based conditions. Any shares of Restricted Equity Awards issued are counted against the shares available for future grant limit as 2.3 shares for every one Restricted Equity Award granted. In general, if options are canceled for any reason or expire, the shares covered by such options again become available for grant. If a share of restricted stock or a RSU is forfeited for any reason, 2.3 shares become available for grant.
Service-based Restricted Equity Awards entitle the holder to receive unrestricted shares of common stock of the Company at the end of a vesting period, subject to the grantee’s continuing employment. Service-based Restricted Equity Awards generally vest over a three or four year period of time.
Performance-based Restricted Equity Awards also entitle the holder to receive shares of common stock of the Company at the end of a vesting period. However, such awards are subject to (a) the grantee’s continuing employment and (b) the Company’s achievement of certain performance goals over a pre-defined performance period. Performance-based Restricted Equity Awards generally vest at the completion of the performance period.
The fair values of both service-based and performance-based Restricted Equity Awards are based on the fair value of the Company’s unrestricted common stock at the date of grant. Compensation expense for both service-based and performance-based Restricted Equity Awards is recognized over the vesting period based on the grant-date fair values of the awards that are expected to vest
F-35
ASCENA RETAIL GROUP, INC.
NOTES TO CONSOLIDATED FINANCIAL STATEMENTS - (Continued)
based upon the service and performance-based conditions. As of July 30, 2016, there are no restricted stock or RSUs with performance-based conditions issued under the 2016 Omnibus Incentive Plan.
A summary of Restricted Equity Awards activity during Fiscal 2016 is as follows:
Service-based Restricted Equity Awards | Performance-based Restricted Equity Awards | Market-based Restricted Equity Awards | ||||||||||||||||||
Number of Shares | Weighted- Average Grant Date Fair Value Per Share | Number of Shares | Weighted- Average Grant Date Fair Value Per Share | Number of Shares | Weighted- Average Grant Date Fair Value Per Share | |||||||||||||||
(thousands) | (thousands) | (thousands) | ||||||||||||||||||
Nonvested at July 25, 2015 | 1,101.9 | $ | 16.13 | 449.1 | $ | 17.20 | 184.8 | $ | 16.84 | |||||||||||
Granted | 1,783.9 | 12.72 | — | — | — | — | ||||||||||||||
Vested | (420.2 | ) | 15.90 | — | — | — | — | |||||||||||||
Canceled/Forfeited | (206.8 | ) | 14.49 | (449.1 | ) | 17.20 | (184.8 | ) | 16.84 | |||||||||||
Nonvested at July 30, 2016 | 2,258.8 | $ | 13.62 | — | $ | — | — | $ | — | |||||||||||
Service-based Restricted Equity Awards | |||
Total unrecognized compensation expense at July 30, 2016 (millions) | $ | 15.8 | |
Weighted-average period expected to be recognized over (years) | 2.8 | ||
Additional information pertaining to Restricted Equity Awards activity is as follows:
Fiscal Years Ended | ||||||||||||
July 30, 2016 | July 25, 2015 | July 26, 2014 | ||||||||||
Service-based Restricted Equity Awards: | ||||||||||||
Weighted-average grant date fair value of awards granted | $ | 12.72 | $ | 13.96 | $ | 19.23 | ||||||
Total fair value of awards vested (millions) | 4.9 | 7.1 | 12.9 | |||||||||
Performance-based Restricted Equity Awards: | ||||||||||||
Weighted-average grant date fair value of awards granted | $ | — | $ | 13.75 | $ | 20.06 | ||||||
Total fair value of awards vested (millions) | — | 1.4 | 2.6 | |||||||||
Market-based Restricted Equity Awards: | ||||||||||||
Weighted-average grant date fair value of awards granted | $ | — | $ | 13.34 | $ | 19.46 | ||||||
Total fair value of awards vested (millions) | — | — | 0.6 | |||||||||
Cash-Settled Long-Term Incentive Plan Awards
Cash-Settled LTIP Awards were stock-settled awards that entitled the holder to a cash payment equal to the value of the number of shares of the Company’s common stock earned at the end of a three-year performance period based on the Company’s achievement of certain performance goals over that three-year performance period.
In the first quarter of Fiscal 2016, the Compensation Committee approved the cancellation of the Company's Cash-Settled LTIP Awards. As a result, an aggregate of approximately 1.3 million awards were canceled and previously accrued liabilities of $1.7 million were derecognized and recorded as a reduction of Selling, general and administrative expenses in the accompanying consolidated financial statements.
F-36
ASCENA RETAIL GROUP, INC.
NOTES TO CONSOLIDATED FINANCIAL STATEMENTS - (Continued)
17. Employee Benefit Plans
Cash Long-Term Incentive Plans
During Fiscal 2016, the Company created a long-term cash incentive program ("Cash LTIP") for vice presidents and above under the 2016 Omnibus Incentive Plan. The Cash LTIP entitles the holder to a cash payment equal to a predetermined target amount earned at the end of a performance period and is subject to (a) the grantee’s continuing employment and (b) the Company’s achievement of certain performance goals over a one, two or three-year performance period. Compensation expense for the Cash LTIP is recognized over the related performance periods based on the expected achievement of the performance goals.
During Fiscal 2016, the Company recognized $20.1 million in compensation expense under the Cash LTIP which was recorded within Selling, general and administrative expenses in the accompanying consolidated financial statements. As of July 30, 2016, there was $21.2 million of expected unrecognized compensation cost related to the Cash LTIP, which is expected to be recognized over a remaining weighted-average vesting period of 1.8 years. As of July 30, 2016, the liability for Cash LTIP Awards was $20.1 million, of which $10.5 million was classified within Accrued expenses and other current liabilities and $9.6 million was classified within Other non-current liabilities in the accompanying consolidated balance sheets.
Retirement Savings Plan (401(k))
The Company currently sponsors a defined contribution retirement savings plan (the "401(k)" plan). This plan covers substantially all eligible U.S. employees. Participating employees may contribute a percentage of their annual compensation, subject to certain limitations under the U.S Internal Revenue Code. The Company's contribution is made in accordance with a matching formula established prior to the beginning of each plan year. Effective with the plan year starting January 1, 2015, the Company will contribute a matching amount based on eligible salary contributed by an employee equal to 100% of the first 3% contributed and 50% of the next 2% contributed. Under the terms of the plan, such matching contributions are immediately vested. The Company incurred expenses relating to its contributions to and administration of its 401(k) plan of $18.0 million in Fiscal 2016, $8.8 million in Fiscal 2015 and $5.2 million in Fiscal 2014.
Defined Benefit Plan
In connection with the ANN Acquisition, the Company assumed ANN's pension plan which is frozen and for which the accumulated benefit obligation exceeded the plan's assets by approximately $6 million as of the acquisition date. In Fiscal 2016, the Company made a decision, and has begun to, terminate the plan. The trust is anticipated to be fully liquidated by the end of calendar 2016. The Company recorded approximately $6 million, net of an income tax benefit of approximately $2 million within Accumulated other comprehensive loss during Fiscal 2016 mainly due to the change in discount rate during the period. As of July 30, 2016, the accumulated benefit obligation exceeded the plan's assets by approximately $12 million.
Executive Retirement Plan
The Company sponsors an Executive Retirement Plan (the “ERP Plan”) for certain officers and key executives. The ERP Plan is a non-qualified deferred compensation plan. The purpose of the ERP Plan is to attract and retain a select group of management and to provide them with an opportunity to defer compensation on a pretax basis above U.S. Internal Revenue Service limitations. ERP Plan balances cannot be rolled over to another qualified plan or IRA upon distribution. Unlike a qualified plan, the Company is not required to pre-fund the benefits payable under the ERP Plan.
ERP Plan participants can contribute up to 50% of base salary and 75% of bonuses, before federal and state taxes are calculated. The Company makes a matching contribution to the ERP Plan in the amount of 100% on the first 1% of base salary and bonus salary deferred up to $265,000. The Company makes an additional matching contribution to the ERP Plan in the amount of 100% on the first 5% of base salary and bonus salary deferred in excess of $265,000. Plan Employees vest immediately in their voluntary deferrals and are incrementally vested in their employer matching contributions over a five year vesting period after which they are 100% vested. The Company incurred expenses related to its matching contributions of approximately $1.9 million in Fiscal 2016, $2.1 million in Fiscal 2015 and $3.4 million in Fiscal 2014 relating to the ERP Plan. In addition, as the ERP Plan is unfunded by the Company, the Company is also required to pay an investment return to participating employees on all account balances in the ERP Plan based on 27 reference investment fund elections offered to participating employees. As a result, the Company’s obligations under the ERP Plan are subject to market appreciation and depreciation, which resulted in expense of $1.4 million in Fiscal 2016, $3.3 million in Fiscal 2015 and $7.2 million in Fiscal 2014. The Company’s obligations under the ERP Plan, including
F-37
ASCENA RETAIL GROUP, INC.
NOTES TO CONSOLIDATED FINANCIAL STATEMENTS - (Continued)
employee compensation deferrals, matching employer contributions and investment returns on account balances, were $75.4 million as of July 30, 2016 and $70.7 million as of July 25, 2015. As of July 30, 2016, $4.5 million was classified within Accrued expenses and other current liabilities and $70.9 million was classified within Other non-current liabilities in the accompanying consolidated balance sheets. As of July 25, 2015, $3.8 million was classified within Accrued expenses and other current liabilities and $66.9 million was classified within Other non-current liabilities in the accompanying consolidated balance sheets.
Employee Stock Purchase Plan
The Company also sponsors an Employee Stock Purchase Plan, which allows employees to purchase shares of the Company’s common stock during each quarterly offering period at a 15% discount through payroll deductions. Expenses incurred during Fiscal 2016, Fiscal 2015 and Fiscal 2014 relating to this plan were de minimis.
18. Segments
The Company’s segment reporting structure reflects an approach designed to optimize the operational coordination and resource allocation of its businesses across multiple functional areas including specialty retail, ecommerce and licensing. The six reportable segments described below represent the Company’s activities for which separate financial information is available and utilized on a regular basis by the Company’s executive team to evaluate performance and allocate resources. In identifying reportable segments and disclosure of product offerings, the Company considers economic characteristics, as well as products, customers, sales growth potential and long-term profitability. As such, the Company reports its operations in six reportable segments as follows:
• | ANN segment – consists primarily of the specialty retail, outlet and ecommerce operations of the Ann Taylor and LOFT brands. |
• | Justice segment – consists of the specialty retail, outlet, ecommerce and licensing operations of the Justice brand. |
• | Lane Bryant segment – consists of the specialty retail, outlet and ecommerce operations of the Lane Bryant brand and its Cacique intimates label. |
• | maurices segment – consists of the specialty retail, outlet and ecommerce operations of the maurices brand. |
• | dressbarn segment – consists of the specialty retail, outlet and ecommerce operations of the dressbarn brand. |
• | Catherines segment – consists of the specialty retail and ecommerce operations of the Catherines brand. |
The accounting policies of the Company’s reporting segments are consistent with those described in Notes 3 and 4. All intercompany revenues are eliminated in consolidation. Corporate overhead expenses are allocated to the segments based upon specific usage or other reasonable allocation methods.
F-38
ASCENA RETAIL GROUP, INC.
NOTES TO CONSOLIDATED FINANCIAL STATEMENTS - (Continued)
Net sales and operating income (loss) for each segment are as follows:
Fiscal Years Ended | ||||||||||||
July 30, 2016 | July 25, 2015 | July 26, 2014 | ||||||||||
Net sales: | (millions) | |||||||||||
ANN (a) | $ | 2,330.9 | $ | — | $ | — | ||||||
Justice | 1,106.3 | 1,276.8 | 1,384.3 | |||||||||
Lane Bryant | 1,130.3 | 1,095.9 | 1,080.0 | |||||||||
maurices | 1,101.3 | 1,060.6 | 971.4 | |||||||||
dressbarn | 993.3 | 1,023.6 | 1,022.5 | |||||||||
Catherines | 333.3 | 346.0 | 332.4 | |||||||||
Total net sales | $ | 6,995.4 | $ | 4,802.9 | $ | 4,790.6 | ||||||
Operating income (loss): | ||||||||||||
ANN (a)(b) | $ | 13.3 | $ | — | $ | — | ||||||
Justice | 29.0 | (62.8 | ) | 99.3 | ||||||||
Lane Bryant | 20.6 | (308.0 | ) | (4.3 | ) | |||||||
maurices | 105.6 | 125.9 | 86.0 | |||||||||
dressbarn | (13.6 | ) | 10.7 | 39.4 | ||||||||
Catherines | 16.3 | 31.0 | 24.4 | |||||||||
Unallocated acquisition and integration expenses | (77.4 | ) | (31.7 | ) | (34.0 | ) | ||||||
Total operating income (loss) | $ | 93.8 | $ | (234.9 | ) | $ | 210.8 | |||||
_______
(a) | The results of ANN for the post-acquisition period from August 22, 2015 to July 30, 2016 are included within the Company's consolidated results of operations for Fiscal 2016. |
(b) | The results of ANN for Fiscal 2016 include approximately $165 million of non-cash expenses for purchase accounting adjustments, primarily related to the $127 million write-up of inventory to its fair value. |
Depreciation and amortization expense and capital expenditures for each segment are as follows:
Fiscal Years Ended | ||||||||||||
July 30, 2016 | July 25, 2015 | July 26, 2014 | ||||||||||
Depreciation and amortization expense: | (millions) | |||||||||||
ANN (a) | $ | 128.0 | $ | — | $ | — | ||||||
Justice | 72.1 | 70.2 | 60.7 | |||||||||
Lane Bryant | 43.0 | 46.8 | 45.6 | |||||||||
maurices | 51.3 | 43.3 | 39.5 | |||||||||
dressbarn | 55.2 | 50.7 | 40.5 | |||||||||
Catherines | 9.1 | 7.2 | 7.3 | |||||||||
Total depreciation and amortization expense | $ | 358.7 | $ | 218.2 | $ | 193.6 | ||||||
Capital expenditures (b): | ||||||||||||
ANN (a) | $ | 57.0 | $ | — | $ | — | ||||||
Justice | 19.8 | 51.5 | 93.5 | |||||||||
Lane Bryant | 30.5 | 47.9 | 53.5 | |||||||||
maurices | 70.4 | 56.3 | 54.0 | |||||||||
dressbarn | 20.2 | 47.6 | 93.5 | |||||||||
Catherines | 10.4 | 6.2 | 7.3 | |||||||||
Corporate (c) | 158.2 | 103.0 | 175.7 | |||||||||
Total capital expenditures | $ | 366.5 | $ | 312.5 | $ | 477.5 | ||||||
(a) The results of ANN for the post-acquisition period from August 22, 2015 to July 30, 2016 are included within the Company's consolidated results of operations for Fiscal 2016.
(b) Excludes ending accrued capital expenditures of $61.9 million in Fiscal 2016, $50.8 million in Fiscal 2015 and $64.4 million in Fiscal 2014.
(c) Includes capital expenditures for technology and supply chain infrastructure and corporate office space.
F-39
ASCENA RETAIL GROUP, INC.
NOTES TO CONSOLIDATED FINANCIAL STATEMENTS - (Continued)
The Company’s executive team does not regularly review asset information by operating segment and, accordingly, we do not report asset information by operating segment. In addition, the Company’s operations are largely concentrated in the United States and Canada. Accordingly, net sales and long-lived assets by geographic location are not meaningful at this time.
The Company’s revenues by major product categories as a percentage of total net sales are as follows:
Fiscal Years Ended | |||||||||
July 30, 2016 | July 25, 2015 | July 26, 2014 | |||||||
(millions) | |||||||||
Apparel | 87 | % | 84 | % | 83 | % | |||
Accessories and other | 13 | % | 16 | % | 17 | % | |||
Total net sales | 100 | % | 100 | % | 100 | % | |||
19. Additional Financial Information
Fiscal Years Ended | ||||||||||||
Cash Interest and Taxes: | July 30, 2016 | July 25, 2015 | July 26, 2014 | |||||||||
(millions) | ||||||||||||
Cash paid for interest | $ | 76.3 | $ | 4.6 | $ | 4.6 | ||||||
Cash (received) paid for income taxes | $ | (9.2 | ) | $ | (5.9 | ) | $ | 42.1 | ||||
Non-cash Transactions
In connection with the ANN Acquisition, as more fully described in Note 5, the Company issued 31.2 million shares of common stock valued at approximately $345 million, based on the Company's stock price on the date of the acquisition. Non-cash investing activities include the accrued purchases of fixed assets in the amount of $61.9 million as of July 30, 2016, $50.8 million as of July 25, 2015 and $64.4 million as of July 26, 2014.
F-40
REPORT OF INDEPENDENT REGISTERED PUBLIC ACCOUNTING FIRM
To the Board of Directors and Stockholders of
Ascena Retail Group, Inc.
Mahwah, New Jersey
We have audited the accompanying consolidated balance sheets of Ascena Retail Group, Inc. (the "Company") as of July 30, 2016 and July 25, 2015, and the related consolidated statements of operations, comprehensive (loss) income, equity, and cash flows for each of the three fiscal years in the period ended July 30, 2016. These financial statements are the responsibility of the Company’s management. Our responsibility is to express an opinion on the financial statements based on our audits.
We conducted our audits in accordance with the standards of the Public Company Accounting Oversight Board (United States). Those standards require that we plan and perform the audit to obtain reasonable assurance about whether the financial statements are free of material misstatement. An audit includes examining, on a test basis, evidence supporting the amounts and disclosures in the financial statements. An audit also includes assessing the accounting principles used and significant estimates made by management, as well as evaluating the overall financial statement presentation. We believe that our audits provide a reasonable basis for our opinion.
In our opinion, such consolidated financial statements present fairly, in all material respects, the financial position of Ascena Retail Group, Inc. and subsidiaries as of July 30, 2016 and July 25, 2015, and the results of their operations and their cash flows for each of the three fiscal years in the period ended July 30, 2016, in conformity with accounting principles generally accepted in the United States of America.
We have also audited, in accordance with the standards of the Public Company Accounting Oversight Board (United States), the Company’s internal control over financial reporting as of July 30, 2016, based on the criteria established in Internal Control - Integrated Framework (2013) issued by the Committee of Sponsoring Organizations of the Treadway Commission and our report dated September 19, 2016 expressed an unqualified opinion on the Company’s internal control over financial reporting.
/s/ Deloitte & Touche LLP
Parsippany, New Jersey
September 19, 2016
F-41
REPORT OF INDEPENDENT REGISTERED PUBLIC ACCOUNTING FIRM
To the Board of Directors and Stockholders of
Ascena Retail Group, Inc.
Mahwah, New Jersey
We have audited the internal control over financial reporting of Ascena Retail Group, Inc. and subsidiaries (the "Company") as of July 30, 2016, based on criteria established in Internal Control - Integrated Framework (2013) issued by the Committee of Sponsoring Organizations of the Treadway Commission. The Company’s management is responsible for maintaining effective internal control over financial reporting and for its assessment of the effectiveness of internal control over financial reporting, included in the accompanying Management’s Assessment of Internal Control over Financial Reporting. Our responsibility is to express an opinion on the Company’s internal control over financial reporting based on our audit.
We conducted our audit in accordance with the standards of the Public Company Accounting Oversight Board (United States). Those standards require that we plan and perform the audit to obtain reasonable assurance about whether effective internal control over financial reporting was maintained in all material respects. Our audit included obtaining an understanding of internal control over financial reporting, assessing the risk that a material weakness exists, testing and evaluating the design and operating effectiveness of internal control based on the assessed risk, and performing such other procedures as we considered necessary in the circumstances. We believe that our audit provides a reasonable basis for our opinion.
A company’s internal control over financial reporting is a process designed by, or under the supervision of, the company’s principal executive and principal financial officers, or persons performing similar functions, and effected by the company’s board of directors, management, and other personnel to provide reasonable assurance regarding the reliability of financial reporting and the preparation of financial statements for external purposes in accordance with generally accepted accounting principles. A company’s internal control over financial reporting includes those policies and procedures that (1) pertain to the maintenance of records that, in reasonable detail, accurately and fairly reflect the transactions and dispositions of the assets of the company; (2) provide reasonable assurance that transactions are recorded as necessary to permit preparation of financial statements in accordance with generally accepted accounting principles, and that receipts and expenditures of the company are being made only in accordance with authorizations of management and directors of the company; and (3) provide reasonable assurance regarding prevention or timely detection of unauthorized acquisition, use, or disposition of the company’s assets that could have a material effect on the financial statements.
Because of the inherent limitations of internal control over financial reporting, including the possibility of collusion or improper management override of controls, material misstatements due to error or fraud may not be prevented or detected on a timely basis. Also, projections of any evaluation of the effectiveness of the internal control over financial reporting to future periods are subject to the risk that the controls may become inadequate because of changes in conditions, or that the degree of compliance with the policies or procedures may deteriorate.
In our opinion, the Company maintained, in all material respects, effective internal control over financial reporting as of July 30, 2016, based on the criteria established in Internal Control - Integrated Framework (2013) issued by the Committee of Sponsoring Organizations of the Treadway Commission.
We have also audited, in accordance with the standards of the Public Company Accounting Oversight Board (United States), the consolidated financial statements as of and for the fiscal year ended July 30, 2016 of the Company and our report dated September 19, 2016 expressed an unqualified opinion on those financial statements.
/s/ Deloitte & Touche LLP
Parsippany, New Jersey
September 19, 2016
F-42
QUARTERLY FINANCIAL INFORMATION (UNAUDITED)
The following table sets forth the quarterly financial information of the Company:
Fiscal Year Ended July 30, 2016 | Fourth Quarter (a)(b)(d)(e) | Third Quarter (a)(d)(e) | Second Quarter (a)(c)(d)(e) | First Quarter (a)(c)(d)(e) | ||||||||||||
(millions, except per share data) | ||||||||||||||||
Net sales | $ | 1,812.3 | $ | 1,669.3 | $ | 1,841.8 | $ | 1,672.0 | ||||||||
Gross margin | 1,041.3 | 1,016.7 | 968.0 | 902.7 | ||||||||||||
Net income (loss) | 13.8 | 15.0 | (22.6 | ) | (18.1 | ) | ||||||||||
Net income (loss) per common share: | ||||||||||||||||
Basic | $ | 0.07 | $ | 0.08 | $ | (0.12 | ) | $ | (0.10 | ) | ||||||
Diluted | $ | 0.07 | $ | 0.08 | $ | (0.12 | ) | $ | (0.10 | ) | ||||||
Fiscal Year Ended July 25, 2015 | Fourth Quarter (e)(f)(g)(h) | Third Quarter (e)(h) | Second Quarter (e)(h) | First Quarter (e)(h) | ||||||||||||
(millions, except per share data) | ||||||||||||||||
Net sales | $ | 1,169.8 | $ | 1,150.3 | $ | 1,288.6 | $ | 1,194.2 | ||||||||
Gross margin | 637.6 | 675.1 | 662.0 | 694.5 | ||||||||||||
Net (loss) income | (323.4 | ) | 24.4 | 8.7 | 53.5 | |||||||||||
Net (loss) income per common share: | ||||||||||||||||
Basic | $ | (1.98 | ) | $ | 0.15 | $ | 0.05 | $ | 0.33 | |||||||
Diluted | $ | (1.98 | ) | $ | 0.15 | $ | 0.05 | $ | 0.32 | |||||||
________
(a) | Fiscal 2016 includes the post-acquisition results of ANN which was acquired on August 21, 2015. ANN's first, second and third quarters of Fiscal 2016 ended October 31, 2015, January 30, 2016 and April 30, 2016, respectively, whereas the first, second and third quarters of Fiscal 2016 for the Company's other segments ended October 24, 2015, January 23, 2016 and April 23, 2016, respectively. The effect of the one-week reporting period difference is not material. All segments of the Company are on the same fiscal calendar at the end of Fiscal 2016. |
(b) The fourth quarter of Fiscal 2016 reflected a 14-week period for all the segments except ANN. The fourth quarter of Fiscal 2016 for ANN reflected a 13-week period as they followed the National Retail Federation calendar and, as a result, was on the same fiscal calendar as the Company's other segments at the end of Fiscal 2016. The inclusion of the 14th week in the fourth quarter of Fiscal 2016 resulted in incremental revenues of approximately $82 million for the legacy ascena brands.
(c) | During the third quarter of Fiscal 2016, the Company determined that, for the first six months of Fiscal 2016, an expense for ANN which should have been classified as Buying, distribution and occupancy expenses, had been incorrectly classified as Cost of goods sold. As a result, the Company restated its prior period information by reclassifying these costs of $6.6 million for the first quarter of Fiscal 2016 and $9.9 million for the second quarter of Fiscal 2016 to Buying, distribution and occupancy expenses from Cost of goods sold, thereby increasing Gross margin. This change had no effect on Net income (loss) or Net income (loss) per common share for any period. |
(d) Fiscal 2016 includes purchase accounting adjustments related to the ANN Acquisition of approximately $111 million, $30 million, $12 million and $12 million for the first, second, third and fourth quarters of Fiscal 2016, respectively.
(e) Fiscal 2016 includes Acquisition and integration expenses of $42.5 million, $16.0 million, $8.4 million and $10.5 million in the first, second, third and fourth quarters, respectively. Fiscal 2015 includes Acquisition and integration expenses of $9.0 million, $5.3 million, $4.6 million and $12.8 million in the first, second, third and fourth quarters, respectively.
(f) In the fourth quarter of Fiscal 2015, the Company recorded a non-cash impairment charge of $44.7 million related to Lane Bryant's trade name and $261.7 million related to Lane Bryant's goodwill. Refer to Note 6 to the consolidated financial statements for additional information.
(g) | In the fourth quarter of Fiscal 2015, the Company established a legal reserve of approximately $51 million in connection with the Justice pricing lawsuits. Refer to Note 14 to the consolidated financial statements for additional information. |
(h) Fiscal 2015 includes accelerated depreciation of $0.5 million, $0.1 million, $2.8 million and $3.1 million in the first, second, third and fourth quarters, respectively. Refer to Note 8 to the consolidated financial statements for additional information.
F-43
SELECTED FINANCIAL INFORMATION
The following table sets forth selected historical financial information as of the dates and for the periods indicated.
The consolidated statement of operations data for each of the three fiscal years in the period ended July 30, 2016 have been derived from, and should be read in conjunction with, the audited consolidated financial statements and other financial information presented elsewhere herein. The consolidated statement of operations data for the fiscal years ended July 27, 2013 and July 28, 2012 have been derived from audited consolidated financial statements not included herein. The historical results are not necessarily indicative of the results to be expected in any future period.
The consolidated balance sheet data as of July 30, 2016 and July 25, 2015 have been derived from, and should be read in conjunction with, the audited consolidated financial statements and other financial information presented elsewhere herein. The consolidated balance sheet data as of July 26, 2014, July 27, 2013 and July 28, 2012 have been derived from audited consolidated financial statements not included herein.
Fiscal Years Ended(a) | ||||||||||||||||||||
July 30, 2016 (b)(c)(g) | July 25, 2015 (c)(d)(e)(f) | July 26, 2014 (c)(d)(f) | July 27, 2013 (c)(f)(g) | July 28, 2012 (c)(h) | ||||||||||||||||
(millions, except for share data) | ||||||||||||||||||||
Statement of Operations Data: | ||||||||||||||||||||
Net sales | $ | 6,995.4 | $ | 4,802.9 | $ | 4,790.6 | $ | 4,714.9 | $ | 3,353.3 | ||||||||||
Impairment of goodwill | — | (261.7 | ) | — | — | — | ||||||||||||||
Impairment of intangible assets | — | (44.7 | ) | (13.0 | ) | — | — | |||||||||||||
Depreciation and amortization expense | (358.7 | ) | (218.2 | ) | (193.6 | ) | (176.0 | ) | (107.4 | ) | ||||||||||
Operating income (loss) | 93.8 | (234.9 | ) | 210.8 | 265.3 | 292.6 | ||||||||||||||
(Loss) income from continuing operations | (11.9 | ) | (236.8 | ) | 138.2 | 155.2 | 171.8 | |||||||||||||
Net (loss) income from continuing operations per common share: | ||||||||||||||||||||
Basic | $ | (0.06 | ) | $ | (1.46 | ) | $ | 0.86 | $ | 0.99 | $ | 1.12 | ||||||||
Diluted | (0.06 | ) | (1.46 | ) | 0.84 | $ | 0.95 | $ | 1.08 | |||||||||||
Balance sheet data: | ||||||||||||||||||||
Cash and cash equivalents | $ | 371.8 | $ | 240.6 | $ | 156.9 | $ | 186.4 | $ | 164.3 | ||||||||||
Working capital (i)(j) | 226.3 | 232.2 | 291.7 | 306.3 | 325.6 | |||||||||||||||
Total assets (i)(j) | 5,506.3 | 2,906.2 | 3,118.6 | 2,865.2 | 2,800.0 | |||||||||||||||
Total debt (j) | 1,648.5 | 106.5 | 166.8 | 129.1 | 319.5 | |||||||||||||||
Total equity | $ | 1,863.3 | $ | 1,518.1 | $ | 1,737.7 | $ | 1,556.4 | $ | 1,340.9 | ||||||||||
________
(a) Except for Fiscal 2016, all fiscal years presented consisted of 52 weeks. Fiscal 2016 consisted of 53 weeks, which resulted in incremental revenue of approximately $82 million for the legacy ascena brands.
(b) Fiscal 2016 included the results of ANN for the post-acquisition period from August 22, 2015 to July 30, 2016 and reflected approximately $165 million of purchase accounting adjustments, as discussed in Note 5.
(c) Includes Acquisition and integration expenses in Operating income of $77.4 million in Fiscal 2016, $31.7 million in Fiscal 2015, $34.0 million in Fiscal 2014, $34.6 million in Fiscal 2013 and $25.4 million in Fiscal 2012. Fiscal 2012 also included Acquisition-related transaction costs of $14.0 million.
(d) Includes non-cash impairment charges of $261.7 million in Fiscal 2015 related to Lane Bryant's goodwill and $44.7 million in Fiscal 2015 related to Lane Bryant's trade name and $13.0 million in Fiscal 2014 to write off the entire carrying value of the Studio Y trade name. Refer to Note 6 in the consolidated financial statements for additional information.
(e) Includes the establishment of a legal reserve of approximately $51 million in connection with the Justice pricing lawsuits. Refer to Note 14 in the consolidated financial statements for additional information.
(f) Includes accelerated depreciation of $5.9 million in Fiscal 2015 in connection with the closure of the Brothers brand and $0.6 million, $8.6 million $14.2 million in Fiscal 2015, Fiscal 2014 and Fiscal 2013, respectively, in connection with the Company’s supply chain and technology integration efforts. Refer to Note 8 in the consolidated financial statements for additional information.
(g) Includes Gain (loss) on the extinguishment of debt of $0.8 million for Fiscal 2016 and $(9.3) million for Fiscal 2013. Refer to Note 11 to the consolidated financial statements for additional information.
(h) The acquisition of Lane Bryant and Catherines was consummated on June 14, 2012.
(i) Fiscal 2013 and Fiscal 2012 include net assets related to discontinued operations of $17.3 million and $15.0 million, respectively.
(j) As a result of adopting ASU 2015-03, which requires debt issuance costs to be presented in the balance sheet as a direct deduction from the carrying value of the debt liability, the Company reclassified debt issuance costs of $9.5 million as of July 25, 2015 from Other assets to a reduction of Long-term debt. In addition, for comparison purposes, debt issuance costs of $5.2 million as of July 26, 2014, $6.5 million as of July 27, 2013 and $7.1 million as of July 28, 2012 were reclassified from Other assets to a reduction of Long-term debt.
F-44