Attached files
| file | filename |
|---|---|
| 8-K - AdvanSix Inc. | form8-k.htm |
Exhibit 99.1

September 15, 2016 ANALYST MEETINGNew York City
Forward Looking Statements AdvanSix Analyst Presentation – September 15, 2016 Statements in this presentation that are not strictly historical, including the expected separation date, statements regarding the Company's business and acquisition opportunities, anticipated revenue growth, anticipated operating margin expansion, anticipated cash flow, and anticipated earnings growth, and any other statements identified by their use of words like “anticipate,” “estimates,” “projects,” “intends,” “plans,” “expect,” “believe,” “outlook,” “guidance,” or “will” or other words of similar meaning are "forward-looking" statements within the meaning of the federal securities laws. There are a number of important factors that could cause actual results, developments and business decisions to differ materially from those suggested or indicated by such forward-looking statements and you should not place undue reliance on any such forward-looking statements. These factors include, without limitation, general economic and financial conditions; growth rates and cyclicality of the industries we serve; international sales and operations; currency exchange rates and currency devaluation; compliance with U.S. and foreign regulations by operations outside the United States; attracting and retaining key personnel; access to and pricing of raw materials; competition from producers of competitive and substitute products; the provision of services by third parties at several facilities; the ability to obtain additional capital on favorable terms; the ability to evaluate acquisitions and strategic investments; natural disasters, such as hurricanes, winter or tropical storms, earthquakes, floods, fires or other unanticipated problems such as labor difficulties, equipment failure, the hazards associated with chemical manufacturing or unscheduled maintenance and repair; protection of intellectual property and proprietary information; government policies, approvals and regulations, including, but not limited to, those affecting the environment, trade, climate change, tax policies and the chemicals industry; and lawsuits arising out of environmental damage or personal injuries associated with chemical manufacturing.These, and other important factors that could cause actual results or events to differ materially from those expressed in forward-looking statements, are described or will be described in our filings with the U.S. Securities and Exchange Commission, including our Registration Statement on Form 10. Readers are cautioned not to place undue reliance on AdvanSix’s projections and forward-looking statements, which speak only as the date thereof. AdvanSix undertakes no obligation to publicly release any revision to the projections and forward-looking statements contained in this presentation, or to update them to reflect events or circumstances occurring after the date of this presentation.The financial data in this presentation have been derived from audited combined financial statements for each of the three years in the period ended December 31, 2015 and as of December 31, 2015 and December 31, 2014, included in AdvanSix’s Registration Statement on Form 10 filed with the U.S. Securities and Exchange Commission. The financial data from and as of prior and subsequent periods were derived from unaudited combined financial statements.Non-GAAP Financial MeasuresThis presentation includes certain non‐GAAP financial measures intended to supplement, not to act as substitutes for, comparable GAAP measures. Reconciliations of non‐GAAP financial measures to GAAP financial measures are provided in the appendix of the presentation. Investors are urged to consider carefully the comparable GAAP measures and the reconciliations to those measures provided. Non-GAAP measures in this presentation may be calculated in a way that is not comparable to similarly-titled measures reported by other companies. 2
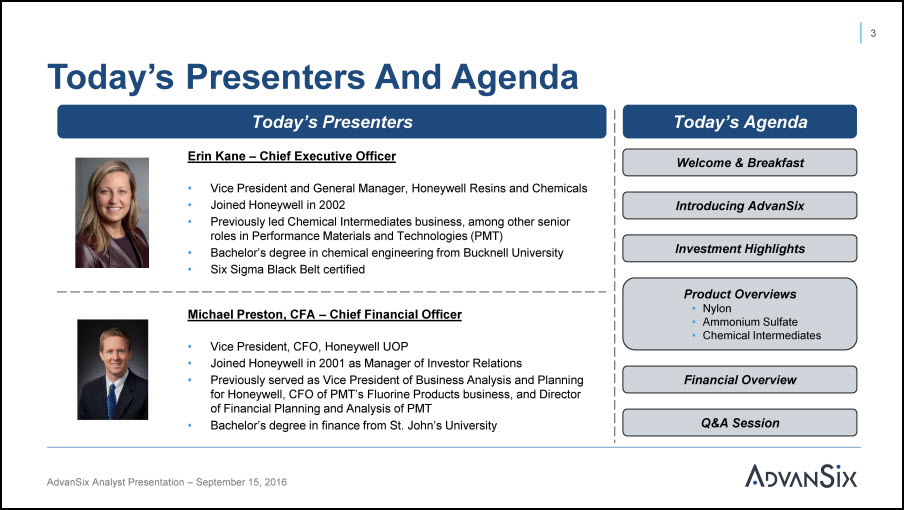
Today’s Presenters And Agenda 3 Today’s Presenters Erin Kane – Chief Executive Officer Vice President and General Manager, Honeywell Resins and ChemicalsJoined Honeywell in 2002Previously led Chemical Intermediates business, among other senior roles in Performance Materials and Technologies (PMT)Bachelor’s degree in chemical engineering from Bucknell UniversitySix Sigma Black Belt certified Michael Preston, CFA – Chief Financial Officer Vice President, CFO, Honeywell UOPJoined Honeywell in 2001 as Manager of Investor RelationsPreviously served as Vice President of Business Analysis and Planning for Honeywell, CFO of PMT’s Fluorine Products business, and Director of Financial Planning and Analysis of PMTBachelor’s degree in finance from St. John’s University Today’s Agenda Welcome & Breakfast Introducing AdvanSix Investment Highlights Product OverviewsNylonAmmonium SulfateChemical Intermediates Financial Overview Q&A Session AdvanSix Analyst Presentation – September 15, 2016
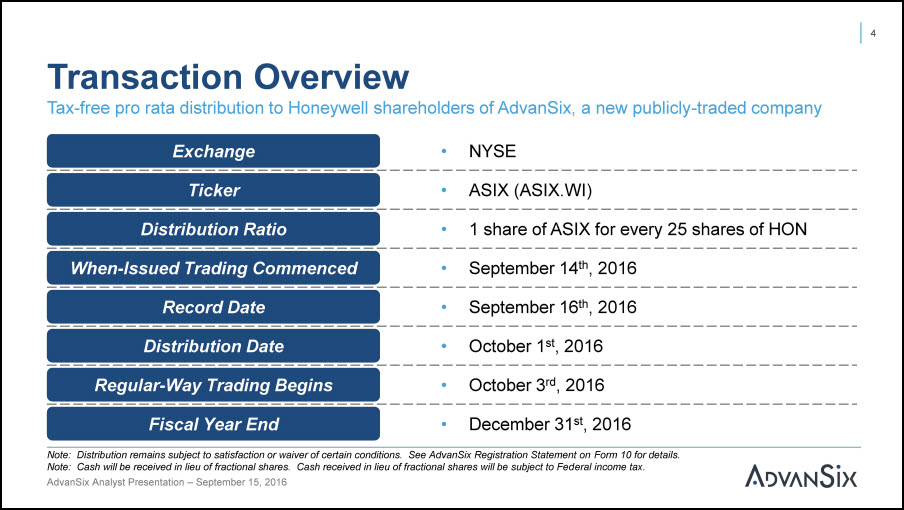
Transaction OverviewTax-free pro rata distribution to Honeywell shareholders of AdvanSix, a new publicly-traded company AdvanSix Analyst Presentation – September 15, 2016 Exchange • NYSETicker • ASIX (ASIX.WI)Distribution Ratio • 1 share of ASIX for every 25 shares of HONWhen-Issued Trading Commenced • September 14th, 2016Record Date • September 16th, 2016Distribution Date • October 1st, 2016Regular-Way Trading Begins • October 3rd, 2016Fiscal Year End • December 31st, 2016Note: Distribution remains subject to satisfaction or waiver of certain conditions. See AdvanSix Registration Statement on Form 10 for details. Note: Cash will be received in lieu of fractional shares. Cash received in lieu of fractional shares will be subject to Federal income tax. 4
Introducing AdvanSix AdvanSix Analyst Presentation – September 15, 2016 5
Highlights AdvanSix Analyst Presentation – September 15, 2016 Leading integrated Nylon 6 business with 60+ year historyVertical integration and cost-advantaged position, enabling 90%+plant utilization over the cycleStrong heritage of operational discipline and proven ability totransform businessReallocation of technology investment in last 2 years positions AdvanSix for enhanced organic growth and margin profileSpin-off provides flexibility to pursue growth strategies aligned toindustry dynamics 6
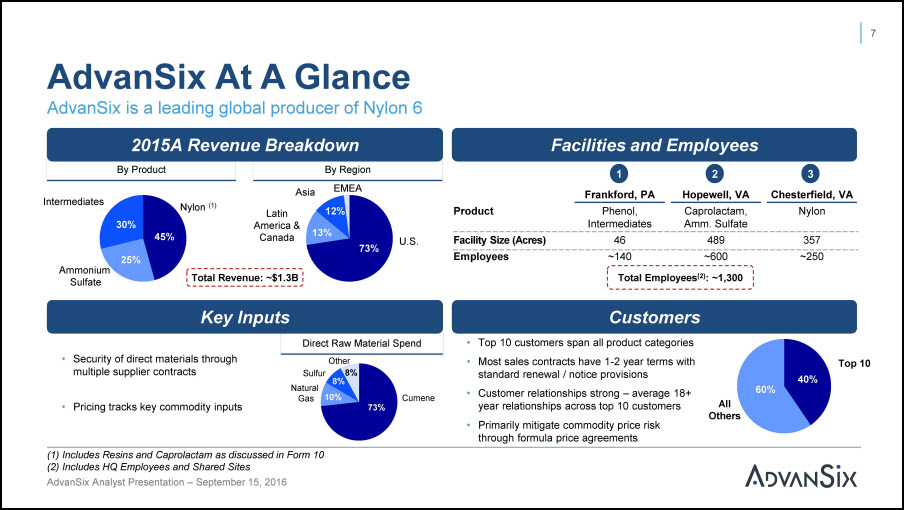
AdvanSix is a leading global producer of Nylon 6 AdvanSix At A Glance Facilities and Employees CustomersTop 10 customers span all product categoriesMost sales contracts have 1-2 year terms with standard renewal / notice provisionsCustomer relationships strong – average 18+ year relationships across top 10 customersPrimarily mitigate commodity price riskthrough formula price agreements U.S. Sulfate Top 10 AllOthers Direct Raw Material Spend Cumene Facility Size (Acres) 46 489 357 Employees ~140 ~600 ~250 2015A Revenue BreakdownBy Product By Region Latin America & Canada Asia EMEA 1Frankford, PA 2Hopewell, VA 3Chesterfield, VA Product Phenol, Intermediates Amm. Sulfate Caprolactam, Nylon Total Employees(2): ~1,300 7 Total Revenue: ~$1.3B Security of direct materials through multiple supplier contracts Pricing tracks key commodity inputs Sulfur Natural Gas Other8% ) Includes Resins and Caprolactam as discussed in Form 10Includes HQ Employees and Shared Sites Key Inputs 45% 25% 30% 73% 13% 12% 73% 10% 8% 40% AdvanSix Analyst Presentation – September 15, 2016 60%
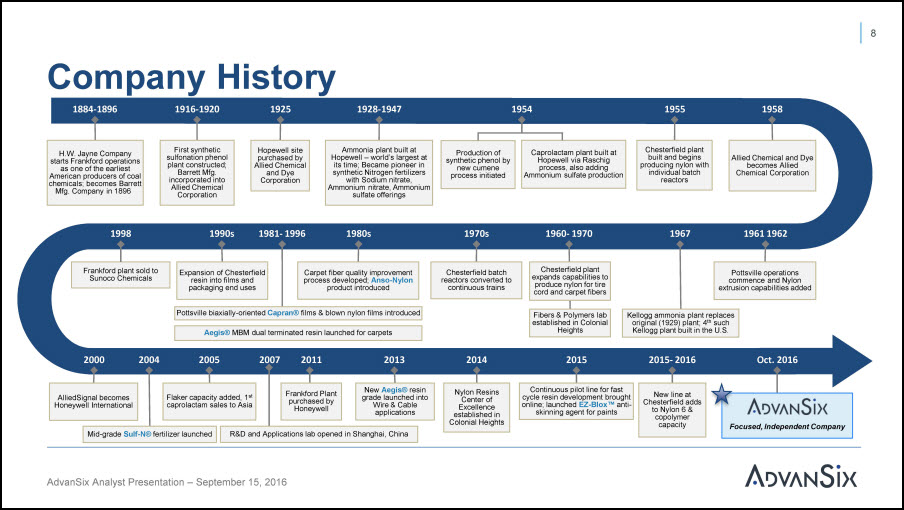
Company History1884-1896 1916-1920 1925 8 1928-1947 1954 1955 1958 1990s 1998 2000 2004 2005 2007 2011 2013 2015- 2016 Caprolactam plant built at Hopewell via Raschig process, also adding Ammonium sulfate production Chesterfield plant built and begins producing nylon with individual batch reactors H.W. Jayne Company starts Frankford operationsas one of the earliest American producers of coal chemicals; becomes Barrett Mfg. Company in 1896 First synthetic sulfonation phenol plant constructed; Barrett Mfg. incorporated into Allied Chemical Corporation Hopewell site purchased by Allied Chemical and Dye Corporation Production of synthetic phenol by new cumene process initiated Allied Chemical and Dye becomes Allied Chemical Corporation Expansion of Chesterfield resin into films and packaging end uses Frankford plant sold to Sunoco Chemicals AlliedSignal becomes Honeywell International Mid-grade Sulf-N® fertilizer launched Frankford Plant purchased by Honeywell New Aegis® resin grade launched into Wire & Cable applications 1961 1962 Pottsville operations commence and Nylon extrusion capabilities added 1967 Kellogg ammonia plant replaces original (1929) plant; 4th such Kellogg plant built in the U.S. 1960- 1970 Chesterfield plant expands capabilities to produce nylon for tire cord and carpet fibers 1970s Chesterfield batch reactors converted to continuous trains 1980s Carpet fiber quality improvement process developed; Anso-Nylon product introduced 1981- 1996 Flaker capacity added, 1st caprolactam sales to Asia 2014 2015 Continuous pilot line for fast cycle resin development brought online; launched EZ-Blox™ anti- skinning agent for paints Ammonia plant built at Hopewell – world’s largest at its time; Became pioneer in synthetic Nitrogen fertilizers with Sodium nitrate, Ammonium nitrate, Ammonium sulfate offerings Aegis® MBM dual terminated resin launched for carpets Fibers & Polymers lab established in Colonial Heights Pottsville biaxially-oriented Capran® films & blown nylon films introduced R&D and Applications lab opened in Shanghai, China Oct. 2016 New line at Chesterfield adds to Nylon 6 & copolymer capacity Focused, Independent Company Nylon Resins Center of Excellence established in Colonial Heights AdvanSix Analyst Presentation – September 15, 2016
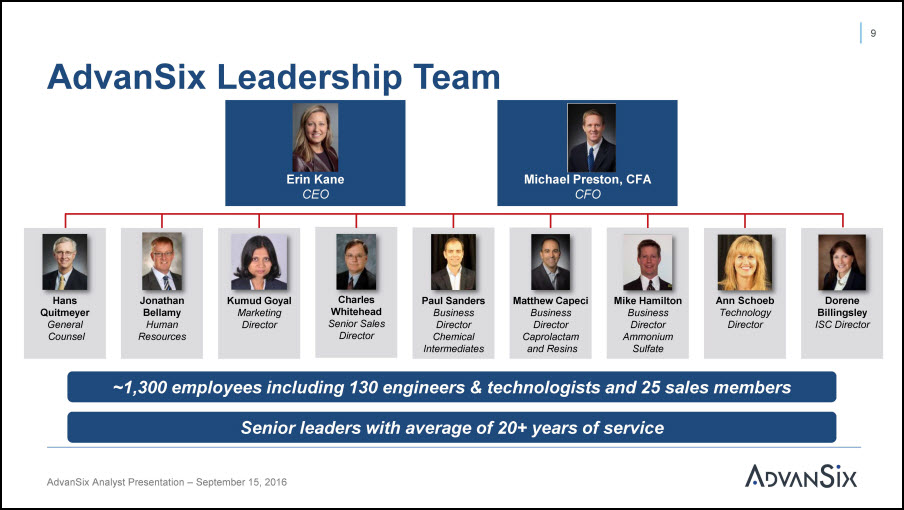
AdvanSix Leadership Team Erin KaneCEO Michael Preston, CFACFO ~1,300 employees including 130 engineers & technologists and 25 sales membersSenior leaders with average of 20+ years of service 9 AdvanSix Analyst Presentation – September 15, 2016 Hans Quitmeyer General Counsel Hans Quitmeyer General Counsel Jonathan Bellamy Human Resources Jonathan Bellamy Human Resources Kumud Goyal Marketing Director Kumud Goyal Marketing Director Charles Whitehead Senior Sales Director Charles Whitehead Senior Sales Director Paul Sanders Business Director Chemical Intermediates Paul Sanders Business Director Chemical Intermediates Matthew Capeci Business Director Caprolactam and Resins Matthew Capeci Business Director Caprolactam and Resins Mike Hamilton Business Director Ammonium Sulfate Mike Hamilton Business Director Ammonium Sulfate Ann Schoeb Technology Director Ann Schoeb Technology Director Dorene Billingsley ISC Director Dorene Billingsley ISC Director
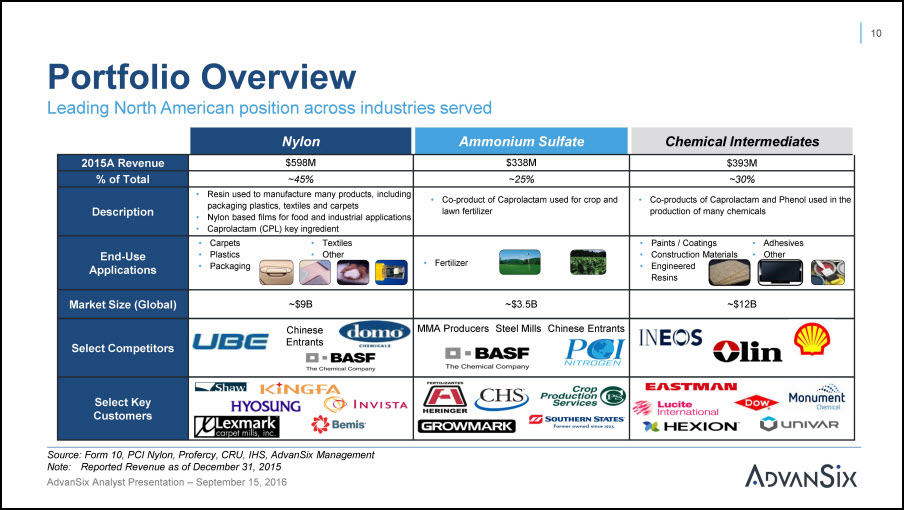
Portfolio OverviewLeading North American position across industries served 10 Source: Form 10, PCI Nylon, Profercy, CRU, IHS, AdvanSix Management Note: Reported Revenue as of December 31, 2015 AdvanSix Analyst Presentation – September 15, 2016 Nylon Ammonium Sulfate Chemical Intermediates 2015A Revenue $598M $338M $393M % of Total ~45% ~25% ~30% Description Resin used to manufacture many products, including packaging plastics, textiles and carpetsNylon based films for food and industrial applicationsCaprolactam (CPL) key ingredient Co-product of Caprolactam used for crop andlawn fertilizer Co-products of Caprolactam and Phenol used in theproduction of many chemicals End-Use Applications Carpets • TextilesPlastics • OtherPackaging Fertilizer Paints / Coatings • AdhesivesConstruction Materials • OtherEngineered Resins Market Size (Global) ~$9B ~$3.5B ~$12B Select Competitors Chinese Entrants MMA Producers Steel Mills Chinese Entrants Select Key Customers
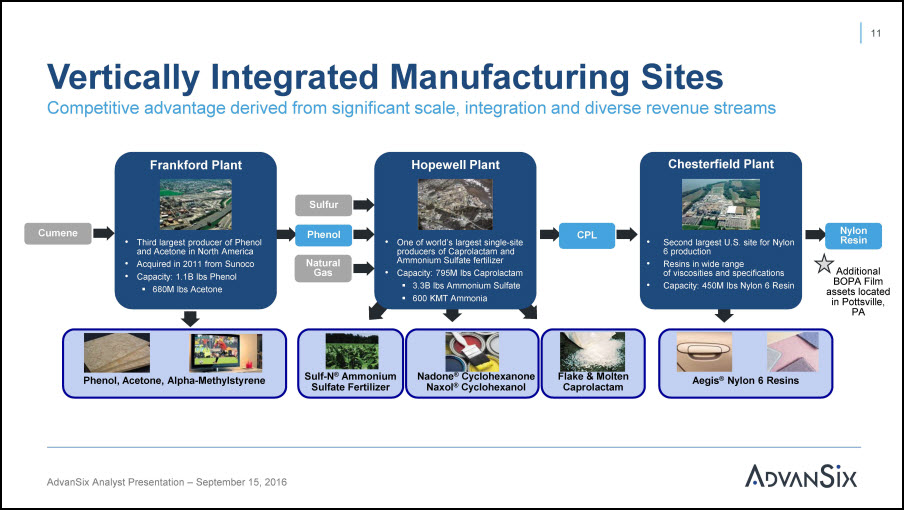
One of world’s largest single-site producers of Caprolactam and Ammonium Sulfate fertilizerCapacity: 795M lbs Caprolactam3.3B lbs Ammonium Sulfate600 KMT Ammonia CPL Second largest U.S. site for Nylon 6 productionResins in wide rangeof viscosities and specificationsCapacity: 450M lbs Nylon 6 Resin NaturalGas Phenol Sulfur Third largest producer of Phenol and Acetone in North AmericaAcquired in 2011 from SunocoCapacity: 1.1B lbs Phenol680M lbs Acetone Cumene Nylon Resin Sulf-N® Ammonium Sulfate Fertilizer Nadone® Cyclohexanone Naxol® Cyclohexanol Flake & Molten Caprolactam Aegis Nylon 6 Resins ® Phenol, Acetone, Alpha-Methylstyrene Additional BOPA Film assets located in Pottsville, PA Vertically Integrated Manufacturing SitesCompetitive advantage derived from significant scale, integration and diverse revenue streams Frankford Plant Hopewell Plant Chesterfield Plant 11 AdvanSix Analyst Presentation – September 15, 2016
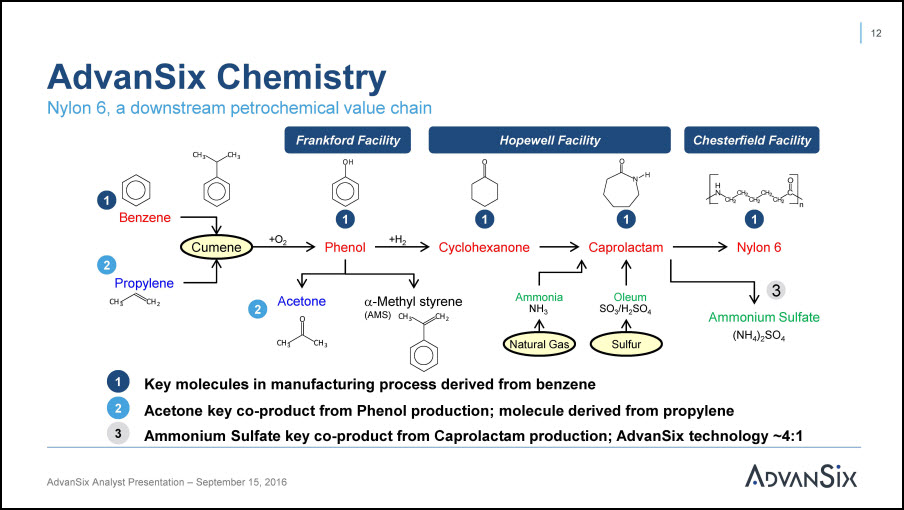
AdvanSix Chemistry Key molecules in manufacturing process derived from benzeneAcetone key co-product from Phenol production; molecule derived from propylene Ammonium Sulfate key co-product from Caprolactam production; AdvanSix technology ~4:1 1 23 Nylon 6, a downstream petrochemical value chainFrankford Facility Hopewell Facility Chesterfield Facility 12 OH Benzene PropyleneCH3 CH2 Phenol AmmoniaNH3 OleumSO3/H2SO4 3Ammonium Sulfate(NH4)2SO4 AcetoneOCH3 CH3 -Methyl styrene (AMS) CH3 CH3 CH3 N H O O C CH2 CH2CH2 CH2 CH2 H N n CH2 Nylon 6 Cumene Natural Gas Sulfur +O2 +H2 1 2 1 O Cyclohexanone 1 1 1 2 AdvanSix Analyst Presentation – September 15, 2016 Caprolactam
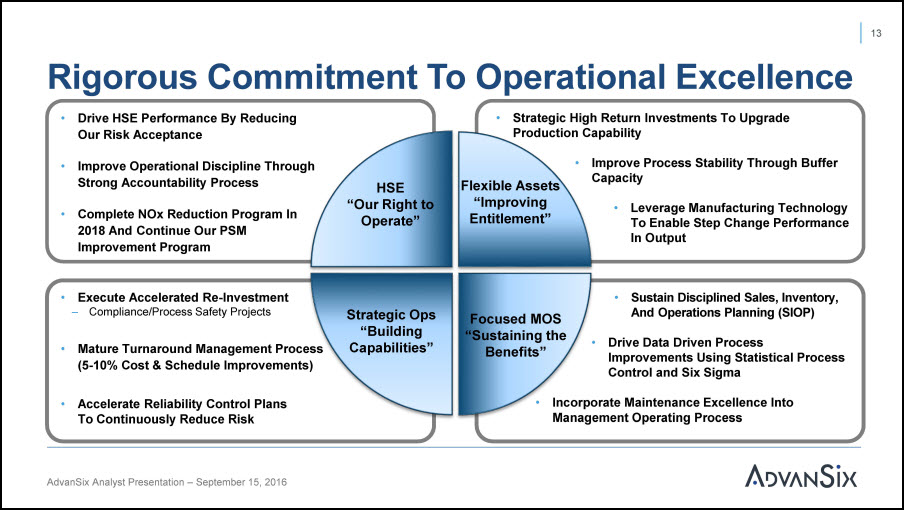
Rigorous Commitment To Operational Excellence Drive HSE Performance By Reducing Our Risk Acceptance Improve Operational Discipline Through Strong Accountability Process Complete NOx Reduction Program In 2018 And Continue Our PSM Improvement Program Sustain Disciplined Sales, Inventory,And Operations Planning (SIOP) Drive Data Driven Process Improvements Using Statistical Process Control and Six Sigma Incorporate Maintenance Excellence Into Management Operating Process Strategic High Return Investments To Upgrade Production Capability Improve Process Stability Through Buffer Capacity Leverage Manufacturing Technology To Enable Step Change Performance In Output Execute Accelerated Re-Investment– Compliance/Process Safety Projects Mature Turnaround Management Process (5-10% Cost & Schedule Improvements) Accelerate Reliability Control Plans To Continuously Reduce Risk 13 HSE “Our Right to Operate” Flexible Assets “Improving Entitlement” Focused MOS “Sustaining the Benefits” Strategic Ops AdvanSix Analyst Presentation – September 15, 2016 “Building Capabilities”
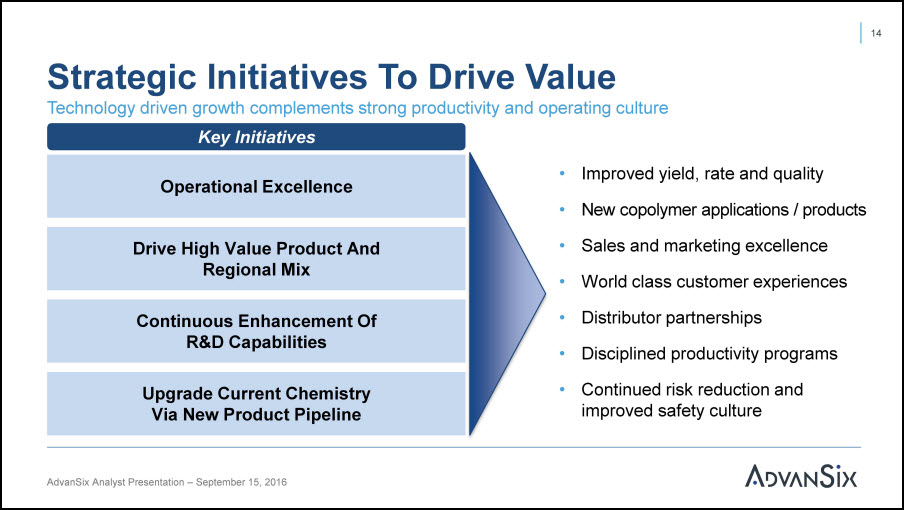
Strategic Initiatives To Drive Value Technology driven growth complements strong productivity and operating cultureKey Initiatives Operational Excellence Drive High Value Product And Regional Mix Continuous Enhancement Of R&D Capabilities Upgrade Current ChemistryVia New Product Pipeline Improved yield, rate and qualityNew copolymer applications / productsSales and marketing excellence World class customer experiences Distributor partnerships Disciplined productivity programsContinued risk reduction andimproved safety culture 14 AdvanSix Analyst Presentation – September 15, 2016
Investment Highlights AdvanSix Analyst Presentation – September 15, 2016 15
Investment Highlights Leading Vertically Integrated Nylon 6 Producer Sustainable Lowest Cost Position Strong Relationships Driven By Dedicated Sales Teams Global Reach Diverse Revenue Sources Continuous Investment In R&D And Technology 1 2 3 4 5 6 AdvanSix Analyst Presentation – September 15, 2016 16
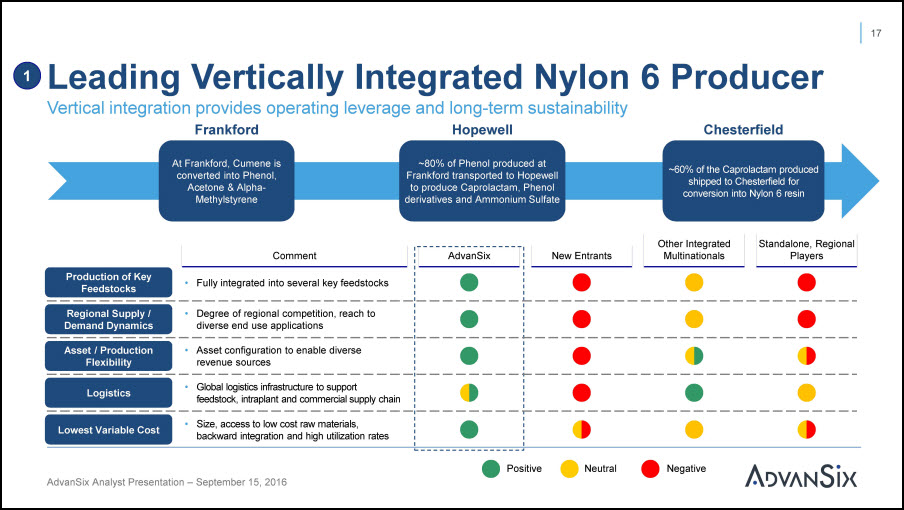
Leading Vertically Integrated Nylon 6 Producer At Frankford, Cumene is converted into Phenol, Acetone & Alpha- Methylstyrene ~80% of Phenol produced at Frankford transported to Hopewell to produce Caprolactam, Phenol derivatives and Ammonium Sulfate ~60% of the Caprolactam produced shipped to Chesterfield for conversion into Nylon 6 resin AdvanSix New Entrants Multinationals Players Positive Neutral Negative Asset / Production Flexibility Asset configuration to enable diverse revenue sources Lowest Variable Cost Size, access to low cost raw materials, backward integration and high utilization rates Regional Supply / Demand Dynamics Degree of regional competition, reach to diverse end use applications Logistics Global logistics infrastructure to supportfeedstock, intraplant and commercial supply chain Production of Key Feedstocks Fully integrated into several key feedstocks Vertical integration provides operating leverage and long-term sustainabilityFrankford Hopewell Chesterfield Comment Other Integrated Standalone, Regional 17 1 AdvanSix Analyst Presentation – September 15, 2016
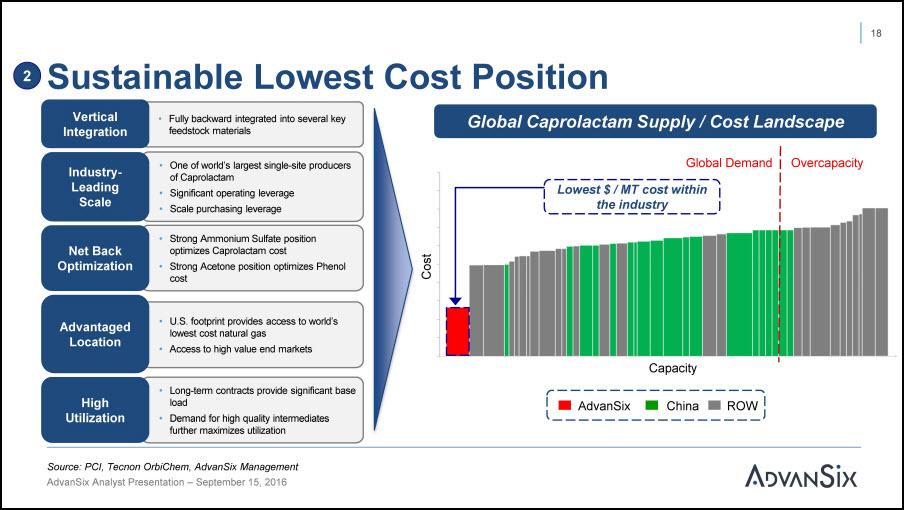
U.S. footprint provides access to world’s lowest cost natural gasAccess to high value end markets Advantaged Location Fully backward integrated into several key feedstock materials One of world’s largest single-site producers of CaprolactamSignificant operating leverageScale purchasing leverage Strong Ammonium Sulfate position optimizes Caprolactam costStrong Acetone position optimizes Phenol cost Long-term contracts provide significant base loadDemand for high quality intermediates further maximizes utilization Sustainable Lowest Cost Position Vertical Integration Industry- Leading Scale Net Back Optimization HighUtilization Global Caprolactam Supply / Cost LandscapeGlobal Demand OvercapacityLowest $ / MT cost within the industry AdvanSix ROW China 18 Source: PCI, Tecnon OrbiChem, AdvanSix Management 2 Capacity AdvanSix Analyst Presentation – September 15, 2016
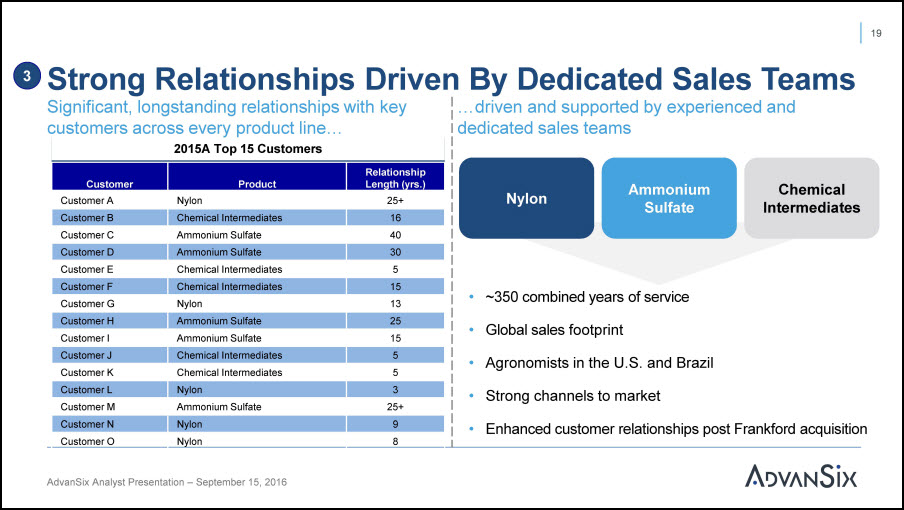
Customer Product Relationship Length (yrs.) Customer A Nylon 25+ Customer B Chemical Intermediates 16 Customer C Ammonium Sulfate 40 Customer D Ammonium Sulfate 30 Customer E Chemical Intermediates 5 Customer F Chemical Intermediates 15 Customer G Nylon 13 Customer H Ammonium Sulfate 25 Customer I Ammonium Sulfate 15 Customer J Chemical Intermediates 5 Customer K Chemical Intermediates 5 Customer L Nylon 3 Customer M Ammonium Sulfate 25+ Customer N Nylon 9 Customer O Nylon 8 2015A Top 15 Customers ~350 combined years of service Strong channels to market Enhanced customer relationships post Frankford acquisition 19 Significant, longstanding relationships with keycustomers across every product line… …driven and supported by experienced anddedicated sales teams Strong Relationships Driven By Dedicated Sales Teams 3 Nylon AmmoniumSulfate ChemicalIntermediates AdvanSix Analyst Presentation – September 15, 2016
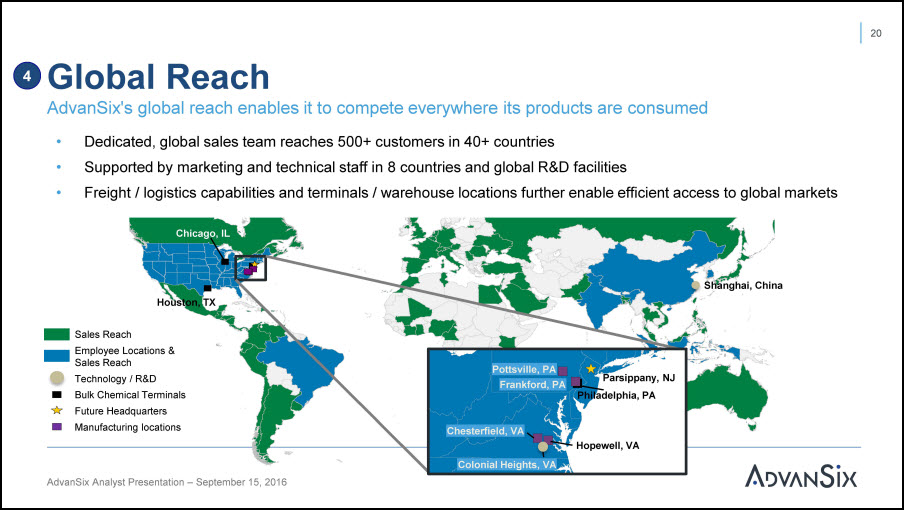
P:\Presentation Center\Maps\Honeywell\R&C World Map Global Reach Chicago, IL Shanghai, ChinaHouston, TX Sales ReachEmployee Locations & Sales ReachTechnology / R&DBulk Chemical Terminals Future Headquarters Manufacturing locations 20 4 AdvanSix's global reach enables it to compete everywhere its products are consumedDedicated, global sales team reaches 500+ customers in 40+ countriesSupported by marketing and technical staff in 8 countries and global R&D facilitiesFreight / logistics capabilities and terminals / warehouse locations further enable efficient access to global markets Parsippany, NJ Philadelphia, PA Frankford, PA Hopewell, VA Chesterfield, VA Colonial Heights, VA Pottsville, PA AdvanSix Analyst Presentation – September 15, 2016
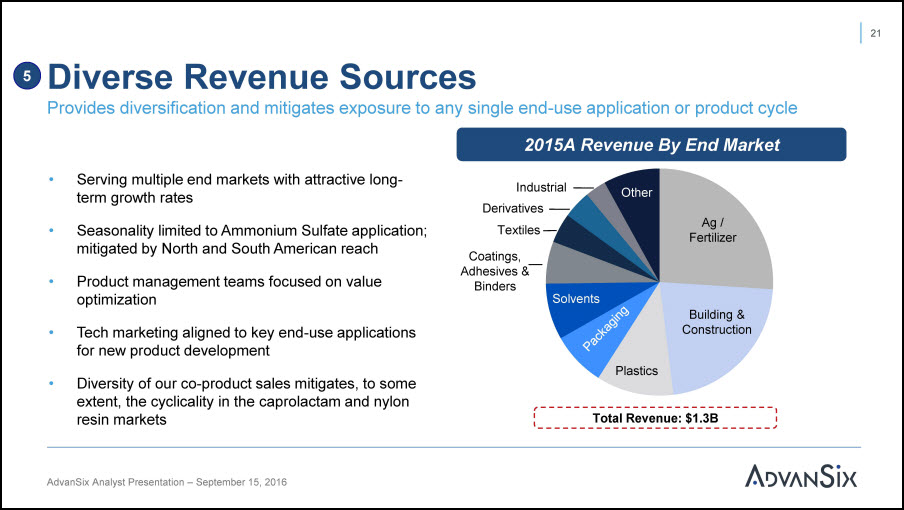
Diverse Revenue Sources 21 Provides diversification and mitigates exposure to any single end-use application or product cycle2015A Revenue By End Market Ag / Fertilizer Total Revenue: $1.3B 5 Building & Construction Plastics Solvents Industrial DerivativesTextiles AdvanSix Analyst Presentation – September 15, 2016 Coatings, Adhesives &Binders Other Serving multiple end markets with attractive long-term growth rates Seasonality limited to Ammonium Sulfate application; mitigated by North and South American reach Product management teams focused on valueoptimization Tech marketing aligned to key end-use applications for new product development Diversity of our co-product sales mitigates, to some extent, the cyclicality in the caprolactam and nylon resin markets
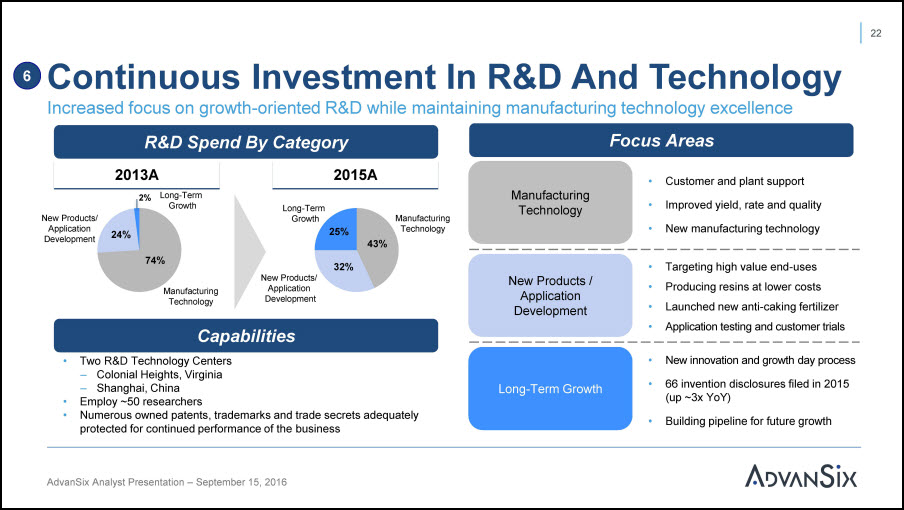
R&D Spend By Category CapabilitiesTwo R&D Technology CentersColonial Heights, VirginiaShanghai, ChinaEmploy ~50 researchersNumerous owned patents, trademarks and trade secrets adequately protected for continued performance of the business Focus Areas ManufacturingTechnology New Products / Application Development Long-Term Growth 6 Continuous Investment In R&D And Technology 22 2013A Manufacturing Technology New Products/ Application Development 66 invention disclosures filed in 2015 (up ~3x YoY) Building pipeline for future growth 2% Long-TermGrowth Manufacturing Technology New Products/ Application Development Long-Term Growth Increased focus on growth-oriented R&D while maintaining manufacturing technology excellence Customer and plant support Improved yield, rate and quality New manufacturing technology Targeting high value end-usesProducing resins at lower costsLaunched new anti-caking fertilizerApplication testing and customer trials New innovation and growth day process 2015A 43% 32% 25% 74% 24% AdvanSix Analyst Presentation – September 15, 2016
Product Line Overviews AdvanSix Analyst Presentation – September 15, 2016 23
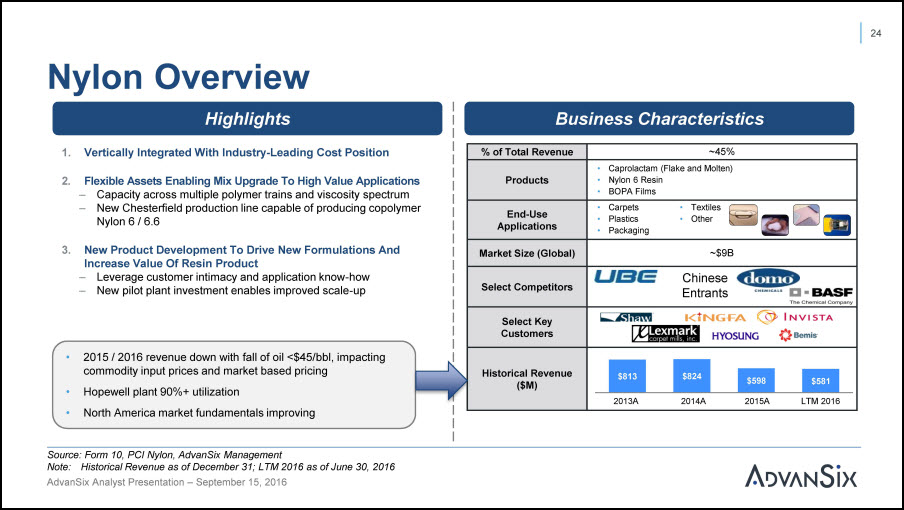
Nylon Overview Vertically Integrated With Industry-Leading Cost PositionFlexible Assets Enabling Mix Upgrade To High Value ApplicationsCapacity across multiple polymer trains and viscosity spectrumNew Chesterfield production line capable of producing copolymer Nylon 6 / 6.6New Product Development To Drive New Formulations And Increase Value Of Resin ProductLeverage customer intimacy and application know-howNew pilot plant investment enables improved scale-up 2015 / 2016 revenue down with fall of oil <$45/bbl, impacting commodity input prices and market based pricingHopewell plant 90%+ utilizationNorth America market fundamentals improvingSource: Form 10, PCI Nylon, AdvanSix ManagementNote: Historical Revenue as of December 31; LTM 2016 as of June 30, 2016 24 Highlights Business Characteristics AdvanSix Analyst Presentation – September 15, 2016 % of Total Revenue ~45% ~45% ~45% Products Caprolactam (Flake and Molten)Nylon 6 ResinBOPA Films Caprolactam (Flake and Molten)Nylon 6 ResinBOPA Films Caprolactam (Flake and Molten)Nylon 6 ResinBOPA Films End-Use Applications Carpets • TextilesPlastics • OtherPackaging Carpets • TextilesPlastics • OtherPackaging Carpets • TextilesPlastics • OtherPackaging Market Size (Global) ~$9B ~$9B ~$9B Select Competitors Chinese Entrants Chinese Entrants Chinese Entrants Select KeyCustomers Historical Revenue ($M) 22001133A 22001144A 22001155A LLTTMM 22001166 $813 $824 $813 $824 $598 $581
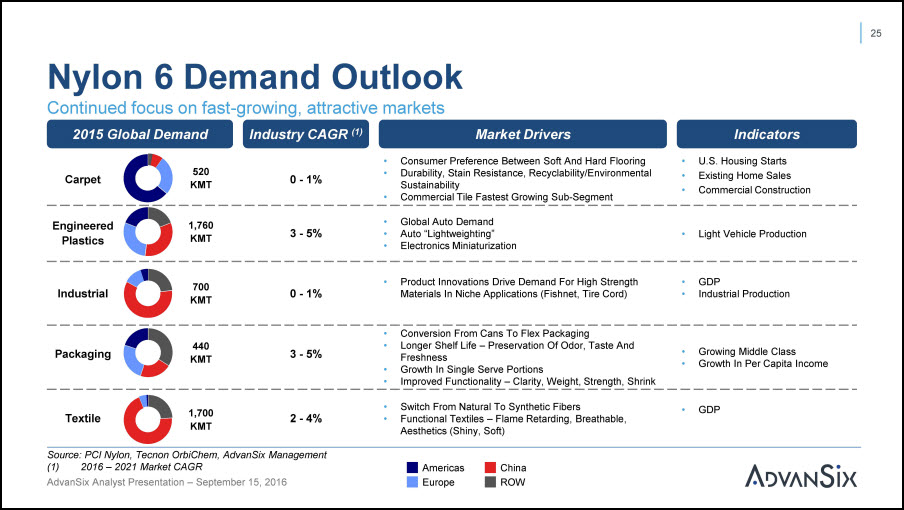
2015 Global Demand Industry CAGR (1) Nylon 6 Demand Outlook Market DriversConsumer Preference Between Soft And Hard FlooringDurability, Stain Resistance, Recyclability/Environmental SustainabilityCommercial Tile Fastest Growing Sub-Segment Source: PCI Nylon, Tecnon OrbiChem, AdvanSix Management(1) 2016 – 2021 Market CAGR IndicatorsU.S. Housing StartsExisting Home SalesCommercial Construction 25 Continued focus on fast-growing, attractive markets Carpet 0 - 1% 520KMT Textile 2 - 4% Switch From Natural To Synthetic FibersFunctional Textiles – Flame Retarding, Breathable, Aesthetics (Shiny, Soft) GDP 1,700KMT Industrial 0 - 1% Product Innovations Drive Demand For High Strength Materials In Niche Applications (Fishnet, Tire Cord) GDPIndustrial Production 700KMT Engineered Plastics 3 - 5% Global Auto DemandAuto “Lightweighting”Electronics Miniaturization Light Vehicle Production 1,760KMT Packaging 3 - 5% Conversion From Cans To Flex PackagingLonger Shelf Life – Preservation Of Odor, Taste And FreshnessGrowth In Single Serve PortionsImproved Functionality – Clarity, Weight, Strength, Shrink Growing Middle ClassGrowth In Per Capita Income 440KMT Americas China AdvanSix Analyst Presentation – September 15, 2016 Europe ROW
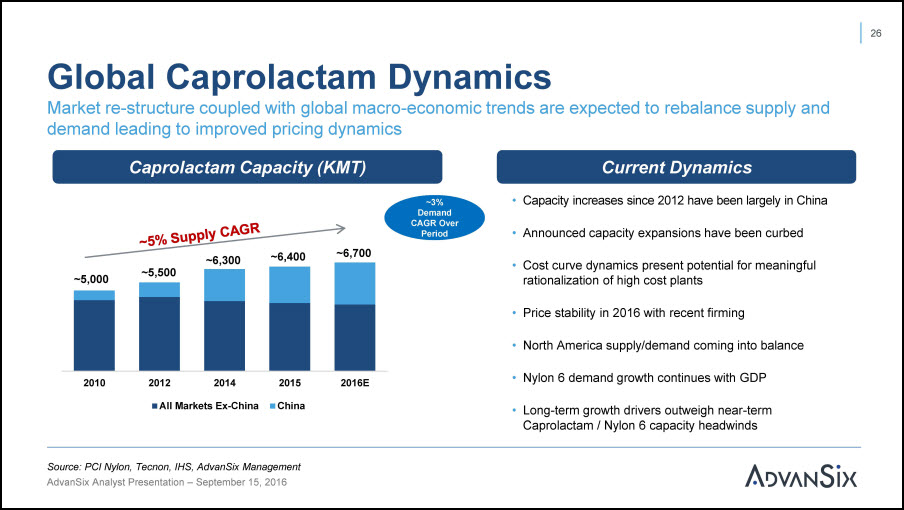
2010 2012 2014All Markets Ex-China 2015 2016E China Global Caprolactam Dynamics 26 Market re-structure coupled with global macro-economic trends are expected to rebalance supply and demand leading to improved pricing dynamicsCaprolactam Capacity (KMT) Current Dynamics ~5,000 ~6,700 ~3% Demand CAGR Over Period Source: PCI Nylon, Tecnon, IHS, AdvanSix ManagementAdvanSix Analyst Presentation – September 15, 2016 Capacity increases since 2012 have been largely in China Announced capacity expansions have been curbed Cost curve dynamics present potential for meaningful rationalization of high cost plants Price stability in 2016 with recent firmingNorth America supply/demand coming into balance Nylon 6 demand growth continues with GDP Long-term growth drivers outweigh near-term Caprolactam / Nylon 6 capacity headwinds ~5,500 ~6,300 ~6,400
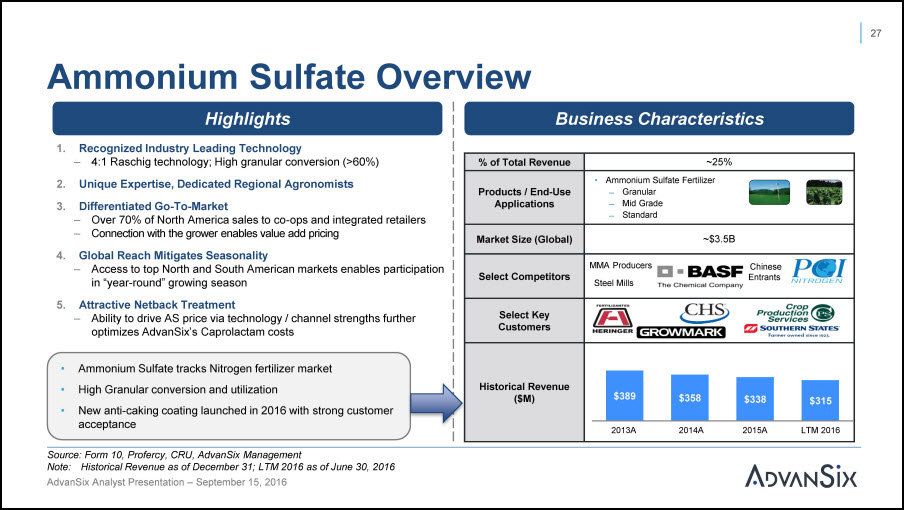
Ammonium Sulfate Overview HighlightsRecognized Industry Leading Technology4:1 Raschig technology; High granular conversion (>60%)Unique Expertise, Dedicated Regional AgronomistsDifferentiated Go-To-MarketOver 70% of North America sales to co-ops and integrated retailersConnection with the grower enables value add pricingGlobal Reach Mitigates SeasonalityAccess to top North and South American markets enables participationin “year-round” growing seasonAttractive Netback TreatmentAbility to drive AS price via technology / channel strengths further optimizes AdvanSix’s Caprolactam costs % of Total Revenue ~25% Products / End-UseApplications Ammonium Sulfate Fertilizer GranularMid GradeStandard Market Size (Global) ~$3.5B Select Competitors Select Key Customers Historical Revenue($M) $389 $358 $338 $315 22001133A 22001144A 22001155A LLTTMM 22001166 Chinese Entrants MMA Producers Steel Mills 27 Business Characteristics Source: Form 10, Profercy, CRU, AdvanSix ManagementNote: Historical Revenue as of December 31; LTM 2016 as of June 30, 2016 Ammonium Sulfate tracks Nitrogen fertilizer marketHigh Granular conversion and utilizationNew anti-caking coating launched in 2016 with strong customeracceptance AdvanSix Analyst Presentation – September 15, 2016
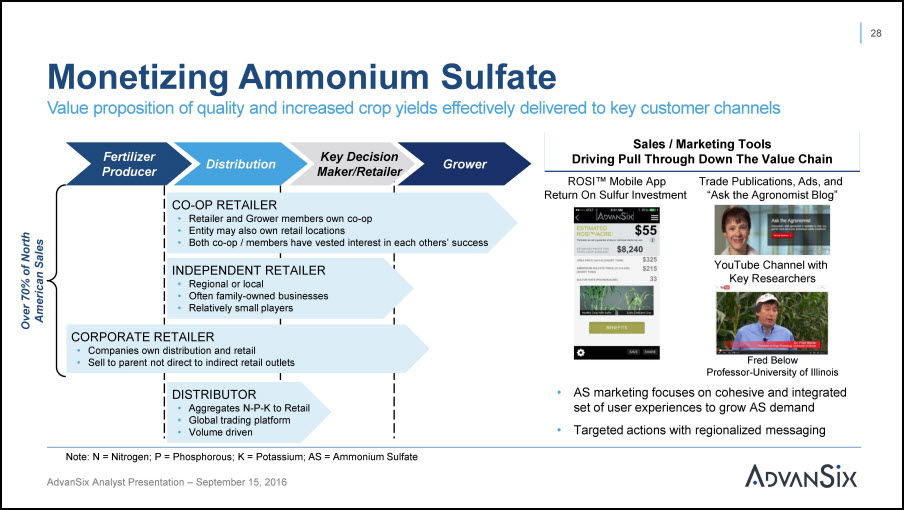
Often family-owned businessesRelatively small playersCORPORATE RETAILERCompanies own distribution and retail Sell to parent not direct to indirect retail outlets INDEPENDENT RETAILER Regional or local DISTRIBUTOR Aggregates N-P-K to RetailGlobal trading platform Volume driven CO-OP RETAILER Retailer and Grower members own co-opEntity may also own retail locationsBoth co-op / members have vested interest in each others’ success Monetizing Ammonium Sulfate Fertilizer Producer Distribution Key Decision Maker/Retailer Grower Fred Below Professor-University of IllinoisAS marketing focuses on cohesive and integrated set of user experiences to grow AS demandTargeted actions with regionalized messaging ROSI™ Mobile App Return On Sulfur Investment Trade Publications, Ads, and “Ask the Agronomist Blog” YouTube Channel with Key Researchers Note: N = Nitrogen; P = Phosphorous; K = Potassium; AS = Ammonium Sulfate 28 Value proposition of quality and increased crop yields effectively delivered to key customer channels Sales / Marketing ToolsDriving Pull Through Down The Value Chain AdvanSix Analyst Presentation – September 15, 2016
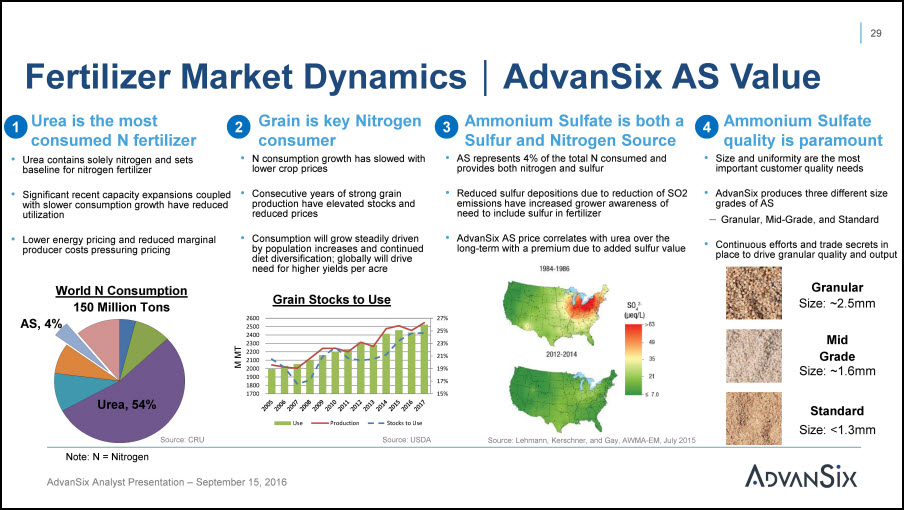
Fertilizer Market Dynamics∣AdvanSix AS Value 29 1 3 4 2 Urea, 54% World N Consumption 150 Million TonsAS, 4% Ammonium Sulfate quality is paramount Ammonium Sulfate is both a Sulfur and Nitrogen Source Urea contains solely nitrogen and sets baseline for nitrogen fertilizer Significant recent capacity expansions coupled with slower consumption growth have reduced utilization Lower energy pricing and reduced marginal producer costs pressuring pricing N consumption growth has slowed with lower crop prices Consecutive years of strong grain production have elevated stocks and reduced prices Consumption will grow steadily driven by population increases and continued diet diversification; globally will drive need for higher yields per acre Urea is the most consumed N fertilizer Size and uniformity are the most important customer quality needs AdvanSix produces three different size grades of AS– Granular, Mid-Grade, and Standard Continuous efforts and trade secrets in place to drive granular quality and output Grain is key Nitrogen consumer Source: CRU Source: Lehmann, Kerschner, and Gay, AWMA-EM, July 2015 AS represents 4% of the total N consumed and provides both nitrogen and sulfur Reduced sulfur depositions due to reduction of SO2 emissions have increased grower awareness of need to include sulfur in fertilizer AdvanSix AS price correlates with urea over the long-term with a premium due to added sulfur value 27%25%23%21%19%17%15% 2600250024002300220021002000190018001700 Use Production Stocks to Use Source: USDA Grain Stocks to Use StandardSize: <1.3mm AdvanSix Analyst Presentation – September 15, 2016 GranularSize: ~2.5mm Mid GradeSize: ~1.6mm Note: N = Nitrogen
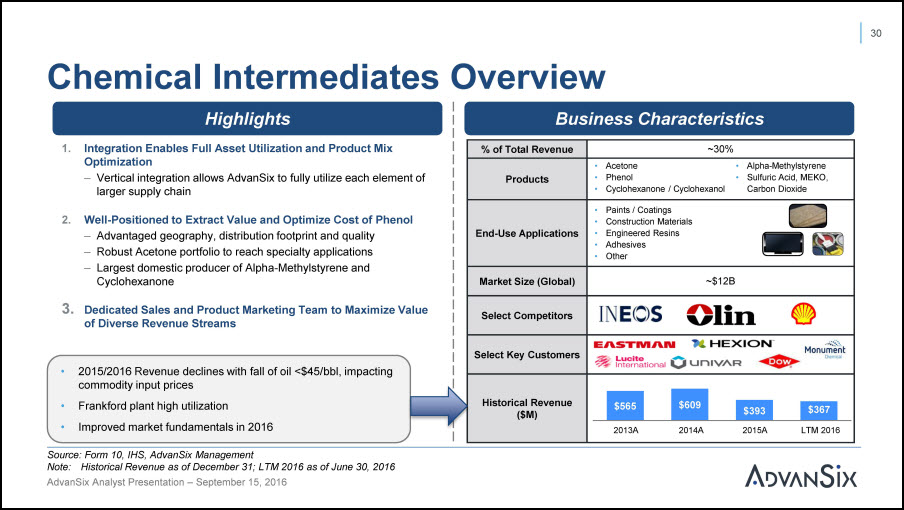
Chemical Intermediates Overview Well-Positioned to Extract Value and Optimize Cost of PhenolAdvantaged geography, distribution footprint and qualityRobust Acetone portfolio to reach specialty applicationsLargest domestic producer of Alpha-Methylstyrene andCyclohexanone 3. Dedicated Sales and Product Marketing Team to Maximize Value of Diverse Revenue Streams ~30% Products AcetonePhenolCyclohexanone / Cyclohexanol Alpha-MethylstyreneSulfuric Acid, MEKO, Carbon Dioxide End-Use Applications Paints / CoatingsConstruction MaterialsEngineered ResinsAdhesivesOther Market Size (Global) ~$12B Select Competitors Select Key Customers Historical Revenue ($M) $565 $609 $393 $367 Highlights1. Integration Enables Full Asset Utilization and Product MixOptimization– Vertical integration allows AdvanSix to fully utilize each element of larger supply chain % of Total Revenue 22001133A 22001144A 22001155A LLTTMM 22001166 Business Characteristics 30 Source: Form 10, IHS, AdvanSix ManagementNote: Historical Revenue as of December 31; LTM 2016 as of June 30, 2016 2015/2016 Revenue declines with fall of oil <$45/bbl, impacting commodity input pricesFrankford plant high utilizationImproved market fundamentals in 2016 AdvanSix Analyst Presentation – September 15, 2016
Financial Overview AdvanSix Analyst Presentation – September 15, 2016 31
Key Takeaways AdvanSix Analyst Presentation – September 15, 2016 Signs of supply/demand re-balancing for Caprolactam after capacity increases over past several yearsAdvanSix lowest cost producer due to scale, vertical integration and highvalue co-productsManufacturing utilization rates remain high through the cycle and demandcontinues to growStrong operational processes, productivity gains, and formula price agreements support sustainable margin ratesOpportunity for new product growth with enhanced R&D capabilities andexperienced sales team 32
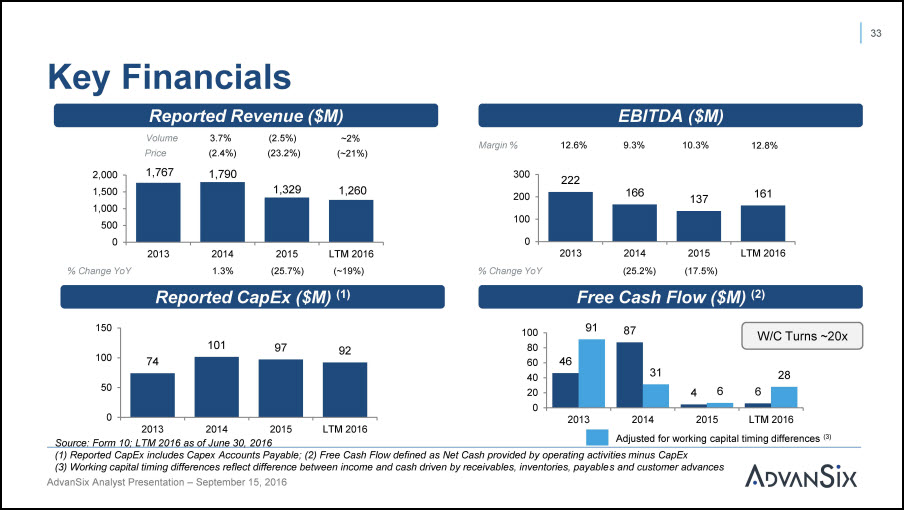
Key Financials 1,767 1,790 1,329 1,260 2,0001,5001,0005000 2013 0 2013 2014 2015 LTM 2016 Source: Form 10; LTM 2016 as of June 30, 2016 (1) Reported CapEx includes Capex Accounts Payable; (2) Free Cash Flow defined as Net Cash provided by operating activities minus CapEx(3) Working capital timing differences reflect difference between income and cash driven by receivables, inventories, payables and customer advances 20141.3% 2015(25.7%) LTM 2016(~19%) 222 166 137 161 0 100 200 300 2013 2014(25.2%) 2015(17.5%) LTM 2016 74 101 97 92 50 100 150 EBITDA ($M)9.3% 10.3% Margin % 12.6% Reported Revenue ($M) Reported CapEx ($M) (1) Free Cash Flow ($M) (2) 12.8% 46 87 4 6 91 6 20 1008060 2013 2014 2015 LTM 2016Adjusted for working capital timing differences (3) 33 W/C Turns ~20x AdvanSix Analyst Presentation – September 15, 2016 3.7%(2.4%) (2.5%)(23.2%) Volume Price ~2% (~21%) % Change YoY % Change YoY
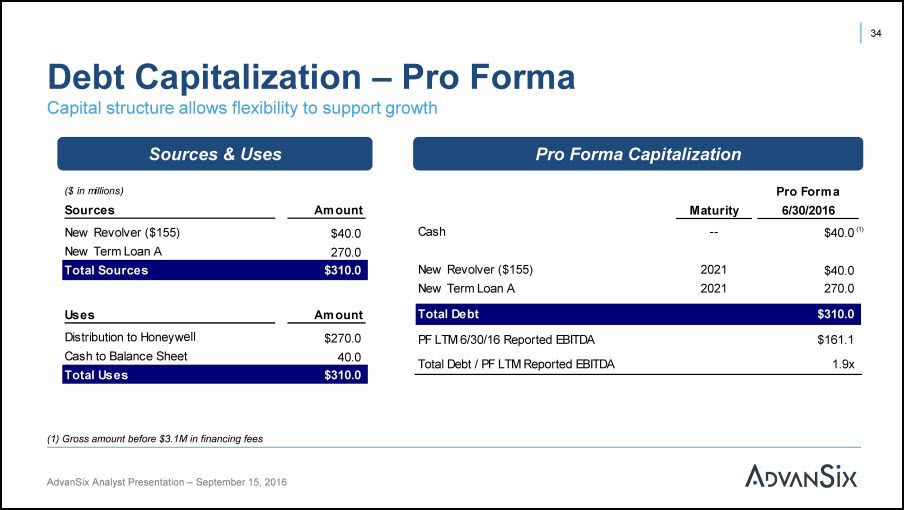
Debt Capitalization – Pro FormaCapital structure allows flexibility to support growth 34 Pro Forma Capitalization Sources & Uses Pro Forma 6/30/2016 Maturity Cash -- $40.0 (1) New Revolver ($155) New Term Loan A 20212021 $40.0 270.0 Total Debt $310.0 PF LTM 6/30/16 Reported EBITDA Total Debt / PF LTM Reported EBITDA $161.11.9x ($ in millions)Sour ce s New Revolver ($155) New Term Loan A Am ount$40.0 270.0 Total Sources $310.0 UsesDistribution to Honeywell Cash to Balance Sheet Total Uses AdvanSix Analyst Presentation – September 15, 2016 Amount ell $270.040.0 $310.0 (1) Gross amount before $3.1M in financing fees
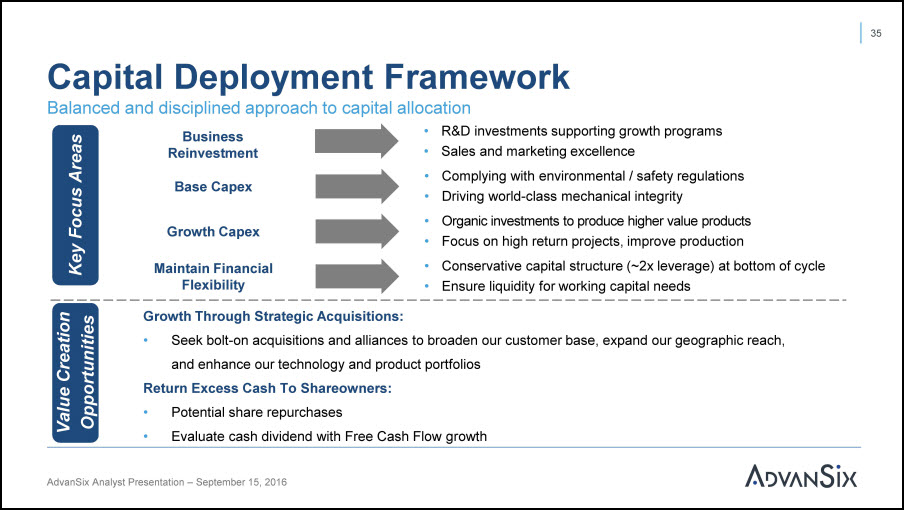
Base Capex Growth Capex Maintain Financial Flexibility Growth Through Strategic Acquisitions:Seek bolt-on acquisitions and alliances to broaden our customer base, expand our geographic reach, and enhance our technology and product portfoliosReturn Excess Cash To Shareowners:Potential share repurchasesEvaluate cash dividend with Free Cash Flow growth Capital Deployment Framework R&D investments supporting growth programsSales and marketing excellenceComplying with environmental / safety regulationsDriving world-class mechanical integrityOrganic investments to produce higher value productsFocus on high return projects, improve productionConservative capital structure (~2x leverage) at bottom of cycleEnsure liquidity for working capital needs AdvanSix Analyst Presentation – September 15, 2016 35 Balanced and disciplined approach to capital allocation BusinessReinvestment
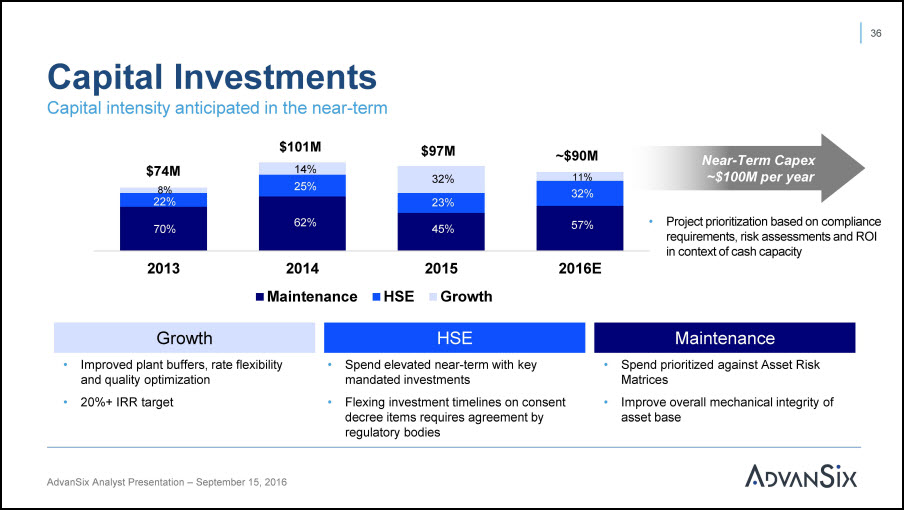
2013 2014Maintenance 2015HSE Growth 2016E $74M8% AdvanSix Analyst Presentation – September 15, 2016 $101M $97M ~$90M Near-Term Capex~$100M per year Maintenance Spend elevated near-term with key mandated investmentsFlexing investment timelines on consent decree items requires agreement by regulatory bodies HSE Spend prioritized against Asset Risk MatricesImprove overall mechanical integrity of asset base Growth Improved plant buffers, rate flexibility and quality optimization20%+ IRR target Capital InvestmentsCapital intensity anticipated in the near-term 36 70% 22% 11% 57% 32% Project prioritization based on compliance requirements, risk assessments and ROI in context of cash capacity 62% 25% 14% 45% 23% 32%
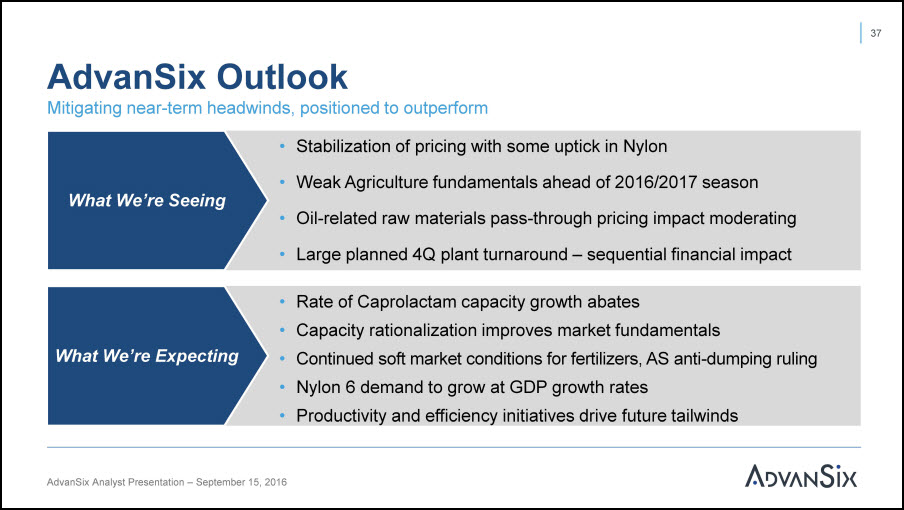
What We’re Seeing What We’re Expecting AdvanSix Analyst Presentation – September 15, 2016 Mitigating near-term headwinds, positioned to outperformStabilization of pricing with some uptick in Nylon Weak Agriculture fundamentals ahead of 2016/2017 seasonOil-related raw materials pass-through pricing impact moderating Large planned 4Q plant turnaround – sequential financial impact Rate of Caprolactam capacity growth abatesCapacity rationalization improves market fundamentalsContinued soft market conditions for fertilizers, AS anti-dumping rulingNylon 6 demand to grow at GDP growth ratesProductivity and efficiency initiatives drive future tailwinds AdvanSix Outlook 37

Investment Highlights Leading Vertically Integrated Nylon 6 Producer Sustainable Lowest Cost Position Strong Relationships Driven By Dedicated Sales Teams Global Reach Diverse Revenue Sources Continuous Investment In R&D And Technology 1 2 3 4 5 6 AdvanSix Analyst Presentation – September 15, 2016 38
Q&A AdvanSix Analyst Presentation – September 15, 2016 39
Appendix AdvanSix Analyst Presentation – September 15, 2016 40
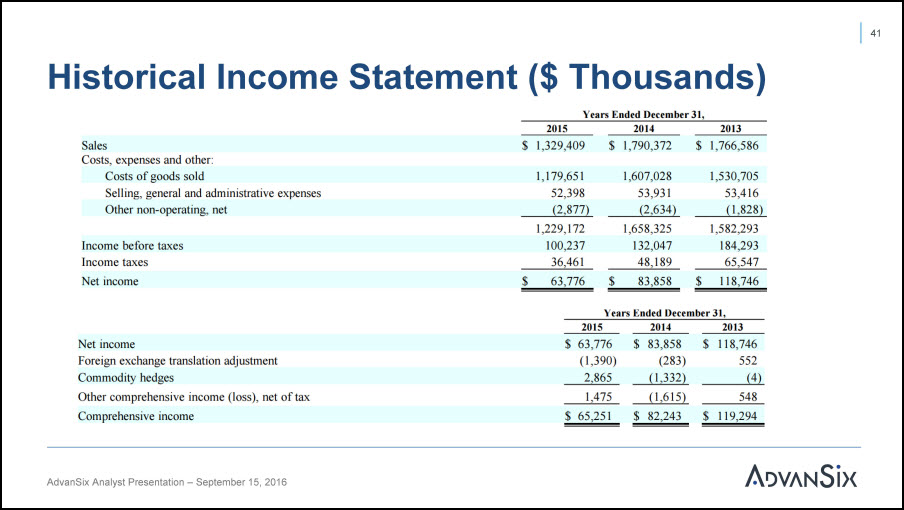
Historical Income Statement ($ Thousands) 41 AdvanSix Analyst Presentation – September 15, 2016
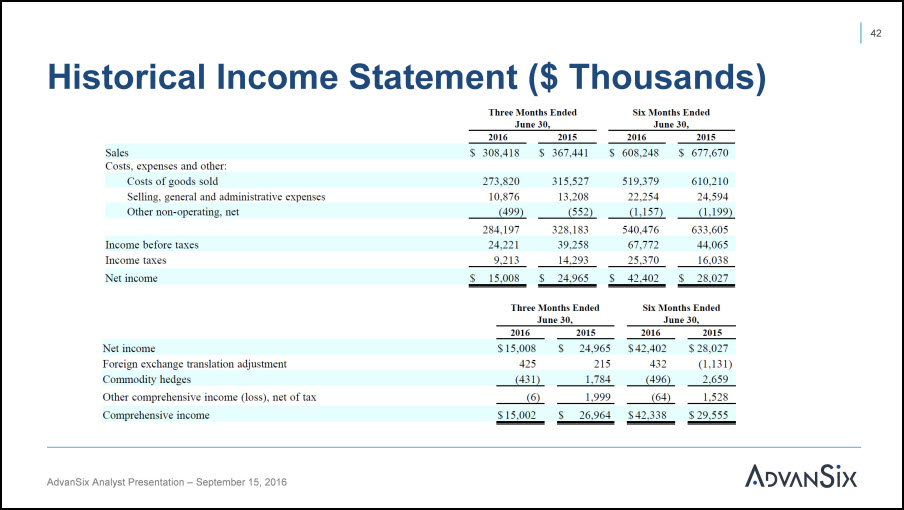
Historical Income Statement ($ Thousands) 42 AdvanSix Analyst Presentation – September 15, 2016
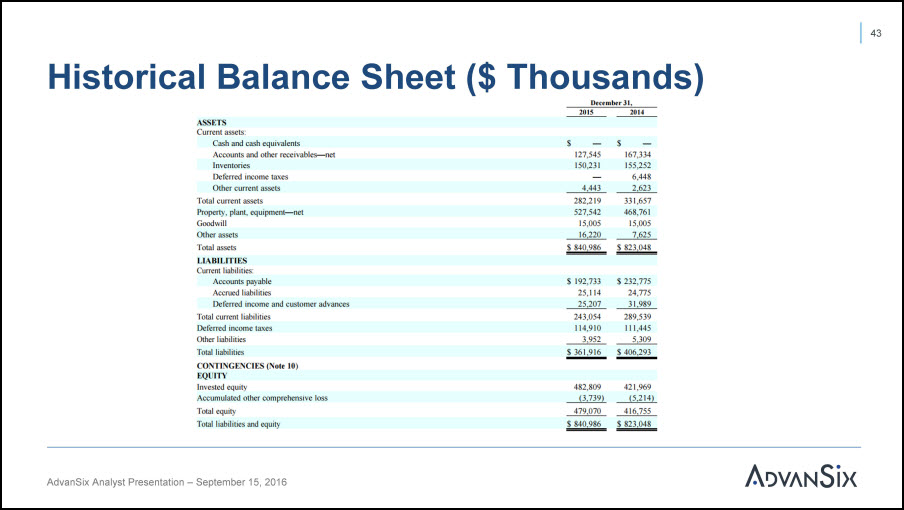
Historical Balance Sheet ($ Thousands) 43 AdvanSix Analyst Presentation – September 15, 2016
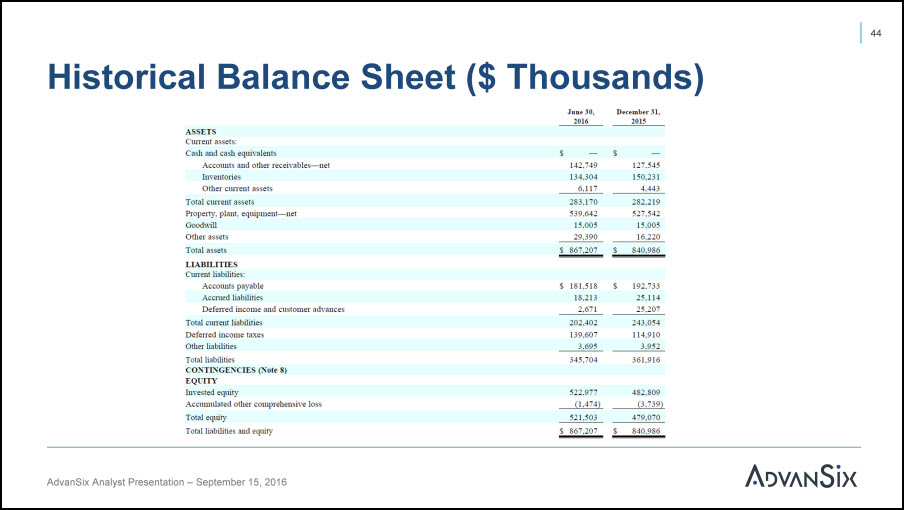
Historical Balance Sheet ($ Thousands) 44 AdvanSix Analyst Presentation – September 15, 2016
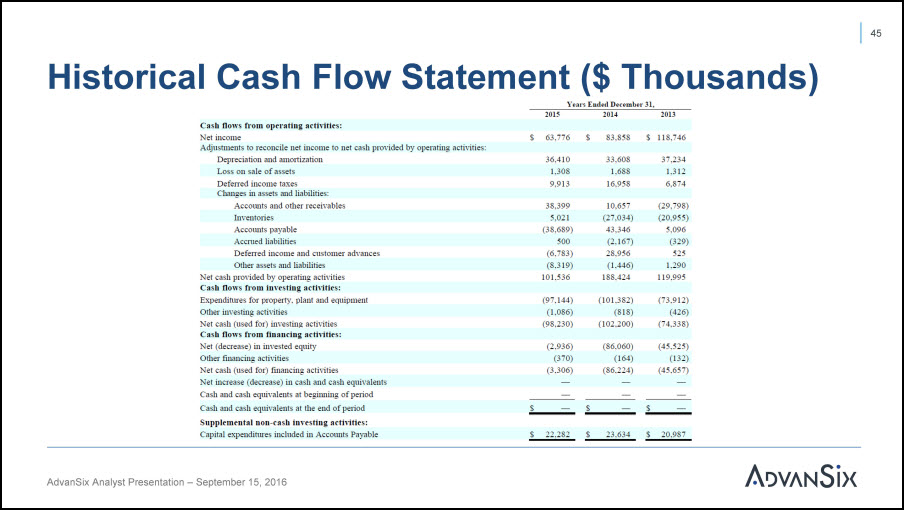
Historical Cash Flow Statement ($ Thousands) 45 AdvanSix Analyst Presentation – September 15, 2016
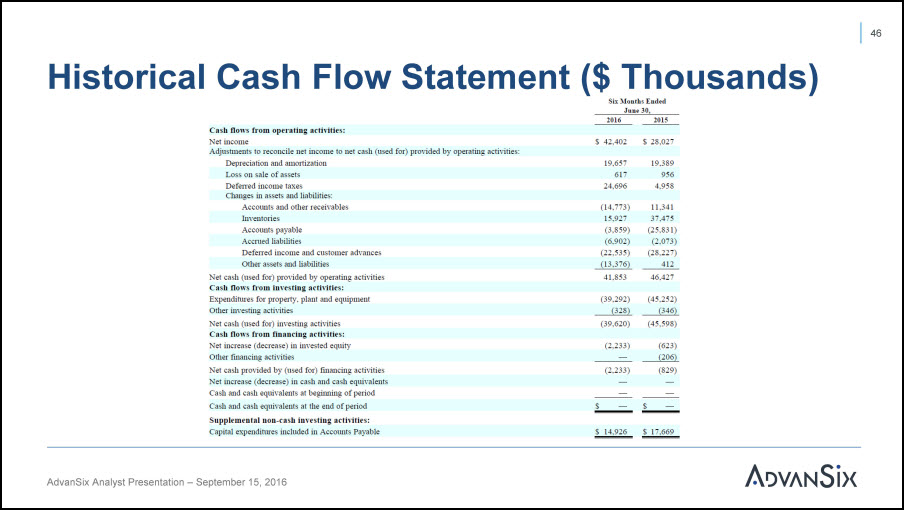
Historical Cash Flow Statement ($ Thousands) 46 AdvanSix Analyst Presentation – September 15, 2016
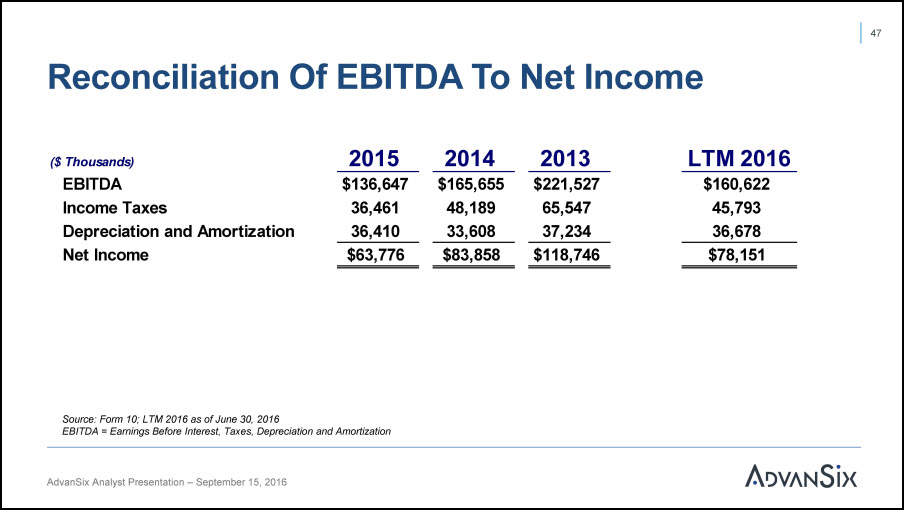
Reconciliation Of EBITDA To Net Income AdvanSix Analyst Presentation – September 15, 2016 47 Source: Form 10; LTM 2016 as of June 30, 2016EBITDA = Earnings Before Interest, Taxes, Depreciation and Amortization ($ Thousands) 2015 2014 2013 LTM 2016 EBITDA $136,647 $165,655 $221,527 $160,622 Income Taxes 36,461 48,189 65,547 45,793 Depreciation and Amortization 36,410 33,608 37,234 36,678 Net Income $63,776 $83,858 $118,746 $78,151
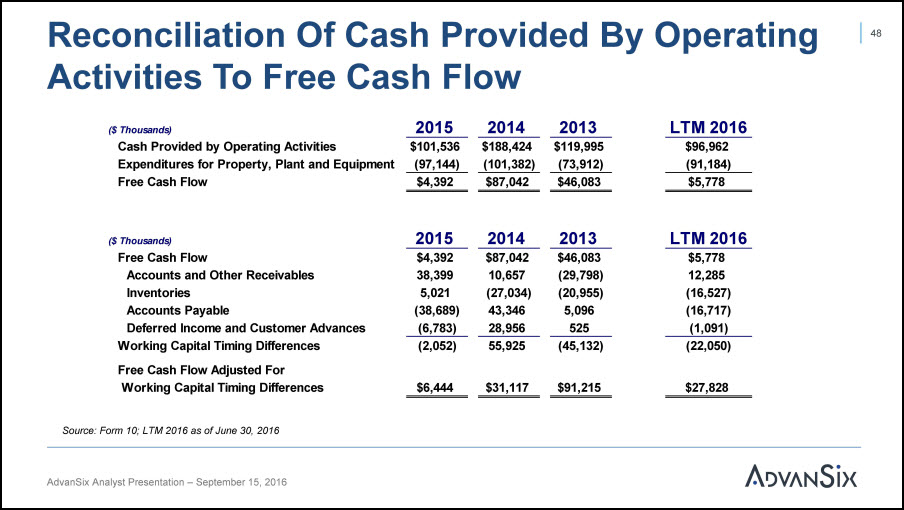
Reconciliation Of Cash Provided By Operating Activities To Free Cash Flow ($ Thousands) 2015 2014 2013 LTM 2016 Cash Provided by Operating Activities $101,536 $188,424 $119,995 $96,962 Expenditures for Property, Plant and Equipment (97,144) (101,382) (73,912) (91,184) Free Cash Flow $4,392 $87,042 $46,083 $5,778 ($ Thousands) 2015 2014 2013 LTM 2016 Free Cash Flow $4,392 $87,042 $46,083 $5,778 Accounts and Other Receivables 38,399 10,657 (29,798) 12,285 Inventories 5,021 (27,034) (20,955) (16,527) Accounts Payable (38,689) 43,346 5,096 (16,717) Deferred Income and Customer Advances (6,783) 28,956 525 (1,091) Working Capital Timing Differences (2,052) 55,925 (45,132) (22,050) Free Cash Flow Adjusted For Working Capital Timing Differences $6,444 $31,117 $91,215 $27,828 Source: Form 10; LTM 2016 as of June 30, 2016 48
Thank You