Attached files
| file | filename |
|---|---|
| 8-K - 8-K - SELECT BANCORP, INC. | v448842_8k.htm |
Exhibit 99.1
Confidential Management Presentation September 8, 2016
2 Disclaimer This presentation contains forward - looking statements (within the meaning of the Private Securities Litigation Reform Act of 1995 ) . Such statements are not historical facts, but rather are based on our current expectations, estimates and projections about our industry, our beliefs and assumptions . Words including “may,” “will,” “could,” “would,” “should,” “anticipate,” “expect,” “intend,” “plan,” “project,” “believe,” “seek,” “estimate” and similar expressions are intended to identify forward - looking statements . These statements are not guarantees of future performance and are subject to certain risks, uncertainties and other factors, some of which remain beyond our control, are difficult to predict, and could cause actual results to differ materially from those expressed or forecasted in the forward - looking statements . Such risk factors are disclosed from time to time in filings made by Select Bancorp, Inc . with the Securities and Exchange Commission . We caution you not to place undue reliance on these forward - looking statements, which reflect management’s view only as of the date of this presentation . We are not obligated to update these statements or publicly release the result of any revisions to them to reflect events or circumstances after the date of this presentation or to reflect the occurrence of unanticipated events .
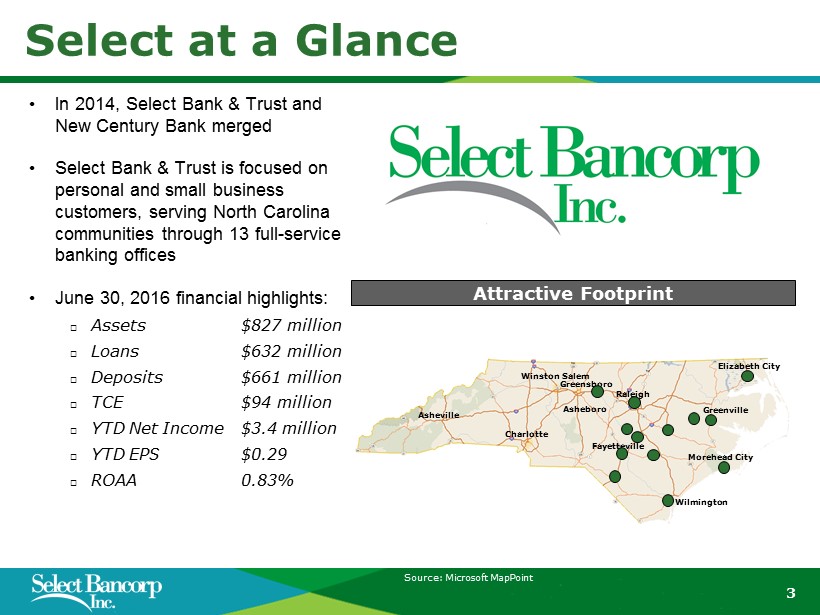
Source: Microsoft MapPoint 3 Select at a Glance • In 2014, Select Bank & Trust and New Century Bank merged • Select Bank & Trust is focused on personal and small business customers, serving North Carolina communities through 13 full - service banking offices • June 30, 2016 financial highlights: □ Assets $ 827 million □ Loans $ 632 million □ Deposits $ 661 million □ TCE $ 94 million □ YTD Net Income $ 3 . 4 million □ YTD EPS $ 0 . 29 □ ROAA 0 . 83 % Charlotte Asheville Greenville Fayetteville Wilmington Raleigh Winston Salem Greensboro Asheboro Elizabeth City Morehead City Attractive Footprint
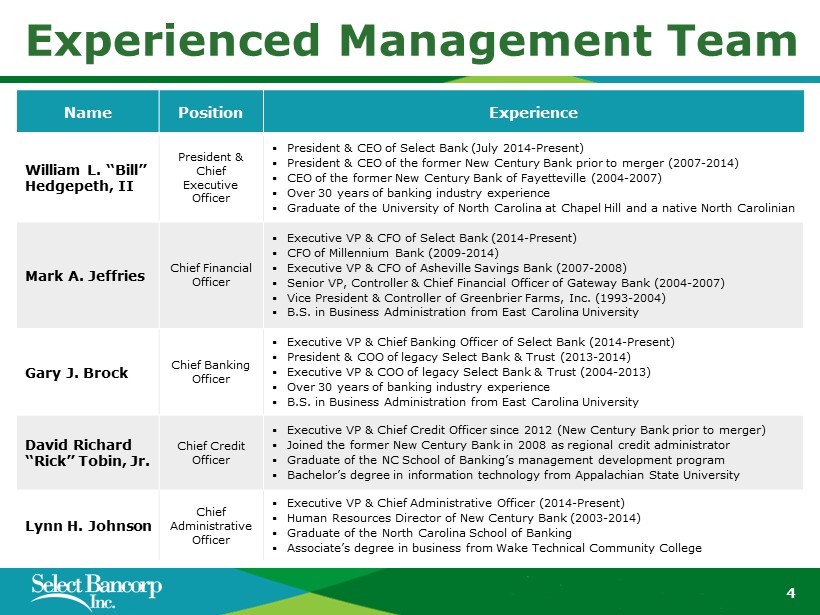
4 Experienced Management Team Name Position Experience William L. “Bill” Hedgepeth, II President & Chief Executive Officer ▪ President & CEO of Select Bank (July 2014 - Present) ▪ President & CEO of the former New Century Bank prior to merger (2007 - 2014) ▪ CEO of the former New Century Bank of Fayetteville (2004 - 2007) ▪ Over 30 years of banking industry experience ▪ Graduate of the University of North Carolina at Chapel Hill and a native North Carolinian Mark A. Jeffries Chief Financial Officer ▪ Executive VP & CFO of Select Bank (2014 - Present) ▪ CFO of Millennium Bank (2009 - 2014) ▪ Executive VP & CFO of Asheville Savings Bank (2007 - 2008) ▪ Senior VP, Controller & Chief Financial Officer of Gateway Bank (2004 - 2007) ▪ Vice President & Controller of Greenbrier Farms, Inc. (1993 - 2004) ▪ B.S. in Business Administration from East Carolina University Gary J. Brock Chief Banking Officer ▪ Executive VP & Chief Banking Officer of Select Bank (2014 - Present) ▪ President & COO of legacy Select Bank & Trust (2013 - 2014) ▪ Executive VP & COO of legacy Select Bank & Trust (2004 - 2013) ▪ Over 30 years of banking industry experience ▪ B.S. in Business Administration from East Carolina University David Richard “Rick” Tobin, Jr. Chief Credit Officer ▪ Executive VP & Chief Credit Officer since 2012 (New Century Bank prior to merger) ▪ Joined the former New Century Bank in 2008 as regional credit administrator ▪ Graduate of the NC School of Banking’s management development program ▪ Bachelor’s degree in information technology from Appalachian State University Lynn H. Johnson Chief Administrative Officer ▪ Executive VP & Chief Administrative Officer (2014 - Present) ▪ Human Resources Director of New Century Bank (2003 - 2014) ▪ Graduate of the North Carolina School of Banking ▪ Associate’s degree in business from Wake Technical Community College
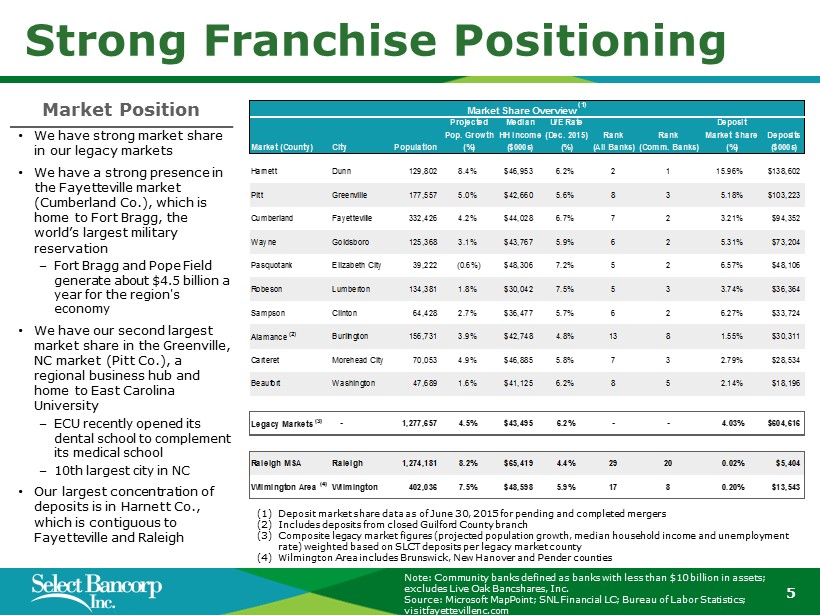
Note: Community banks defined as banks with less than $10 billion in assets; excludes Live Oak Bancshares, Inc. Source: Microsoft MapPoint; SNL Financial LC; Bureau of Labor Statistics; visitfayettevillenc.com 5 Strong Franchise Positioning Market Position • We have strong market share in our legacy markets • We have a strong presence in the Fayetteville market (Cumberland Co.), which is home to Fort Bragg, the world’s largest military reservation ‒ Fort Bragg and Pope Field generate about $4.5 billion a year for the region's economy • We have our second largest market share in the Greenville, NC market (Pitt Co.), a regional business hub and home to East Carolina University ‒ ECU recently opened its dental school to complement its medical school ‒ 10th largest city in NC • Our largest concentration of deposits is in Harnett Co., which is contiguous to Fayetteville and Raleigh Market Share Overview (1) Projected Median U/E Rate Deposit Pop. Growth HH Income(Dec. 2015) Rank Rank Market Share Deposits Market (County) City Population (%) ($000s) (%) (All Banks) (Comm. Banks) (%) ($000s) Harnett Dunn 129,802 8.4% $46,953 6.2% 2 1 15.96% $138,602 Pitt Greenville 177,557 5.0% $42,660 5.6% 8 3 5.18% $103,223 Cumberland Fayetteville 332,426 4.2% $44,028 6.7% 7 2 3.21% $94,352 Wayne Goldsboro 125,368 3.1% $43,767 5.9% 6 2 5.31% $73,204 Pasquotank Elizabeth City 39,222 (0.6%) $48,306 7.2% 5 2 6.57% $48,106 Robeson Lumberton 134,381 1.8% $30,042 7.5% 5 3 3.74% $36,364 Sampson Clinton 64,428 2.7% $36,477 5.7% 6 2 6.27% $33,724 Alamance (2) Burlington 156,731 3.9% $42,748 4.8% 13 8 1.55% $30,311 Carteret Morehead City 70,053 4.9% $46,885 5.8% 7 3 2.79% $28,534 Beaufort Washington 47,689 1.6% $41,125 6.2% 8 5 2.14% $18,196 Legacy Markets (3) - 1,277,657 4.5% $43,495 6.2% - - 4.03% $604,616 Raleigh MSA Raleigh 1,274,181 8.2% $65,419 4.4% 29 20 0.02% $5,404 Wilmington Area (4) Wilmington 402,036 7.5% $48,598 5.9% 17 8 0.20% $13,543 (1) Deposit market share data as of June 30, 2015 for pending and completed mergers (2) Includes deposits from closed Guilford County branch (3) Composite legacy market figures (projected population growth, median household income and unemployment rate) weighted based on SLCT deposits per legacy market county (4) Wilmington Area includes Brunswick, New Hanover and Pender counties
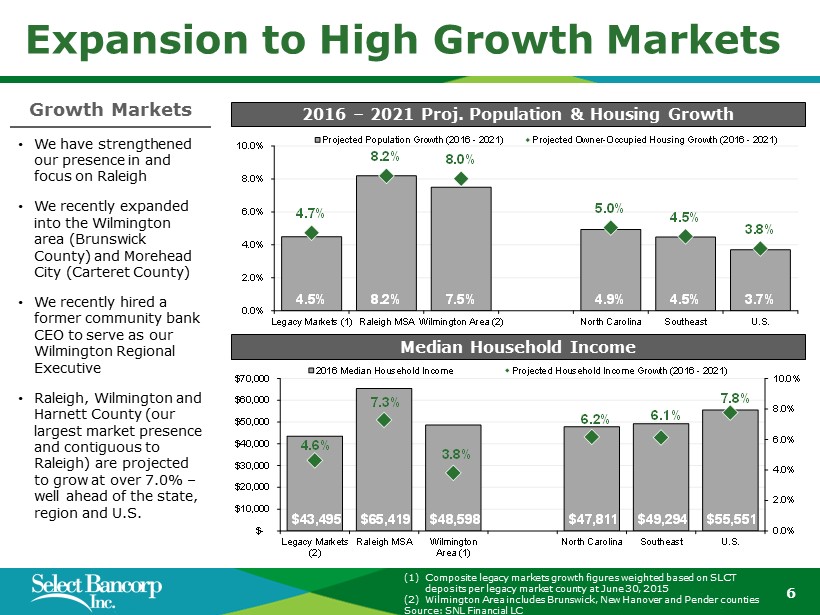
(1) Composite legacy markets growth figures weighted based on SLCT deposits per legacy market county at June 30, 2015 (2) Wilmington Area includes Brunswick, New Hanover and Pender counties Source: SNL Financial LC 6 Expansion to High Growth Markets Median Household Income • We have strengthened our presence in and focus on Raleigh • We recently expanded into the Wilmington area (Brunswick County ) and Morehead City (Carteret County) • We recently hired a former community bank CEO to serve as our Wilmington Regional Executive • Raleigh, Wilmington and Harnett County (our largest market presence and contiguous to Raleigh) are projected to grow at over 7.0% – well ahead of the state, region and U.S. Growth Markets 2016 – 2021 Proj. Population & Housing Growth 4.5% 8.2% 7.5% 4.9% 4.5% 3.7% 4.7% 8.2% 8.0% 5.0% 4.5% 3.8% 0.0% 2.0% 4.0% 6.0% 8.0% 10.0% Legacy Markets (1) Raleigh MSA Wilmington Area (2) North Carolina Southeast U.S. Projected Population Growth (2016 - 2021) Projected Owner-Occupied Housing Growth (2016 - 2021) $43,495 $65,419 $48,598 $47,811 $49,294 $55,551 4.6% 7.3% 3.8% 6.2% 6.1% 7.8% 0.0% 2.0% 4.0% 6.0% 8.0% 10.0% $- $10,000 $20,000 $30,000 $40,000 $50,000 $60,000 $70,000 Legacy Markets (2) Raleigh MSA Wilmington Area (1) North Carolina Southeast U.S. 2016 Median Household Income Projected Household Income Growth (2016 - 2021)
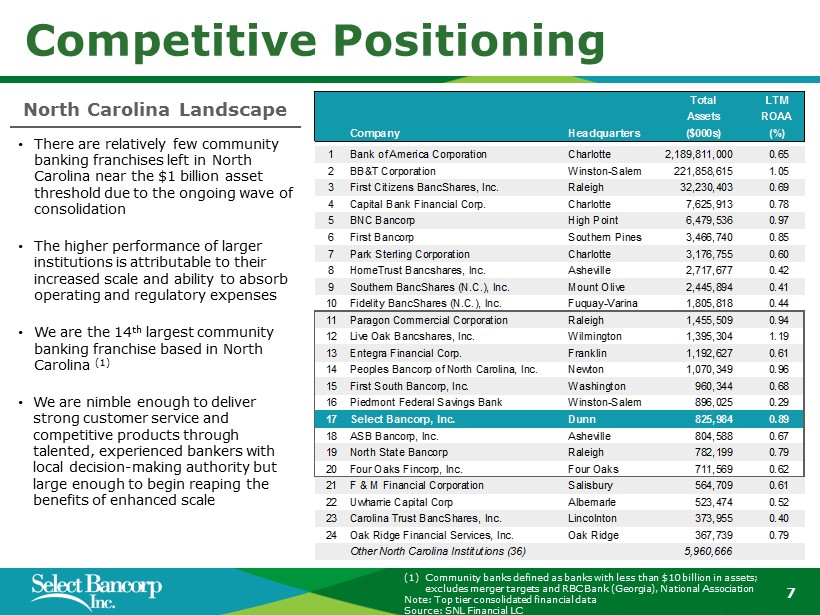
(1) Community banks defined as banks with less than $10 billion in assets; excludes merger targets and RBC Bank (Georgia), National Association Note: Top tier consolidated financial data Source: SNL Financial LC 7 Competitive Positioning North Carolina Landscape Total LTM Assets ROAA Company Headquarters ($000s) (%) 1 Bank of America Corporation Charlotte 2,189,811,000 0.65 2 BB&T Corporation Winston-Salem 221,858,615 1.05 3 First Citizens BancShares, Inc. Raleigh 32,230,403 0.69 4 Capital Bank Financial Corp. Charlotte 7,625,913 0.78 5 BNC Bancorp High Point 6,479,536 0.97 6 First Bancorp Southern Pines 3,466,740 0.85 7 Park Sterling Corporation Charlotte 3,176,755 0.60 8 HomeTrust Bancshares, Inc. Asheville 2,717,677 0.42 9 Southern BancShares (N.C.), Inc. Mount Olive 2,445,894 0.41 10 Fidelity BancShares (N.C.), Inc. Fuquay-Varina 1,805,818 0.44 11 Paragon Commercial Corporation Raleigh 1,455,509 0.94 12 Live Oak Bancshares, Inc. Wilmington 1,395,304 1.19 13 Entegra Financial Corp. Franklin 1,192,627 0.61 14 Peoples Bancorp of North Carolina, Inc. Newton 1,070,349 0.96 15 First South Bancorp, Inc. Washington 960,344 0.68 16 Piedmont Federal Savings Bank Winston-Salem 896,025 0.29 17 Select Bancorp, Inc. Dunn 825,984 0.89 18 ASB Bancorp, Inc. Asheville 804,588 0.67 19 North State Bancorp Raleigh 782,199 0.79 20 Four Oaks Fincorp, Inc. Four Oaks 711,569 0.62 21 F & M Financial Corporation Salisbury 564,709 0.61 22 Uwharrie Capital Corp Albemarle 523,474 0.52 23 Carolina Trust BancShares, Inc. Lincolnton 373,955 0.40 24 Oak Ridge Financial Services, Inc. Oak Ridge 367,739 0.79 Other North Carolina Institutions (36) 5,960,666 • There are relatively few community banking franchises left in North Carolina near the $1 billion asset threshold due to the ongoing wave of consolidation • The higher performance of larger institutions is attributable to their increased scale and ability to absorb operating and regulatory expenses • We are the 14 th largest community banking franchise based in North Carolina (1) • We are nimble enough to deliver strong customer service and competitive products through talented, experienced bankers with local decision - making authority but large enough to begin reaping the benefits of enhanced scale
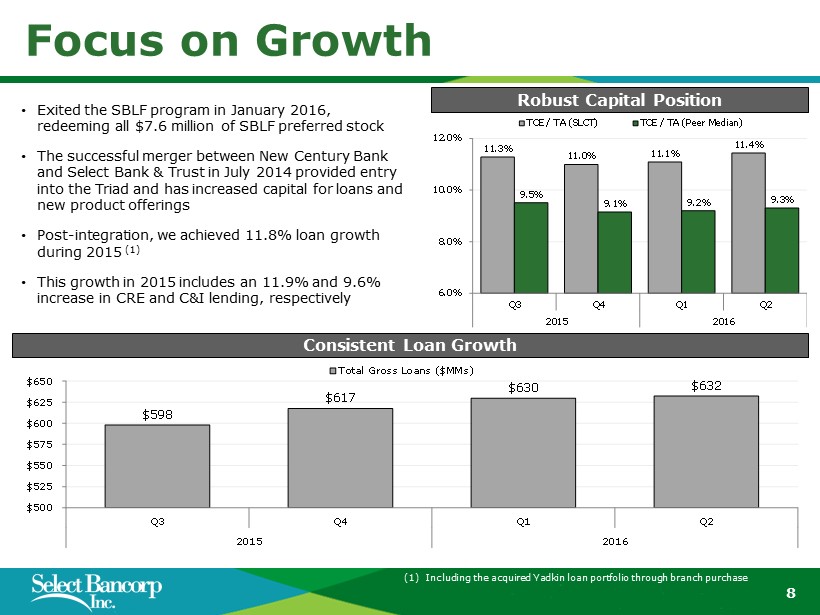
(1) Including the acquired Yadkin loan portfolio through branch purchase 8 Focus on Growth Robust Capital Position Consistent Loan Growth • Exited the SBLF program in January 2016, redeeming all $7.6 million of SBLF preferred stock • The successful merger between New Century Bank and Select Bank & Trust in July 2014 provided entry into the Triad and has increased capital for loans and new product offerings • Post - integration, we achieved 11.8% loan growth during 2015 (1) • This growth in 2015 includes an 11.9% and 9.6% increase in CRE and C&I lending, respectively $598 $617 $630 $632 $500 $525 $550 $575 $600 $625 $650 Q3 Q4 Q1 Q2 2015 2016 Total Gross Loans ($MMs) 11.3% 11.0% 11.1% 11.4% 9.5% 9.1% 9.2% 9.3% 6.0% 8.0% 10.0% 12.0% Q3 Q4 Q1 Q2 2015 2016 TCE / TA (SLCT) TCE / TA (Peer Median)
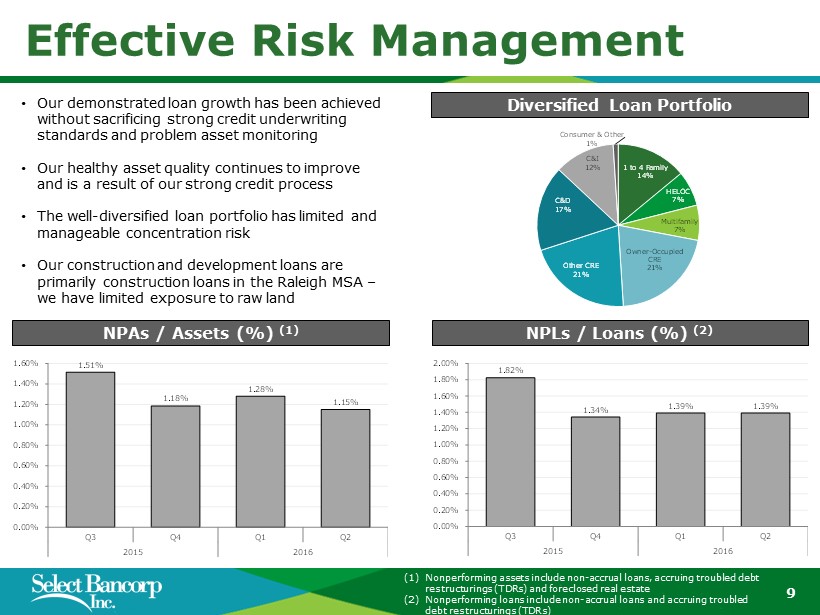
(1) Nonperforming assets include non - accrual loans, accruing troubled debt restructurings (TDRs) and foreclosed real estate (2) Nonperforming loans include non - accrual loans and accruing troubled debt restructurings (TDRs) 9 Effective Risk Management Diversified Loan Portfolio NPAs / Assets (%) (1) 1 to 4 Family 14% HELOC 7% Multifamily 7% Owner - Occupied CRE 21% Other CRE 21% C&D 17% C&I 12% Consumer & Other 1% NPLs / Loans (%) (2) 1.51% 1.18% 1.28% 1.15% 0.00% 0.20% 0.40% 0.60% 0.80% 1.00% 1.20% 1.40% 1.60% Q3 Q4 Q1 Q2 2015 2016 1.82% 1.34% 1.39% 1.39% 0.00% 0.20% 0.40% 0.60% 0.80% 1.00% 1.20% 1.40% 1.60% 1.80% 2.00% Q3 Q4 Q1 Q2 2015 2016 • Our demonstrated loan growth has been achieved without sacrificing strong credit underwriting standards and problem asset monitoring • Our healthy asset quality continues to improve and is a result of our strong credit process • The well - diversified loan portfolio has limited and manageable concentration risk • Our construction and development loans are primarily construction loans in the Raleigh MSA – we have limited exposure to raw land
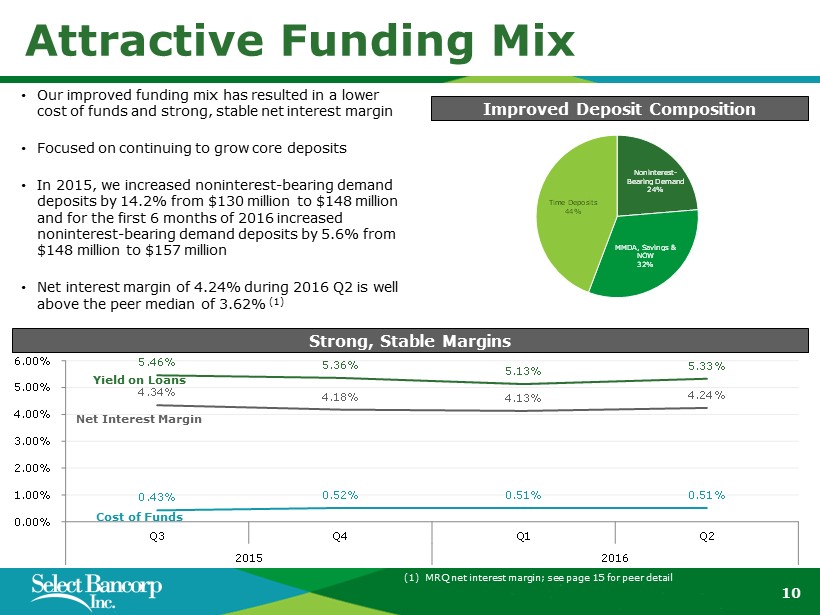
(1) MRQ net interest margin; see page 15 for peer detail 10 Attractive Funding Mix Improved Deposit Composition 5.46% 5.36% 5.13% 5.33% 4.34% 4.18% 4.13% 4.24% 0.43% 0.52% 0.51% 0.51% 0.00% 1.00% 2.00% 3.00% 4.00% 5.00% 6.00% Q3 Q4 Q1 Q2 2015 2016 Noninterest - Bearing Demand 24% MMDA, Savings & NOW 32% Time Deposits 44% Yield on Loans Net Interest Margin Cost of Funds • Our improved funding mix has resulted in a lower cost of funds and strong, stable net interest margin • Focused on continuing to grow core deposits • In 2015, we increased noninterest - bearing demand deposits by 14.2% from $130 million to $148 million and for the first 6 months of 2016 increased noninterest - bearing demand deposits by 5.6% from $148 million to $157 million • Net interest margin of 4.24% during 2016 Q2 is well above the peer median of 3.62% (1) Strong, Stable Margins
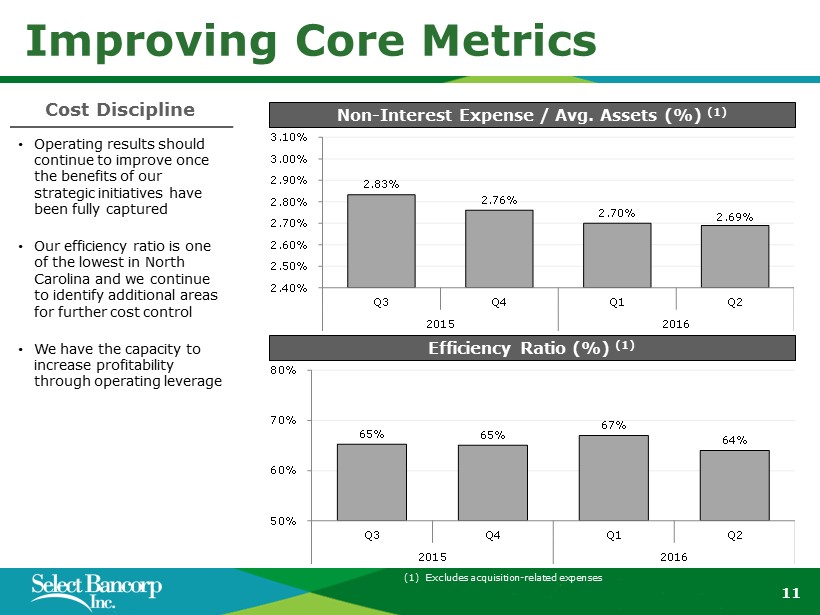
(1) Excludes acquisition - related expenses 11 Improving Core Metrics Cost Discipline Non - Interest Expense / Avg. Assets (%) (1) Efficiency Ratio (%) (1) 2.83% 2.76% 2.70% 2.69% 2.40% 2.50% 2.60% 2.70% 2.80% 2.90% 3.00% 3.10% Q3 Q4 Q1 Q2 2015 2016 65% 65% 67% 64% 50% 60% 70% 80% Q3 Q4 Q1 Q2 2015 2016 • Operating results should continue to improve once the benefits of our strategic initiatives have been fully captured • Our efficiency ratio is one of the lowest in North Carolina and we continue to identify additional areas for further cost control • We have the capacity to increase profitability through operating leverage
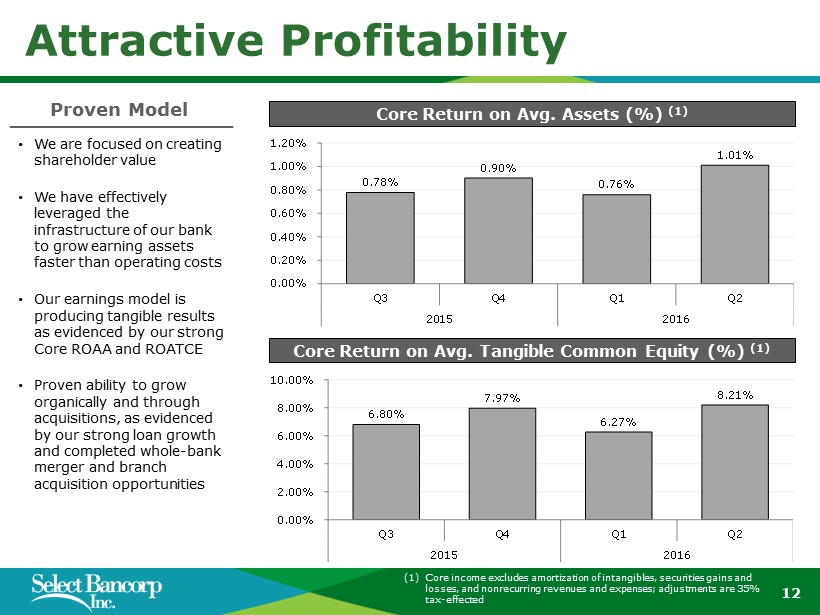
(1) Core income excludes amortization of intangibles, securities gains and losses, and nonrecurring revenues and expenses; adjustments are 35% tax - effected 12 Attractive Profitability Core Return on Avg. Tangible Common Equity (%) (1) Proven Model Core Return on Avg. Assets (%) (1) 0.78% 0.90% 0.76% 1.01% 0.00% 0.20% 0.40% 0.60% 0.80% 1.00% 1.20% Q3 Q4 Q1 Q2 2015 2016 6.80% 7.97% 6.27% 8.21% 0.00% 2.00% 4.00% 6.00% 8.00% 10.00% Q3 Q4 Q1 Q2 2015 2016 • We are focused on creating shareholder value • We have effectively leveraged the infrastructure of our bank to grow earning assets faster than operating costs • Our earnings model is producing tangible results as evidenced by our strong Core ROAA and ROATCE • Proven ability to grow organically and through acquisitions, as evidenced by our strong loan growth and completed whole - bank merger and branch acquisition opportunities
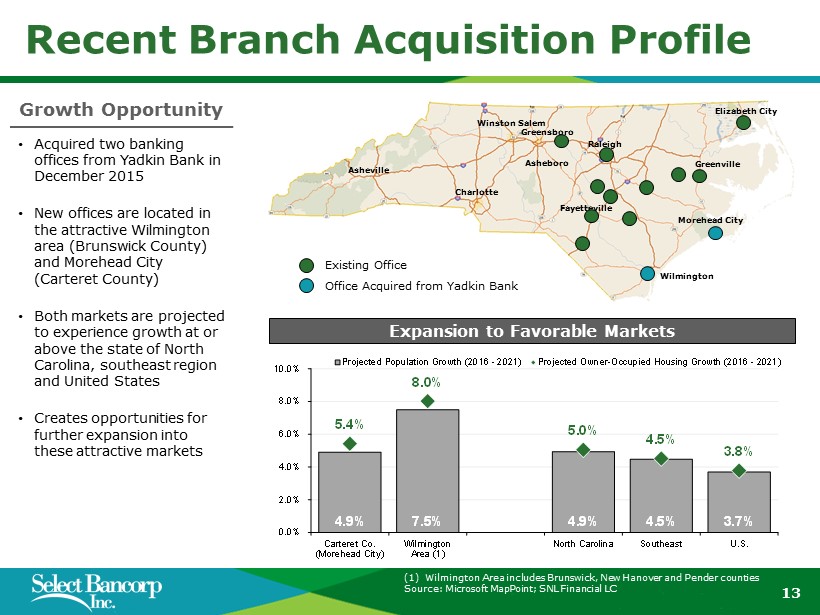
(1) Wilmington Area includes Brunswick, New Hanover and Pender counties Source: Microsoft MapPoint; SNL Financial LC 13 Recent Branch Acquisition Profile Growth Opportunity Charlotte Asheville Greenville Fayetteville Wilmington Raleigh Winston Salem Greensboro Asheboro Elizabeth City Morehead City Expansion to Favorable Markets Existing Office Office Acquired from Yadkin Bank • Acquired two banking offices from Yadkin Bank in December 2015 • New offices are located in the attractive Wilmington area (Brunswick County) and Morehead City (Carteret County) • Both markets are projected to experience growth at or above the state of North Carolina, southeast region and United States • Creates opportunities for further expansion into these attractive markets 4.9% 7.5% 4.9% 4.5% 3.7% 5.4% 8.0% 5.0% 4.5% 3.8% 0.0% 2.0% 4.0% 6.0% 8.0% 10.0% Carteret Co. (Morehead City) Wilmington Area (1) North Carolina Southeast U.S. Projected Population Growth (2016 - 2021) Projected Owner-Occupied Housing Growth (2016 - 2021)
14 Strategic Focus • Further increasing strong market share • Gaining scale in high - growth Raleigh and Wilmington markets • Leveraging strong internal infrastructure • Continuing to increase core operating performance • Open to evaluating branch and whole bank acquisitions
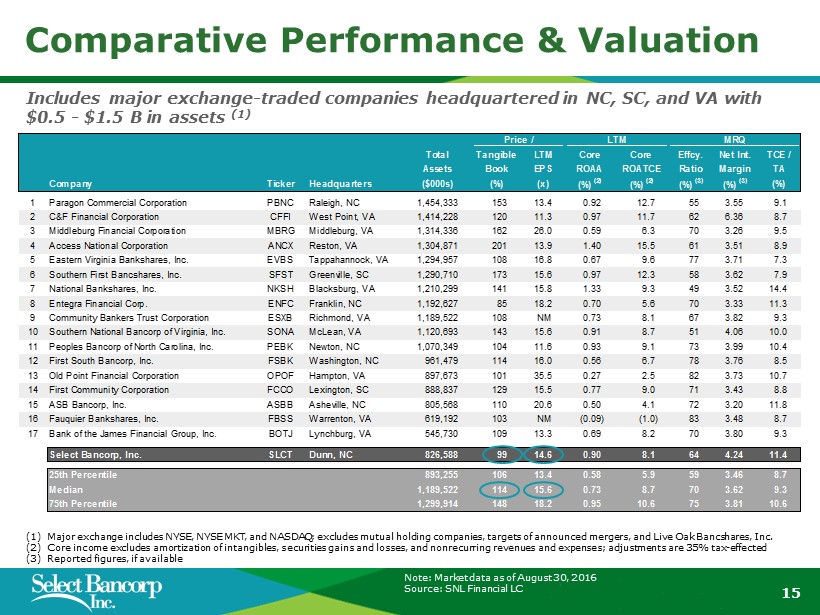
(1) Major exchange includes NYSE, NYSE MKT, and NASDAQ; excludes mutual holding companies, targets of announced mergers, and Live Oa k Bancshares, Inc. (2) Core income excludes amortization of intangibles, securities gains and losses, and nonrecurring revenues and expenses; adjust men ts are 35% tax - effected (3) Reported figures, if available Price / LTM MRQ Total Tangible LTM Core Core Effcy. Net Int. TCE / Assets Book EPS ROAA ROATCE Ratio Margin TA Company Ticker Headquarters ($000s) (%) (x) (%) (2) (%) (2) (%) (3) (%) (3) (%) 1 Paragon Commercial Corporation PBNC Raleigh, NC 1,454,333 153 13.4 0.92 12.7 55 3.55 9.1 2 C&F Financial Corporation CFFI West Point, VA 1,414,228 120 11.3 0.97 11.7 62 6.36 8.7 3 Middleburg Financial Corporation MBRG Middleburg, VA 1,314,336 162 26.0 0.59 6.3 70 3.26 9.5 4 Access National Corporation ANCX Reston, VA 1,304,871 201 13.9 1.40 15.5 61 3.51 8.9 5 Eastern Virginia Bankshares, Inc. EVBS Tappahannock, VA 1,294,957 108 16.8 0.67 9.6 77 3.71 7.3 6 Southern First Bancshares, Inc. SFST Greenville, SC 1,290,710 173 15.6 0.97 12.3 58 3.62 7.9 7 National Bankshares, Inc. NKSH Blacksburg, VA 1,210,299 141 15.8 1.33 9.3 49 3.52 14.4 8 Entegra Financial Corp. ENFC Franklin, NC 1,192,627 85 18.2 0.70 5.6 70 3.33 11.3 9 Community Bankers Trust Corporation ESXB Richmond, VA 1,189,522 108 NM 0.73 8.1 67 3.82 9.3 10 Southern National Bancorp of Virginia, Inc. SONA McLean, VA 1,120,693 143 15.6 0.91 8.7 51 4.06 10.0 11 Peoples Bancorp of North Carolina, Inc. PEBK Newton, NC 1,070,349 104 11.6 0.93 9.1 73 3.99 10.4 12 First South Bancorp, Inc. FSBK Washington, NC 961,479 114 16.0 0.56 6.7 78 3.76 8.5 13 Old Point Financial Corporation OPOF Hampton, VA 897,673 101 35.5 0.27 2.5 82 3.73 10.7 14 First Community Corporation FCCO Lexington, SC 888,837 129 15.5 0.77 9.0 71 3.43 8.8 15 ASB Bancorp, Inc. ASBB Asheville, NC 805,568 110 20.6 0.50 4.1 72 3.20 11.8 16 Fauquier Bankshares, Inc. FBSS Warrenton, VA 619,192 103 NM (0.09) (1.0) 83 3.48 8.7 17 Bank of the James Financial Group, Inc. BOTJ Lynchburg, VA 545,730 109 13.3 0.69 8.2 70 3.80 9.3 Select Bancorp, Inc. SLCT Dunn, NC 826,588 99 14.6 0.90 8.1 64 4.24 11.4 25th Percentile 893,255 106 13.4 0.58 5.9 59 3.46 8.7 Median 1,189,522 114 15.6 0.73 8.7 70 3.62 9.3 75th Percentile 1,299,914 148 18.2 0.95 10.6 75 3.81 10.6 Note: Market data as of August 30, 2016 Source: SNL Financial LC 15 Comparative Performance & Valuation Includes major exchange - traded companies headquartered in NC, SC, and VA with $0.5 - $1.5 B in assets (1)
16 Investment Rationale x Attractive franchise in central and eastern North Carolina x Favorable exposure to two of North Carolina’s most attractive markets : Raleigh and Wilmington x Advantageous market positioning x Low relative valuation on both a tangible book value and earnings basis x Focused on continued growth in promising markets x Track record of improving performance