Attached files
| file | filename |
|---|---|
| 8-K - 8-K - LEGG MASON, INC. | item701.htm |
For internal use only. Not for distribution to the public. For internal use only. Not for distribution to the public.
Sell Side Analyst Lunch and Investor Call
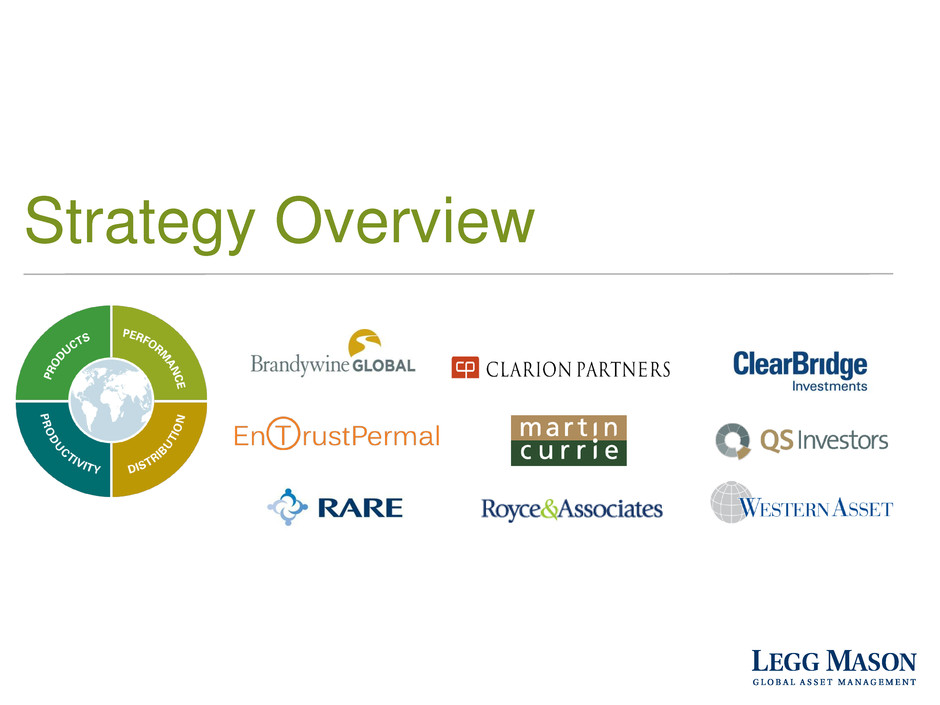
Brandywine Global | Clarion Partners | ClearBridge Investments | EnTrustPermal | Martin Currie | QS Investors | RARE Infrastructure | Royce & Associates | Western Asset
September 8, 2016
Joseph A. Sullivan
Chairman and Chief Executive Officer
Peter H. Nachtwey
Chief Financial Officer
Page 1
Important Disclosures
Forward-Looking Statements
This presentation may contain forward-looking statements within the meaning of the Private
Securities Litigation Reform Act of 1995.
These forward-looking statements are not statements of facts or guarantees of future
performance, and are subject to risks, uncertainties and other factors that may cause actual
results to differ materially from those discussed in the statements.
For a discussion of these risks and uncertainties, please see “Risk Factors” and “Management’s
Discussion and Analysis of Financial Condition and Results of Operations” in the Company’s
Annual Report on Form 10-K for the fiscal year ended March 31, 2016 and in the Company’s
quarterly reports on Form 10-Q.
Non-GAAP Financial Measures
This presentation includes non-GAAP financial information. This non-GAAP information is in
addition to, not a substitute for or superior to, measures of financial performance or liquidity
determined in accordance with GAAP. The company undertakes no obligation to update the
information contained in this presentation to reflect subsequently occurring events or
circumstances.
Agenda
• Strategy Overview
• Strategic Capital Update
• Non-GAAP Financial Measures
• Tax Shield
• Closing
• Q&A
Page 2
Strategy Overview
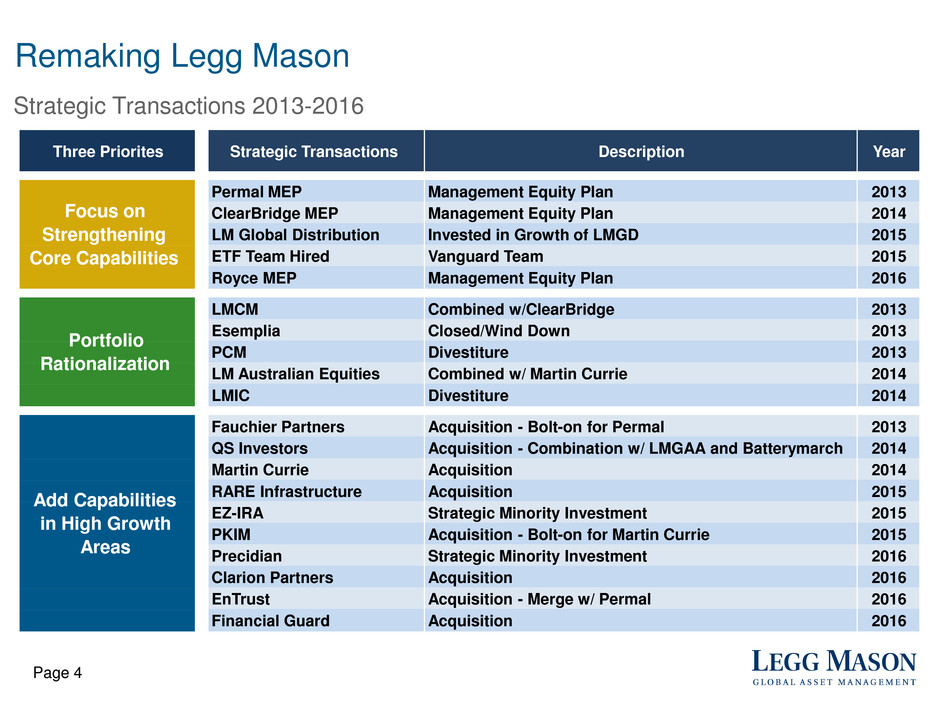
Remaking Legg Mason
Page 4
Strategic Transactions 2013-2016
Three Priorites Strategic Transactions Description Year
Permal MEP Management Equity Plan 2013
ClearBridge MEP Management Equity Plan 2014
LM Global Distribution Invested in Growth of LMGD 2015
ETF Team Hired Vanguard Team 2015
Royce MEP Management Equity Plan 2016
LMCM Combined w/ClearBridge 2013
Esemplia Closed/Wind Down 2013
PCM Divestiture 2013
LM Australian Equities Combined w/ Martin Currie 2014
LMIC Divestiture 2014
Fauchier Partners Acquisition - Bolt-on for Permal 2013
QS Investors Acquisition - Combination w/ LMGAA and Batterymarch 2014
Martin Currie Acquisition 2014
RARE Infrastructure Acquisition 2015
EZ-IRA Strategic Minority Investment 2015
PKIM Acquisition - Bolt-on for Martin Currie 2015
Precidian Strategic Minority Investment 2016
Clarion Partners Acquisition 2016
EnTrust Acquisition - Merge w/ Permal 2016
Financial Guard Acquisition 2016
Focus on
Strengthening
Core Capabilities
Portfolio
Rationalization
Add Capabilities
in High Growth
Areas
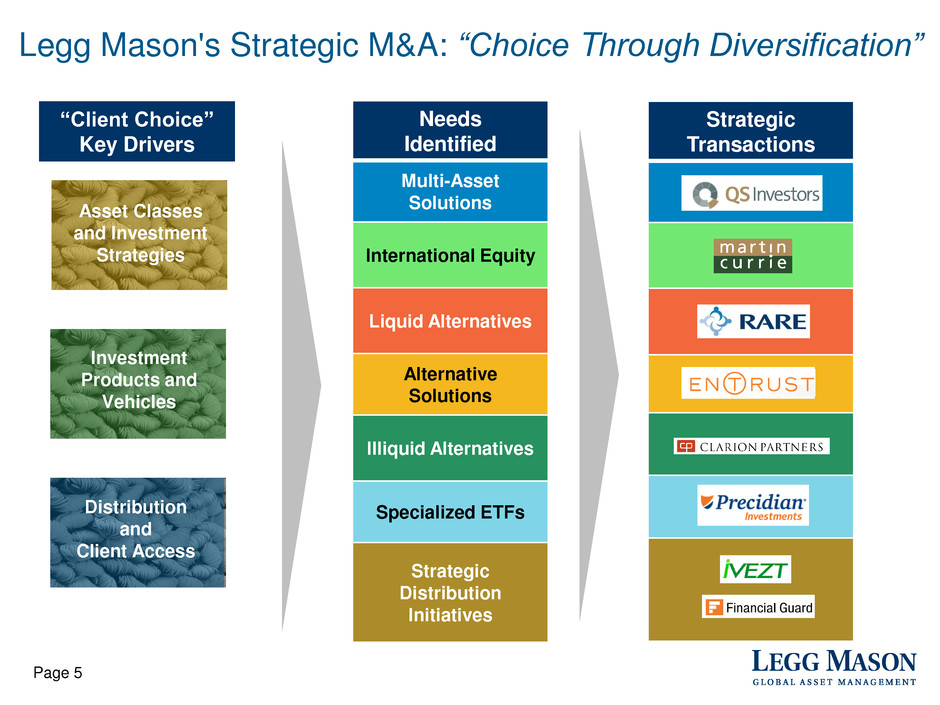
Legg Mason's Strategic M&A: “Choice Through Diversification”
Page 5
Asset Classes
and Investment
Strategies
Investment
Products and
Vehicles
Distribution
and
Client Access
Needs
Identified
Multi-Asset
Solutions
International Equity
Liquid Alternatives
Alternative
Solutions
Illiquid Alternatives
Specialized ETFs
Strategic
Distribution
Initiatives
Strategic
Transactions
“Client Choice”
Key Drivers
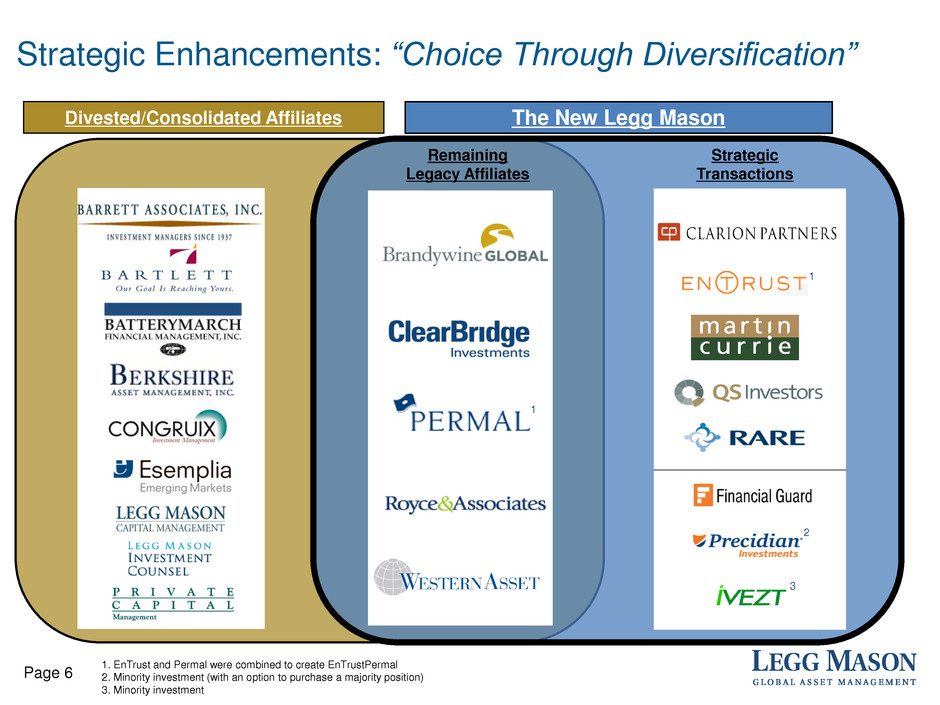
Divested/Consolidated Affiliates
Strategic Enhancements: “Choice Through Diversification”
Page 6
1. EnTrust and Permal were combined to create EnTrustPermal
2. Minority investment (with an option to purchase a majority position)
3. Minority investment
Remaining
Legacy Affiliates
The New Legg Mason
1
2
3
Strategic
Transactions
1

Strategic Capital Update
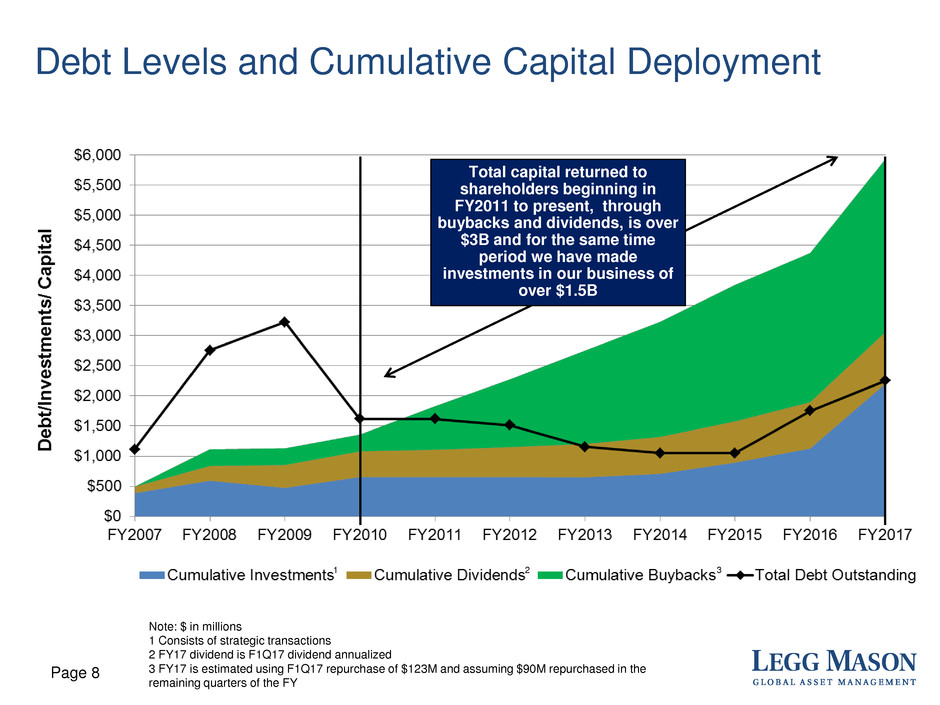
Debt Levels and Cumulative Capital Deployment
Page 8
Note: $ in millions
1 Consists of strategic transactions
2 FY17 dividend is F1Q17 dividend annualized
3 FY17 is estimated using F1Q17 repurchase of $123M and assuming $90M repurchased in the
remaining quarters of the FY
1 2 3
Total capital returned to
shareholders beginning in
FY2011 to present, through
buybacks and dividends, is over
$3B and for the same time
period we have made
investments in our business of
over $1.5B
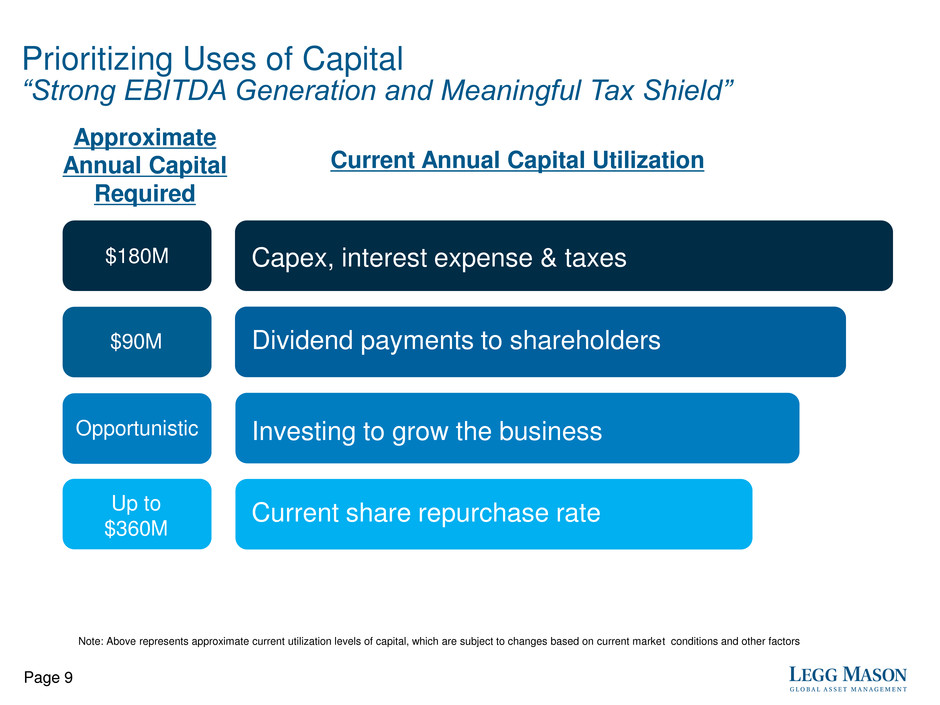
Prioritizing Uses of Capital
“Strong EBITDA Generation and Meaningful Tax Shield”
Page 9
Capex, interest expense & taxes
Investing to grow the business
Dividend payments to shareholders
Current share repurchase rate
Approximate
Annual Capital
Required
$180M
$90M
Opportunistic
Up to
$360M
Current Annual Capital Utilization
Note: Above represents approximate current utilization levels of capital, which are subject to changes based on current market conditions and other factors
163
150
140
125
117 111
107
104
97
88
$-
$0.25
$0.50
$0.75
$1.00
75
100
125
150
175
Mar 10 Mar 11 Mar 12 Mar 13 Mar 14 Mar 15 Mar 16 Jun 16 EST
Mar17
EST
Mar18
An
nu
ali
ze
d Q
ua
rte
rly
Di
vid
en
d
(Pe
r S
ha
re)
Sh
are
s O
uts
tan
din
g (
M)
Shares Outstanding Annualized Quarterly Dividend
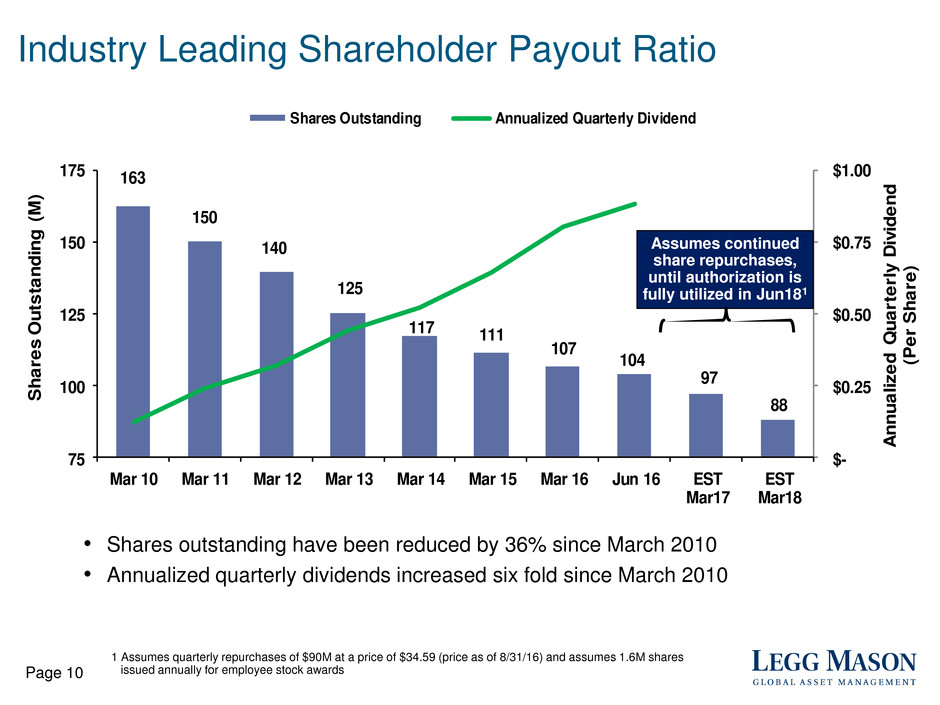
Industry Leading Shareholder Payout Ratio
Page 10
1 Assumes quarterly repurchases of $90M at a price of $34.59 (price as of 8/31/16) and assumes 1.6M shares
issued annually for employee stock awards
Assumes continued
share repurchases,
until authorization is
fully utilized in Jun181
• Shares outstanding have been reduced by 36% since March 2010
• Annualized quarterly dividends increased six fold since March 2010
Non-GAAP Financial Measures
New Non-GAAP Measures
Page 12
Introducing new measures to enhance understanding of our financial performance. We believe
these additional metrics will be useful to investors in evaluating our operating results
Additional Non-GAAP Measures:
• Adjusted EBITDA
• Parent Operating Margin
Usefulness:
• Adjusted EBITDA1 provides additional information with regard to Legg Mason’s ability to
meet working capital requirements, service debt principal, pay for capital expenditures and
return capital to our shareholders
• Parent Operating Margin provides a measure of the revenues that accrue to the benefit of the
Parent from affiliates in support of Parent-level expenses
Frequency:
• Adjusted EBITDA will be disclosed quarterly in our earnings release materials and 10Q, and
annually in our 10K
• Parent Operating Margin will be disclosed at least annually in our investor relations materials
1 Legg Mason has previously disclosed Adjusted EBITDA (also referred to as “EBITDA, bank defined” in the past) that
conformed to calculations required by our debt covenants, which adjusted for certain items that required cash
settlement that are not part of the current definition
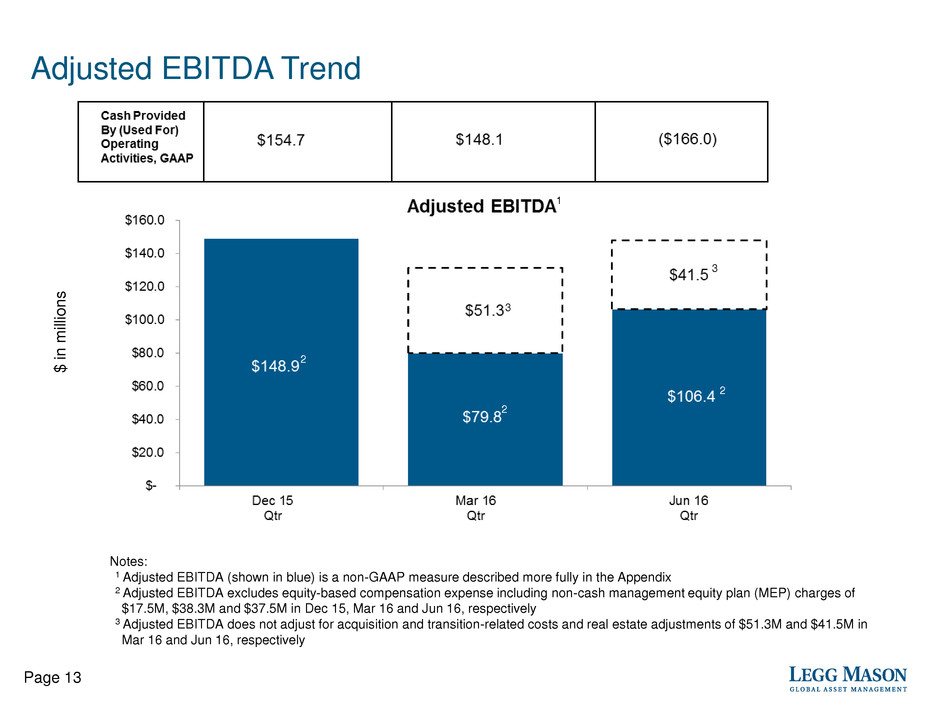
Adjusted EBITDA Trend
Page 13
Notes:
1 Adjusted EBITDA (shown in blue) is a non-GAAP measure described more fully in the Appendix
2 Adjusted EBITDA excludes equity-based compensation expense including non-cash management equity plan (MEP) charges of
$17.5M, $38.3M and $37.5M in Dec 15, Mar 16 and Jun 16, respectively
3 Adjusted EBITDA does not adjust for acquisition and transition-related costs and real estate adjustments of $51.3M and $41.5M in
Mar 16 and Jun 16, respectively
2
3
3
2
2
1
$
in
m
ill
io
n
s
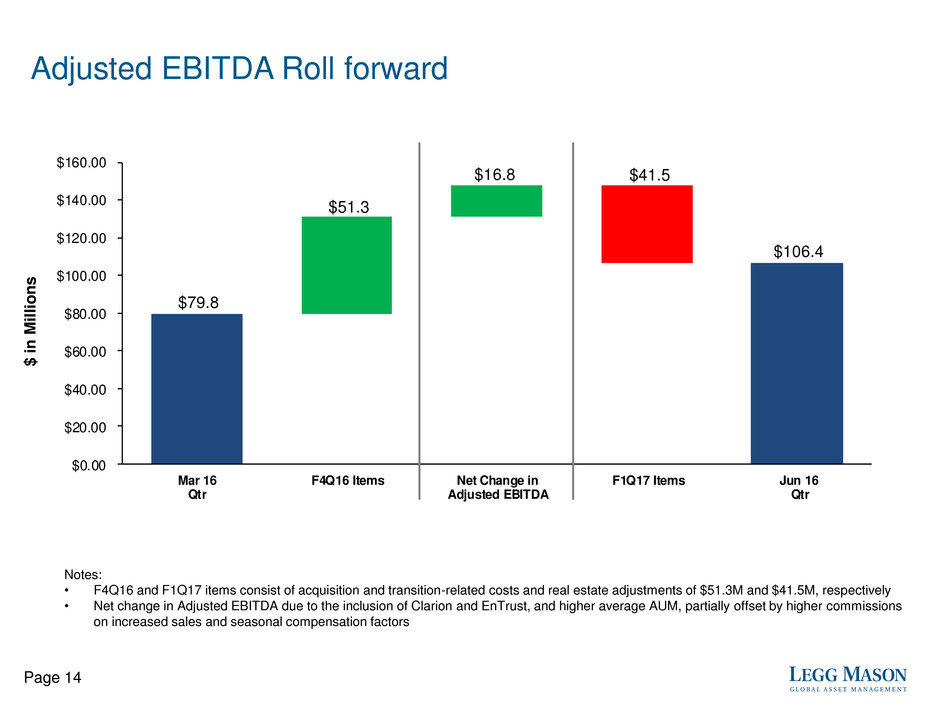
Adjusted EBITDA Roll forward
$79.8
$106.4
$51.3
$16.8 $41.5
$0.00
$20.00
$40.00
$60.00
$80.00
$100.00
$120.00
$140.00
$160.00
Mar 16
Qtr
F4Q16 Items Net Change in
Adjusted EBITDA
F1Q17 Items Jun 16
Qtr
Notes:
• F4Q16 and F1Q17 items consist of acquisition and transition-related costs and real estate adjustments of $51.3M and $41.5M, respectively
• Net change in Adjusted EBITDA due to the inclusion of Clarion and EnTrust, and higher average AUM, partially offset by higher commissions
on increased sales and seasonal compensation factors
Page 14
$
in
M
il
li
on
s
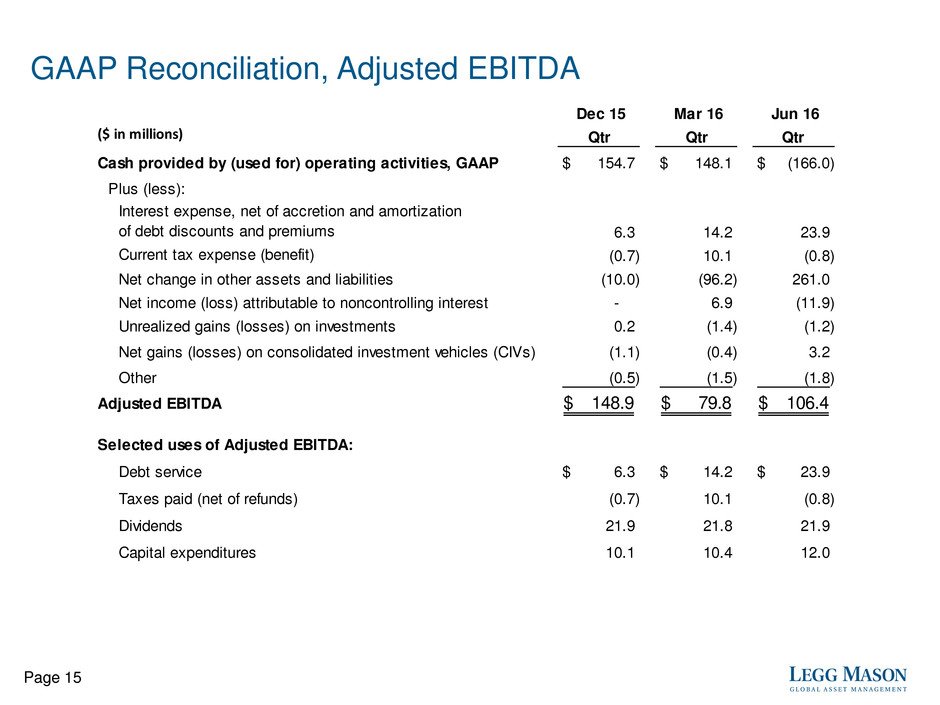
GAAP Reconciliation, Adjusted EBITDA
Page 15
($ in millions)
Dec 15
Qtr
Mar 16
Qtr
Jun 16
Qtr
Cash provided by (used for) operating activities, GAAP 154.7$ 148.1$ (166.0)$
Plus (less):
Interest expense, net of accretion and amortization
of debt discounts and premiums 6.3 14.2 23.9
Current tax expense (benefit) (0.7) 10.1 (0.8)
Net change in other assets and liabilities (10.0) (96.2) 261.0
Net income (loss) attributable to noncontrolling interest - 6.9 (11.9)
Unrealized gains (losses) on investments 0.2 (1.4) (1.2)
Net gains (losses) on consolidated investment vehicles (CIVs) (1.1) (0.4) 3.2
Other (0.5) (1.5) (1.8)
Adjusted EBITDA 148.9$ 79.8$ 106.4$
Selected uses of Adjusted EBITDA:
Debt service 6.3$ 14.2$ 23.9$
Taxes paid (net of refunds) (0.7) 10.1 (0.8)
Dividends 21.9 21.8 21.9
Capital expenditures 10.1 10.4 12.0
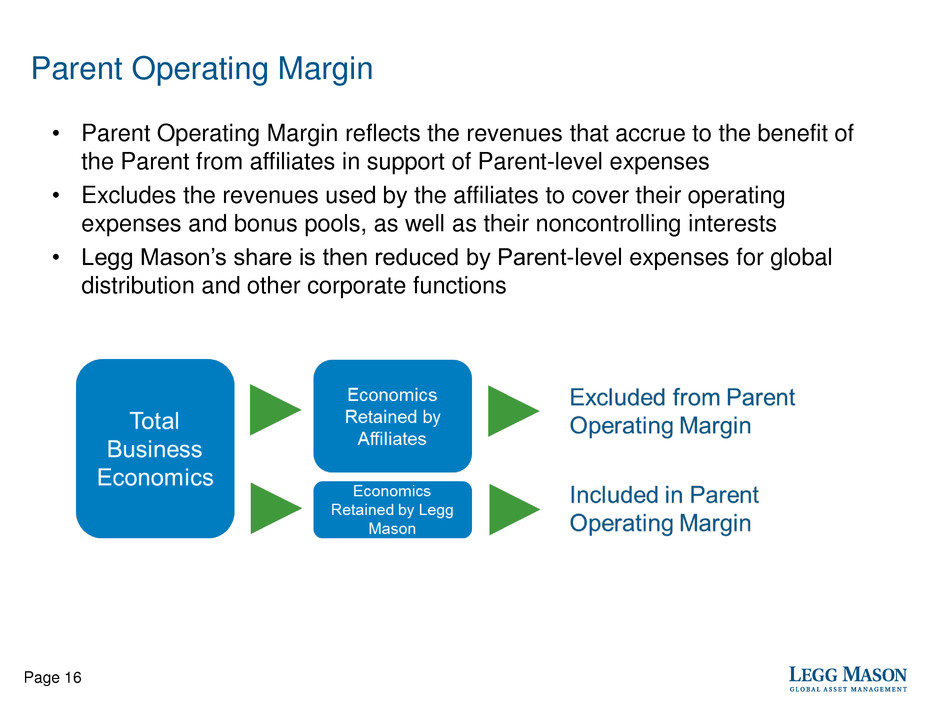
Parent Operating Margin
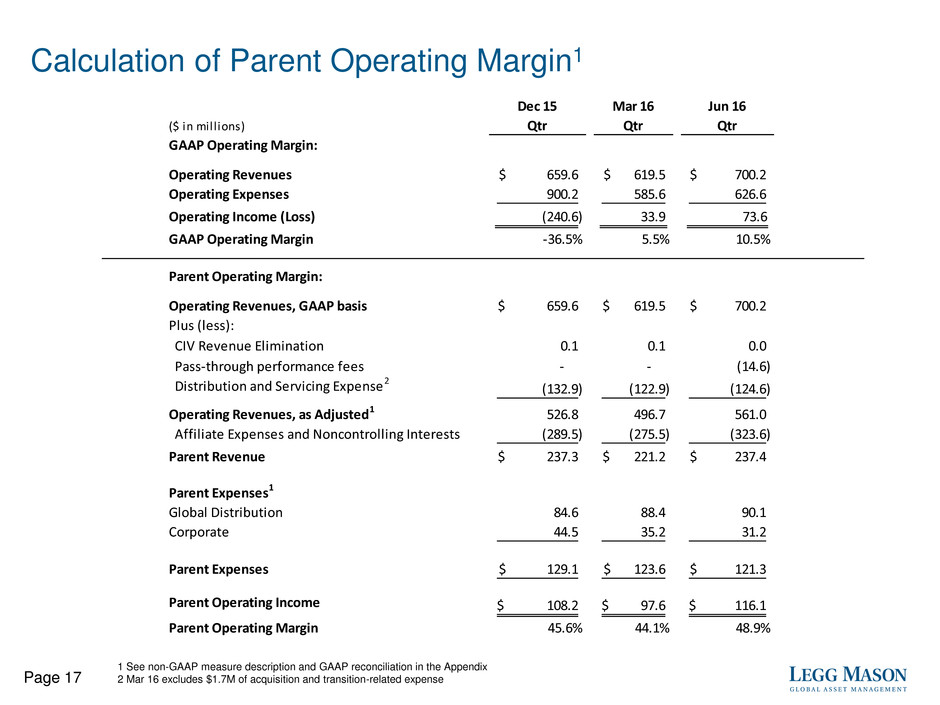
• Parent Operating Margin reflects the revenues that accrue to the benefit of
the Parent from affiliates in support of Parent-level expenses
• Excludes the revenues used by the affiliates to cover their operating
expenses and bonus pools, as well as their noncontrolling interests
• Legg Mason’s share is then reduced by Parent-level expenses for global
distribution and other corporate functions
Page 16
Calculation of Parent Operating Margin1
Page 17
1 See non-GAAP measure description and GAAP reconciliation in the Appendix
2 Mar 16 excludes $1.7M of acquisition and transition-related expense
($ in mill ions)
Dec 15
Qtr
Mar 16
Qtr
Jun 16
Qtr
GAAP Operating Margin:
Operating Revenues 659.6$ 619.5$ 700.2$
Operating Expenses 900.2 585.6 626.6
Operating Income (Loss) (240.6) 33.9 73.6
GAAP Operating Margin -36.5% 5.5% 10.5%
Parent Operating Margin:
Operating Revenues, GAAP basis 659.6$ 619.5$ 700.2$
Plus (less):
CIV Revenue Elimination 0.1 0.1 0.0
Pass-through performance fees - - (14.6)
Distribution and Servicing Expense2 (132.9) (122.9) (124.6)
Operating Revenues, as Adjusted1 526.8 496.7 561.0
Affiliate Expenses and Noncontrolling Interests (289.5) (275.5) (323.6)
Parent Revenue 237.3$ 221.2$ 237.4$
Parent Expenses1
Global Distribution 84.6 88.4 90.1
Corporate 44.5 35.2 31.2
Parent Expenses 129.1$ 123.6$ 121.3$
Parent Operating Income 108.2$ 97.6$ 116.1$
Parent Operating Margin 45.6% 44.1% 48.9%
Parent Operating Margin Trend
Page 18
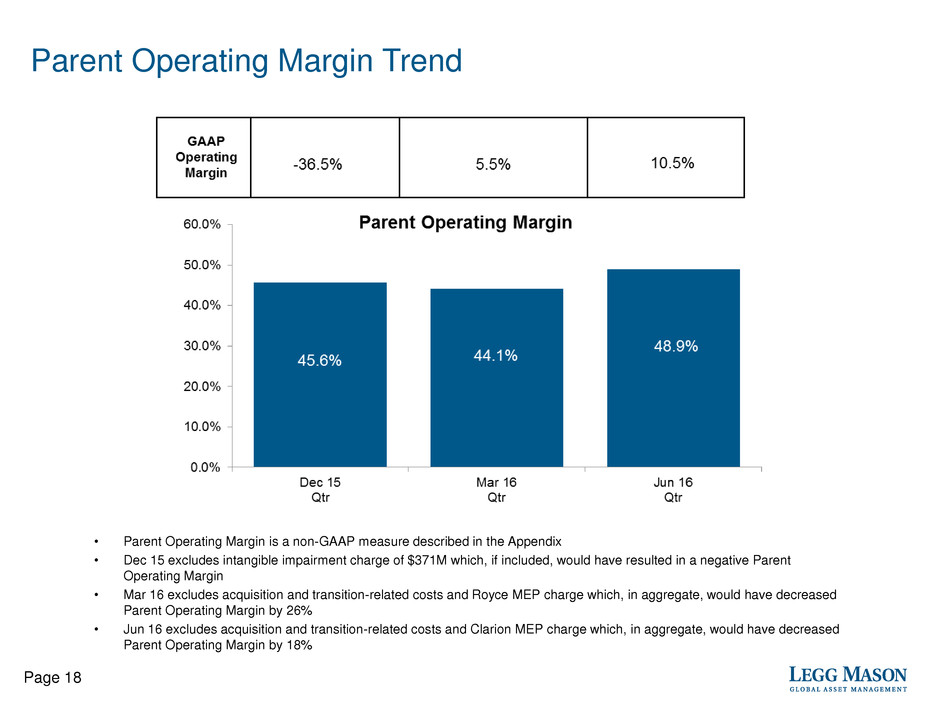
• Parent Operating Margin is a non-GAAP measure described in the Appendix
• Dec 15 excludes intangible impairment charge of $371M which, if included, would have resulted in a negative Parent
Operating Margin
• Mar 16 excludes acquisition and transition-related costs and Royce MEP charge which, in aggregate, would have decreased
Parent Operating Margin by 26%
• Jun 16 excludes acquisition and transition-related costs and Clarion MEP charge which, in aggregate, would have decreased
Parent Operating Margin by 18%
Parent Operating Margin Demonstrates the Potential
Leverage in Our Business Model
Page 19
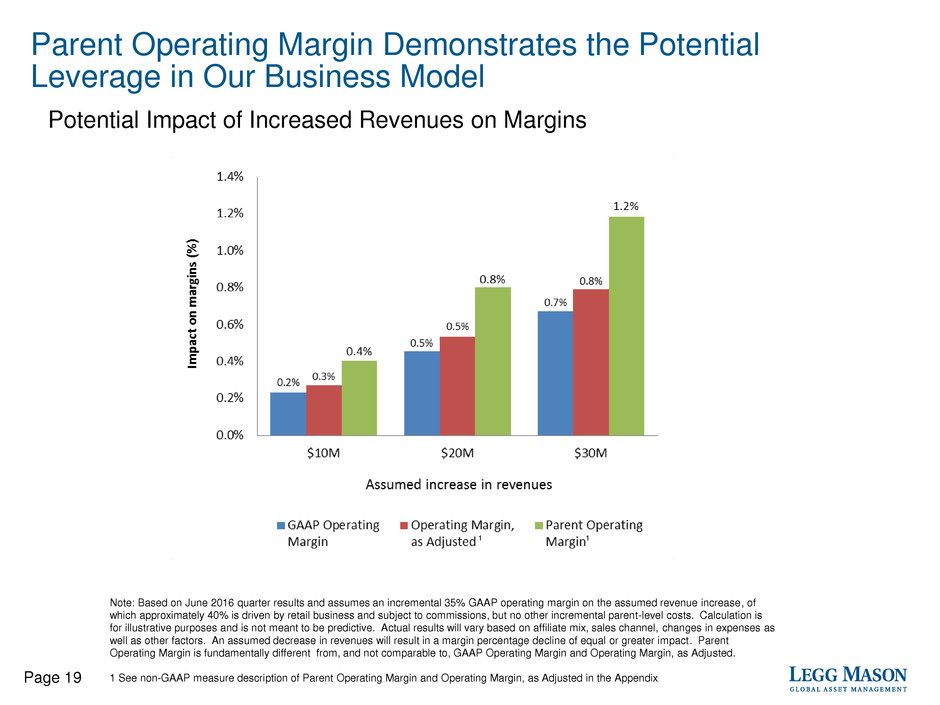
Note: Based on June 2016 quarter results and assumes an incremental 35% GAAP operating margin on the assumed revenue increase, of
which approximately 40% is driven by retail business and subject to commissions, but no other incremental parent-level costs. Calculation is
for illustrative purposes and is not meant to be predictive. Actual results will vary based on affiliate mix, sales channel, changes in expenses as
well as other factors. An assumed decrease in revenues will result in a margin percentage decline of equal or greater impact. Parent
Operating Margin is fundamentally different from, and not comparable to, GAAP Operating Margin and Operating Margin, as Adjusted.
1 See non-GAAP measure description of Parent Operating Margin and Operating Margin, as Adjusted in the Appendix
Potential Impact of Increased Revenues on Margins
1 1
Tax Shield
Page 21
Significant Tax Benefit
$3.5B of Future Income Sheltered
$1.3
$0.5
$2.2
$0.9
$0
$1
$2
$3
$4
$5
Tax Shield Tax Benefit
$
in
B
ill
io
ns
NOL/FTC Purchased Goodwill and intangibles
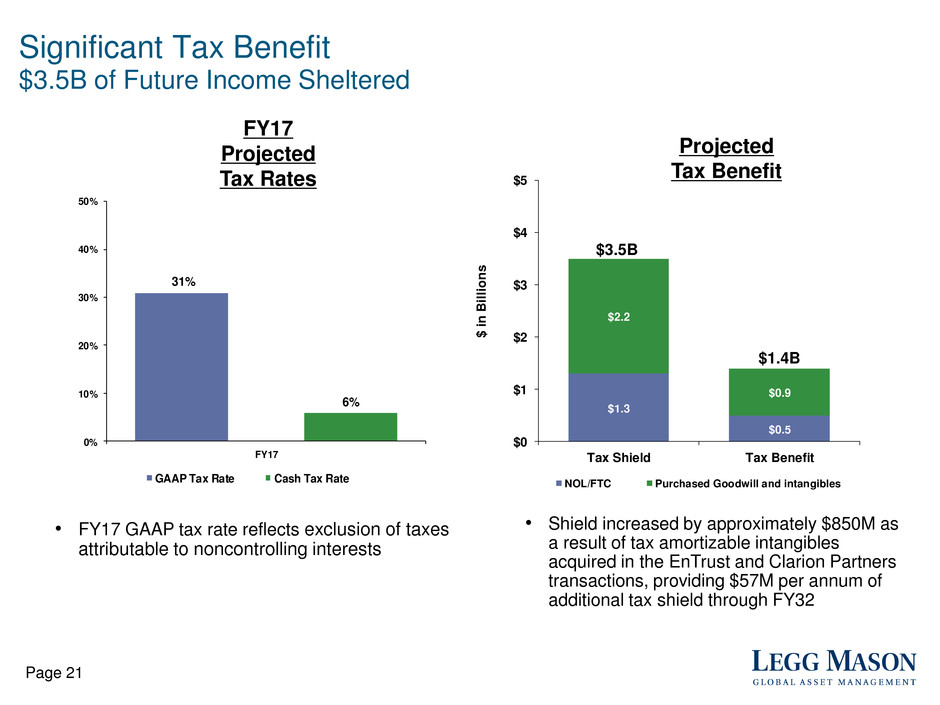
• Shield increased by approximately $850M as
a result of tax amortizable intangibles
acquired in the EnTrust and Clarion Partners
transactions, providing $57M per annum of
additional tax shield through FY32
$3.5B
$1.4B
FY17
Projected
Tax Rates
Projected
Tax Benefit
31%
6%
0%
10%
20%
30%
40%
50%
FY17
GAAP Tax Rate Cash Tax Rate
• FY17 GAAP tax rate reflects exclusion of taxes
attributable to noncontrolling interests
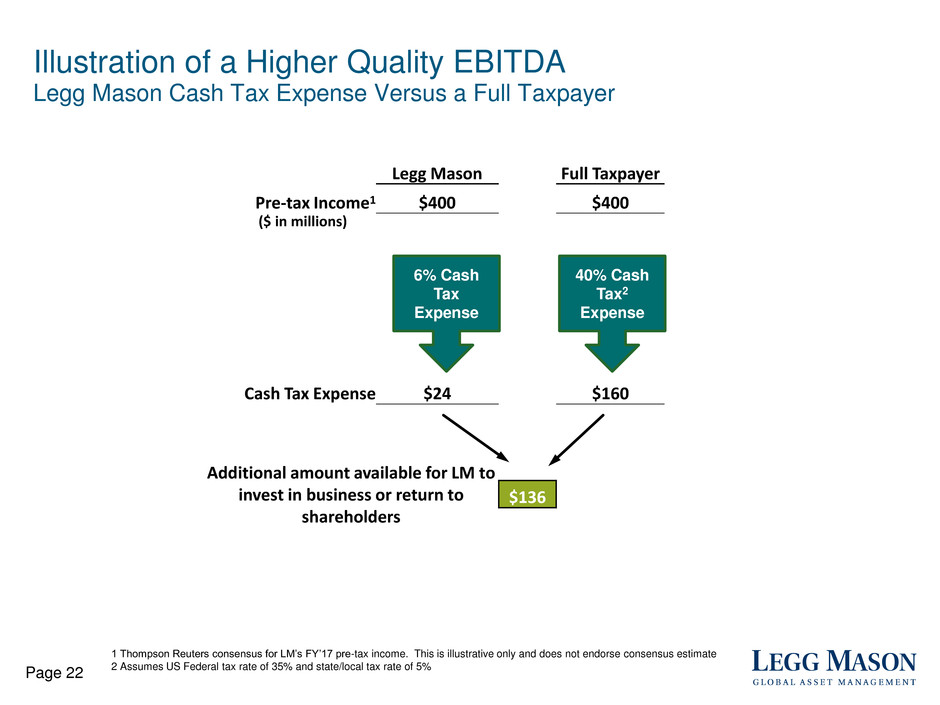
Illustration of a Higher Quality EBITDA
Legg Mason Cash Tax Expense Versus a Full Taxpayer
Page 22
1 Thompson Reuters consensus for LM’s FY’17 pre-tax income. This is illustrative only and does not endorse consensus estimate
2 Assumes US Federal tax rate of 35% and state/local tax rate of 5%
Legg Mason Full Taxpayer
Pre-tax Income1 $400 $400
Cash Tax Expense $24 $160
Additional amount available for LM to
invest in business or return to
shareholders
$136
6% Cash
Tax
Expense
40% Cash
Tax2
Expense
($ in millions)
0%
20%
40%
60%
80%
100%
2017 2018 2019 2020 2021 2022 2023 2024 2025 2026&
Beyond
Purchased Goodwill and Intangibles NOL/FTC
17%
100%
83%
81%
73%
63%
7%
54%
39%
28%
Cumulative Use of $1.4B Tax Benefit
Hypothetical Example
≈
Page 23
Deferred Tax Asset Utilization (by Fiscal Year)
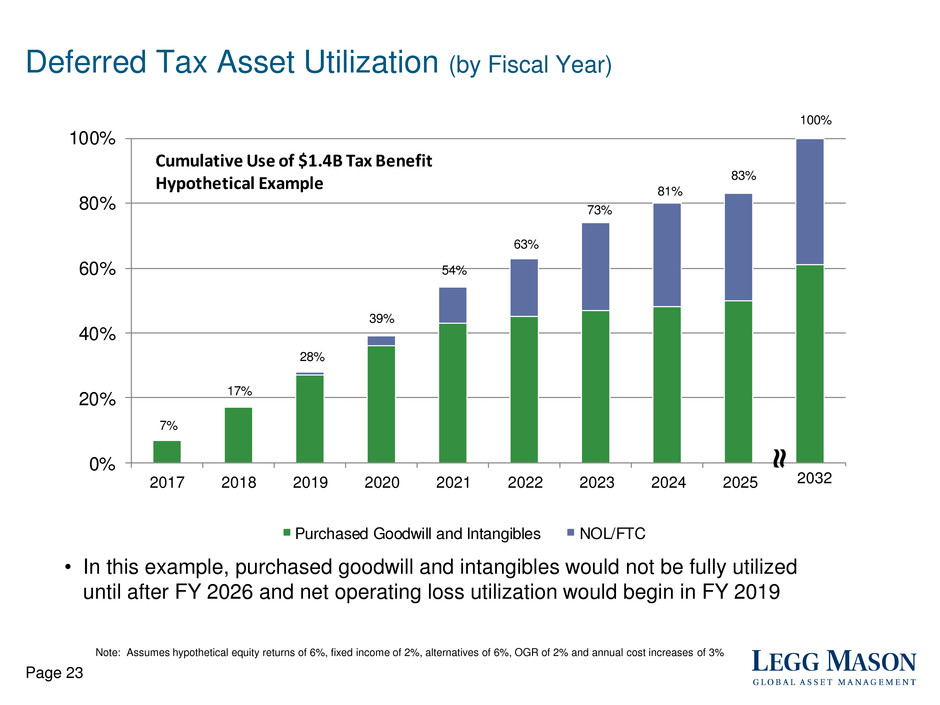
• In this example, purchased goodwill and intangibles would not be fully utilized
until after FY 2026 and net operating loss utilization would begin in FY 2019
Note: Assumes hypothetical equity returns of 6%, fixed income of 2%, alternatives of 6%, OGR of 2% and annual cost increases of 3%
2032
Closing
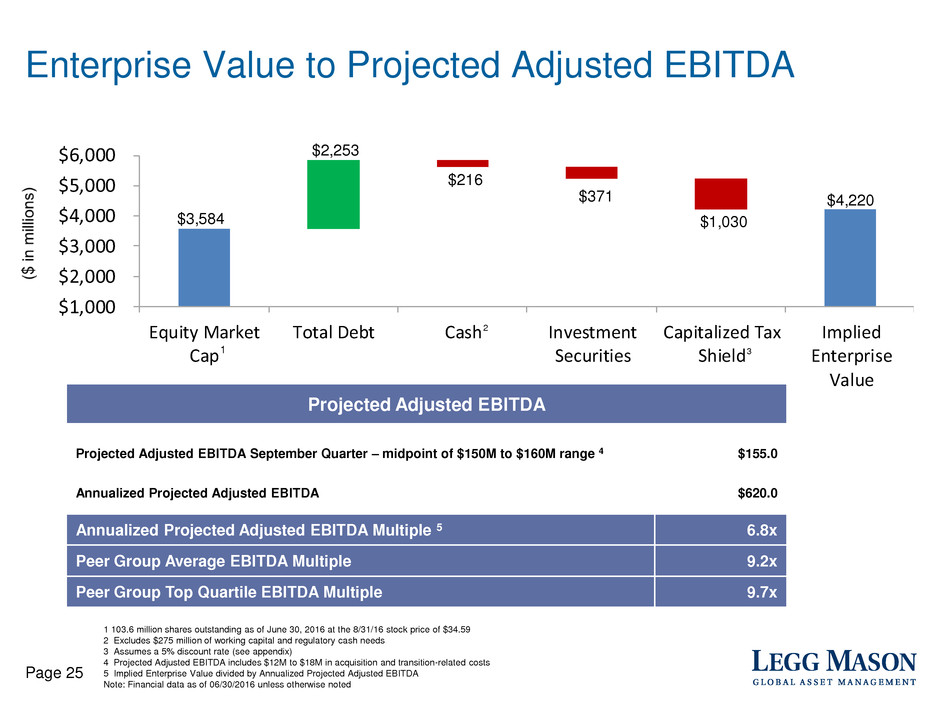
$3,584
$4,220
$2,253
$216
$371
$1,030
$1,000
$2,000
$3,000
$4,000
$5,000
$6,000
Equity Market
Cap
Total Debt Cash Investment
Securities
Capitalized Tax
Shield
Implied
Enterprise
Value
Enterprise Value to Projected Adjusted EBITDA
3
Page 25
2
1
Projected Adjusted EBITDA
Projected Adjusted EBITDA September Quarter – midpoint of $150M to $160M range 4 $155.0
Annualized Projected Adjusted EBITDA $620.0
Annualized Projected Adjusted EBITDA Multiple 5 6.8x
Peer Group Average EBITDA Multiple 9.2x
Peer Group Top Quartile EBITDA Multiple 9.7x
1 103.6 million shares outstanding as of June 30, 2016 at the 8/31/16 stock price of $34.59
2 Excludes $275 million of working capital and regulatory cash needs
3 Assumes a 5% discount rate (see appendix)
4 Projected Adjusted EBITDA includes $12M to $18M in acquisition and transition-related costs
5 Implied Enterprise Value divided by Annualized Projected Adjusted EBITDA
Note: Financial data as of 06/30/2016 unless otherwise noted

For internal use only. Not for distribution to the public.
Products &
Vehicles
Distribution &
Client Access
Investment
Capabilities
A tapestry is not formed from a
single thread. It is formed by
combining many threads,
uniquely and distinctly, into
something greater than its parts.
Providing Global Investors an Expanding Amount of Choice
Page 26
Appendix
Appendix - Non-GAAP Adjusted EBITDA
Page 28
We define Adjusted EBITDA1 as cash provided by operating activities plus (minus) (i) interest expense, net of accretion and
amortization of debt discounts and premiums, (ii) current income tax expense (benefit), (iii) the net change in other assets and
liabilities, (iv) net income (loss) attributable to noncontrolling interests, (v) unrealized gains (losses) on investments, (vi) net gains
(losses) on CIVs, and (vii) other. The net change in other assets and liabilities adjustment aligns with the Consolidated Statements of
Cash Flows. Adjusted EBITDA is not reduced by equity-based compensation expense, including Management Equity Plan (MEP)
non-cash issuance-related charges. Most MEP units may be put to or called by Legg Mason for cash payment, although the terms of
the MEP units do not require this to occur.
We believe that this measure is useful to investors and Legg Mason as it provides additional information with regard to our ability to
meet working capital requirements, service our debt, and return capital to our shareholders. This measure is provided in addition to
Cash provided by operating activities and may not be comparable to non-GAAP performance measures or liquidity measures of other
companies, including their measures of EBITDA or Adjusted EBITDA. Further, this measure is not to be confused with Net income,
Cash provided by operating activities or other measures of earnings or cash flows under GAAP, and are provided as a supplement
to, and not in replacement of, GAAP measures.
1 Legg Mason has previously disclosed Adjusted EBITDA (also referred to as “EBITDA, bank defined” in the past) that
conformed to calculations required by our debt covenants, which adjusted for certain items that required cash
settlement that are not part of the current definition.
Appendix – Non-GAAP Parent Operating Margin
Page 29
Parent Operating Margin is a performance measure calculated by dividing “Parent Operating Income” by “Parent Revenue.” Parent
Revenue is calculated from our Operating Revenues, adjusted to add back net investment advisory fees eliminated upon consolidation
of investment vehicles, less Distribution and Servicing Expenses, which we use as an approximate measure of revenues that are
passed through to third parties, and less affiliates’ operating expenses and noncontrolling interests, and adjusted for certain affiliate
expenses, such as those that arise from acquisitions, related restructurings, MEP issuances and impairment charges. These
adjustments include acquisition charges and transition/restructuring charges. We reduce revenues by certain operating expenses of
our affiliates to represent the portion of revenues used by the affiliates to pay expenses and thus generating a measure of revenues
that accrue to the parent company as profits from our affiliates. Parent Operating Income is calculated as Parent Revenue, less all
corporate level expenses, also adjusted to exclude certain expenses such as those that arise from acquisitions, related restructurings,
MEP issuances and impairment charges. Our corporate level (“Parent”) expenses consist of the expenses of our centralized
distribution operations and other holding company functions.
We believe that Parent Operating Margin is a useful assessment of our performance because it provides a measure of the revenues
that accrue to the benefit of the parent from affiliates to support parent-level expenses. Legg Mason uses Parent Operating Margin as
a measure of management’s effectiveness with the portion of revenues or profits it receives from affiliates. Our business model
provides our affiliates the ability to operate with autonomy through revenue share and other arrangements. From time-to-time, Legg
Mason may adjust its affiliate revenue share arrangements such that the affiliates incur more expenses, or retain more revenues than
provided for by their revenue share arrangements. These adjustments appear in affiliate expenses. Non-revenue sharing affiliates are
subject to a parent oversight budgeting process.
Parent Operating Margin excludes items that have no net impact on Net Income (Loss) Attributable to Legg Mason, Inc. and indicates
the operating margin of our Parent operations without the distribution revenues that are passed through to third parties as a direct cost
of selling our products, the portion of revenues aligned to the operating expenses incurred by our advisory affiliates, and the impact of
the consolidation of certain investment vehicles described above.
This measure is not intended to indicate the margin of our business as a whole and is provided in addition to measures applicable to
the entire business such as operating margin calculated under GAAP, but is not a substitute for calculations of margins under GAAP,
Parent Operating Margin is not comparable to non-GAAP performance measures, including measures of adjusted margins of other
companies, because Parent Operating Margin is fundamentally different from these measures because it excludes all expenses of our
affiliates.
Appendix – Non-GAAP Operating Margin, as Adjusted
Page 30
We calculate “Operating Margin, as Adjusted,” by dividing (i) Operating Income (Loss), adjusted to exclude the impact on
compensation expense of gains or losses on investments made to fund deferred compensation plans, the impact on compensation
expense of gains or losses on seed capital investments by our affiliates under revenue sharing agreements, amortization related to
intangible assets, income (loss) of consolidated investment vehicles, the impact of fair value adjustments of contingent consideration
liabilities, if any, and impairment charges by (ii) our operating revenues, adjusted to add back net investment advisory fees eliminated
upon consolidation of investment vehicles, less distribution and servicing expenses which we use as an approximate measure of
revenues that are passed through to third parties, and less performance fees that are passed through as compensation expenses or
net income (loss) attributable to non-controlling interests, which we refer to as “Operating Revenues, as Adjusted”. The compensation
items are removed from Operating Income (Loss) in the calculation because they are offset by an equal amount in Other non-operating
income (expense), and thus have no impact on Net Income (Loss) Attributable to Legg Mason, Inc. We adjust for the impact of
amortization of management contract assets and the impact of fair value adjustments of contingent consideration liabilities, if any,
which arise from acquisitions to reflect the fact that these items distort comparison of our operating results with results of other asset
management firms that have not engaged in significant acquisitions. Impairment charges and income (loss) of consolidated
investment vehicles are removed from Operating Income (Loss) in the calculation because these items are not reflective of our core
asset management operations. We use Operating Revenues, as Adjusted in the calculation to show the operating margin without
distribution and servicing expenses, which we use to approximate our distribution revenues that are passed through to third parties as
a direct cost of selling our products, although distribution and servicing expenses may include commissions paid in connection with the
launching of closed-end funds for which there is no corresponding revenue in the period. We also use Operating Revenues, as
Adjusted in the calculation to show the operating margin without performance fees, which are passed through as compensation
expense or net income (loss) attributable to non-controlling interests per the terms of certain more recent acquisitions. Operating
Revenues, as Adjusted, also include our advisory revenues we receive from consolidated investment vehicles that are eliminated in
consolidation under GAAP.
We believe that Operating Margin, as Adjusted, is a useful measure of our performance because it provides a measure of our core
business activities. It excludes items that have no impact on Net Income (Loss) Attributable to Legg Mason, Inc. and indicates what
our operating margin would have been without the distribution revenues that are passed through to third parties as a direct cost of
selling our products, performance fees that are passed through as compensation expense or net income (loss) attributable to non-
controlling interests per the terms of certain more recent acquisitions, amortization related to intangible assets, changes in the fair
value of contingent consideration liabilities, if any, impairment charges, and the impact of the consolidation of certain investment
vehicles described above. The consolidation of these investment vehicles does not have an impact on Net Income (Loss) Attributable
to Legg Mason, Inc. This measure is provided in addition to our operating margin calculated under GAAP, but is not a substitute for
calculations of margins under GAAP and may not be comparable to non-GAAP performance measures, including measures of
adjusted margins of other companies.
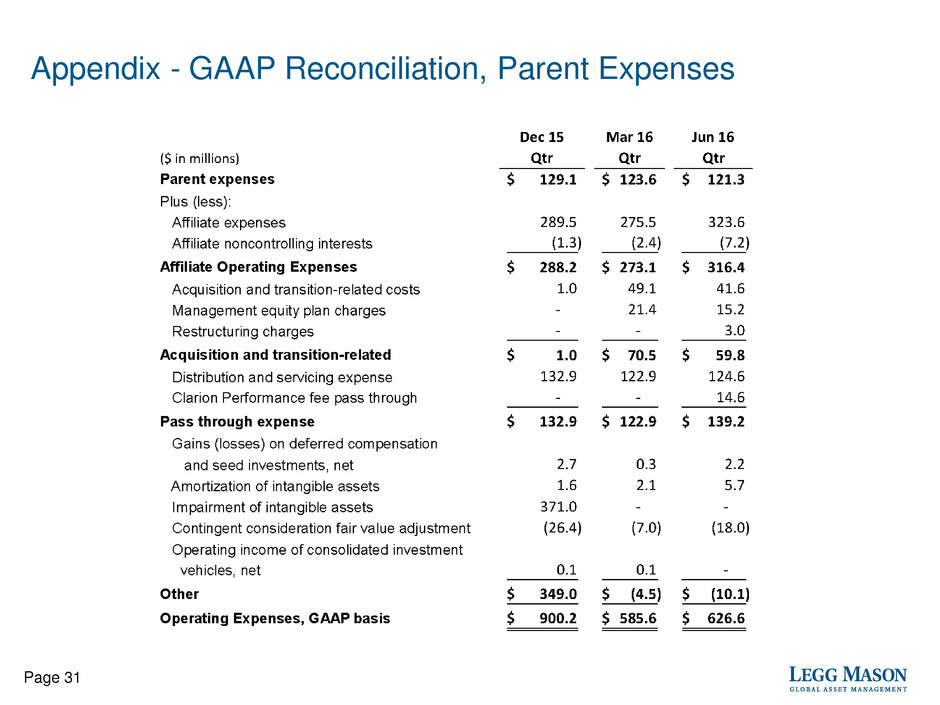
Appendix - GAAP Reconciliation, Parent Expenses
Page 31
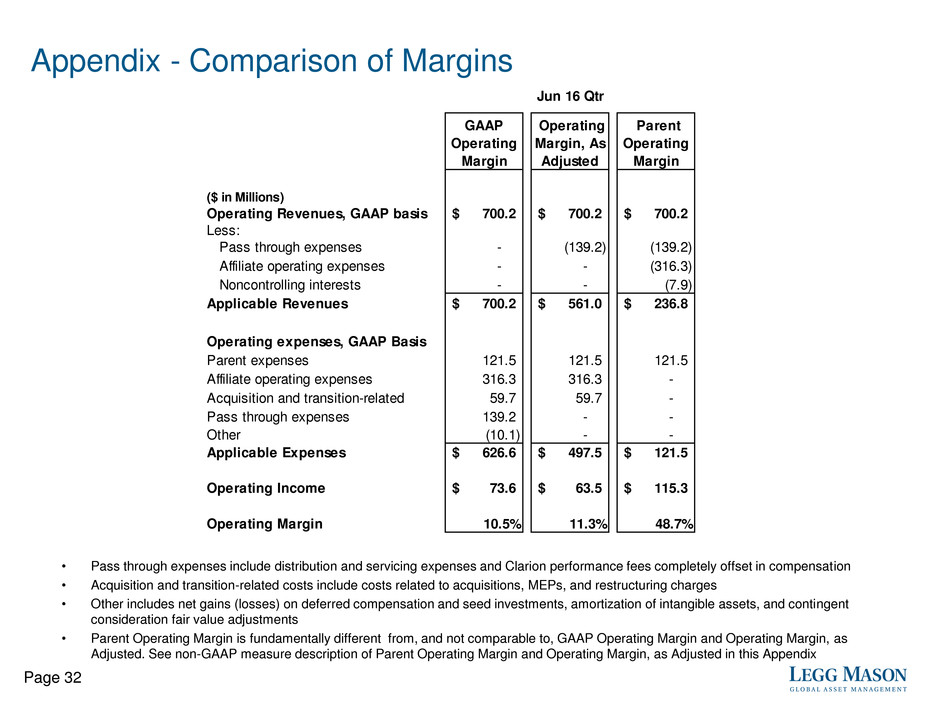
Appendix - Comparison of Margins
Page 32
• Pass through expenses include distribution and servicing expenses and Clarion performance fees completely offset in compensation
• Acquisition and transition-related costs include costs related to acquisitions, MEPs, and restructuring charges
• Other includes net gains (losses) on deferred compensation and seed investments, amortization of intangible assets, and contingent
consideration fair value adjustments
• Parent Operating Margin is fundamentally different from, and not comparable to, GAAP Operating Margin and Operating Margin, as
Adjusted. See non-GAAP measure description of Parent Operating Margin and Operating Margin, as Adjusted in this Appendix
($ in Millions)
Operating Revenues, GAAP basis 700.2$ 700.2$ 700.2$
Less:
Pass through expenses - (139.2) (139.2)
Affiliate operating expenses - - (316.3)
Noncontrolling interests - - (7.9)
Applicable Revenues 700.2$ 561.0$ 236.8$
Operating expenses, GAAP Basis
Parent expenses 121.5 121.5 121.5
Affiliate operating expenses 316.3 316.3 -
Acquisition and transition-related 59.7 59.7 -
Pass through expenses 139.2 - -
Other (10.1) - -
Applicable Expenses 626.6$ 497.5$ 121.5$
Operating Income 73.6$ 63.5$ 115.3$
Operating Margin 10.5% 11.3% 48.7%
GAAP
Operating
Margin
Operating
Margin, As
Adjusted
Parent
Operating
Margin
Jun 16 Qtr
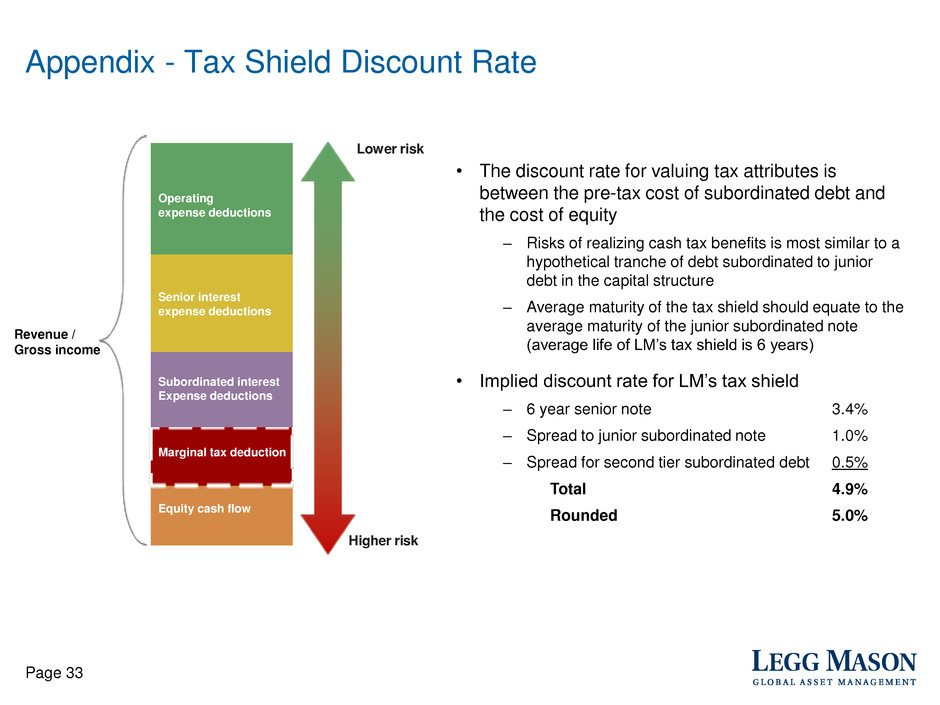
Appendix - Tax Shield Discount Rate
Revenue /
Gross income
Page 33
• The discount rate for valuing tax attributes is
between the pre-tax cost of subordinated debt and
the cost of equity
‒ Risks of realizing cash tax benefits is most similar to a
hypothetical tranche of debt subordinated to junior
debt in the capital structure
‒ Average maturity of the tax shield should equate to the
average maturity of the junior subordinated note
(average life of LM’s tax shield is 6 years)
• Implied discount rate for LM’s tax shield
‒ 6 year senior note 3.4%
‒ Spread to junior subordinated note 1.0%
‒ Spread for second tier subordinated debt 0.5%
Total 4.9%
Rounded 5.0%
Low r risk
Higher risk
Operating
expense deductions
Senior interest
expense deductions
Subordinated interest
Expense deductions
Marginal tax deduction
Equity cash flow
