Attached files
| file | filename |
|---|---|
| EX-23.2 - EX-23.2 - HV Bancorp, Inc. | d251878dex232.htm |
| EX-99.2 - EX-99.2 - HV Bancorp, Inc. | d251878dex992.htm |
| EX-99.1 - EX-99.1 - HV Bancorp, Inc. | d251878dex991.htm |
| EX-23.3 - EX-23.3 - HV Bancorp, Inc. | d251878dex233.htm |
| EX-21 - EX-21 - HV Bancorp, Inc. | d251878dex21.htm |
| EX-10.3 - EX-10.3 - HV Bancorp, Inc. | d251878dex103.htm |
| EX-10.2 - EX-10.2 - HV Bancorp, Inc. | d251878dex102.htm |
| EX-10.1 - EX-10.1 - HV Bancorp, Inc. | d251878dex101.htm |
| EX-8.2 - EX-8.2 - HV Bancorp, Inc. | d251878dex82.htm |
| EX-8.1 - EX-8.1 - HV Bancorp, Inc. | d251878dex81.htm |
| EX-5 - EX-5 - HV Bancorp, Inc. | d251878dex5.htm |
| EX-4 - EX-4 - HV Bancorp, Inc. | d251878dex4.htm |
| EX-3.2 - EX-3.2 - HV Bancorp, Inc. | d251878dex32.htm |
| EX-3.1 - EX-3.1 - HV Bancorp, Inc. | d251878dex31.htm |
| EX-2 - EX-2 - HV Bancorp, Inc. | d251878dex2.htm |
| EX-1.1 - EX-1.1 - HV Bancorp, Inc. | d251878dex11.htm |
| S-1 - S-1 - HV Bancorp, Inc. | d251878ds1.htm |
Exhibit 99.3
PRO FORMA VALUATION REPORT
STANDARD CONVERSION
HV Bancorp, Inc. | Huntingdon Valley, Pennsylvania
PROPOSED HOLDING COMPANY FOR:
Huntingdon Valley Bank | Huntingdon Valley, Pennsylvania
Dated as of August 5, 2016

1100 North Glebe Road Suite 600
Arlington, Virginia 22201
703.528.1700
rpfinancial.com

August 5, 2016
Board of Directors
HV Bancorp, Inc.
Board of Trustees
Huntingdon Valley Bank
3501 Masons Mill Road, Suite 401
Huntingdon Valley, Pennsylvania 19006
Members of the Board of Directors:
At your request, we have completed and hereby provide an independent appraisal (“Appraisal”) of the estimated pro forma market value of the common stock which is to be issued in connection with the mutual-to-stock conversion transaction described below.
This Appraisal is furnished pursuant to the requirements stipulated in the Code of Federal Regulations and has been prepared in accordance with the “Guidelines for Appraisal Reports for the Valuation of Savings and Loan Associations Converting from Mutual to Stock Form of Organization” of the Office of Thrift Supervision (“OTS”) and accepted by the Federal Reserve Board (“FRB”), the Office of the Comptroller of the Currency (“OCC”), the Federal Deposit Insurance Corporation (“FDIC”) and the Pennsylvania Department of Banking and Securities (the “Department”), and applicable regulatory interpretations thereof.
Description of Plan of Conversion
The Board of Trustees of Huntingdon Valley Bank, Huntingdon Valley, Pennsylvania (““HV Bank” or the “Bank”) adopted the plan of conversion on July 20, 2016, incorporated herein by reference. Pursuant to the plan of conversion, the Bank will convert from a Pennsylvania-chartered mutual savings bank to a Pennsylvania-chartered stock savings bank and become a wholly-owned subsidiary of HV Bancorp, Inc. (“HV Bancorp” or the “Company”), a Pennsylvania corporation formed by HV Bank. HV Bancorp will offer 100% of its common stock to qualifying depositors of the Bank in a subscription offering to Eligible Account Holders, Tax-Qualified Employee Benefit Plans including HV Bank’s employee stock ownership plan (the “ESOP”), Supplemental Eligible Account Holders and Other Members, as such terms are defined for purposes of applicable federal regulatory guidelines governing mutual-to-stock conversions. To the extent that shares remain available for purchase after satisfaction of all subscriptions received in the subscription offering, the shares may be offered for sale to the public at large in a community offering and/or a syndicated community offering. Going forward, HV Bancorp will own 100% of the Bank’s stock, and the Bank will initially be HV Bancorp’s sole subsidiary. A portion of the net proceeds received from the sale of common stock will be used to purchase all of the then to be issued and outstanding capital stock of the Bank and the balance of the net proceeds will be retained by the Company.
| Washington Headquarters | ||
| Three Ballston Plaza | Telephone: (703) 528-1700 | |
| 1100 North Glebe Road, Suite 600 | Fax No.: (703) 528-1788 | |
| Arlington, VA 22201 | Toll-Free No.: (866) 723-0594 | |
| www.rpfinancial.com | E-Mail: mail@rpfinancial.com |
Board of Directors
August 5, 2016
Page 2
At this time, no other activities are contemplated for the Company other than the ownership of the Bank, a loan to the newly-formed ESOP and reinvestment of the proceeds that are retained by the Company. In the future, HV Bancorp may acquire or organize other operating subsidiaries, diversify into other banking-related activities, pay dividends or repurchase its stock, although there are no specific plans to undertake such activities at the present time.
RP® Financial, LC.
RP® Financial, LC. (“RP Financial”) is a financial consulting firm serving the financial services industry nationwide that, among other things, specializes in financial valuations and analyses of business enterprises and securities, including the pro forma valuation for savings institutions converting from mutual-to-stock form. The background and experience of RP Financial is detailed in Exhibit V-1. For its appraisal services, RP Financial is being compensated on a fixed fee basis for the original appraisal and for any subsequent updates, and such fees are payable regardless of the valuation conclusion or the completion of the conversion offering transaction. We believe that we are independent of the Bank and the other parties engaged by HV Bank or the Company to assist in the stock conversion process.
Valuation Methodology
In preparing our Appraisal, we have reviewed the regulatory applications of the Bank and the Company, including the prospectus as filed with the FRB, the FDIC, the Department and the Securities and Exchange Commission (“SEC”). We have conducted a financial analysis of the Bank that has included a review of audited financial information for the fiscal years ended June 30, 2012 through June 30, 2016 and a review of various unaudited information and internal financial reports through June 30, 2016. We have also conducted due diligence related discussions with HV Bank’s management; BDO USA, LLP, HV Bank’s independent auditor; Luse Gorman, PC, HV Bank’s conversion counsel; and Sandler O’Neill & Partners, L.P., HV Bank’s financial and marketing advisor in connection with the stock offering. All assumptions and conclusions set forth in the Appraisal were reached independently from such discussions. In addition, where appropriate, we have considered information based on other available published sources that we believe are reliable. While we believe the information and data gathered from all these sources are reliable, we cannot guarantee the accuracy and completeness of such information.
We have investigated the competitive environment within which HV Bank operates and have assessed the Bank’s relative strengths and weaknesses. We have monitored all material regulatory and legislative actions affecting financial institutions generally and analyzed the potential impact of such developments on HV Bank and the industry as a whole to the extent we were aware of such matters. We have analyzed the potential effects of the stock conversion on the Bank’s operating characteristics and financial performance as they relate to the pro forma market value of HV Bank. We have reviewed the economy and demographic characteristics of the primary market area in which the Bank currently operates. We have compared HV Bank’s financial performance and condition with publicly-traded thrift institutions evaluated and selected in accordance with the Valuation Guidelines, as well as all publicly-traded thrifts and thrift holding companies. We have reviewed conditions in the securities markets in general and the market for thrifts and thrift holding companies, including the market for new issues.
Board of Directors
August 5, 2016
Page 3
The Appraisal is based on HV Bank’s representation that the information contained in the regulatory applications and additional information furnished to us by the Bank and its independent auditors, legal counsel, investment bankers and other authorized agents are truthful, accurate and complete. We did not independently verify the financial statements and other information provided by the Bank, or its independent auditors, legal counsel, investment bankers and other authorized agents nor did we independently value the assets or liabilities of HV Bank. The valuation considers HV Bank only as a going concern and should not be considered as an indication of the Bank’s liquidation value.
Our appraised value is predicated on a continuation of the current operating environment for the Bank and for all thrifts and their holding companies. Changes in the local and national economy, the federal and state legislative and regulatory environments for financial institutions, the stock market, interest rates, and other external forces (such as natural disasters or significant world events) may occur from time to time, often with great unpredictability, and may materially impact the value of thrift stocks as a whole or the Bank’s value alone. It is our understanding that HV Bank intends to remain an independent institution and there are no current plans for selling control of the Bank as a converted institution. To the extent that such factors can be foreseen, they have been factored into our analysis.
The estimated pro forma market value is defined as the price at which the Company’s stock, immediately upon completion of the offering, would change hands between a willing buyer and a willing seller, neither being under any compulsion to buy or sell and both having reasonable knowledge of relevant facts.
Valuation Conclusion
It is our opinion that, as of August 5, 2016, the estimated aggregate pro forma market value of the shares to be issued immediately following the conversion equaled $16,500,000 at the midpoint, equal to 1,650,000 shares offered at a per share value of $10.00. Pursuant to conversion guidelines, the 15% offering range indicates a minimum value of $14,025,000 and a maximum value of $18,975,000. Based on the $10.00 per share offering price determined by the Board, this valuation range equates to total shares outstanding of 1,402,500 at the minimum and 1,897,500 at the maximum. In the event the appraised value is subject to an increase, the aggregate pro forma market value may be increased up to a super maximum value of $21,821,250 without a resolicitation. Based on the $10.00 per share offering price, the super maximum value would result in total shares outstanding of 2,182,250.
Limiting Factors and Considerations
The valuation is not intended, and must not be construed, as a recommendation of any kind as to the advisability of purchasing shares of the common stock. Moreover, because such valuation is determined in accordance with applicable regulatory guidelines and is necessarily based upon estimates and projections of a number of matters, all of which are subject to change from time to time, no assurance can be given that persons who purchase shares of common
Board of Directors
August 5, 2016
Page 4
stock in the conversion will thereafter be able to buy or sell such shares at prices related to the foregoing valuation of the estimated pro forma market value thereof. The appraisal reflects only a valuation range as of this date for the pro forma market value of HV Bancorp immediately upon issuance of the stock and does not take into account any trading activity with respect to the purchase and sale of common stock in the secondary market on the date of issuance of such securities or at anytime thereafter following the completion of the public stock offering.
The valuation prepared by RP Financial, in accordance with applicable regulatory guidelines, was based on the financial condition and operations of HV Bank as of June 30, 2016, the date of the financial data included in the prospectus.
RP Financial is not a seller of securities within the meaning of any federal and state securities laws and any report prepared by RP Financial shall not be used as an offer or solicitation with respect to the purchase or sale of any securities. RP Financial maintains a policy which prohibits RP Financial, its principals or employees from purchasing stock of its financial institution clients.
The valuation will be updated as provided for in the conversion regulations and guidelines. These updates will consider, among other things, any developments or changes in the financial performance and condition of HV Bank, management policies, and current conditions in the equity markets for thrift stocks, both existing issues and new issues. These updates may also consider changes in other external factors which impact value including, but not limited to: various changes in the federal and state legislative and regulatory environments for financial institutions, the stock market in general, the market for thrift stocks and interest rates. Should any such new developments or changes be material, in our opinion, to the valuation of the shares, appropriate adjustments to the estimated pro forma market value will be made. The reasons for any such adjustments will be explained in the update at the date of the release of the update.
| Respectfully submitted, |
| RP® FINANCIAL, LC. |

|
| Marcus Faust |
| Managing Director |

|
| Gregory E. Dunn |
| Director |
| RP® Financial, LC. | TABLE OF CONTENTS |
TABLE OF CONTENTS
HV Bancorp, Inc.
Huntingdon Valley Bank
Huntingdon Valley, Pennsylvania
| DESCRIPTION |
PAGE NUMBER |
|||||
| CHAPTER ONE | OVERVIEW AND FINANCIAL ANALYSIS | |||||
| Introduction |
I.1 | |||||
| Plan of Conversion |
I.1 | |||||
| Strategic Overview |
I.2 | |||||
| Balance Sheet Trends |
I.4 | |||||
| Income and Expense Trends |
I.7 | |||||
| Interest Rate Risk Management |
I.10 | |||||
| Lending Activities and Strategy |
I.11 | |||||
| Asset Quality |
I.14 | |||||
| Funding Composition and Strategy |
I.14 | |||||
| Legal Proceedings |
I.15 | |||||
| CHAPTER TWO |
MARKET AREA ANALYSIS | |||||
| Introduction |
II.1 | |||||
| National Economic Factors |
II.1 | |||||
| Market Area Demographics |
II.5 | |||||
| Regional Economy |
II.7 | |||||
| Unemployment Data |
II.11 | |||||
| Deposit Trends |
II.12 | |||||
| Competition |
II.13 | |||||
| CHAPTER THREE |
PEER GROUP ANALYSIS | |||||
| Peer Group Selection |
III.1 | |||||
| Financial Condition |
III.5 | |||||
| Income and Expense Components |
III.8 | |||||
| Loan Composition |
III.11 | |||||
| Interest Rate Risk |
III.13 | |||||
| Credit Rate Risk |
III.15 | |||||
| Summary |
III.17 | |||||
i
| RP® Financial, LC. | TABLE OF CONTENTS |
TABLE OF CONTENTS
HV Bancorp, Inc.
Huntingdon Valley Bank
Huntingdon Valley, Pennsylvania
(continued)
| DESCRIPTION |
PAGE NUMBER | |||
| CHAPTER FOUR | VALUATION ANALYSIS | |||
| Introduction |
IV.1 | |||
| Appraisal Guidelines |
IV.1 | |||
| RP Financial Approach to the Valuation |
IV.1 | |||
| Valuation Analysis |
IV.2 | |||
| 1. Financial Condition |
IV.2 | |||
| 2. Profitability, Growth and Viability of Earnings |
IV.4 | |||
| 3. Asset Growth |
IV.5 | |||
| 4. Primary Market Area |
IV.6 | |||
| 5. Dividends |
IV.7 | |||
| 6. Liquidity of the Shares |
IV.8 | |||
| 7. Marketing of the Issue |
IV.8 | |||
| A. The Public Market |
IV.8 | |||
| B. The New Issue Market |
IV.12 | |||
| C. The Acquisition Market |
IV.13 | |||
| 8. Management |
IV.16 | |||
| 9. Effect of Government Regulation and Regulatory Reform |
IV.16 | |||
| Summary of Adjustments |
IV.17 | |||
| Valuation Approach |
IV.17 | |||
| 1. Price-to-Earnings (“P/E”) |
IV.18 | |||
| 2. Price-to-Book (“P/B”) |
IV.19 | |||
| 3. Price-to-Assets (“P/A”) |
IV.21 | |||
| Comparison to Recent Offerings |
IV.21 | |||
| Valuation Conclusion |
IV.21 | |||
ii
| RP® Financial, LC. | LIST OF TABLES |
LIST OF TABLES
Huntingdon Valley Bancorp, Inc.
Huntingdon Valley Bank
Huntingdon Valley, Pennsylvania
| TABLE |
DESCRIPTION |
PAGE | ||
| 1.1 | Historical Balance Sheet Data |
I.5 | ||
| 1.2 | Historical Income Statements |
I.8 | ||
| 2.1 | Summary Demographic Data |
II.6 | ||
| 2.2 | Market Area Largest Employers – Greater Philadelphia |
II.9 | ||
| 2.3 | Market Area Largest Employers – Montgomery County |
II.11 | ||
| 2.4 | Unemployment Trends |
II.12 | ||
| 2.5 | Deposit Summary |
II.13 | ||
| 2.6 | Market Area Deposit Competitors |
II.14 | ||
| 3.1 | Peer Group of Publicly-Traded Thrifts |
III.3 | ||
| 3.2 | Balance Sheet Composition and Growth Rates |
III.6 | ||
| 3.3 | Income as a Pct. of Avg. Assets and Yields, Costs, Spreads |
III.9 | ||
| 3.4 | Loan Portfolio Composition and Related Information |
III.12 | ||
| 3.5 | Interest Rate Risk Measures and Net Interest Income Volatility |
III.14 | ||
| 3.6 | Credit Risk Measures and Related Information |
III.16 | ||
| 4.1 | Market Area Unemployment Rates |
IV.7 | ||
| 4.2 | Pricing Characteristics and After-Market Trends |
IV.14 | ||
| 4.3 | Market Pricing Comparatives |
IV.15 | ||
| 4.4 | Public Market Pricing Versus Peer Group |
IV.20 | ||
iii
| RP® Financial, LC. | OVERVIEW AND FINANCIAL ANALYSIS |
I.1
I. OVERVIEW AND FINANCIAL ANALYSIS
Introduction
Huntingdon Valley Bank (“HV Bank” or the “Bank”), chartered in 1871, is a Pennsylvania-chartered mutual savings bank headquartered in Huntingdon Valley, Pennsylvania. HV Bank serves the Philadelphia metropolitan area through an administrative office, four full service branch offices, a limited service branch office, a mortgage center and a loan origination office. The Bank’s primary market area includes Montgomery, Bucks and Philadelphia counties in Pennsylvania. A map of the Bank’s office locations is provided in Exhibit I-1. HV Bank is a member of the Federal Home Loan Bank (“FHLB”) system and its deposits are insured up to the maximum allowable amount by the Federal Deposit Insurance Corporation (“FDIC”). As of June 30, 2016, HV Bank had total assets of $182.0 million, total deposits of $141.8 million and total equity of $13.0 million, equal to 7.13% of total assets. The Bank’s audited financial statements are incorporated by reference as Exhibit I-2.
Plan of Conversion
On July 20, 2016, the Board of Trustees of the Bank adopted a plan of conversion, incorporated herein by reference, in which the Bank will convert from a Pennsylvania mutual savings bank to a Pennsylvania stock bank and become a wholly-owned subsidiary of HV Bancorp, Inc. (“HV Bancorp” or the “Company”), a newly formed Pennsylvania corporation.
HV Bancorp will offer its common stock in a subscription offering to Eligible Account Holders, Tax-Qualified Employee Stock Benefit Plans including HV Bank’s employee stock ownership plan (the “ESOP”), Supplemental Eligible Account Holders and Other Members, as such terms are defined for purposes of applicable federal regulatory guidelines governing mutual-to-stock conversions. To the extent that shares remain available for purchase after satisfaction of all subscriptions received in the subscription offering, the shares may be offered for sale to members of the general public in a community offering and/or a syndicated community offering. A portion of the net proceeds received from the sale of the common stock will be used to purchase all of the then to be issued and outstanding capital stock of HV Bank and the balance of the net proceeds will be retained by the Company.
| RP® Financial, LC. | OVERVIEW AND FINANCIAL ANALYSIS |
I.2
At this time, no other activities are contemplated for the Company other than the ownership of the Bank, funding a loan to the newly-formed ESOP and reinvestment of the proceeds that are retained by the Company. In the future, HV Bancorp may acquire or organize other operating subsidiaries, diversify into other banking-related activities, pay dividends or repurchase its stock, although there are no specific plans to undertake such activities at the present time.
Strategic Overview
HV Bank maintains a local community banking emphasis, with a primary strategic objective of meeting the borrowing and savings needs of its local customer base. Mortgage banking, which is largely an off-balance sheet activity, constitutes a significant component of the Bank’s operations. Beyond its mortgage banking activities, HV Bank’s operating strategy has been fairly reflective of a traditional thrift operating strategy in which 1-4 family residential mortgage loans and retail deposits have constituted the principal components of the Bank’s assets and liabilities, respectively. Lending diversification by the Bank has emphasized the origination of commercial real estate loans and home equity loans and lines of credit. On a more limited basis, lending diversification by the Bank includes commercial business loans, construction loans and consumer loans. The Bank’s lending activities are supplemented with investments in securities, which comprise a less significant component of the Bank’s interest-earning asset composition. Mortgage-backed securities and municipal bonds comprise the largest components of the Bank’s current holdings of investment securities. Assets are primarily funded by retail deposits generated through the branch network, with supplemental funding provided by borrowings as an alternative funding source for purposes of funding loans held for sale, as well as for managing funding costs and interest rate risk.
The Bank’s lending markets were adversely impacted by the 2008 national recession and the resulting fallout from the financial crisis that occurred with the implosion of the housing market, pursuant to which the Bank experienced credit quality deterioration. Over the past five fiscal years, the Bank’s balance of non-performing assets peaked at $4.3 million or 2.74% of assets at fiscal yearend 2012. Since fiscal yearend 2012, the balance of non-performing assets has trended steadily lower to equal $1.3 million or 0.69% of assets at June 30, 2016.
Pursuant to the Bank’s mortgage banking activities, non-interest operating income and operating expenses are maintained at relatively high levels as a percent of assets and have a significant impact on the Bank’s earnings. Operating expenses and non-interest operating income have been increasing as a percent of average assets, which has been largely related to the growing
| RP® Financial, LC. | OVERVIEW AND FINANCIAL ANALYSIS |
I.3
influence of the Bank’s mortgage banking activities on earnings. The Bank has maintained a relative stable net interest margin in recent years, in which the decline in the average yield on interest-earning assets has been fairly comparable to the decline in the average rate paid on interest-bearing liabilities. Overall, the Bank’s operating strategies have effectively reduced problem assets and improved core profitability. Growth in core earnings has been driven by the mortgage banking operation, which is viewed as a more volatile source of core earnings relative to earnings derived from the Bank’s retail and commercial banking operations.
The post-offering business plan of the Bank is expected to remain consistent with current strategic objectives. Specifically, HV Bank will continue to be an independent community-oriented financial institution with a commitment to local real estate financing with operations funded primarily by retail deposits. Growth strategies will continue to be implemented within the context of managing the Bank’s exposure to credit risk and interest rate risk.
The Bank’s Board of Directors has elected to complete a public stock offering to improve the competitive position of HV Bank. The capital realized from the stock offering will increase the Bank’s operating flexibility and allow for implementation of desired growth strategies. The additional funds realized from the stock offering will provide an alternative funding source to deposits and borrowings in meeting the Bank’s future funding needs, which may facilitate a reduction in HV Bank’s funding costs. Additionally, HV Bank’s higher equity-to-assets ratio will also better position the Bank to pursue expansion opportunities. Such expansion would most likely occur through the establishment or acquisition of additional banking offices. The Bank will also be in a better position to pursue growth through acquisition of other financial service providers following the stock offering, given its strengthened capital position and ability to offer its common stock as consideration .At this time, the Bank has no specific plans for expansion. The projected uses of proceeds are highlighted below.
| • | HV Bancorp, Inc. The Company is expected to retain up to 50% of the net offering proceeds. At present, funds at the Company level, net of the loan to the ESOP, are expected to be primarily invested initially into liquid funds held as a deposit at the Bank. Over time, the funds may be utilized for various corporate purposes, possibly including infusing additional equity into the Bank, repurchases of common stock and the payment of cash dividends. |
| • | HV Bank. Approximately 50% of the net stock proceeds will be infused into the Bank in exchange for all of the Bank’s stock. Cash proceeds (i.e., net proceeds less deposits withdrawn to fund stock purchases) infused into the Bank are anticipated to become part of general operating funds and are expected to be primarily utilized to fund loan growth over time. |
| RP® Financial, LC. | OVERVIEW AND FINANCIAL ANALYSIS |
I.4
Overall, it is the Bank’s objective to pursue growth that will serve to increase returns, while, at the same time, growth will not be pursued that could potentially compromise the overall risk associated with HV Bank’s operations.
Balance Sheet Trends
Table 1.1 shows the Bank’s historical balance sheet data for the past five fiscal years. From fiscal yearend 2012 through fiscal yearend 2016, HV Bank’s assets increased at a 3.95% annual rate. Asset growth during the period was largely due to loan growth, which was partially offset by a decline in investment securities. A combination of deposit growth and additional borrowings funded the Bank’s asset growth. A summary of HV Bank’s key operating ratios is presented in Exhibit I-3.
HV Bank’s loans receivable portfolio increased at a 7.64% annual rate from fiscal yearend 2012 through fiscal yearend 2016. The loans receivable portfolio showed a consistent upward trend since fiscal yearend 2012. The Bank’s higher loan growth rate compared to its asset growth rate provided for an increase in the loans-to-assets ratio from 44.65% at fiscal yearend 2012 to 51.34% at fiscal yearend 2016 Net loans receivable at June 30, 2016 totaled $93.5 million, versus $69.6 million at June 30, 2012. Additionally, loans held for sale, which consist of originations of 1-4 family permanent mortgage loans, fluctuated from a low of $9.3 million or 6.06% of assets at fiscal yearend 2013 to a high of $24.7 million or 13.56% of assets at fiscal yearend 2016.
Trends in the Bank’s loan portfolio composition over the past two fiscal years show that the concentration of residential mortgage loans comprising total loans receivable increased slightly from 75.70% at fiscal yearend 2015 to 76.75% at fiscal yearend 2016. The increase in the concentration of residential mortgage loans was primarily due to growth of the residential mortgage loan portfolio and, to a lesser extent, decreases in all other loan types with the exception of construction loans. Commercial real estate loans and home equity loans and lines of credit constitute the primary types of lending diversification for the Bank, with both of those areas of lending diversification showing a decline in loans outstanding during fiscal year 2016. From fiscal yearend 2015 to fiscal yearend 2016, commercial real estate loans decreased from 15.11% of total loans to 12.39% of total loans and home equity loans and lines of credit decreased from 7.95% of total loans to 6.87% of total loans. Other areas of lending diversification for the Bank have been fairly limited over the past five fiscal years, consisting of residential construction loans, commercial business loans and other consumer loans. As of June 30, 2016, construction loans equaled 3.39% of total loans, commercial business loans equaled 0.59% of total loans and other consumer loans equaled 0.01% of total loans.
| RP® Financial, LC. | OVERVIEW AND FINANCIAL ANALYSIS |
I.5
Table 1.1
Huntingdon Valley Bank
Historical Balance Sheet Data
| 6/30/12- 6/30/16 Annual. Growth Rate |
||||||||||||||||||||||||||||||||||||||||||||
| At June 30, | ||||||||||||||||||||||||||||||||||||||||||||
| 2012 | 2013 | 2014 | 2015 | 2016 | ||||||||||||||||||||||||||||||||||||||||
| Amount | Pct(1) | Amount | Pct(1) | Amount | Pct(1) | Amount | Pct(1) | Amount | Pct(1) | Pct | ||||||||||||||||||||||||||||||||||
| ($000) | (%) | ($000) | (%) | ($000) | (%) | ($000) | (%) | ($000) | (%) | (%) | ||||||||||||||||||||||||||||||||||
| Total Amount of: |
||||||||||||||||||||||||||||||||||||||||||||
| Assets |
$ | 155,914 | 100.00 | % | $ | 153,373 | 100.00 | % | $ | 165,894 | 100.00 | % | $ | 167,298 | 100.00 | % | $ | 182,023 | 100.00 | % | 3.95 | % | ||||||||||||||||||||||
| Cash and cash equivalents |
11,261 | 7.22 | % | 7,073 | 4.61 | % | 15,309 | 9.23 | % | 15,596 | 9.32 | % | 15,427 | 8.48 | % | 8.19 | % | |||||||||||||||||||||||||||
| Investment securities |
48,860 | 31.34 | % | 51,807 | 33.78 | % | 43,425 | 26.18 | % | 42,832 | 25.60 | % | 39,106 | 21.48 | % | -5.41 | % | |||||||||||||||||||||||||||
| Loans held for sale |
16,393 | 10.51 | % | 9,293 | 6.06 | % | 16,375 | 9.87 | % | 16,261 | 9.72 | % | 24,676 | 13.56 | % | 10.77 | % | |||||||||||||||||||||||||||
| Loans receivable, net |
69,614 | 44.65 | % | 74,572 | 48.62 | % | 81,085 | 48.88 | % | 83,319 | 49.80 | % | 93,450 | 51.34 | % | 7.64 | % | |||||||||||||||||||||||||||
| FHLB stock |
761 | 0.49 | % | 779 | 0.51 | % | 871 | 0.53 | % | 627 | 0.37 | % | 1,108 | 0.61 | % | 9.85 | % | |||||||||||||||||||||||||||
| Bank-owned life insurance |
3,443 | 2.21 | % | 3,559 | 2.32 | % | 3,672 | 2.21 | % | 3,783 | 2.26 | % | 3,895 | 2.14 | % | 3.13 | % | |||||||||||||||||||||||||||
| Real estate owned |
1,824 | 1.17 | % | 2,199 | 1.43 | % | 431 | 0.26 | % | 574 | 0.34 | % | 115 | 0.06 | % | -49.89 | % | |||||||||||||||||||||||||||
| Deposits |
$ | 133,717 | 85.76 | % | $ | 133,540 | 87.07 | % | $ | 139,340 | 83.99 | % | $ | 142,877 | 85.40 | % | $ | 141,771 | 77.89 | % | 1.47 | % | ||||||||||||||||||||||
| Borrowings |
8,204 | 5.26 | % | 7,031 | 4.58 | % | 13,618 | 8.21 | % | 10,502 | 6.28 | % | 23,929 | 13.15 | % | 30.68 | % | |||||||||||||||||||||||||||
| Equity |
$ | 11,628 | 7.46 | % | $ | 10,566 | 6.89 | % | $ | 10,721 | 6.46 | % | $ | 11,456 | 6.85 | % | $ | 12,971 | 7.13 | % | 2.77 | % | ||||||||||||||||||||||
| Loans/Deposits |
52.06 | % | 55.84 | % | 58.19 | % | 58.32 | % | 65.92 | % | ||||||||||||||||||||||||||||||||||
| (1) | Ratios are as a percent of ending assets. |
Sources: HV Bank’s prospectus, audited financial statements and RP Financial calculations.
| RP® Financial, LC. | OVERVIEW AND FINANCIAL ANALYSIS |
I.6
The intent of the Bank’s investment policy is to provide adequate liquidity and to generate a favorable return within the context of supporting HV Bank’s overall credit and interest rate risk objectives. The Bank has maintained a higher level of cash and cash equivalents during the past three fiscal years for purposes of managing interest rate exposure, during a period when interest rates have been at historical lows. Over the past five fiscal years, the Bank’s level of cash and investment securities (inclusive of FHLB/ACBB stock) ranged from a low of 30.61% of assets at fiscal yearend 2015 to a high of 39.05% of assets at fiscal yearend 2012. The Bank maintained total cash and investments of $55.6 million or 30.56% of assets at June 30, 2016.
Mortgage-backed securities have comprised the largest concentration of the Bank’s investment holdings over the past five fiscal years and are generally purchased as a means to deploy excess liquidity at more favorable yields than other investment alternatives that are consistent with HV Bank’s investment philosophy. Mortgage-backed securities held by HV Bank consist of securities that are guaranteed or insured by government sponsored enterprises (“GSEs”). As of June 30, 2016, the mortgage-backed securities portfolio totaled $16.8 million and the entire portfolio was maintained as available for sale. Other investment securities held by the Bank at June 30, 2016 consisted of $9.4 million of municipal bonds, $1.5 million of U.S. Government agency securities, $8.3 million of corporate notes and $3.0 million of certificates of deposit (“CDs”) held in other financial institutions. With the exception of $5.8 million of municipal bonds, all investments were maintained as available for sale at June 30, 2016. As of June 30, 2016, investment securities maintained as available for sale had a net unrealized loss of $12,000. Exhibit I-4 provides detail of the Bank’s investment portfolio, as of fiscal yearend 2015 and fiscal yearend 2016. As of June 30, 2016, the Bank also held $1.1 million of FHLB/ACBB stock equal to 0.61% of assets and $15.4 million of cash and cash equivalents equal to 8.48% of assets.
The Bank also maintains an investment in bank-owned life insurance (“BOLI”) policies, which cover the lives of some of the Bank’s current and former officers. The purpose of the investment is to provide funding for the Bank’s benefit plans. As of June 30, 2016, the cash surrender value of the Bank’s BOLI equaled $3.9 million or 2.14% of assets.
Over the past five fiscal years, HV Bank’s funding needs have been addressed through a combination of deposits, borrowings and internal cash flows. From fiscal yearend 2012 through fiscal yearend 2016, the Bank’s deposits increased at a 1.47% annual rate. The Bank recorded
| RP® Financial, LC. | OVERVIEW AND FINANCIAL ANALYSIS |
I.7
deposit growth in fiscal years 2014 and 2015, while deposits declined slightly during fiscal years 2013 and 2016. Overall, total deposits increased from $133.7 million or 85.76% of assets at fiscal yearend 2012 to $141.8 million or 77.89% of assets at fiscal yearend 2016. Transaction and savings account deposits constitute the largest concentration of the Bank’s deposits.
Borrowings serve as an alternative funding source for the Bank to address funding needs and to support management of deposit costs and interest rate risk. From fiscal yearend 2012 through fiscal yearend 2016, borrowings ranged from a low of $7.0 million or 4.58% of assets at fiscal yearend 2013 to a high of $23.9 million or 13.15% of assets at fiscal yearend 2016. Most of the increase in borrowings during fiscal year 2016 was related to funding an increase in the balance of loans held for sale at fiscal yearend 2016. As of June 30, 2016, borrowings held by the Bank consisted of $20.0 million of FHLB advances and $3.9 million of overnight repurchase agreements.
The Bank’s equity increased at a 2.77% annual rate from fiscal yearend 2012 through fiscal yearend 2016, which was mostly attributable to retention of earnings. A slightly lower rate of capital growth relative to asset growth provided for a slightly decline the Bank’s equity-to-assets ratio from 7.46% at fiscal yearend 2012 to 7.13% at fiscal yearend 2016. All of the Bank’s capital is tangible capital and HV Bank maintained capital surpluses relative to all of its regulatory capital requirements at June 30, 2016. The addition of stock proceeds will serve to strengthen the Bank’s capital position, as well as support growth opportunities. At the same time, HV Bank’s ROE will initially be depressed following its stock conversion as the Bank’s pro forma capital position will be significantly higher following the infusion of net stock proceeds into capital.
Income and Expense Trends
Table 1.2 shows the Bank’s historical income statements for the past five fiscal years. The Bank’s reported earnings over the past five fiscal years ranged from a net loss of $123,000 or 0.08% of average assets during fiscal 2014 to net income of $1.0 million or 0.62% of average assets during fiscal 2016. Currently, revenues derived from sources of non-interest operating income are a more significant contributor to the Bank’s earnings relative to net interest income, which is attributable to the revenues generated from the Bank’s mortgage banking operations. Also as the result of the significance of the significance of the Bank’s mortgage banking activities relative to its asset size, the Bank’s operating expense ratios as a percent of average assets have been maintained at relatively high levels as well. Loan loss provisions and non-operating income and losses have had a varied impact on the Bank’s earnings over the past five fiscal years.
| RP® Financial, LC. | OVERVIEW AND FINANCIAL ANALYSIS |
I.8
Table 1.2
Huntingdon Valley Bank
Historical Income Statements
| For the Fiscal Year Ended June 30, | ||||||||||||||||||||||||||||||||||||||||
| 2012 | 2013 | 2014 | 2015 | 2016 | ||||||||||||||||||||||||||||||||||||
| Amount | Pct(1) | Amount | Pct(1) | Amount | Pct(1) | Amount | Pct(1) | Amount | Pct(1) | |||||||||||||||||||||||||||||||
| ($000) | (%) | ($000) | (%) | ($000) | (%) | ($000) | (%) | ($000) | (%) | |||||||||||||||||||||||||||||||
| Interest income |
$ | 5,545 | 3.66 | % | $ | 4,994 | 3.21 | % | $ | 5,123 | 3.21 | % | $ | 5,057 | 3.02 | % | $ | 5,302 | 3.19 | % | ||||||||||||||||||||
| Interest expense |
(1,211 | ) | -0.80 | % | (982 | ) | -0.63 | % | (839 | ) | -0.53 | % | (785 | ) | -0.47 | % | (746 | ) | -0.45 | % | ||||||||||||||||||||
|
|
|
|
|
|
|
|
|
|
|
|
|
|
|
|
|
|
|
|
|
|||||||||||||||||||||
| Net interest income |
$ | 4,334 | 2.86 | % | $ | 4,012 | 2.58 | % | $ | 4,284 | 2.68 | % | $ | 4,272 | 2.55 | % | $ | 4,556 | 2.74 | % | ||||||||||||||||||||
| Provision for loan losses |
(178 | ) | -0.12 | % | (120 | ) | -0.08 | % | (246 | ) | -0.15 | % | (79 | ) | -0.05 | % | (9 | ) | -0.01 | % | ||||||||||||||||||||
|
|
|
|
|
|
|
|
|
|
|
|
|
|
|
|
|
|
|
|
|
|||||||||||||||||||||
| Net interest income after provisions |
$ | 4,156 | 2.74 | % | $ | 3,892 | 2.50 | % | $ | 4,038 | 2.53 | % | $ | 4,193 | 2.50 | % | $ | 4,547 | 2.73 | % | ||||||||||||||||||||
| Mortgage banking gains/Gain on sale of loans |
$ | 1,774 | 1.17 | % | $ | 1,686 | 1.08 | % | $ | 2,204 | 1.38 | % | $ | 4,519 | 2.70 | % | $ | 5,004 | 3.01 | % | ||||||||||||||||||||
| Other non-interest operating income |
417 | 0.28 | % | 409 | 0.26 | % | 333 | 0.21 | % | 381 | 0.23 | % | 333 | 0.20 | % | |||||||||||||||||||||||||
| Operating expense |
(6,073 | ) | -4.01 | % | (6,498 | ) | -4.17 | % | (6,616 | ) | -4.14 | % | (7,485 | ) | -4.47 | % | (8,354 | ) | -5.02 | % | ||||||||||||||||||||
|
|
|
|
|
|
|
|
|
|
|
|
|
|
|
|
|
|
|
|
|
|||||||||||||||||||||
| Net operating income |
$ | 274 | 0.18 | % | ($ | 511 | ) | -0.33 | % | ($ | 41 | ) | -0.03 | % | $ | 1,608 | 0.96 | % | $ | 1,530 | 0.92 | % | ||||||||||||||||||
| Non-Operating Income/(Losses) |
||||||||||||||||||||||||||||||||||||||||
| Gain (loss) on sale of securities |
$ | 528 | 0.35 | % | $ | 592 | 0.38 | % | $ | 6 | 0.00 | % | $ | 9 | 0.01 | % | $ | 21 | 0.01 | % | ||||||||||||||||||||
| Merger and conversion costs |
— | 0.00 | % | — | 0.00 | % | (186 | ) | -0.12 | % | (854 | ) | -0.51 | % | — | 0.00 | % | |||||||||||||||||||||||
|
|
|
|
|
|
|
|
|
|
|
|
|
|
|
|
|
|
|
|
|
|||||||||||||||||||||
| Net non-operating income (loss) |
$ | 528 | 0.35 | % | $ | 592 | 0.38 | % | ($ | 180 | ) | -0.11 | % | ($ | 845 | ) | -0.50 | % | $ | 21 | 0.01 | % | ||||||||||||||||||
| Net income before tax |
$ | 802 | 0.53 | % | $ | 81 | 0.05 | % | ($ | 221 | ) | -0.14 | % | $ | 763 | 0.46 | % | $ | 1,551 | 0.93 | % | |||||||||||||||||||
| Income tax provision |
110 | 0.07 | % | 42 | 0.03 | % | 98 | 0.06 | % | (135 | ) | -0.08 | % | (525 | ) | -0.32 | % | |||||||||||||||||||||||
|
|
|
|
|
|
|
|
|
|
|
|
|
|
|
|
|
|
|
|
|
|||||||||||||||||||||
| Net income (loss) |
$ | 912 | 0.60 | % | $ | 123 | 0.08 | % | ($ | 123 | ) | -0.08 | % | $ | 628 | 0.38 | % | $ | 1,026 | 0.62 | % | |||||||||||||||||||
| Adjusted Earnings |
||||||||||||||||||||||||||||||||||||||||
| Net income |
$ | 912 | 0.60 | % | $ | 123 | 0.08 | % | ($ | 123 | ) | -0.08 | % | $ | 628 | 0.38 | % | $ | 1,026 | 0.62 | % | |||||||||||||||||||
| Add (Deduct): Non-operating income |
(528 | ) | -0.35 | % | (592 | ) | -0.38 | % | 180 | 0.11 | % | 845 | 0.50 | % | (21 | ) | -0.01 | % | ||||||||||||||||||||||
| Tax effect (2) |
211 | 0.14 | % | 237 | 0.15 | % | (72 | ) | -0.05 | % | (338 | ) | -0.20 | % | 8 | 0.01 | % | |||||||||||||||||||||||
|
|
|
|
|
|
|
|
|
|
|
|
|
|
|
|
|
|
|
|
|
|||||||||||||||||||||
| Adjusted earnings |
$ | 595 | 0.39 | % | ($ | 232 | ) | -0.15 | % | ($ | 15 | ) | -0.01 | % | $ | 1,135 | 0.68 | % | $ | 1,013 | 0.61 | % | ||||||||||||||||||
| Expense Coverage Ratio (3) |
0.71 | x | 0.62 | x | 0.65 | x | 0.57 | x | 0.55 | x | ||||||||||||||||||||||||||||||
| Efficiency Ratio (4) |
93.04 | % | 106.38 | % | 96.96 | % | 81.57 | % | 84.37 | % | ||||||||||||||||||||||||||||||
| (1) | Ratios are as a percent of average assets. |
| (2) | Assumes a 40.0% effective tax rate. |
| (3) | Expense coverage ratio calculated as net interest income before provisions for loan losses divided by operating expenses. |
| (4) | Efficiency ratio calculated as operating expenses divided by the sum of net interest income before provisions for loan losses plus non-interest operating income. |
Sources: HV Bank’s prospectus, audited financial statements and RP Financial calculations.
| RP® Financial, LC. | OVERVIEW AND FINANCIAL ANALYSIS |
I.9
Over the past five fiscal years, the Bank’s net interest income to average assets ratio ranged from a low of 2.55% during fiscal 2015 to a high of 2.86% during fiscal 2012. For 2016, the Bank’s net interest income to average assets ratio equaled 2.74%. The decline in the Bank’s net interest income ratio since fiscal 2012 has been largely attributable to interest rate spread compression that has resulted from a more significant decrease in the yield earned on interest-earnings assets relative to the cost of interest-bearing liabilities. As the result of the prolonged low interest rate environment, the decline in yield earned on less rate sensitive interest-earning assets became more significant relative to the decline in rate paid on more rate sensitive liabilities. While the prolonged low interest rate environment and relatively flat yield curve has resulted in interest rate spread compress for financial institutions in general, a shift in the Bank’s interest-earning asset composition towards a higher concentration of loans has facilitated maintenance of a relatively stable net interest margin over the past five fiscal years. The increase in the Bank’s net interest income ratio during fiscal 2016 was attributable to a wider yield-cost spread, which increased from 2.65% during fiscal 2015 to 2.85% during fiscal 2016. An increase in yield earned on interest-earning assets drove the increase in the Bank’s yield-cost spread during fiscal 2016, as the concentration of loans comprising interest-earning assets increased during fiscal 2016. The Bank’s net interest rate spreads and yields and costs for the past two fiscal years are set forth in Exhibit I-3 and Exhibit I-5.
Non-interest operating income has been a significant and growing contributor to the Bank’s earnings, which has been largely driven by increases in gains on sales of loans and other mortgage banking related gains (gain from hedging instruments and change in fair value of loans held-for-sale). Beyond the mortgage banking related gains, revenues derived from sources of non-interest operating income have been somewhat of a limited contributor to the Bank’s earnings. Throughout the period shown in Table 1.2, sources of non-interest operating income ranged from a low of $2.1 million or 1.34% of average assets during fiscal 2013 to a high of $5.3 million or 3.21% of average assets during fiscal 2016. Mortgage banking related gains accounted for 93.8% of the Bank’s non-interest operating income during fiscal 2016. Other than mortgage banking related gains, customer service fees and earnings on BOLI constitute the largest sources of non-interest operating income for the Bank.
Operating expenses represent the other major component of the Bank’s earnings, ranging from a low of $6.1 million or 4.01% of average assets during fiscal 2012 to a high of $8.4 million or 5.02% of average assets during fiscal 2016. Consistent with the Bank’s relatively high levels of non-interest operating income, the Bank’s relatively high operating expense ratios are largely attributable to the significance of its mortgage banking operation relative to its asset size.
| RP® Financial, LC. | OVERVIEW AND FINANCIAL ANALYSIS |
I.10
Overall, the general trends in the Bank’s ratios for net interest income, non-interest operating income and operating expenses since fiscal 2012 reflect an increase in core earnings, as indicated by the Bank’s efficiency ratio efficiency ratio (operating expenses as a percent of the sum of net interest income and non-interest operating income). HV Bank’s efficiency ratio improved from 93.04% during fiscal 2012 to 84.37% during fiscal 2016. The improvement in the Bank’s efficiency ratio was the result of an increase in the non-interest operating income ratio, which was partially offset by a decrease in the net interest income ratio and an increase in the operating expense ratio.
During the period covered in Table 1.2, loan loss provisions had a varied impact on the Bank’s earnings with the amount of loan loss provisions established becoming a less significant earnings factor during recent periods. Over the past five fiscal years, loan loss provisions established by the Bank ranged from a low of $9,000 or 0.01% of average assets during fiscal 2016 to a high of $246,000 or 0.15% of average asset during fiscal 2014. As of June 30, 2016, the Bank maintained valuation allowances of $487,000, equal to 0.52% of loans receivable and 42.53% of non-accruing loans. Exhibit I-6 sets forth the Bank’s loan loss allowance activity for the past two fiscal years.
Non-operating income and losses over the past five fiscal years have primarily consisted of gains on the sale of securities. Additionally, during fiscal years 2014 and 2015, the Bank recorded non-recurring losses related to the write-off of merger and conversion expenses. Overall, net non-operating income and losses ranged from a net loss of $845,000 or 0.50% of average assets during fiscal year 2015 to net non-operating income of $592,000 or 0.38% of average assets during fiscal year 2013. For fiscal year 2016 the Bank recorded non-operating income of $21,000 or 0.01% of average assets, which consisted entirely of gains on the sale of securities. Overall, the various items that comprise the Bank’s non-operating income and losses are not viewed to be part of the Bank’s core or recurring earnings base.
The Bank’s effective tax rate ranged from 33.85% during fiscal 2016 to a tax benefit of 51.85% during fiscal 2013. The Bank’s effective marginal tax rate on a fully taxable instrument approximates 40%.
Interest Rate Risk Management
The Bank’s balance sheet is liability-sensitive in the short-term (less than one year) and, thus, Economic Value of Equity (“EVE”) would decrease during periods of rising and higher interest rates. Comparatively, the Bank’s net interest income would increase during periods of rising interest
| RP® Financial, LC. | OVERVIEW AND FINANCIAL ANALYSIS |
I.11
rates. As of June 30, 2016, an analysis of the Bank’s EVE and net interest income indicated that a 2.0% instantaneous and sustained parallel increase in the yield curve would result in an 11.99% decline in EVE and an 8.46% increase in net interest income over a one year period (see Exhibit I-7).
The Bank pursues a number of strategies to manage interest rate risk, particularly with respect to seeking to limit the repricing mismatch between interest rate sensitive assets and liabilities. The Bank manages interest rate risk from the asset side of the balance sheet through selling originations of 1-4 family fixed rate loans, retaining originations of ARM loans for its own portfolio, diversifying into other types of lending beyond 1-4 family permanent mortgage loans which consist primarily of shorter term fixed rate loans, maintaining most investments as available for sale and maintaining a relatively high level of liquidity in the prevailing low interest rate environment. As of June 30, 2016, of the Bank’s total loans due after June 30, 2017, ARM loans comprised 26.0% of those loans (see Exhibit I-8). The Bank also recently restructured the investment portfolio, in which the Bank invested in securities with shorter term maturities and durations. On the liability side of the balance sheet, management of interest rate risk has been pursued through increasing the concentration of lower cost and less interest rate sensitive transaction and savings account deposits comprising total deposits.
The infusion of stock proceeds will serve to further limit the Bank’s interest rate risk exposure, as most of the net proceeds will be redeployed into interest-earning assets and the increase in the Bank’s capital position will lessen the proportion of interest rate sensitive liabilities funding assets.
Lending Activities and Strategy
HV Bank’s lending activities have traditionally emphasized 1-4 family permanent mortgage loans and such loans continue to comprise the largest portion of the Bank’s loan portfolio. Beyond 1-4 family loans, lending diversification by the Bank has emphasized commercial real estate loans and home equity loans and lines of credit. Pursuant to the Bank’s strategic plan, the Bank is pursuing a diversified lending strategy emphasizing commercial real estate loans as the primary area of targeted loan growth. On a more limited basis, other areas of lending diversification for the Bank include commercial business loans, residential construction loans and other consumer loans. Exhibit I-9 provides historical detail of HV Bank’s loan portfolio composition for the past two fiscal years and Exhibit I-10 provides the contractual maturity of the Bank’s loan portfolio by loan type as of June 30, 2016.
| RP® Financial, LC. | OVERVIEW AND FINANCIAL ANALYSIS |
I.12
1-4 Family Residential Loans. HV Bank’s residential lending activities are conducted through its mortgage banking operations, in which the large majority of residential mortgage originations are sold to the secondary market on a servicing released basis. Fixed rate loans that do not meet secondary market standards and ARM loans are retained in the loans receivable portfolio. ARM loans generally have fixed rates for initial terms of five or seven years and adjust annually thereafter at a margin indexed to the one year LIBOR. The retained fixed rate loans generally do not have materially higher risk characteristics, but are not saleable for minor underwriting or loan characteristic reasons. The Bank generally limits the loan-to-value (“LTV”) ratio on 1-4 family residential without private mortgage insurance to 80%. As of June 30, 2016, the Bank’s outstanding balance of 1-4 family loans (excluding loans held for sale) equaled $72.0 million or 76.75% of total loans receivable.
Construction Loans. The Bank’s construction lending activities consist of financing for the purchase of developed lots and for the construction of single-family residences, which are extended to individuals for the construction and permanent financing of their personal residences. Construction loans to individuals are made on the same general terms as the Bank’s 1-4 family loans, but provide for the payment of interest only during the construction phase which is typically six months. At the end of the construction phase, the loan converts to a permanent mortgage loan. As of June 30, 2016, the Bank’s outstanding balance of construction loans equaled $3.2 million or 3.39% of total loans receivable.
Home Equity Loans and Lines of Credit. The Bank’s 1-4 family lending activities include home equity loans and lines of credit. Home equity loans are offered as fixed rate amortizing loans for terms of up to 20 years, while home equity lines of credit have a floating rate tied to the prime rate and generally have 30 year terms. The Bank will originate home equity loans and lines of credit up to a LTV ratio of 80% inclusive of other liens on the property. As of June 30, 2016, the Bank’s outstanding balance of home equity loans and lines of credit equaled $6.4 million or 6.87% of total loans receivable.
Commercial Real Estate Loans. The balance of the mortgage loan portfolio consists of commercial real estate loans, which are collateralized by properties in the Bank’s regional lending area. Commercial real estate loans are originated up to a LTV ratio of 80% and require a minimum debt-coverage ratio of 1.25 times. Commercial real estate loans are generally extended as five
| RP® Financial, LC. | OVERVIEW AND FINANCIAL ANALYSIS |
I.13
year balloon loans with amortization terms of up to 25 years. The Bank’s commercial real estate loans are typically secured by medical, retail, industrial, warehouse, service, apartments or other commercial properties. The largest commercial real estate loan in the Bank’s loan portfolio at June 30, 2016 was a $1.3 million loan secured by a medical office, which was performing in accordance with its original terms at June 30, 2016. As of June 30, 2016, the Bank’s outstanding balance of commercial real estate loans totaled $11.6 million or 12.39% of total loans receivable.
Commercial real estate lending is a desired area of loan growth for the Bank, pursuant to which the Bank is seeking to become a full service community bank to its commercial loan customers through offering a full range of commercial loan products that can be packaged with lower cost commercial deposit products. The Bank’s plan is to focus on lending to small businesses located in its market area, targeting owner occupied businesses such as professional service providers. The Bank recently hired an experienced commercial loan officer with commercial lending relationships in the Bank’s market area to lead this initiative. The Bank intends to enter into a consulting agreement with another local financial institution in order to create a partnership where the Bank can sell to the other financial institution a participation interest in commercial real estate loans originated by the Bank so as to limit the Bank’s risk as it grows its portfolio of commercial real estate loans. The commercial real estate loans would have to comply with both the Bank’s and the other financial institution’s underwriting policies.
Commercial Business Loans. The commercial business loan portfolio is generated through extending loans to small businesses operating in the Bank’s local market area. Commercial business loans offered by the Bank consist of regular lines of credit and revolving lines of credit with terms up to twelve months to finance short-term working capital needs such as accounts receivable and inventory. As of December 31, 2016, the Bank’s outstanding balance of commercial business loans equaled $558,000 or 0.59% of total loans receivable.
Other Consumer Loans. Consumer loans other than home equity loans and line of credit is largely an inactive area of lending diversification for the Bank. As of June 30, 2016, the Bank held $10,000 of other consumer loans or 0.01% of total loans receivable.
Exhibit I-11 provides a summary of the Bank’s lending activities over the past two fiscal years. Total loans originated increased from $174.3 million during fiscal year 2015 to $190.1 million during fiscal year 2016. The increase in loans originated during fiscal year 2016 was substantially driven by an increase in originations of 1-family loans, with such originations increasing from $171.1 million during fiscal year 2015 to $183.0 million during fiscal year 2016. Other areas of lending
| RP® Financial, LC. | OVERVIEW AND FINANCIAL ANALYSIS |
I.14
activity were comparatively modest during the past two fiscal years, consisting of originations of home equity loans and lines of credit, commercial real estate loans, construction loans and a nominal amount of consumer loans. Originations of loans other than 1-4 family loans increased from $3.2 million during fiscal year 2015 to $7.2 million during fiscal year 2016, which was due to increased originations of home equity loans and lines of credit and construction loans. Comparatively, commercial real estate loan originations declined during fiscal year 2016. Loans sold decreased from $159.5 million during fiscal year 2015 to $157.8 million during fiscal year 2016, while loan repayments increased from $13.0 million during fiscal year 2015 to $13.9 million during fiscal year 2016. Overall, total loans, including loans held for sale, increased by $18.4 million during fiscal year 2016 to total $118.5 million at June 30, 2016.
Asset Quality
Historically, the Bank’s lending emphasis on lending in local and familiar markets generally supported maintenance of relatively favorable credit quality measures. However, following the national recession and bursting of the housing bubble in 2008, the Bank experienced elevated levels of problems assets. Over the past two fiscal years, HV Bank’s balance of non-performing assets ranged from a high of $2.2 million or 1.33% of assets at fiscal yearend 2015 to a low of $1.3 million or 0.69% of assets at fiscal yearend 2016. As shown in Exhibit I-12, non-performing assets at June 30, 2016 consisted of $1.1 million of non-accruing loans and $115,000 of real estate owned. Non-accruing loans held by the Bank at June 30, 2106 were concentrated in 1-4 family permanent mortgage loans totaling $818,000.
To track the Bank’s asset quality and the adequacy of valuation allowances, the Bank has established detailed asset classification policies and procedures which are consistent with regulatory guidelines. Classified assets are reviewed monthly by senior management and quarterly by the Board. Pursuant to these procedures, when needed, the Bank establishes additional valuation allowances to cover anticipated losses in classified or non-classified assets. As of June 30, 2016, the Bank maintained loan loss allowances of $487,000, equal to 0.52% of total loans receivable and 42.53% of non-performing loans.
Funding Composition and Strategy
Deposits have consistently served as the Bank’s primary funding source and at June 30, 2016 deposits accounted for 85.56% of HV Bank’s combined balance of deposits and borrowings.
| RP® Financial, LC. | OVERVIEW AND FINANCIAL ANALYSIS |
I.15
Exhibit I-13 sets forth the Bank’s deposit composition for the past two fiscal years. Transaction and savings account deposits comprised 71.09%% of average total deposits during fiscal year 2016, as compared to 68.11% of average total deposits during fiscal year 2015. The increase in the concentration of core deposits comprising total deposits during fiscal year 2016 was realized through a decrease in CDs. Savings account deposits comprised the largest concentration of the Bank’s core deposits during fiscal year 2016, equaling 25.17% of average total deposits and 36.19% of average core deposits.
The balance of the Bank’s deposits consists of CDs, which equaled 28.91% of average total deposits during fiscal year 2016 compared to 31.89% of average total deposits during fiscal year 2015. As of June 30, 2016, jumbo CDs (CD accounts with balances of $100,000 or more) amounted to $18.5 million or 49.37% of total CDs and $12.3 million or 66.47% were scheduled to mature in one year or less. Exhibit I-14 sets forth the maturity schedule of the Bank’s jumbo CDs as of June 30, 2016. The Bank did not maintain any brokered CDs at June 30, 2016.
Borrowings serve as an alternative funding source for the Bank to facilitate management of funding costs and interest rate risk. Borrowings utilized by the Bank consist of FHLB advances and overnight repurchase agreements. As of June 30, 2016, the Bank’s borrowings consisted of $20.0 million of FHLB advances and $3.9 million of overnight repurchase agreements. The FHLB advances have scheduled maturities through June 2019. At June 30, 2016, the weighted average interest rate on the FHLB advances equaled 0.86% and the weighted average interest rate on the repurchase agreements equaled 0.08%. Exhibit I-15 provides further detail of the Bank’s borrowings during the past two fiscal years.
Legal Proceedings
The Bank is not currently party to any pending legal proceedings that the Bank’s management believes would have a material adverse effect on the Bank’s financial condition, results of operations or cash flows.
| RP® Financial, LC. | MARKET AREA ANALYSIS |
II.1
II. MARKET AREA ANALYSIS
Introduction
HV Bank serves the Philadelphia metropolitan area through four full service branches and a limited service branch, which serve the counties of Montgomery, Buck and Philadelphia. All of the branch offices, with the exception of the Philadelphia limited service branch, are located north of the city of Philadelphia. Exhibit II-1 provides information on the Bank’s office properties.
The Philadelphia MSA is the nation’s sixth largest metropolitan area in terms of total population, with a 2016 population of approximately 6.1 million. The three counties served by the Bank’s branches had a total population of approximately 3.0 million in 2016. The Greater Philadelphia area economy is typical of the cities in the northeast corridor, where the traditional manufacturing-based economy has diminished and the service sector has been the primary source of growth. Overall, the Philadelphia MSA maintains a fairly diversified economic base, as traditional employers in the manufacturing and financial services industry have been bolstered by growth in the life sciences and healthcare industries as well as the information technology and communication sectors.
Future growth opportunities for HV Bank depend on the future growth and stability of the local and regional economy, demographic growth trends, and the nature and intensity of the competitive environment. These factors have been briefly examined to help determine the growth potential that exists for the Bank, the relative economic health of the Bank’s market area, and the resultant impact on value.
National Economic Factors
The business potential of a financial institution is partially dependent on the future operating environment and growth opportunities for the banking industry and the economy as a whole. In assessing national economic trends over the past few quarters, manufacturing activity for January 2016 shrank for a fourth straight month with an index reading of 48.2. Comparatively, January service sector activity expanded at a slower rate with an index reading of 53.2. U.S. employers added 151,000 jobs in January, which was the weakest job growth since September 2015. However, the January unemployment rate fell to 4.9%. Retail sales increased 0.2% in January, while orders for durable goods surged 4.9% in January. Housing
| RP® Financial, LC. | MARKET AREA ANALYSIS |
II.2
data for January showed declines in housing starts and new home sales of 3.8% and 9.2%, respectively, while January existing home sales increased 0.4%. Pending home sales for January fell 2.5%, which was attributable to rising prices and lower inventory. Manufacturing activity for February contracted for a fifth straight month with an index reading of 49.5%, which was up slightly compared to January’s reading. February service sector activity expanded at a slightly higher rate with an index reading of 53.3. Job growth rebounded in February as U.S. employers added 242,000 jobs in February. The February unemployment rate held steady at 4.9%, although wages fell in February. February retail sales and orders for durable goods suggested a slowdown in the U.S. economy, based on respective declines of 0.1% and 2.8%. Comparatively, February housing data showed a pick-up in activity as housing starts rebounded with a 5.2% increase, new home sales rose 2.0% and pending home sales were up 3.5%. However, sales of existing homes dropped 7.1% in February. March job growth slowed slightly in March, as employers added 215,000 jobs in March. The March unemployment rate edged up to 5.0%, due to more Americans entering the labor force. Manufacturing activity for March expanded for the first time since August 2015, with an index reading of 51.8. Service sector activity for March also accelerated with an index reading of 54.5. March retail sales unexpectedly fell 0.3%, while durable-goods orders for March rose 0.8%. March housing data remained somewhat mixed, as existing and pending home sales rose 5.1% and 1.4%, respectively. Comparatively, new home sales dropped 1.5% in March. First quarter GDP increased at a 0.5% annual rate (subsequently revised up to 1.1%), which marked the economy’s worst performance in two years.
Manufacturing activity expanded for a second straight month in April 2016, but at a slightly slower pace with an index reading of 50.8%. April service sector activity recorded stronger growth, based on an index reading of 55.7. The U.S. economy added 160,000 jobs in April, which came in below expectations, and the April unemployment rate remained at 5.0%. Retail sales for April surged 1.3%, which was the highest level of retail sales in more than a year. Housing demand showed signs of firming up in April, as housing starts showed a healthy increase of 6.6%, existing home sales rose 1.7% and new home sales surged 16.6%. New home sales recorded for April was the strongest month since 2008 and the median home price for a new home rose to a record high of $321,000 in April. Other indications that the U.S. economy was gaining traction included a 1.0% increase in April consumer spending, which was the biggest one month jump since August 2009, and manufacturing activity expanded at a slightly faster pace in May with an index reading of 51.3. Comparatively, service sector activity
| RP® Financial, LC. | MARKET AREA ANALYSIS |
II.3
expanded a lower rate in May with an index reading of 52.9 and the May employment report suggested that the U.S. economy may be slowing. Employers added just 38,000 jobs in May, which was the fewest jobs added in more than five years. While the May unemployment rate dropped to 4.7%, which was the lowest unemployment rate since November 2007, the decrease was attributable to nearly a half-million jobless Americans stopped looking for work during May. Notwithstanding the weak job growth reported for May, retail sales showed a healthy increase of 0.5% in May. Housing starts declined 0.3% in May, suggesting the supply of new homes could have trouble keeping up with steady demand. Sales of new single-family homes declined 6.0% in May, versus a 1.8% increase in May existing home sales. Manufacturing activity expanded for a fourth consecutive month in June with a slightly higher index reading of 53.2. Service sector activity for June also accelerated in June with an index reading of 56.5, which was the highest reading since November 2015. June employment data eased fears about a downturn in the U.S. economy, as employers added a stronger-than-expected 287,000 jobs in June. The unemployment rate for June ticked up to 4.9%. June housing starts were up 4.8% compared to May. Home sales for June also pointed towards a healthy market for housing, with June existing and home sales showing increases of 1.1% and 3.5%, respectively. Second quarter GDP increased at a 1.2% annualized rate, which was less than forecasted and only slight above the first quarter growth rate of 0.8%. Manufacturing and service sector activity expanded at slightly lower rates in July 2016, with respective index readings of 52.6 and 55.5. The U.S. economy added a better-than-expected 255,000 jobs in July, while the July unemployment rate held steady at 4.9%.
In terms of interest rates trends over the past few quarters, long-term Treasury yields trended lower through the first three weeks of January 2016 with the yield on the 10-Treasury note approaching 2.0%. Data showing a slowing U.S. economy, falling commodity prices and investors moving into safe haven investments amid stock market volatility were factors contributing to long-term Treasury yields declining. The Federal Reserve held interest rates steady at its late-January meeting, expressing concerns about financial market turmoil and slow economic growth abroad. The decline in long-term Treasury yields accelerated in early-February, as investors moved into safe haven investments amid concern about the outlook for global economy that fueled a sell-off in global stock markets. Congressional testimony by the Federal Reserve Chairwoman signaling a cautious approach by the Federal Reserve for future interest rate increases pushed the 10-year Treasury yield to a one year low of 1.64% heading into mid-February. Long-term Treasury yields stabilized during the second half of February, as
| RP® Financial, LC. | MARKET AREA ANALYSIS |
II.4
investors took into consideration mixed data on the health of the U.S. economy. A rebound in February job growth pushed the 10-year Treasury yield higher at the start of March, as the 10-year Treasury yield approached 2.0% going into mid-March. Comments by the Federal Reserve Chairwoman that global economic and financial uncertainty justified a slower path for increasing interest rates contributed to long-term Treasury yields edging lower during the second half of March.
The 10-year Treasury yield hovered around 1.75% during the first half of April 2016, as minutes of the Federal Reserve’s March policy meeting signaled that an interest rate increase in April was unlikely. Long-term Treasury yields edged up slightly during the second half of April, with the Federal Reserve concluding its late-April policy meeting leaving interest rates unchanged and remaining ambiguous about raising interest rates in June. Weaker-than-expected job growth reflected in the April employment data contributed to the 10-year Treasury yield dipping back down to 1.75% through mid-May. Signals from the Federal Reserve that an interest rate hike at its June policy meeting was still in-play factored into long-term Treasury yields ticking up going into the second half of May. Investors bought Treasury bonds in early-June following the much-weaker-than-expected jobs report for May, as the anemic job growth reflected in the May employment data reduced expectations that the Federal Reserve would push up rates at its mid-June meeting. As expected, the Federal Reserve concluded it mid-June policy meeting holding short-term interest rates steady and lowered projections of how much they would raise rates in the coming years. Long-term Treasury yields stabilized heading into the second half of June, which was followed by a sharp decline in the 10-year Treasury yield in late-June as investors worried about the economic and political consequences of Britain’s vote to leave the European Union.
In early-July 2016, investors continued to sell risky assets in favor of safe haven investments, which drove the yield on the 10-year Treasury to a record low of 1.37%. Long-term Treasury yields rose going into mid-July, as investors moved back into riskier assets on the heels of the strong job growth reported for June. During the second half of July and into early-August, long-term Treasury yields remained fairly stable, as the Federal Reserve concluded its late-July policy meeting keeping its target interest rate unchanged as expected. As of August 5, 2016, the bond equivalent yields for U.S. Treasury bonds with terms of one and ten years equaled 0.56% and 1.59%, respectively, versus comparable year ago yields of 0.38% and 2.28%. Exhibit II-2 provides historical interest rate trends.
| RP® Financial, LC. | MARKET AREA ANALYSIS |
II.5
Based on the consensus outlook of economists surveyed by The Wall Street Journal in July 2016, GDP growth was projected to come in at 2.0% in 2016 and increase to 2.2% in 2017. The unemployment rate was forecasted to equal 4.7% in December 2016 and decrease slightly to 4.6% in June 2017. An average of 164,000 jobs were projected to be added per month during 2016. The majority of economists believed the next interest rate hike by the Federal Reserve would occur in December 2016 and, on average, the economists forecasted that the 10-year Treasury yield would increase to 1.78% by the end of 2016 and increase to 2.06% by June 2017. The surveyed economists also forecasted home prices would rise 5.2% in 2016 and increase an additional 4.3% in 2017. Housing starts were forecasted to increase slightly in 2016 and continue to trend higher in 2017.
The June 2016 mortgage finance forecast from the Mortgage Bankers Association (the “MBA”) was for 2016 existing home sales to increase by 5.0% and for 2016 new home sales to increase by 16.1%. The MBA forecast showed a 2.0% increase in the median sales price for existing homes in 2016 and a 0.8% decrease in the median sales price for new homes in 2016. Total mortgage production was forecasted to increase to $1.663 trillion in 2016, compared to $1.630 trillion in 2015. The forecasted increase in 2016 originations was based on a 10.4% increase in purchase volume, which was partially offset by a 7.9% decrease in refinancing volume. Purchase mortgage originations were forecasted to total $973 billion in 2016, versus refinancing volume totaling $690 billion. Housing starts for 2016 were projected to increase by 9.8% to total $1.217 billion.
Market Area Demographics
Table 2.1 presents information regarding the demographic and economic trends for the Bank’s market area from 2010 to 2016 and projected through 2021. Data for the nation, the state of Pennsylvania and the Philadelphia MSA are included for comparative purposes. The size and scope of the market area is evidenced by the demographic data, which shows that as of 2016 the total population of the state was 12.8 million, with 47.5% of the state’s population in the Philadelphia MSA. Between 2010 and 2016 the annualized population growth rates of the state and the MSA were 0.1% and 0.3%, respectively, which were less than the comparable national growth rate of 0.7%. Both Montgomery and Philadelphia Counties recorded an annualized population growth rate of 0.5%, while Bucks County no population growth for the same time period. Over the next projected five years, the state, MSA and all of the market area counties are expected to continue to experience similar population growth rates as recorded during the past six years.
| RP® Financial, LC. | MARKET AREA ANALYSIS |
II.6
Table 2.1
Huntingdon Valley Bank
Summary Demographic Data
| Year | Growth Rate | |||||||||||||||||||
| 2010 | 2016 | 2021 | 2010-2016 | 2016-2021 | ||||||||||||||||
| (%) | (%) | |||||||||||||||||||
| Population (000) |
||||||||||||||||||||
| USA |
308,746 | 322,431 | 334,342 | 0.7 | % | 0.7 | % | |||||||||||||
| Pennsylvania |
12,702 | 12,806 | 12,905 | 0.1 | % | 0.2 | % | |||||||||||||
| Philadelphia MSA |
5,965 | 6,077 | 6,177 | 0.3 | % | 0.3 | % | |||||||||||||
| Montgomery County |
800 | 822 | 839 | 0.5 | % | 0.4 | % | |||||||||||||
| Bucks County |
625 | 627 | 630 | 0.0 | % | 0.1 | % | |||||||||||||
| Philadelphia County |
1,526 | 1,569 | 1,600 | 0.5 | % | 0.4 | % | |||||||||||||
| Households (000) |
||||||||||||||||||||
| USA |
116,716 | 122,265 | 127,049 | 0.8 | % | 0.8 | % | |||||||||||||
| Pennsylvania |
5,019 | 5,087 | 5,143 | 0.2 | % | 0.2 | % | |||||||||||||
| Philadelphia MSA |
2,260 | 2,311 | 2,354 | 0.4 | % | 0.4 | % | |||||||||||||
| Montgomery County |
308 | 317 | 324 | 0.5 | % | 0.4 | % | |||||||||||||
| Bucks County |
235 | 238 | 240 | 0.2 | % | 0.2 | % | |||||||||||||
| Philadelphia County |
600 | 620 | 634 | 0.6 | % | 0.5 | % | |||||||||||||
| Median Household Income ($) |
||||||||||||||||||||
| USA |
NA | 55,551 | 59,865 | NA | 1.5 | % | ||||||||||||||
| Pennsylvania |
NA | 55,392 | 60,286 | NA | 1.7 | % | ||||||||||||||
| Philadelphia MSA |
NA | 63,514 | 67,722 | NA | 1.3 | % | ||||||||||||||
| Montgomery County |
NA | 80,501 | 85,948 | NA | 1.3 | % | ||||||||||||||
| Bucks County |
NA | 76,110 | 80,464 | NA | 1.1 | % | ||||||||||||||
| Philadelphia County |
NA | 38,978 | 42,266 | NA | 1.6 | % | ||||||||||||||
| Per Capita Income ($) |
||||||||||||||||||||
| USA |
NA | 30,002 | 32,569 | NA | 1.7 | % | ||||||||||||||
| Pennsylvania |
NA | 30,881 | 33,909 | NA | 1.9 | % | ||||||||||||||
| Philadelphia MSA |
NA | 34,177 | 36,843 | NA | 1.5 | % | ||||||||||||||
| Montgomery County |
NA | 43,231 | 46,235 | NA | 1.4 | % | ||||||||||||||
| Bucks County |
NA | 38,953 | 41,411 | NA | 1.2 | % | ||||||||||||||
| Philadelphia County |
NA | 23,204 | 25,551 | NA | 1.9 | % | ||||||||||||||
| 2016 Age Distribution (%) |
0-14 Yrs. | 15-34 Yrs. | 35-54 Yrs. | 55-69 Yrs. | 70+ Yrs. | |||||||||||||||
| USA |
19.0 | 27.2 | 26.0 | 17.8 | 10.0 | |||||||||||||||
| Pennsylvania |
17.2 | 26.1 | 25.4 | 19.5 | 11.9 | |||||||||||||||
| Philadelphia MSA |
18.3 | 27.1 | 26.2 | 18.2 | 10.2 | |||||||||||||||
| Montgomery County |
17.8 | 24.3 | 26.9 | 19.2 | 11.8 | |||||||||||||||
| Bucks County |
16.8 | 23.5 | 26.9 | 21.2 | 11.6 | |||||||||||||||
| Philadelphia County |
19.0 | 31.7 | 24.8 | 15.7 | 8.9 | |||||||||||||||
| 2016 HH Income Dist. (%) |
|
Less Than 25,000 |
|
|
$25,000 to 50,000 |
|
|
$50,000 to 100,000 |
|
$100,000+ | ||||||||||
| USA |
22.7 | 23.4 | 29.6 | 24.3 | ||||||||||||||||
| Pennsylvania |
22.5 | 23.6 | 30.4 | 23.5 | ||||||||||||||||
| Philadelphia MSA |
20.7 | 20.4 | 28.8 | 30.2 | ||||||||||||||||
| Montgomery County |
14.0 | 16.9 | 29.3 | 39.8 | ||||||||||||||||
| Bucks County |
13.4 | 18.8 | 30.9 | 37.0 | ||||||||||||||||
| Philadelphia County |
35.1 | 25.4 | 24.4 | 15.0 | ||||||||||||||||
Source: SNL Financial, LC.
| RP® Financial, LC. | MARKET AREA ANALYSIS |
II.7
Changes in the number of households in the market area have generally paralleled trends with respect to population. Projected household growth for the next five years for the state, MSA and all of the market area counties are consistent with their historical growth rates over the past six years and, thus, will continue to lag the projected national household growth rate.
Age distribution figures for the market area reveal that the state and Montgomery and Bucks Counties contained somewhat older population bases than the nation as a whole, while Philadelphia County exhibited a younger population base compared to the nation and the state.
Household and per capita income levels are important indicators of a market area’s health and attractiveness in terms of housing and economic activity. The 2016 median household incomes of the Philadelphia MSA, Montgomery and Bucks Counties exceeded the state and national measures. However the median household income of Philadelphia County was notably lower than the state and national measures, reflecting some concentrations of poverty in the city of Philadelphia.
Similarly, per capita income measures generally tracked the household income data, with Montgomery County recording the highest per capita income and Philadelphia County recording the lowest per capita income. Household income distribution measures also indicate that Bucks County and Montgomery County are relatively affluent markets.
Regional Economy
Real Estate Market. According to the National Association of Realtors, which tracks real estate trends in the Bank’s market area, real estate prices have been relatively stable over the most recent year. Single-family home prices in the Greater Philadelphia region averaged $203,900 during the first quarter of 2016, which reflects a slight decrease of 4.6% from the last quarter of 2015. As reported by RealtyTrac, in terms of foreclosure activity, foreclosure filings in Pennsylvania in May 2016 were 12.5% lower than the same time in 2015, with a foreclosure rate of one out of every 1,196 households.
| RP® Financial, LC. | MARKET AREA ANALYSIS |
II.8
Regarding the commercial real estate market, according to Colliers International, the Greater Philadelphia CRE market in 2015 was characterized as an improving market. Overall, the vacancy rate for office space decreased marginally from 12.60% to 11.06% during the last two quarters of 2015. The net absorption rate, construction and rental rate for Greater Philadelphia office space all trended upwards during the second quarter of 2016 compared to a year ago.
Regional Employment
The economy of the Bank’s market area is relatively diverse and has several large components, as shown in the chart below.
Employment data indicates that education, health and social services constitute the most prominent employment sector, comprising approximately 21% of total employment. Trade, transportation, and utilities is the second largest employment sector in the Philadelphia economy, which approximates 19% of total employment, followed by professional and business services (approximating 16% of employment) and government (approximating 11% of total employment). Growth sectors of the local economy have included the life science and healthcare industries, whose expansion has been fostered by the presence of major research universities locally and a highly educated technically proficient workforce.
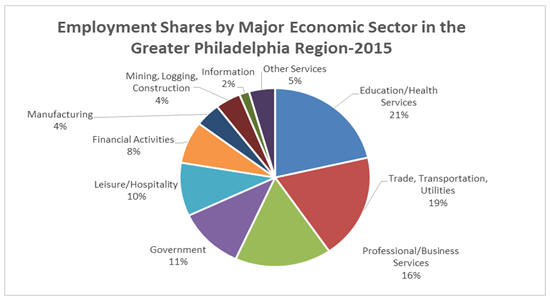
Source: IHS Global Insight
| RP® Financial, LC. | MARKET AREA ANALYSIS |
II.9
The largest employers in the Greater Philadelphia region are provided in Table 2.2 and the market area’s core industries have been described below.
Table 2.2
Huntingdon Valley Bank
Market Area Largest Employers
| Greater Philadelphia |
||||||
| Company | Industry | Employees | ||||
| Jefferson Health System Inc |
Healthcare and Social Assistance |
18,740 | ||||
| University of Pennsylvania |
Educational Services |
16,160 | ||||
| University of Pennsylvania Health System |
Healthcare and Social Assistance |
14,941 | ||||
| Temple University |
State Related Institution of Higher Learning |
14,000 | ||||
| Comcast Corp.* |
Media and Technology |
12,858 | ||||
| Christiana Care Health System |
Hospital and Outpatient |
10,500 | ||||
| UPS |
Air freight express services |
10,261 | ||||
| Main Line Health |
Healthcare |
10,075 | ||||
| Bank of America Corp. |
Finance and Insurance |
10,000 | ||||
| Drexel University |
Research University |
9,829 | ||||
| Vanguard Group |
Investment Products |
9,722 | ||||
| Verizon Communications Inc. |
Information — Telecommunications |
9,054 | ||||
| Einstein Healthcare Network |
Healthcare Services |
8,992 | ||||
| Temple University Health System |
Healthcare Services |
8,975 | ||||
| Wells Fargo (includes former Wachovia Bank) |
Finance and Insurance |
8,870 | ||||
| Southeastern Pennsylvania Transportation Authority (SEPTA) |
Transportation and Warehousing |
8,800 | ||||
| Virtua |
Healthcare Services |
8,400 | ||||
| Wawa, Inc. |
Retail Trade — convenience store |
8,333 | ||||
| Wal-Mart |
Retail Trade — discount department stores |
7,996 | ||||
| Siemens Medical Solutions USA, Inc. |
Manufacturing |
7,546 | ||||
| Reading Health System |
Regional Healthcare System |
7,300 | ||||
| CVS Caremark Corp. |
Retail Trade |
7,097 | ||||
| Crozer-Keystone Health System |
Health System |
6,800 | ||||
| Bayada Home Health Care |
Nursing, rehabilitative, therapeutic, hospice, and assistive care |
6,751 | ||||
| Comcast-Spectator |
Sports and Entertainment |
6,490 | ||||
Source: Select Greater Philadelphia.
Life Science and Healthcare. The Philadelphia metropolitan area is a leading region for the life sciences sector, including in the areas of biotech, pharmaceuticals, medical devices, diagnostics, and healthcare. The region is home to nearly 1,200 life science establishments including global pharmaceutical leaders, medical device and diagnostics, biotech and contract research organizations. Greater Philadelphia has more than 197 hospitals and more than 15 major health systems, four children’s hospitals and six medical schools. In addition, the region is home to major teaching hospitals and is a nationally leading location for clinical trials.
| RP® Financial, LC. | MARKET AREA ANALYSIS |
II.10
Advanced Manufacturing. Many of the world’s advanced products including aerospace equipment, biomedical and optoelectronic materials, chemicals, communications and electric equipment, navigation and control instruments and medical instruments are developed in the Greater Philadelphia region. In fact, defense contractors, which include Boeing, AgustaWestland, W.L. Gore and others, continue to create new innovations that have a positive impact on the region’s entrepreneurial ecosystem.
IT and Communications. With about 6,500 IT-producing businesses in Greater Philadelphia, the region has access to cutting-edge IT capabilities fueled by a high concentration of workers in IT occupations at diverse companies including large IT and communications companies like Comcast and SAP. The Greater Philadelphia region features IT producers that provide specialized hardware and software to customers around the world. Greater Philadelphia has also been an attractive market for young Information & Communications Technology (ICT) companies to attract venture capital.
Higher Education. Home to 101 degree-granting institutions, Greater Philadelphia ranks as one of the nation’s leading centers for higher education. This provides a steady pipeline of highly-educated people who enter the workforce or launch startup companies in the Greater Philadelphia region. Annual operations spending generated by colleges and universities in Greater Philadelphia exceeds $10 billion. In addition, these institutions employ over 90,000 people.
Financial Services. In 2012, the financial services sector represented 7.5% of the region’s total employment, constituting the fourth highest employment concentration among the 15 largest MSAs in 2012. Greater Philadelphia has a multifaceted financial activities sector that includes banking, investment, securities, insurance, leasing and real estate.
Montgomery County Employment
Table 2.3 below presents a listing of the largest private employers in Montgomery County where the Bank is headquartered and holds the largest amount of deposits. The county exhibits a diverse employment base, with a major focus on services. Healthcare companies hold the largest level of employment, followed by finance and insurance, and information technology companies. Additionally, manufacturing companies still account for a notable source of jobs among the county’s largest employers.
| RP® Financial, LC. | MARKET AREA ANALYSIS |
II.11
Table 2.3
Huntingdon Valley Bank
Market Area Largest Employers
| Montgomery County |
||||||
| Company | Industry | Employees | ||||
| Main Line Health Systems |
Healthcare and Social Assistance |
14,000 | ||||
| Abington Health |
Healthcare and Social Assistance |
6,387 | ||||
| Genuardi’s Markets |
Retail Supermarket |
3,520 | ||||
| Lockheed Martin Corporation |
Manufacturing — Aerospace |
3,500 | ||||
| Holy Redeemer Health Systems |
Healthcare and Social Assistance |
3,414 | ||||
| ACTS Retirment-Life Communities |
Healthcare and Social Assistance |
2,500 | ||||
| Aetna Inc. |
Healthcare and Social Assistance |
2,400 | ||||
| Prudential |
Finance and Insurance |
2,332 | ||||
| SunGard |
Information Technology |
2,000 | ||||
| Teva Pharmaceuticals |
Healthcare and Social Assistance |
1,600 | ||||
| Dow Advanced Materials |
Manufacturing |
1,590 | ||||
| Montgomery Cty Comm College |
Educational Services |
1,297 | ||||
| Unisys Corp. |
Information Technology |
1,200 | ||||
| Harleysville Insurance |
Finance and Insurance |
1,100 | ||||
| NextGen Healthcare Info Syst, Inc. |
Healthcare and Social Assistance |
630 | ||||
| CBIZ Inc. & Mayer Hoff McCann |
Professional Services |
445 | ||||
Source: Montgomery County Economic Development Corporation.
Unemployment Data
Table 2.4 below provides recent unemployment data for the Bank’s market area, which provides an additional indication of the economic and demographic health of the primary market area. Comparative unemployment rates for Bucks, Montgomery and Philadelphia Counties, as well as for the U.S., Pennsylvania and the Philadelphia MSA, are shown in Table 2.4. June 2016 unemployment rates for primary market area counties ranged from a low of 4.2% for Montgomery County to a high of 6.9% for Philadelphia County. Comparative unemployment rates for the U.S., Pennsylvania and the Philadelphia MSA were 5.1%, 5.5% and 5.2%, respectively. Consistent with the national trend, all three of the primary market area counties and the Philadelphia MSA reported lower unemployment rates for June 2016 compared to a year ago. The statewide unemployment rate for June 2016 was unchanged from a year ago.
| RP® Financial, LC. | MARKET AREA ANALYSIS |
II.12
Table 2.4
Huntingdon Valley Bank
Unemployment Trends
| Unemployment Rate | ||||||||
| Region |
June 2015 | June 2016 | ||||||
| USA |
5.5 | % | 5.1 | % | ||||
| Pennsylvania |
5.5 | % | 5.5 | % | ||||
| Philadelphia MSA |
5.6 | % | 5.2 | % | ||||
| Montgomery County |
4.3 | % | 4.2 | % | ||||
| Bucks County |
4.7 | % | 4.6 | % | ||||
| Philadelphia County |
7.4 | % | 6.9 | % | ||||
Source: U.S. Bureau of Labor Statistics.
Deposit Trends
Table 2.5 displays bank and thrift deposit market trends from June 30, 2011 through June 30, 2015 for the state of Pennsylvania and the counties where the Bank maintains a branch presence. Total state deposits increased at a 4.4% annual rate from 2011 through 2015. Commercial banks maintained a larger market share of deposits in Pennsylvania and in all three counties served by the Bank’s branches. Commercial banks also gained deposit market share in Pennsylvania and in the counties served by the Bank’s branches, during the four year period covered in Table 2.5. Bank and thrift deposits in Montgomery County, where the Bank maintains its headquarters and largest concentration of deposits, increased at a 2.9% annual rate from June 30, 2011 to June 30, 2015, versus comparable growth rates of 3.0% for Bucks County and 0.1% for Philadelphia County.
As of June 30, 2015, HV Bank maintained deposit market shares of 0.4% in Montgomery County, 0.3% in Bucks County and 0.0% in Philadelphia County. Over the past four years, deposit growth at the Bank’s Montgomery County and Buck County branches exceeded and approximated the respective comparable county deposit growth rates, while deposits maintained at the Bank’s Philadelphia County branch declined slightly over the past four years.
| RP® Financial, LC. | MARKET AREA ANALYSIS |
II.13
Table 2.5
Huntingdon Valley Bank
Deposit Summary
| As of June 30, | ||||||||||||||||||||||||||||
| 2011 | 2015 | Deposit Growth Rate 2011-2015 |
||||||||||||||||||||||||||
| Deposits | Market Share |
No. of Branches |
Deposits | Market Share |
No. of Branches |
|||||||||||||||||||||||
| (Dollars in Thousands) | (%) | |||||||||||||||||||||||||||
| Pennsylvania |
300,267,467 | 100.0 | % | 4,710 | $ | 356,316,269 | 100.0 | % | 4,394 | 4.4 | % | |||||||||||||||||
| Commercial Banks |
231,733,404 | 77.2 | % | 3,466 | 299,917,006 | 84.2 | % | 3,504 | 6.7 | % | ||||||||||||||||||
| Savings Institutions |
68,534,063 | 22.8 | % | 1,244 | 56,399,263 | 15.8 | % | 890 | -4.8 | % | ||||||||||||||||||
| Montgomery County |
$ | 22,816,701 | 100.0 | % | 373 | $ | 25,574,490 | 100.0 | % | 325 | 2.9 | % | ||||||||||||||||
| Commercial Banks |
15,100,037 | 66.2 | % | 247 | 19,319,115 | 75.5 | % | 248 | 6.4 | % | ||||||||||||||||||
| Savings Institutions |
7,716,664 | 33.8 | % | 126 | 6,255,375 | 24.5 | % | 77 | -5.1 | % | ||||||||||||||||||
| Huntingdon Valley Bank |
80,541 | 0.4 | % | 2 | 93,823 | 0.4 | % | 2 | 3.9 | % | ||||||||||||||||||
| Bucks County |
$ | 14,777,438 | 100.0 | % | 261 | $ | 16,621,145 | 100.0 | % | 248 | 3.0 | % | ||||||||||||||||
| Commercial Banks |
10,190,532 | 69.0 | % | 179 | 12,671,230 | 76.2 | % | 178 | 5.6 | % | ||||||||||||||||||
| Savings Institutions |
4,586,906 | 31.0 | % | 82 | 3,949,915 | 23.8 | % | 70 | -3.7 | % | ||||||||||||||||||
| Huntingdon Valley Bank |
43,621 | 0.3 | % | 3 | 48,978 | 0.3 | % | 2 | 2.9 | % | ||||||||||||||||||
| Philadelphia County |
$ | 50,837,485 | 100.0 | % | 328 | $ | 51,007,050 | 100.0 | % | 303 | 0.1 | % | ||||||||||||||||
| Commercial Banks |
35,593,890 | 70.0 | % | 185 | 40,241,239 | 78.9 | % | 200 | 3.1 | % | ||||||||||||||||||
| Savings Institutions |
15,243,595 | 30.0 | % | 143 | 10,765,811 | 21.1 | % | 103 | -8.3 | % | ||||||||||||||||||
| Huntingdon Valley Bank |
3,373 | 0.0 | % | 1 | 2,709 | 0.0 | % | 1 | -5.3 | % | ||||||||||||||||||
Source: FDIC.
Competition
As implied by the Bank’s low market shares of deposits in the counties served by its branches, competition among financial institutions in the Bank’s market area is significant. Among the Bank’s competitors are much larger and more diversified institutions, which have greater resources than maintained by HV Bank. Financial institution competitors in the Bank’s primary market area include other locally based thrifts and banks, as well as regional, super regional and money center banks. From a competitive standpoint, HV Bank has sought to emphasize its community orientation in the markets served by its branches. In Montgomery County, there are a total of 35 banking institutions, with HV Bank holding the 24th largest market share of deposits. In Bucks County, there are a total of 34 banking institutions, with HV Bank holding the 26th largest market share of deposits. In Philadelphia County, there are a total of 35 banking institutions, with HV Bank holding the 34th largest market share of deposits. Table 2.6 lists the Bank’s largest competitors in the market area counties, based on deposit market share as noted parenthetically.
| RP® Financial, LC. | MARKET AREA ANALYSIS |
II.14
Table 2.6
Huntingdon Valley Bank
Market Area Deposit Competitors
| Location |
Name |
Market Share | Rank | |||||||
| Montgomery County |
Wells Fargo Bank, N.A. |
19.66 | % | |||||||
| Citizens Bank of PA |
13.29 | % | ||||||||
| TD Bank, N.A. |
12.36 | % | ||||||||
| PNC Bank, N.A. |
8.84 | % | ||||||||
| Univest Bank and Trust Co. |
6.64 | % | ||||||||
| BB&T Corp. (NC) |
6.14 | % | ||||||||
| Huntingdon Valley Bank |
0.37 | % | 24 out of 35 | |||||||
| Bucks County |
Wells Fargo Bank, N.A. |
19.85 | % | |||||||
| TD Bank, N.A. |
13.09 | % | ||||||||
| Citizens Bank of PA |
8.68 | % | ||||||||
| Penn Community Mutual Holdings |
7.52 | % | ||||||||
| PNC Financial Services Group |
6.86 | % | ||||||||
| Bank of America Corp. (NC) |
6.37 | % | ||||||||
| Huntingdon Valley Bank |
0.29 | % | 26 out of 34 | |||||||
| Philadelphia County |
Wells Fargo Bank, N.A. |
25.35 | % | |||||||
| PNC Bank, N.A. |
16.79 | % | ||||||||
| Bank of America Corp. (NC) |
14.70 | % | ||||||||
| Citizens Bank of PA |
14.67 | % | ||||||||
| Santander Bank, N.A. |
7.74 | % | ||||||||
| TD Bank, N.A. |
6.31 | % | ||||||||
| Huntingdon Valley Bank |
0.01 | % | 34 out of 35 | |||||||
Source: SNL Financial, LC.
| RP® Financial, LC. | PEER GROUP ANALYSIS |
III.1
III. PEER GROUP ANALYSIS
This chapter presents an analysis of HV Bank’s operations versus a group of comparable savings institutions (the “Peer Group”) selected from the universe of all publicly-traded savings institutions in a manner consistent with the regulatory valuation guidelines. The basis of the pro forma market valuation of HV Bank is derived from the pricing ratios of the Peer Group institutions, incorporating valuation adjustments for key differences in relation to the Peer Group. Since no Peer Group can be exactly comparable to HV Bank, key areas examined for differences are: financial condition; profitability, growth and viability of earnings; asset growth; primary market area; dividends; liquidity of the shares; marketing of the issue; management; and effect of government regulations and regulatory reform.
Peer Group Selection
The Peer Group selection process is governed by the general parameters set forth in the regulatory valuation guidelines. Accordingly, the Peer Group is comprised of only those publicly-traded savings institutions whose common stock is either listed on a national exchange (NYSE) or is NASDAQ listed, since their stock trading activity is regularly reported and generally more frequent than non-publicly-traded and closely-held institutions. Institutions that are not listed on a national exchange or NASDAQ are inappropriate, since the trading activity for thinly-traded or closely-held stocks is typically highly irregular in terms of frequency and price and thus may not be a reliable indicator of market value. We have also excluded from the Peer Group those companies under acquisition or subject to rumored acquisition, mutual holding companies and recent conversions, since their pricing ratios are subject to unusual distortion and/or have limited trading history. A recent listing of the universe of all publicly-traded savings institutions is included as Exhibit III-1.
Ideally, the Peer Group, which must have at least 10 members to comply with the regulatory valuation guidelines, should be comprised of locally- or regionally-based institutions with comparable resources, strategies and financial characteristics. There are approximately 80 fully-converted, publicly-traded institutions nationally and, thus, it is typically the case that the Peer Group will be comprised of institutions with relatively comparable characteristics. To the extent that differences exist between the converting institution and the Peer Group, valuation adjustments will be applied to account for the differences. Since HV Bank will be a fully-converted public company upon completion of the offering, we considered only fully-converted public companies to be viable candidates for inclusion in the Peer Group.
| RP® Financial, LC. | PEER GROUP ANALYSIS |
III.2
From the universe of publicly-traded thrifts, we selected ten institutions with characteristics similar to those of HV Bank. In the selection process, we applied two “screens” to the universe of all public companies that were eligible for consideration:
| • | Screen #1 Mid-Atlantic institutions with assets less than $550 million, tangible equity-to-assets ratios of greater than 7.0% and positive core earnings. Six companies met the criteria for Screen #1 and four were included in the Peer Group: Bay Bancorp, Inc. of Maryland, Hamilton Bancorp, Inc. of Maryland, MSB Financial Corp. of New Jersey and Prudential Bancorp, Inc. of Pennsylvania. The two companies which met the selection criteria, but were excluded from the Peer Group were FSB Bancorp, Inc. of New York and WVS Financial Corp. of Pennsylvania. FSB Bancorp, Inc. of New York was excluded due to its recent conversion status (conversion completed in July 2016 and WVS Financial Corp. was excluded due to its significantly different interest-earning asset composition, as its interest-earning asset composition reflected a very high concentration of investment securities and a very low concentration of loans. Exhibit III-2 provides financial and public market pricing characteristics of all publicly-traded Mid-Atlantic thrifts. |
| • | Screen #2 Midwest institutions with assets less than $550 million, tangible equity-to-assets ratios of greater than 7.0% and positive core earnings. Eight companies met the criteria for Screen #2 and six were included in the Peer Group: Equitable Financial Corp. of Nebraska, Jacksonville Bancorp, Inc. of Illinois, Poage Bankshares, Inc. of Kentucky, United Community Bancorp of Indiana, Wayne Savings Bancshares, Inc. of Ohio and Wolverine Bancorp, Inc. of Michigan. Central Federal Corporation met the selection criteria, but was excluded due to its very low trading price (closing stock price of $1.36 per share on August 5, 2016) and WCF Bancorp, Inc. of Iowa was excluded due to its recent conversion status (conversion completed in July 2016). Exhibit III-3 provides financial and public market pricing characteristics of all publicly-traded Midwest thrifts. |
Table 3.1 shows the general characteristics of each of the ten Peer Group companies and Exhibit III-4 provides summary demographic and deposit market share data for the primary market area counties served by each of the Peer Group companies. While there are expectedly some differences between the Peer Group companies and HV Bank, we believe that the Peer Group companies, on average, provide a good basis for valuation subject to valuation adjustments. The following sections present a comparison of HV Bank’s financial condition, income and expense trends, loan composition, interest rate risk and credit risk versus the Peer Group as of the most recent publicly available date. Comparative data for all publicly-traded thrifts, publicly-traded Pennsylvania thrifts and Randolph Bancorp, Inc. of Massachusetts, which is the most recently completed publicly-traded standard conversion offering, have been included in the Chapter III tables as well.
| RP® Financial, LC. | PEER GROUP ANALYSIS |
III.3
Table 3.1
Peer Group of Publicly-Traded Thrifts
As of March 31, 2016
| As of August 5, 2016 |
||||||||||||||||||||||||||||||||
| Ticker |
Financial Institution |
Exchange |
City |
State |
Total |
Offices |
Fiscal |
Conv. Date |
Stock |
Market |
||||||||||||||||||||||
| ($Mil) | ($) | ($Mil) | ||||||||||||||||||||||||||||||
| BYBK |
Bay Bancorp, Inc. | NASDAQ | Columbia | MD | 463 | 15 | Dec | NA | 5.09 | 55.57 | ||||||||||||||||||||||
| EQFN |
Equitable Financial Corp. | NASDAQ | Grand Island | NE | 234 | 6 | Jun | 7/9/2015 | 8.49 | 29.52 | ||||||||||||||||||||||
| HBK |
Hamilton Bancorp, Inc. | NASDAQ | Towson | MD | 393 | 7 | Mar | 10/10/2012 | 13.75 | 46.94 | ||||||||||||||||||||||
| JXSB |
Jacksonville Bancorp, Inc. | NASDAQ | Jacksonville | IL | 302 | 6 | Dec | 7/15/2010 | 28.36 | 50.96 | ||||||||||||||||||||||
| MSBF |
MSB Financial Corp. | NASDAQ | Millington | NJ | 380 | 5 | Dec | 7/17/2015 | 13.14 | 78.22 | ||||||||||||||||||||||
| PBIP |
Prudential Bancorp, Inc. | NASDAQ | Philadelphia | PA | 538 | 6 | Sep | 10/10/2013 | 14.28 | 114.92 | ||||||||||||||||||||||
| PBSK |
Poage Bankshares, Inc. | NASDAQ | Ashland | KY | 436 | 10 | Dec | 9/13/2011 | 18.25 | 69.72 | ||||||||||||||||||||||
| UCBA |
United Community Bancorp | NASDAQ | Lawrenceburg | IN | 518 | 8 | Jun | 1/10/2013 | 15.00 | 63.02 | ||||||||||||||||||||||
| WAYN |
Wayne Savings Bancshares, Inc. | NASDAQ | Wooster | OH | 438 | 12 | Dec | 1/9/2003 | 13.17 | 36.64 | ||||||||||||||||||||||
| WBKC |
Wolverine Bancorp, Inc. | NASDAQ | Midland | MI | 386 | 3 | Dec | 1/20/2011 | 25.95 | 55.80 | ||||||||||||||||||||||
Source: SNL Financial, LC.
| RP® Financial, LC. | PEER GROUP ANALYSIS |
III.4
In addition to the selection criteria used to identify the Peer Group companies, a summary description of the key comparable characteristics of each of the Peer Group companies relative to HV Bank’s characteristics is detailed below.
| • | Bay Bancorp, Inc. of Maryland. Comparable due similar interest-bearing funding composition, relatively high earnings contribution from sources of non-interest operating income and relatively high operating expense ratio as a percent of average assets. |
| • | Equitable Financial Corp. of Nebraska. Comparable due to similar asset size, similar size of branch network, relatively high earnings contribution from sources of non-interest operating income and relatively high operating expense ratio as a percent of average assets. |
| • | Hamilton Bancorp, Inc. of Maryland. Comparable due to similar interest-earning asset composition, similar interest-bearing funding composition and similar net interest income to average assets ratio. |
| • | Jacksonville Bancorp, Inc. of Illinois. Comparable due to similar size of branch network, similar interest-earning asset composition, relatively high earnings contribution from sources of non-interest operating income, relatively high operating expense ratio as a percent of average assets and relatively favorable credit quality measures. |
| • | MSB Financial Corp. of New Jersey. Comparable due to similar size of branch network, similar interest-bearing funding composition, similar net interest income to average assets ratio and similar concentration of 1-4 family permanent mortgage loans as a percent of assets. |
| • | Poage Bankshares, Inc. of Kentucky. Comparable due to relatively high operating expense ratio as a percent of average assets and similar concentration of 1-4 family permanent mortgage loans as a percent of assets. |
| • | Prudential Bancorp, Inc. of Pennsylvania. Comparable due to Philadelphia market area, similar size of branch network, similar interest-bearing funding composition, similar net interest income to average assets ratio and similar concentration of 1-4 family permanent mortgage loans as a percent of assets. |
| • | United Community Bancorp of Indiana. Comparable due to similar return on average assets ratio, similar net interest income to average assets ratio and relatively favorable credit quality measures. |
| • | Wayne Savings Bancshares, Inc. of Ohio. Comparable due to similar interest-earning asset composition, similar interest-bearing funding composition and relatively favorable credit quality measures. |
| • | Wolverine Bancorp, Inc. of Michigan. Comparable due to similar interest-bearing funding composition. |
| RP® Financial, LC. | PEER GROUP ANALYSIS |
III.5
In aggregate, the Peer Group companies maintained a higher level of tangible equity than the industry average (15.16% of assets versus 12.33% for all public companies), generated lower earnings as a percent of average assets (0.49% core ROAA versus 0.71% for all public companies) and earned a lower ROE (3.37% core ROE versus 5.91% for all public companies). Overall, the Peer Group’s average P/TB ratio and average core P/E multiple were below and above the respective averages for all publicly-traded thrifts.
| All Publicly-Traded |
Peer Group | |||||||
| Financial Characteristics (Averages) |
||||||||
| Assets ($Mil) |
$ | 3,334 | $ | 409 | ||||
| Market capitalization ($Mil) |
$ | 475 | $ | 60 | ||||
| Tangible equity/assets (%) |
12.33 | % | 15.16 | % | ||||
| Core return on average assets (%) |
0.71 | 0.49 | ||||||
| Core return on average equity (%) |
5.91 | 3.37 | ||||||
| Pricing Ratios (Averages)(1) |
||||||||
| Core price/earnings (x) |
18.05 | x | 21.83 | x | ||||
| Price/tangible book (%) |
119.47 | % | 94.99 | % | ||||
| Price/assets (%) |
13.82 | 14.32 | ||||||
| (1) | Based on market prices as of August 5, 2016. |
Ideally, the Peer Group companies would be comparable to HV Bank in terms of all of the selection criteria, but the universe of publicly-traded thrifts does not provide for an appropriate number of such companies. However, in general, the companies selected for the Peer Group were fairly comparable to HV Bank, as will be highlighted in the following comparative analysis. Comparative data for all publicly-traded thrifts, publicly-traded Pennsylvania thrifts and Randolph Bancorp, Inc. of Massachusetts, which is most recently completed publicly-traded standard conversion offering, have been included in the Chapter III tables as well.
Financial Condition
Table 3.2 shows comparative balance sheet measures for HV Bank and the Peer Group, reflecting the expected similarities and some differences given the selection procedures outlined above. The Bank’s and the Peer Group’s ratios reflect financial data as of June 30, 2016 and March 31, 2016, respectively. The Bank’s equity ratio of 7.13% of assets was well below the Peer Group’s median equity ratio of 14.84%. All of the Bank’s equity consisted of tangible equity, while the Peer Group’s equity included intangibles equal to 0.46% of assets. The Peer Group’s higher capital position is favorable from a risk perspective and in terms of future earnings potential that could be realized through leverage and lower funding costs. In terms of regulatory capital, the Peer Group’s ratios were also well above the comparable ratios for the Bank. However, the Bank’s pro forma capital position will increase with the addition of stock proceeds, providing the Bank with an equity-to-assets ratio that will be more comparable to the Peer Group’s ratio. The increase in HV Bank’s pro forma capital position will be favorable from a risk perspective and in terms of future earnings potential that could be realized through leverage and lower funding costs. At the same time, the Bank’s higher pro forma capitalization will initially depress return on equity.
| RP® Financial, LC. | PEER GROUP ANALYSIS |
III.6
Table 3.2
Balance Sheet Composition and Growth Rates
Comparable Institution Analysis
As of March 31, 2016
| Balance Sheet as a Percent of Assets | Balance Sheet Annual Growth Rates | Regulatory Capital | ||||||||||||||||||||||||||||||||||||||||||||||||||||||||||||||||||||||||||||||||||
| Cash & Equivalents |
MBS & Invest |
BOLI | Net Loans (1) |
Deposits | Borrowed Funds |
Sub. Debt |
Total Equity |
Goodwill & Intang |
Tangible Equity |
Assets | MBS, Cash & Investments |
Loans (1) | Deposits | Borrows. & Subdebt |
Total Equity |
Tangible Equity |
Tier 1 Leverage |
Tier 1 Risk- Based |
Risk- Based Capital |
|||||||||||||||||||||||||||||||||||||||||||||||||||||||||||||||||
| Huntingdon Valley Bank |
PA | |||||||||||||||||||||||||||||||||||||||||||||||||||||||||||||||||||||||||||||||||||
| June 30, 2016 |
8.48 | % | 22.09 | % | 2.14 | % | 64.90 | % | 77.89 | % | 13.15 | % | 0.00 | % | 7.13 | % | 0.00 | % | 7.13 | % | 8.80 | % | -5.78 | % | 18.62 | % | -0.77 | % | 127.85 | % | 13.22 | % | 13.22 | % | 7.63 | % | 12.04 | % | 12.49 | % | ||||||||||||||||||||||||||||||||||||||||||||
| All Public Companies |
||||||||||||||||||||||||||||||||||||||||||||||||||||||||||||||||||||||||||||||||||||
| Averages |
5.37 | % | 17.53 | % | 1.91 | % | 71.78 | % | 73.50 | % | 11.72 | % | 0.40 | % | 13.10 | % | 0.69 | % | 12.33 | % | 12.53 | % | 8.49 | % | 17.99 | % | 13.13 | % | 20.89 | % | 8.81 | % | 9.02 | % | 12.52 | % | 18.27 | % | 19.41 | % | ||||||||||||||||||||||||||||||||||||||||||||
| Medians |
3.30 | % | 16.15 | % | 1.89 | % | 73.42 | % | 72.80 | % | 11.15 | % | 0.00 | % | 11.94 | % | 0.06 | % | 11.34 | % | 9.39 | % | -0.46 | % | 14.13 | % | 7.45 | % | 5.37 | % | 3.28 | % | 1.67 | % | 11.41 | % | 16.20 | % | 17.09 | % | ||||||||||||||||||||||||||||||||||||||||||||
| State of PA |
||||||||||||||||||||||||||||||||||||||||||||||||||||||||||||||||||||||||||||||||||||
| Averages |
2.54 | % | 32.35 | % | 1.85 | % | 60.21 | % | 66.84 | % | 17.48 | % | 0.30 | % | 14.40 | % | 1.10 | % | 13.31 | % | 9.23 | % | 0.41 | % | 25.05 | % | 8.65 | % | 10.72 | % | 0.27 | % | 16.92 | % | 14.04 | % | 22.47 | % | 23.35 | % | ||||||||||||||||||||||||||||||||||||||||||||
| Medians |
1.64 | % | 24.71 | % | 1.83 | % | 65.97 | % | 71.64 | % | 12.86 | % | 0.00 | % | 12.11 | % | 0.47 | % | 10.59 | % | 8.32 | % | 4.15 | % | 19.65 | % | 6.21 | % | 12.46 | % | 1.66 | % | 1.25 | % | 11.96 | % | 16.84 | % | 17.40 | % | ||||||||||||||||||||||||||||||||||||||||||||
| Comparable Recent Conversions(2) |
||||||||||||||||||||||||||||||||||||||||||||||||||||||||||||||||||||||||||||||||||||
| RNDB |
Randolph Bancorp, Inc. | MA | 3.69 | % | 10.50 | % | 2.21 | % | 77.79 | % | 79.04 | % | 11.67 | % | 0.00 | % | 7.47 | % | 0.09 | % | 7.38 | % | 5.30 | % | -14.76 | % | 12.38 | % | 3.11 | % | 37.42 | % | -1.97 | % | -2.01 | % | 6.83 | % | 10.65 | % | 11.82 | % | ||||||||||||||||||||||||||||||||||||||||||
| Comparable Group |
||||||||||||||||||||||||||||||||||||||||||||||||||||||||||||||||||||||||||||||||||||
| Averages |
6.59 | % | 18.50 | % | 1.83 | % | 69.79 | % | 78.48 | % | 4.81 | % | 0.06 | % | 15.64 | % | 0.48 | % | 15.16 | % | 7.63 | % | 22.53 | % | 10.75 | % | 7.58 | % | 103.97 | % | 14.95 | % | 14.70 | % | 13.33 | % | 20.07 | % | 21.10 | % | ||||||||||||||||||||||||||||||||||||||||||||
| Medians |
3.59 | % | 18.96 | % | 2.09 | % | 70.59 | % | 79.49 | % | 4.72 | % | 0.00 | % | 15.53 | % | 0.46 | % | 14.84 | % | 4.59 | % | 3.53 | % | 10.44 | % | 4.33 | % | 3.59 | % | 1.03 | % | 0.52 | % | 13.58 | % | 19.41 | % | 20.66 | % | ||||||||||||||||||||||||||||||||||||||||||||
| Comparable Group |
||||||||||||||||||||||||||||||||||||||||||||||||||||||||||||||||||||||||||||||||||||
| BYBK |
Bay Bancorp, Inc. | MD | 3.18 | % | 6.14 | % | 1.22 | % | 85.98 | % | 78.95 | % | 5.67 | % | 0.00 | % | 14.44 | % | 0.52 | % | 13.92 | % | -4.84 | % | 30.47 | % | -1.05 | % | -9.50 | % | 116.26 | % | 1.96 | % | 3.00 | % | 13.74 | % | 16.20 | % | 16.68 | % | ||||||||||||||||||||||||||||||||||||||||||
| EQFN |
Equitable Financial Corp. | NE | 13.35 | % | 0.75 | % | 0.00 | % | 81.49 | % | 83.84 | % | 0.00 | % | 0.00 | % | 15.18 | % | 0.00 | % | 15.18 | % | 16.80 | % | 3.51 | % | 15.85 | % | 10.61 | % | 0.00 | % | 71.06 | % | 75.53 | % | 11.32 | % | 13.66 | % | 14.91 | % | ||||||||||||||||||||||||||||||||||||||||||
| HBK |
Hamilton Bancorp, Inc. | MD | 18.18 | % | 18.20 | % | 3.23 | % | 56.10 | % | 79.91 | % | 3.77 | % | 0.00 | % | 15.66 | % | 1.88 | % | 13.78 | % | 35.00 | % | 1.99 | % | 38.47 | % | 41.24 | % | 146.75 | % | 1.23 | % | -7.07 | % | 8.50 | % | 11.84 | % | 12.45 | % | ||||||||||||||||||||||||||||||||||||||||||
| JXSB |
Jacksonville Bancorp, Inc. | IL | 3.37 | % | 27.67 | % | 2.36 | % | 62.50 | % | 80.74 | % | 1.31 | % | 0.00 | % | 15.40 | % | 0.90 | % | 14.50 | % | -1.43 | % | -11.17 | % | 1.69 | % | -0.02 | % | -55.29 | % | 0.73 | % | 1.30 | % | 13.41 | % | 18.58 | % | 19.84 | % | ||||||||||||||||||||||||||||||||||||||||||
| MSBF |
MSB Financial Corp. | NJ | 3.82 | % | 19.72 | % | 1.98 | % | 71.22 | % | 72.83 | % | 5.97 | % | 0.00 | % | 20.14 | % | 0.00 | % | 20.14 | % | 9.41 | % | 6.13 | % | 13.14 | % | 4.17 | % | -38.88 | % | 85.42 | % | 86.14 | % | 14.16 | % | 20.23 | % | 21.48 | % | ||||||||||||||||||||||||||||||||||||||||||
| PBIP |
Prudential Bancorp, Inc. | PA | 1.36 | % | 35.27 | % | 2.40 | % | 59.94 | % | 71.45 | % | 6.89 | % | 0.00 | % | 20.90 | % | 0.00 | % | 20.90 | % | 3.72 | % | 3.56 | % | -1.73 | % | -0.36 | % | 875.30 | % | -12.79 | % | -9.52 | % | 20.76 | % | 42.07 | % | 43.25 | % | ||||||||||||||||||||||||||||||||||||||||||
| PBSK |
Poage Bankshares, Inc. | KY | 3.13 | % | 16.04 | % | 1.60 | % | 74.57 | % | 79.06 | % | 3.45 | % | 0.64 | % | 16.22 | % | 0.58 | % | 15.64 | % | 4.68 | % | 9.36 | % | 8.09 | % | 5.63 | % | -5.68 | % | 4.58 | % | 4.59 | % | 15.51 | % | 23.11 | % | 23.86 | % | ||||||||||||||||||||||||||||||||||||||||||
| UCBA |
United Community Bancorp | IN | 4.49 | % | 37.15 | % | 3.31 | % | 52.02 | % | 83.39 | % | 2.69 | % | 0.00 | % | 13.28 | % | 0.55 | % | 12.73 | % | -0.85 | % | -4.87 | % | 6.14 | % | 0.07 | % | 7.18 | % | -4.24 | % | -4.97 | % | 11.69 | % | 21.65 | % | 22.91 | % | ||||||||||||||||||||||||||||||||||||||||||
| WAYN |
Wayne Savings Bancshares, Inc. | OH | 1.86 | % | 23.26 | % | 2.20 | % | 69.96 | % | 83.54 | % | 6.22 | % | 0.00 | % | 9.30 | % | 0.39 | % | 8.91 | % | 4.50 | % | -9.11 | % | 14.13 | % | 4.48 | % | 15.73 | % | 0.84 | % | -0.25 | % | 8.85 | % | 13.12 | % | 14.07 | % | ||||||||||||||||||||||||||||||||||||||||||
| WBKC |
Wolverine Bancorp, Inc. | MI | 13.13 | % | 0.83 | % | 0.00 | % | 84.15 | % | 71.10 | % | 12.18 | % | 0.00 | % | 15.92 | % | 0.00 | % | 15.92 | % | 9.26 | % | 195.43 | % | 12.78 | % | 19.51 | % | -21.67 | % | 0.69 | % | -1.72 | % | 15.38 | % | 20.24 | % | 21.52 | % | ||||||||||||||||||||||||||||||||||||||||||
| (1) | Includes loans held for sale. |
| (2) | Ratios are based on the date of the most recent financial statements disclosed in the offering prospectus. |
Source: SNL Financial, LC. and RP® Financial, LC. calculations. The information provided in this table has been obtained from sources we believe are reliable, but we cannot guarantee the accuracy or completeness of such information.
Copyright (c) 2016 by RP® Financial, LC.
| RP® Financial, LC. | PEER GROUP ANALYSIS |
III.7
The interest-earning asset compositions for the Bank and the Peer Group were somewhat similar, with loans constituting the bulk of interest-earning assets for both HV Bank and the Peer Group. The Bank’s loans-to-assets ratio of 64.90% was lower than the comparable Peer Group median ratio of 70.59%. Comparatively, the Bank’s cash and investments-to-assets ratio of 30.57% was higher than the comparable Peer Group ratio of 22.55%. Overall, HV Bank’s interest-earning assets amounted to 95.47% of assets, which exceeded the comparable Peer Group ratio of 93.14%. The Peer Group’s non-interest earning assets included bank-owned life insurance (“BOLI”) equal to 2.09% of assets and goodwill/intangibles equal to 0.46% of assets, while the Bank maintained BOLI equal to 2.14% of assets and a zero balance of goodwill/intangibles.
HV Bank’s funding liabilities reflected a funding strategy that was somewhat similar to that of the Peer Group’s funding composition. The Bank’s deposits equaled 77.89% of assets, which was slightly below the Peer Group’s median ratio of 79.49%. Comparatively, the Bank maintained a higher level of borrowings than the Peer Group, as indicated by borrowings-to-assets ratios of 13.15% and 4.72% for HV Bank and the Peer Group, respectively. Total interest-bearing liabilities maintained by the Bank and the Peer Group, as a percent of assets, equaled 91.04% and 84.21%, respectively, with the Peer Group’s lower ratio supported by maintenance of a higher capital position.
A key measure of balance sheet strength for a thrift institution is its interest-earnings assets/interest-bearing liabilities (“IEA/IBL”) ratio. Presently, the Bank’s IEA/IBL ratio is lower than the Peer Group’s ratio, based on IEA/IBL ratios of 104.87% and 110.60%, respectively. The additional capital realized from stock proceeds should serve to provide HV Bank with an IEA/IBL ratio that is more comparable to the Peer Group’s ratio, as the increase in capital provided by the infusion of stock proceeds will serve to lower the level of interest-bearing liabilities funding assets and will be primarily deployed into interest-earning assets.
| RP® Financial, LC. | PEER GROUP ANALYSIS |
III.8
The growth rate section of Table 3.2 shows annual growth rates for key balance sheet items. HV Bank’s and the Peer Group’s growth rates are based on annual growth for the twelve months ended June 30, 2016 and March 31, 2016, respectively. HV Bank recorded an 8.80% increase in assets, versus median asset growth of 4.59% recorded by the Peer Group. Asset growth for the Bank was driven by an 18.62% increase in loans, which was in part funded by a 5.78% decrease in cash and investments. Loans held for sale accounted for approximately 45% of the Bank’s loan growth. Asset growth for the Peer Group was primarily sustained by a 10.44% increase in loans and was supplemented with a 3.53% increase in cash and investments.
HV Bank’s asset growth was funded by a 127.85% increase in borrowings, which also funded a 0.77% reduction in deposits. Comparatively, asset growth for the Peer Group was funded through a 4.33% increase in deposits and a 3.59% increase in borrowings. The Bank posted a tangible capital growth rate of 13.22%, versus a 1.03% tangible capital growth rate posted by the Peer Group. The Bank’s stronger capital growth rate was facilitated by retention of all its earnings on a comparatively lower level of capital than maintained by the Peer Group, while the Peer Group’s lower capital growth reflects retention of earning partially offset by capital management strategies such as dividend payments and stock repurchases. The Bank’s post-conversion capital growth rate will initially be constrained by maintenance of a higher pro forma capital position. Dividend payments and stock repurchases, pursuant to regulatory limitations and guidelines, could also potentially slow the Bank’s capital growth rate in the longer term following the stock offering.
Income and Expense Components
Table 3.3 displays statements of operations for the Bank and the Peer Group. The Bank’s and the Peer Group’s ratios are based on earnings for the twelve months ended June 30, 2016 and March 31, 2016, respectively. HV Bank and the Peer Group reported net income to average assets ratios of 0.62% and 0.43%, respectively. The Bank’s higher return was realized through earnings advantages maintained with respect to loan loss provisions and non-interest operating income, which were partially offset by earnings advantages maintained by the Peer Group with respect to net interest income and operating expenses.
The Peer Group’s higher net interest income to average assets ratio was realized through a higher interest income ratio, which was partially offset by the Bank’s slightly lower interest expense ratio. The Peer Group’s higher interest income ratio was supported by maintaining a higher concentration of interest-earning assets in comparatively higher yielding loans relative to yields earned on cash and investments, which provided the Peer Group with a higher overall yield earned on interest-earning assets (3.79% versus 3.37% for the Bank). Likewise, the Bank’s lower interest expense ratio was supported by a lower cost of funds (0.52% versus 0.69% for the Peer Group). Overall, HV Bank and the Peer Group reported net interest income to average assets ratios of 2.74% and 3.13%, respectively.
| RP® Financial, LC. | PEER GROUP ANALYSIS |
III.9
Table 3.3
Income as Percent of Average Assets and Yields, Costs, Spreads
Comparable Institution Analysis
For the 12 Months Ended March 31, 2016
| Net Interest Income | Non-Interest Income |
Non-Op. Items | Yields, Costs, and Spreads |
|||||||||||||||||||||||||||||||||||||||||||||||||||||||||||||||||||||||
| Net Income |
Income | Expense | NII | Loss Provis. on IEA |
NII After Provis. |
Recurring Gain on Sale of Loans |
Other Non-Int Income |
Total Non-Int Expense |
Net Gains/ Losses (2) |
Extrao. Items |
Provision for Taxes |
Yield On IEA |
Cost Of IBL |
Yld-Cost Spread |
MEMO: Assets/ FTE Emp. |
MEMO: Effective Tax Rate |
||||||||||||||||||||||||||||||||||||||||||||||||||||||||||
| (%) | (%) | (%) | (%) | (%) | (%) | (%) | (%) | (%) | (%) | (%) | (%) | (%) | (%) | (%) | (%) | |||||||||||||||||||||||||||||||||||||||||||||||||||||||||||
| Huntingdon Valley Bank |
PA | |||||||||||||||||||||||||||||||||||||||||||||||||||||||||||||||||||||||||
| June 30, 2016 |
0.62 | % | 3.19 | % | 0.45 | % | 2.74 | % | 0.01 | % | 2.73 | % | 3.01 | % | 0.20 | % | 5.02 | % | 0.01 | % | 0.00 | % | 0.32 | % | 3.37 | % | 0.52 | % | 2.85 | % | $ | 2,800 | 33.85 | % | ||||||||||||||||||||||||||||||||||||||||
| All Public Companies |
||||||||||||||||||||||||||||||||||||||||||||||||||||||||||||||||||||||||||
| Averages |
0.73 | % | 3.54 | % | 0.60 | % | 2.95 | % | 0.05 | % | 2.89 | % | 0.30 | % | 0.55 | % | 2.76 | % | -0.01 | % | 0.00 | % | 0.23 | % | 3.78 | % | 0.79 | % | 3.00 | % | $ | 6,774 | 20.72 | % | ||||||||||||||||||||||||||||||||||||||||
| Medians |
0.69 | % | 3.51 | % | 0.59 | % | 2.90 | % | 0.07 | % | 2.87 | % | 0.04 | % | 0.45 | % | 2.68 | % | 0.00 | % | 0.00 | % | 0.29 | % | 3.78 | % | 0.74 | % | 3.02 | % | $ | 5,775 | 32.83 | % | ||||||||||||||||||||||||||||||||||||||||
| State of PA |
||||||||||||||||||||||||||||||||||||||||||||||||||||||||||||||||||||||||||
| Averages |
0.51 | % | 3.13 | % | 0.60 | % | 2.53 | % | 0.07 | % | 2.47 | % | 0.00 | % | 0.40 | % | 2.18 | % | 0.00 | % | 0.00 | % | 0.18 | % | 3.35 | % | 0.77 | % | 2.58 | % | $ | 7,357 | 26.40 | % | ||||||||||||||||||||||||||||||||||||||||
| Medians |
0.51 | % | 3.27 | % | 0.65 | % | 2.62 | % | 0.07 | % | 2.55 | % | 0.00 | % | 0.35 | % | 2.40 | % | 0.02 | % | 0.00 | % | 0.19 | % | 3.48 | % | 0.83 | % | 2.64 | % | $ | 7,463 | 32.24 | % | ||||||||||||||||||||||||||||||||||||||||
| Comparable Recent Conversions(2) |
||||||||||||||||||||||||||||||||||||||||||||||||||||||||||||||||||||||||||
| RNDB |
Randolph Bancorp, Inc. | MA | 0.10 | % | 3.44 | % | 0.38 | % | 3.06 | % | -0.03 | % | 3.09 | % | 2.78 | % | 0.74 | % | 6.40 | % | -0.06 | % | 0.00 | % | 0.05 | % | 3.66 | % | 0.48 | % | 3.18 | % | $ | 2,112 | 30.44 | % | ||||||||||||||||||||||||||||||||||||||
| Comparable Group |
||||||||||||||||||||||||||||||||||||||||||||||||||||||||||||||||||||||||||
| Averages |
0.48 | % | 3.74 | % | 0.53 | % | 3.21 | % | 0.13 | % | 3.08 | % | 0.11 | % | 0.51 | % | 3.05 | % | 0.01 | % | 0.00 | % | 0.20 | % | 3.95 | % | 0.72 | % | 3.23 | % | $ | 5,085 | 37.88 | % | ||||||||||||||||||||||||||||||||||||||||
| Medians |
0.43 | % | 3.60 | % | 0.49 | % | 3.13 | % | 0.14 | % | 2.96 | % | 0.06 | % | 0.48 | % | 2.72 | % | 0.03 | % | 0.00 | % | 0.16 | % | 3.79 | % | 0.69 | % | 3.06 | % | $ | 4,217 | 30.05 | % | ||||||||||||||||||||||||||||||||||||||||
| Comparable Group |
||||||||||||||||||||||||||||||||||||||||||||||||||||||||||||||||||||||||||
| BYBK |
Bay Bancorp, Inc. | MD | 0.37 | % | 4.68 | % | 0.36 | % | 4.33 | % | 0.24 | % | 4.09 | % | 0.31 | % | 0.70 | % | 4.60 | % | 0.08 | % | 0.00 | % | 0.21 | % | 4.94 | % | 0.54 | % | 4.40 | % | $ | 3,263 | 35.91 | % | ||||||||||||||||||||||||||||||||||||||
| EQFN |
Equitable Financial Corp. | NE | 0.42 | % | 3.74 | % | 0.47 | % | 3.27 | % | 0.14 | % | 3.12 | % | 0.37 | % | 0.75 | % | 3.57 | % | -0.01 | % | 0.00 | % | 0.24 | % | 3.95 | % | 0.68 | % | 3.27 | % | $ | 3,492 | 36.52 | % | ||||||||||||||||||||||||||||||||||||||
| HBK |
Hamilton Bancorp, Inc. | MD | -0.03 | % | 3.33 | % | 0.54 | % | 2.79 | % | 0.13 | % | 2.66 | % | 0.01 | % | 0.24 | % | 2.76 | % | -0.07 | % | 0.00 | % | 0.12 | % | 3.61 | % | 0.74 | % | 2.87 | % | $ | 6,345 | 128.27 | % | ||||||||||||||||||||||||||||||||||||||
| JXSB |
Jacksonville Bancorp, Inc. | IL | 1.01 | % | 3.79 | % | 0.35 | % | 3.44 | % | 0.05 | % | 3.39 | % | 0.05 | % | 1.23 | % | 3.41 | % | 0.10 | % | 0.00 | % | 0.36 | % | 4.04 | % | 0.47 | % | 3.57 | % | $ | 3,283 | 26.12 | % | ||||||||||||||||||||||||||||||||||||||
| MSBF |
MSB Financial Corp. | NJ | 0.10 | % | 3.35 | % | 0.56 | % | 2.79 | % | 0.08 | % | 2.71 | % | 0.00 | % | 0.18 | % | 2.62 | % | -0.14 | % | 0.00 | % | 0.04 | % | 3.61 | % | 0.81 | % | 2.80 | % | $ | 6,443 | 26.48 | % | ||||||||||||||||||||||||||||||||||||||
| PBIP |
Prudential Bancorp, Inc. | PA | 0.20 | % | 3.24 | % | 0.65 | % | 2.59 | % | 0.09 | % | 2.51 | % | 0.00 | % | 0.16 | % | 2.42 | % | 0.05 | % | 0.00 | % | 0.10 | % | 3.36 | % | 0.87 | % | 2.49 | % | $ | 8,660 | 33.68 | % | ||||||||||||||||||||||||||||||||||||||
| PBSK |
Poage Bankshares, Inc. | KY | 0.72 | % | 4.48 | % | 0.52 | % | 3.96 | % | 0.19 | % | 3.78 | % | 0.13 | % | 0.55 | % | 3.60 | % | 0.06 | % | 0.00 | % | 0.19 | % | 4.77 | % | 0.70 | % | 4.07 | % | $ | 3,787 | 21.05 | % | ||||||||||||||||||||||||||||||||||||||
| UCBA |
United Community Bancorp | IN | 0.64 | % | 3.02 | % | 0.43 | % | 2.59 | % | 0.01 | % | 2.58 | % | 0.06 | % | 0.74 | % | 2.68 | % | 0.06 | % | 0.00 | % | 0.12 | % | 3.26 | % | 0.56 | % | 2.70 | % | $ | 4,521 | 15.25 | % | ||||||||||||||||||||||||||||||||||||||
| WAYN |
Wayne Savings Bancshares, Inc. | OH | 0.45 | % | 3.46 | % | 0.46 | % | 3.00 | % | 0.20 | % | 2.79 | % | 0.05 | % | 0.40 | % | 2.67 | % | 0.00 | % | 0.00 | % | 0.13 | % | 3.63 | % | 0.58 | % | 3.05 | % | $ | 3,912 | 21.94 | % | ||||||||||||||||||||||||||||||||||||||
| WBKC |
Wolverine Bancorp, Inc. | MI | 0.92 | % | 4.30 | % | 0.96 | % | 3.34 | % | 0.15 | % | 3.19 | % | 0.16 | % | 0.18 | % | 2.14 | % | 0.00 | % | 0.00 | % | 0.46 | % | 4.34 | % | 1.26 | % | 3.08 | % | $ | 7,145 | 33.62 | % | ||||||||||||||||||||||||||||||||||||||
| (1) | Net gains/losses includes gain/loss on sale of securities and nonrecurring income and expense. |
| (2) | Ratios are based on the date of the most recent financial statements disclosed in the offering prospectus. |
Source: SNL Financial, LC. and RP® Financial, LC. calculations. The information provided in this table has been obtained from sources we believe are reliable, but we cannot guarantee the accuracy or completeness of such information.
Copyright (c) 2016 by RP® Financial, LC.
| RP® Financial, LC. | PEER GROUP ANALYSIS |
III.10
In another key area of core earnings strength, the Bank maintained a significantly higher level of operating expenses than the Peer Group. For the period covered in Table 3.3, the Bank and the Peer Group reported operating expense to average assets ratios of 5.02% and 2.72%, respectively. The Bank’s higher operating expense ratio was consistent with the comparatively higher number of employees maintained relative to its asset size, which is mostly attributable to the significance of the Bank’s mortgage banking operations relative to its asset size. Assets per full time equivalent employee equaled $2.800 million for the Bank, versus $4.217 million for the Peer Group. On a post-offering basis, the Bank’s operating expenses can be expected to increase with the addition of stock benefit plans and certain expenses that result from being a publicly-traded company, with such expenses already impacting the Peer Group’s operating expenses. At the same time, HV Bank’s capacity to leverage operating expenses will be more comparable to the Peer Group’s leverage capacity following the increase in capital realized from the infusion of net stock proceeds.
When viewed together, net interest income and operating expenses provide considerable insight into a thrift’s earnings strength, since those sources of income and expenses are typically the most prominent components of earnings and are generally more predictable than losses and gains realized from the sale of assets or other non-recurring activities. In this regard, as measured by their expense coverage ratios (net interest income divided by operating expenses), the Bank’s earnings were less favorable than the Peer Group’s earnings. Expense coverage ratios for HV Bank and the Peer Group equaled 0.55x and 1.15x, respectively.
The Bank’s mortgage banking operations also provided HV Bank with a significantly higher level of non-interest operating income compared to the Peer Group, with such income amounting to 3.21% and 0.54% of HV Bank’s and the Peer Group’s average assets, respectively. Taking non-interest operating income into account in comparing the Bank’s and the Peer Group’s earnings, HV Bank’s efficiency ratio (operating expenses, as a percent of the sum of non-interest operating income and net interest income) of 84.37% was less favorable than the Peer Group’s efficiency ratio of 74.11%.
| RP® Financial, LC. | PEER GROUP ANALYSIS |
III.11
Loan loss provisions had a larger impact on the Peer Group’s earnings, with loan loss provisions established by the Bank and the Peer Group equaling 0.01% and 0.14% of average assets, respectively.
Net non-operating gains and losses had a slightly more favorable impact on the Peer Group’s earnings, as the Bank and the Peer Group reported net non-operating gains equal to 0.01% and 0.03% of average assets, respectively. Typically, gains and losses generated from the sale of assets and other non-operating activities are viewed as earnings with a relatively high degree of volatility, particularly to the extent that such gains and losses result from the sale of investments or other assets that are not considered to be part of an institution’s core operations. Extraordinary items were not a factor in either the Bank’s or the Peer Group’s earnings.
Taxes had a slightly larger impact on the Bank’s earnings, as the Bank and the Peer Group posted effective tax rates of 33.85% and 30.05%, respectively. As indicated in the prospectus, the Bank’s effective marginal tax rate is equal to 40.0%.
Loan Composition
Table 3.4 presents data related to the Bank’s and the Peer Group’s loan portfolio compositions (including the investment in mortgage-backed securities). The Bank’s loan portfolio composition reflected a higher concentration of 1-4 family permanent mortgage loans and mortgage-backed securities combined, compared to the Peer Group (62.35% of assets versus 42.17% for the Peer Group). The Bank’s higher ratio was primarily the result of maintaining a higher concentration of 1-4 family permanent mortgage loans and, to a lesser extent, maintaining a higher concentration of mortgage-backed securities. Loans serviced for others equaled 3.63% and 1.60% of the Bank’s and the Peer Group’s assets, respectively, thereby indicating that loan servicing income had a fairly similar impact on the Bank’s and the Peer Group’s respective earnings. Loan servicing intangibles constituted a relatively small balance sheet item for the Peer Group, versus a zero balance of loan servicing intangibles for the Bank.
Overall, diversification into higher risk and higher yielding types of lending was more significant for the Peer Group. Commercial real estate loans constituted the most significant type of lending diversification for the Bank and the Peer Group, equaling 6.28% of the Bank’s assets and 19.12% of the Peer Group’s assets. Commercial business loans accounted for the second largest area of lending diversification for the Peer Group amounting to 4.73% of assets, versus 0.31% of assets for the Bank. Based on the Peer Group’s medians, the Peer Group also maintained higher concentrations of construction/land loans and multi-family loans relative to the Bank’s loan portfolio composition. Consumer loans was the second largest area of lending diversification for the Bank, equaling 3.55% of assets and was only area of lending diversification that was more significant for the Bank. In total, construction/land, commercial real estate, multi-family, commercial business and consumer loans comprised 11.99% and 30.56% of the Bank’s and the Peer Group’s assets, respectively. Overall, the Bank’s asset composition provided for a lower risk weighted assets-to-assets ratio of 58.53%, versus a comparable Peer Group ratio of 66.72%.
| RP® Financial, LC. | PEER GROUP ANALYSIS |
III.12
Table 3.4
Loan Portfolio Composition and Related Information
Comparable Institution Analysis
As of March 31, 2016
| Portfolio Composition as a Percent of Assets | ||||||||||||||||||||||||||||||||||||||||||||
| MBS | 1-4 Family(1) |
Constr. & Land |
Multi- Family |
Comm RE |
Commerc. Business |
Consumer | RWA/ Assets |
Serviced For Others |
Servicing Assets |
|||||||||||||||||||||||||||||||||||
| (%) | (%) | (%) | (%) | (%) | (%) | (%) | (%) | ($000) | ($000) | |||||||||||||||||||||||||||||||||||
| Huntingdon Valley Bank |
PA | |||||||||||||||||||||||||||||||||||||||||||
| June 30, 2016 |
9.25 | % | 53.10 | % | 1.75 | % | 0.10 | % | 6.28 | % | 0.31 | % | 3.55 | % | 58.53 | % | $ | 6,603 | $ | 0 | ||||||||||||||||||||||||
| All Public Companies |
||||||||||||||||||||||||||||||||||||||||||||
| Averages |
9.88 | % | 32.94 | % | 3.68 | % | 9.78 | % | 18.55 | % | 6.06 | % | 1.57 | % | 69.31 | % | $ | 1,372,511 | $ | 7,857 | ||||||||||||||||||||||||
| Medians |
7.94 | % | 31.90 | % | 2.67 | % | 3.66 | % | 17.81 | % | 4.62 | % | 0.43 | % | 70.49 | % | $ | 60,324 | $ | 406 | ||||||||||||||||||||||||
| State of PA |
||||||||||||||||||||||||||||||||||||||||||||
| Averages |
18.93 | % | 33.95 | % | 2.55 | % | 3.66 | % | 12.43 | % | 4.05 | % | 4.17 | % | 63.90 | % | $ | 157,663 | $ | 573 | ||||||||||||||||||||||||
| Medians |
17.48 | % | 38.05 | % | 2.55 | % | 2.24 | % | 13.41 | % | 5.29 | % | 3.16 | % | 67.01 | % | $ | 28,051 | $ | 418 | ||||||||||||||||||||||||
| Comparable Recent Conversions(2) |
||||||||||||||||||||||||||||||||||||||||||||
| RNDB |
Randolph Bancorp, Inc. | MA | 7.96 | % | 54.60 | % | 6.87 | % | 0.98 | % | 16.23 | % | 0.47 | % | 0.60 | % | 63.46 | % | $ | 1,065,062 | $ | 9,041 | ||||||||||||||||||||||
| Comparable Group |
||||||||||||||||||||||||||||||||||||||||||||
| Averages |
9.67 | % | 34.47 | % | 3.13 | % | 3.74 | % | 21.81 | % | 6.35 | % | 1.28 | % | 67.67 | % | $ | 34,398 | $ | 268 | ||||||||||||||||||||||||
| Medians |
6.93 | % | 35.24 | % | 3.20 | % | 2.95 | % | 19.12 | % | 4.73 | % | 0.56 | % | 66.72 | % | $ | 6,659 | $ | 203 | ||||||||||||||||||||||||
| Comparable Group |
||||||||||||||||||||||||||||||||||||||||||||
| BYBK |
Bay Bancorp, Inc. | MD | 3.42 | % | 36.15 | % | 3.64 | % | 3.54 | % | 34.20 | % | 8.63 | % | 0.23 | % | 86.94 | % | $ | 0 | $ | 0 | ||||||||||||||||||||||
| EQFN |
Equitable Financial Corp. | NE | 0.39 | % | 22.19 | % | 4.55 | % | 4.16 | % | 33.51 | % | 16.98 | % | 1.32 | % | 80.92 | % | $ | 99,153 | $ | 676 | ||||||||||||||||||||||
| HBK |
Hamilton Bancorp, Inc. | MD | 13.73 | % | 28.65 | % | 3.28 | % | 0.74 | % | 18.10 | % | 4.82 | % | 1.06 | % | 60.35 | % | $ | 0 | $ | 0 | ||||||||||||||||||||||
| JXSB |
Jacksonville Bancorp, Inc. | IL | 6.84 | % | 18.81 | % | 2.67 | % | 2.32 | % | 23.16 | % | 12.15 | % | 4.36 | % | 70.96 | % | $ | 130,172 | $ | 592 | ||||||||||||||||||||||
| MSBF |
MSB Financial Corp. | NJ | 6.85 | % | 49.99 | % | 1.98 | % | 3.25 | % | 13.87 | % | 3.04 | % | 0.10 | % | 66.86 | % | $ | 0 | $ | 0 | ||||||||||||||||||||||
| PBIP |
Prudential Bancorp, Inc. | PA | 21.39 | % | 46.67 | % | 4.37 | % | 0.86 | % | 8.48 | % | 0.00 | % | 0.12 | % | 49.08 | % | $ | 0 | $ | 0 | ||||||||||||||||||||||
| PBSK |
Poage Bankshares, Inc. | KY | 7.00 | % | 45.61 | % | 3.12 | % | 1.02 | % | 14.27 | % | 6.96 | % | 4.16 | % | 65.91 | % | $ | 0 | $ | 339 | ||||||||||||||||||||||
| UCBA |
United Community Bancorp | IN | 20.39 | % | 34.32 | % | 1.16 | % | 3.03 | % | 12.04 | % | 1.63 | % | 0.82 | % | 52.62 | % | $ | 65,974 | $ | 627 | ||||||||||||||||||||||
| WAYN |
Wayne Savings Bancshares, Inc. | OH | 16.64 | % | 41.54 | % | 1.35 | % | 2.87 | % | 20.14 | % | 4.64 | % | 0.30 | % | 66.59 | % | $ | 35,364 | $ | 378 | ||||||||||||||||||||||
| WBKC |
Wolverine Bancorp, Inc. | MI | 0.00 | % | 20.79 | % | 5.13 | % | 15.59 | % | 40.34 | % | 4.60 | % | 0.28 | % | 76.45 | % | $ | 13,318 | $ | 66 | ||||||||||||||||||||||
| (1) | Includes loans held for sale. |
| (2) | Ratios are based on the date of the most recent financial statements disclosed in the offering prospectus. |
Source: SNL Financial LC. and RP® Financial, LC. calculations. The information provided in this table has been obtained from sources we believe are reliable, but we cannot guarantee the accuracy or completeness of such information.
Copyright (c) 2016 by RP® Financial, LC.
| RP® Financial, LC. | PEER GROUP ANALYSIS |
III.13
Interest Rate Risk
Table 3.5 reflects various key ratios highlighting the relative interest rate risk exposure of the Bank versus the Peer Group. In terms of balance sheet composition, HV Bank’s interest rate risk characteristics were overall considered to be less favorable than the Peer Group’s measures. Most notably, the Bank’s tangible equity-to-assets ratio and IEA/IBL ratio were below the comparable Peer Group ratios. Comparatively, the Bank maintained a slight advantage with respect to its lower ratio of non-interest earning assets as a percent of assets. On a pro forma basis, the infusion of stock proceeds should serve to provide the Bank with equity-to-assets and IEA/IBL ratios that are more comparable to the Peer Group’s ratios.
To analyze interest rate risk associated with the net interest margin, we reviewed quarterly changes in net interest income as a percent of average assets for HV Bank and the Peer Group. In general, the comparative fluctuations in the Bank’s and the Peer Group’s ratios implied that the interest rate risk associated with the Bank’s net interest margin was slightly greater, based on the interest rate environment that prevailed during the period covered in Table 3.5. The stability of the Bank’s net interest margin should be enhanced by the infusion of stock proceeds, as interest rate sensitive liabilities will be funding a lower portion of HV Bank’s assets and the proceeds will be substantially deployed into interest-earning assets.
Credit Risk
Overall, based on a comparison of credit risk measures, the Bank’s implied credit risk exposure was viewed to be slightly less relative to the Peer Group’s implied credit risk exposure. As shown in Table 3.6, the Bank’s ratios for non-performing/assets and non-performing loans/loans equaled 0.89% and 1.60%, respectively, versus comparable measures of 2.01% and 2.53% for the Peer Group. It should be noted that the measures for non-performing assets and non-performing loans include accruing loans that are classified as troubled debt restructurings. The Bank’s and Peer Group’s loss reserves as a percent of non-performing loans equaled 32.42% and 52.11%, respectively. Loss reserves maintained as percent of loans receivable equaled 0.52% for the Bank, versus 1.14% for the Peer Group. Net loan charge-offs were a slightly larger factor for the Peer Group, as net loan charge-offs for the Bank and the Peer Group equaled 0.04% and 0.08% of loans, respectively.
| RP® Financial, LC. | PEER GROUP ANALYSIS |
III.14
Table 3.5
Interest Rate Risk Measures and Net Interest Income Volatility
Comparable Institution Analysis
As of March 31, 2016
| Balance Sheet Measures | ||||||||||||||||||||||||||||||||||||||||
| Tangible Equity/ Assets |
Non-IEA Assets/ Assets |
Quarterly Change in Net Interest Income
|
||||||||||||||||||||||||||||||||||||||
| IEA/ IBL |
||||||||||||||||||||||||||||||||||||||||
| 3/31/2016 | 12/31/2015 | 9/30/2015 | 6/30/2015 | 3/31/2015 | 12/31/2014 | |||||||||||||||||||||||||||||||||||
| (%) | (%) | (%) | (change in net interest income is annualized in basis points) | |||||||||||||||||||||||||||||||||||||
| Huntingdon Valley Bank |
PA | |||||||||||||||||||||||||||||||||||||||
| June 30, 2016 |
7.1 | % | 104.9 | % | 4.5 | % | -12 | 11 | 23 | -1 | 1 | -27 | ||||||||||||||||||||||||||||
| All Public Companies |
12.4 | % | 112.0 | % | 4.7 | % | -4 | 1 | 3 | 0 | -7 | 4 | ||||||||||||||||||||||||||||
| State of |
PA | 13.5 | % | 109.0 | % | 3.8 | % | 3 | 1 | 1 | -6 | 4 | -1 | |||||||||||||||||||||||||||
| Comparable Recent Conversions(1) |
||||||||||||||||||||||||||||||||||||||||
| RNDB |
Randolph Bancorp, Inc. | MA | 8.5 | % | 104.5 | % | 6.2 | % | NA | NA | 8 | 5 | -34 | 4 | ||||||||||||||||||||||||||
| Comparable Group |
||||||||||||||||||||||||||||||||||||||||
| Average |
15.2 | % | 114.0 | % | 5.1 | % | -11 | 2 | 10 | 0 | -16 | 13 | ||||||||||||||||||||||||||||
| Median |
14.8 | % | 113.4 | % | 5.1 | % | -10 | 4 | 4 | -2 | -3 | 2 | ||||||||||||||||||||||||||||
| Comparable Group |
||||||||||||||||||||||||||||||||||||||||
| BYBK |
Bay Bancorp, Inc. | MD | 13.9 | % | 112.6 | % | 4.7 | % | -31 | -16 | -13 | 18 | -94 | 79 | ||||||||||||||||||||||||||
| EQFN |
Equitable Financial Corp. | NE | 15.2 | % | 114.0 | % | 4.4 | % | -20 | -26 | 38 | 22 | -27 | -19 | ||||||||||||||||||||||||||
| HBK |
Hamilton Bancorp, Inc. | MD | 13.8 | % | 110.5 | % | 7.5 | % | -29 | 21 | 4 | -3 | 11 | 13 | ||||||||||||||||||||||||||
| JXSB |
Jacksonville Bancorp, Inc. | IL | 14.5 | % | 114.0 | % | 6.5 | % | 7 | 13 | -4 | 0 | 9 | -6 | ||||||||||||||||||||||||||
| MSBF |
MSB Financial Corp. | NJ | 20.1 | % | 120.3 | % | 5.2 | % | 18 | 16 | -16 | -1 | -1 | 3 | ||||||||||||||||||||||||||
| PBIP |
Prudential Bancorp, Inc. | PA | 20.9 | % | 123.3 | % | 3.4 | % | 4 | -4 | 15 | -14 | 8 | -6 | ||||||||||||||||||||||||||
| PBSK |
Poage Bankshares, Inc. | KY | 15.6 | % | 112.7 | % | 6.3 | % | -40 | 36 | 15 | -15 | -41 | 51 | ||||||||||||||||||||||||||
| UCBA |
United Community Bancorp | IN | 12.7 | % | 108.8 | % | 6.3 | % | 1 | 2 | 4 | 5 | -1 | 16 | ||||||||||||||||||||||||||
| WAYN |
Wayne Savings Bancshares, Inc. | OH | 8.9 | % | 105.9 | % | 4.9 | % | 8 | 5 | 4 | -3 | -4 | 0 | ||||||||||||||||||||||||||
| WBKC |
Wolverine Bancorp, Inc. | MI | 15.9 | % | 117.8 | % | 1.9 | % | -31 | -31 | 50 | -7 | -18 | -6 | ||||||||||||||||||||||||||
NA=Change is greater than 100 basis points during the quarter.
(1) Ratios are based on the date of the most recent financial statements disclosed in the offering prospectus.
Source: SNL Financial LC. and RP® Financial, LC. calculations. The information provided in this table has been obtained from sources we believe are reliable, but we cannot guarantee the accuracy or completeness of such information.
Copyright (c) 2016 by RP® Financial, LC.
| RP® Financial, LC. | PEER GROUP ANALYSIS |
III.15
Table 3.6
Credit Risk Measures and Related Information
Comparable Institution Analysis
As of March 31, 2016
| REO/ Assets |
NPAs & 90+Del/ Assets (1) |
Adj NPAs & 90+Del/ Assets (3) |
NPLs/ Loans (1) |
Rsrves/ Loans HFI |
Rsrves/ NPLs (1) |
Rsrves/ NPAs & 90+Del (1) |
Net Loan Chargeoffs (2) |
NLCs/ Loans |
||||||||||||||||||||||||||||||||
| (%) | (%) | (%) | (%) | (%) | (%) | (%) | ($000) | (%) | ||||||||||||||||||||||||||||||||
| Huntingdon Valley Bank | PA | |||||||||||||||||||||||||||||||||||||||
| June 30, 2016 | 0.06 | % | 0.89 | % | 0.69 | % | 1.60 | % | 0.52 | % | 32.42 | % | 30.12 | % | $ | 36 | 0.04 | % | ||||||||||||||||||||||
| All Public Companies | ||||||||||||||||||||||||||||||||||||||||
| Averages | 0.13 | % | 1.23 | % | 0.73 | % | 1.48 | % | 1.07 | % | 105.28 | % | 96.72 | % | $ | 1,784 | 0.05 | % | ||||||||||||||||||||||
| Medians | 0.06 | % | 1.00 | % | 0.66 | % | 1.21 | % | 0.96 | % | 84.50 | % | 77.42 | % | $ | 180 | 0.03 | % | ||||||||||||||||||||||
| State of PA | ||||||||||||||||||||||||||||||||||||||||
| Averages | 0.05 | % | 1.13 | % | 0.96 | % | 1.68 | % | 0.92 | % | 132.50 | % | 120.52 | % | $ | 3,232 | 0.08 | % | ||||||||||||||||||||||
| Medians | 0.05 | % | 0.84 | % | 0.61 | % | 0.95 | % | 0.89 | % | 102.68 | % | 100.64 | % | $ | 802 | 0.05 | % | ||||||||||||||||||||||
| Comparable Recent Conversions(3) | ||||||||||||||||||||||||||||||||||||||||
| RNDB | Randolph Bancorp, Inc. | MA | 0.12 | % | 1.74 | % | 0.73 | % | 2.22 | % | 1.02 | % | 43.16 | % | 40.41 | % | $ | 177 | 0.06 | % | ||||||||||||||||||||
| Comparable Group | ||||||||||||||||||||||||||||||||||||||||
| Averages | 0.11 | % | 2.25 | % | 1.41 | % | 2.94 | % | 1.29 | % | 50.54 | % | 45.91 | % | $ | 127 | 0.05 | % | ||||||||||||||||||||||
| Medians | 0.07 | % | 2.01 | % | 1.33 | % | 2.53 | % | 1.14 | % | 52.11 | % | 43.25 | % | $ | 188 | 0.08 | % | ||||||||||||||||||||||
| Comparable Group | ||||||||||||||||||||||||||||||||||||||||
| BYBK | Bay Bancorp, Inc. | MD | 0.32 | % | 2.10 | % | 1.97 | % | 1.48 | % | 0.49 | % | 32.91 | % | 20.07 | % | $ | 570 | 0.14 | % | ||||||||||||||||||||
| EQFN | Equitable Financial Corp. | NE | 0.10 | % | 2.48 | % | 1.09 | % | 2.88 | % | 1.46 | % | 50.42 | % | 48.48 | % | $ | (87 | ) | -0.05 | % | |||||||||||||||||||
| HBK | Hamilton Bancorp, Inc. | MD | 0.11 | % | 1.93 | % | 1.40 | % | 2.90 | % | 0.77 | % | 26.40 | % | 22.40 | % | $ | 428 | 0.22 | % | ||||||||||||||||||||
| JXSB | Jacksonville Bancorp, Inc. | IL | 0.10 | % | 1.24 | % | 0.70 | % | 1.80 | % | 1.53 | % | 84.92 | % | 78.06 | % | $ | 175 | 0.09 | % | ||||||||||||||||||||
| MSBF | MSB Financial Corp. | NJ | 0.00 | % | 4.38 | % | 1.51 | % | 5.97 | % | 1.34 | % | 22.43 | % | 22.04 | % | $ | 201 | 0.08 | % | ||||||||||||||||||||
| PBIP | Prudential Bancorp, Inc. | PA | 0.00 | % | 3.27 | % | 2.82 | % | 5.40 | % | 0.93 | % | 17.31 | % | 17.31 | % | $ | (15 | ) | 0.00 | % | |||||||||||||||||||
| PBSK | Poage Bankshares, Inc. | KY | 0.38 | % | 1.29 | % | 1.26 | % | 1.21 | % | 0.65 | % | 53.81 | % | 38.02 | % | $ | 676 | 0.21 | % | ||||||||||||||||||||
| UCBA | United Community Bancorp | IN | 0.04 | % | 1.19 | % | 0.74 | % | 2.17 | % | 1.83 | % | 84.24 | % | 81.39 | % | $ | 106 | 0.04 | % | ||||||||||||||||||||
| WAYN | Wayne Savings Bancshares, Inc. | OH | 0.01 | % | 1.09 | % | 0.46 | % | 1.53 | % | 0.90 | % | 58.46 | % | 57.92 | % | $ | 453 | 0.16 | % | ||||||||||||||||||||
| WBKC | Wolverine Bancorp, Inc. | MI | 0.05 | % | 3.54 | % | 2.18 | % | 4.02 | % | 3.01 | % | 74.47 | % | 73.40 | % | $ | (1,238 | ) | -0.40 | % | |||||||||||||||||||
| (1) | Includes TDRs for the Company and the Peer Group. |
| (2) | Net loan chargeoffs are shown on a last twelve month basis. |
| (3) | Ratios are based on the date of the most recent financial statements disclosed in the offering prospectus. |
Source: SNL Financial, LC and RP® Financial, LC. calculations. The information provided in this table has been obtained from sources we believe are reliable, but we cannot guarantee the accuracy or completeness of such information.
Copyright (c) 2016 by RP® Financial, LC.
| RP® Financial, LC. | PEER GROUP ANALYSIS |
III.16
Summary
Based on the above analysis, RP Financial concluded that the Peer Group forms a reasonable basis for determining the pro forma market value of the Bank. Such general characteristics as asset size, capital position, interest-earning asset composition, funding composition, core earnings measures, loan composition, credit quality and exposure to interest rate risk all tend to support the reasonability of the Peer Group from a financial standpoint. Those areas where differences exist will be addressed in the form of valuation adjustments to the extent necessary.
| RP® Financial, LC. | VALUATION ANALYSIS |
IV.1
IV. VALUATION ANALYSIS
Introduction
This chapter presents the valuation analysis and methodology prepared pursuant to the regulatory valuation guidelines, and valuation adjustments and assumptions used to determine the estimated pro forma market value of the common stock to be issued in conjunction with the Bank’s conversion transaction.
Appraisal Guidelines
The federal regulatory appraisal guidelines required by the FRB, the FDIC and state banking agencies specify the pro forma market value methodology for estimating the pro forma market value of a converting thrift. Pursuant to this methodology: (1) a peer group of comparable publicly-traded institutions is selected; (2) a financial and operational comparison of the subject company to the peer group is conducted to discern key differences; and (3) a valuation analysis in which the pro forma market value of the subject company is determined based on the market pricing of the peer group as of the date of valuation, incorporating valuation adjustments for key differences. In addition, the pricing characteristics of recent conversions, both at conversion and in the aftermarket, must be considered.
RP Financial Approach to the Valuation
The valuation analysis herein complies with such regulatory approval guidelines. Accordingly, the valuation incorporates a detailed analysis based on the Peer Group, discussed in Chapter III, which constitutes “fundamental analysis” techniques. Additionally, the valuation incorporates a “technical analysis” of recently completed stock conversions, including closing pricing and aftermarket trading of such offerings. It should be noted that these valuation analyses cannot possibly fully account for all the market forces which impact trading activity and pricing characteristics of a particular stock on a given day.
The pro forma market value determined herein is a preliminary value for the Bank’s to-be-issued stock. Throughout the conversion process, RP Financial will: (1) review changes in HV Bank’s operations and financial condition; (2) monitor HV Bank’s operations and financial condition relative to the Peer Group to identify any fundamental changes; (3) monitor the external factors affecting value including, but not limited to, local and national economic conditions, interest rates, and the stock market environment, including the market for thrift stocks; and (4) monitor
| RP® Financial, LC. | VALUATION ANALYSIS |
IV.2
pending conversion offerings (including those in the offering phase), both regionally and nationally. If material changes should occur during the conversion process, RP Financial will evaluate if updated valuation reports should be prepared reflecting such changes and their related impact on value, if any. RP Financial will also prepare a final valuation update at the closing of the offering to determine if the prepared valuation analysis and resulting range of value continues to be appropriate.
The appraised value determined herein is based on the current market and operating environment for the Bank and for all thrifts. Subsequent changes in the local and national economy, the legislative and regulatory environment, the stock market, interest rates, and other external forces (such as natural disasters or major world events), which may occur from time to time (often with great unpredictability) may materially impact the market value of all thrift stocks, including HV Bank’s value, or HV Bank’s value alone. To the extent a change in factors impacting the Bank’s value can be reasonably anticipated and/or quantified, RP Financial has incorporated the estimated impact into the analysis.
Valuation Analysis
A fundamental analysis discussing similarities and differences relative to the Peer Group was presented in Chapter III. The following sections summarize the key differences between the Bank and the Peer Group and how those differences affect the pro forma valuation. Emphasis is placed on the specific strengths and weaknesses of the Bank relative to the Peer Group in such key areas as financial condition, profitability, growth and viability of earnings, asset growth, primary market area, dividends, liquidity of the shares, market for thrift issues, management, and the effect of government regulations and/or regulatory reform. We have also considered the market for thrift stocks, in particular new issues, to assess the impact on value of the Company coming to market at this time.
| 1. | Financial Condition |
The financial condition of an institution is an important determinant in pro forma market value because investors typically look to such factors as liquidity, capital, asset composition, credit quality and funding sources in assessing investment attractiveness. The similarities and differences in the Bank’s and the Peer Group’s financial strengths are noted as follows:
| • | Overall A/L Composition. In comparison to the Peer Group, the Bank’s interest-earning asset composition showed a higher concentration of cash and investments and a lower concentration of loans. Diversification into higher risk and higher yielding |
| RP® Financial, LC. | VALUATION ANALYSIS |
IV.3
| types of loans was more significant for the Peer Group. Overall, in comparison to the Peer Group, the Bank’s interest-earning asset composition provided for a lower yield earned on interest-earning assets and a lower risk weighted assets-to-assets ratio. HV Bank’s funding composition reflected a similar level of deposits and a higher level of borrowings funding assets relative to the Peer Group’s ratios, which translated into a lower cost of funds for the Bank. Overall, as a percent of assets, the Bank maintained a similar level of interest-earning assets and a higher level of interest-bearing liabilities compared to the Peer Group’s ratios, which resulted in a lower IEA/IBL ratio for the Bank. After factoring in the impact of the net stock proceeds, the Bank’s IEA/IBL ratio should be more comparable to the Peer Group’s ratio. On balance, RP Financial concluded that asset/liability composition was a neutral factor in our adjustment for financial condition. |
| • | Credit Quality. The Bank’s ratios for non-performing assets as a percent of assets and non-performing loans as a percent of loans were lower than the comparable ratios for the Peer Group. In comparison to the Peer Group, loss reserves as a percent of non-performing loans and loans were lower for the Bank. Net loan charge-offs as a percent of loans were similar for the Bank and the Peer Group. The Bank’s risk weighted assets-to-assets ratio was lower than the Peer Group’s ratio. Overall, RP Financial concluded that credit quality was a neutral factor in our adjustment for financial condition. |
| • | Balance Sheet Liquidity. The Bank operated with a higher level of cash and investment securities relative to the Peer Group (30.6% of assets versus 22.6% for the Peer Group). Following the infusion of stock proceeds, the Bank’s cash and investments ratio is expected to increase as the net proceeds realized from the stock offering will be initially deployed into cash and investments. The Bank’s future borrowing capacity was considered to be slightly less than the Peer Group’s borrowing capacity, based on the Bank’s comparatively higher level of borrowings currently funding assets. Overall, RP Financial concluded that balance sheet liquidity was a slightly positive factor in our adjustment for financial condition. |
| • | Funding Liabilities. The Bank’s interest-bearing funding composition reflected a higher similar concentration of deposits and a slightly higher concentration of borrowings relative to the comparable Peer Group ratios, which translated into a lower cost of funds for the Bank. Total interest-bearing liabilities as a percent of assets were higher for the Bank which was attributable to HV Bank’s lower capital position. Following the stock offering, the increase in the Bank’s capital position will reduce the level of interest-bearing liabilities funding the Bank’s assets to a ratio that is more comparable to the Peer Group’s ratio. Overall, RP Financial concluded that funding liabilities were a neutral factor in our adjustment for financial condition. |
| • | Capital. The Bank currently operates with a lower tangible equity-to-assets ratio than the Peer Group. However, following the stock offering, HV Bank’s pro forma capital position will be more comparable to the Peer Group’s equity-to-assets ratio. The increase in the Bank’s pro forma capital position will result in greater leverage potential and reduce the level of interest-bearing liabilities utilized to fund assets. At the same time, the Bank’s more significant capital surplus will likely result in a lower ROE. On balance, RP Financial concluded that capital strength was a neutral factor in our adjustment for financial condition. |
On balance, HV Bank’s pro forma balance sheet strength was considered to be similar to the Peer Group’s balance sheet strength and, thus, no adjustment was applied for the Bank’s financial condition.
| RP® Financial, LC. | VALUATION ANALYSIS |
IV.4
2. Profitability, Growth and Viability of Earnings
Earnings are a key factor in determining pro forma market value, as the level and risk characteristics of an institution’s earnings stream and the prospects and ability to generate future earnings heavily influence the multiple that the investment community will pay for earnings. The major factors considered in the valuation are described below.
| • | Reported Earnings. The Bank’s reported earnings were higher than the Peer Group’s on a ROAA basis (0.62% of average assets versus 0.43% of average assets for the Peer Group), which was attributable to the Bank’s significantly higher level of non-interest operating income and lower level of loan loss provisions. The earnings advantages maintained by the Bank were somewhat offset by the Peer Group’s higher net interest income ratio and lower operating expenses. Notably, the Bank’s earnings advantage with respect to non-interest operating income was attributable to revenues derived from its mortgage banking operations, which tend to be subject to greater volatility relative to revenues derived from net interest income and other sources of non-interest operating income such as customer service charges and fees. Reinvestment of stock proceeds into interest-earning assets will serve to increase the Bank’s earnings, with the benefit of reinvesting proceeds expected to be somewhat offset by higher operating expenses associated with operating as a publicly-traded company and the implementation of stock benefit plans. Overall, the Bank’s reported earnings were considered to be comparable to the Peer Group’s reported earnings and, thus, RP Financial concluded that this was a neutral factor in our adjustment for profitability, growth and viability of earnings. |
| • | Core Earnings. Net interest income, operating expenses, non-interest operating income and loan loss provisions were reviewed in assessing the relative strengths and weaknesses of the Bank’s and the Peer Group’s core earnings. In these measures, the Bank operated with a lower net interest income ratio, a higher operating expense ratio and a higher level of non-interest operating income. The Bank’s lower net interest income ratio and higher operating expense ratio translated into a lower expense coverage ratio in comparison to the Peer Group’s ratio (equal to 0.55x versus 1.15x for the Peer Group). Similarly, the Bank’s efficiency ratio of 84.37% was less favorable than the Peer Group’s efficiency ratio of 74.11%. Loan loss provisions had a slightly larger impact on the Peer Group’s earnings. Overall, these measures, as well as the expected earnings benefits the Bank should realize from the redeployment of stock proceeds into interest-earning assets and leveraging of post-conversion capital, which will be somewhat negated by expenses associated with the stock benefit plans and operating as a publicly-traded company, indicate that the Bank’s pro forma core earnings will remain less favorable than the Peer Group’s core earnings. Therefore, RP Financial concluded that this was a slightly negative factor in our adjustment for profitability, growth and viability of earnings. |
| • | Interest Rate Risk. Quarterly changes in the Bank’s and the Peer Group’s net interest income to average assets ratios indicated a slightly greater degree of volatility was associated with the Bank’s net interest margin. Measures of balance sheet interest rate risk, such as capital and IEA/IBL asset ratios were more favorable for the Peer |
| RP® Financial, LC. | VALUATION ANALYSIS |
IV.5
| Group and were slightly negated by the slightly lower level of non-interest earning assets maintained by the Bank. On a pro forma basis, the infusion of stock proceeds can be expected to provide the Bank with equity-to-assets and IEA/ILB ratios that are comparable to the Peer Group ratios, as well as enhance the stability of the Bank’s net interest margin. Accordingly, on balance, this was a neutral factor in our adjustment for profitability, growth and viability of earnings. |
| • | Credit Risk. Loan loss provisions were a less significant factor in the Bank’s earnings (0.01% of average assets versus 0.14% of average assets for the Peer Group). In terms of future exposure to credit quality related losses, lending diversification into higher risk types of loans was more significant for the Peer Group. The Bank’s credit quality measures generally implied a similar degree of credit risk exposure relative to the comparable credit quality measures indicated for the Peer Group, as the Bank’s lower ratios for non-performing assets and non-performing loans were viewed to be offset by the Peer Group’s higher reserve coverage ratios. Overall, RP Financial concluded that credit risk was a neutral factor in our adjustment for profitability, growth and viability of earnings. |
| • | Earnings Growth Potential. Several factors were considered in assessing earnings growth potential. First, the Peer Group maintained a higher interest rate spread than the Bank, which would tend to continue to provide the Peer Group with a higher net interest income ratio going forward. Second, the infusion of stock proceeds will provide the Bank with similar growth potential through leverage as currently maintained by the Peer Group. Third, the Bank’s higher ratios of non-interest operating income and operating expenses were viewed as respective advantages and disadvantages to sustain earnings growth during periods when net interest margins come under pressure as the result of adverse changes in interest rates. At the same time, given the significant influence of the Bank’s mortgage banking operations on earnings, the Bank’s earnings growth potential is also viewed subject to a greater degree of volatility compared to the volatility associated with the Peer Group’s earnings growth potential. Overall, earnings growth potential was considered to be a slightly negative factor in our adjustment for profitability, growth and viability of earnings. |
| • | Return on Equity. Currently, the Bank’s core ROE is slightly higher than the Peer Group’s core ROE. As the result of the increase in capital that will be realized from the infusion of net stock proceeds into the Bank’s equity, the Bank’s pro forma return equity on a core earnings basis will be comparable to the Peer Group’s core ROE. Accordingly, this was a neutral factor in the adjustment for profitability, growth and viability of earnings. |
On balance, HV Bank’s pro forma core earnings strength was considered to be slightly less favorable than the Peer Group’s and, thus, a slight downward adjustment was applied for profitability, growth and viability of earnings.
3. Asset Growth
Comparative twelve-month asset growth rates for the Bank and the Peer Group showed an 8.80% increase in the Bank’s assets, versus a 4.59% increase in the Peer Group’s assets. Asset growth for the Bank was sustained by an 18.62% increase in loans, which was partially
| RP® Financial, LC. | VALUATION ANALYSIS |
IV.6
funded with cash and investments. Approximately 45% of the Bank’s loan growth was attributable to an increase in the balance loan held for sale, which are subject to fluctuation based on the timing of loan sales. Similarly, the Peer Group’s asset growth was sustained by a 10.44% increase in loans, which was supplemented with a 3.53% increase in cash and investments. Overall, the Bank’s recent asset growth trends would tend to be viewed fairly comparable to the Peer Group’s asset growth trends in terms of supporting future earnings growth. On a pro forma basis, the Bank’s tangible equity-to-assets ratio will be comparable to the Peer Group’s tangible equity-to-assets ratio, providing the Bank with similar leverage capacity as maintained by the Peer Group. On balance, no adjustment was applied for asset growth.
4. Primary Market Area
The general condition of an institution’s market area has an impact on value, as future success is in part dependent upon opportunities for profitable activities in the local market served. The Bank’s primary market area is the Philadelphia metropolitan area, where it maintains four full service branch offices and one limited service branch office in the counties of Montgomery, Bucks and Philadelphia. The Bank maintains its largest presence in Montgomery County, where it maintains its administrative office and two branch offices. Montgomery County is an affluent suburb of Philadelphia, with relatively favorable demographic and economic characteristics. The favorable demographic and economic characteristics of the Bank’s market area has also fostered a highly competitive banking environment, in which the Bank competes against other community banks as well as institutions with a regional or national presence.
The Peer Group companies generally operate in markets with slightly slower population growth rates, less densely populated markets and lower per capita income compared to Montgomery County. The respective average and median deposit market shares maintained by the Peer Group companies were well above the Bank’s market share of deposits in Montgomery County. Overall, the degree of competition faced by the Peer Group companies was viewed to be less compared to the Bank’s competitive environment and the growth potential in the markets served by the Peer Group companies was viewed to be less favorable compared to the growth potential offered by Bank’s primary market area. Summary demographic and deposit market share data for the Bank and the Peer Group companies primary market area counties is provided in Exhibit III-4. As shown in Table 4.1, June 2016 unemployment rates for the markets served by the Peer Group companies were, on average, higher than the comparable unemployment rate for Montgomery County. On balance, we concluded that a slight upward adjustment was appropriate for the Bank’s market area.
| RP® Financial, LC. | VALUATION ANALYSIS |
IV.7
Table 4.1
Market Area Unemployment Rates
HV Bank and the Peer Group Companies(1)
| County | June 2016 Unemployment |
|||||
| HV Bank - PA |
Montgomery | 4.2 | % | |||
| Philadelphia MSA | 5.2 | |||||
| Peer Group Average |
4.9 | |||||
| Peer Group |
||||||
| Bay Bancorp, Inc. – MD |
Howard | 3.5 | ||||
| Equitable Financial Corp. – NE |
Hall | 3.5 | ||||
| Hamilton Bancorp, Inc. – MD |
Baltimore | 4.8 | ||||
| Jacksonville Bancorp, Inc. – IL |
Morgan | 4.7 | ||||
| MSB Financial Corp. – NJ |
Morris | 3.9 | ||||
| Poage Bankshares, Inc. – KY |
Boyd | 8.3 | ||||
| Prudential Bancorp, Inc. – PA |
Philadelphia | 6.9 | ||||
| United Community Bancorp – IN |
Dearborn | 4.8 | ||||
| Wayne Savings Bancshares – OH |
Wayne | 4.0 | ||||
| Wolverine Bancorp, Inc. – MI |
Midland | 4.3 | ||||
| (1) | Unemployment rates are not seasonally adjusted. |
Source: SNL Financial.
5. Dividends
At this time the Company has not established a dividend policy. Future declarations of dividends by the Board of Directors will depend upon a number of factors, including investment opportunities, growth objectives, financial condition, profitability, tax considerations, minimum capital requirements, regulatory limitations, stock market characteristics and general economic conditions.
Six out of the ten Peer Group companies pay regular cash dividends, with implied dividend yields ranging from 0.84% to 3.93%. The average dividend yield on the stocks of the Peer Group institutions equaled 1.23% as of August 5, 2016. Comparatively, as of August 5, 2016, the average dividend yield on the stocks of all fully-converted publicly-traded thrifts equaled 1.72%. The dividend paying thrifts generally maintain higher than average profitability ratios, facilitating their ability to pay cash dividends.
While the Bank has not established a definitive dividend policy prior to converting, the Bank will have the capacity to pay a dividend comparable to the Peer Group’s average dividend yield based on pro forma earnings and capitalization. On balance, we concluded that no adjustment was warranted for this factor.
| RP® Financial, LC. | VALUATION ANALYSIS |
IV.8
6. Liquidity of the Shares
The Peer Group is by definition composed of companies that are traded in the public markets. All ten of the Peer Group members trade on the NASDAQ. Typically, the number of shares outstanding and market capitalization provides an indication of how much liquidity there will be in a particular stock. The market capitalization of the Peer Group companies ranged from $29.6 million to $115.0 million as of August 5, 2016, with average and median market values of $59.7 million and $54.9 million, respectively. The shares issued and outstanding of the Peer Group companies ranged from 10.9 million to 1.8 million, with average and median shares outstanding of 4.7 million and 3.6 million, respectively. The Company’s stock offering is expected to have a pro forma market value and shares outstanding that will be somewhat below the comparable Peer Group averages and medians. Following the stock offering, the Bank’s stock will be traded on NASDAQ. Overall, we anticipate that the Company’s stock will have a less liquid trading market compared to the stocks of the Peer Group companies on average and, therefore, concluded a slight downward adjustment was necessary for this factor.
7. Marketing of the Issue
We believe that three separate markets exist for thrift stocks, including those coming to market such as HV Bank: (1) the after-market for public companies, in which trading activity is regular and investment decisions are made based upon financial condition, earnings, capital, ROE, dividends and future prospects; (2) the new issue market in which converting thrifts are evaluated on the basis of the same factors, but on a pro forma basis without the benefit of prior operations as a fully-converted publicly-held company and stock trading history; and (3) the acquisition market for thrift franchises in Pennsylvania. All three of these markets were considered in the valuation of the Bank’s to-be-issued stock.
A. The Public Market
The value of publicly-traded thrift stocks is easily measurable and is tracked by most investment houses and related organizations. Exhibit IV-1 provides pricing and financial data on all publicly-traded thrifts. In general, thrift stock values react to market stimuli such as interest rates, inflation, perceived industry health, projected rates of economic growth, regulatory
| RP® Financial, LC. | VALUATION ANALYSIS |
IV.9
issues and stock market conditions in general. Exhibit IV-2 displays historical stock market trends for various indices and includes historical stock price index values for thrifts and commercial banks. Exhibit IV-3 displays various stock price indices as of August 5, 2016.
In terms of assessing general stock market conditions, the performance of the overall stock market has been mixed in recent quarters. The Dow Jones Industrial Average (“DJIA”) tumbled more than 1,000 points or 6.2% during the first week of trading in 2016, as fresh concerns about China’s economy and a steep decline in oil prices rattled stock markets worldwide. Investor anxiety over the global economy and further declines in oil prices continued to weigh on stocks through most of January, although stocks rebounded at the end of January with higher oil prices and the Bank of Japan’s surprise decision to shift to negative interest rates contributing to gains in the broader stock market. Overall, the DJIA was down 5.5% for the month of January. Stocks closed lower during the first week of February, as investors reacted to oil falling below $30 a barrel and January employment data showing a slowdown in job growth. The broader stock market traded lower heading into mid-February 2016, as investors reacted to the January employment report which showed a slowdown in job growth. A strong retail sales report for January and a jump in oil prices contributed to stocks rallying in mid-February. The positive trend in the broader stock market continued through the second half of February, with the DJIA closing up 0.3% for the month of February. Signs of an improving U.S. economy helped stocks surge to their highest level in two months, in which the late-February rally was led by financial and technology shares. Strong job gains reflected in the February employment report sustained the positive trend in the boarder stock market, as the DJIA posted its third consecutive weekly gain during the first week of March. Higher oil prices and a rebound in energy shares extended the stock market rally into mid-March, with the DJIA moving into positive territory for the year following its fifth consecutive week of gains. After settling into a narrow trading range in the closing weeks of the first quarter, the DJIA closed up 1.5% for the first quarter of 2016. Noted factors contributing to the stock market gains in the first quarter included a recovery in oil prices, data showing a stable U.S. economy and reassuring comments from the Federal Reserve that it would take a slow path for future interest rate increases.
Stocks traded in a narrow range during the first couple weeks of the second quarter of 2016, as investors turned cautious at the start of the first quarter earnings season that was expected to show a decline in corporate profits. Bank stocks contributed to stock market gains in mid-April with the DJIA closing above 18000 for the first time since July 20, 2015, as first quarter earnings reports posted by some of the large banks came in above lowered expectations. The
| RP® Financial, LC. | VALUATION ANALYSIS |
IV.10
broader stock market traded in a narrow range heading into the last week of April, as investors turned cautious ahead of the late-April meeting of the Federal Reserve. The broader stock market trended lower in late-April 2016, as investors reacted to weak first quarter GDP growth and the Bank of Japan’s decision not to launch additional stimulus measures. Fresh worries about a slowing global economy and lower oil prices extended the downturn in stocks during the first week of May, as U.S. stock indexes fell for a second consecutive week. Volatility prevailed in the broader stock market heading into mid-May. Energy shares led the stock market higher as crude oil prices hit a new high for 2016, while consumer-focused companies led indexes lower following weak earnings reports posted by some of the large retailers. The DJIA traded down for three consecutive sessions at the start of the second half of May, as a handful of upbeat economic data releases and comments from Federal Reserve officials raised the possibility of a June rate increase. Technology and financial stocks led a rebound in stock market in late-May, as strong housing data, rising oil prices and growing investor confidence that higher interest rates would not undermine stock prices combined to lift major U.S. stock indexes. The positive trend in the broader stock market continued through the last full trading week of May, with major U.S. stock indexes matching their biggest weekly gains in months. Comments by Federal Reserve Chairwoman Janet Yellen reiterating that Federal Reserve policymakers were looking at a possible rate increase at its June or July meeting served to trim May stock market gains at the close of the month. During the first two weeks of June, the broader stock market seesawed in a narrow range. Weak job growth reflected in the May employment report pulled stocks lower at the start of June, which was followed by a stock market rebound led by a rally in energy stocks as oil approached $50 a barrel. Volatility prevailed in the broader stock market during the second half of June, with Britain’s late-June vote on whether to exit the European Union (“Brexit”) impacting global stock markets. Stocks traded higher ahead of the Brexit vote and then plunged sharply lower, as the shock from Britain’s vote to leave the European Union swept across global stock markets. Stocks rebounded to close out the month of June, led by the sectors that were hit hardest by the Brexit vote.
The rally in the broader stock market continued at the start of July 2016, with the stronger-than-expected job growth reflected in the June employment report propelling the S&P 500 to a record high close. Stocks continued to trend higher going in the second half of July, as a string of economic data releases that showed improvement in home building, retail sales and job creation helped to propel the DJIA higher for nine consecutive sessions. Following the extended rally, the DJIA closed lower for seven consecutive sessions going into early-August. A decline in
| RP® Financial, LC. | VALUATION ANALYSIS |
IV.11
oil prices amid concerns of a glut in the supply of oil and weaker-than-expected second quarter GDP growth were factors that contributed to the downturn in the broader stock market. A rally in energy and financial shares helped to snap the seven day losing streak in the DJIA ahead of the July employment report. Better-than-expected job growth reflected in the July employment report fueled a rally in the broader stock market to close out the first week of trading in August. On August 5, 2016, the DJIA closed at 18543.53, an increase of 6.7% from one year ago and an increase of 6.4% year-to-date, and the NASDAQ Composite Index closed at 5221.12, an increase of 3.5% from one year ago and an increase of 4.3% year-to-date. The S&P 500 closed at 2182.87 on August 5, 2016, an increase of 5.1% from one year ago and an increase of 6.8% year-to-date.
The market for thrift stocks has also experienced varied trends in recent quarters. Thrift shares participated in the broader stock market sell-off during the first week of 2016, while a weak retail sales report for December and other signs of a slowing U.S. economy furthered the downward trend in thrift prices going into the second half of January. The sell-off in financial shares tended to more significant among institutions with lending exposure to the energy sector and international markets. Thrift stocks rebounded with the broader stock market at the close of January, which was followed by a pullback during first week of February amid disappointing economic reports for January manufacturing activity and January job growth. Disappointing job growth reported in the January employment data pulled thrift shares lower going into mid-February 2016, which was followed by a rebound as investors favored beaten down financial shares following the release of a strong retail sales report for January. A strong durable-goods report for January contributed to further gains in the thrift sector heading into late-February. Financial and technology shares led the broader stock higher at the start of March, as stocks rallied on signs of an improving U.S. economy. The advance in thrift shares continued through the first full week of March, as strong job gains reflected in the February employment data served to further ease recession worries. Thrift stocks continued to edge higher through the end of March, as most sectors traded higher after the Federal Reserve signaled a more gradual pace of interest rate increases.
Financial shares traded lower at the start of the second quarter of 2016, as investors anticipated a decline in first quarter profitability for the banking sector. Better-than-expected first quarter earnings reports posted by some of the money center banks contributed to a mid-April rebound for bank and thrift stocks in general. Thrift stocks advanced ahead of the late-April policy meeting of the Federal Reserve, which was followed by a downturn in thrift shares at the close of April and into the first week of May. The pullback in financial shares was fueled by
| RP® Financial, LC. | VALUATION ANALYSIS |
IV.12
growing expectations that the Federal Reserve was not in a hurry to raise interest rates, based on economic data that showed a slowdown in first quarter GDP growth and a decline in April job growth. Thrift shares seesawed along with the broader stock market heading into mid-May, initially rallying with a rebound in oil prices followed by a pullback as some favorable economic reports spurred increased expectations that the Federal Reserve could move to increase interest rates at its next meeting in June. Financial shares outpaced the broader stock market going into the second half of May, as minutes from the Federal Reserve’s April meeting suggested that a June interest rate increase was a possibility. A surge in April new home sales added to gains in the banking sector heading into late-May. Financial shares led the market lower in early-June and then settled into narrow trading range heading into mid-June, as the weak jobs report for May dimmed expectation that the Federal Reserve would move to lift interest rates this summer. Going into the second half June, thrift shares paralleled trends in the broader stock market. After trending higher ahead of the Brexit vote, financial shares were among the hardest hit sectors on Britain’s surprising vote to exit the European Union. Also, similar to the broader stock market, thrift shares rallied at the close of the second quarter.
The positive trend for thrift stocks continued at the start of July, with the strong jobs report fueling additional gains for the thrift sector. Some stronger-than-expected second quarter earnings reports coming out of the banking sector, along with favorable data on the U.S. economy, helped to sustain the positive trend in thrift shares going into the second half of July. Financial shares traded in a narrow range to closeout July and into early-August, as the Federal Reserve concluded its late-July policy meeting with no change in its target interest rate as expected. Financial shares posted healthy gains on the heels of the favorable jobs report for July, as the S&P 500’s financial sector moved into positive territory for the first time in 2016. On August 5, 2016, the SNL Index for all publicly-traded thrifts closed at 812.1, a decrease of 2.4% from one year ago and a decrease of 1.0% year-to-date.
B. The New Issue Market
In addition to thrift stock market conditions in general, the new issue market for converting thrifts is also an important consideration in determining the Bank’s pro forma market value. The new issue market is separate and distinct from the market for seasoned thrift stocks in that the pricing ratios for converting issues are computed on a pro forma basis, specifically: (1) the numerator and denominator are both impacted by the conversion offering amount, unlike existing stock issues in which price change affects only the numerator; and (2) the pro forma pricing ratio incorporates assumptions regarding source and use of proceeds, effective tax rates,
| RP® Financial, LC. | VALUATION ANALYSIS |
IV.13
stock plan purchases, etc. which impact pro forma financials, whereas pricing for existing issues are based on reported financials. The distinction between pricing of converting and existing issues is perhaps no clearer than in the case of the price/book (“P/B”) ratio in that the P/B ratio of a converting thrift will typically result in a discount to book value whereas in the current market for existing thrifts the P/B ratio may reflect a premium to book value. Therefore, it is appropriate to also consider the market for new issues, both at the time of the conversion and in the aftermarket.
As shown in Table 4.2, two standard conversions, two second-step conversions and one first-step MHC offering have been completed during the past three months. For purposes of our analysis, the standard conversion offerings are considered to be more relevant for HV Bank’s pro forma pricing. The average closing pro forma price/tangible book ratio of the two recent standard conversion offerings equaled 68.7%. On average, the two standard conversion offerings reflected price appreciation of 15.9% after the first week of trading. As of August 5, 2016, the two recent standard conversion offerings reflected an 18.5% increase in their stock price on average.
Shown in Table 4.3 are the current pricing ratios for the three fully-converted offerings completed during the past three months that trade on NASDAQ, two of which were second-step offerings. The current average and median P/TB ratios of the fully-converted recent conversions equaled 82.65% and 78.73%, respectively, based on closing stock prices as of August 5, 2016.
C. The Acquisition Market
Also considered in the valuation was the potential impact on the Bank’s pro forma market value of acquisition activity for thrift institutions operating in Pennsylvania. As shown in Exhibit IV-4, there were eleven acquisitions of thrifts headquartered in Pennsylvania completed from the beginning of 2013 through August 5, 2016 and there are currently two acquisitions pending for thrifts based in Pennsylvania. The recent acquisition activity involving Pennsylvania savings institutions may imply a certain degree of acquisition speculation for the Bank’s stock. To the extent that acquisition speculation may impact the Bank’s offering, we have largely taken this into account in selecting companies for the Peer Group which operate in markets that have experienced a comparable level of acquisition activity as the Bank’s market and, thus, are subject to the same type of acquisition speculation that may influence HV Bank’s stock. However, since converting thrifts are subject to a three-year regulatory moratorium from being acquired, acquisition speculation in HV Bank’s stock would tend to be less compared to the stocks of the Peer Group companies.
* * * * * * * * * * *
| RP® Financial, LC. | VALUATION ANALYSIS |
IV.14
Table 4.2
Pricing Characteristics and After-Market Trends
Conversions Completed the Last Three Months
| Institutional Information | Pre-Conversion Data | Offering Information | Contribution to Char. Found. |
Insider Purchases | Pro Forma Data | Post-IPO Pricing Trends | ||||||||||||||||||||||||||||||||||||||||||||||||||||||||||||||||||||||||||||||||||||||||||||||||||||||||||||||||||||||
| Financial Info. | Asset Quality | Form | % of Public Off. Inc. Fdn. (%) |
% Off Incl. Fdn.+Merger Shares | Pricing Ratios(2)(5) | Financial Charac. |
Closing Price: | |||||||||||||||||||||||||||||||||||||||||||||||||||||||||||||||||||||||||||||||||||||||||||||||||||||||||||||||||||||
| Assets ($Mil) |
Equity/ Assets (%) |
NPAs/ Assets (%) |
Res. Cov. (%) |
Excluding Foundation | Benefit Plans | Mgmt & Dirs. |
Initial Div. Yield (%) |
First Trainging Day ($) |
% Chge (%) |
After First Week(3) ($) |
% Chge (%) |
After First Week(3) (%) |
% Chge (%) |
Thru 8/5/2016 ($) |
% Chge (%) |
|||||||||||||||||||||||||||||||||||||||||||||||||||||||||||||||||||||||||||||||||||||||||||||||||||||||||||||
| Institution |
Conversion Date |
Ticker |
Gross Proc. ($Mil) |
% Offer (%) |
% of Mid. (%) |
Exp./ Proc. (%) |
ESOP (%) |
Recog. Plans (%) |
Stk Option (%) |
P/TB (%) |
Core P/E (x) |
P/A (%) |
Core ROA (%) |
TE/A (%) |
Core ROE (%) |
IPO Price ($) |
||||||||||||||||||||||||||||||||||||||||||||||||||||||||||||||||||||||||||||||||||||||||||||||||||||||||||||
| Standard Conversions | ||||||||||||||||||||||||||||||||||||||||||||||||||||||||||||||||||||||||||||||||||||||||||||||||||||||||||||||||||||||||||||
| Randolph Bancorp, Inc – MA* Best Hometown Bancorp, Inc. – IL |
7/1/16 RNDB-NASDAQ 6/30/16 BTHT-OTC Pink |
$ $ |
432 100 |
|
|
7.71 6.81 |
% % |
|
0.53 0.90 |
% % |
|
159 447 |
% % |
$ $ |
56.9 8.3 |
|
|
97 100 |
% % |
|
132 127 |
% % |
|
3.2 14.9 |
% % |
|
C/S N.A. |
|
|
$455K/3.10% N.A. |
|
|
8.0% 8.0% |
|
|
4.0% 4.0% |
|
|
10.0% 10.0% |
|
|
5.0% 7.8% |
|
|
0.00% 0.00% |
|
|
72.4% 65.0% |
|
|
143.2x NM |
|
|
12.2% 7.8% |
|
|
0.1% -0.6% |
|
|
16.9% 12.0% |
|
|
0.5% -5.0% |
|
|
$10.00 $10.00 |
|
|
$12.18 $11.00 |
|
|
21.8% 10.0% |
|
|
$12.27 $10.90 |
|
|
22.7% 9.0% |
|
|
$12.76 $10.80 |
|
|
27.6% 8.0% |
|
|
$12.79 $10.90 |
|
|
27.9% 9.0% |
| |||||||||||||||||||||||||||||||||
| Averages - Standard Conversions: |
$ | 266 | 7.26 | % | 0.72 | % | 303 | % | $ | 32.6 | 98 | % | 130 | % | 9.0 | % | N.A. | N.A. | 8.0% | 4.0% | 10.0% | 6.4% | 0.00% | 68.7% | 143.2x | 10.0% | -0.3% | 14.4% | -2.2% | $10.00 | $11.59 | 15.9% | $11.59 | 15.9% | $11.78 | 17.8% | $11.84 | 18.5% | ||||||||||||||||||||||||||||||||||||||||||||||||||||||||||||||||||||||||||||||||||||||
| Medians - Standard Conversions: |
$ | 266 | 7.26 | % | 0.72 | % | 303 | % | $ | 32.6 | 98 | % | 130 | % | 9.0 | % | N.A. | N.A. | 8.0% | 4.0% | 10.0% | 6.4% | 0.00% | 68.7% | 143.2x | 10.0% | -0.3% | 14.4% | -2.2% | $10.00 | $11.59 | 15.9% | $11.59 | 15.9% | $11.78 | 17.8% | $11.84 | 18.5% | ||||||||||||||||||||||||||||||||||||||||||||||||||||||||||||||||||||||||||||||||||||||
| Second Step Conversions |
||||||||||||||||||||||||||||||||||||||||||||||||||||||||||||||||||||||||||||||||||||||||||||||||||||||||||||||||||||||||||||
| WCF Bancorp,Inc. – IA Fairport Savings Bank – MA* |
7/14/16 WCFB-NASDAQ 7/14/16 FSBC-NASDAQ |
$ $ |
114 258 |
|
|
13.18 8.56 |
% % |
|
0.80 0.05 |
% % |
|
56 626 |
% % |
$ $ |
17.1 10.3 |
|
|
83 53 |
% % |
|
132 115 |
% % |
|
7.3 11.0 |
% % |
|
N.A. N.A. |
|
|
N.A. N.A. |
|
|
8.0% 0.0% |
|
|
4.0% 0.0% |
|
|
10.0% 0.0% |
|
|
0.4% 2.9% |
|
|
0.00% 0.00% |
|
|
71.3% 63.7% |
|
|
54.9x 62.8x |
|
|
16.1% 7.3% |
|
|
0.3% 0.1% |
|
|
22.5% 11.5% |
|
|
0.8% 1.0% |
|
|
$8.00 $10.00 |
|
|
$8.79 $12.23 |
|
|
9.9% 22.3% |
|
|
$8.62 $12.76 |
|
|
7.7% 27.6% |
|
|
$8.59 $12.40 |
|
|
7.4% 24.0% |
|
|
$8.60 $12.40 |
|
|
7.5% 24.0% |
| |||||||||||||||||||||||||||||||||
| Averages - Second Step Conversions: |
$ | 186 | 10.87 | % | 0.43 | % | 341 | % | $ | 13.7 | 68 | % | 123 | % | 9.2 | % | N.A. | N.A. | 4.0% | 2.0% | 5.0% | 1.7% | 0.00% | 67.5% | 58.8x | 11.7% | 0.2% | 17.0% | 0.9% | $9.00 | $10.51 | 16.1% | $10.69 | 17.7% | $10.50 | 15.7% | $10.50 | 15.8% | ||||||||||||||||||||||||||||||||||||||||||||||||||||||||||||||||||||||||||||||||||||||
| Medians - Second Step Conversions: |
$ | 186 | 10.87 | % | 0.43 | % | 341 | % | $ | 13.7 | 68 | % | 123 | % | 9.2 | % | N.A. | N.A. | 4.0% | 2.0% | 5.0% | 1.7% | 0.00% | 67.5% | 58.8x | 11.7% | 0.2% | 17.0% | 0.9% | $9.00 | $10.51 | 16.1% | $10.69 | 17.7% | $10.50 | 15.7% | $10.50 | 15.8% | ||||||||||||||||||||||||||||||||||||||||||||||||||||||||||||||||||||||||||||||||||||||
| Mutual Holding Companies |
||||||||||||||||||||||||||||||||||||||||||||||||||||||||||||||||||||||||||||||||||||||||||||||||||||||||||||||||||||||||||||
| HarborOne Mutual Bancshares – MA* |
6/30/16 HONE-NASDAQ | $ | 2,245 | 8.54 | % | 1.32 | % | 50 | % | $ | 144.5 | 45 | % | 132 | % | 2.7 | % | C/S | $964K/2.67% | 8.0% | 4.0% | 10.0% | 2.3% | 0.00% | 106.4% | 76.9x | 13.6% | 0.2% | 12.7% | 1.4% | $10.00 | $10.00 | 0.0% | $12.69 | 26.9% | $13.40 | 34.0% | $14.07 | 40.7% | |||||||||||||||||||||||||||||||||||||||||||||||||||||||||||||||||||||||||||||||||||||
| Averages - MHC Conversions: |
$ | 2,245 | 8.54 | % | 1.32 | % | 50 | % | $ | 144.5 | 45 | % | 132 | % | 2.7 | % | N.A. | N.A. | 8.0% | 4.0% | 10.0% | 2.3% | 0.00% | 106.4% | 76.9x | 13.6% | 0.2% | 12.7% | 1.4% | $10.00 | $10.00 | 0.0% | $12.69 | 26.9% | $13.40 | 34.0% | $14.07 | 40.7% | ||||||||||||||||||||||||||||||||||||||||||||||||||||||||||||||||||||||||||||||||||||||
| Medians - MHC Conversions: |
$ | 2,245 | 8.54 | % | 1.32 | % | 50 | % | $ | 144.5 | 45 | % | 132 | % | 2.7 | % | N.A. | N.A. | 8.0% | 4.0% | 10.0% | 2.3% | 0.00% | 106.4% | 76.9x | 13.6% | 0.2% | 12.7% | 1.4% | $10.00 | $10.00 | 0.0% | $12.69 | 26.9% | $13.40 | 34.0% | $14.07 | 40.7% | ||||||||||||||||||||||||||||||||||||||||||||||||||||||||||||||||||||||||||||||||||||||
| Averages - All Conversions: |
$ | 630 | 8.96 | % | 0.72 | % | 268 | % | $ | 47.4 | 76 | % | 128 | % | 7.8 | % | N.A. | N.A. | 6.4% | 3.2% | 8.0% | 3.7% | 0.00% | 75.8% | 96.2x | 11.4% | 0.0% | 15.1% | -0.3% | $9.60 | $10.84 | 12.8% | $11.45 | 18.8% | $11.59 | 20.2% | $11.75 | 21.8% | ||||||||||||||||||||||||||||||||||||||||||||||||||||||||||||||||||||||||||||||||||||||
| Medians - All Conversions: |
$ | 266 | 8.54 | % | 0.72 | % | 303 | % | $ | 32.6 | 68 | % | 130 | % | 9.0 | % | N.A. | N.A. | 8.0% | 4.0% | 10.0% | 2.3% | 0.00% | 68.7% | 76.9x | 11.7% | 0.2% | 14.4% | 0.9% | $10.00 | $10.51 | 15.9% | $11.59 | 17.7% | $11.78 | 17.8% | $11.84 | 18.5% | ||||||||||||||||||||||||||||||||||||||||||||||||||||||||||||||||||||||||||||||||||||||
| Note: *- Appraisal performed by RP Financial; BOLD = RP Fin. Did the business plan, "NT" - Not Traded; "NA" - Not Applicable, Not Available; C/S-Cash/Stock. | ||
| (1) As a percent of MHC offering for MHC transactions. (2) Does not take into account the adoption of SOP 93-6. (3) Latest price if offering is less than one week old. (4) Latest price if offering is more than one week but less than one month old. |
(5) Mutual holding company pro forma data on full conversion basis. (6) Simultaneously completed acquisition of another financial institution. (7) Simultaneously converted to a commercial bank charter. (8) Former credit union. | |
| RP® Financial, LC. | VALUATION ANALYSIS |
IV.15
Table 4.3
Public Market Pricing Versus Peer Group
As of August 5, 2016
| Market Capitalization |
Per Share Data |
Pricing Ratios(2) |
Dividends(3) |
Financial Characteristics(5) | ||||||||||||||||||||||||||||||||||||||||||||||||||||||||||||||||||||||||||||||||
| Core 12 Month EPS(1) |
Book Value/ Share |
Amount/ Share |
Yield | Payout Ratio(4) |
Total Assets |
Equity/ Assets |
Tang. Eq./ T. Assets |
NPAs/ Assets |
Reported | Core | ||||||||||||||||||||||||||||||||||||||||||||||||||||||||||||||||||||||||||
| Price/ Share |
Market Value |
P/E | P/B | P/A | P/TB | P/Core | ROAA | ROAE | ROAA | ROAE | ||||||||||||||||||||||||||||||||||||||||||||||||||||||||||||||||||||||||||
| ($) | ($Mil) | ($) | ($) | (x) | (%) | (%) | (%) | (x) | ($) | (%) | (%) | ($Mil) | (%) | (%) | (%) | (%) | (%) | (%) | (%) | |||||||||||||||||||||||||||||||||||||||||||||||||||||||||||||||||
| All Non-MHC Public Companies(6) |
||||||||||||||||||||||||||||||||||||||||||||||||||||||||||||||||||||||||||||||||||||
| Averages |
$ | 17.67 | $ | 474.57 | $ | 1.01 | $ | 15.52 | 18.26x | 110.61 | % | 13.82 | % | 119.47 | % | 18.05x | $ | 0.30 | 1.72 | % | 47.88 | % | $ | 3,334 | 12.83 | % | 12.16 | % | 1.27 | % | 0.69 | % | 5.91 | % | 0.71 | % | 5.91 | % | ||||||||||||||||||||||||||||||||||||||||||||||
| Median |
$ | 14.69 | $ | 113.94 | $ | 0.73 | $ | 13.84 | 17.48x | 106.86 | % | 13.27 | % | 115.16 | % | 17.95x | $ | 0.24 | 1.64 | % | 35.25 | % | $ | 932 | 11.89 | % | 11.39 | % | 1.06 | % | 0.62 | % | 5.35 | % | 0.72 | % | 5.51 | % | ||||||||||||||||||||||||||||||||||||||||||||||
| Comparable Group |
||||||||||||||||||||||||||||||||||||||||||||||||||||||||||||||||||||||||||||||||||||
| Averages |
$ | 11.26 | $ | 40.39 | $ | 0.13 | $ | 13.81 | NA | 81.25 | % | 13.97 | % | 82.65 | % | NA | $ | 0.07 | 0.78 | % | 108.13 | % | $ | 292 | 17.01 | % | 16.96 | % | 0.71 | % | 0.16 | % | 1.44 | % | 0.20 | % | 1.66 | % | ||||||||||||||||||||||||||||||||||||||||||||||
| Medians |
$ | 12.40 | $ | 24.08 | $ | 0.15 | $ | 13.91 | NA | 78.73 | % | 15.61 | % | 78.73 | % | NA | $ | 0.00 | 0.00 | % | 108.13 | % | $ | 266 | 16.99 | % | 16.89 | % | 0.71 | % | 0.20 | % | 1.57 | % | 0.17 | % | 1.99 | % | ||||||||||||||||||||||||||||||||||||||||||||||
| Comparable Group |
||||||||||||||||||||||||||||||||||||||||||||||||||||||||||||||||||||||||||||||||||||
| FSBC |
FSB Bancorp, Inc. | NY | $ | 12.40 | $ | 24.08 | $ | 0.16 | $ | 15.75 | NM | 78.73 | % | 9.02 | % | 78.73 | % | NM | $ | 0.00 | 0.00 | % | NM | $ | 266 | 11.46 | % | 11.46 | % | 0.05 | % | 0.20 | % | 2.28 | % | 0.17 | % | 1.99 | % | |||||||||||||||||||||||||||||||||||||||||||||
| RNDB |
Randolph Bancorp, Inc. | MA | $ | 12.79 | $ | 75.06 | $ | 0.07 | $ | 13.91 | NM | 91.91 | % | 15.61 | % | 92.52 | % | NM | $ | 0.00 | 0.00 | % | NM | $ | 481 | 16.99 | % | 16.89 | % | 1.36 | % | 0.08 | % | 0.46 | % | 0.09 | % | 0.50 | % | |||||||||||||||||||||||||||||||||||||||||||||
| WCFB |
WCF Bancorp, Inc. | IA | $ | 8.60 | $ | 22.04 | $ | 0.15 | $ | 11.76 | NM | 73.11 | % | 17.27 | % | 76.69 | % | NM | $ | 0.20 | 2.34 | % | 108.13 | % | $ | 128 | 22.58 | % | 22.52 | % | NA | 0.21 | % | 1.57 | % | 0.33 | % | 2.50 | % | |||||||||||||||||||||||||||||||||||||||||||||
| (1) | Core income, on a diluted per-share basis. Core income is net income after taxes and before extraordinary items, less net income attributable to noncontrolling interest, gain on the sale of securities, amortization of intangibles, goodwill and nonrecurring items. Assumed tax rate is 35%. |
| (2) | P/E = Price to earnings; P/B = Price to book; P/A = Price to assets; P/TB = Price to tangible book value; and P/Core = Price to core earnings. P/E and P/Core =NM if the ratio is negative or above 35x. |
| (3) | Indicated 12 month dividend, based on last quarterly dividend declared. |
| (4) | Indicated 12 month dividend as a percent of trailing 12 month earnings. |
| (5) | ROAA (return on average assets) and ROAE (return on average equity) are indicated ratios based on trailing 12 month earnings and average equity and assets balances. |
| (6) | Excludes from averages and medians those companies the subject of actual or rumored acquisition activities or unusual operating characteristics. |
Source: SNL Financial, LC. and RP Financial, LC. calculations. The information provided in this report has been obtained from sources we believe are reliable, but we cannot guarantee the accuracy or completeness of such information.
Copyright (c) 2016 by RP® Financial, LC.
| RP® Financial, LC. | VALUATION ANALYSIS |
IV.16
In determining our valuation adjustment for marketing of the issue, we considered trends in both the overall thrift market, the new issue market including the new issue market for thrift conversions and the local acquisition market for thrift stocks. Taking these factors and trends into account, RP Financial concluded that no adjustment was appropriate in the valuation analysis for purposes of marketing of the issue.
8. Management
The Bank’s management team appears to have experience and expertise in all of the key areas of the Bank’s operations. Exhibit IV-5 provides summary resumes of the Bank’s Board of Directors and senior management. While the Company does not have the resources to develop a great deal of management depth, given its asset size and the impact it would have on operating expenses, management and the Board have been effective in implementing an operating strategy that can be well managed by the Bank’s present organizational structure. The Bank currently does not have any senior management positions that are vacant.
Similarly, the returns, equity positions and other operating measures of the Peer Group companies are indicative of well-managed financial institutions, which have Boards and management teams that have been effective in implementing competitive operating strategies. Therefore, on balance, we concluded no valuation adjustment relative to the Peer Group was appropriate for this factor.
9. Effect of Government Regulation and Regulatory Reform
In summary, as a fully-converted, FDIC insured institution, HV Bank will be operating in substantially the same regulatory environment as the Peer Group members — all of whom are adequately capitalized institutions and are operating with no apparent restrictions. Exhibit IV-6 reflects HV Bank’s pro forma regulatory capital ratios. On balance, no adjustment has been applied for the effect of government regulation and regulatory reform.
| RP® Financial, LC. | VALUATION ANALYSIS |
IV.17
Summary of Adjustments
Overall, based on the factors discussed above, we concluded that the Bank’s pro forma market value should reflect the following valuation adjustments relative to the Peer Group:
| Key Valuation Parameters: |
Valuation Adjustment | |||
| Financial Condition | No Adjustment | |||
| Profitability, Growth and Viability of Earnings | Slight Downward | |||
| Asset Growth | No Adjustment | |||
| Primary Market Area | Slight Upward | |||
| Dividends | No Adjustment | |||
| Liquidity of the Shares | Slight Downward | |||
| Marketing of the Issue | No Adjustment | |||
| Management | No Adjustment | |||
| Effect of Government Regulations and Regulatory Reform | No Adjustment | |||
Valuation Approach
In applying the accepted valuation methodology promulgated by the FDIC, the FRB and the Department, i.e., the pro forma market value approach, we considered the three key pricing ratios in valuing the Bank’s to-be-issued stock – price/earnings (“P/E”), price/book (“P/B”), and price/assets (“P/A”) approaches – all performed on a pro forma basis including the effects of the stock proceeds. In computing the pro forma impact of the conversion and the related pricing ratios, we have incorporated the valuation parameters disclosed in the Bank’s prospectus for reinvestment rate, effective tax rate, stock benefit plan assumptions and expenses (summarized in Exhibits IV-7 and IV-8).
In our estimate of value, we assessed the relationship of the pro forma pricing ratios relative to the Peer Group and recent conversion offerings.
RP Financial’s valuation placed an emphasis on the following:
| • | P/E Approach. The P/E approach is generally the best indicator of long-term value for a stock and the P/E approach was carefully considered in this valuation. At the same time, since reported earnings may include certain non-recurring items, we also reviewed reported earnings for adjustments to arrive at core earnings estimates for the Bank and the Peer Group and resulting price/core earnings ratios. |
| • | P/B Approach. P/B ratios have generally served as a useful benchmark in the valuation of thrift stocks, particularly in the context of an initial public offering, as the earnings approach involves assumptions regarding the use of proceeds. RP Financial considered the P/B approach to be a useful indicator of pro forma value, taking into account the pricing ratios under the P/E and P/A approaches. We have also modified the P/B approach to exclude the impact of intangible assets (i.e., price/tangible book value or “P/TB”), in that the investment community frequently makes this adjustment in its evaluation of this pricing approach. |
| RP® Financial, LC. | VALUATION ANALYSIS |
IV.18
| • | P/A Approach. P/A ratios are generally a less reliable indicator of market value, as investors typically assign less weight to assets and attribute greater weight to book value and earnings. Furthermore, this approach as set forth in the regulatory valuation guidelines does not take into account the amount of stock purchases funded by deposit withdrawals, thus understating the pro forma P/A ratio. At the same time, the P/A ratio is an indicator of franchise value, and, in the case of highly capitalized institutions, high P/A ratios may limit the investment community’s willingness to pay market multiples for earnings or book value when ROE is expected to be low. |
The Company will adopt “Employers’ Accounting for Employee Stock Ownership Plans” (“ASC 718-40”), which will cause earnings per share computations to be based on shares issued and outstanding excluding unreleased ESOP shares. For purposes of preparing the pro forma pricing analyses, we have reflected all shares issued in the offering, including all ESOP shares, to capture the full dilutive impact, particularly since the ESOP shares are economically dilutive, receive dividends and can be voted. However, we did consider the impact of the adoption of ASC 718-40 in the valuation.
Based on the application of the three valuation approaches, which takes into consideration the valuation adjustments discussed above, RP Financial concluded that, as of August 5, 2016, the pro forma market value of HV Bank’s conversion stock was $16,500,000 at the midpoint, equal to 1,650,000 shares at $10.00 per share.
1. Price-to-Earnings (“P/E”). The application of the P/E valuation method requires calculating the Bank’s pro forma market value by applying a valuation P/E multiple to the pro forma earnings base. In applying this technique, we considered both reported earnings and a recurring earnings base, that is, earnings adjusted to exclude any one-time non-operating items, plus the estimated after-tax earnings benefit of the reinvestment of the net proceeds. The Bank’s reported earnings equaled $1.026 million for the twelve months ended June 30, 2016. In deriving HV Bank’s core earnings, the only adjustment made to reported earnings was to eliminate the gain on sale of securities equal to $21,000. As shown below, on a tax effected basis, assuming an effective marginal tax rate of 40.0% applied to pre-tax earnings, the Bank’s core earnings were determined to equal $1.013 million for the twelve months ended June 30, 2016.
| Amount | ||||
| ($000) | ||||
| Net income before tax |
$ | 1,026 | ||
| Deduct: Gain on sale of investment securities(1) |
(13 | ) | ||
|
|
|
|||
| Core earnings estimate |
$ | 1,013 | ||
| (1) | Tax effected at 40.0%. |
| RP® Financial, LC. | VALUATION ANALYSIS |
IV.19
Based on the Bank’s reported and estimated core earnings and incorporating the impact of the pro forma assumptions discussed previously, the Bank’s pro forma reported and core P/E multiples at the $16.5 million midpoint value equaled 18.00 times and 18.26 times, respectively, which provided for discounts of 18.52% and 16.35% relative to the Peer Group’s average reported and core P/E multiples of 22.09 times and 21.83 times, respectively (see Table 4.4). In comparison to the Peer Group’s median reported and core earnings multiples which equaled 18.81 times and 19.31 times, respectively, the Bank’s pro forma reported and core P/E multiples at the midpoint value indicated discounts of 4.31% and 5.44%, respectively. The Bank’s pro forma P/E ratios based on reported earnings at the minimum and the super maximum equaled 15.05x and 24.71x, respectively, and based on core earnings at the minimum and the super maximum equaled 15.26x and 25.08x, respectively.
2. Price-to-Book (“P/B”). The application of the P/B valuation method requires calculating the Bank’s pro forma market value by applying a valuation P/B ratio, as derived from the Peer Group’s P/B ratio, to the Bank’s pro forma book value. Based on the $16.5 million midpoint valuation, the Bank’s pro forma P/B and P/TB ratios both equaled 62.85%. In comparison to the average P/B and P/TB ratios for the Peer Group of 91.89% and 94.99%, respectively, the Bank’s ratios reflected a discount of 31.60% on a P/B basis and a discount of 33.84% on a P/TB basis. In comparison to the Peer Group’s median P/B and P/TB ratios of 89.87% and 93.80%, respectively, the Bank’s pro forma P/B and P/TB ratios at the midpoint value reflected discounts of 30.07% and 33.00%, respectively. At the top of the super range, the Bank’s P/B and P/TB ratios both equaled 70.67%. In comparison to the Peer Group’s average P/B and P/TB ratios, the Bank’s P/B and P/TB ratios at the top of the super range reflected discounts of 23.09% and 25.60%, respectively. In comparison to the Peer Group’s median P/B and P/TB ratios, the Bank’s P/B and P/TB ratios at the top of the super range reflected discounts of 21.36% and 24.66%, respectively. RP Financial considered the discounts under the P/B approach to be reasonable, given the nature of the calculation of the P/B ratio which mathematically results in a ratio discounted to book value.
| RP® Financial, LC. | VALUATION ANALYSIS |
IV.20
Table 4.4
Public Market Pricing Versus Peer Group
Huntingdon Valley Bank
As of August 5, 2016
| Market Capitalization |
Per Share Data |
Pricing Ratios(2) |
Dividends(3) |
Financial Characteristics(5) | ||||||||||||||||||||||||||||||||||||||||||||||||||||||||||||||||||||||||||||||||
| Core 12 Month EPS(1) |
Book Value/ Share |
Amount/ Share |
Yield | Payout Ratio(4) |
Total Assets |
Comm Eq/ Assets |
Comm T. Eq./ Assets |
NPAs/ Assets |
Reported | Core | ||||||||||||||||||||||||||||||||||||||||||||||||||||||||||||||||||||||||||
| Price/ Share |
Market Value |
P/E | P/B | P/A | P/TB | P/Core | ROAA | ROAE | ROAA | ROAE | ||||||||||||||||||||||||||||||||||||||||||||||||||||||||||||||||||||||||||
| ($) | ($Mil) | ($) | ($) | (x) | (%) | (%) | (%) | (x) | ($) | (%) | (%) | ($Mil) | (%) | (%) | (%) | (%) | (%) | (%) | (%) | |||||||||||||||||||||||||||||||||||||||||||||||||||||||||||||||||
| Huntingdon Valley Bank |
PA | |||||||||||||||||||||||||||||||||||||||||||||||||||||||||||||||||||||||||||||||||||
| Supermaximum |
$ | 10.00 | $ | 21.82 | $ | 0.40 | $ | 14.15 | 24.71x | 70.67 | % | 10.91 | % | 70.67 | % | 25.08x | $ | 0.00 | 0.00 | % | 0.00 | % | $ | 200 | 15.44 | % | 15.44 | % | 0.81 | % | 0.44 | % | 2.86 | % | 0.44 | % | 2.82 | % | ||||||||||||||||||||||||||||||||||||||||||||||
| Maximum |
$ | 10.00 | $ | 18.98 | $ | 0.47 | $ | 14.97 | 21.06x | 66.80 | % | 9.61 | % | 66.80 | % | 21.37x | $ | 0.00 | 0.00 | % | 0.00 | % | $ | 197 | 14.39 | % | 14.39 | % | 0.82 | % | 0.46 | % | 3.17 | % | 0.45 | % | 3.13 | % | ||||||||||||||||||||||||||||||||||||||||||||||
| Midpoint |
$ | 10.00 | $ | 16.50 | $ | 0.55 | $ | 15.91 | 18.00x | 62.85 | % | 8.45 | % | 62.85 | % | 18.26x | $ | 0.00 | 0.00 | % | 0.00 | % | $ | 195 | 13.45 | % | 13.45 | % | 0.83 | % | 0.47 | % | 3.49 | % | 0.46 | % | 3.44 | % | ||||||||||||||||||||||||||||||||||||||||||||||
| Minimum |
$ | 10.00 | $ | 14.03 | $ | 0.66 | $ | 17.20 | 15.05x | 58.14 | % | 7.26 | % | 58.14 | % | 15.26x | $ | 0.00 | 0.00 | % | 0.00 | % | $ | 193 | 12.49 | % | 12.49 | % | 0.84 | % | 0.48 | % | 3.86 | % | 0.48 | % | 3.81 | % | ||||||||||||||||||||||||||||||||||||||||||||||
| All Non-MHC Public Companies(6) |
||||||||||||||||||||||||||||||||||||||||||||||||||||||||||||||||||||||||||||||||||||
| Averages |
$ | 17.67 | $ | 474.57 | $ | 1.01 | $ | 15.52 | 18.26x | 110.61 | % | 13.82 | % | 119.47 | % | 18.05x | $ | 0.30 | 1.72 | % | 47.88 | % | $ | 3,334 | 12.83 | % | 12.16 | % | 1.27 | % | 0.69 | % | 5.91 | % | 0.71 | % | 5.91 | % | ||||||||||||||||||||||||||||||||||||||||||||||
| Median |
$ | 14.69 | $ | 113.94 | $ | 0.73 | $ | 13.84 | 17.48x | 106.86 | % | 13.27 | % | 115.16 | % | 17.95x | $ | 0.24 | 1.64 | % | 35.25 | % | $ | 932 | 11.89 | % | 11.39 | % | 1.06 | % | 0.62 | % | 5.35 | % | 0.72 | % | 5.51 | % | ||||||||||||||||||||||||||||||||||||||||||||||
| All Non-MHC State of PA(6) |
||||||||||||||||||||||||||||||||||||||||||||||||||||||||||||||||||||||||||||||||||||
| Averages |
$ | 14.05 | $ | 496.14 | $ | 0.56 | $ | 13.92 | 17.72x | 103.06 | % | 14.43 | % | 114.82 | % | 19.14x | $ | 0.27 | 1.76 | % | 68.81 | % | $ | 2,986 | 13.86 | % | 12.83 | % | 1.66 | % | 0.45 | % | 3.57 | % | 0.55 | % | 4.10 | % | ||||||||||||||||||||||||||||||||||||||||||||||
| Medians |
$ | 14.22 | $ | 138.12 | $ | 0.74 | $ | 13.62 | 17.48x | 102.14 | % | 14.97 | % | 110.49 | % | 19.85x | $ | 0.20 | 1.57 | % | 44.44 | % | $ | 1,281 | 11.89 | % | 10.53 | % | 1.25 | % | 0.43 | % | 3.78 | % | 0.53 | % | 4.92 | % | ||||||||||||||||||||||||||||||||||||||||||||||
| State of PA(6) |
||||||||||||||||||||||||||||||||||||||||||||||||||||||||||||||||||||||||||||||||||||
| PBIP |
Prudential Bancorp, Inc. | PA | $ | 14.27 | $ | 115.03 | $ | 0.10 | $ | 13.93 | NM | 102.41 | % | 21.40 | % | 102.41 | % | NM | $ | 0.12 | 0.84 | % | 92.31 | % | $ | 538 | 20.90 | % | 20.90 | % | 3.27 | % | 0.20 | % | 0.85 | % | 0.17 | % | 0.71 | % | ||||||||||||||||||||||||||||||||||||||||||||
| BNCL |
Beneficial Bancorp, Inc. | PA | $ | 13.56 | $ | 1,046.02 | $ | 0.35 | $ | 13.31 | NM | 101.87 | % | 18.96 | % | 122.78 | % | NM | $ | 0.24 | 1.77 | % | 25.00 | % | $ | 5,514 | 18.61 | % | 15.95 | % | NA | 0.37 | % | 1.70 | % | 0.53 | % | 2.43 | % | |||||||||||||||||||||||||||||||||||||||||||||
| ESSA |
ESSA Bancorp, Inc. | PA | $ | 14.16 | $ | 161.21 | $ | 0.82 | $ | 15.59 | 17.48x | 90.85 | % | 9.12 | % | 100.14 | % | 17.34x | $ | 0.36 | 2.54 | % | 44.44 | % | $ | 1,767 | 10.04 | % | 9.20 | % | NA | 0.50 | % | 4.89 | % | 0.51 | % | 4.92 | % | |||||||||||||||||||||||||||||||||||||||||||||
| MLVF |
Malvern Bancorp, Inc. | PA | $ | 15.66 | $ | 102.74 | $ | 0.79 | $ | 13.21 | 18.64x | 118.57 | % | 12.90 | % | 118.57 | % | 19.85x | $ | 0.11 | 0.00 | % | NM | $ | 796 | 10.88 | % | 10.88 | % | 0.46 | % | 0.75 | % | 6.45 | % | 0.70 | % | 6.06 | % | |||||||||||||||||||||||||||||||||||||||||||||
| NWBI |
Northwest Bancshares, Inc. | PA | $ | 14.91 | $ | 1,527.87 | $ | 0.74 | $ | 11.28 | NM | 132.23 | % | 17.04 | % | 172.60 | % | 20.25x | $ | 0.60 | 4.02 | % | 147.50 | % | $ | 8,964 | 12.89 | % | 10.18 | % | 1.25 | % | 0.45 | % | 3.48 | % | 0.83 | % | 6.40 | % | ||||||||||||||||||||||||||||||||||||||||||||
| WVFC |
WVS Financial Corp. | PA | $ | 11.75 | $ | 23.97 | NA | $ | 16.22 | 17.03x | 72.44 | % | 7.14 | % | 72.44 | % | NM | $ | 0.16 | 1.36 | % | 34.78 | % | $ | 336 | 9.85 | % | 9.85 | % | NA | 0.40 | % | 4.08 | % | NA | NA | ||||||||||||||||||||||||||||||||||||||||||||||||
| Comparable Group |
||||||||||||||||||||||||||||||||||||||||||||||||||||||||||||||||||||||||||||||||||||
| Averages |
$ | 15.42 | $ | 59.72 | $ | 0.62 | $ | 16.57 | 22.09x | 91.89 | % | 14.32 | % | 94.99 | % | 21.83x | $ | 0.24 | 1.23 | % | 34.64 | % | $ | 409 | 15.64 | % | 15.16 | % | 2.25 | % | 0.48 | % | 3.33 | % | 0.49 | % | 3.37 | % | ||||||||||||||||||||||||||||||||||||||||||||||
| Medians |
$ | 13.89 | $ | 54.94 | $ | 0.49 | $ | 15.50 | 18.81x | 89.87 | % | 13.41 | % | 93.80 | % | 19.31x | $ | 0.18 | 1.13 | % | 30.48 | % | $ | 415 | 15.53 | % | 14.84 | % | 2.01 | % | 0.43 | % | 3.79 | % | 0.44 | % | 3.86 | % | ||||||||||||||||||||||||||||||||||||||||||||||
| Comparable Group |
||||||||||||||||||||||||||||||||||||||||||||||||||||||||||||||||||||||||||||||||||||
| BYBK |
Bay Bancorp, Inc. | MD | $ | 5.05 | $ | 55.14 | $ | 0.18 | $ | 6.18 | 31.56x | 81.69 | % | 11.13 | % | 84.54 | % | 28.77x | $ | 0.00 | 0.00 | % | 0.00 | % | $ | 463 | 14.44 | % | 13.92 | % | 2.10 | % | 0.35 | % | 2.51 | % | 0.39 | % | 2.76 | % | ||||||||||||||||||||||||||||||||||||||||||||
| EQFN |
Equitable Financial Corp. | NE | $ | 8.51 | $ | 29.59 | $ | 0.27 | $ | 10.23 | 32.01x | 83.17 | % | 12.62 | % | 83.17 | % | 31.35x | $ | 0.00 | 0.00 | % | 0.00 | % | $ | 234 | 15.18 | % | 15.18 | % | 2.48 | % | 0.42 | % | 3.17 | % | 0.42 | % | 3.24 | % | ||||||||||||||||||||||||||||||||||||||||||||
| HBK |
Hamilton Bancorp, Inc. | MD | $ | 13.50 | $ | 46.08 | $ | 0.03 | $ | 18.03 | NM | 74.88 | % | 11.73 | % | 85.09 | % | NM | $ | 0.00 | 0.00 | % | 0.00 | % | $ | 393 | 15.66 | % | 13.78 | % | 1.93 | % | -0.03 | % | -0.15 | % | 0.03 | % | 0.15 | % | ||||||||||||||||||||||||||||||||||||||||||||
| JXSB |
Jacksonville Bancorp, Inc. | IL | $ | 28.20 | $ | 50.68 | $ | 1.56 | $ | 26.60 | 16.89x | 106.02 | % | 16.19 | % | 112.43 | % | 18.13x | $ | 0.40 | 1.42 | % | 81.44 | % | $ | 302 | 15.40 | % | 14.50 | % | 1.24 | % | 0.98 | % | 6.46 | % | 0.91 | % | 6.01 | % | ||||||||||||||||||||||||||||||||||||||||||||
| MSBF |
MSB Financial Corp. | NJ | $ | 13.10 | $ | 77.98 | $ | 0.11 | $ | 12.66 | NM | 103.45 | % | 19.70 | % | 103.45 | % | NM | $ | 0.00 | 0.00 | % | 0.00 | % | $ | 380 | 20.14 | % | 20.14 | % | 4.38 | % | 0.17 | % | 0.89 | % | 0.26 | % | 1.35 | % | ||||||||||||||||||||||||||||||||||||||||||||
| PBIP |
Prudential Bancorp, Inc. | PA | $ | 14.27 | $ | 115.03 | $ | 0.10 | $ | 13.93 | NM | 102.41 | % | 21.40 | % | 102.41 | % | NM | $ | 0.12 | 0.84 | % | 92.31 | % | $ | 538 | 20.90 | % | 20.90 | % | 3.27 | % | 0.20 | % | 0.85 | % | 0.17 | % | 0.71 | % | ||||||||||||||||||||||||||||||||||||||||||||
| PBSK |
Poage Bankshares, Inc. | KY | $ | 18.21 | $ | 69.56 | $ | 0.86 | $ | 18.50 | 21.42x | 98.42 | % | 15.96 | % | 102.09 | % | 21.06x | $ | 0.32 | 1.76 | % | 30.59 | % | $ | 436 | 16.22 | % | 15.64 | % | 1.29 | % | 0.72 | % | 4.40 | % | 0.73 | % | 4.48 | % | ||||||||||||||||||||||||||||||||||||||||||||
| UCBA |
United Community Bancorp | IN | $ | 14.69 | $ | 61.72 | $ | 0.76 | $ | 16.37 | 18.60x | 89.73 | % | 11.92 | % | 93.63 | % | 19.31x | $ | 0.24 | 1.63 | % | 30.38 | % | $ | 518 | 13.28 | % | 12.73 | % | 1.19 | % | 0.64 | % | 4.80 | % | 0.62 | % | 4.64 | % | ||||||||||||||||||||||||||||||||||||||||||||
| WAYN |
Wayne Savings Bancshares, Inc. | OH | $ | 13.17 | $ | 36.64 | $ | 0.70 | $ | 14.63 | 18.81x | 90.01 | % | 8.37 | % | 93.98 | % | 18.81x | $ | 0.36 | 2.73 | % | 51.43 | % | $ | 438 | 9.30 | % | 8.91 | % | 1.09 | % | 0.45 | % | 4.78 | % | 0.45 | % | 4.78 | % | ||||||||||||||||||||||||||||||||||||||||||||
| WBKC |
Wolverine Bancorp, Inc. | MI | $ | 25.46 | $ | 54.75 | $ | 1.66 | $ | 28.55 | 15.34x | 89.17 | % | 14.20 | % | 89.17 | % | 15.34x | $ | 1.00 | 3.93 | % | 60.24 | % | $ | 386 | 15.92 | % | 15.92 | % | 3.54 | % | 0.92 | % | 5.55 | % | 0.92 | % | 5.55 | % | ||||||||||||||||||||||||||||||||||||||||||||
| (1) | Core income, on a diluted per-share basis. Core income is net income after taxes and before extraordinary items, less net income attributable to noncontrolling interest, gain on the sale of securities, amortization of intangibles, goodwill and nonrecurring items. Assumed tax rate is 35%. |
| (2) | P/E = Price to earnings; P/B = Price to book; P/A = Price to assets; P/TB = Price to tangible book value; and P/Core = Price to core earnings. P/E and P/Core =NM if the ratio is negative or above 35x. |
| (3) | Indicated 12 month dividend, based on last quarterly dividend declared. |
| (4) | Indicated 12 month dividend as a percent of trailing 12 month earnings. |
| (5) | Equity and tangible equity equal common equity and tangible common equity, respectively. ROAA (return on average assets) and ROAE (return on average equity) are indicated ratios based on trailing 12 month earnings and average equity and assets balances. |
| (6) | Excludes from averages and medians those companies the subject of actual or rumored acquisition activities or unusual operating characteristics. |
Source: SNL Financial, LC. and RP Financial, LC. calculations. The information provided in this report has been obtained from sources we believe are reliable, but we cannot guarantee the accuracy or completeness of such information.
Copyright (c) 2016 by RP® Financial, LC.
| RP® Financial, LC. | VALUATION ANALYSIS |
IV.21
3. Price-to-Assets (“P/A”). The P/A valuation methodology determines market value by applying a valuation P/A ratio to the Bank’s pro forma asset base, conservatively assuming no deposit withdrawals are made to fund stock purchases. In all likelihood there will be deposit withdrawals, which results in understating the pro forma P/A ratio which is computed herein. At the $16.5 million midpoint of the valuation range, the Bank’s value equaled 8.45% of pro forma assets. Comparatively, the Peer Group companies exhibited an average P/A ratio of 14.32%, which implies a discount of 40.99% has been applied to the Bank’s pro forma P/A ratio. In comparison to the Peer Group’s median P/A ratio of 13.41%, the Bank’s pro forma P/A ratio at the midpoint value reflects a discount of 36.99%.
Comparison to Recent Offerings
As indicated at the beginning of this chapter, RP Financial’s analysis of recent conversion offering pricing characteristics at closing and in the aftermarket has been limited to a “technical” analysis and, thus, the pricing characteristics of recent conversion offerings cannot be a primary determinate of value. Particular focus was placed on the P/TB approach in this analysis, since the P/E multiples do not reflect the actual impact of reinvestment and the source of the stock proceeds (i.e., external funds vs. deposit withdrawals). As discussed previously, two standard conversion offerings were completed during the past three months. One of the standard conversion offerings was closed at the top of its super range and the other standard conversion offering was closed at slightly below the top of its super range. In comparison to the 68.70% average closing forma P/TB ratio of the two recent standard conversions, the Bank’s P/TB ratio of 62.85% at the midpoint value reflects an implied discount of 8.52%. At the top of the super range, the Bank’s P/TB ratio of 70.67% reflects an implied premium of 4.39% relative to the recent standard conversions average P/TB ratio at closing. Comparative pre-conversion financial data for Randolph Bancorp, which is the most recently completed publicly-traded standard conversion offering, has been included in the Chapter III tables and show that, in comparison to HV Bank, Randolph Bancorp maintained a similar tangible equity-to-assets ratio (7.38% versus 7.14% for HV Bank), a lower return on average assets (0.10% versus 0.62% for HV Bank) and a higher ratio of non-performing assets as a percent of assets (1.74% versus 0.89% for HV Bank).
Valuation Conclusion
Based on the foregoing, it is our opinion that, as of August 5, 2016, the estimated aggregate pro forma market value of the shares to be issued immediately following the conversion
| RP® Financial, LC. | VALUATION ANALYSIS |
IV.22
equaled $16,500,000 at the midpoint, equal to 1,650,000 shares offered at a per share value of $10.00. Pursuant to conversion guidelines, the 15% valuation range indicates a minimum value of $14,025,000 and a maximum value of $18,975,000. Based on the $10.00 per share offering price determined by the Board, this valuation range equates to total shares outstanding of 1,402,500 at the minimum and 1,897,500 at the maximum. In the event the appraised value is subject to an increase, the aggregate pro forma market value may be increased up to a super maximum value of $21,821,250 without a resolicitation. Based on the $10.00 per share offering price, the super maximum value would result in total shares outstanding of 2,182,125. The pro forma valuation calculations relative to the Peer Group are shown in Table 4.4 and are detailed in Exhibit IV-7 and Exhibit IV-8.
| RP® Financial, LC. | LIST OF EXHIBITS |
EXHIBITS
| RP® Financial, LC. | LIST OF EXHIBITS |
LIST OF EXHIBITS
| Exhibit |
Description | |
| I-1 |
Map of Office Locations | |
| I-2 |
Audited Financial Statements | |
| I-3 |
Key Operating Ratios | |
| I-4 |
Investment Portfolio Composition | |
| I-5 |
Yields and Costs | |
| I-6 |
Loan Loss Allowance Activity | |
| I-7 |
Interest Rate Risk Analysis | |
| I-8 |
Fixed and Adjustable Rate Loans | |
| I-9 |
Loan Portfolio Composition | |
| I-10 |
Contractual Maturity by Loan Type | |
| I-11 |
Loan Originations, Purchases, Sales and Repayments | |
| I-12 |
Non-Performing Assets | |
| I-13 |
Deposit Composition | |
| I-14 |
Maturity of Jumbo Time Deposits | |
| I-15 |
Borrowing Activity | |
| II-1 |
Description of Office Properties | |
| II-2 |
Historical Interest Rates | |
| RP® Financial, LC. | LIST OF EXHIBITS |
LIST OF EXHIBITS (continued)
| Exhibit |
Description | |
| III-1 |
General Characteristics of Publicly-Traded Institutions | |
| III-2 |
Public Market Pricing of Mid-Atlantic Thrift Institutions | |
| III-3 |
Public Market Pricing of Midwest Thrift Institutions | |
| III-4 |
Peer Group Market Area Comparative Analysis | |
| IV-1 |
Stock Prices: As of August 5, 2016 | |
| IV-2 |
Historical Stock Price Indices | |
| IV-3 |
Stock Indices as of August 5, 2016 | |
| IV-4 |
Market Area Acquisition Activity | |
| IV-5 |
Director and Senior Management Summary Resumes | |
| IV-6 |
Pro Forma Regulatory Capital Ratios | |
| IV-7 |
Pro Forma Analysis Sheet | |
| IV-8 |
Pro Forma Effect of Conversion Proceeds | |
| V-1 |
Firm Qualifications Statement | |
EXHIBIT I-1
Huntingdon Valley Bank
Map of Office Locations
Exhibit I-1
Huntingdon Valley Bank
Map of Office Locations
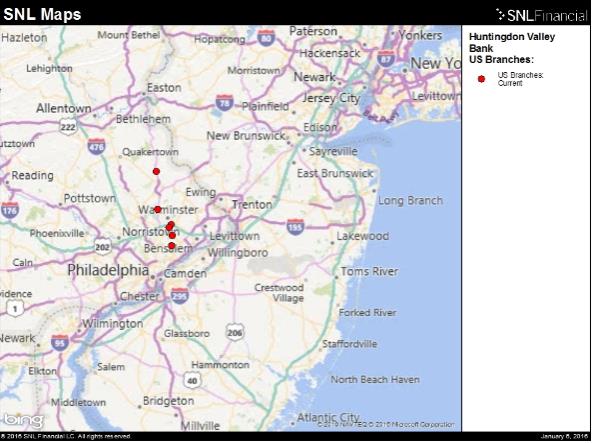
Source: SNL Financial LC
EXHIBIT I-2
Huntingdon Valley Bank
Audited Financial Statements
[Incorporated by Reference]
EXHIBIT I-3
Huntingdon Valley Bank
Key Operating Ratios
Exhibit I-3
Huntingdon Valley Bank
Key Operating Ratios
| At or For the Years Ended June 30, |
||||||||
| 2016 | 2015 | |||||||
| Selected Financial Ratios and Other Data: |
||||||||
| Performance Ratios: |
||||||||
| Return on average assets |
0.62 | % | 0.38 | % | ||||
| Return on average equity |
8.69 | % | 5.55 | % | ||||
| Interest rate spread (1) |
2.85 | % | 2.65 | % | ||||
| Net interest margin (2) |
2.90 | % | 2.68 | % | ||||
| Efficiency ratio (3) |
84.26 | % | 90.83 | % | ||||
| Average interest-earning assets to average interest-bearing liabilities |
108.72 | % | 107.23 | % | ||||
| Asset Quality Ratios: |
||||||||
| Non-performing assets as a percent of total assets |
0.69 | % | 1.33 | % | ||||
| Non-performing loans as a percent of total loans |
0.97 | % | 1.66 | % | ||||
| Allowance for loan losses as a percent of non-performing loans |
42.53 | % | 31.15 | % | ||||
| Allowance for loan losses as a percent of total loans |
0.52 | % | 0.61 | % | ||||
| Net charge-offs to average outstanding loans during the year |
0.04 | % | 0.29 | % | ||||
| Capital Ratios: (4) |
||||||||
| Common equity tier 1 capital (to risk weighted assets) |
12.04 | % | 12.46 | % | ||||
| Tier 1 leverage (core) capital (to adjusted tangible assets) |
7.63 | % | 6.82 | % | ||||
| Tier 1 risk-based capital (to risk weighted assets) |
12.04 | % | 12.46 | % | ||||
| Total risk-based capital (to risk weighted assets) |
12.49 | % | 13.02 | % | ||||
| Average equity to average total assets |
7.10 | % | 6.76 | % | ||||
| Other Data: |
||||||||
| Number of full service offices |
4 | 4 | ||||||
| Number of employees |
65 | 57 | ||||||
| (1) | Represents the difference between the weighted-average yield on interest-earning assets and the weighted-average cost of interest-bearing liabilities for the year. |
| (2) | The net interest margin represents net interest income as a percent of average interest-earning assets for the year. |
| (3) | The efficiency ratio represents non-interest expense divided by the sum of net interest income and non-interest income. |
| (4) | Capital ratios are for Huntingdon Valley Bank. |
Source: Huntingdon Valley Bank’s prospectus.
EXHIBIT I-4
Huntingdon Valley Bank
Investment Portfolio Composition
Exhibit I-4
Huntingdon Valley Bank
Investment Portfolio Composition
| At June 30, | ||||||||||||||||
| 2016 | 2015 | |||||||||||||||
| Amortized Cost |
Fair Value |
Amortized Cost |
Fair Value |
|||||||||||||
| Securities available-for-sale: |
||||||||||||||||
| U.S. Government securities |
$ | 1,493 | $ | 1,521 | $ | 2,958 | $ | 2,927 | ||||||||
| Corporate notes |
8,423 | 8,327 | 5,822 | 5,683 | ||||||||||||
| Collateralized mortgage obligations |
9,879 | 9,831 | 16,467 | 16,026 | ||||||||||||
| Mortgage-backed securities |
6,980 | 7,009 | 7,033 | 6,888 | ||||||||||||
| Municipal securities |
3,524 | 3,566 | 4,402 | 4,324 | ||||||||||||
| Bank certificates of deposit |
2,994 | 3,027 | 2,249 | 2,240 | ||||||||||||
|
|
|
|
|
|
|
|
|
|||||||||
| Total securities available-for-sale |
$ | 33,293 | $ | 33,281 | $ | 38,931 | $ | 38,088 | ||||||||
|
|
|
|
|
|
|
|
|
|||||||||
| Securities held-to-maturity: |
||||||||||||||||
| Municipal securities |
$ | 5,825 | $ | 5,941 | $ | 4,744 | $ | 4,732 | ||||||||
|
|
|
|
|
|
|
|
|
|||||||||
| Total securities held-to-maturity |
$ | 5,825 | $ | 5,941 | $ | 4,744 | $ | 4,732 | ||||||||
|
|
|
|
|
|
|
|
|
|||||||||
Source: Huntingdon Valley Bank’s prospectus.
EXHIBIT I-5
Huntingdon Valley Bank
Yields and Costs
Exhibit I-5
Huntingdon Valley Bank
Yields and Costs
| For the Years Ended June 30, | ||||||||||||||||||||||||
| 2016 | 2015 | |||||||||||||||||||||||
| Average Balance |
Interest Income/ Expense |
Yield/ Cost |
Average Balance |
Interest Income/ Expense |
Yield/ Cost |
|||||||||||||||||||
| Interest-earning assets: |
||||||||||||||||||||||||
| Loans (1) |
$ | 100,165 | $ | 4,446 | 4.44 | % | $ | 92,498 | $ | 4,181 | 4.52 | % | ||||||||||||
| Cash and cash equivalents |
16,068 | 113 | 0.70 | % | 26,033 | 77 | 0.30 | % | ||||||||||||||||
| Investment securities |
40,423 | 715 | 1.77 | % | 39,957 | 750 | 1.88 | % | ||||||||||||||||
| Restricted investment in bank stock |
676 | 28 | 4.14 | % | 702 | 49 | 6.98 | % | ||||||||||||||||
|
|
|
|
|
|
|
|
|
|||||||||||||||||
| Total interest-earning assets |
157,332 | 5,302 | 3.37 | % | 159,190 | 5,057 | 3.18 | % | ||||||||||||||||
|
|
|
|
|
|
|
|
|
|||||||||||||||||
| Noninterest-earning assets |
8,930 | 8,206 | ||||||||||||||||||||||
|
|
|
|
|
|||||||||||||||||||||
| Total assets |
$ | 166,262 | $ | 167,396 | ||||||||||||||||||||
|
|
|
|
|
|||||||||||||||||||||
| Interest-bearing liabilities: |
||||||||||||||||||||||||
| NOW accounts |
$ | 30,178 | 38 | 0.13 | % | $ | 27,7988 | 35 | 0.13 | % | ||||||||||||||
| Money market deposit accounts |
27,030 | 68 | 0.25 | % | 28,8866 | 711 | 0.25 | % | ||||||||||||||||
| Passbook and statement savings accounts |
34,441 | 105 | 0.30 | % | 33,341 | 97 | 0.29 | % | ||||||||||||||||
| Checking accounts |
3,511 | 12 | 0.34 | % | 4,379 | 17 | 0.39 | % | ||||||||||||||||
| Certificates of deposit |
38,696 | 426 | 1.10 | % | 44,196 | 501 | 1.13 | % | ||||||||||||||||
|
|
|
|
|
|
|
|
|
|||||||||||||||||
| Total deposits |
$ | 133,856 | $ | 649 | 0.48 | % | $ | 138,600 | $ | 721 | 0.52 | % | ||||||||||||
|
|
|
|
|
|
|
|
|
|||||||||||||||||
| Federal Home Loan Bank advances |
8,863 | 94 | 1.06 | % | 7,000 | 60 | 0.86 | % | ||||||||||||||||
| Securities sold under agreements to repurchase |
1,998 | 3 | 0.15 | % | 2,854 | 4 | 0.14 | % | ||||||||||||||||
|
|
|
|
|
|
|
|
|
|||||||||||||||||
| Total interest-bearing liabilities |
$ | 144,717 | $ | 746 | 0.52 | % | $ | 148,454 | $ | 785 | 0.53 | % | ||||||||||||
|
|
|
|
|
|
|
|
|
|||||||||||||||||
| Noninterest-bearing liabilities: |
||||||||||||||||||||||||
| Checking |
8,336 | 7,119 | ||||||||||||||||||||||
| Other |
1,399 | 515 | ||||||||||||||||||||||
|
|
|
|
|
|||||||||||||||||||||
| Total liabilities |
$ | 154,452 | $ | 156,088 | ||||||||||||||||||||
|
|
|
|
|
|||||||||||||||||||||
| Equity |
11,810 | 11,308 | ||||||||||||||||||||||
|
|
|
|
|
|||||||||||||||||||||
| Total liabilities and equity |
$ | 166,262 | $ | 167,396 | ||||||||||||||||||||
|
|
|
|
|
|||||||||||||||||||||
| Net interest income |
$ | 4,556 | $ | 4,272 | ||||||||||||||||||||
|
|
|
|
|
|||||||||||||||||||||
| Interest rate spread (2) |
2.85 | % | 2.65 | % | ||||||||||||||||||||
|
|
|
|
|
|||||||||||||||||||||
| Net interest-earning assets (3) |
$ | 12,615 | $ | 10,736 | ||||||||||||||||||||
|
|
|
|
|
|||||||||||||||||||||
| Net interest margin (4) |
2.90 | % | 2.68 | % | ||||||||||||||||||||
|
|
|
|
|
|||||||||||||||||||||
| Average interest-earning assets to average interest-bearing liabilities |
108.72 | % | 107.23 | % | ||||||||||||||||||||
|
|
|
|
|
|||||||||||||||||||||
| (1) | Includes loans held for sale. |
| (2) | Interest rate spread represents the difference between the yield on average interest-earning assets and the cost of average interest-bearing liabilities. |
| (3) | Net interest-earning assets represents total interest-earning assets less total interest-bearing liabilities. |
| (4) | Net interest margin represents net interest income divided by total interest-earning assets. |
Source: Huntingdon Valley Bank’s prospectus.
EXHIBIT I-6
Huntingdon Valley Bank
Loan Loss Allowance Activity
Exhibit I-6
Huntingdon Valley Bank
Loan Loss Allowance Activity
| At or For the Years Ended June 30, |
||||||||
| 2016 | 2015 | |||||||
| (Dollars in thousands) | ||||||||
| Balance at beginning of year |
$ | 514 | $ | 705 | ||||
| Charge-offs: |
||||||||
| Residential: |
||||||||
| One- to four-family |
— | (233 | ) | |||||
| Home equity & HELOCs |
— | — | ||||||
| Commercial real estate |
(34 | ) | (31 | ) | ||||
| Commercial business |
— | — | ||||||
| Construction |
— | — | ||||||
| Consumer |
(3 | ) | (7 | ) | ||||
|
|
|
|
|
|||||
| Total charge-offs |
(37 | ) | (271 | ) | ||||
|
|
|
|
|
|||||
| Recoveries: |
||||||||
| Residential: |
||||||||
| One- to four-family |
— | — | ||||||
| Home equity & HELOCs |
— | — | ||||||
| Commercial real estate |
— | — | ||||||
| Commercial business |
— | — | ||||||
| Construction |
— | — | ||||||
| Consumer |
1 | 1 | ||||||
|
|
|
|
|
|||||
| Total recoveries |
1 | 1 | ||||||
|
|
|
|
|
|||||
| Net charge-offs |
(36 | ) | (270 | ) | ||||
| Provision for loan losses |
9 | 79 | ||||||
|
|
|
|
|
|||||
| Balance at end of year |
$ | 487 | $ | 514 | ||||
|
|
|
|
|
|||||
| Ratios: |
||||||||
| Net charge-offs to average loans outstanding |
0.04 | % | 0.29 | % | ||||
| Allowance for loan losses to non-performing loans at end of year |
42.53 | % | 31.15 | % | ||||
| Allowance for loan losses to total loans at end of year |
0.52 | % | 0.61 | % | ||||
Source: Huntingdon Valley Bank’s Prospectus.
EXHIBIT I-7
Huntingdon Valley Bank
Interest Rate Risk Analysis
Exhibit I-7
Huntingdon Valley Bank
Interest Rate Risk Analysis
| Change in Interest Rates (basis points) (1) |
Estimated Increase | EVE as a Percentage of Fair Value of Assets (3) |
||||||||||||||||||
| (Decrease) in EVE | Increase | |||||||||||||||||||
| Estimated EVE (2) |
Amount | Percent | EVE Ratio (4) |
(Decrease) (basis points) |
||||||||||||||||
| (Dollars in thousands) | ||||||||||||||||||||
| +400 |
$ | 13,635 | $ | (4,613 | ) | (25.28 | )% | 7.51 | % | (216 | ) | |||||||||
| +300 |
14,726 | (3,522 | ) | (19.30 | )% | 8.04 | % | (163 | ) | |||||||||||
| +200 |
16,061 | (2,187 | ) | (11.99 | )% | 8.67 | % | (100 | ) | |||||||||||
| +100 |
17,394 | (854 | ) | (4.68 | )% | 9.29 | % | (38 | ) | |||||||||||
| — |
18,248 | — | — | 9.67 | % | — | ||||||||||||||
| -100 |
17,090 | (1,159 | ) | (6.35 | )% | 9.08 | % | (59 | ) | |||||||||||
| (1) | Assumes an immediate uniform change in interest rates at all maturities. |
| (2) | EVE is the fair value of expected cash flows from assets, less the fair value of the expected cash flows arising from our liabilities adjusted for the value of off-balance sheet contracts. |
| (3) | Fair value of assets represents the amount at which an asset could be exchanged between knowledgeable and willing parties in an arms-length transaction. |
| (4) | EVE Ratio represents EVE divided by the fair value of assets. |
| Rate Shift (1) |
Net Interest Income Year 1 Forecast |
Year 1 Change from Level |
||||||
| (Dollars in thousands) | ||||||||
| +400 |
$ | 5,840 | 17 | % | ||||
| +300 |
5,633 | 13 | % | |||||
| +200 |
5,421 | 8 | % | |||||
| +100 |
5,224 | 5 | % | |||||
| 0 |
4,998 | — | ||||||
| -100 |
4,757 | -5 | % | |||||
| (1) | Expressed in basis points. |
Source: Huntingdon Valley Bank’s prospectus.
EXHIBIT I-8
Huntingdon Valley Bank
Fixed and Adjustable Rate Loans
Exhibit I-8
Huntingdon Valley Bank
Fixed and Adjustable Rate Loans
The following table sets forth our fixed and adjustable-rate loans at June 30, 2016 that are contractually due after June 30, 2017.
| Due After June 30, 2017 | ||||||||||||
| Fixed | Adjustable | Total | ||||||||||
| (In thousands) | ||||||||||||
| Residential: |
||||||||||||
| One- to four-family |
$ | 49,335 | $ | 22,574 | $ | 71,909 | ||||||
| Home equity & HELOCs |
6,120 | — | 6,120 | |||||||||
| Commercial real estate |
10,671 | 739 | 11,410 | |||||||||
| Commercial business |
— | — | — | |||||||||
| Construction |
204 | — | 204 | |||||||||
| Consumer |
— | — | — | |||||||||
|
|
|
|
|
|
|
|||||||
| Total |
$ | 66,330 | $ | 23,313 | $ | 89,643 | ||||||
|
|
|
|
|
|
|
|||||||
Source: Huntingdon Valley Bank’s prospectus.
EXHIBIT I-9
Huntingdon Valley Bank
Loan Portfolio Composition
Exhibit I-9
Huntingdon Valley Bank
Loan Portfolio Composition
| At June 30, | At June 30, | |||||||||||||||
| 2016 | 2015 | |||||||||||||||
| Amount | Percent | Amount | Percent | |||||||||||||
| (dollars in thousands) | ||||||||||||||||
| Residential: |
||||||||||||||||
| One- to four-family |
$ | 71,980 | 76.75 | % | $ | 63,425 | 75.70 | % | ||||||||
| Home equity & HELOCs |
6,448 | 6.87 | % | 6,662 | 7.95 | % | ||||||||||
| Commercial real estate |
11,620 | 12.39 | % | 12,662 | 15.11 | % | ||||||||||
| Commercial business |
558 | 0.59 | % | 634 | 0.76 | % | ||||||||||
| Construction |
3,179 | 3.39 | % | 365 | 0.44 | % | ||||||||||
| Consumer |
10 | 0.01 | % | 31 | 0.04 | % | ||||||||||
|
|
|
|
|
|
|
|
|
|||||||||
| Total loans receivable |
93,795 | 100.00 | % | 83,779 | 100.00 | % | ||||||||||
|
|
|
|
|
|
|
|
|
|||||||||
| Deferred loan origination costs |
142 | 54 | ||||||||||||||
| Loans in process |
— | — | ||||||||||||||
| Allowance for loan losses |
(487 | ) | (514 | ) | ||||||||||||
|
|
|
|
|
|||||||||||||
| Total loans receivable, net |
$ | 93,450 | $ | 83,319 | ||||||||||||
|
|
|
|
|
|||||||||||||
Source: Huntingdon Valley Bank’s prospectus.
EXHIBIT I-10
Huntingdon Valley Bank
Contractual Maturity by Loan Type
Exhibit I-10
Huntingdon Valley Bank
Contractual Maturity by Loan Type
| One- to Four-Family Real Estate Loans |
Home Equity & HELOCs |
Commercial Real Estate Loans |
Commercial Business Loans |
Construction Loans |
Consumer Loans |
Total | ||||||||||||||||||||||
| (In thousands) | ||||||||||||||||||||||||||||
| Due During the Years Ending June 30, |
||||||||||||||||||||||||||||
| 2017 |
$ | 71 | $ | 328 | $ | 210 | $ | 558 | $ | 2,975 | $ | 10 | $ | 4,152 | ||||||||||||||
| 2018 |
350 | 58 | 2,042 | — | — | — | 2,450 | |||||||||||||||||||||
| 2019 |
146 | 78 | 1,397 | — | — | — | 1,621 | |||||||||||||||||||||
| 2020 to 2021 |
74 | 556 | 1,347 | — | 204 | — | 2,181 | |||||||||||||||||||||
| 2022 to 2026 |
1,467 | 363 | 2,596 | — | — | — | 4,426 | |||||||||||||||||||||
| 2027 to 2031 |
4,925 | 891 | 487 | — | — | — | 6,303 | |||||||||||||||||||||
| 2032 and beyond |
64,947 | 4,174 | 3,541 | — | — | — | 72,662 | |||||||||||||||||||||
|
|
|
|
|
|
|
|
|
|
|
|
|
|
|
|||||||||||||||
| Total |
$ | 71,980 | $ | 6,448 | $ | 11,620 | $ | 558 | $ | 3,179 | $ | 10 | $ | 93,795 | ||||||||||||||
|
|
|
|
|
|
|
|
|
|
|
|
|
|
|
|||||||||||||||
Source: Huntingdon Valley Bank’s prospectus.
EXHIBIT I-11
Huntingdon Valley Bank
Loan Originations, Purchases, Sales and Repayments
Exhibit I-11
Huntingdon Valley Bank
Loan Originations, Purchases, Sales and Repayments
| For the Year Ended June 30, |
||||||||
| 2016 | 2015 | |||||||
| (In thousands) | ||||||||
| Total loans at beginning of year (1) |
$ | 100,040 | $ | 98,189 | ||||
|
|
|
|
|
|||||
| Loan originations: |
||||||||
| Residential: |
||||||||
| One- to four-family |
182,962 | 171,114 | ||||||
| Home equity & HELOCs |
2,989 | 298 | ||||||
| Commercial real estate |
1,198 | 2,399 | ||||||
| Commercial business |
— | — | ||||||
| Construction |
2,970 | 460 | ||||||
| Consumer loans |
4 | 4 | ||||||
|
|
|
|
|
|||||
| Total loans originated |
190,123 | 174,275 | ||||||
|
|
|
|
|
|||||
| Sales and loan principal repayments: |
||||||||
| Principal repayments |
13,914 | 12,973 | ||||||
| Loan sales |
157,778 | 159,451 | ||||||
|
|
|
|
|
|||||
| Net loan activity |
18,431 | 1,851 | ||||||
|
|
|
|
|
|||||
| Total loans at end of year |
$ | 118,471 | $ | 100,040 | ||||
|
|
|
|
|
|||||
| (1) | Includes loans held for sale |
Source: Huntingdon Valley Bank’s prospectus.
EXHIBIT I-12
Huntingdon Valley Bank
Non-Performing Assets
Exhibit I-12
Huntingdon Valley Bank
Non-Performing Assets
| At June 30, | ||||||||
| 2016 | 2015 | |||||||
| (Dollars in thousands) | ||||||||
| Non-accrual loans: |
||||||||
| Residential: |
||||||||
| One- to four-family |
$ | 818 | $ | 1,277 | ||||
| Home equity & HELOCs |
227 | 147 | ||||||
| Commercial real estate |
100 | 226 | ||||||
| Commercial business |
— | — | ||||||
| Construction |
— | — | ||||||
| Consumer |
— | — | ||||||
|
|
|
|
|
|||||
| Total |
$ | 1,145 | $ | 1,650 | ||||
|
|
|
|
|
|||||
| Total non-performing loans |
$ | 1,145 | $ | 1,650 | ||||
|
|
|
|
|
|||||
| Real estate owned |
115 | 574 | ||||||
| Other non-performing assets |
— | — | ||||||
|
|
|
|
|
|||||
| Total non-performing assets |
$ | 1,260 | $ | 2,224 | ||||
|
|
|
|
|
|||||
| Ratios: |
||||||||
| Total non-performing loans to total loans |
1.22 | % | 1.97 | % | ||||
| Total non-performing loans to total assets |
0.63 | % | 0.99 | % | ||||
| Total non-performing assets to total assets |
0.69 | % | 1.33 | % | ||||
Source: Huntingdon Valley Bank’s prospectus.
EXHIBIT I-13
Huntingdon Valley Bank
Deposit Composition
Exhibit I-13
Huntingdon Valley Bank
Deposit Composition
| For the Years Ended June 30, | ||||||||||||||||||||||||
| 2016 | 2015 | |||||||||||||||||||||||
| Average Balance |
Percent | Weighted Average Rate |
Average Balance |
Percent | Weighted Average Rate |
|||||||||||||||||||
| (Dollars in thousands) | ||||||||||||||||||||||||
| Deposit type: |
||||||||||||||||||||||||
| NOW accounts – interest bearing |
$ | 30,178 | 22.55 | % | 0.13 | % | $ | 27,798 | 20.06 | % | 0.13 | % | ||||||||||||
| Money market deposit accounts |
27,030 | 20.19 | % | 0.25 | % | 28,886 | 20.84 | % | 0.25 | % | ||||||||||||||
| Passbook and statement savings accounts |
34,441 | 25.73 | % | 0.30 | % | 33,341 | 24.06 | % | 0.29 | % | ||||||||||||||
| Checking accounts |
3,511 | 2.62 | % | 0.34 | % | 4,379 | 3.16 | % | 0.39 | % | ||||||||||||||
| Certificates of deposit |
38,696 | 28.91 | % | 1.10 | % | 44,196 | 31.89 | % | 1.13 | % | ||||||||||||||
|
|
|
|
|
|
|
|
|
|
|
|
|
|||||||||||||
| Total deposits |
$ | 133,856 | 100.00 | % | 0.48 | % | $ | 138,600 | 100.00 | % | 0.52 | % | ||||||||||||
|
|
|
|
|
|
|
|
|
|
|
|
|
|||||||||||||
Source: Huntingdon Valley Bank’s prospectus.
EXHIBIT I-14
Huntingdon Valley Bank
Maturity of Jumbo Time Deposits
Exhibit I-14
Huntingdon Valley Bank
Maturity of Jumbo Time Deposits
| At June 30, 2016 |
||||
| (In thousands) | ||||
| Three months or less |
$ | 2,745 | ||
| Over three months through six months |
1,384 | |||
| Over six months through one year |
8,180 | |||
| Over one year to three years |
4,673 | |||
| Over three years |
1,535 | |||
|
|
|
|||
| Total |
$ | 18,517 | ||
|
|
|
|||
Source: Huntingdon Valley Bank’s prospectus.
EXHIBIT I-15
Huntingdon Valley Bank
Borrowing Activity
Exhibit I-15
Huntingdon Valley Bank
Borrowing Activity
The following table sets forth information concerning balances and interest rates on our Federal Home Loan Bank advances at and for the periods shown:
| At or For the Years Ended June 30, |
||||||||
| 2016 | 2015 | |||||||
| (Dollars in thousands) | ||||||||
| Balance at end of year |
$ | 20,000 | $ | 7,000 | ||||
| Average balance during year |
$ | 8,863 | $ | 7,000 | ||||
| Maximum outstanding at any month end |
$ | 20,000 | $ | 7,000 | ||||
| Weighted average interest rate at end of year |
0.86 | % | 0.78 | % | ||||
| Weighted average interest rate during year |
1.06 | % | 0.52 | % | ||||
We have also entered into overnight repurchase agreements, which are collateralized by mortgage-backed securities and collateralized mortgage obligations. The following table sets forth information concerning balances and interest rates on our securities sold under agreements to repurchase at and for the periods shown:
| At or For the Years Ended June 30, |
||||||||
| 2016 | 2015 | |||||||
| (Dollars in thousands) | ||||||||
| Balance at end of year |
$ | 3,929 | $ | 3,502 | ||||
| Average balance during year |
$ | 1,998 | $ | 2,854 | ||||
| Maximum outstanding at any month end |
$ | 3,929 | $ | 4,688 | ||||
| Weighted average interest rate at end of year |
0.08 | % | 0.16 | % | ||||
| Weighted average interest rate during year |
0.15 | % | 0.14 | % | ||||
Source: Huntingdon Valley Bank’s prospectus.
EXHIBIT II-1
Huntingdon Valley Bank
Description of Office Properties
Exhibit II-1
Huntingdon Valley Bank
Description of Office Properties
| Location |
Leased or Owner | Year Acquired or Leased | Net Book Value of Real Property |
|||||||||
| Administrative Offices: |
||||||||||||
| Executive Office: 3501 Masons Mill Road Suite 401 Huntingdon Valley, PA 19006 |
Leased | 2011 | $ | 2 | ||||||||
| Mortgage Production Office: 1388 W. Street Road Warminster, PA 18974 |
Leased | 2010 | 60 | |||||||||
| Mortgage Origination Office: 539 Bethlehem Pike Montgomeryville, PA 18936 |
Leased | 2013 | — | |||||||||
| Banking Offices: |
||||||||||||
| Main Office: 2617 Huntingdon Pike Huntingdon Valley, PA 19006 |
Leased | 2006 | 2 | |||||||||
| Plumsteadville: 5725 Easton Road Plumsteadville, PA 18949 |
Owned | 2002 | 1,181 | |||||||||
| Warrington Plaza Shopping Center: Route 611 & Street Road Warrington, PA 18976 |
Leased | 1994 | 20 | |||||||||
| Justa Farm Shopping Center: 1990 County Line Road Huntingdon Valley, PA 19006 |
Leased | 1995 | 98 | |||||||||
| Limited Service Office: 8580 Verree Road Philadelphia, PA 19111 |
Leased | 2007 | — | |||||||||
Source: Huntingdon Valley Bank’s prospectus.
EXHIBIT II-2
Historical Interest Rates
Exhibit II-2
Historical Interest Rates(1)
| Prime | 90 Day | One Year | 10 Year | |||||||||||||||
| Year/Qtr. Ended |
Rate | T-Note | T-Note | T-Note | ||||||||||||||
| 2004: |
Quarter 1 | 4.00 | % | 0.95 | % | 1.20 | % | 3.86 | % | |||||||||
| Quarter 2 | 4.00 | % | 1.33 | % | 2.09 | % | 4.62 | % | ||||||||||
| Quarter 3 | 4.75 | % | 1.70 | % | 2.16 | % | 4.12 | % | ||||||||||
| Quarter 4 | 5.25 | % | 2.22 | % | 2.75 | % | 4.24 | % | ||||||||||
| 2005: |
Quarter 1 | 5.75 | % | 2.80 | % | 3.43 | % | 4.51 | % | |||||||||
| Quarter 2 | 6.00 | % | 3.12 | % | 3.51 | % | 3.98 | % | ||||||||||
| Quarter 3 | 6.75 | % | 3.55 | % | 4.01 | % | 4.34 | % | ||||||||||
| Quarter 4 | 7.25 | % | 4.08 | % | 4.38 | % | 4.39 | % | ||||||||||
| 2006: |
Quarter 1 | 7.75 | % | 4.63 | % | 4.82 | % | 4.86 | % | |||||||||
| Quarter 2 | 8.25 | % | 5.01 | % | 5.21 | % | 5.15 | % | ||||||||||
| Quarter 3 | 8.25 | % | 4.88 | % | 4.91 | % | 4.64 | % | ||||||||||
| Quarter 4 | 8.25 | % | 5.02 | % | 5.00 | % | 4.71 | % | ||||||||||
| 2007: |
Quarter 1 | 8.25 | % | 5.04 | % | 4.90 | % | 4.65 | % | |||||||||
| Quarter 2 | 8.25 | % | 4.82 | % | 4.91 | % | 5.03 | % | ||||||||||
| Quarter 3 | 7.75 | % | 3.82 | % | 4.05 | % | 4.59 | % | ||||||||||
| Quarter 4 | 7.25 | % | 3.36 | % | 3.34 | % | 3.91 | % | ||||||||||
| 2008: |
Quarter 1 | 5.25 | % | 1.38 | % | 1.55 | % | 3.45 | % | |||||||||
| Quarter 2 | 5.00 | % | 1.90 | % | 2.36 | % | 3.99 | % | ||||||||||
| Quarter 3 | 5.00 | % | 0.92 | % | 1.78 | % | 3.85 | % | ||||||||||
| Quarter 4 | 3.25 | % | 0.11 | % | 0.37 | % | 2.25 | % | ||||||||||
| 2009: |
Quarter 1 | 3.25 | % | 0.21 | % | 0.57 | % | 2.71 | % | |||||||||
| Quarter 2 | 3.25 | % | 0.19 | % | 0.56 | % | 3.53 | % | ||||||||||
| Quarter 3 | 3.25 | % | 0.14 | % | 0.40 | % | 3.31 | % | ||||||||||
| Quarter 4 | 3.25 | % | 0.06 | % | 0.47 | % | 3.85 | % | ||||||||||
| 2010: |
Quarter 1 | 3.25 | % | 0.16 | % | 0.41 | % | 3.84 | % | |||||||||
| Quarter 2 | 3.25 | % | 0.18 | % | 0.32 | % | 2.97 | % | ||||||||||
| Quarter 3 | 3.25 | % | 0.18 | % | 0.32 | % | 2.97 | % | ||||||||||
| Quarter 4 | 3.25 | % | 0.12 | % | 0.29 | % | 3.30 | % | ||||||||||
| 2011: |
Quarter 1 | 3.25 | % | 0.09 | % | 0.30 | % | 3.47 | % | |||||||||
| Quarter 2 | 3.25 | % | 0.03 | % | 0.19 | % | 3.18 | % | ||||||||||
| Quarter 3 | 3.25 | % | 0.02 | % | 0.13 | % | 1.92 | % | ||||||||||
| Quarter 4 | 3.25 | % | 0.02 | % | 0.12 | % | 1.89 | % | ||||||||||
| 2012: |
Quarter 1 | 3.25 | % | 0.07 | % | 0.19 | % | 2.23 | % | |||||||||
| Quarter 2 | 3.25 | % | 0.09 | % | 0.21 | % | 1.67 | % | ||||||||||
| Quarter 3 | 3.25 | % | 0.10 | % | 0.17 | % | 1.65 | % | ||||||||||
| Quarter 4 | 3.25 | % | 0.05 | % | 0.16 | % | 1.78 | % | ||||||||||
| 2013: |
Quarter 1 | 3.25 | % | 0.07 | % | 0.14 | % | 1.87 | % | |||||||||
| Quarter 2 | 3.25 | % | 0.04 | % | 0.15 | % | 2.52 | % | ||||||||||
| Quarter 3 | 3.25 | % | 0.02 | % | 0.10 | % | 2.64 | % | ||||||||||
| Quarter 4 | 3.25 | % | 0.07 | % | 0.13 | % | 3.04 | % | ||||||||||
| 2014: |
Quarter 1 | 3.25 | % | 0.05 | % | 0.13 | % | 2.73 | % | |||||||||
| Quarter 2 | 3.25 | % | 0.04 | % | 0.11 | % | 2.53 | % | ||||||||||
| Quarter 3 | 3.25 | % | 0.02 | % | 0.13 | % | 2.52 | % | ||||||||||
| Quarter 4 | 3.25 | % | 0.04 | % | 0.25 | % | 2.17 | % | ||||||||||
| 2015: |
Quarter 1 | 3.25 | % | 0.03 | % | 0.26 | % | 1.94 | % | |||||||||
| Quarter 2 | 3.25 | % | 0.01 | % | 0.28 | % | 2.35 | % | ||||||||||
| Quarter 3 | 3.25 | % | 0.00 | % | 0.33 | % | 2.06 | % | ||||||||||
| Quarter 4 | 3.50 | % | 0.16 | % | 0.65 | % | 2.27 | % | ||||||||||
| 2016: |
Quarter 1 | 3.50 | % | 0.21 | % | 0.59 | % | 1.78 | % | |||||||||
| Quarter 2 | 3.50 | % | 0.26 | % | 0.45 | % | 1.49 | % | ||||||||||
| As of August 5, 2016 |
3.50 | % | 0.28 | % | 0.56 | % | 1.59 | % | ||||||||||
| (1) | End of period data. |
Sources: Federal Reserve and The Wall Street Journal.
EXHIBIT III-1
General Characteristics of Publicly-Traded Institutions
Exhibit III-1
Characteristics of Publicly-Traded Thrifts
August 5, 2016
| As of | ||||||||||||||||||||||||||||||
| August 5, 2016 | ||||||||||||||||||||||||||||||
| Total | Fiscal | Conv. | Stock | Market | ||||||||||||||||||||||||||
| Ticker |
Financial Institution |
Exchange | Region | City |
State | Assets | Offices | Mth End | Date | Price | Value | |||||||||||||||||||
| ($Mil) | ($) | ($Mil) | ||||||||||||||||||||||||||||
| ANCB |
Anchor Bancorp | NASDAQ | WE | Lacey | WA | 420 | 10 | Jun | 1/26/11 | 26.14 | 67 | |||||||||||||||||||
| ASBB |
ASB Bancorp, Inc. | NASDAQ | SE | Asheville | NC | 784 | 13 | Dec | 10/12/11 | 24.90 | 94 | |||||||||||||||||||
| ACFC |
Atlantic Coast Financial Corporation | NASDAQ | SE | Jacksonville | FL | 893 | 12 | Dec | 2/4/11 | 6.00 | 93 | |||||||||||||||||||
| BKMU |
Bank Mutual Corporation | NASDAQ | MW | Milwaukee | WI | 2,533 | 66 | Dec | 10/30/03 | 7.68 | 350 | |||||||||||||||||||
| BFIN |
BankFinancial Corporation | NASDAQ | MW | Burr Ridge | IL | 1,512 | 20 | Dec | 6/24/05 | 12.21 | 239 | |||||||||||||||||||
| BYBK |
Bay Bancorp, Inc. | NASDAQ | MA | Columbia | MD | 463 | 15 | Dec | 1/0/00 | 5.09 | 56 | |||||||||||||||||||
| BNCL |
Beneficial Bancorp, Inc. | NASDAQ | MA | Philadelphia | PA | 4,815 | 69 | Dec | 1/13/15 | 14.34 | 1,106 | |||||||||||||||||||
| BHBK |
Blue Hills Bancorp, Inc. | NASDAQ | NE | Norwood | MA | 2,162 | 11 | Dec | 7/22/14 | 14.03 | 384 | |||||||||||||||||||
| BOFI |
BofI Holding, Inc. | NASDAQ | WE | San Diego | CA | 7,706 | 2 | Jun | 3/14/05 | 17.94 | 1,134 | |||||||||||||||||||
| BYFC |
Broadway Financial Corporation | NASDAQ | WE | Los Angeles | CA | 387 | 3 | Dec | 1/9/96 | 1.79 | 52 | |||||||||||||||||||
| BLMT |
BSB Bancorp, Inc. | NASDAQ | NE | Belmont | MA | 1,916 | 7 | Dec | 10/5/11 | 23.08 | 210 | |||||||||||||||||||
| CFFN |
Capitol Federal Financial, Inc. | NASDAQ | MW | Topeka | KS | 9,317 | 47 | Sep | 12/22/10 | 14.23 | 1,953 | |||||||||||||||||||
| CARV |
Carver Bancorp, Inc. | NASDAQ | MA | New York | NY | NA | 9 | Mar | 10/25/94 | 4.46 | 16 | |||||||||||||||||||
| CFBK |
Central Federal Corporation | NASDAQ | MW | Worthington | OH | 353 | 5 | Dec | 12/30/98 | 1.36 | 22 | |||||||||||||||||||
| CHFN |
Charter Financial Corporation | NASDAQ | SE | West Point | GA | 1,051 | 21 | Sep | 4/9/13 | 13.39 | 201 | |||||||||||||||||||
| CSBK |
Clifton Bancorp Inc. | NASDAQ | MA | Clifton | NJ | 1,253 | 12 | Mar | 4/2/14 | 14.89 | 351 | |||||||||||||||||||
| CWAY |
Coastway Bancorp, Inc. | NASDAQ | NE | Warwick | RI | 573 | 11 | Dec | 1/15/14 | 12.60 | 56 | |||||||||||||||||||
| DCOM |
Dime Community Bancshares, Inc. | NASDAQ | MA | Brooklyn | NY | 5,517 | 25 | Dec | 6/26/96 | 17.42 | 656 | |||||||||||||||||||
| ESBK |
Elmira Savings Bank | NASDAQ | MA | Elmira | NY | 560 | 13 | Dec | 3/1/85 | 19.30 | 53 | |||||||||||||||||||
| ENFC |
Entegra Financial Corp. | NASDAQ | SE | Franklin | NC | 1,055 | 16 | Dec | 10/1/14 | 17.55 | 113 | |||||||||||||||||||
| EQFN |
Equitable Financial Corp. | NASDAQ | MW | Grand Island | NE | 234 | 6 | Jun | 7/9/15 | 8.49 | 30 | |||||||||||||||||||
| ESSA |
ESSA Bancorp, Inc. | NASDAQ | MA | Stroudsburg | PA | 1,763 | 27 | Sep | 4/4/07 | 14.00 | 159 | |||||||||||||||||||
| FCAP |
First Capital, Inc. | NASDAQ | MW | Corydon | IN | 736 | 17 | Dec | 1/4/99 | 33.68 | 112 | |||||||||||||||||||
| FBNK |
First Connecticut Bancorp, Inc. | NASDAQ | NE | Farmington | CT | 2,702 | 27 | Dec | 6/30/11 | 16.39 | 259 | |||||||||||||||||||
| FDEF |
First Defiance Financial Corp. | NASDAQ | MW | Defiance | OH | 2,359 | 34 | Dec | 10/2/95 | 43.11 | 387 | |||||||||||||||||||
| FNWB |
First Northwest Bancorp | NASDAQ | WE | Port Angeles | WA | 995 | 10 | Jun | 1/30/15 | 13.21 | 167 | |||||||||||||||||||
| FBC |
Flagstar Bancorp, Inc. | NYSE | MW | Troy | MI | 13,737 | 99 | Dec | 4/30/97 | 27.31 | 1,545 | |||||||||||||||||||
| FSBW |
FS Bancorp, Inc. | NASDAQ | WE | Mountlake Terrace | WA | 805 | 12 | Dec | 7/10/12 | 27.80 | 85 | |||||||||||||||||||
| FSBC |
FSB Bancorp, Inc. | NASDAQ | MA | Fairport | NY | 258 | 5 | Dec | 7/14/16 | 12.40 | 24 | |||||||||||||||||||
| GTWN |
Georgetown Bancorp, Inc. | NASDAQ | NE | Georgetown | MA | 306 | 4 | Dec | 7/12/12 | 20.45 | 38 | |||||||||||||||||||
| HBK |
Hamilton Bancorp, Inc. | NASDAQ | MA | Towson | MD | 393 | 7 | Mar | 10/10/12 | 13.75 | 47 | |||||||||||||||||||
| HIFS |
Hingham Institution for Savings | NASDAQ | NE | Hingham | MA | 1,850 | 13 | Dec | 12/20/88 | 133.90 | 285 | |||||||||||||||||||
| HMNF |
HMN Financial, Inc. | NASDAQ | MW | Rochester | MN | 638 | 13 | Dec | 6/30/94 | 14.22 | 64 | |||||||||||||||||||
| HFBL |
Home Federal Bancorp, Inc. of Louisiana | NASDAQ | SW | Shreveport | LA | 363 | 7 | Jun | 12/22/10 | 23.15 | 46 | |||||||||||||||||||
| IROQ |
IF Bancorp, Inc. | NASDAQ | MW | Watseka | IL | 584 | 6 | Jun | 7/8/11 | 18.91 | 76 | |||||||||||||||||||
| ISBC |
Investors Bancorp, Inc. | NASDAQ | MA | Short Hills | NJ | 21,190 | 148 | Dec | 5/8/14 | 11.35 | 3,558 | |||||||||||||||||||
| JXSB |
Jacksonville Bancorp, Inc. | NASDAQ | MW | Jacksonville | IL | 302 | 6 | Dec | 7/15/10 | 28.36 | 51 | |||||||||||||||||||
| KRNY |
Kearny Financial Corp. | NASDAQ | MA | Fairfield | NJ | 4,486 | 42 | Jun | 5/19/15 | 13.05 | 1,198 | |||||||||||||||||||
| MLVF |
Malvern Bancorp, Inc. | NASDAQ | MA | Paoli | PA | 764 | 9 | Sep | 10/12/12 | 15.99 | 105 | |||||||||||||||||||
| MELR |
Melrose Bancorp, Inc. | NASDAQ | NE | Melrose | MA | 241 | 1 | Dec | 10/22/14 | 15.50 | 42 | |||||||||||||||||||
| EBSB |
Meridian Bancorp, Inc. | NASDAQ | NE | Peabody | MA | 3,729 | 31 | Dec | 7/29/14 | 15.22 | 817 | |||||||||||||||||||
| CASH |
Meta Financial Group, Inc. | NASDAQ | MW | Sioux Falls | SD | 3,072 | 11 | Sep | 9/20/93 | 56.26 | 480 | |||||||||||||||||||
| MSBF |
MSB Financial Corp. | NASDAQ | MA | Millington | NJ | 380 | 5 | Dec | 7/17/15 | 13.14 | 78 | |||||||||||||||||||
| NYCB |
New York Community Bancorp, Inc. | NYSE | MA | Westbury | NY | 48,516 | 263 | Dec | 11/23/93 | 14.50 | 7,062 | |||||||||||||||||||
| NFBK |
Northfield Bancorp, Inc. | NASDAQ | MA | Woodbridge | NJ | 3,673 | 39 | Dec | 1/25/13 | 15.43 | 746 | |||||||||||||||||||
| NWBI |
Northwest Bancshares, Inc. | NASDAQ | MA | Warren | PA | 8,916 | 160 | Dec | 12/18/09 | 15.10 | 1,538 | |||||||||||||||||||
| OCFC |
OceanFirst Financial Corp. | NASDAQ | MA | Toms River | NJ | 2,588 | 51 | Dec | 7/3/96 | 18.86 | 486 | |||||||||||||||||||
| ORIT |
Oritani Financial Corp. | NASDAQ | MA | Township of Washington | NJ | 3,603 | 27 | Jun | 6/24/10 | 16.29 | 737 | |||||||||||||||||||
| PBHC |
Pathfinder Bancorp, Inc. | NASDAQ | MA | Oswego | NY | 665 | 18 | Dec | 10/17/14 | 12.10 | 53 | |||||||||||||||||||
| PBBI |
PB Bancorp, Inc. | NASDAQ | NE | Putnam | CT | 498 | 8 | Jun | 1/8/16 | 8.52 | 67 | |||||||||||||||||||
| PBSK |
Poage Bankshares, Inc. | NASDAQ | MW | Ashland | KY | 436 | 10 | Dec | 9/13/11 | 18.25 | 70 | |||||||||||||||||||
Exhibit III-1
Characteristics of Publicly-Traded Thrifts
August 5, 2016
| As of | ||||||||||||||||||||||||||||||
| August 5, 2016 | ||||||||||||||||||||||||||||||
| Total | Fiscal | Conv. | Stock | Market | ||||||||||||||||||||||||||
| Ticker |
Financial Institution |
Exchange | Region | City |
State | Assets | Offices | Mth End | Date | Price | Value | |||||||||||||||||||
| ($Mil) | ($) | ($Mil) | ||||||||||||||||||||||||||||
| PROV |
Provident Financial Holdings, Inc. | NASDAQ | WE | Riverside | CA | 1,174 | 14 | Jun | 6/28/96 | 19.40 | 155 | |||||||||||||||||||
| PFS |
Provident Financial Services, Inc. | NYSE | MA | Iselin | NJ | 9,026 | 89 | Dec | 1/16/03 | 20.65 | 1,359 | |||||||||||||||||||
| PBIP |
Prudential Bancorp, Inc. | NASDAQ | MA | Philadelphia | PA | 538 | 6 | Sep | 10/10/13 | 14.28 | 115 | |||||||||||||||||||
| RNDB |
Randolph Bancorp, Inc. | NASDAQ | NE | Stoughton | MA | 390 | 6 | Dec | 7/1/16 | 12.79 | 75 | |||||||||||||||||||
| RVSB |
Riverview Bancorp, Inc. | NASDAQ | WE | Vancouver | WA | 921 | 17 | Mar | 10/1/97 | 4.85 | 109 | |||||||||||||||||||
| SVBI |
Severn Bancorp, Inc. | NASDAQ | MA | Annapolis | MD | 765 | 4 | Dec | 1/0/00 | 6.47 | 78 | |||||||||||||||||||
| SIFI |
SI Financial Group, Inc. | NASDAQ | NE | Willimantic | CT | 1,508 | 25 | Dec | 1/13/11 | 13.11 | 160 | |||||||||||||||||||
| SBCP |
Sunshine Bancorp, Inc. | NASDAQ | SE | Plant City | FL | 523 | 12 | Dec | 7/15/14 | 14.19 | 75 | |||||||||||||||||||
| TBNK |
Territorial Bancorp Inc. | NASDAQ | WE | Honolulu | HI | 1,850 | 29 | Dec | 7/13/09 | 28.47 | 275 | |||||||||||||||||||
| TSBK |
Timberland Bancorp, Inc. | NASDAQ | WE | Hoquiam | WA | 852 | 22 | Sep | 1/13/98 | 15.50 | 108 | |||||||||||||||||||
| TRST |
TrustCo Bank Corp NY | NASDAQ | MA | Glenville | NY | 4,763 | 146 | Dec | 1/0/00 | 6.91 | 661 | |||||||||||||||||||
| UCBA |
United Community Bancorp | NASDAQ | MW | Lawrenceburg | IN | 518 | 8 | Jun | 1/10/13 | 15.00 | 63 | |||||||||||||||||||
| UCFC |
United Community Financial Corp. | NASDAQ | MW | Youngstown | OH | 2,036 | 31 | Dec | 7/9/98 | 6.83 | 318 | |||||||||||||||||||
| UBNK |
United Financial Bancorp, Inc. | NASDAQ | NE | Glastonbury | CT | 6,319 | 54 | Dec | 3/4/11 | 13.49 | 678 | |||||||||||||||||||
| WSBF |
Waterstone Financial, Inc. | NASDAQ | MW | Wauwatosa | WI | 1,738 | 13 | Dec | 1/23/14 | 15.75 | 459 | |||||||||||||||||||
| WAYN |
Wayne Savings Bancshares, Inc. | NASDAQ | MW | Wooster | OH | 438 | 12 | Dec | 1/9/03 | 13.17 | 37 | |||||||||||||||||||
| WCFB |
WCF Bancorp, Inc. | NASDAQ | MW | Webster City | IA | NA | 2 | Dec | 7/14/16 | 8.60 | 22 | |||||||||||||||||||
| WEBK |
Wellesley Bancorp, Inc. | NASDAQ | NE | Wellesley | MA | 620 | 6 | Dec | 1/26/12 | 21.15 | 52 | |||||||||||||||||||
| WBB |
Westbury Bancorp, Inc. | NASDAQ | MW | West Bend | WI | 655 | 8 | Sep | 4/10/13 | 19.40 | 80 | |||||||||||||||||||
| WFD |
Westfield Financial, Inc. | NASDAQ | NE | Westfield | MA | 1,369 | 14 | Dec | 1/4/07 | 7.58 | 139 | |||||||||||||||||||
| WBKC |
Wolverine Bancorp, Inc. | NASDAQ | MW | Midland | MI | 386 | 3 | Dec | 1/20/11 | 25.95 | 56 | |||||||||||||||||||
| WSFS |
WSFS Financial Corporation | NASDAQ | MA | Wilmington | DE | 5,686 | 53 | Dec | 11/26/86 | 36.24 | 1,071 | |||||||||||||||||||
| WVFC |
WVS Financial Corp. | NASDAQ | MA | Pittsburgh | PA | 338 | 6 | Jun | 11/29/93 | 11.90 | 24 | |||||||||||||||||||
| GCBC |
Greene County Bancorp, Inc. (MHC) | NASDAQ | MA | Catskill | NY | 851 | 15 | Jun | 12/30/98 | 17.05 | 145 | |||||||||||||||||||
| HONE |
HarborOne Bancorp, Inc. (MHC) | NASDAQ | NE | Brockton | MA | 2,245 | 17 | Dec | 6/30/16 | 14.07 | 452 | |||||||||||||||||||
| KFFB |
Kentucky First Federal Bancorp (MHC) | NASDAQ | MW | Frankfort | KY | 294 | 7 | Jun | 3/3/05 | 8.21 | 69 | |||||||||||||||||||
| LSBK |
Lake Shore Bancorp, Inc. (MHC) | NASDAQ | MA | Dunkirk | NY | 474 | 11 | Dec | 4/4/06 | 13.58 | 82 | |||||||||||||||||||
| MGYR |
Magyar Bancorp, Inc. (MHC) | NASDAQ | MA | New Brunswick | NJ | 562 | 6 | Sep | 1/24/06 | 9.76 | 57 | |||||||||||||||||||
| OFED |
Oconee Federal Financial Corp. (MHC) | NASDAQ | SE | Seneca | SC | 483 | 7 | Jun | 1/14/11 | 19.30 | 113 | |||||||||||||||||||
| PVBC |
Provident Bancorp, Inc. (MHC) | NASDAQ | NE | Amesbury | MA | 737 | 8 | Dec | 7/16/15 | 15.88 | 151 | |||||||||||||||||||
| TFSL |
TFS Financial Corporation (MHC) | NASDAQ | MW | Cleveland | OH | 12,467 | 38 | Sep | 4/23/07 | 18.40 | 5,250 | |||||||||||||||||||
Source: SNL Financial, LC.
EXHIBIT III-2
Public Market Pricing of Mid-Atlantic Thrift Institutions
Exhibit III-2
Mid-Atlantic Public Market Pricing
As of August 5, 2016
| Market | Per Share Data | |||||||||||||||||||||||||||||||||||||||||||||||||||||||||||||||||||||||||||||||||||||
| Capitalization | Core | Book | Dividends(3) | Financial Characteristics(5) | ||||||||||||||||||||||||||||||||||||||||||||||||||||||||||||||||||||||||||||||||||
| Price/ | Market | 12 Month | Value/ | Pricing Ratios(2) | Amount/ | Payout | Total | Equity/ | Tang. Eq./ | NPAs/ | Reported | Core | ||||||||||||||||||||||||||||||||||||||||||||||||||||||||||||||||||||||||||
| Share | Value | EPS(1) | Share | P/E | P/B | P/A | P/TB | P/Core | Share | Yield | Ratio(4) | Assets | Assets | T. Assets | Assets | ROAA | ROAE | ROAA | ROAE | |||||||||||||||||||||||||||||||||||||||||||||||||||||||||||||||||||
| ($) | ($Mil) | ($) | ($) | (x) | (%) | (%) | (%) | (x) | ($) | (%) | (%) | ($Mil) | (%) | (%) | (%) | (%) | (%) | (%) | (%) | |||||||||||||||||||||||||||||||||||||||||||||||||||||||||||||||||||
| All Non-MHC Public Companies(6) |
|
|||||||||||||||||||||||||||||||||||||||||||||||||||||||||||||||||||||||||||||||||||||
| Averages |
|
$ | 17.96 | $ | 481.41 | $ | 1.02 | $ | 15.55 | 22.53x | 112.00 | % | 13.91 | % | 120.99 | % | 32.47x | $ | 0.30 | 1.69 | % | 47.44 | % | $ | 3,337 | 12.74 | % | 12.07 | % | 1.13 | % | 0.69 | % | 5.90 | % | 0.71 | % | 5.93 | % | |||||||||||||||||||||||||||||||||||||||||||||||
| Median |
|
$ | 14.89 | $ | 113.48 | $ | 0.75 | $ | 13.84 | 18.86x | 108.39 | % | 13.21 | % | 115.73 | % | 19.70x | $ | 0.24 | 1.61 | % | 37.68 | % | $ | 932 | 11.79 | % | 11.32 | % | 0.92 | % | 0.62 | % | 5.50 | % | 0.72 | % | 5.58 | % | |||||||||||||||||||||||||||||||||||||||||||||||
| Comparable Group |
|
|||||||||||||||||||||||||||||||||||||||||||||||||||||||||||||||||||||||||||||||||||||
| Averages |
|
$ | 14.31 | $ | 853.42 | $ | 0.69 | $ | 12.81 | 19.34x | 1.14 | 0.15 | 1.29 | 17.07x | $ | 0.32 | 2.01 | % | 60.14 | % | $ | 5,434 | 13.55 | % | 12.69 | % | 1.53 | % | 0.62 | % | 5.19 | % | 0.69 | % | 5.56 | % | ||||||||||||||||||||||||||||||||||||||||||||||||||
| Medians |
$ | 14.28 | $ | 351.05 | $ | 0.62 | $ | 13.17 | 17.24x | 1.13 | 0.14 | 1.21 | 16.84x | $ | 0.24 | 1.67 | % | 52.00 | % | $ | 1,767 | 12.42 | % | 10.18 | % | 1.08 | % | 0.50 | % | 3.83 | % | 0.70 | % | 5.42 | % | |||||||||||||||||||||||||||||||||||||||||||||||||||
| Comparable Group |
|
|||||||||||||||||||||||||||||||||||||||||||||||||||||||||||||||||||||||||||||||||||||
| BYBK |
Bay Bancorp, Inc. | MD | $ | 5.09 | $ | 55.57 | $ | 0.18 | $ | 6.18 | 31.81x | 82.33 | % | 11.21 | % | 85.21 | % | 29.00x | $ | 0.00 | 0.00 | % | NA | $ | 496 | 13.62 | % | 13.22 | % | NA | 0.35 | % | 2.51 | % | 0.39 | % | 2.76 | % | ||||||||||||||||||||||||||||||||||||||||||||||||
| BNCL |
Beneficial Bancorp, Inc. | PA | $ | 14.34 | $ | 1,106.19 | $ | 0.35 | $ | 13.31 | NM | 107.73 | % | 20.05 | % | 129.85 | % | NM | $ | 0.24 | 1.67 | % | 25.00 | % | $ | 5,514 | 18.61 | % | 15.95 | % | NA | 0.37 | % | 1.70 | % | 0.53 | % | 2.43 | % | |||||||||||||||||||||||||||||||||||||||||||||||
| CARV |
Carver Bancorp, Inc. | NY | $ | 4.46 | $ | 16.48 | ($ | 0.11 | ) | $ | 2.69 | 44.60x | 165.72 | % | 2.32 | % | 165.72 | % | NM | $ | 0.00 | 0.00 | % | NA | $ | 754 | 7.30 | % | 7.30 | % | 2.54 | % | 0.05 | % | 0.59 | % | -0.07 | % | -0.84 | % | ||||||||||||||||||||||||||||||||||||||||||||||
| CSBK |
Clifton Bancorp Inc. | NJ | $ | 14.89 | $ | 351.05 | $ | 0.19 | $ | 13.13 | NM | 113.43 | % | 27.30 | % | 113.43 | % | NM | $ | 0.24 | 1.61 | % | 126.32 | % | $ | 1,286 | 24.07 | % | 24.07 | % | NA | 0.40 | % | 1.45 | % | 0.39 | % | 1.43 | % | |||||||||||||||||||||||||||||||||||||||||||||||
| DCOM |
Dime Community Bancshares, Inc. | NY | $ | 17.42 | $ | 655.95 | NA | $ | 14.60 | 7.74x | 119.35 | % | 11.81 | % | 132.79 | % | NA | $ | 0.56 | 3.21 | % | 24.89 | % | $ | 5,556 | 9.89 | % | 8.98 | % | 0.26 | % | 1.63 | % | 16.36 | % | NA | NA | |||||||||||||||||||||||||||||||||||||||||||||||||
| ESBK |
Elmira Savings Bank | NY | $ | 19.30 | $ | 52.77 | $ | 1.17 | $ | 16.69 | 16.08x | 115.65 | % | 9.34 | % | 158.62 | % | 16.53x | $ | 0.92 | 4.77 | % | 76.67 | % | $ | 575 | 9.64 | % | 7.65 | % | NA | 0.74 | % | 7.57 | % | 0.72 | % | 7.44 | % | |||||||||||||||||||||||||||||||||||||||||||||||
| ESSA |
ESSA Bancorp, Inc. | PA | $ | 14.00 | $ | 159.39 | $ | 0.82 | $ | 15.59 | 17.28x | 89.82 | % | 9.02 | % | 99.01 | % | 17.14x | $ | 0.36 | 2.57 | % | 44.44 | % | $ | 1,767 | 10.04 | % | 9.20 | % | NA | 0.50 | % | 4.89 | % | 0.51 | % | 4.92 | % | |||||||||||||||||||||||||||||||||||||||||||||||
| FSBC |
FSB Bancorp, Inc. | NY | $ | 12.40 | $ | 24.08 | NA | NA | NM | 109.05 | % | NA | 109.05 | % | NA | NA | NA | NA | $ | 280 | 7.93 | % | 7.93 | % | NA | 0.23 | % | 2.67 | % | NA | NA | |||||||||||||||||||||||||||||||||||||||||||||||||||||||
| HBK |
Hamilton Bancorp, Inc. | MD | $ | 13.75 | $ | 46.94 | $ | 0.06 | $ | 18.06 | NM | 76.12 | % | 8.98 | % | 92.02 | % | NM | NA | NA | NA | $ | 523 | 11.80 | % | 9.96 | % | NA | -0.14 | % | -0.90 | % | 0.04 | % | 0.25 | % | ||||||||||||||||||||||||||||||||||||||||||||||||||
| ISBC |
Investors Bancorp, Inc. | NJ | $ | 11.35 | $ | 3,557.93 | $ | 0.58 | $ | 9.99 | 19.57x | 113.59 | % | 16.38 | % | 117.39 | % | 19.69x | $ | 0.24 | 2.11 | % | 39.66 | % | $ | 21,718 | 14.42 | % | NA | 0.53 | % | 0.87 | % | 5.50 | % | 0.86 | % | 5.42 | % | |||||||||||||||||||||||||||||||||||||||||||||||
| KRNY |
Kearny Financial Corp. | NJ | $ | 13.05 | $ | 1,198.28 | $ | 0.18 | $ | 12.50 | NM | 104.41 | % | 26.63 | % | 115.37 | % | NM | $ | 0.08 | 0.61 | % | 44.44 | % | $ | 4,500 | 25.50 | % | 23.65 | % | NA | 0.36 | % | 1.36 | % | 0.36 | % | 1.37 | % | |||||||||||||||||||||||||||||||||||||||||||||||
| MLVF |
Malvern Bancorp, Inc. | PA | $ | 15.99 | $ | 104.91 | $ | 0.79 | $ | 13.21 | 19.04x | 121.07 | % | 13.17 | % | 121.07 | % | 20.26x | $ | 0.11 | 0.00 | % | NA | $ | 796 | 10.88 | % | 10.88 | % | 0.46 | % | 0.75 | % | 6.45 | % | 0.70 | % | 6.06 | % | |||||||||||||||||||||||||||||||||||||||||||||||
| MSBF |
MSB Financial Corp. | NJ | $ | 13.14 | $ | 78.22 | $ | 0.11 | $ | 12.66 | NM | 103.77 | % | 19.76 | % | 103.77 | % | NM | $ | 0.00 | 0.00 | % | NA | $ | 396 | 19.04 | % | 19.04 | % | NA | 0.17 | % | 0.89 | % | 0.26 | % | 1.35 | % | ||||||||||||||||||||||||||||||||||||||||||||||||
| NYCB |
New York Community Bancorp, Inc. | NY | $ | 14.50 | $ | 7,061.64 | $ | 1.19 | $ | 12.40 | NM | 116.93 | % | 14.40 | % | 196.06 | % | 12.15x | $ | 0.68 | 4.69 | % | NA | $ | 49,036 | 12.32 | % | 7.73 | % | NA | -0.07 | % | -0.57 | % | 1.14 | % | 9.47 | % | ||||||||||||||||||||||||||||||||||||||||||||||||
| NFBK |
Northfield Bancorp, Inc. | NJ | $ | 15.43 | $ | 745.61 | NA | $ | 12.73 | 32.83x | 121.17 | % | 19.93 | % | 129.68 | % | NA | $ | 0.32 | 2.07 | % | 63.83 | % | $ | 3,741 | 16.45 | % | 15.53 | % | 0.91 | % | 0.61 | % | 3.58 | % | NA | NA | |||||||||||||||||||||||||||||||||||||||||||||||||
| NWBI |
Northwest Bancshares, Inc. | PA | $ | 15.10 | $ | 1,537.91 | $ | 0.74 | $ | 11.28 | NM | 133.92 | % | 17.26 | % | 174.80 | % | 20.51x | $ | 0.60 | 3.97 | % | 147.50 | % | $ | 8,964 | 12.89 | % | 10.18 | % | 1.25 | % | 0.45 | % | 3.48 | % | 0.83 | % | 6.40 | % | ||||||||||||||||||||||||||||||||||||||||||||||
| OCFC |
OceanFirst Financial Corp. | NJ | $ | 18.86 | $ | 485.62 | $ | 1.34 | $ | 15.89 | 18.86x | 118.66 | % | 12.00 | % | 143.57 | % | 14.09x | $ | 0.52 | 2.76 | % | 52.00 | % | $ | 4,047 | 10.11 | % | 8.51 | % | 1.32 | % | 0.63 | % | 6.47 | % | 0.87 | % | 9.01 | % | ||||||||||||||||||||||||||||||||||||||||||||||
| ORIT |
Oritani Financial Corp. | NJ | $ | 16.29 | $ | 737.08 | $ | 0.90 | $ | 11.83 | 13.46x | 137.72 | % | 20.09 | % | 137.72 | % | 18.08x | $ | 0.70 | 4.30 | % | 99.17 | % | $ | 3,669 | 14.59 | % | 14.59 | % | NA | 1.50 | % | 9.92 | % | 1.12 | % | 7.38 | % | |||||||||||||||||||||||||||||||||||||||||||||||
| PBHC |
Pathfinder Bancorp, Inc. | NY | $ | 12.10 | $ | 52.73 | $ | 0.62 | $ | 13.70 | 16.58x | 88.35 | % | NA | 95.97 | % | 19.63x | $ | 0.20 | 1.65 | % | 27.40 | % | $ | 671 | NA | NA | NA | 0.50 | % | NA | 0.43 | % | 4.10 | % | |||||||||||||||||||||||||||||||||||||||||||||||||||
| PFS |
Provident Financial Services, Inc. | NJ | $ | 20.65 | $ | 1,359.05 | $ | 1.37 | $ | 18.68 | 15.41x | 110.53 | % | 14.73 | % | 171.87 | % | 15.09x | $ | 0.72 | 3.49 | % | 52.24 | % | $ | 9,227 | 13.33 | % | NA | NA | 0.95 | % | 7.02 | % | 0.95 | % | 7.02 | % | ||||||||||||||||||||||||||||||||||||||||||||||||
| PBIP |
Prudential Bancorp, Inc. | PA | $ | 14.28 | $ | 115.11 | $ | 0.10 | $ | 13.93 | NM | 102.48 | % | 21.41 | % | 102.48 | % | NM | $ | 0.12 | 0.84 | % | 92.31 | % | $ | 538 | 20.90 | % | 20.90 | % | 3.27 | % | 0.20 | % | 0.85 | % | 0.17 | % | 0.71 | % | ||||||||||||||||||||||||||||||||||||||||||||||
| SVBI |
Severn Bancorp, Inc. | MD | $ | 6.47 | $ | 78.16 | $ | 1.16 | $ | 6.86 | 5.58x | 94.31 | % | 10.05 | % | 94.70 | % | 5.58x | $ | 0.00 | 0.00 | % | NA | $ | 794 | 12.53 | % | 12.50 | % | 4.24 | % | 2.03 | % | 17.94 | % | 2.03 | % | 17.94 | % | |||||||||||||||||||||||||||||||||||||||||||||||
| TRST |
TrustCo Bank Corp NY | NY | $ | 6.91 | $ | 659.86 | $ | 0.43 | $ | 4.51 | 15.85x | 153.36 | % | 13.66 | % | 153.56 | % | 16.02x | $ | 0.26 | 3.80 | % | 60.21 | % | $ | 4,831 | 8.91 | % | 8.90 | % | NA | 0.88 | % | 10.00 | % | 0.87 | % | 9.90 | % | |||||||||||||||||||||||||||||||||||||||||||||||
| WSFS |
WSFS Financial Corporation | DE | $ | 36.24 | $ | 1,070.86 | $ | 2.39 | $ | 20.89 | 17.51x | 173.50 | % | 18.36 | % | 212.48 | % | 15.17x | $ | 0.24 | 0.66 | % | 11.59 | % | $ | 5,834 | 10.58 | % | NA | 0.54 | % | 1.13 | % | 10.82 | % | 1.29 | % | 12.33 | % | |||||||||||||||||||||||||||||||||||||||||||||||
| WVFC |
WVS Financial Corp. | PA | $ | 11.86 | $ | 24.19 | NA | $ | 16.22 | 17.19x | 73.12 | % | 7.21 | % | 73.12 | % | NA | $ | 0.16 | 1.35 | % | 34.78 | % | $ | 336 | 9.85 | % | 9.85 | % | NA | 0.40 | % | 4.08 | % | NA | NA | ||||||||||||||||||||||||||||||||||||||||||||||||||
| MHCs |
||||||||||||||||||||||||||||||||||||||||||||||||||||||||||||||||||||||||||||||||||||||
| GCBC |
Greene County Bancorp, Inc. (MHC) | NY | $ | 17.05 | $ | 144.51 | NA | $ | 8.77 | 16.08x | 194.49 | % | 16.63 | % | 194.49 | % | NA | $ | 0.38 | 2.06 | % | 35.14 | % | $ | 869 | 8.55 | % | 8.55 | % | NA | 1.12 | % | 12.67 | % | NA | NA | ||||||||||||||||||||||||||||||||||||||||||||||||||
| LSBK |
Lake Shore Bancorp, Inc. (MHC) | NY | $ | 13.58 | $ | 81.99 | NA | NA | 17.18x | 108.14 | % | NA | 108.14 | % | NA | $ | 0.28 | NA | 35.44 | % | $ | 480 | 16.05 | % | 16.05 | % | NA | 0.99 | % | 6.29 | % | NA | NA | |||||||||||||||||||||||||||||||||||||||||||||||||||||
| MGYR |
Magyar Bancorp, Inc. (MHC) | NJ | $ | 9.76 | $ | 56.81 | NA | $ | 8.16 | NM | 119.59 | % | 10.00 | % | 119.59 | % | NA | NA | 0.00 | % | NA | $ | 568 | 8.36 | % | 8.36 | % | NA | 0.19 | % | 2.26 | % | NA | NA | ||||||||||||||||||||||||||||||||||||||||||||||||||||
| Under Acquisition |
|
|||||||||||||||||||||||||||||||||||||||||||||||||||||||||||||||||||||||||||||||||||||
| AF |
Astoria Financial Corporation | NY | $ | 14.83 | $ | 1,502.89 | $ | 0.68 | $ | 15.45 | 22.82x | 96.00 | % | 10.10 | % | 108.88 | % | 21.96x | $ | 0.16 | 1.08 | % | 24.62 | % | $ | 15,017 | 11.29 | % | 10.18 | % | NA | 0.49 | % | 4.47 | % | 0.51 | % | 4.62 | % | |||||||||||||||||||||||||||||||||||||||||||||||
| OSHC |
Ocean Shore Holding Co. | NJ | $ | 21.93 | $ | 141.61 | $ | 1.12 | $ | 18.03 | 19.76x | 121.60 | % | 13.49 | % | 127.12 | % | 19.65x | $ | 0.24 | 1.09 | % | 21.62 | % | $ | 1,043 | 11.09 | % | 10.66 | % | 0.93 | % | 0.65 | % | 6.19 | % | 0.66 | % | 6.22 | % | ||||||||||||||||||||||||||||||||||||||||||||||
| (1) | Core income, on a diluted per-share basis. Core income is net income after taxes and before extraordinary items, less net income attributable to noncontrolling interest, gain on the sale of securities, amortization of intangibles, goodwill and nonrecurring items. Assumed tax rate is 35%. |
| (2) | P/E = Price to earnings; P/B = Price to book; P/A = Price to assets; P/TB = Price to tangible book value; and P/Core = Price to core earnings. P/E and P/Core =NM if the ratio is negative or above 35x. |
| (3) | Indicated 12 month dividend, based on last quarterly dividend declared. |
| (4) | Indicated 12 month dividend as a percent of trailing 12 month earnings. |
| (5) | ROAA (return on average assets) and ROAE (return on average equity) are indicated ratios based on trailing 12 month earnings and average equity and assets balances. |
| (6) | Excludes from averages and medians those companies the subject of actual or rumored acquisition activities or unusual operating characteristics. |
Source: SNL Financial, LC. and RP Financial, LC. calculations. The information provided in this report has been obtained from sources we believe are reliable, but we cannot guarantee the accuracy or completeness of such information.
Copyright (c) 2015 by RP® Financial, LC.
EXHIBIT III-3
Public Market Pricing of Midwest Thrift Institutions
Exhibit III-3
Public Market Pricing of Midwest Thrifts
As of August 5, 2016
| Market | Per Share Data | |||||||||||||||||||||||||||||||||||||||||||||||||||||||||||||||||||||||||||||||||||
| Capitalization | Core | Book | Dividends(3) | Financial Characteristics(5) | ||||||||||||||||||||||||||||||||||||||||||||||||||||||||||||||||||||||||||||||||
| Price/ | Market | 12 Month | Value/ | Pricing Ratios(2) | Amount/ | Payout | Total | Equity/ | Tang. Eq./ | NPAs/ | Reported | Core | ||||||||||||||||||||||||||||||||||||||||||||||||||||||||||||||||||||||||
| Share | Value | EPS(1) | Share | P/E | P/B | P/A | P/TB | P/Core | Share | Yield | Ratio(4) | Assets | Assets | T. Assets | Assets | ROAA | ROAE | ROAA | ROAE | |||||||||||||||||||||||||||||||||||||||||||||||||||||||||||||||||
| ($) | ($Mil) | ($) | ($) | (x) | (%) | (%) | (%) | (x) | ($) | (%) | (%) | ($Mil) | (%) | (%) | (%) | (%) | (%) | (%) | (%) | |||||||||||||||||||||||||||||||||||||||||||||||||||||||||||||||||
| All Non-MHC Public Companies(6) |
|
|||||||||||||||||||||||||||||||||||||||||||||||||||||||||||||||||||||||||||||||||||
| Averages |
$ | 17.96 | $ | 481.41 | $ | 1.02 | $ | 15.55 | 22.53x | 112.00 | % | 13.91 | % | 120.99 | % | 32.47x | $ | 0.30 | 1.69 | % | 47.44 | % | $ | 3,337 | 12.74 | % | 12.07 | % | 1.13 | % | 0.69 | % | 5.90 | % | 0.71 | % | 5.93 | % | ||||||||||||||||||||||||||||||||||||||||||||||
| Median |
$ | 14.89 | $ | 113.48 | $ | 0.75 | $ | 13.84 | 18.86x | 108.39 | % | 13.21 | % | 115.73 | % | 19.70x | $ | 0.24 | 1.61 | % | 37.68 | % | $ | 932 | 11.79 | % | 11.32 | % | 0.92 | % | 0.62 | % | 5.50 | % | 0.72 | % | 5.58 | % | ||||||||||||||||||||||||||||||||||||||||||||||
| Comparable Group |
||||||||||||||||||||||||||||||||||||||||||||||||||||||||||||||||||||||||||||||||||||
| Averages |
$ | 19.44 | $ | 320.55 | $ | 1.13 | $ | 16.81 | 18.61x | 111.33 | % | 14.39 | % | 116.94 | % | 18.97x | $ | 0.30 | 1.58 | % | 51.07 | % | $ | 2,099 | 13.38 | % | 13.03 | % | 1.02 | % | 0.82 | % | 6.44 | % | 0.80 | % | 6.35 | % | ||||||||||||||||||||||||||||||||||||||||||||||
| Medians |
$ | 15.38 | $ | 77.71 | $ | 0.79 | $ | 16.34 | 17.82x | 110.64 | % | 14.47 | % | 113.95 | % | 18.81x | $ | 0.24 | 1.75 | % | 42.35 | % | $ | 662 | 12.91 | % | 12.47 | % | 1.03 | % | 0.81 | % | 5.77 | % | 0.74 | % | 5.74 | % | ||||||||||||||||||||||||||||||||||||||||||||||
| Comparable Group |
||||||||||||||||||||||||||||||||||||||||||||||||||||||||||||||||||||||||||||||||||||
| BKMU |
Bank Mutual Corporation | WI | $ | 7.68 | $ | 350.13 | $ | 0.35 | $ | 6.29 | 22.59x | 122.06 | % | 13.36 | % | 122.06 | % | 22.14x | $ | 0.22 | 2.86 | % | 61.76 | % | $ | 2,620 | 10.95 | % | 10.95 | % | 0.70 | % | 0.62 | % | 5.50 | % | 0.63 | % | 5.62 | % | ||||||||||||||||||||||||||||||||||||||||||||
| BFIN |
BankFinancial Corporation | IL | $ | 12.21 | $ | 238.61 | $ | 0.39 | $ | 10.50 | 33.00x | 116.24 | % | 16.02 | % | 116.83 | % | 31.61x | $ | 0.20 | 1.64 | % | 51.35 | % | $ | 1,500 | 13.78 | % | 13.72 | % | 0.66 | % | 0.49 | % | 3.39 | % | 0.51 | % | 3.54 | % | ||||||||||||||||||||||||||||||||||||||||||||
| CFFN |
Capitol Federal Financial, Inc. | KS | $ | 14.23 | $ | 1,952.87 | $ | 0.61 | $ | 10.06 | 23.33x | 141.43 | % | 21.13 | % | 141.43 | % | 23.47x | $ | 0.34 | 2.39 | % | 137.70 | % | $ | 9,242 | 14.94 | % | 14.94 | % | 0.58 | % | 0.72 | % | 5.77 | % | 0.72 | % | 5.74 | % | ||||||||||||||||||||||||||||||||||||||||||||
| CFBK |
Central Federal Corporation | OH | $ | 1.36 | $ | 21.71 | $ | 0.21 | $ | 1.70 | 6.45x | 79.91 | % | 6.35 | % | 79.91 | % | 6.45x | $ | 0.00 | 0.00 | % | NA | $ | 353 | 10.91 | % | 10.91 | % | 2.25 | % | 1.34 | % | 12.67 | % | 1.34 | % | 12.67 | % | |||||||||||||||||||||||||||||||||||||||||||||
| EQFN |
Equitable Financial Corp. | NE | $ | 8.49 | $ | 29.52 | $ | 0.27 | $ | 10.23 | 31.94x | 82.98 | % | 12.59 | % | 82.98 | % | 31.27x | NA | NA | NA | $ | 234 | 15.18 | % | 15.18 | % | NA | 0.42 | % | 3.17 | % | 0.42 | % | 3.24 | % | ||||||||||||||||||||||||||||||||||||||||||||||||
| FCAP |
First Capital, Inc. | IN | $ | 33.68 | $ | 112.44 | $ | 2.03 | NA | 17.82x | 148.04 | % | NA | 165.08 | % | 16.61x | $ | 0.84 | 2.49 | % | 44.44 | % | $ | 739 | NA | NA | 1.31 | % | 0.93 | % | NA | 0.99 | % | 8.97 | % | |||||||||||||||||||||||||||||||||||||||||||||||||
| FDEF |
First Defiance Financial Corp. | OH | $ | 43.11 | $ | 386.76 | $ | 3.04 | $ | 31.95 | 14.27x | 134.93 | % | 16.05 | % | 173.23 | % | 14.19x | $ | 0.88 | 2.04 | % | 28.48 | % | $ | 2,410 | 11.89 | % | 9.52 | % | 1.13 | % | 1.20 | % | 9.91 | % | 1.21 | % | 9.96 | % | ||||||||||||||||||||||||||||||||||||||||||||
| FBC |
Flagstar Bancorp, Inc. | MI | $ | 27.31 | $ | 1,545.08 | NA | $ | 23.49 | 11.72x | 116.26 | % | 11.48 | % | 116.26 | % | NA | $ | 0.00 | 0.00 | % | NA | $ | 13,725 | 11.63 | % | 11.63 | % | 1.03 | % | 1.27 | % | 10.67 | % | NA | NA | ||||||||||||||||||||||||||||||||||||||||||||||||
| HMNF |
HMN Financial, Inc. | MN | $ | 14.22 | $ | 63.83 | $ | 1.07 | $ | 16.34 | 12.93x | 87.04 | % | 9.77 | % | 88.62 | % | 13.35x | $ | 0.00 | 0.00 | % | NA | $ | 653 | 11.22 | % | 11.05 | % | NA | 0.82 | % | 7.35 | % | 0.79 | % | 7.09 | % | ||||||||||||||||||||||||||||||||||||||||||||||
| IROQ |
IF Bancorp, Inc. | IL | $ | 18.91 | $ | 75.90 | $ | 0.79 | $ | 20.50 | 21.99x | 92.26 | % | 12.99 | % | 92.26 | % | 24.07x | $ | 0.16 | 0.85 | % | 15.12 | % | $ | 584 | 14.08 | % | 14.08 | % | 0.94 | % | 0.59 | % | 4.02 | % | 0.54 | % | 3.67 | % | ||||||||||||||||||||||||||||||||||||||||||||
| JXSB |
Jacksonville Bancorp, Inc. | IL | $ | 28.36 | $ | 50.96 | $ | 1.56 | $ | 26.60 | 16.98x | 106.61 | % | 16.28 | % | 113.06 | % | 18.24x | $ | 0.40 | 1.41 | % | 81.44 | % | $ | 313 | 15.27 | % | 14.53 | % | NA | 0.98 | % | 6.46 | % | 0.91 | % | 6.01 | % | |||||||||||||||||||||||||||||||||||||||||||||
| CASH |
Meta Financial Group, Inc. | SD | $ | 56.26 | $ | 479.57 | $ | 4.67 | $ | 39.03 | 14.65x | 144.15 | % | 15.25 | % | 180.51 | % | 12.06x | $ | 0.52 | 0.92 | % | 13.54 | % | $ | 3,144 | 10.58 | % | 8.63 | % | 0.04 | % | 1.13 | % | 11.36 | % | 1.37 | % | 13.75 | % | ||||||||||||||||||||||||||||||||||||||||||||
| PBSK |
Poage Bankshares, Inc. | KY | $ | 18.25 | $ | 69.72 | $ | 0.86 | $ | 18.50 | 21.47x | 98.64 | % | 16.00 | % | 102.32 | % | 21.11x | $ | 0.32 | 1.75 | % | 30.59 | % | $ | 436 | 16.22 | % | 15.73 | % | 1.29 | % | 0.72 | % | 4.40 | % | 0.73 | % | 4.48 | % | ||||||||||||||||||||||||||||||||||||||||||||
| UCBA |
United Community Bancorp | IN | $ | 15.00 | $ | 63.02 | $ | 0.76 | $ | 16.37 | 18.99x | 91.61 | % | 12.17 | % | 95.59 | % | 19.72x | $ | 0.24 | 1.60 | % | 30.38 | % | $ | 518 | 13.28 | % | 12.80 | % | 1.19 | % | 0.64 | % | 4.80 | % | 0.62 | % | 4.64 | % | ||||||||||||||||||||||||||||||||||||||||||||
| UCFC |
United Community Financial Corp. | OH | $ | 6.83 | $ | 317.54 | $ | 0.35 | $ | 5.46 | 18.87x | 124.98 | % | 15.26 | % | 125.75 | % | 19.39x | $ | 0.12 | 1.76 | % | 29.01 | % | $ | 2,081 | 12.21 | % | 12.15 | % | NA | 0.86 | % | 6.96 | % | 0.84 | % | 6.77 | % | |||||||||||||||||||||||||||||||||||||||||||||
| WSBF |
Waterstone Financial, Inc. | WI | $ | 15.75 | $ | 459.34 | $ | 0.73 | $ | 13.74 | 21.58x | 114.66 | % | 25.53 | % | 114.84 | % | 21.58x | $ | 0.32 | 2.03 | % | 31.51 | % | $ | 1,799 | 22.26 | % | 22.24 | % | 1.53 | % | 1.14 | % | 5.04 | % | 1.14 | % | 5.04 | % | ||||||||||||||||||||||||||||||||||||||||||||
| WAYN |
Wayne Savings Bancshares, Inc. | OH | $ | 13.17 | $ | 36.64 | $ | 0.85 | $ | 14.83 | 15.49x | 88.80 | % | 8.16 | % | 92.66 | % | 15.49x | $ | 0.36 | 2.73 | % | 42.35 | % | $ | 449 | 9.18 | % | 8.84 | % | NA | 0.54 | % | 5.83 | % | 0.54 | % | 5.83 | % | |||||||||||||||||||||||||||||||||||||||||||||
| WCFB |
WCF Bancorp, Inc. | IA | $ | 8.60 | $ | 22.04 | $ | 0.10 | $ | 5.95 | NM | 144.48 | % | 18.66 | % | 143.99 | % | NM | $ | 0.20 | 2.33 | % | 108.13 | % | $ | 113 | 12.91 | % | NA | NA | 0.35 | % | 2.68 | % | 0.22 | % | 1.69 | % | ||||||||||||||||||||||||||||||||||||||||||||||
| WBB |
Westbury Bancorp, Inc. | WI | $ | 19.40 | $ | 79.51 | $ | 1.29 | $ | 19.30 | 13.96x | 100.54 | % | 11.85 | % | 100.54 | % | 15.05x | NA | NA | NA | $ | 671 | 11.79 | % | 11.79 | % | 0.65 | % | 0.80 | % | 6.84 | % | 0.74 | % | 6.35 | % | |||||||||||||||||||||||||||||||||||||||||||||||
| WBKC |
Wolverine Bancorp, Inc. | MI | $ | 25.95 | $ | 55.80 | $ | 1.66 | $ | 28.55 | 15.63x | 90.88 | % | 14.47 | % | 90.88 | % | 15.63x | NA | NA | 60.24 | % | $ | 386 | 15.92 | % | 15.92 | % | NA | 0.92 | % | 5.55 | % | 0.92 | % | 5.55 | % | |||||||||||||||||||||||||||||||||||||||||||||||
| MHCs |
||||||||||||||||||||||||||||||||||||||||||||||||||||||||||||||||||||||||||||||||||||
| KFFB |
Kentucky First Federal Bancorp (MHC) | KY | $ | 8.21 | $ | 69.29 | $ | 0.20 | $ | 7.95 | NM | 103.27 | % | 23.69 | % | 131.56 | % | NM | $ | 0.40 | 4.87 | % | 200.00 | % | $ | 294 | 22.94 | % | 18.94 | % | NA | 0.56 | % | 2.45 | % | 0.56 | % | 2.45 | % | |||||||||||||||||||||||||||||||||||||||||||||
| TFSL |
TFS Financial Corporation (MHC) | OH | $ | 18.40 | $ | 5,262.72 | NA | $ | 5.87 | NM | 313.44 | % | 41.69 | % | 315.27 | % | NA | $ | 0.40 | 2.17 | % | 142.86 | % | $ | 12,624 | 13.30 | % | 13.23 | % | 1.66 | % | 0.65 | % | 4.69 | % | NA | NA | |||||||||||||||||||||||||||||||||||||||||||||||
| (1) | Core income, on a diluted per-share basis. Core income is net income after taxes and before extraordinary items, less net income attributable to noncontrolling interest, gain on the sale of securities, amortization of intangibles, goodwill and nonrecurring items. Assumed tax rate is 35%. |
| (2) | P/E = Price to earnings; P/B = Price to book; P/A = Price to assets; P/TB = Price to tangible book value; and P/Core = Price to core earnings. P/E and P/Core = NM if the ratio is negative or above 35x. |
| (3) | Indicated 12 month dividend, based on last quarterly dividend declared. |
| (4) | Indicated 12 month dividend as a percent of trailing 12 month earnings. |
| (5) | ROAA (return on average assets) and ROAE (return on average equity) are indicated ratios based on trailing 12 month earnings and average equity and assets balances. |
| (6) | Excludes from averages and medians those companies the subject of actual or rumored acquisition activities or unusual operating characteristics. |
Source: SNL Financial, LC. and RP Financial, LC. calculations. The information provided in this report has been obtained from sources we believe are reliable, but we cannot guarantee the accuracy or completeness of such information.
Copyright (c) 2016 by RP® Financial, LC.
EXHIBIT III-4
Peer Group Market Area Comparative Analysis
Exhibit III-4
Peer Group Market Area Comparative Analysis
| Proj. | Per Capita Income | Deposit | ||||||||||||||||||||||||||||||||
| Population | Pop. | 2010-2016 | 2016-2021 | 2016 | % State | Market | ||||||||||||||||||||||||||||
| Institution |
County | 2010 | 2016 | 2021 | % Change | % Change | Amount | Average | Share(1) | |||||||||||||||||||||||||
| Bay Bancorp, Inc. |
Howard, MD | 287,085 | 316,627 | 337,725 | 1.6 | % | 1.3 | % | 51,648 | 136.6 | % | 0.39 | % | |||||||||||||||||||||
| Equitable Financial Corp. |
Hall, NE | 58,607 | 62,421 | 65,434 | 1.1 | % | 0.9 | % | 24,046 | 82.5 | % | 6.54 | % | |||||||||||||||||||||
| Hamilton Bancorp, Inc. |
Baltimore, MD | 805,029 | 833,355 | 860,871 | 0.6 | % | 0.7 | % | 35,431 | 93.7 | % | 1.21 | % | |||||||||||||||||||||
| Jacksonville Bancorp, Inc. |
Morgan, IL | 35,547 | 34,692 | 34,211 | -0.4 | % | -0.3 | % | 29,817 | 94.2 | % | 24.86 | % | |||||||||||||||||||||
| MSB Financial Corp. |
Morris, NJ | 492,276 | 501,318 | 509,537 | 0.3 | % | 0.3 | % | 52,009 | 138.7 | % | 1.00 | % | |||||||||||||||||||||
| Poage Bankshares, Inc. |
Boyd, KY | 49,542 | 48,562 | 48,257 | -0.3 | % | -0.1 | % | 26,801 | 105.4 | % | 0.91 | % | |||||||||||||||||||||
| Prudential Bancorp, Inc. |
Philadelphia, PA | 1,526,006 | 1,569,473 | 1,599,807 | 0.5 | % | 0.4 | % | 23,204 | 75.1 | % | 21.68 | % | |||||||||||||||||||||
| United Community Bancorp |
Dearborn, IN | 50,047 | 49,234 | 49,011 | -0.3 | % | -0.1 | % | 26,820 | 103.0 | % | 41.44 | % | |||||||||||||||||||||
| Wayne Savings Bancshares, Inc. |
Wayne, OH | 114,520 | 115,982 | 117,420 | 0.2 | % | 0.2 | % | 25,247 | 88.5 | % | 12.78 | % | |||||||||||||||||||||
| Wolverine Bancorp, Inc. |
Midland, MI | 83,629 | 83,266 | 83,153 | -0.1 | % | 0.0 | % | 30,041 | 108.2 | % | 17.32 | % | |||||||||||||||||||||
| Averages: | 350,229 | 361,493 | 370,543 | 0.3 | % | 0.3 | % | 32,506 | 102.6 | % | 12.81 | % | ||||||||||||||||||||||
| Medians: | 99,075 | 99,624 | 100,287 | 0.3 | % | 0.3 | % | 28,319 | 98.6 | % | 9.66 | % | ||||||||||||||||||||||
| Huntingdon Valley Bank |
Montgomery, PA | 799,874 | 822,319 | 838,886 | 0.5 | % | 0.4 | % | 43,231 | 140.0 | % | 0.37 | % | |||||||||||||||||||||
| (1) | Total institution deposits in headquarters county as percent of total county deposits as of June 30, 2015. |
Sources: SNL Financial LC, FDIC.
EXHIBIT IV-1
Stock Prices:
As of August 5, 2016
Exhibit IV-1A
Weekly Thrift Market Line - Part One
Prices As of August 5, 2016
| Market Capitalization | Price Change Data | Current Per Share Financials | ||||||||||||||||||||||||||||||||||||||||||||||||||||||||||
| Price/ | Shares | Market | 52 Week (1) | % Change From | LTM | LTM Core | BV/ | TBV/ | Assets/ | |||||||||||||||||||||||||||||||||||||||||||||||||||
| Share(1) | Outstanding | Capitalization | High | Low | Last Wk | Last Wk | 52 Wks (2) | MRY (2) | EPS (3) | EPS (3) | Share | Share (4) | Share | |||||||||||||||||||||||||||||||||||||||||||||||
| ($) | (000) | ($Mil) | ($) | ($) | ($) | (%) | (%) | (%) | ($) | ($) | ($) | ($) | ($) | |||||||||||||||||||||||||||||||||||||||||||||||
| Companies |
||||||||||||||||||||||||||||||||||||||||||||||||||||||||||||
| ANCB |
Anchor Bancorp | WA | 26.14 | 2,550 | 66.6 | 26.94 | 20.60 | 26.00 | 0.52 | 16.41 | 0.95 | 0.20 | 0.19 | 24.78 | 24.78 | 169.22 | ||||||||||||||||||||||||||||||||||||||||||||
| ASBB |
ASB Bancorp, Inc. | NC | 24.90 | 3,787 | 94.3 | 27.24 | 22.70 | 25.15 | -0.99 | 9.21 | -4.07 | 1.27 | 1.01 | 23.80 | 23.80 | 212.70 | ||||||||||||||||||||||||||||||||||||||||||||
| ACFC |
Atlantic Coast Financial Corporation | FL | 6.00 | 15,523 | 93.1 | 6.75 | 5.03 | 6.00 | 0.00 | 11.11 | 2.39 | 0.30 | 0.26 | 5.44 | 5.44 | 59.38 | ||||||||||||||||||||||||||||||||||||||||||||
| BKMU |
Bank Mutual Corporation | WI | 7.68 | 45,590 | 350.1 | 8.50 | 6.44 | 7.64 | 0.52 | 3.64 | -1.54 | 0.34 | 0.35 | 6.29 | 6.29 | 57.47 | ||||||||||||||||||||||||||||||||||||||||||||
| BFIN |
BankFinancial Corporation | IL | 12.21 | 19,542 | 238.6 | 13.29 | 11.38 | 12.20 | 0.08 | 1.92 | -3.33 | 0.37 | 0.39 | 10.50 | 10.45 | 76.75 | ||||||||||||||||||||||||||||||||||||||||||||
| BYBK |
Bay Bancorp, Inc. | MD | 5.09 | 10,918 | 55.6 | 5.40 | 4.57 | 5.05 | 0.79 | 0.79 | 0.59 | 0.16 | 0.18 | 6.18 | 5.97 | 45.39 | ||||||||||||||||||||||||||||||||||||||||||||
| BNCL |
Beneficial Bancorp, Inc. | PA | 14.34 | 77,140 | 1,106.2 | 14.43 | 11.94 | 13.56 | 5.75 | 10.48 | 7.66 | 0.24 | 0.35 | 13.31 | 11.04 | 71.48 | ||||||||||||||||||||||||||||||||||||||||||||
| BHBK |
Blue Hills Bancorp, Inc. | MA | 14.03 | 27,336 | 383.5 | 16.58 | 13.22 | 14.25 | -1.54 | -3.77 | -8.36 | 0.28 | 0.29 | 14.31 | 13.90 | 81.97 | ||||||||||||||||||||||||||||||||||||||||||||
| BOFI |
BofI Holding, Inc. | CA | 17.94 | 63,219 | 1,134.2 | 35.98 | 13.47 | 16.82 | 6.66 | -46.22 | -14.77 | 1.85 | 1.84 | 10.73 | 10.73 | 120.24 | ||||||||||||||||||||||||||||||||||||||||||||
| BYFC |
Broadway Financial Corporation | CA | 1.79 | 29,077 | 52.0 | 2.50 | 1.17 | 1.77 | 1.13 | 40.93 | 18.54 | 0.25 | NA | 1.62 | 1.62 | 14.05 | ||||||||||||||||||||||||||||||||||||||||||||
| BLMT |
BSB Bancorp, Inc. | MA | 23.08 | 9,101 | 210.1 | 23.98 | 19.59 | 23.00 | 0.35 | 8.87 | -1.33 | 1.05 | NA | 16.82 | 16.82 | 217.45 | ||||||||||||||||||||||||||||||||||||||||||||
| CFFN |
Capitol Federal Financial, Inc. | KS | 14.23 | 137,236 | 1,952.9 | 14.33 | 11.39 | 14.17 | 0.42 | 18.39 | 13.30 | 0.61 | 0.61 | 10.06 | 10.06 | 67.34 | ||||||||||||||||||||||||||||||||||||||||||||
| CARV |
Carver Bancorp, Inc. | NY | 4.46 | 3,696 | 16.5 | 7.60 | 1.92 | 4.32 | 3.24 | -24.79 | 18.93 | 0.10 | -0.11 | 2.69 | 2.69 | 204.04 | ||||||||||||||||||||||||||||||||||||||||||||
| CFBK |
Central Federal Corporation | OH | 1.36 | 16,024 | 21.7 | 1.68 | 1.10 | 1.33 | 1.88 | -1.09 | 2.65 | 0.21 | 0.21 | 1.70 | 1.70 | 22.05 | ||||||||||||||||||||||||||||||||||||||||||||
| CHFN |
Charter Financial Corporation | GA | 13.39 | 15,031 | 201.3 | 14.76 | 11.81 | 13.04 | 2.68 | 8.07 | 1.36 | 0.56 | 0.61 | 13.29 | 11.11 | 94.99 | ||||||||||||||||||||||||||||||||||||||||||||
| CSBK |
Clifton Bancorp Inc. | NJ | 14.89 | 23,576 | 351.0 | 15.43 | 13.09 | 14.98 | -0.60 | 7.35 | 3.84 | 0.19 | 0.19 | 13.13 | 13.13 | 54.54 | ||||||||||||||||||||||||||||||||||||||||||||
| CWAY |
Coastway Bancorp, Inc. | RI | 12.60 | 4,467 | 56.3 | 14.01 | 10.88 | 12.60 | 0.00 | 9.57 | -3.67 | 0.58 | 0.58 | 15.23 | 15.23 | 134.29 | ||||||||||||||||||||||||||||||||||||||||||||
| DCOM |
Dime Community Bancshares, Inc. | NY | 17.42 | 37,655 | 655.9 | 18.87 | 15.61 | 17.30 | 0.69 | 1.04 | -0.40 | 2.25 | NA | 14.60 | 13.12 | 147.56 | ||||||||||||||||||||||||||||||||||||||||||||
| ESBK |
Elmira Savings Bank | NY | 19.30 | 2,734 | 52.8 | 21.13 | 16.83 | 18.92 | 2.01 | -3.62 | -2.93 | 1.20 | 1.17 | 16.69 | 12.17 | 210.20 | ||||||||||||||||||||||||||||||||||||||||||||
| ENFC |
Entegra Financial Corp. | NC | 17.55 | 6,466 | 113.5 | 19.90 | 16.11 | 17.62 | -0.40 | -3.47 | -9.34 | 1.02 | 1.17 | 21.23 | 20.77 | 184.48 | ||||||||||||||||||||||||||||||||||||||||||||
| EQFN |
Equitable Financial Corp. | NE | 8.49 | 3,477 | 29.5 | 9.09 | 7.65 | 8.51 | -0.24 | 1.68 | -3.63 | 0.27 | 0.27 | 10.23 | 10.23 | 67.42 | ||||||||||||||||||||||||||||||||||||||||||||
| ESSA |
ESSA Bancorp, Inc. | PA | 14.00 | 11,385 | 159.4 | 14.22 | 12.00 | 14.16 | -1.13 | 8.02 | 2.34 | 0.81 | 0.82 | 15.59 | 14.14 | 155.18 | ||||||||||||||||||||||||||||||||||||||||||||
| FCAP |
First Capital, Inc. | IN | 33.68 | 3,339 | 112.4 | 35.00 | 23.08 | 32.50 | 3.62 | 29.54 | 29.04 | 1.89 | 2.03 | NA | NA | 221.45 | ||||||||||||||||||||||||||||||||||||||||||||
| FBNK |
First Connecticut Bancorp, Inc. | CT | 16.39 | 15,818 | 259.3 | 18.40 | 14.42 | 16.10 | 1.80 | 2.89 | -5.86 | 0.92 | 0.90 | 15.95 | 15.95 | 175.69 | ||||||||||||||||||||||||||||||||||||||||||||
| FDEF |
First Defiance Financial Corp. | OH | 43.11 | 8,971 | 386.8 | 43.44 | 34.80 | 41.69 | 3.41 | 12.21 | 14.11 | 3.02 | 3.04 | 31.95 | 24.89 | 268.59 | ||||||||||||||||||||||||||||||||||||||||||||
| FNWB |
First Northwest Bancorp | WA | 13.21 | 12,677 | 167.5 | 14.26 | 11.62 | 13.08 | 0.99 | 6.96 | -6.64 | 0.33 | 0.31 | 14.97 | NA | 79.68 | ||||||||||||||||||||||||||||||||||||||||||||
| FBC |
Flagstar Bancorp, Inc. | MI | 27.31 | 56,576 | 1,545.1 | 27.32 | 17.25 | 26.41 | 3.41 | 33.81 | 18.17 | 2.33 | NA | 23.49 | 23.49 | 242.59 | ||||||||||||||||||||||||||||||||||||||||||||
| FSBW |
FS Bancorp, Inc. | WA | 27.80 | 3,056 | 85.0 | 27.85 | 21.95 | 26.80 | 3.73 | 19.42 | 6.94 | 2.83 | 3.15 | 24.88 | 23.47 | 256.51 | ||||||||||||||||||||||||||||||||||||||||||||
| FSBC |
FSB Bancorp, Inc. | NY | 12.40 | 1,942 | 24.1 | 13.70 | 8.27 | 12.35 | 0.40 | 36.32 | 19.97 | 0.30 | NA | NA | NA | 144.16 | ||||||||||||||||||||||||||||||||||||||||||||
| GTWN |
Georgetown Bancorp, Inc. | MA | 20.45 | 1,841 | 37.6 | 23.75 | 17.80 | 20.86 | -1.99 | 13.80 | 8.09 | 0.65 | NA | 17.60 | 17.60 | 162.90 | ||||||||||||||||||||||||||||||||||||||||||||
| HBK |
Hamilton Bancorp, Inc. | MD | 13.75 | 3,414 | 46.9 | 16.00 | 13.19 | 13.50 | 1.85 | 3.00 | -3.58 | -0.17 | 0.06 | 18.06 | 14.94 | 153.14 | ||||||||||||||||||||||||||||||||||||||||||||
| HIFS |
Hingham Institution for Savings | MA | 133.90 | 2,131 | 285.3 | 137.87 | 109.14 | 131.00 | 2.21 | 14.71 | 11.77 | 9.92 | 9.81 | 69.69 | 69.69 | 900.46 | ||||||||||||||||||||||||||||||||||||||||||||
| HMNF |
HMN Financial, Inc. | MN | 14.22 | 4,489 | 63.8 | 14.44 | 10.81 | 14.21 | 0.07 | 21.85 | 23.12 | 1.10 | 1.07 | 16.34 | 16.05 | 145.55 | ||||||||||||||||||||||||||||||||||||||||||||
| HFBL |
Home Federal Bancorp, Inc. of Louisiana | LA | 23.15 | 1,968 | 45.6 | 25.00 | 20.80 | 21.90 | 5.71 | 8.33 | -0.43 | 1.74 | 1.74 | 22.05 | 22.05 | 193.96 | ||||||||||||||||||||||||||||||||||||||||||||
| IROQ |
IF Bancorp, Inc. | IL | 18.91 | 4,014 | 75.9 | 19.97 | 16.36 | 18.54 | 1.99 | 14.60 | 2.21 | 0.86 | 0.79 | 20.50 | 20.50 | 145.54 | ||||||||||||||||||||||||||||||||||||||||||||
| ISBC |
Investors Bancorp, Inc. | NJ | 11.35 | 313,474 | 3,557.9 | 13.13 | 10.67 | 11.36 | -0.09 | -8.39 | -8.76 | 0.58 | 0.58 | 9.99 | NA | 69.28 | ||||||||||||||||||||||||||||||||||||||||||||
| JXSB |
Jacksonville Bancorp, Inc. | IL | 28.36 | 1,797 | 51.0 | 33.08 | 23.20 | 28.20 | 0.56 | 19.45 | 7.91 | 1.67 | 1.56 | 26.60 | 25.08 | 174.18 | ||||||||||||||||||||||||||||||||||||||||||||
| KRNY |
Kearny Financial Corp. | NJ | 13.05 | 91,822 | 1,198.3 | 13.42 | 11.01 | 13.02 | 0.23 | 14.57 | 3.00 | 0.18 | 0.18 | 12.50 | 11.31 | 49.01 | ||||||||||||||||||||||||||||||||||||||||||||
| MLVF |
Malvern Bancorp, Inc. | PA | 15.99 | 6,561 | 104.9 | 17.70 | 14.51 | 15.66 | 2.11 | 4.99 | -8.94 | 0.84 | 0.79 | 13.21 | 13.21 | 121.37 | ||||||||||||||||||||||||||||||||||||||||||||
| MELR |
Melrose Bancorp, Inc. | MA | 15.50 | 2,698 | 41.8 | 15.85 | 13.75 | 15.48 | 0.14 | 9.54 | 1.44 | 0.28 | 0.28 | 16.55 | 16.55 | 89.44 | ||||||||||||||||||||||||||||||||||||||||||||
| EBSB |
Meridian Bancorp, Inc. | MA | 15.22 | 53,689 | 817.1 | 15.71 | 12.02 | 14.70 | 3.54 | 16.90 | 7.94 | 0.49 | 0.49 | 10.93 | 10.67 | 73.18 | ||||||||||||||||||||||||||||||||||||||||||||
| CASH |
Meta Financial Group, Inc. | SD | 56.26 | 8,524 | 479.6 | 56.53 | 36.22 | 54.69 | 2.87 | 13.77 | 22.49 | 3.84 | 4.67 | 39.03 | 31.17 | 368.85 | ||||||||||||||||||||||||||||||||||||||||||||
| MSBF |
MSB Financial Corp. | NJ | 13.14 | 5,953 | 78.2 | 13.95 | 10.98 | 13.10 | 0.31 | 13.28 | 5.12 | 0.11 | 0.11 | 12.66 | 12.66 | 66.51 | ||||||||||||||||||||||||||||||||||||||||||||
| NYCB |
New York Community Bancorp, Inc. | NY | 14.50 | 487,068 | 7,062.5 | 19.18 | 14.10 | 14.45 | 0.35 | -22.29 | -11.15 | -0.08 | 1.19 | 12.40 | 7.40 | 100.68 | ||||||||||||||||||||||||||||||||||||||||||||
| NFBK |
Northfield Bancorp, Inc. | NJ | 15.43 | 48,322 | 745.6 | 16.68 | 14.31 | 14.93 | 3.35 | 1.25 | -3.08 | 0.47 | NA | 12.73 | 11.90 | 77.43 | ||||||||||||||||||||||||||||||||||||||||||||
| NWBI |
Northwest Bancshares, Inc. | PA | 15.10 | 101,849 | 1,537.9 | 15.22 | 11.78 | 14.91 | 1.27 | 18.90 | 12.77 | 0.40 | 0.74 | 11.28 | 8.64 | 88.01 | ||||||||||||||||||||||||||||||||||||||||||||
| OCFC |
OceanFirst Financial Corp. | NJ | 18.86 | 25,749 | 485.6 | 21.00 | 15.98 | 18.86 | 0.00 | 5.30 | -5.84 | 1.00 | 1.34 | 15.89 | 13.14 | 157.19 | ||||||||||||||||||||||||||||||||||||||||||||
| ORIT |
Oritani Financial Corp. | NJ | 16.29 | 45,247 | 737.1 | 17.63 | 14.70 | 16.22 | 0.43 | 3.17 | -1.27 | 1.21 | 0.90 | 11.83 | 11.83 | 81.09 | ||||||||||||||||||||||||||||||||||||||||||||
| PBHC |
Pathfinder Bancorp, Inc. | NY | 12.10 | 4,358 | 52.7 | 13.32 | 10.51 | 12.09 | 0.08 | 5.22 | -6.24 | 0.73 | 0.62 | 13.70 | 12.61 | 153.96 | ||||||||||||||||||||||||||||||||||||||||||||
| PBBI |
PB Bancorp, Inc. | CT | 8.52 | 7,880 | 67.1 | 10.15 | 6.63 | 8.48 | 0.42 | 20.27 | -0.11 | 0.15 | 0.16 | 10.75 | 9.87 | 63.13 | ||||||||||||||||||||||||||||||||||||||||||||
| PBSK |
Poage Bankshares, Inc. | KY | 18.25 | 3,820 | 69.7 | 18.85 | 15.35 | 18.21 | 0.22 | 17.14 | 6.73 | 0.85 | 0.86 | 18.50 | 17.84 | 114.17 | ||||||||||||||||||||||||||||||||||||||||||||
| PROV |
Provident Financial Holdings, Inc. | CA | 19.40 | 7,975 | 154.7 | 20.00 | 15.77 | 19.49 | -0.46 | 20.27 | 2.70 | 0.90 | 0.91 | 16.76 | 16.76 | 146.87 | ||||||||||||||||||||||||||||||||||||||||||||
| PFS |
Provident Financial Services, Inc. | NJ | 20.65 | 65,814 | 1,359.1 | 21.20 | 17.71 | 20.15 | 2.48 | 4.40 | 2.48 | 1.34 | 1.37 | 18.68 | NA | 140.20 | ||||||||||||||||||||||||||||||||||||||||||||
| PBIP |
Prudential Bancorp, Inc. | PA | 14.28 | 8,047 | 114.9 | 16.20 | 13.76 | 14.27 | 0.07 | -2.26 | -6.05 | 0.22 | 0.21 | 14.05 | 14.05 | 69.13 | ||||||||||||||||||||||||||||||||||||||||||||
| RNDB |
Randolph Bancorp, Inc. | MA | 12.79 | 5,869 | 75.1 | 12.85 | 12.06 | 12.76 | 0.23 | NA | NA | NA | NA | NA | NA | 77.74 | ||||||||||||||||||||||||||||||||||||||||||||
| RVSB |
Riverview Bancorp, Inc. | WA | 4.85 | 22,508 | 109.2 | 5.48 | 4.15 | 4.69 | 3.41 | 14.12 | 3.41 | 0.29 | 0.29 | 4.89 | 3.75 | 41.43 | ||||||||||||||||||||||||||||||||||||||||||||
| SVBI |
Severn Bancorp, Inc. | MD | 6.47 | 12,081 | 78.2 | 6.47 | 4.65 | 6.37 | 1.57 | 29.40 | 12.52 | 1.16 | 1.16 | 6.86 | 6.83 | 65.74 | ||||||||||||||||||||||||||||||||||||||||||||
| SIFI |
SI Financial Group, Inc. | CT | 13.11 | 12,217 | 160.2 | 14.47 | 11.25 | 13.37 | -1.94 | 10.40 | -3.96 | 0.48 | NA | 13.00 | 11.54 | 124.23 | ||||||||||||||||||||||||||||||||||||||||||||
| SBCP |
Sunshine Bancorp, Inc. | FL | 14.19 | 5,261 | 74.7 | 15.25 | 13.55 | 14.30 | -0.77 | -2.00 | -6.64 | -0.39 | -0.37 | 13.73 | 11.82 | 97.84 | ||||||||||||||||||||||||||||||||||||||||||||
| TBNK |
Territorial Bancorp Inc. | HI | 28.47 | 9,663 | 275.1 | 29.44 | 24.87 | 26.90 | 5.84 | 11.78 | 2.63 | 1.64 | 1.61 | 23.36 | 23.36 | 191.55 | ||||||||||||||||||||||||||||||||||||||||||||
| TSBK |
Timberland Bancorp, Inc. | WA | 15.50 | 6,939 | 107.6 | 16.10 | 10.16 | 15.11 | 2.58 | 42.86 | 24.90 | 1.48 | 1.48 | 13.61 | 12.80 | 123.67 | ||||||||||||||||||||||||||||||||||||||||||||
| TRST |
TrustCo Bank Corp NY | NY | 6.91 | 95,600 | 660.6 | 6.94 | 5.17 | 6.63 | 4.22 | 11.09 | 12.54 | 0.44 | 0.43 | 4.51 | 4.50 | 50.53 | ||||||||||||||||||||||||||||||||||||||||||||
| UCBA |
United Community Bancorp | IN | 15.00 | 4,201 | 63.0 | 15.42 | 12.95 | 14.69 | 2.10 | 7.91 | 0.07 | 0.79 | 0.76 | 16.37 | 15.69 | 123.30 | ||||||||||||||||||||||||||||||||||||||||||||
| UCFC |
United Community Financial Corp. | OH | 6.83 | 46,500 | 317.6 | 6.86 | 4.65 | 6.64 | 2.86 | 33.92 | 15.76 | 0.36 | 0.35 | 5.46 | 5.43 | 44.74 | ||||||||||||||||||||||||||||||||||||||||||||
| UBNK |
United Financial Bancorp, Inc. | CT | 13.49 | 50,293 | 678.5 | 14.16 | 10.28 | 13.15 | 2.59 | -0.37 | 4.74 | 0.89 | 1.01 | 12.81 | 10.39 | 127.55 | ||||||||||||||||||||||||||||||||||||||||||||
| WSBF |
Waterstone Financial, Inc. | WI | 15.75 | 29,164 | 459.3 | 15.95 | 12.38 | 15.68 | 0.45 | 19.68 | 11.70 | 0.73 | 0.73 | 13.74 | 13.72 | 61.69 | ||||||||||||||||||||||||||||||||||||||||||||
| WAYN |
Wayne Savings Bancshares, Inc. | OH | 13.17 | 2,782 | 36.6 | 13.52 | 11.69 | 13.17 | 0.00 | 4.44 | -0.30 | 0.85 | 0.85 | 14.83 | 14.21 | 161.48 | ||||||||||||||||||||||||||||||||||||||||||||
| WCFB |
WCF Bancorp, Inc. | IA | 8.60 | 2,563 | 22.0 | 10.97 | 8.50 | 8.54 | 0.70 | -5.69 | -5.05 | 0.16 | 0.10 | 5.95 | NA | 44.05 | ||||||||||||||||||||||||||||||||||||||||||||
| WEBK |
Wellesley Bancorp, Inc. | MA | 21.15 | 2,459 | 52.0 | 21.15 | 18.05 | 20.17 | 4.86 | 6.98 | 11.32 | 1.31 | NA | 22.23 | 22.23 | 263.01 | ||||||||||||||||||||||||||||||||||||||||||||
| WBB |
Westbury Bancorp, Inc. | WI | 19.40 | 4,098 | 79.5 | 20.26 | 17.20 | 19.56 | -0.82 | 12.07 | 7.78 | 1.39 | 1.29 | 19.30 | 19.30 | 163.67 | ||||||||||||||||||||||||||||||||||||||||||||
| WFD |
Westfield Financial, Inc. | MA | 7.58 | 18,330 | 138.9 | 8.85 | 7.30 | 7.87 | -3.68 | 2.16 | -9.76 | 0.30 | 0.30 | 7.89 | 7.89 | 71.26 | ||||||||||||||||||||||||||||||||||||||||||||
Exhibit IV-1A
Weekly Thrift Market Line - Part One
Prices As of August 5, 2016
| Market Capitalization | Price Change Data | Current Per Share Financials | ||||||||||||||||||||||||||||||||||||||||||||||||||||||||||
| Price/ | Shares | Market | 52 Week (1) | % Change From | LTM | LTM Core | BV/ | TBV/ | Assets/ | |||||||||||||||||||||||||||||||||||||||||||||||||||
| Share(1) | Outstanding | Capitalization | High | Low | Last Wk | Last Wk | 52 Wks (2) | MRY (2) | EPS (3) | EPS (3) | Share | Share (4) | Share | |||||||||||||||||||||||||||||||||||||||||||||||
| ($) | (000) | ($Mil) | ($) | ($) | ($) | (%) | (%) | (%) | ($) | ($) | ($) | ($) | ($) | |||||||||||||||||||||||||||||||||||||||||||||||
| Companies |
||||||||||||||||||||||||||||||||||||||||||||||||||||||||||||
| WBKC |
Wolverine Bancorp, Inc. | MI | 25.95 | 2,150 | 55.8 | 27.73 | 25.25 | 25.46 | 1.92 | 1.76 | -2.59 | 1.66 | 1.66 | 28.55 | 28.55 | 179.47 | ||||||||||||||||||||||||||||||||||||||||||||
| WSFS |
WSFS Financial Corporation | DE | 36.24 | 29,549 | 1,070.9 | 37.10 | 26.26 | 35.19 | 2.98 | 28.37 | 11.99 | 2.07 | 2.39 | 20.89 | NA | 197.44 | ||||||||||||||||||||||||||||||||||||||||||||
| WVFC |
WVS Financial Corp. | PA | 11.90 | 2,040 | 24.3 | 12.60 | 10.73 | 11.75 | 1.28 | 5.40 | -3.25 | 0.69 | NA | 16.22 | 16.22 | 164.59 | ||||||||||||||||||||||||||||||||||||||||||||
| GCBC |
Greene County Bancorp, Inc. (MHC) | NY | 17.05 | 8,476 | 144.5 | 21.30 | 13.70 | 16.66 | 2.34 | 25.18 | 6.73 | 1.06 | NA | 8.77 | 8.77 | 102.50 | ||||||||||||||||||||||||||||||||||||||||||||
| MHCs |
||||||||||||||||||||||||||||||||||||||||||||||||||||||||||||
| HONE |
HarborOne Bancorp, Inc. (MHC) | MA | 14.07 | 32,121 | 451.9 | 14.25 | 12.53 | 13.40 | 5.00 | NA | NA | NA | NA | 10.10 | 9.67 | 70.57 | ||||||||||||||||||||||||||||||||||||||||||||
| KFFB |
Kentucky First Federal Bancorp (MHC) | KY | 8.21 | 8,440 | 69.3 | 10.37 | 8.00 | 8.26 | -0.61 | -0.64 | -12.10 | 0.20 | 0.20 | 7.95 | 6.24 | 34.84 | ||||||||||||||||||||||||||||||||||||||||||||
| LSBK |
Lake Shore Bancorp, Inc. (MHC) | NY | 13.58 | 6,039 | 82.0 | 15.10 | 12.97 | 13.44 | 1.01 | 1.08 | 1.31 | 0.79 | NA | NA | NA | 79.48 | ||||||||||||||||||||||||||||||||||||||||||||
| MGYR |
Magyar Bancorp, Inc. (MHC) | NJ | 9.76 | 5,821 | 56.8 | 11.00 | 9.51 | 9.76 | 0.00 | -2.40 | -2.50 | 0.18 | NA | 8.16 | 8.16 | 97.61 | ||||||||||||||||||||||||||||||||||||||||||||
| OFED |
Oconee Federal Financial Corp. (MHC) | SC | 19.30 | 5,871 | 113.3 | 20.75 | 16.50 | 19.33 | -0.16 | -0.26 | 3.49 | 0.86 | 0.86 | 14.36 | 13.79 | 82.20 | ||||||||||||||||||||||||||||||||||||||||||||
| PVBC |
Provident Bancorp, Inc. (MHC) | MA | 15.88 | 9,499 | 150.8 | 16.35 | 11.26 | 15.93 | -0.31 | 24.45 | 22.25 | NA | NA | 11.26 | 11.26 | 80.06 | ||||||||||||||||||||||||||||||||||||||||||||
| TFSL |
TFS Financial Corporation (MHC) | OH | 18.40 | 285,336 | 5,250.2 | 19.42 | 15.58 | 18.20 | 1.10 | 6.67 | -2.28 | 0.28 | NA | 5.87 | 5.84 | 44.24 | ||||||||||||||||||||||||||||||||||||||||||||
| AF |
Astoria Financial Corporation | NY | 14.83 | 101,341 | 1,502.9 | 18.13 | 13.92 | 14.67 | 1.09 | -8.63 | -6.44 | 0.65 | 0.68 | 15.45 | 13.62 | 148.18 | ||||||||||||||||||||||||||||||||||||||||||||
| Under Acquisition |
||||||||||||||||||||||||||||||||||||||||||||||||||||||||||||
| CBNK |
Chicopee Bancorp, Inc. | MA | 18.56 | 5,234 | 97.1 | 19.00 | 16.00 | 18.98 | -2.21 | 11.00 | 7.04 | 0.57 | 0.66 | 17.19 | 17.19 | 134.08 | ||||||||||||||||||||||||||||||||||||||||||||
| EVER |
EverBank Financial Corp | FL | 18.64 | 125,324 | 2,336.0 | 21.18 | 12.32 | 17.96 | 3.79 | -8.45 | 16.65 | 0.90 | 0.91 | 13.62 | 13.24 | 218.27 | ||||||||||||||||||||||||||||||||||||||||||||
| LSBG |
Lake Sunapee Bank Group | NH | 17.59 | 8,385 | 147.5 | 18.89 | 13.25 | 18.44 | -4.61 | 17.74 | 25.37 | 1.08 | 1.16 | 16.86 | 10.69 | 189.70 | ||||||||||||||||||||||||||||||||||||||||||||
| (1) | Average of High/Low or Bid/Ask price per share. |
| (2) | Or since offering price if converted of first listed in the past 52 weeks. Percent change figures are actual year-to-date and are not annualized. |
| (3) | EPS (earnings per share) is based on actual trailing 12 month data and is not shown on a pro forma basis. |
| (4) | Excludes intangibles (such as goodwill, value of core deposits, etc.). |
| (5) | ROA (return on assets) and ROE (return on equity) are indicated ratios based on trailing 12 month common earnings and average common equity and total assets balances. |
| (6) | Annualized based on last regular quarterly cash dividend announcement. |
| (7) | Indicated dividend as a percent of trailing 12 month earnings. |
| (8) | Excluded from averages due to actual or rumored acquisition activities or unusual operating characteristics. |
| (9) | For MHC institutions, market value reflects share price multiplied by public (non-MHC) shares. |
Source: SNL Financial, LC. and RP® Financial, LC. calculations. The information provided in this table has been obtained from sources we believe are reliable, but we cannot guarantee the accuracy or completeness of such information.
Copyright (c) 2016 by RP® Financial, LC.
Exhibit IV-1B
Weekly Thrift Market Line - Part Two
Prices As of August 5, 2016
| Key Financial Ratios | Asset Quality Ratios | Pricing Ratios | Dividend Data (6) | |||||||||||||||||||||||||||||||||||||||||||||||||||||||||||||||||
| Equity/ | Tang Equity/ | Reported Earnings | Core Earnings | NPAs/ | Rsvs/ | Price/ | Price/ | Price/ | Price/ | Price/ | Div/ | Dividend | Payout | |||||||||||||||||||||||||||||||||||||||||||||||||||||||
| Assets(1) | Assets(1) | ROA(5) | ROE(5) | ROA(5) | ROE(5) | Assets | NPLs | Earnings | Book | Assets | Tang Book | Core Earnings | Share | Yield | Ratio (7) | |||||||||||||||||||||||||||||||||||||||||||||||||||||
| (%) | (%) | (%) | (%) | (%) | (%) | (%) | (%) | (x) | (%) | (%) | (%) | (x) | ($) | (%) | (%) | |||||||||||||||||||||||||||||||||||||||||||||||||||||
| Companies |
||||||||||||||||||||||||||||||||||||||||||||||||||||||||||||||||||||
| ANCB |
Anchor Bancorp | WA | 14.65 | 14.65 | 0.12 | 0.78 | 0.12 | 0.75 | NA | NA | NM | 105.46 | 15.44 | 105.46 | 135.32 | NA | NA | NM | ||||||||||||||||||||||||||||||||||||||||||||||||||
| ASBB |
ASB Bancorp, Inc. | NC | 11.78 | 11.78 | 0.62 | 5.20 | 0.50 | 4.13 | 1.46 | 94.69 | 19.61 | 104.61 | 12.32 | 104.61 | 24.74 | NA | NA | NM | ||||||||||||||||||||||||||||||||||||||||||||||||||
| ACFC |
Atlantic Coast Financial Corporation | FL | 9.16 | 9.16 | 0.54 | 5.55 | 0.48 | 4.90 | NA | NA | 20.00 | 110.29 | 10.10 | 110.29 | 22.67 | 0.00 | 0.00 | NM | ||||||||||||||||||||||||||||||||||||||||||||||||||
| BKMU |
Bank Mutual Corporation | WI | 10.95 | 10.95 | 0.62 | 5.50 | 0.63 | 5.62 | 0.70 | 115.90 | 22.59 | 122.06 | 13.36 | 122.06 | 22.14 | 0.22 | 2.86 | 61.76 | ||||||||||||||||||||||||||||||||||||||||||||||||||
| BFIN |
BankFinancial Corporation | IL | 13.78 | 13.72 | 0.49 | 3.39 | 0.51 | 3.54 | 0.66 | 194.35 | 33.00 | 116.24 | 16.02 | 116.83 | 31.61 | 0.20 | 1.64 | 51.35 | ||||||||||||||||||||||||||||||||||||||||||||||||||
| BYBK |
Bay Bancorp, Inc. | MD | 13.62 | 13.22 | 0.35 | 2.51 | 0.39 | 2.76 | NA | NA | 31.81 | 82.33 | 11.21 | 85.21 | 29.00 | 0.00 | 0.00 | NM | ||||||||||||||||||||||||||||||||||||||||||||||||||
| BNCL |
Beneficial Bancorp, Inc. | PA | 18.61 | 15.95 | 0.37 | 1.70 | 0.53 | 2.43 | NA | NA | 59.75 | 107.73 | 20.05 | 129.85 | 40.66 | 0.24 | 1.67 | 25.00 | ||||||||||||||||||||||||||||||||||||||||||||||||||
| BHBK |
Blue Hills Bancorp, Inc. | MA | 17.49 | 17.08 | 0.35 | 1.81 | 0.37 | 1.87 | 0.68 | 119.52 | 50.11 | 98.07 | 17.15 | 100.94 | 48.06 | 0.12 | 0.86 | 25.00 | ||||||||||||||||||||||||||||||||||||||||||||||||||
| BOFI |
BofI Holding, Inc. | CA | 8.99 | 8.99 | 1.75 | 19.32 | 1.74 | 19.23 | NA | NA | 9.70 | 167.15 | 14.93 | 167.15 | 9.74 | NA | NA | NM | ||||||||||||||||||||||||||||||||||||||||||||||||||
| BYFC |
Broadway Financial Corporation | CA | 11.56 | 11.56 | 1.94 | 17.13 | NA | NA | NA | NA | 7.16 | 110.21 | 12.74 | 110.21 | NA | 0.04 | 0.00 | NM | ||||||||||||||||||||||||||||||||||||||||||||||||||
| BLMT |
BSB Bancorp, Inc. | MA | 7.73 | 7.73 | 0.53 | 6.41 | NA | NA | 0.41 | 156.87 | 21.98 | 137.25 | 10.61 | 137.25 | NA | NA | NA | NM | ||||||||||||||||||||||||||||||||||||||||||||||||||
| CFFN |
Capitol Federal Financial, Inc. | KS | 14.94 | 14.94 | 0.72 | 5.77 | 0.72 | 5.74 | 0.58 | 18.85 | 23.33 | 141.43 | 21.13 | 141.43 | 23.47 | 0.34 | 2.39 | 137.70 | ||||||||||||||||||||||||||||||||||||||||||||||||||
| CARV |
Carver Bancorp, Inc. | NY | 7.30 | 7.30 | 0.05 | 0.59 | -0.07 | -0.84 | 2.54 | 28.41 | 44.60 | 165.72 | 2.32 | 165.72 | NM | 0.00 | 0.00 | NM | ||||||||||||||||||||||||||||||||||||||||||||||||||
| CFBK |
Central Federal Corporation | OH | 10.91 | 10.91 | 1.34 | 12.67 | 1.34 | 12.67 | 2.25 | 106.47 | 6.45 | 79.91 | 6.35 | 79.91 | 6.45 | 0.00 | 0.00 | NM | ||||||||||||||||||||||||||||||||||||||||||||||||||
| CHFN |
Charter Financial Corporation | GA | 13.99 | 11.97 | 0.78 | 4.24 | 0.83 | 4.52 | 0.81 | 120.88 | 23.91 | 100.73 | 14.10 | 120.51 | 22.08 | 0.20 | 1.49 | 35.71 | ||||||||||||||||||||||||||||||||||||||||||||||||||
| CSBK |
Clifton Bancorp Inc. | NJ | 24.07 | 24.07 | 0.40 | 1.45 | 0.39 | 1.43 | NA | NA | NM | 113.43 | 27.30 | 113.43 | 79.24 | 0.24 | 1.61 | 126.32 | ||||||||||||||||||||||||||||||||||||||||||||||||||
| CWAY |
Coastway Bancorp, Inc. | RI | 11.34 | 11.34 | 0.46 | 3.60 | 0.46 | 3.60 | 1.64 | 26.53 | 21.72 | 82.71 | 9.38 | 82.71 | 21.72 | NA | NA | NM | ||||||||||||||||||||||||||||||||||||||||||||||||||
| DCOM |
Dime Community Bancshares, Inc. | NY | 9.89 | 8.98 | 1.63 | 16.36 | NA | NA | 0.26 | 144.15 | 7.74 | 119.35 | 11.81 | 132.79 | NA | 0.56 | 3.21 | 24.89 | ||||||||||||||||||||||||||||||||||||||||||||||||||
| ESBK |
Elmira Savings Bank | NY | 9.64 | 7.65 | 0.74 | 7.57 | 0.72 | 7.44 | NA | NA | 16.08 | 115.65 | 9.34 | 158.62 | 16.53 | 0.92 | 4.77 | 76.67 | ||||||||||||||||||||||||||||||||||||||||||||||||||
| ENFC |
Entegra Financial Corp. | NC | 11.51 | 11.29 | 0.64 | 5.00 | 0.73 | 5.71 | NA | NA | 17.21 | 82.68 | 9.51 | 84.48 | 15.03 | NA | NA | NM | ||||||||||||||||||||||||||||||||||||||||||||||||||
| EQFN |
Equitable Financial Corp. | NE | 15.18 | 15.18 | 0.42 | 3.17 | 0.42 | 3.24 | NA | NA | 31.94 | 82.98 | 12.59 | 82.98 | 31.27 | NA | NA | NM | ||||||||||||||||||||||||||||||||||||||||||||||||||
| ESSA |
ESSA Bancorp, Inc. | PA | 10.04 | 9.20 | 0.50 | 4.89 | 0.51 | 4.92 | NA | NA | 17.28 | 89.82 | 9.02 | 99.01 | 17.14 | 0.36 | 2.57 | 44.44 | ||||||||||||||||||||||||||||||||||||||||||||||||||
| FCAP |
First Capital, Inc. | IN | NA | NA | 0.93 | NA | 0.99 | 8.97 | 1.31 | 58.89 | 17.82 | 148.04 | NA | 165.08 | 16.61 | 0.84 | 2.49 | 44.44 | ||||||||||||||||||||||||||||||||||||||||||||||||||
| FBNK |
First Connecticut Bancorp, Inc. | CT | 9.08 | 9.08 | 0.51 | 5.59 | 0.50 | 5.47 | 1.07 | 70.55 | 17.82 | 102.78 | 9.33 | 102.78 | 18.21 | 0.28 | 1.71 | 28.26 | ||||||||||||||||||||||||||||||||||||||||||||||||||
| FDEF |
First Defiance Financial Corp. | OH | 11.89 | 9.52 | 1.20 | 9.91 | 1.21 | 9.96 | 1.13 | 99.53 | 14.27 | 134.93 | 16.05 | 173.23 | 14.19 | 0.88 | 2.04 | 28.48 | ||||||||||||||||||||||||||||||||||||||||||||||||||
| FNWB |
First Northwest Bancorp | WA | 18.78 | NA | 0.41 | 2.09 | 0.39 | 1.97 | NA | NA | 40.03 | 88.26 | 16.58 | NA | 42.62 | NA | NA | NM | ||||||||||||||||||||||||||||||||||||||||||||||||||
| FBC |
Flagstar Bancorp, Inc. | MI | 11.63 | 11.63 | 1.27 | 10.67 | NA | NA | 1.03 | 122.95 | 11.72 | 116.26 | 11.48 | 116.26 | NA | 0.00 | 0.00 | NM | ||||||||||||||||||||||||||||||||||||||||||||||||||
| FSBW |
FS Bancorp, Inc. | WA | 9.70 | 9.20 | 1.20 | 11.54 | 1.34 | 12.87 | 0.09 | NM | 9.82 | 111.71 | 10.84 | 118.42 | 8.81 | 0.40 | 1.44 | 12.01 | ||||||||||||||||||||||||||||||||||||||||||||||||||
| FSBC |
FSB Bancorp, Inc. | NY | 7.93 | 7.93 | 0.23 | 2.67 | NA | NA | NA | NA | 40.90 | 109.05 | NA | 109.05 | NA | NA | NA | NM | ||||||||||||||||||||||||||||||||||||||||||||||||||
| GTWN |
Georgetown Bancorp, Inc. | MA | 10.80 | 10.80 | 0.39 | 3.63 | NA | NA | NA | NA | 31.46 | 116.22 | 12.55 | 116.22 | NA | 0.20 | 0.98 | 30.00 | ||||||||||||||||||||||||||||||||||||||||||||||||||
| HBK |
Hamilton Bancorp, Inc. | MD | 11.80 | 9.96 | -0.14 | -0.90 | 0.04 | 0.25 | NA | NA | NM | 76.12 | 8.98 | 92.02 | 228.17 | NA | NA | NM | ||||||||||||||||||||||||||||||||||||||||||||||||||
| HIFS |
Hingham Institution for Savings | MA | 7.74 | 7.74 | 1.20 | 15.26 | 1.18 | 15.08 | 0.30 | 179.47 | 13.50 | 192.13 | 14.87 | 192.13 | 13.65 | 1.20 | 0.90 | 15.12 | ||||||||||||||||||||||||||||||||||||||||||||||||||
| HMNF |
HMN Financial, Inc. | MN | 11.22 | 11.05 | 0.82 | 7.35 | 0.79 | 7.15 | 0.95 | 215.46 | 12.93 | 87.04 | 9.77 | 88.62 | 13.31 | 0.00 | 0.00 | NM | ||||||||||||||||||||||||||||||||||||||||||||||||||
| HFBL |
Home Federal Bancorp, Inc. of Louisiana | LA | 11.37 | 11.37 | 0.91 | 7.53 | 0.91 | 7.53 | NA | NA | 13.30 | 104.99 | 11.94 | 104.99 | 13.30 | 0.36 | 1.56 | 18.97 | ||||||||||||||||||||||||||||||||||||||||||||||||||
| IROQ |
IF Bancorp, Inc. | IL | 14.08 | 14.08 | 0.59 | 4.02 | 0.54 | 3.67 | 0.94 | 99.47 | 21.99 | 92.26 | 12.99 | 92.26 | 24.07 | 0.16 | 0.85 | 15.12 | ||||||||||||||||||||||||||||||||||||||||||||||||||
| ISBC |
Investors Bancorp, Inc. | NJ | 14.42 | NA | 0.87 | 5.50 | 0.86 | 5.42 | 0.53 | 196.01 | 19.57 | 113.59 | 16.38 | 117.39 | 19.69 | 0.24 | 2.11 | 39.66 | ||||||||||||||||||||||||||||||||||||||||||||||||||
| JXSB |
Jacksonville Bancorp, Inc. | IL | 15.27 | 14.53 | 0.98 | 6.46 | 0.91 | 6.01 | NA | NA | 16.98 | 106.61 | 16.28 | 113.06 | 18.24 | 0.40 | 1.41 | 81.44 | ||||||||||||||||||||||||||||||||||||||||||||||||||
| KRNY |
Kearny Financial Corp. | NJ | 25.50 | 23.65 | 0.36 | 1.36 | 0.36 | 1.37 | NA | NA | NM | 104.41 | 26.63 | 115.37 | 72.01 | 0.08 | 0.61 | 44.44 | ||||||||||||||||||||||||||||||||||||||||||||||||||
| MLVF |
Malvern Bancorp, Inc. | PA | 10.88 | 10.88 | 0.75 | 6.45 | 0.70 | 6.06 | 0.46 | 178.34 | 19.04 | 121.07 | 13.17 | 121.07 | 20.26 | 0.11 | 0.00 | NM | ||||||||||||||||||||||||||||||||||||||||||||||||||
| MELR |
Melrose Bancorp, Inc. | MA | 18.53 | 18.53 | 0.31 | 1.54 | 0.31 | 1.54 | 0.00 | NM | 55.36 | 93.64 | 17.36 | 93.64 | 55.32 | NA | NA | NM | ||||||||||||||||||||||||||||||||||||||||||||||||||
| EBSB |
Meridian Bancorp, Inc. | MA | 14.93 | 14.63 | 0.73 | 4.42 | 0.73 | 4.41 | NA | NA | 31.06 | 139.29 | 20.80 | 142.62 | 31.15 | 0.12 | 0.79 | 24.49 | ||||||||||||||||||||||||||||||||||||||||||||||||||
| CASH |
Meta Financial Group, Inc. | SD | 10.58 | 8.63 | 1.13 | 11.36 | 1.37 | 13.75 | 0.04 | 536.37 | 14.65 | 144.15 | 15.25 | 180.51 | 12.06 | 0.52 | 0.92 | 13.54 | ||||||||||||||||||||||||||||||||||||||||||||||||||
| MSBF |
MSB Financial Corp. | NJ | 19.04 | 19.04 | 0.17 | 0.89 | 0.26 | 1.35 | NA | NA | NM | 103.77 | 19.76 | 103.77 | 119.45 | 0.00 | 0.00 | NM | ||||||||||||||||||||||||||||||||||||||||||||||||||
| NYCB |
New York Community Bancorp, Inc. | NY | 12.32 | 7.73 | -0.07 | -0.57 | 1.14 | 9.47 | 0.13 | 365.48 | NM | 116.93 | 14.40 | 196.06 | 12.15 | 0.68 | 4.69 | NM | ||||||||||||||||||||||||||||||||||||||||||||||||||
| NFBK |
Northfield Bancorp, Inc. | NJ | 16.45 | 15.53 | 0.61 | 3.58 | NA | NA | 0.91 | 71.26 | 32.83 | 121.17 | 19.93 | 129.68 | NA | 0.32 | 2.07 | 63.83 | ||||||||||||||||||||||||||||||||||||||||||||||||||
| NWBI |
Northwest Bancshares, Inc. | PA | 12.89 | 10.18 | 0.45 | 3.48 | 0.83 | 6.40 | 1.25 | 56.86 | 37.75 | 133.92 | 17.26 | 174.80 | 20.51 | 0.60 | 3.97 | 147.50 | ||||||||||||||||||||||||||||||||||||||||||||||||||
| OCFC |
OceanFirst Financial Corp. | NJ | 10.11 | 8.51 | 0.63 | 6.47 | 0.87 | 9.01 | 1.32 | 38.34 | 18.86 | 118.66 | 12.00 | 143.57 | 14.09 | 0.52 | 2.76 | 52.00 | ||||||||||||||||||||||||||||||||||||||||||||||||||
| ORIT |
Oritani Financial Corp. | NJ | 14.59 | 14.59 | 1.50 | 9.92 | 1.12 | 7.38 | NA | NA | 13.46 | 137.72 | 20.09 | 137.72 | 18.08 | 0.70 | 4.30 | 99.17 | ||||||||||||||||||||||||||||||||||||||||||||||||||
| PBHC |
Pathfinder Bancorp, Inc. | NY | NA | NA | 0.50 | NA | 0.43 | 4.10 | NA | NA | 16.58 | 88.35 | NA | 95.97 | 19.63 | 0.20 | 1.65 | 27.40 | ||||||||||||||||||||||||||||||||||||||||||||||||||
| PBBI |
PB Bancorp, Inc. | CT | 17.02 | 15.85 | 0.24 | 2.01 | 0.25 | 2.11 | NA | NA | 57.08 | 79.24 | 13.49 | 86.28 | 54.63 | 0.12 | 1.41 | 76.15 | ||||||||||||||||||||||||||||||||||||||||||||||||||
| PBSK |
Poage Bankshares, Inc. | KY | 16.22 | 15.73 | 0.72 | 4.40 | 0.73 | 4.48 | 1.29 | 53.81 | 21.47 | 98.64 | 16.00 | 102.32 | 21.11 | 0.32 | 1.75 | 30.59 | ||||||||||||||||||||||||||||||||||||||||||||||||||
| PROV |
Provident Financial Holdings, Inc. | CA | 11.41 | 11.41 | 0.66 | 5.60 | 0.67 | 5.65 | NA | NA | 21.56 | 115.73 | 13.21 | 115.73 | 21.37 | 0.52 | 2.68 | 54.44 | ||||||||||||||||||||||||||||||||||||||||||||||||||
| PFS |
Provident Financial Services, Inc. | NJ | 13.33 | NA | 0.95 | 7.02 | 0.95 | 7.02 | NA | NA | 15.41 | 110.53 | 14.73 | 171.87 | 15.09 | 0.72 | 3.49 | 52.24 | ||||||||||||||||||||||||||||||||||||||||||||||||||
| PBIP |
Prudential Bancorp, Inc. | PA | 20.33 | 20.33 | 0.34 | 1.51 | 0.31 | 1.40 | NA | NA | 64.91 | 101.64 | 20.66 | 101.64 | 69.11 | 0.12 | 0.84 | 54.55 | ||||||||||||||||||||||||||||||||||||||||||||||||||
| RNDB |
Randolph Bancorp, Inc. | MA | 7.49 | 7.49 | NA | NA | NA | NA | NA | NA | NA | NA | NA | NA | NA | NA | NA | NA | ||||||||||||||||||||||||||||||||||||||||||||||||||
| RVSB |
Riverview Bancorp, Inc. | WA | 11.80 | 9.31 | 0.72 | 6.00 | 0.72 | 6.03 | NA | NA | 16.72 | 99.25 | 11.71 | 129.31 | 16.81 | 0.08 | 1.65 | 25.00 | ||||||||||||||||||||||||||||||||||||||||||||||||||
| SVBI |
Severn Bancorp, Inc. | MD | 12.53 | 12.50 | 2.03 | 17.94 | 2.03 | 17.94 | 4.24 | 27.07 | 5.58 | 94.31 | 10.05 | 94.70 | 5.58 | 0.00 | 0.00 | NM | ||||||||||||||||||||||||||||||||||||||||||||||||||
| SIFI |
SI Financial Group, Inc. | CT | 10.46 | 9.40 | 0.38 | 3.66 | NA | NA | NA | NA | 27.31 | 100.85 | 10.55 | 113.57 | NA | 0.16 | 1.22 | 33.33 | ||||||||||||||||||||||||||||||||||||||||||||||||||
| SBCP |
Sunshine Bancorp, Inc. | FL | 14.03 | 12.32 | -0.31 | -2.17 | -0.34 | -2.37 | NA | NA | NM | 103.34 | 14.50 | 120.03 | NM | NA | NA | NM | ||||||||||||||||||||||||||||||||||||||||||||||||||
| TBNK |
Territorial Bancorp Inc. | HI | 12.19 | 12.19 | 0.84 | 6.86 | 0.82 | 6.74 | NA | NA | 17.36 | 121.88 | 14.86 | 121.88 | 17.67 | 0.72 | 2.53 | 49.39 | ||||||||||||||||||||||||||||||||||||||||||||||||||
| TSBK |
Timberland Bancorp, Inc. | WA | 11.01 | 10.42 | 1.25 | 11.51 | 1.25 | 11.53 | 1.89 | 92.57 | 10.47 | 113.87 | 12.53 | 121.12 | 10.45 | 0.36 | 2.32 | 25.00 | ||||||||||||||||||||||||||||||||||||||||||||||||||
| TRST |
TrustCo Bank Corp NY | NY | 8.91 | 8.90 | 0.88 | 10.00 | 0.87 | 9.90 | 0.91 | 112.28 | 15.85 | 153.36 | 13.66 | 153.56 | 16.02 | 0.26 | 3.80 | 60.21 | ||||||||||||||||||||||||||||||||||||||||||||||||||
| UCBA |
United Community Bancorp | IN | 13.28 | 12.80 | 0.64 | 4.80 | 0.62 | 4.64 | 1.19 | 84.24 | 18.99 | 91.61 | 12.17 | 95.59 | 19.72 | 0.24 | 1.60 | 30.38 | ||||||||||||||||||||||||||||||||||||||||||||||||||
| UCFC |
United Community Financial Corp. | OH | 12.21 | 12.15 | 0.86 | 6.96 | 0.84 | 6.77 | NA | NA | 18.87 | 124.98 | 15.26 | 125.75 | 19.39 | 0.12 | 1.76 | 29.01 | ||||||||||||||||||||||||||||||||||||||||||||||||||
| UBNK |
United Financial Bancorp, Inc. | CT | 10.04 | 8.30 | 0.73 | 7.07 | 0.83 | 8.06 | 0.92 | 64.75 | 15.16 | 105.27 | 10.57 | 129.85 | 13.31 | 0.48 | 3.56 | 53.93 | ||||||||||||||||||||||||||||||||||||||||||||||||||
| WSBF |
Waterstone Financial, Inc. | WI | 22.26 | 22.24 | 1.14 | 5.04 | 1.14 | 5.04 | 1.53 | 83.33 | 21.58 | 114.66 | 25.53 | 114.84 | 21.58 | 0.32 | 2.03 | 31.51 | ||||||||||||||||||||||||||||||||||||||||||||||||||
| WAYN |
Wayne Savings Bancshares, Inc. | OH | 9.18 | 8.84 | 0.54 | 5.83 | 0.54 | 5.83 | NA | NA | 15.49 | 88.80 | 8.16 | 92.66 | 15.49 | 0.36 | 2.73 | 42.35 | ||||||||||||||||||||||||||||||||||||||||||||||||||
| WCFB |
WCF Bancorp, Inc. | IA | 12.91 | NA | 0.35 | 2.68 | 0.22 | 1.69 | NA | 103.48 | 53.68 | 144.48 | 18.66 | 143.99 | 84.95 | 0.20 | 2.33 | 108.13 | ||||||||||||||||||||||||||||||||||||||||||||||||||
| WEBK |
Wellesley Bancorp, Inc. | MA | 8.45 | 8.45 | 0.50 | 5.84 | NA | NA | NA | NA | 16.14 | 95.14 | 8.04 | 95.14 | NA | 0.16 | 0.76 | 9.92 | ||||||||||||||||||||||||||||||||||||||||||||||||||
| WBB |
Westbury Bancorp, Inc. | WI | 11.79 | 11.79 | 0.80 | 6.84 | 0.74 | 6.35 | 0.65 | 140.14 | 13.96 | 100.54 | 11.85 | 100.54 | 15.05 | NA | NA | NM | ||||||||||||||||||||||||||||||||||||||||||||||||||
| WFD |
Westfield Financial, Inc. | MA | 11.07 | 11.07 | 0.40 | 3.88 | 0.40 | 3.90 | NA | NA | 25.27 | 96.07 | 10.63 | 96.07 | 25.37 | 0.12 | 1.58 | 40.00 | ||||||||||||||||||||||||||||||||||||||||||||||||||
Exhibit IV-1B
Weekly Thrift Market Line - Part Two
Prices As of August 5, 2016
| Key Financial Ratios | Asset Quality Ratios | Pricing Ratios | Dividend Data (6) | |||||||||||||||||||||||||||||||||||||||||||||||||||||||||||||||||
| Equity/ | Tang Equity/ | Reported Earnings | Core Earnings | NPAs/ | Rsvs/ | Price/ | Price/ | Price/ | Price/ | Price/ | Div/ | Dividend | Payout | |||||||||||||||||||||||||||||||||||||||||||||||||||||||
| Assets(1) | Assets(1) | ROA(5) | ROE(5) | ROA(5) | ROE(5) | Assets | NPLs | Earnings | Book | Assets | Tang Book | Core Earnings | Share | Yield | Ratio (7) | |||||||||||||||||||||||||||||||||||||||||||||||||||||
| (%) | (%) | (%) | (%) | (%) | (%) | (%) | (%) | (x) | (%) | (%) | (%) | (x) | ($) | (%) | (%) | |||||||||||||||||||||||||||||||||||||||||||||||||||||
| Companies |
||||||||||||||||||||||||||||||||||||||||||||||||||||||||||||||||||||
| WBKC |
Wolverine Bancorp, Inc. | MI | 15.92 | 15.92 | 0.92 | 5.55 | 0.92 | 5.55 | NA | NA | 15.63 | 90.88 | 14.47 | 90.88 | 15.63 | NA | NA | 60.24 | ||||||||||||||||||||||||||||||||||||||||||||||||||
| WSFS |
WSFS Financial Corporation | DE | 10.58 | NA | 1.13 | 10.82 | 1.29 | 12.33 | 0.54 | 131.74 | 17.51 | 173.50 | 18.36 | 212.48 | 15.17 | 0.24 | 0.66 | 11.59 | ||||||||||||||||||||||||||||||||||||||||||||||||||
| WVFC |
WVS Financial Corp. | PA | 9.85 | 9.85 | 0.40 | 4.08 | NA | NA | NA | NA | 17.25 | 73.37 | 7.23 | 73.37 | NA | 0.16 | 1.34 | 34.78 | ||||||||||||||||||||||||||||||||||||||||||||||||||
| GCBC |
Greene County Bancorp, Inc. (MHC) | NY | 8.55 | 8.55 | 1.12 | 12.67 | NA | NA | NA | NA | 16.08 | 194.49 | 16.63 | 194.49 | NA | 0.38 | 2.23 | 35.14 | ||||||||||||||||||||||||||||||||||||||||||||||||||
| MHCs |
||||||||||||||||||||||||||||||||||||||||||||||||||||||||||||||||||||
| HONE |
HarborOne Bancorp, Inc. (MHC) | MA | 14.31 | 13.79 | 0.15 | 1.67 | 0.28 | 3.20 | NA | NA | NA | 139.36 | 19.94 | 145.48 | NA | NA | NA | NA | ||||||||||||||||||||||||||||||||||||||||||||||||||
| KFFB |
Kentucky First Federal Bancorp (MHC) | KY | 22.94 | 18.94 | 0.56 | 2.45 | 0.56 | 2.45 | NA | NA | 41.05 | 103.27 | 23.69 | 131.56 | 41.05 | 0.40 | 4.87 | 200.00 | ||||||||||||||||||||||||||||||||||||||||||||||||||
| LSBK |
Lake Shore Bancorp, Inc. (MHC) | NY | 16.05 | 16.05 | 0.99 | 6.29 | NA | NA | NA | NA | 17.18 | 108.14 | NA | 108.14 | NA | 0.28 | 2.06 | 35.44 | ||||||||||||||||||||||||||||||||||||||||||||||||||
| MGYR |
Magyar Bancorp, Inc. (MHC) | NJ | 8.36 | 8.36 | 0.19 | 2.26 | NA | NA | NA | NA | 54.22 | 119.59 | 10.00 | 119.59 | NA | NA | NA | NM | ||||||||||||||||||||||||||||||||||||||||||||||||||
| OFED |
Oconee Federal Financial Corp. (MHC) | SC | 17.47 | 16.89 | 1.05 | 6.25 | 1.05 | 6.26 | 1.03 | 35.46 | 22.44 | 134.41 | 23.48 | 140.00 | 22.38 | 0.40 | 2.07 | 46.51 | ||||||||||||||||||||||||||||||||||||||||||||||||||
| PVBC |
Provident Bancorp, Inc. (MHC) | MA | 14.06 | 14.06 | 0.61 | 4.20 | 0.78 | 5.37 | NA | NA | NA | 141.06 | 19.84 | 141.06 | NA | NA | NA | NA | ||||||||||||||||||||||||||||||||||||||||||||||||||
| TFSL |
TFS Financial Corporation (MHC) | OH | 13.30 | 13.23 | 0.65 | 4.69 | NA | NA | 1.66 | 32.38 | 65.71 | 313.44 | 41.69 | 315.27 | NA | 0.40 | 2.17 | 142.86 | ||||||||||||||||||||||||||||||||||||||||||||||||||
| AF |
Astoria Financial Corporation | NY | 11.29 | 10.18 | 0.49 | 4.47 | 0.51 | 4.62 | NA | NA | 22.82 | 96.00 | 10.10 | 108.88 | 21.96 | 0.16 | 1.08 | 24.62 | ||||||||||||||||||||||||||||||||||||||||||||||||||
| Under Acquisition |
||||||||||||||||||||||||||||||||||||||||||||||||||||||||||||||||||||
| CBNK |
Chicopee Bancorp, Inc. | MA | 12.79 | 12.79 | 0.42 | 3.20 | 0.49 | 3.76 | NA | NA | 32.56 | 107.99 | 13.81 | 107.99 | 28.07 | 0.36 | 1.94 | 61.40 | ||||||||||||||||||||||||||||||||||||||||||||||||||
| EVER |
EverBank Financial Corp | FL | 6.79 | 6.63 | 0.48 | 6.72 | 0.49 | 6.81 | 0.58 | 58.58 | 20.71 | 136.82 | 8.59 | 140.80 | 20.41 | 0.24 | 1.29 | 26.67 | ||||||||||||||||||||||||||||||||||||||||||||||||||
| LSBG |
Lake Sunapee Bank Group | NH | 8.89 | 5.83 | 0.60 | 6.49 | 0.64 | 6.99 | NA | NA | 16.29 | 104.33 | 9.27 | 164.50 | 15.10 | 0.56 | 3.18 | 51.85 | ||||||||||||||||||||||||||||||||||||||||||||||||||
| (1) | Average of High/Low or Bid/Ask price per share. |
| (2) | Or since offering price if converted of first listed in the past 52 weeks. Percent change figures are actual year-to-date and are not annualized. |
| (3) | EPS (earnings per share) is based on actual trailing 12 month data and is not shown on a pro forma basis. |
| (4) | Exludes intangibles (such as goodwill, value of core deposits, etc.). |
| (5) | ROA (return on assets) and ROE (return on equity) are indicated ratios based on trailing 12 month common earnings and average common equity and total assets balances. |
| (6) | Annualized based on last regular quarterly cash dividend announcement. |
| (7) | Indicated dividend as a percent of trailing 12 month earnings. |
| (8) | Excluded from averages due to actual or rumored acquisition activities or unusual operating characteristics. |
| (9) | For MHC institutions, market value reflects share price multiplied by public (non-MHC) shares. |
Source: SNL Financial, LC. and RP® Financial, LC. calculations. The information provided in this table has been obtained from sources we believe are reliable, but we cannot guarantee the accuracy or completeness of such information.
Copyright (c) 2016 by RP® Financial, LC.
EXHIBIT IV-2
Historical Stock Price Indices
Exhibit IV-2
Historical Stock Price Indices(1)
| SNL | SNL | |||||||||||||||||||||
| NASDAQ | Thrift | Bank | ||||||||||||||||||||
| Year/Qtr. Ended |
DJIA | S&P 500 | Composite | Index | Index | |||||||||||||||||
| 2004: |
Quarter 1 | 10357.7 | 1126.2 | 1994.2 | 1585.3 | 562.20 | ||||||||||||||||
| Quarter 2 | 10435.5 | 1140.8 | 2047.8 | 1437.8 | 546.62 | |||||||||||||||||
| Quarter 3 | 10080.3 | 1114.6 | 1896.8 | 1495.1 | 556.00 | |||||||||||||||||
| Quarter 4 | 10783.0 | 1211.9 | 2175.4 | 1605.6 | 595.10 | |||||||||||||||||
| 2005: |
Quarter 1 | 10503.8 | 1180.6 | 1999.2 | 1516.6 | 551.00 | ||||||||||||||||
| Quarter 2 | 10275.0 | 1191.3 | 2057.0 | 1577.1 | 563.27 | |||||||||||||||||
| Quarter 3 | 10568.7 | 1228.8 | 2151.7 | 1527.2 | 546.30 | |||||||||||||||||
| Quarter 4 | 10717.5 | 1248.3 | 2205.3 | 1616.4 | 582.80 | |||||||||||||||||
| 2006: |
Quarter 1 | 11109.3 | 1294.8 | 2339.8 | 1661.1 | 595.50 | ||||||||||||||||
| Quarter 2 | 11150.2 | 1270.2 | 2172.1 | 1717.9 | 601.14 | |||||||||||||||||
| Quarter 3 | 11679.1 | 1335.9 | 2258.4 | 1727.1 | 634.00 | |||||||||||||||||
| Quarter 4 | 12463.2 | 1418.3 | 2415.3 | 1829.3 | 658.60 | |||||||||||||||||
| 2007: |
Quarter 1 | 12354.4 | 1420.9 | 2421.6 | 1703.6 | 634.40 | ||||||||||||||||
| Quarter 2 | 13408.6 | 1503.4 | 2603.2 | 1645.9 | 622.63 | |||||||||||||||||
| Quarter 3 | 13895.6 | 1526.8 | 2701.5 | 1523.3 | 595.80 | |||||||||||||||||
| Quarter 4 | 13264.8 | 1468.4 | 2652.3 | 1058.0 | 492.85 | |||||||||||||||||
| 2008: |
Quarter 1 | 12262.9 | 1322.7 | 2279.1 | 1001.5 | 442.5 | ||||||||||||||||
| Quarter 2 | 11350.0 | 1280.0 | 2293.0 | 822.6 | 332.2 | |||||||||||||||||
| Quarter 3 | 10850.7 | 1166.4 | 2082.3 | 760.1 | 414.8 | |||||||||||||||||
| Quarter 4 | 8776.4 | 903.3 | 1577.0 | 653.9 | 268.3 | |||||||||||||||||
| 2009: |
Quarter 1 | 7608.9 | 797.9 | 1528.6 | 542.8 | 170.1 | ||||||||||||||||
| Quarter 2 | 8447.0 | 919.3 | 1835.0 | 538.8 | 227.6 | |||||||||||||||||
| Quarter 3 | 9712.3 | 1057.1 | 2122.4 | 561.4 | 282.9 | |||||||||||||||||
| Quarter 4 | 10428.1 | 1115.1 | 2269.2 | 587.0 | 260.8 | |||||||||||||||||
| 2010: |
Quarter 1 | 10856.6 | 1169.4 | 2398.0 | 626.3 | 301.1 | ||||||||||||||||
| Quarter 2 | 9744.0 | 1030.7 | 2109.2 | 564.5 | 257.2 | |||||||||||||||||
| Quarter 3 | 9744.0 | 1030.7 | 2109.2 | 564.5 | 257.2 | |||||||||||||||||
| Quarter 4 | 11577.5 | 1257.6 | 2652.9 | 592.2 | 290.1 | |||||||||||||||||
| 2011: |
Quarter 1 | 12319.7 | 1325.8 | 2781.1 | 578.1 | 293.1 | ||||||||||||||||
| Quarter 2 | 12414.3 | 1320.6 | 2773.5 | 540.8 | 266.8 | |||||||||||||||||
| Quarter 3 | 10913.4 | 1131.4 | 2415.4 | 443.2 | 198.9 | |||||||||||||||||
| Quarter 4 | 12217.6 | 1257.6 | 2605.2 | 481.4 | 221.3 | |||||||||||||||||
| 2012: |
Quarter 1 | 13212.0 | 1408.5 | 3091.6 | 529.3 | 284.9 | ||||||||||||||||
| Quarter 2 | 12880.1 | 1362.2 | 2935.1 | 511.6 | 257.3 | |||||||||||||||||
| Quarter 3 | 13437.1 | 1440.7 | 3116.2 | 557.6 | 276.8 | |||||||||||||||||
| Quarter 4 | 13104.1 | 1426.2 | 3019.5 | 565.8 | 292.7 | |||||||||||||||||
| 2013: |
Quarter 1 | 14578.5 | 1569.2 | 3267.5 | 602.3 | 318.9 | ||||||||||||||||
| Quarter 2 | 14909.6 | 1606.3 | 3404.3 | 625.3 | 346.7 | |||||||||||||||||
| Quarter 3 | 15129.7 | 1681.6 | 3771.5 | 650.8 | 354.4 | |||||||||||||||||
| Quarter 4 | 16576.7 | 1848.4 | 4176.6 | 706.5 | 394.4 | |||||||||||||||||
| 2014: |
Quarter 1 | 16457.7 | 1872.3 | 4199.0 | 718.9 | 410.8 | ||||||||||||||||
| Quarter 2 | 16826.6 | 1960.2 | 4408.2 | 723.9 | 405.2 | |||||||||||||||||
| Quarter 3 | 17042.9 | 1972.3 | 4493.4 | 697.7 | 411.0 | |||||||||||||||||
| Quarter 4 | 17823.1 | 2058.9 | 4736.1 | 738.7 | 432.8 | |||||||||||||||||
| 2015: |
Quarter 1 | 17776.1 | 2067.9 | 4900.9 | 749.3 | 418.8 | ||||||||||||||||
| Quarter 2 | 17619.5 | 2063.1 | 4986.9 | 795.7 | 448.4 | |||||||||||||||||
| Quarter 3 | 16284.7 | 1920.0 | 4620.2 | 811.7 | 409.4 | |||||||||||||||||
| Quarter 4 | 17425.0 | 2043.9 | 5007.4 | 809.1 | 431.5 | |||||||||||||||||
| 2016: |
Quarter 1 | 17685.1 | 2059.7 | 4869.9 | 788.1 | 381.4 | ||||||||||||||||
| Quarter 2 | 17930.0 | 2098.9 | 4842.7 | 780.9 | 385.6 | |||||||||||||||||
| As of August 5, 2016 |
18543.5 | 2182.9 | 5221.1 | 812.1 | 412.9 | |||||||||||||||||
| (1) | End of period data. |
Sources: SNL Financial and The Wall Street Journal.
EXHIBIT IV-3
Stock Indices as of August 5, 2016
Index Values
| Industry: | Savings Bank/Thrift/Mutual | |
| Geography: | United States and Canada |
| Last | Change (%) | Price / Earnings |
||||||||||||||||||||||||||||||||||||||
| Close | Update | 1 Day | 1 Week | MTD | QTD | YTD | 1 Year | 3 Years | (x) | |||||||||||||||||||||||||||||||
| SNL Custom** Indexes |
||||||||||||||||||||||||||||||||||||||||
| SNL Banking Indexes |
||||||||||||||||||||||||||||||||||||||||
| SNL U.S. Bank and Thrift |
397.05 | 8/8/2016 | 0.05 | 3.61 | 2.94 | 7.02 | (4.13 | ) | (9.07 | ) | 11.54 | 13.4 | ||||||||||||||||||||||||||||
| SNL U.S. Thrift |
811.30 | 8/8/2016 | (0.10 | ) | 1.69 | 1.40 | 3.89 | 0.28 | (0.13 | ) | 21.92 | 29.0 | ||||||||||||||||||||||||||||
| SNL TARP Participants |
66.42 | 8/8/2016 | 0.37 | 1.06 | 0.33 | 12.92 | 27.01 | 9.83 | (18.97 | ) | 14.4 | |||||||||||||||||||||||||||||
| S&P 500 Bank |
219.62 | 8/5/2016 | 2.95 | 3.10 | 3.10 | 7.07 | (6.24 | ) | (12.23 | ) | 8.28 | NA | ||||||||||||||||||||||||||||
| NASDAQ Bank |
2,900.52 | 8/8/2016 | (0.34 | ) | 2.83 | 2.06 | 6.09 | 1.66 | 0.55 | 21.36 | NA | |||||||||||||||||||||||||||||
| SNL Asset Size Indexes |
||||||||||||||||||||||||||||||||||||||||
| SNL U.S. Thrift < $250M |
1,099.70 | 8/8/2016 | 0.77 | 0.77 | 0.92 | 3.15 | 1.64 | 7.16 | 23.90 | 47.8 | ||||||||||||||||||||||||||||||
| SNL U.S. Thrift $250M-$500M |
5,120.21 | 8/8/2016 | (0.12 | ) | 0.09 | 0.44 | 1.79 | 1.21 | 5.69 | 33.04 | 25.1 | |||||||||||||||||||||||||||||
| SNL U.S. Thrift < $500M |
1,751.77 | 8/8/2016 | (0.04 | ) | 0.14 | 0.49 | 1.96 | 1.37 | 5.99 | 33.00 | 27.5 | |||||||||||||||||||||||||||||
| SNL U.S. Thrift $500M-$1B |
2,320.70 | 8/8/2016 | (0.39 | ) | 0.31 | 0.49 | 2.36 | 2.84 | 10.74 | 41.22 | 21.8 | |||||||||||||||||||||||||||||
| SNL U.S. Thrift $1B-$5B |
2,831.22 | 8/8/2016 | (0.25 | ) | 1.42 | 1.25 | 3.88 | 3.68 | 9.98 | 37.31 | 22.7 | |||||||||||||||||||||||||||||
| SNL U.S. Thrift $5B-$10B |
844.50 | 8/8/2016 | (0.14 | ) | 3.05 | 2.49 | 4.51 | 5.29 | (1.01 | ) | 5.14 | 24.8 | ||||||||||||||||||||||||||||
| SNL U.S. Thrift > $10B |
156.24 | 8/8/2016 | 0.02 | 1.42 | 1.12 | 3.78 | (4.00 | ) | (6.48 | ) | 15.08 | 36.4 | ||||||||||||||||||||||||||||
| SNL Market Cap Indexes |
||||||||||||||||||||||||||||||||||||||||
| SNL Micro Cap U.S. Thrift |
867.68 | 8/8/2016 | (0.19 | ) | (0.03 | ) | (0.03 | ) | 2.44 | (0.87 | ) | 5.72 | 31.37 | 22.3 | ||||||||||||||||||||||||||
| SNL Micro Cap U.S. Bank & Thrift |
582.42 | 8/8/2016 | (0.05 | ) | 0.17 | 0.15 | 2.34 | 2.91 | 8.19 | 32.03 | 16.3 | |||||||||||||||||||||||||||||
| SNL Small Cap U.S. Thrift |
618.51 | 8/8/2016 | (0.32 | ) | 1.32 | 1.38 | 3.57 | 5.04 | 10.17 | 33.40 | 20.4 | |||||||||||||||||||||||||||||
| SNL Small Cap U.S. Bank & Thrift |
520.11 | 8/8/2016 | (0.25 | ) | 1.87 | 1.55 | 5.45 | 4.56 | 7.76 | 28.10 | 17.8 | |||||||||||||||||||||||||||||
| SNL Mid Cap U.S. Thrift |
310.22 | 8/8/2016 | 0.28 | 3.19 | 2.61 | 7.14 | 3.11 | (2.03 | ) | 19.04 | 22.9 | |||||||||||||||||||||||||||||
| SNL Mid Cap U.S. Bank & Thrift |
333.01 | 8/8/2016 | (0.31 | ) | 3.41 | 2.58 | 6.32 | 3.01 | 0.14 | 19.06 | 17.6 | |||||||||||||||||||||||||||||
| SNL Large Cap U.S. Thrift |
156.38 | 8/8/2016 | (0.44 | ) | 0.40 | 0.23 | (0.43 | ) | (7.47 | ) | (7.24 | ) | 9.94 | 65.9 | ||||||||||||||||||||||||||
| SNL Large Cap U.S. Bank & Thrift |
256.35 | 8/8/2016 | 0.12 | 3.77 | 3.11 | 7.25 | (5.76 | ) | (11.46 | ) | 9.29 | 12.5 | ||||||||||||||||||||||||||||
| SNL Geographic Indexes |
||||||||||||||||||||||||||||||||||||||||
| SNL Mid-Atlantic U.S. Thrift |
3,021.07 | 8/8/2016 | (0.49 | ) | 0.77 | 0.58 | 1.05 | (3.79 | ) | (4.51 | ) | 13.29 | 24.4 | |||||||||||||||||||||||||||
| SNL Midwest U.S. Thrift |
3,039.93 | 8/8/2016 | 0.01 | 1.67 | 1.41 | 6.30 | 5.82 | 14.37 | 45.45 | 40.1 | ||||||||||||||||||||||||||||||
| SNL New England U.S. Thrift |
2,342.04 | 8/8/2016 | (0.14 | ) | 1.29 | 1.23 | 2.45 | 4.10 | 9.42 | 23.38 | 26.4 | |||||||||||||||||||||||||||||
| SNL Southeast U.S. Thrift |
381.94 | 8/8/2016 | 2.31 | 5.68 | 5.39 | 21.41 | 14.49 | (3.22 | ) | 24.46 | 21.3 | |||||||||||||||||||||||||||||
| SNL Southwest U.S. Thrift |
678.99 | 8/8/2016 | (0.55 | ) | 5.13 | 5.13 | 7.33 | (0.98 | ) | 3.14 | 30.76 | 13.2 | ||||||||||||||||||||||||||||
| SNL Western U.S. Thrift |
103.23 | 8/8/2016 | 0.28 | 7.21 | 5.05 | 3.60 | (5.48 | ) | (21.76 | ) | 18.07 | 14.4 | ||||||||||||||||||||||||||||
| SNL Stock Exchange Indexes |
||||||||||||||||||||||||||||||||||||||||
| SNL U.S. Thrift NYSE |
133.98 | 8/8/2016 | (0.06 | ) | 1.66 | 1.48 | 3.03 | (2.79 | ) | (10.49 | ) | 7.53 | 18.3 | |||||||||||||||||||||||||||
| SNL U.S. Thrift NASDAQ |
2,347.37 | 8/8/2016 | (0.12 | ) | 1.70 | 1.36 | 4.28 | 1.66 | 4.58 | 28.12 | 31.6 | |||||||||||||||||||||||||||||
| SNL U.S. Thrift Pink |
261.04 | 8/8/2016 | (0.05 | ) | (0.36 | ) | (0.04 | ) | 2.04 | 1.72 | 8.52 | 38.46 | 17.8 | |||||||||||||||||||||||||||
| SNL Other Indexes |
||||||||||||||||||||||||||||||||||||||||
| SNL U.S. Thrift MHCs |
6,019.41 | 8/8/2016 | 0.22 | 1.68 | 1.53 | 6.71 | (1.16 | ) | 7.45 | 58.33 | 62.7 | |||||||||||||||||||||||||||||
| Broad Market Indexes |
||||||||||||||||||||||||||||||||||||||||
| DJIA |
18,529.29 | 8/8/2016 | (0.08 | ) | 0.68 | 0.53 | 3.34 | 6.34 | 6.65 | 19.56 | NA | |||||||||||||||||||||||||||||
| S&P 500 |
2,180.89 | 8/8/2016 | (0.09 | ) | 0.46 | 0.34 | 3.91 | 6.70 | 4.97 | 28.48 | NA | |||||||||||||||||||||||||||||
| S&P Mid-Cap |
1,562.57 | 8/8/2016 | 0.00 | 0.48 | 0.20 | 4.41 | 11.73 | 5.00 | 26.31 | NA | ||||||||||||||||||||||||||||||
| S&P Small-Cap |
746.67 | 8/5/2016 | 1.33 | 0.36 | 0.36 | 5.41 | 11.16 | 4.97 | 24.74 | NA | ||||||||||||||||||||||||||||||
Source: SNL Financial | Page 1 of 2
Index Values
| S&P 500 Financials |
323.41 | 8/5/2016 | 1.93 | 1.42 | 1.42 | 4.87 | 0.52 | (4.70 | ) | 15.60 | NA | |||||||||||||||||||||||||||||
| SNL U.S. Financial Institutions |
701.22 | 8/8/2016 | 0.05 | 2.61 | 2.11 | 5.72 | (1.10 | ) | (7.21 | ) | 15.65 | 15.4 | ||||||||||||||||||||||||||||
| MSCI US IMI Financials |
1,210.41 | 8/5/2016 | 1.75 | 1.16 | 1.16 | 4.94 | 2.17 | (2.91 | ) | 16.24 | NA | |||||||||||||||||||||||||||||
| NASDAQ |
5,213.14 | 8/8/2016 | (0.15 | ) | 0.56 | 0.99 | 7.65 | 4.11 | 3.36 | 42.08 | NA | |||||||||||||||||||||||||||||
| NASDAQ Finl |
3,394.44 | 8/8/2016 | (0.26 | ) | 1.39 | 1.27 | 4.31 | 4.72 | 1.37 | 19.81 | NA | |||||||||||||||||||||||||||||
| NYSE |
10,788.00 | 8/8/2016 | 0.05 | 0.54 | 0.02 | 2.84 | 6.35 | 0.23 | 11.97 | NA | ||||||||||||||||||||||||||||||
| Russell 1000 |
1,208.93 | 8/5/2016 | 0.83 | 0.37 | 0.37 | 4.08 | 6.81 | 3.20 | 27.28 | NA | ||||||||||||||||||||||||||||||
| Russell 2000 |
1,231.30 | 8/5/2016 | 1.45 | 0.93 | 0.93 | 6.89 | 8.40 | (0.04 | ) | 15.83 | NA | |||||||||||||||||||||||||||||
| Russell 3000 |
1,289.60 | 8/5/2016 | 0.88 | 0.41 | 0.41 | 4.28 | 6.92 | 2.94 | 26.31 | NA | ||||||||||||||||||||||||||||||
| S&P TSX Composite |
14,755.62 | 8/8/2016 | 0.73 | 1.19 | 1.19 | 4.91 | 13.42 | 3.17 | 17.55 | NA | ||||||||||||||||||||||||||||||
| MSCI AC World (USD) |
415.58 | 8/5/2016 | 0.58 | (0.12 | ) | (0.12 | ) | 4.08 | 4.06 | (2.38 | ) | 9.99 | NA | |||||||||||||||||||||||||||
| MSCI World (USD) |
1,716.65 | 8/5/2016 | 0.52 | (0.30 | ) | (0.30 | ) | 3.84 | 3.24 | (2.62 | ) | 12.17 | NA | |||||||||||||||||||||||||||
| Bermuda Royal Gazette/BSX |
1,226.40 | 8/5/2016 | 0.74 | 1.58 | 1.58 | 3.97 | (5.96 | ) | (3.13 | ) | 6.08 | NA |
Intraday data is available for certain exchanges. In all cases, the data is at least 15 minutes delayed.
| ** | - Non-publicly traded institutions and institutions outside of your current subscription are not included in custom indexes. Custom indexes including foreign institutions do not take into account currency translations. Data is as of the previous close. |
All SNL indexes are market-value weighted; i.e., an institution’s effect on an index is proportional to that institution’s market capitalization.
Source: MSCI. MSCI makes no express or implied warranties or representations and shall have no liability whatsoever with respect to any MSCI data contained herein. The MSCI data may not be further redistributed or used as a basis for other indices or any securities or financial products.
| Mid-Atlantic: DE, DC, MD, NJ, NY, PA, PR | Midwest: IA, IN, IL, KS, KY, MI, MN, MO, ND, NE, OH, SD, WI | |
| New England: CT, ME, MA, NH, RI, VT | Southeast: AL, AR, FL, GA, MS, NC, SC, TN, VA, WV | |
| Southwest: CO, LA, NM, OK, TX, UT | West: AZ, AK, CA, HI, ID, MT, NV, OR, WA, WY | |
Source: SNL Financial | Page 2 of 2
EXHIBIT IV-4
Market Area Acquisition Activity
Exhibit IV-4
Pennsylvania Thrift Acquisitions 2013-Present
| Target Financials at Announcement | Deal Terms and Pricing at Announcement | |||||||||||||||||||||||||||||||||||||||||||||||||||||||||||||||||||
| Total | LTM | LTM | NPAs/ | Rsrvs/ | Deal | Value/ | Prem/ | |||||||||||||||||||||||||||||||||||||||||||||||||||||||||||||
| Announce | Complete | Assets | E/A | TE/A | ROAA | ROAE | Assets | NPLs | Value | Share | P/B | P/TB | P/E | P/A | Cdeps | |||||||||||||||||||||||||||||||||||||||||||||||||||||
| Date |
Date | Buyer Short Name |
Target Name |
($000) | (%) | (%) | (%) | (%) | (%) | (%) | ($M) | ($) | (%) | (%) | (x) | (%) | (%) | |||||||||||||||||||||||||||||||||||||||||||||||||||
| 06/02/2016 |
Def. Agrmt | Prudential Bancorp Inc. | PA | Polonia Bancorp, Inc. | PA | 291,611 | 12.86 | 12.86 | -0.05 | -0.35 | NA | NA | 38.0 | 11.299 | 100.90 | 100.90 | NM | 13.02 | 0.35 | |||||||||||||||||||||||||||||||||||||||||||||||||
| 04/04/2016 |
Def. Agrmt | DNB Financial Corp. | PA | East River Bank | PA | 310,742 | 9.78 | 9.78 | 0.76 | 7.73 | 0.45 | 248.74 | 49.0 | 19.254 | 154.90 | 154.90 | 21.16 | 15.77 | 11.48 | |||||||||||||||||||||||||||||||||||||||||||||||||
| 12/30/2015 |
04/30/2016 | Emclaire Financial Corp. | PA | United-American Savings Bank | PA | 90,717 | 8.73 | 8.73 | 0.75 | 8.87 | 1.26 | 37.63 | 14.1 | 42.670 | 166.84 | 166.84 | 19.68 | 15.52 | 15.32 | |||||||||||||||||||||||||||||||||||||||||||||||||
| 12/08/2015 |
07/01/2016 | Univest Corp. of Pennsylvania | PA | Fox Chase Bancorp, Inc. | PA | 1,098,797 | 16.02 | 16.02 | 0.91 | 5.62 | 1.11 | 112.81 | 244.3 | 20.387 | 134.27 | 134.27 | 23.17 | 22.24 | 10.50 | |||||||||||||||||||||||||||||||||||||||||||||||||
| 11/04/2015 |
02/29/2016 | C&G Savings Bank | PA | Cresson Community Bank | PA | 58,986 | 12.44 | 12.44 | 0.36 | 3.02 | 0.75 | 22.73 | NA | NA | NA | NA | NA | NA | NA | |||||||||||||||||||||||||||||||||||||||||||||||||
| 10/22/2015 |
04/14/2016 | Beneficial Bancorp Inc | PA | Conestoga Bank | PA | 719,013 | 8.70 | 8.70 | 0.59 | 6.75 | 0.92 | 133.46 | 100.1 | NA | 160.00 | 160.00 | 24.52 | 13.92 | 9.21 | |||||||||||||||||||||||||||||||||||||||||||||||||
| 09/03/2015 |
01/08/2016 | NexTier Inc. | PA | Eureka Financial Corporation | PA | 154,626 | 15.15 | 15.15 | 1.01 | 6.78 | 0.54 | 473.84 | 35.3 | 28.500 | 146.94 | 146.94 | 21.43 | 22.83 | 13.06 | |||||||||||||||||||||||||||||||||||||||||||||||||
| 03/03/2015 |
10/09/2015 | WSFS Financial Corp. | DE | Alliance Bancorp, Inc. of Pennsylvania | PA | 420,829 | 15.79 | 15.79 | 0.60 | 3.82 | 2.24 | 54.85 | 93.4 | 22.358 | 135.48 | 135.48 | 35.49 | 22.20 | 9.25 | |||||||||||||||||||||||||||||||||||||||||||||||||
| 11/19/2014 |
08/01/2015 | FSB Mutual Holdings Inc. | PA | First Federal Savings and Loan Association of Bucks County | PA | 739,405 | 10.87 | 10.87 | 0.72 | 6.70 | 0.36 | 163.82 | NA | NA | NA | NA | NA | NA | NA | |||||||||||||||||||||||||||||||||||||||||||||||||
| 10/29/2014 |
02/10/2015 | WesBanco Inc. | WV | ESB Financial Corporation | PA | 1,945,398 | 10.55 | 8.59 | 0.91 | 8.95 | 1.04 | 37.63 | 352.7 | 19.189 | 165.54 | 207.37 | 19.78 | 19.98 | 18.27 | |||||||||||||||||||||||||||||||||||||||||||||||||
| 06/04/2014 |
10/24/2014 | National Penn Bancshares Inc. | PA | TF Financial Corporation | PA | 846,016 | 11.46 | 10.96 | 0.83 | 7.37 | 1.20 | 99.83 | 141.6 | 43.183 | 140.31 | 147.62 | 19.02 | 16.74 | 7.67 | |||||||||||||||||||||||||||||||||||||||||||||||||
| 04/14/2014 |
10/31/2014 | CB Financial Services Inc. | PA | FedFirst Financial Corporation | PA | 319,027 | 16.25 | 15.96 | 0.73 | 4.28 | 1.54 | 69.16 | 55.0 | 22.929 | 104.45 | 106.78 | 25.20 | 17.24 | 2.37 | |||||||||||||||||||||||||||||||||||||||||||||||||
| 12/20/2013 |
05/30/2014 | Provident Financial Services | NJ | Team Capital Bank | PA | 949,224 | 9.24 | 9.24 | 0.71 | 7.09 | 0.86 | 123.93 | 124.4 | 16.205 | 190.58 | 190.58 | 19.20 | 13.11 | 9.72 | |||||||||||||||||||||||||||||||||||||||||||||||||
|
|
|
|
|
|
|
|
|
|
|
|
|
|
|
|
|
|
|
|
|
|
|
|
|
|||||||||||||||||||||||||||||||||||||||||||||
| Average: | 611,107 | 12.14 | 11.93 | 0.68 | 5.89 | 1.02 | 131.54 | 145.47 | 150.15 | 22.87 | 17.51 | 9.75 | ||||||||||||||||||||||||||||||||||||||||||||||||||||||||
| Median: | 420,829 | 11.46 | 10.96 | 0.73 | 6.75 | 0.98 | 106.32 | 146.94 | 147.62 | 21.30 | 16.74 | 9.72 | ||||||||||||||||||||||||||||||||||||||||||||||||||||||||
Source: SNL Financial, LC.
EXHIBIT IV-5
Huntingdon Valley Bank
Director and Senior Management Summary Resumes
Exhibit IV-5
Huntingdon Valley Bank
Director and Senior Management Summary Resumes
Directors
Carl Hj. Asplundh, Jr. began working for Asplundh Tree Expert Company in 1953. He is now retired. He was Chairman of the Board of that company from 1996 until 2000. At various times he served on the boards of Doylestown Hospital, The Heritage Conservancy of Bucks County, and Bryn Athyn Academy. Mr. Asplundh’s business and financial experience and contacts in the local community are among his qualifications to serve as a director.
John D. Behm is the co-founder and co-Managing Principal of the Philadelphia and Princeton offices of Cresa, a tenant-only commercial real estate firm. Mr. Behm began working at Cresa in 1996 and has worked on a variety of commercial real estate matters at Cresa, including process management, real estate administration, planning, managing and negotiating leases, building sales/purchases, build-to-suit projects, land sales/purchases, and renewals and dispositions for end users of space on a local, national and international basis. Mr. Behm’s commercial real estate and business experience and contacts in the local community are among his qualifications as a director.
Scott W. Froggatt is currently a Senior Vice President at Land Services USA, Inc., a large title insurance agency located in Philadelphia, a position he has held since August 2015. Previously, Mr. Froggatt was an Executive Vice President at Robert Chalphin Associates Inc., a title insurance agency. Mr. Froggatt worked for Robert Chalphin Associates since 1981. Prior to joining Robert Chalphin Associates, Mr. Froggatt was vice president/title insurance underwriting at UGT – MidAtlantic Inc., and vice president/audits, marketing, management and commercial closings at Stewart of Pennsylvania Inc. He has served on many committees for Pennsylvania Land Title Association, and has earned the designation of Associate Land Title Professional. He also is a Trustee of the Old School Baptist Meetinghouse. Mr. Froggatt’s business and financial experience and contacts in the local community are among his qualifications to serve as a director.
Joseph F. Kelly is currently President/Owner of J.M.J.M. Inc., a construction company, a position he has held since 1991. In addition, Mr. Kelly owns and manages several residential and commercial properties. Mr. Kelly has served on many homeowners and condominium association boards. He has worked in various capacities, including property management. He is also a licensed real estate builder owner salesperson. Mr. Kelly’s business experience, including experience with his construction company and as the owner/manager of residential and commercial properties, are among his qualifications to serve as a director.
Travis J. Thompson was appointed President and Chief Executive Officer of Huntingdon Valley Bank in January 2013 and Chairman of the Board in July 2016. From 2006 through 2012, Mr. Thompson was an executive officer of Suburban Marble & Granite Inc., first as its Chief Operating Officer and later as its President. From 1998 to 2006, Mr. Thompson was an associate, shareholder and managing shareholder at the law firm of Liederbach, Hahn, Foy, VanBlunk & Thompson PC, which merged into the law firm of Stark & Stark. Mr. Thompson was solicitor to Huntingdon Valley Bank for most of this period and represented several other local community banks in the late 1990s and early 2000s. Mr. Thompson’s business and legal experience, as well as his long relationship with Huntingdon Valley Bank, are among his qualifications to serve as a director.
Exhibit IV-5 (continued)
Huntingdon Valley Bank
Director and Senior Management Summary Resumes
Executive Officers Who Are Not Directors
Joseph C. O’Neill, Jr. was appointed Executive Vice President and Chief Financial Officer on July 1, 2016. He was previously Senior Vice President and Chief Financial Officer of Huntingdon Valley Bank beginning in January 2010, and assumed the additional duties of Chief Operating Officer from January 2013 until June 2016. In his current position, Mr. O’Neill is responsible for Huntingdon Valley Bank’s finance, accounting and deposit operations, including policies and procedures, as well as coordination and maintenance of accounting and management reporting systems. Mr. O’Neill is also responsible for regulatory reporting, tax and cost accounting and Huntingdon Valley Bank’s investment portfolio. From 1999 to 2009, Mr. O’Neill held various positions with General Motors and General Motors Acceptance Corporation, including chief financial officer for General Motors’ wholly owned thrift subsidiary, vice president for financial reporting for GMAC Commercial Mortgage and divisional controller for GMAC Residential Mortgage.
Charles S. Hutt has been employed by Huntingdon Valley Bank since 2007. He was appointed Executive Vice President and Chief Credit Officer on July 1, 2016. Previously, he was Senior Vice President and Chief Credit Officer beginning in January 2013. Between 2007 and 2013, Mr. Hutt was Senior Vice President of Residential Lending at Huntingdon Valley Bank. Mr. Hutt is responsible for Huntingdon Valley Bank’s lending portfolio, as well as for retail loan originations and sales operations.
J. Chris Jacobsen was appointed Executive Vice President and Chief Operating Officer in June 2016. In his current position, Mr. Jacobsen is responsible for the retail branch network, information technology, compliance, marketing and human resources. Mr. Jacobsen has more than 25 years of banking experience, including serving as Senior Vice President/Retail Banking at Roxborough-Manayunk Bank from 2000 to 2003 when it was acquired by Citizens Bank. Following the acquisition, Mr. Jacobsen was appointed Senior Vice President/Business Strategy at Citizens Bank where he worked on mergers and acquisitions. In 2005, Mr. Jacobsen joined St. Edmond’s Federal Savings Bank and was appointed Executive Vice President and Chief Operating Officer, a position he held until 2012 when the bank was acquired by Beneficial Bank where Mr. Jacobsen subsequently served as Market Director prior to joining Huntingdon Valley Bank.
Source: Huntingdon Valley Bank’s prospectus.
EXHIBIT IV-6
Huntingdon Valley Bank
Pro Forma Regulatory Capital Ratios
Exhibit IV-6
Huntingdon Valley Bank
Pro Forma Regulatory Capital Ratios
| Huntingdon Valley Bank Historical at June 30, 2016 |
Pro Forma at June 30, 2016, Based Upon the Sale in the Offering of (1) | |||||||||||||||||||||||||||||||||||||||
| 1,402,500 Shares | 1,650,000 Shares | 1,897,500 Shares | 2,182,125 Shares (2) | |||||||||||||||||||||||||||||||||||||
| Amount | Percent of Assets |
Amount | Percent of Assets |
Amount | Percent of Assets |
Amount | Percent of Assets |
Amount | Percent of Assets |
|||||||||||||||||||||||||||||||
| (Dollars in thousands) | ||||||||||||||||||||||||||||||||||||||||
| Equity |
$ | 12,971 | 7.14 | % | $ | 17,703 | 9.41 | % | $ | 18,626 | 9.83 | % | $ | 19,549 | 10.26 | % | $ | 20,611 | 10.73 | % | ||||||||||||||||||||
|
|
|
|
|
|
|
|
|
|
|
|||||||||||||||||||||||||||||||
| Tier 1 leverage |
$ | 12,951 | 7.63 | % | $ | 17,683 | 10.04 | % | $ | 18,606 | 10.49 | $ | 19,529 | 10.94 | % | $ | 20,591 | 11.44 | % | |||||||||||||||||||||
| Tier 1 leverage requirement |
8,483 | 5.00 | 8,804 | 5.00 | 8,865 | 5.00 | 8,926 | 5.00 | 8,996 | 5.00 | ||||||||||||||||||||||||||||||
|
|
|
|
|
|
|
|
|
|
|
|
|
|
|
|
|
|
|
|
|
|||||||||||||||||||||
| Excess |
$ | 4,468 | 2.63 | % | $ | 8,879 | 5.04 | % | $ | 9,741 | 5.49 | % | $ | 10,603. | 5.94 | % | $ | 11,595 | 6.44 | % | ||||||||||||||||||||
|
|
|
|
|
|
|
|
|
|
|
|
|
|
|
|
|
|
|
|
|
|||||||||||||||||||||
| Tier 1 risk-based capital (3)(4) |
$ | 12,951 | 12.04 | % | $ | 17,683 | 15.96 | % | $ | 18,606 | 16.70 | % | $ | 19,529 | 17.43 | % | $ | 20,591 | 18.27 | % | ||||||||||||||||||||
| Tier 1 risk-based requirement |
8,607 | 8.00 | 8,864 | 8.00 | 8,913 | 8.00 | 8,961 | 8.00 | 9,018 | 8.00 | ||||||||||||||||||||||||||||||
|
|
|
|
|
|
|
|
|
|
|
|
|
|
|
|
|
|
|
|
|
|||||||||||||||||||||
| Excess |
$ | 4,344 | 4.04 | % | $ | 8,819 | 7.96 | % | $ | 9,693 | 8.70 | % | $ | 10,568 | 9.43 | % | $ | 11,573 | 10.27 | % | ||||||||||||||||||||
|
|
|
|
|
|
|
|
|
|
|
|
|
|
|
|
|
|
|
|
|
|||||||||||||||||||||
| Total risk-based capital (3)(4) |
$ | 13,438 | 12.49 | % | $ | 18,170 | 16.40 | % | $ | 19,093 | 17.14 | % | $ | 20,016 | 17.87 | % | $ | 21,078 | 18.70 | % | ||||||||||||||||||||
| Total risk-based requirement |
10,759 | 10.00 | 11,080 | 10.00 | 11,141 | 10.00 | 11,202 | 10.00 | 11,272 | 10.00 | ||||||||||||||||||||||||||||||
|
|
|
|
|
|
|
|
|
|
|
|
|
|
|
|
|
|
|
|
|
|||||||||||||||||||||
| Excess |
$ | 2,679 | 2.49 | % | $ | 7,090 | 6.40 | % | $ | 7,952 | 7.14 | % | $ | 8,814 | 7.87 | % | $ | 9,806 | 8.70 | % | ||||||||||||||||||||
|
|
|
|
|
|
|
|
|
|
|
|
|
|
|
|
|
|
|
|
|
|||||||||||||||||||||
| Common equity tier 1 risk-based |
$ | 12,951 | 12.04 | % | $ | 17,683 | 15.96 | % | $ | 18,606 | 16.70 | % | $ | 19,529 | 17.43 | % | $ | 20,591 | 18.27 | % | ||||||||||||||||||||
| Common equity tier 1 risk-based |
6,993 | 6.50 | 7,202 | 6.50 | 7,241 | 6.50 | 7,281 | 6.50 | 7,327 | 6.50 | ||||||||||||||||||||||||||||||
|
|
|
|
|
|
|
|
|
|
|
|
|
|
|
|
|
|
|
|
|
|||||||||||||||||||||
| Excess |
$ | 5,958 | 5.54 | % | $ | 10,481 | 9.46 | % | $ | 11,365 | 10.20 | % | $ | 12,248 | 10.93 | % | $ | 13,264 | 11.77 | % | ||||||||||||||||||||
|
|
|
|
|
|
|
|
|
|
|
|
|
|
|
|
|
|
|
|
|
|||||||||||||||||||||
Exhibit IV-6 (continued)
Huntingdon Valley Bank
Pro Forma Regulatory Capital Ratios
| Reconciliation of capital infused into Huntingdon Valley Bank: |
||||||||||||||||
| Net proceeds |
$ | 6,415 | $ | 7,635 | $ | 8,855 | $ | 10,259 | ||||||||
| Less: Common stock acquired by stock-based benefit plan |
(561 | ) | (660 | ) | (759 | ) | (873 | ) | ||||||||
| Less: Common stock acquired by employee stock ownership plan |
(1,122 | ) | (1,320 | ) | (1,518 | ) | (1,746 | ) | ||||||||
|
|
|
|
|
|
|
|
|
|||||||||
| Pro forma increase |
$ | 4,732 | $ | 5,655 | $ | 6,578 | $ | 7,640 | ||||||||
|
|
|
|
|
|
|
|
|
| (1) | Pro forma capital levels assume that the employee stock ownership plan purchases 8% of the shares of common stock sold in the stock offering with funds we lend and that our stock-based benefit plan purchases 4% of the shares sold in the offering for restricted stock awards. Pro forma capital calculated under generally accepted accounting principles (“GAAP”) and regulatory capital have been reduced by the amount required to fund these plans. See “Management” for a discussion of the employee stock ownership plan. |
| (2) | As adjusted to give effect to an increase in the number of shares which could occur due to a 15% increase in the offering range to reflect demand for the shares or changes in market conditions following the commencement of the offering. |
| (3) | Tier 1 leverage capital levels are shown as a percentage of total average assets. Risk-based capital levels are shown as a percentage of risk-weighted assets |
| (4) | Pro forma amounts and percentages assume net proceeds are invested in assets that carry a 20% risk weighting. |
Source: Huntingdon Valley Bank’s prospectus.
EXHIBIT IV-7
Huntingdon Valley Bank
Pro Forma Analysis Sheet
Exhibit IV-7
PRO FORMA ANALYSIS SHEET
Huntingdon Valley Bank
Prices as of August 5, 2016
| Peer Group | Pennsylvania | All-Publicly-Traded | ||||||||||||||||||||||||||||
| Price Multiple |
Symbol | Subject (1) | Mean | Median | Mean | Median | Mean | Median | ||||||||||||||||||||||
| Price-earnings ratio (x) |
P/E | 18.00x | 22.09x | 18.81x | 17.72x | 17.48x | 18.26x | 17.48x | ||||||||||||||||||||||
| Price-core earnings ratio (x) |
P/Core | 18.26x | 21.83x | 19.31x | 19.14x | 19.85x | 18.05x | 17.95x | ||||||||||||||||||||||
| Price-book ratio (%) |
= P/B | 62.85 | % | 91.89 | % | 89.87 | % | 103.06 | % | 102.14 | % | 110.61 | % | 106.86 | % | |||||||||||||||
| Price-tangible book ratio (%) |
= P/TB | 62.85 | % | 94.99 | % | 93.80 | % | 114.82 | % | 110.49 | % | 119.47 | % | 115.16 | % | |||||||||||||||
| Price-assets ratio (%) |
= P/A | 8.45 | % | 14.32 | % | 13.41 | % | 14.43 | % | 14.97 | % | 13.82 | % | 13.27 | % | |||||||||||||||
| Valuation Parameters |
||||||||||
| Pre-Conversion Earnings (Y) |
$ | 1,026,000 | ESOP Stock Purchases (E) | 8.00 | % (5) | |||||
| Pre-Conversion Earnings (CY) |
$ | 1,013,000 | Cost of ESOP Borrowings (S) | 0.00 | % (4) | |||||
| Pre-Conversion Book Value (B) |
$ | 12,971,000 | ESOP Amortization (T) | 20.00 years | ||||||
| Pre-Conv. Tang. Book Val. (TB) |
$ | 12,971,000 | RRP Amount (M) | 4.00 | % | |||||
| Pre-Conversion Assets (A) |
$ | 182,023,000 | RRP Vesting (N) | 5.00 years | (5) | |||||
| Reinvestment Rate (2)(R) |
1.01% | Foundation (F) | 0.00 | % | ||||||
| Est. Conversion Expenses (3)(X) |
7.45% | Tax Benefit (Z) | 0 | |||||||
| Tax Rate (TAX) |
40.00% | Percentage Sold (PCT) | 100.00 | % | ||||||
| Option (O1) | 10.00 | % (6) | ||||||||
| Estimated Option Value (O2) | 24.00 | % (6) | ||||||||
| Option vesting (O3) | 5.00 | (6) | ||||||||
| Option pct taxable (O4) | 25.00 | % (6) | ||||||||
| Calculation of Pro Forma Value After Conversion |
||||||||||
| 1. V= |
P/E * (Y) | V= | $ | 16,500,000 | ||||||
| 1 - P/E * PCT * ((1-X-E-M-F)*R*(1-TAX) - (1-TAX)*E/T - (1-TAX)*M/N) - (1-(TAX*O4))*(O1*O2)/O3) | ||||||||||
| 2. V= |
P/Core * (Y) | V= | $ | 16,500,000 | ||||||
| 1 - P/core * PCT * ((1-X-E-M-F)*R*(1-TAX) - (1-TAX)*E/T - (1-TAX)*M/N) - (1-(TAX*O4))*(O1*O2)/O3) | ||||||||||
| 3. V= |
P/B * (B+Z) | V= | $ | 16,500,000 | ||||||
| 1 - P/B * PCT * (1-X-E-M-F) | ||||||||||
| 4. V= |
P/TB * (TB+Z) | V= | $ | 16,500,000 | ||||||
| 1 - P/TB * PCT * (1-X-E-M-F) | ||||||||||
| 5. V= |
P/A * (A+Z) | V= | $ | 16,500,000 | ||||||
| 1 - P/A * PCT * (1-X-E-M-F) | ||||||||||
| Shares | Aggregate | |||||||||||||||||||||||
| Shares Issued | Price Per | Gross Offering | Issued To | Total Shares | Market Value | |||||||||||||||||||
| Conclusion |
To the Public | Share | Proceeds | Foundation | Issued | of Shares Issued | ||||||||||||||||||
| Supermaximum |
2,182,125 | 10.00 | $ | 21,821,250 | 0 | 2,182,125 | $ | 21,821,250 | ||||||||||||||||
| Maximum |
1,897,500 | 10.00 | 18,975,000 | 0 | 1,897,500 | 18,975,000 | ||||||||||||||||||
| Midpoint |
1,650,000 | 10.00 | 16,500,000 | 0 | 1,650,000 | 16,500,000 | ||||||||||||||||||
| Minimum |
1,402,500 | 10.00 | 14,025,000 | 0 | 1,402,500 | 14,025,000 | ||||||||||||||||||
| (1) | Pricing ratios shown reflect the midpoint value. |
| (2) | Net return reflects a reinvestment rate of 1.01% and a tax rate of 40.0% percent. |
| (3) | Offering expenses shown at estimated midpoint value. |
| (4) | No cost is applicable since holding company will fund the ESOP loan. |
| (5) | ESOP and MRP amortize over 20 years and 5 years, respectively; amortization expenses tax effected at 40.0%. |
| (6) | 10 percent option plan with an estimated Black-Scholes valuation of 24.00% of the exercise price, including a 5 year vesting with 25 percent of the options (granted to directors) tax effected at 40.0%. |
EXHIBIT IV-8
Huntingdon Valley Bank
Pro Forma Effect of Conversion Proceeds
Exhibit IV-8
PRO FORMA EFFECT OF CONVERSION PROCEEDS
Huntingdon Valley Bank
At the Minimum
| 1. |
Pro Forma Market Capitalization | $ | 14,025,000 | |||||||||||||||
| Less: Foundation Shares |
— | |||||||||||||||||
|
|
|
|||||||||||||||||
| 2. |
Offering Proceeds |
$ | 14,025,000 | |||||||||||||||
| Less: Estimated Offering Expenses |
1,195,795 | |||||||||||||||||
|
|
|
|||||||||||||||||
| Net Conversion Proceeds |
$ | 12,829,205 | ||||||||||||||||
| 3. |
Estimated Additional Income from Conversion Proceeds | |||||||||||||||||
| Net Conversion Proceeds | $ | 12,829,205 | ||||||||||||||||
| Less: Cash Contribution to Foundation | 0 | |||||||||||||||||
| Less: Non-Cash Stock Purchases (1) | 1,683,000 | |||||||||||||||||
|
|
|
|||||||||||||||||
| Net Proceeds Reinvested | $ | 11,146,205 | ||||||||||||||||
| Estimated net incremental rate of return | 0.61 | % | ||||||||||||||||
|
|
|
|||||||||||||||||
| Reinvestment Income | $ | 67,546 | ||||||||||||||||
| Less: Estimated cost of ESOP borrowings (2) |
0 | |||||||||||||||||
| Less: Amortization of ESOP borrowings (3) |
33,660 | |||||||||||||||||
| Less: Amortization of Options (4) |
60,588 | |||||||||||||||||
| Less: Recognition Plan Vesting (5) |
67,320 | |||||||||||||||||
|
|
|
|||||||||||||||||
| Net Earnings Impact | ($ | 94,022 | ) | |||||||||||||||
| Before Conversion |
Net Earnings Increase |
After Conversion | ||||||||||||||||
| 4. |
Pro Forma Earnings | |||||||||||||||||
| 12 Months ended June 30, 2016 (reported) | $ | 1,026,000 | ($ | 94,022 | ) | $ | 931,978 | |||||||||||
| 12 Months ended June 30, 2016 (core) | $ | 1,013,000 | ($ | 94,022 | ) | $ | 918,978 | |||||||||||
| Before Conversion |
Net Cash Proceeds |
Tax Benefit Of Contribution |
After Conversion | |||||||||||||||
| 5. |
Pro Forma Net Worth | |||||||||||||||||
| June 30, 2016 | $ | 12,971,000 | $ | 11,146,205 | $ | 0 | $ | 24,117,205 | ||||||||||
| June 30, 2016 (Tangible) | $ | 12,971,000 | $ | 11,146,205 | $ | 0 | $ | 24,117,205 | ||||||||||
| Before Conversion |
Net Cash Proceeds |
Tax Benefit Of Contribution |
After Conversion | |||||||||||||||
| 6. |
Pro Forma Assets | |||||||||||||||||
| June 30, 2016 | $ | 182,023,000 | $ | 11,146,205 | $ | 0 | $ | 193,169,205 | ||||||||||
| (1) | Includes ESOP and RRP stock purchases equal to 8.0 and 4.0 percent of total shares issued, respectively. |
| (2) | ESOP stock purchases are internally financed by a loan from the holding company. |
| (3) | ESOP borrowings are amortized over 20 years, amortization expense is tax-effected at a 40.0 percent rate. |
| (4) | Option valuation based on Black-Scholes model, 5 year vesting, and assumes 25 percent is taxable. |
| (5) | RRP is amortized over 5 years, and amortization expense is tax effected at 40.0 percent. |
Exhibit IV-8
PRO FORMA EFFECT OF CONVERSION PROCEEDS
Huntingdon Valley Bank
At the Midpoint Value
| 1. |
Pro Forma Market Capitalization | $ | 16,500,000 | |||||||||||||||
| Less: Foundation Shares |
— | |||||||||||||||||
|
|
|
|||||||||||||||||
| 2. |
Offering Proceeds |
$ | 16,500,000 | |||||||||||||||
| Less: Estimated Offering Expenses |
1,229,950 | |||||||||||||||||
|
|
|
|||||||||||||||||
| Net Conversion Proceeds |
$ | 15,270,050 | ||||||||||||||||
| 3. |
Estimated Additional Income from Conversion Proceeds | |||||||||||||||||
| Net Conversion Proceeds | $ | 15,270,050 | ||||||||||||||||
| Less: Cash Contribution to Foundation | 0 | |||||||||||||||||
| Less: Non-Cash Stock Purchases (1) | 1,980,000 | |||||||||||||||||
|
|
|
|||||||||||||||||
| Net Proceeds Reinvested | $ | 13,290,050 | ||||||||||||||||
| Estimated net incremental rate of return | 0.61 | % | ||||||||||||||||
|
|
|
|||||||||||||||||
| Reinvestment Income | $ | 80,538 | ||||||||||||||||
| Less: Estimated cost of ESOP borrowings (2) |
0 | |||||||||||||||||
| Less: Amortization of ESOP borrowings (3) |
39,600 | |||||||||||||||||
| Less: Amortization of Options (4) |
71,280 | |||||||||||||||||
| Less: Recognition Plan Vesting (5) |
79,200 | |||||||||||||||||
|
|
|
|||||||||||||||||
| Net Earnings Impact | ($ | 109,542 | ) | |||||||||||||||
| Before Conversion |
Net Earnings Increase |
After Conversion | ||||||||||||||||
| 4. |
Pro Forma Earnings | |||||||||||||||||
| 12 Months ended June 30, 2016 (reported) | $ | 1,026,000 | ($ | 109,542 | ) | $ | 916,458 | |||||||||||
| 12 Months ended June 30, 2016 (core) | $ | 1,013,000 | ($ | 109,542 | ) | $ | 903,458 | |||||||||||
| Before Conversion |
Net Cash Proceeds |
Tax Benefit Of Contribution |
After Conversion | |||||||||||||||
| 5. |
Pro Forma Net Worth | |||||||||||||||||
| June 30, 2016 | $ | 12,971,000 | $ | 13,290,050 | $ | 0 | $ | 26,261,050 | ||||||||||
| June 30, 2016 (Tangible) | $ | 12,971,000 | $ | 13,290,050 | $ | 0 | $ | 26,261,050 | ||||||||||
| Before Conversion |
Net Cash Proceeds |
Tax Benefit Of Contribution |
After Conversion | |||||||||||||||
| 6. |
Pro Forma Assets | |||||||||||||||||
| June 30, 2016 | $ | 182,023,000 | $ | 13,290,050 | $ | 0 | $ | 195,313,050 | ||||||||||
| (1) | Includes ESOP and RRP stock purchases equal to 8.0 and 4.0 percent of total shares issued, respectively. |
| (2) | ESOP stock purchases are internally financed by a loan from the holding company. |
| (3) | ESOP borrowings are amortized over 20 years, amortization expense is tax-effected at a 40.0 percent rate. |
| (4) | Option valuation based on Black-Scholes model, 5 year vesting, and assumes 25 percent is taxable. |
| (5) | RRP is amortized over 5 years, and amortization expense is tax effected at 40.0 percent. |
Exhibit IV-8
PRO FORMA EFFECT OF CONVERSION PROCEEDS
Huntingdon Valley Bank
At the Maximum Value
| 1. |
Pro Forma Market Capitalization | $ | 18,975,000 | |||||||||||||||
| Less: Foundation Shares |
|
— | ||||||||||||||||
|
|
|
|||||||||||||||||
| 2. |
Offering Proceeds |
|
$ | 18,975,000 | ||||||||||||||
| Less: Estimated Offering Expenses |
|
1,264,105 | ||||||||||||||||
|
|
|
|||||||||||||||||
| Net Conversion Proceeds |
|
$ | 17,710,895 | |||||||||||||||
| 3. |
Estimated Additional Income from Conversion Proceeds | |||||||||||||||||
| Net Conversion Proceeds | $ | 17,710,895 | ||||||||||||||||
| Less: Cash Contribution to Foundation | 0 | |||||||||||||||||
| Less: Non-Cash Stock Purchases (1) | 2,277,000 | |||||||||||||||||
|
|
|
|||||||||||||||||
| Net Proceeds Reinvested | $ | 15,433,895 | ||||||||||||||||
| Estimated net incremental rate of return | 0.61 | % | ||||||||||||||||
|
|
|
|||||||||||||||||
| Reinvestment Income | $ | 93,529 | ||||||||||||||||
| Less: Estimated cost of ESOP borrowings (2) |
|
0 | ||||||||||||||||
| Less: Amortization of ESOP borrowings (3) |
|
45,540 | ||||||||||||||||
| Less: Amortization of Options (4) |
|
81,972 | ||||||||||||||||
| Less: Recognition Plan Vesting (5) |
|
91,080 | ||||||||||||||||
|
|
|
|||||||||||||||||
| Net Earnings Impact | ($ | 125,063 | ) | |||||||||||||||
| Before Conversion |
Net Earnings Increase |
After Conversion | ||||||||||||||||
| 4. |
Pro Forma Earnings | |||||||||||||||||
| 12 Months ended June 30, 2016 (reported) | $ | 1,026,000 | ($ | 125,063 | ) | $ | 900,937 | |||||||||||
| 12 Months ended June 30, 2016 (core) | $ | 1,013,000 | ($ | 125,063 | ) | $ | 887,937 | |||||||||||
| Before Conversion |
Net Cash Proceeds |
Tax Benefit Of Contribution |
After Conversion | |||||||||||||||
| 5. |
Pro Forma Net Worth | |||||||||||||||||
| June 30, 2016 | $ | 12,971,000 | $ | 15,433,895 | $ | 0 | $ | 28,404,895 | ||||||||||
| June 30, 2016 (Tangible) | $ | 12,971,000 | $ | 15,433,895 | $ | 0 | $ | 28,404,895 | ||||||||||
| Before Conversion |
Net Cash Proceeds |
Tax Benefit Of Contribution |
After Conversion | |||||||||||||||
| 6. |
Pro Forma Assets | |||||||||||||||||
| June 30, 2016 | $ | 182,023,000 | $ | 15,433,895 | $ | 0 | $ | 197,456,895 | ||||||||||
| (1) | Includes ESOP and RRP stock purchases equal to 8.0 and 4.0 percent of total shares issued, respectively. |
| (2) | ESOP stock purchases are internally financed by a loan from the holding company. |
| (3) | ESOP borrowings are amortized over 20 years, amortization expense is tax-effected at a 40.0 percent rate. |
| (4) | Option valuation based on Black-Scholes model, 5 year vesting, and assumes 25 percent is taxable. |
| (5) | RRP is amortized over 5 years, and amortization expense is tax effected at 40.0 percent. |
Exhibit IV-8
PRO FORMA EFFECT OF CONVERSION PROCEEDS
Huntingdon Valley Bank
At the Supermaximum Value
| 1. |
Pro Forma Market Capitalization | $ | 21,821,250 | |||||||||||||||
| Less: Foundation Shares |
— | |||||||||||||||||
|
|
|
|||||||||||||||||
| 2. |
Offering Proceeds |
$ | 21,821,250 | |||||||||||||||
| Less: Estimated Offering Expenses |
1,303,383 | |||||||||||||||||
|
|
|
|||||||||||||||||
| Net Conversion Proceeds |
$ | 20,517,867 | ||||||||||||||||
| 3. |
Estimated Additional Income from Conversion Proceeds | |||||||||||||||||
| Net Conversion Proceeds | $ | 20,517,867 | ||||||||||||||||
| Less: Cash Contribution to Foundation | 0 | |||||||||||||||||
| Less: Non-Cash Stock Purchases (1) | 2,618,550 | |||||||||||||||||
|
|
|
|||||||||||||||||
| Net Proceeds Reinvested | $ | 17,899,317 | ||||||||||||||||
| Estimated net incremental rate of return | 0.61 | % | ||||||||||||||||
|
|
|
|||||||||||||||||
| Reinvestment Income | $ | 108,470 | ||||||||||||||||
| Less: Estimated cost of ESOP borrowings (2) |
0 | |||||||||||||||||
| Less: Amortization of ESOP borrowings (3) |
52,371 | |||||||||||||||||
| Less: Amortization of Options (4) |
94,268 | |||||||||||||||||
| Less: Recognition Plan Vesting (5) |
104,742 | |||||||||||||||||
|
|
|
|||||||||||||||||
| Net Earnings Impact | ($ | 142,911 | ) | |||||||||||||||
| Before Conversion |
Net Earnings Increase |
After Conversion | ||||||||||||||||
| 4. |
Pro Forma Earnings | |||||||||||||||||
| 12 Months ended June 30, 2016 (reported) | $ | 1,026,000 | ($ | 142,911 | ) | $ | 883,089 | |||||||||||
| 12 Months ended June 30, 2016 (core) | $ | 1,013,000 | ($ | 142,911 | ) | $ | 870,089 | |||||||||||
| Before Conversion |
Net Cash Proceeds |
Tax Benefit Of Contribution |
After Conversion | |||||||||||||||
| 5. |
Pro Forma Net Worth | |||||||||||||||||
| June 30, 2016 | $ | 12,971,000 | $ | 17,899,317 | $ | 0 | $ | 30,870,317 | ||||||||||
| June 30, 2016 (Tangible) | $ | 12,971,000 | $ | 17,899,317 | $ | 0 | $ | 30,870,317 | ||||||||||
| Before Conversion |
Net Cash Proceeds |
Tax Benefit Of Contribution |
After Conversion | |||||||||||||||
| 6. |
Pro Forma Assets | |||||||||||||||||
| June 30, 2016 | $ | 182,023,000 | $ | 17,899,317 | $ | 0 | $ | 199,922,317 | ||||||||||
| (1) | Includes ESOP and RRP stock purchases equal to 8.0 and 4.0 percent of total shares issued, respectively. |
| (2) | ESOP stock purchases are internally financed by a loan from the holding company. |
| (3) | ESOP borrowings are amortized over 20 years, amortization expense is tax-effected at a 40.0 percent rate. |
| (4) | Option valuation based on Black-Scholes model, 5 year vesting, and assumes 25 percent is taxable. |
| (5) | RRP is amortized over 5 years, and amortization expense is tax effected at 40.0 percent. |
EXHIBIT V-1
RP® Financial, LC.
Firm Qualifications Statement
RP FINANCIAL, LC.
Advisory | Planning | Valuation
FIRM QUALIFICATION STATEMENT
RP® Financial, LC. (“RP Financial”) provides financial and management consulting, merger advisory and valuation services to the financial services companies, including banks, thrifts, credit unions, insurance companies, mortgage companies and others. We offer a broad array of services, high quality and prompt service, hands-on involvement by our senior staff, careful structuring of strategic initiatives and sophisticated valuation and other analyses consistent with industry practices and regulatory requirements. Our staff has extensive consulting, valuation, financial advisory and industry backgrounds.
STRATEGIC PLANNING SERVICES
RP Financial’s strategic planning services, for established or de novo banking companies, provide effective feasible plans with quantifiable results to enhance shareholder value, achieve regulatory approval or realize other objectives. We conduct situation analyses; establish mission/vision statements, develope strategic goals and objectives; and identify strategies to enhance value, address capital, increase earnings, manage risk and tackle operational or organizational matters. Our proprietary financial simulation models facilitate the evaluation of the feasibility, impact and merit of alternative financial strategies.
MERGER ADVISORY SERVICES
RP Financial’s merger advisory services include targeting buyers and sellers, assessing acquisition merit, conducting due diligence, negotiating and structuring deal terms, preparing merger business plans and financial simulations, rendering fairness opinions, preparing fair valuation analyses and supporting post-merger strategies. RP Financial is also expert in de novo charters, shelf charters and failed bank deals with loss sharing or other assistance. Through financial simulations, valuation proficiency and regulatory familiarity, RP Financial’s merger advisory services center on enhancing shareholder returns.
VALUATION SERVICES
RP Financial’s extensive valuation practice includes mergers, thrift stock conversions, insurance company demutualizations, merger valuation and goodwill impairment, ESOPs, going private, secondary offerings and other purposes. We are highly experienced in performing appraisals conforming with regulatory guidelines and appraisal standards. RP Financial is the nation’s leading valuation firm for thrift stock conversions, with offerings ranging up to $4 billion.
MANAGEMENT STUDIES
RP Financial provides effective organizational planning, and we are often engaged to prepare independent management studies required for regulatory enforcement actions. We evaluate Board, management and staffing needs, assess existing talent and capabilities and make strategic recommendations for new positions, replacement, succession and other organizational matters.
ENTERPRISE RISK ASSESSMENT SERVICES
RP Financial provides effective enterprise risk assessment consulting services to assist our clients in evaluating the degree to which they have properly identified, understood, measured, monitored and controlled enterprise risk as part of a deliberate risk/reward strategy and to help them implement strategies to mitigate risk, enhance performance, ensure effective reporting and compliance with laws and regulations and avoid potential future damage to their reputation and associated consequences and to mitigate residual risk and unanticipated losses.
OTHER CONSULTING SERVICES
RP Financial provides other consulting services including evaluating regulatory changes, development diversification and branching strategies, conducting feasibility studies and other research, and preparing management studies in response to regulatory enforcement actions. We assist clients with CRA plans and revising policies and procedures. Our other consulting services are aided by proprietary valuation and financial simulation models.
KEY PERSONNEL (Years of Relevant Experience & Contact Information)
| Ronald S. Riggins, Managing Director (34) | (703) 647-6543 | rriggins@rpfinancial.com | ||
| William E. Pommerening, Managing Director (31) | (703) 647-6546 | wpommerening@rpfinancial.com | ||
| Marcus Faust, Director (27) | (703) 647-6553 | mfaust@rpfinancial.com | ||
| Gregory E. Dunn, Director (32) | (703) 647-6548 | gdunn@rpfinancial.com | ||
| James P. Hennessey, Director (29) | (703) 647-6544 | jhennessey@rpfinancial.com | ||
| James J. Oren, Director (28) | (703) 647-6549 | joren@rpfinancial.com | ||
| Carla H. Pollard, Senior Vice President (26) | (703) 647-6556 | cpollard@rpfinancial.com |
| RP Financial, LC. 1100 North Glebe Road, Suite 600 Arlington, VA 22201 |
Phone: (703) 528-1700 Fax: (703) 528-1788 www.rpfinancial.com |
1