Attached files
| file | filename |
|---|---|
| 8-K - FORM 8-K - DELTA AIR LINES, INC. | delta_8k.htm |
Exhibit 99.1

Delta – Delivering Sustainable Results Cowen and Company 9th Annual Global Transportation Conference September 7, 2016

2 Safe Harbor Statements in this presentation that are not historical facts, including statements regarding our estimates, expectations, beliefs, intentions, projections or strategies for the future, may be "forward - looking statements" as defined in the Private Securities Litigation Reform Act of 1995. All forward - looking statements involve a number of risks and uncertainties that could cause actual results to differ materially from the estimate s, expectations, beliefs, intentions, projections and strategies reflected in or suggested by the forward - looking statements. These risks and uncertainti es include, but are not limited to, the cost of aircraft fuel; the impact of rebalancing our hedge portfolio, recording mark - to - market adjustments or po sting collateral in connection with our fuel hedge contracts; the availability of aircraft fuel; the effects of terrorist attacks or geopolitical co nflict; the possible effects of accidents involving our aircraft; the restrictions that financial covenants in our financing agreements will have on our fina nci al and business operations; labor issues; interruptions or disruptions in service at one of our hub or gateway airports; disruptions or secur ity breaches of our information technology infrastructure; our dependence on technology in our operations; the effects of weather, natural disast ers and seasonality on our business; the effects of an extended disruption in services provided by third party regional carriers; failure or inabili ty of insurance to cover a significant liability at Monroe’s Trainer refinery; the impact of environmental regulation on the Trainer refinery, including co sts related to renewable fuel standard regulations; our ability to retain management and key employees; competitive conditions in the airline industry ; t he effects of extensive government regulation on our business; the sensitivity of the airline industry to prolonged periods of stagnant or weak econo mic conditions; uncertainty in economic conditions and regulatory environment in the United Kingdom related to the likely exit of the United Kin gdom from the European Union; and the effects of the rapid spread of contagious illnesses. Additional information concerning risks and uncertainties that could cause differences between actual results and forward - lookin g statements is contained in our Securities and Exchange Commission filings, including our Annual Report on Form 10 - K for the fiscal year ended Dec. 31, 2015 and our Quarterly Report on Form 10 - Q for the quarterly period ended June 30, 2016. Caution should be taken not to place undue reli ance on our forward - looking statements, which represent our views only as of September 7, 2016, and which we have no current intention to update .

3 Delta: Delivering Sustainable Results Delivering Solid Results Through Headwinds Focused on Returning to Positive RASM Positioning the Business for Long - Term Success • Business producing solid margins and cash flows through headwinds from operational disruption, volatile fuel prices, and unit revenue declines • Taking action to drive unit revenue growth needed to produce sustainable margins and cash flows, despite continued challenges in the revenue environment • More durable business model positioned to produce strong results throughout the business cycle Leveraging our solid foundation to produce consistent, sustainable results for shareholders through the business cycle

Producing a Solid September Quarter • The outage event and subsequent operational recovery efforts are expected to reduce Delta’s September quarter pretax income by $150 million, or ~1.5 points of operating margin • Unit revenues are now expected to decline approximately 7%, including ~1 point of pressure from the technology outage – performance has improved as fall capacity reductions have started to be implemented 4 Operating margin 18% - 19% Passenger unit revenue change year over year Down ~7% Fuel price $1.47 - $1.52 CASM – ex fuel including profit sharing change year over year Flat to Up 1% System capacity change year over year Up ~1.5% September Quarter 2016 Forecast On track to produce solid 18 - 19% operating margin and nearly $1.5B of operating cash flow, despite headwinds from operational disruption, volatile fuel prices, and continued unit revenue weakness

The Path To Positive PRASM Broad commercial initiatives should result in Delta being the first network carrier to return to positive unit revenue growth - an important indicator that margins and cash flows are sustainable regardless of the direction of fuel prices Domestic • Capacity growth decelerates in 2H16 and moderates to + 2.5% by 4Q vs. +5.7% in 1H16 • Domestic RASM has seen solid improvement from Summer performance as Fall schedules implemented • Revenue management strategies leverage winter capacity profile, while business travel segment becomes a larger component of overall revenue • Branded Fares expansion into more markets and distribution channels continues with strong results Latin • Already achieving positive RASM in the region driven by South America and Mexico • Currency improvement in Brazil drives both better demand and higher fares – expect Brazil RASM to continue positive trends into 4Q16 and 2017 • Latin 4Q capacity flat with reductions in Brazil and Central America and modest growth in Caribbean and Mexico Pacific • Winter capacity down 15% Yo2Y; reductions focused on underperforming markets • Additional challenges from entity restructuring & split operation in Narita and Haneda • 3Q RASM (ex - hedge) likely positive, but 4Q yields under pressure with reduced surcharges & industry capacity up ~10% • Yen at current levels a RASM tailwind, while Yen hedge related headwinds lessen in 4Q16 Atlantic • Currency to remain a modest headwind for entity into 2017 • Delta’s winter capacity is down 3% Yo2Y – trimming winter capacity as events in Paris, Brussels, Nice, Istanbul and Munich impact Transatlantic demand • Challenging revenue environment with industry capacity outstripping demand due to growth by Middle East carriers & ULCCs 5

Fuel Tailwind Now Behind Us Volatile fuel environment underscores importance of unit revenue growth to achieving long - term targets • Brent prices have increased over 85% since bottoming in late January • No hedge book remaining for 2016 • Refinery provides Delta with a competitive advantage – Logistics expertise creates opportunities to drive efficiency and value through the fuel supply chain – Lower crack spreads are a net positive for the airline, but are pushing refinery toward a modest loss for 2016 Brent Crude Prices 6 $25 $30 $35 $40 $45 $50 $55

Solid Cost Opportunity Pipeline Productivity pipeline remains robust and will allow Delta to maintain non - fuel unit cost growth below 2% annually • Leading operational efficiency and reliability drives unit cost productivity • Upgauging and r efleeting initiatives will continue to deliver benefits for several more years . – Upgauging: Avg. gauge will increase 7% over next 5 years, following a 5% increase since 2012 – Refleeting : Retirement of 747s, older 757s and domestic 767s continue and will drive $350M in savings in 2016 • 2016 maintenance benefit expected to be ~$400M – Purchased 46 aircraft or engines for green time or part - out in 2015 and materially expanding this effort in 2016 – Payback on surplus aircraft / engine purchases is generally within 12 months • Continue to leverage technology investments as well as our scale with suppliers to drive cost productivity 7 127 133 143 2012 2015 2020E Average Network Gauge 5% 7 % 50 - Seat 76 - Seat 100 - 110 Seat Small Narrowbody Large Narrowbody - 12% - 10% - 7% - 9% $50 $75 $100 $125 $150 40 60 80 100 120 140 160 180 200 Cost Per Seat Aircraft Seat Count Unit Cost Upgauge Benefit 750 mi Stage | $1.60 Fuel
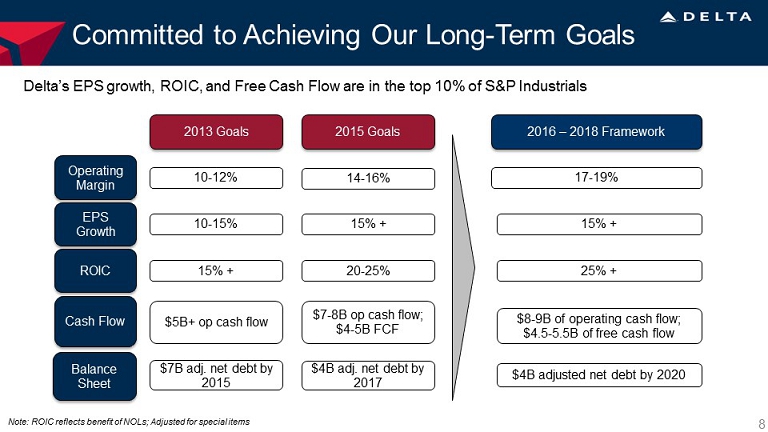
Committed to Achieving Our Long - Term Goals 8 Delta’s EPS growth, ROIC, and Free Cash Flow are in the top 10% of S&P Industrials 14 - 16% Operating Margin EPS Growth ROIC Cash Flow 2013 Goals 2015 Goals 10 - 12% 10 - 15% 15% + 15% + 20 - 25% $5B+ op cash flow $7 - 8B op cash flow ; $4 - 5B FCF $7B adj . net d ebt by 2015 $4B adj . net d ebt by 2017 2016 – 2018 Framework 17 - 19% 15% + 25% + $4B adjusted net debt by 2020 $8 - 9B of operating c ash f low ; $4.5 - 5.5B of f ree c ash flow Note: ROIC reflects benefit of NOLs; Adjusted for special items Balance Sheet

9 Consistently Improving Our Performance Delta’s focus on its long - term financial goals has driven improved returns and de - risked the balance sheet, while allowing for increased shareholder returns Note: Delta ROIC reflects benefit of NOLs; Adjusted for special items Foundation in place to produce high - quality, sustainable returns for shareholders Return on Invested Capital Adjusted Net Debt Capital Returns to Shareholders $9.4B $7.1B $6.8B 2009 2013 2Q15 2Q16 1.5% 15.1% 23.5% 31.0% 2009 2013 LTM 2Q15 LTM 2Q16 $17.0B $ 0.4B $ 2.4B $ 3.1B 2009 2013 LTM 2Q15 LTM 2Q16

Strong Cash Generation Differentiates Delta 10 Continued strong cash generation, with ~$25 billion of operating cash flow expected over the next three years Capital Expenditures & Operating Cash Flow ($B) • Strong cash generation funds investments in the future, reductions in leverage, and capital returns to owners • Capital spending in $3.3 - 3.7B range – Delta to replace ~50% of the mainline fleet between 2014 - 2020 • Allows Delta to address upcoming fleet retirements, while continuing to reduce 50 - seaters and upgauge the domestic fleet – Full retirement of MD - 88 fleet over the next 5 years – Opportunistic aircraft pricing will drive strong returns • Resulting free cash flow is targeted between $4.5 - 5.5B per year Note: Operating cash flow adjusted for special items $1.3B $2.0B $2.9B $2.1B $3.7B ~$4B $0B $2B $4B $6B $8B 2011 2012 2013 2014 2015 2016E Capital Expenditures Operating Cash Flow

$17B ~$ 6B $4B 2009 2016E 2020 Target Balanced Approach to Capital Deployment 11 Strong free cash flow generation funds consistent shareholder returns, while also allowing for continued debt reduction Committed to Maintaining an Investment Grade Balance Sheet… ….While Returning at Least 70% of Free Cash Flow to Shareholders • Investment grade balance sheet lowers interest expense, reduces risk and provides better access to capital markets throughout the cycle • Targeting $4 billion of adjusted net debt by 2020 • Delta has demonstrated a willingness to accelerate buybacks with excess free cash flow and will complete its 3 rd repurchase authorization ahead of schedule • Annual dividend increases 50% to $0.81 in September – a 2%+ dividend yield at current stock price Total Shareholder Returns Adjusted Net Debt $ 1.3B ~$400M ~$200M Interest Expense: $ 350M $ 1.4B $2.6B ~$3.5B 2013 2014 2015 2016E

Delta Is A Compelling Investment 12 Performance is consistent with high quality industrial peers, but current valuation overprices risk Note: High quality industrial transports include CHRW, CSX, EXPD, FDX, KSU, NSC, R, UNP, UPS; Adjusted for special items; Based on 2016 consensus estimates. $37 $94 $97 $113 Current Stock Price DAL @ High Qual. Ind. Trans. P/E Multiple DAL @ High Qual. Ind. Trans. EV/EBITDA Multiple DAL @ High Qual. Ind. Trans. Free Cash Flow Multiple Implied Delta Stock Price at High Quality Industrial Transport Valuation Multiples +205% + 160% + 155%

Non-GAAP Financial Measures
Note A: The following tables show reconciliations of non-GAAP financial measures. The reasons Delta uses these measures are described below.
Delta sometimes uses information ("non-GAAP financial measures") that is derived from the Consolidated Financial Statements, but that is not presented in accordance with accounting principles generally accepted in the U.S. (“GAAP”). Under the U.S. Securities and Exchange Commission rules, non-GAAP financial measures may be considered in addition to results prepared in accordance with GAAP, but should not be considered a substitute for or superior to GAAP results. The tables below show reconciliations of non-GAAP financial measures used in this presentation to the most directly comparable GAAP financial measures.
Forward Looking Projections. The Company does not reconcile forward looking non-GAAP financial measures because MTM adjustments and settlements will not be known until the end of the period and could be significant.
Return on Invested Capital
Delta presents return on invested capital as management believes this metric is helpful to investors in assessing the company’s ability to generate returns using its invested capital and as a measure against the industry. Return on invested capital is adjusted total operating income divided by average invested capital.
| Last Twelve Months Ended | Last Twelve Months Ended | Year Ended | Year Ended | |||||||||||||
| (in billions, except % of return) | June 30, 2016 | June 30, 2015 | December 31, 2013 | December 31, 2009 | ||||||||||||
| Adjusted book value of equity | $ | 18.5 | $ | 17.5 | $ | 15.4 | $ | 12.9 | ||||||||
| Average adjusted net debt | 6.8 | 7.4 | 10.5 | 16.8 | ||||||||||||
| Average invested capital | $ | 25.3 | $ | 24.9 | $ | 25.9 | $ | 29.7 | ||||||||
| Adjusted total operating income | $ | 7.8 | $ | 5.9 | $ | 3.9 | $ | 0.5 | ||||||||
| Return on invested capital | 31.0% | 23.5% | 15.1% | 1.5% | ||||||||||||
| 14 |
Adjusted Net Debt
Delta uses adjusted total debt, including aircraft rent, in addition to long-term adjusted debt and capital leases, to present estimated financial obligations. Delta reduces adjusted debt by cash, cash equivalents and short-term investments, and hedge margin receivable, resulting in adjusted net debt, to present the amount of assets needed to satisfy the debt. Management believes this metric is helpful to investors in assessing the company’s overall debt profile. Management has reduced adjusted debt by the amount of hedge margin receivable, which reflects cash posted to counterparties, as we believe this removes the impact of current market volatility on our unsettled hedges and is a better representation of the continued progress we have made on our debt initiatives.
| (in billions) | June 30, 2016 | June 30, 2015 | December 31, 2013 | December 31, 2009 | ||||||||||||||||||||||||||||
| Debt and capital lease obligations | $ | 7.8 | $ | 9.2 | $ | 11.2 | $ | 17.2 | ||||||||||||||||||||||||
| Plus: unamortized discount, net and debt issuance costs | 0.1 | 0.1 | 0.5 | 1.1 | ||||||||||||||||||||||||||||
| Adjusted debt and capital lease obligations | $ | 7.9 | $ | 9.3 | $ | 11.7 | $ | 18.3 | ||||||||||||||||||||||||
| Plus: 7x last twelve months' aircraft rent | 1.8 | 1.7 | 1.5 | 3.4 | ||||||||||||||||||||||||||||
| Adjusted total debt | 9.7 | 11.0 | 13.2 | 21.7 | ||||||||||||||||||||||||||||
| Less: cash, cash equivalents and short-term investments | (2.9 | ) | (3.8 | ) | (3.8 | ) | (4.7 | ) | ||||||||||||||||||||||||
| Less: hedge margin receivable | – | (0.1 | ) | – | – | |||||||||||||||||||||||||||
| Adjusted net debt | $ | 6.8 | $ | 7.1 | $ | 9.4 | $ | 17.0 | ||||||||||||||||||||||||
Capital Expenditures, Net
Delta presents net capital expenditures because management believes investors should be informed that a portion of these capital expenditures are reimbursed by a third party.
| Year Ended | ||||
| (in billions) | December 31, 2014 | |||
| Property and equipment additions | $ | 2.2 | ||
| Adjustments: | – | |||
| Reimbursements related to build-to-suit leased facilities and other | (0.1 | ) | ||
| Capital expenditures, net | $ | 2.1 | ||
| 15 |
Operating Cash Flow, adjusted
Delta presents adjusted operating cash flow because management believes adjusting for the following items provides a more meaningful measure for investors. Adjustments include:
Hedge deferrals. During the March 2015 quarter, we effectively deferred settlement of a portion of our hedge portfolio until 2016 by entering into fuel derivative transactions that, excluding market movements from the date of the transactions, provided approximately $150 million in cash receipts during the September 2015 quarter and $150 million in cash receipts for the December 2015 quarter. Additionally, these transactions require approximately $300 million in cash payments in 2016 (excluding market movements from the date of the transactions). By effectively deferring settlement of a portion of the original derivative transactions, the restructured hedge portfolio provides additional time for the fuel market to stabilize while adding some hedge protection in 2016. Operating cash flow is adjusted to include these deferral transactions in order to allow investors to better understand the net impact of hedging activities in the periods shown.
Hedge margin. Operating cash flow is adjusted for hedge margin as we believe this adjustment removes the impact of current market volatility on our unsettled hedges and allows investors to better understand and analyze the company’s core operational performance in the periods shown.
Reimbursements related to build-to-suit facilities. Management believes investors should be informed that these reimbursements for build-to-suit leased facilities effectively reduce net cash provided by operating activities and related capital expenditures.
| Year Ended December 31, | ||||||||||||||||||||
| (in billions) | 2015 | 2014 | 2013 | 2012 | 2011 | |||||||||||||||
| Net cash provided by operating activities (GAAP) | $ | 7.9 | $ | 4.9 | $ | 4.5 | $ | 2.5 | $ | 2.8 | ||||||||||
| Adjustments: | ||||||||||||||||||||
| Hedge deferrals | 0.4 | – | – | – | – | |||||||||||||||
| Hedge margin | (0.8 | ) | 0.9 | – | – | – | ||||||||||||||
| Reimbursements related to build-to-suit leased facilities | (0.1 | ) | – | – | – | – | ||||||||||||||
| SkyMiles used pursuant to advance purchase under AMEX agreement | – | – | 0.3 | 0.3 | – | |||||||||||||||
| Net cash provided by operating activities, adjusted | $ | 7.4 | $ | 5.8 | $ | 4.8 | $ | 2.8 | $ | 2.8 | ||||||||||
| 16 |