Attached files
| file | filename |
|---|---|
| 8-K - FORM 8-K - ConnectOne Bancorp, Inc. | f8k_090716.htm |
Exhibit 99.1
Raymond James September 7, 2016 Chicago, IL
Forward-Looking Statements This presentation contains forward-looking statements. Any statements about our expectations, beliefs, plans, predictions, forecasts, objectives,assumptionsorfutureeventsorperformancearenothistoricalfactsandmaybeforward-looking.Thesestatementsareoften, butnotalways,madethroughtheuseofwordsorphrasessuchas“anticipate,”“believes,”“can,”“could,”“may,”“predicts,”“potential,” “should,” “will,” “estimate,” “plans,” “projects,” “continuing,” “ongoing,” “expects,” “intends” and similar words or phrases. Accordingly,thesestatementsareonlypredictionsandinvolveestimates,knownandunknownrisks,assumptionsanduncertaintiesthat could cause actual results to differ materially from those expressed in them. Our actual results could differ materially from those anticipated insuchforward-lookingstatementsasaresultofseveralfactors morefully described under“RiskFactors”inourAnnual ReportonForm10-k,Item 1A.Any orallofourforward-lookingstatements inthispresentation may turnouttobeinaccurate.The inclusion of this forward-looking information should not be regarded as a representation by us that the future plans, estimates or expectationscontemplatedbyuswillbeachieved.Wehavebasedtheseforward-lookingstatementslargelyonourcurrentexpectations andprojectionsaboutfutureeventsandfinancialtrendsthatwebelievemayaffectourfinancialcondition,resultsofoperations,business strategyandfinancialneeds.Thereareimportantfactorsthatcouldcauseouractualresults,levelofactivity,performanceorachievements to differ materially from the results, level of activity, performance or achievements expressed or implied by the forward looking statementsincluding,butnotlimitedto:(1)changesingeneraleconomicandfinancialmarketconditions;(2)changesintheregulatory environment;(3)economicconditionsgenerally andinthefinancialservicesindustry;(4)changesintheeconomyaffectingrealestate values;(5)ourabilitytoachieveloananddepositgrowth;(6)thecompletionofourfutureacquisitionsorbusinesscombinationsandour ability tointegrate theacquiredbusinessintoourbusinessmodel;(7)projected populationandincome growthinourtargeted market areas;and(8)volatility anddirection ofmarket interest rates and aweakening ofthe economy whichcouldmaterially impact credit qualitytrendsandtheabilitytogenerateloans.Allforward-lookingstatementsarenecessarilyonlyestimatesoffutureresultsandactual resultsmaydiffermateriallyfromexpectations.Youare,therefore,cautionednottoplaceunduerelianceonsuchstatementswhichshould bereadinconjunctionwiththeothercautionarystatementsthatareincludedelsewhereinthispresentation.Further,anyforward-looking statementspeaksonlyasofthedateonwhichitismadeandweundertakenoobligationtoupdateorreviseanyforward-lookingstatement toreflecteventsorcircumstancesafterthedateonwhichthestatementismadeortoreflecttheoccurrenceofunanticipatedevents. 2
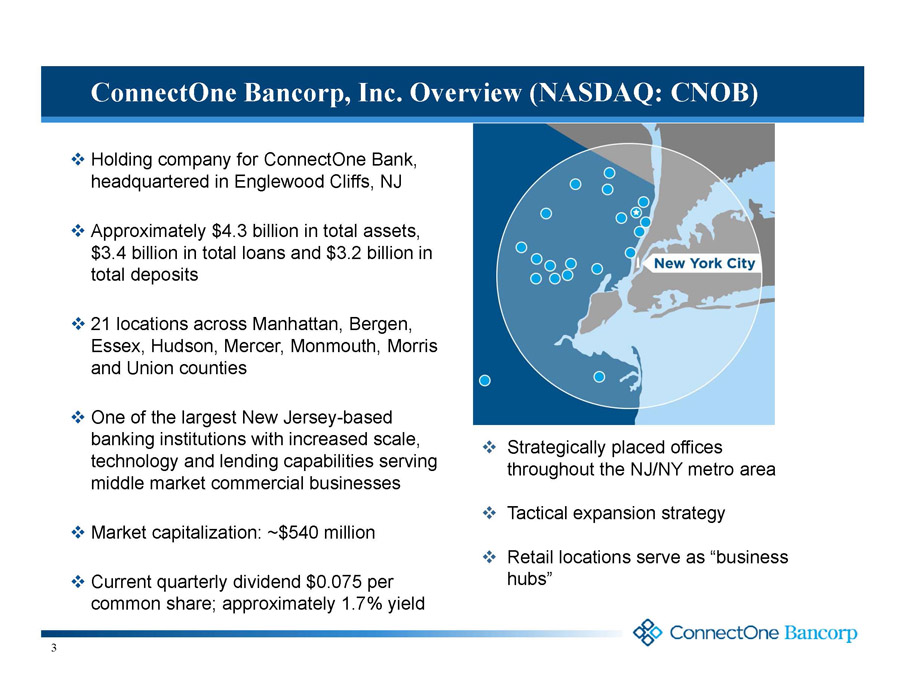
ConnectOne Bancorp, Inc. Overview (NASDAQ: CNOB) □Holding company for ConnectOne Bank, headquartered in Englewood Cliffs, NJ □Approximately $4.3 billion in total assets, $3.4 billion in total loans and $3.2billion in total deposits □21 locations across Manhattan, Bergen, Essex, Hudson, Mercer, Monmouth, Morris and Union counties □One of the largest New Jersey-based banking institutions with increased scale, technology and lending capabilities serving middle market commercial businesses □Market capitalization: ~$540 million □Current quarterly dividend $0.075 per common share; approximately 1.7% yield 3 □ Strategically placed offices throughout the NJ/NY metro area □ Tactical expansion strategy □ Retail locations serve as “business hubs”
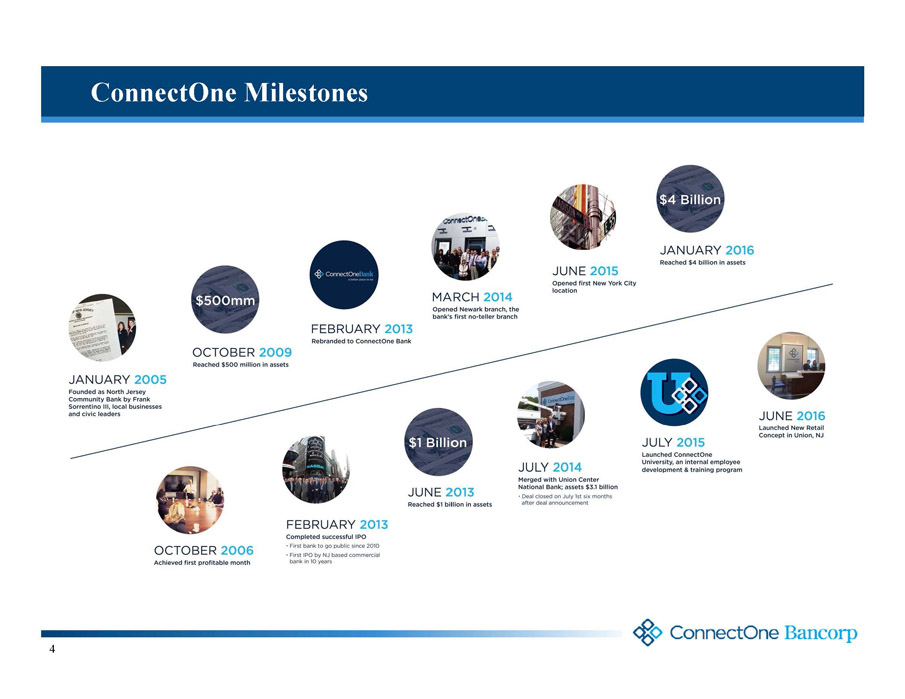
4 ConnectOne Milestones
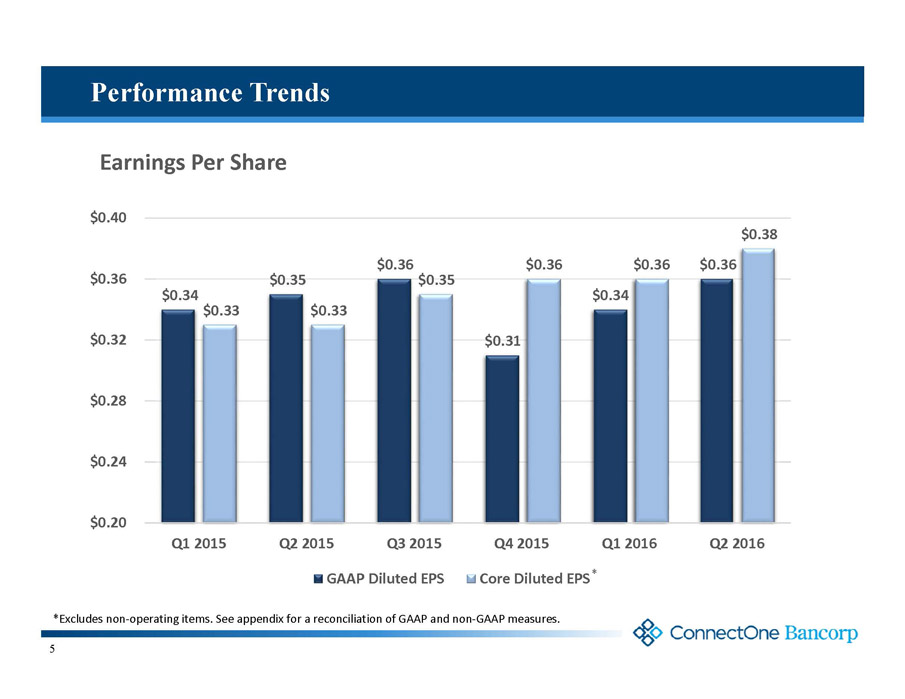
5 Performance Trends *Excludes non-operating items. See appendix for a reconciliation of GAAP and non-GAAP measures. $0.34 $0.35 $0.36 $0.31 $0.34 $0.36 $0.33 $0.33 $0.35 $0.36 $0.36 $0.38 $0.20 $0.24 $0.28 $0.32 $0.36 $0.40 Q1 2015 Q2 2015 Q3 2015 Q4 2015 Q1 2016 Q2 2016 Earnings Per Share GAAP Diluted EPS Core Diluted EPS *
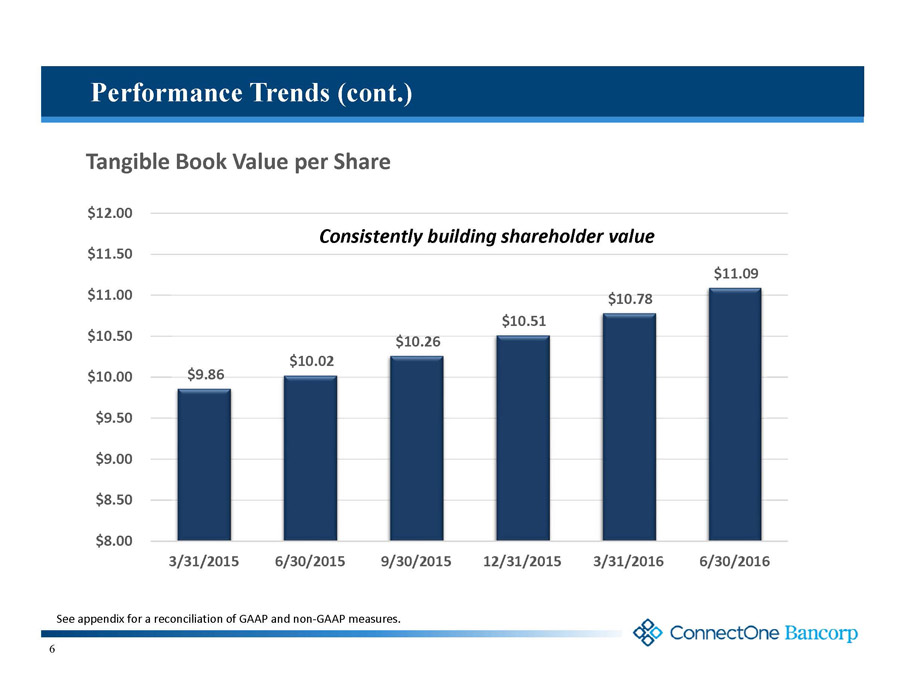
6 Performance Trends(cont.) See appendix for a reconciliation of GAAP and non-GAAP measures. $9.86 $10.02 $10.26 $10.51 $10.78 $11.09 $8.00 $8.50 $9.00 $9.50 $10.00 $10.50 $11.00 $11.50 $12.00 3/31/2015 6/30/2015 9/30/2015 12/31/2015 3/31/2016 6/30/2016 Tangible Book Value per Share Consistently building shareholder value
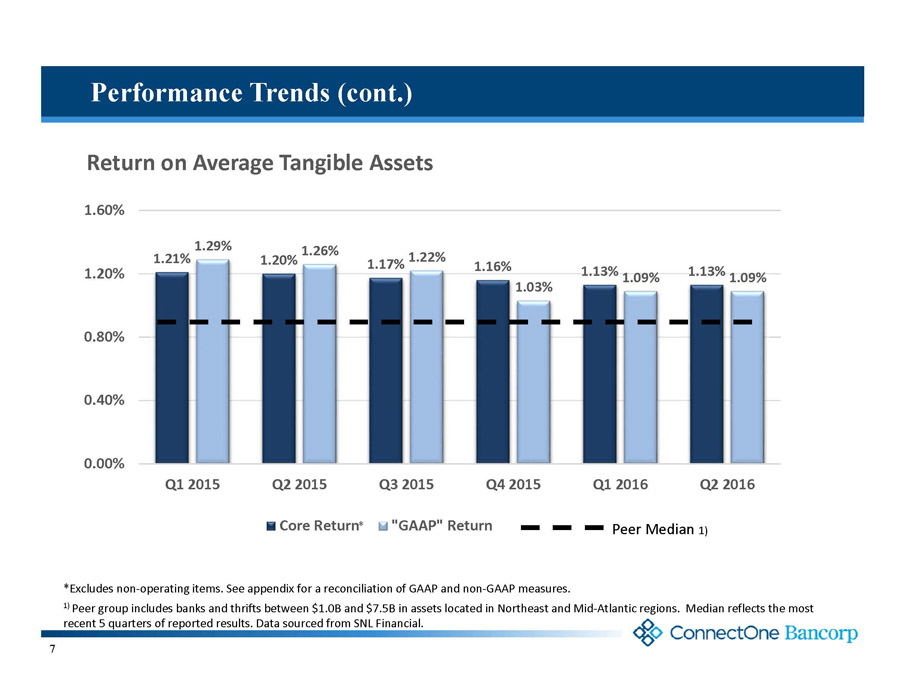
7 Performance Trends (cont.) *Excludes non-operating items. See appendix for a reconciliation of GAAP and non-GAAP measures. 1) Peer group includes banks and thrifts between $1.0B and $7.5B in assets located in Northeast and Mid-Atlantic regions. Median reflects the most recent 5 quarters of reported results. Data sourced from SNL Financial. 1.21% 1.20% 1.17% 1.16% 1.13% 1.13% 1.29% 1.26% 1.22% 1.03% 1.09% 1.09% 0.00% 0.40% 0.80% 1.20% 1.60% Q1 2015 Q2 2015 Q3 2015 Q4 2015 Q1 2016 Q2 2016 Return on Average Tangible Assets Core Return "GAAP" Return Peer Median 1) *
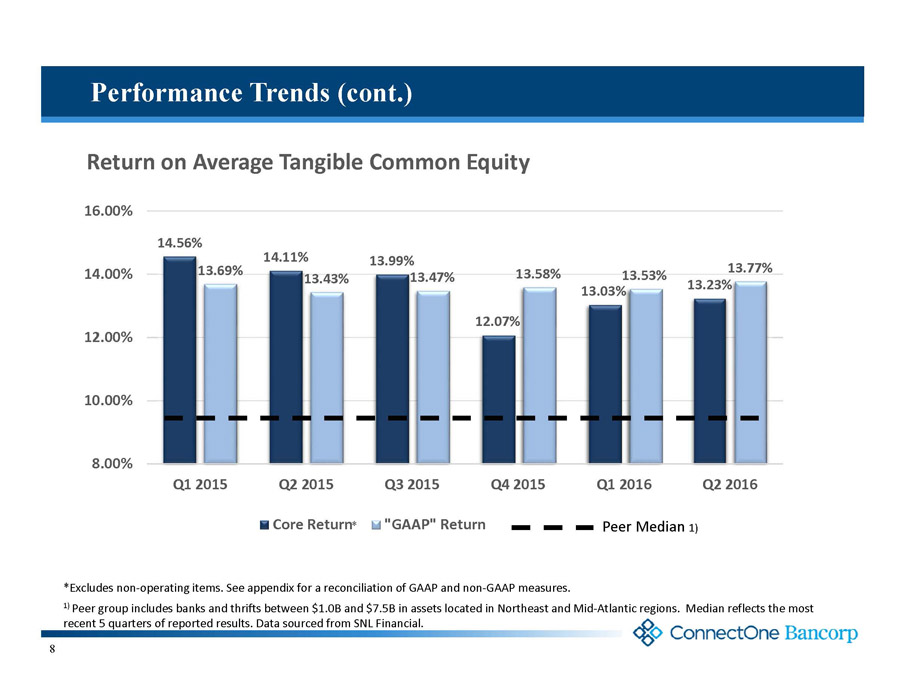
8 Performance Trends (cont.) *Excludes non-operating items. See appendix for a reconciliation of GAAP and non-GAAP measures. 1) Peer group includes banks and thrifts between $1.0B and $7.5B in assets located in Northeast and Mid-Atlantic regions. Median reflects the most recent 5 quarters of reported results. Data sourced from SNL Financial. 14.56% 14.11% 13.99% 12.07% 13.03% 13.23% 13.69% 13.43% 13.47% 13.58% 13.53% 13.77% 8.00% 10.00% 12.00% 14.00% 16.00% Q1 2015 Q2 2015 Q3 2015 Q4 2015 Q1 2016 Q2 2016 Return on Average Tangible Common Equity Core Return "GAAP" Return Peer Median 1) *
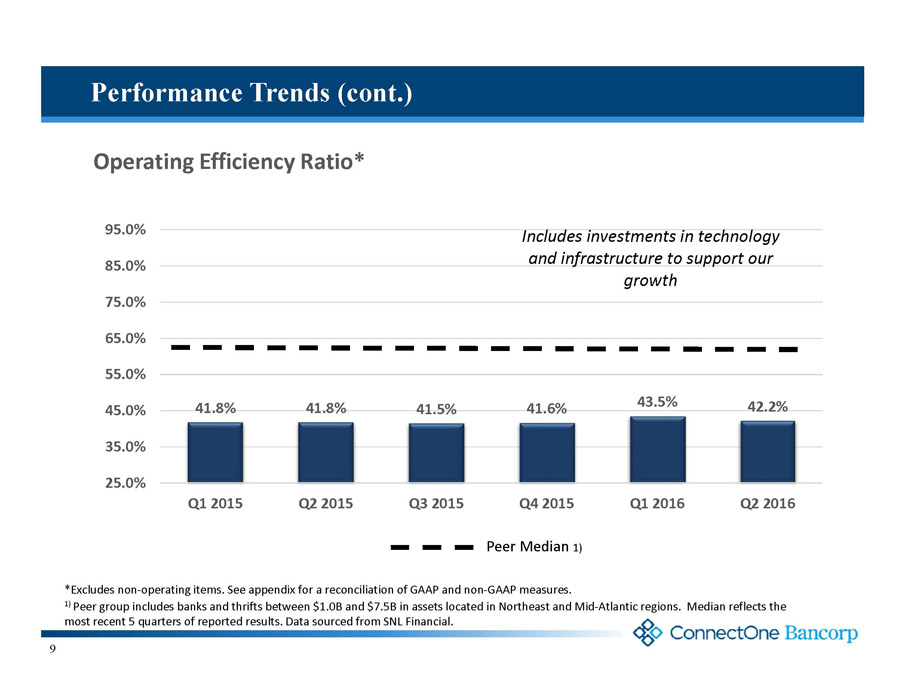
9 Performance Trends (cont.) *Excludes non-operating items. See appendix for a reconciliation of GAAP and non-GAAP measures. 1) Peer group includes banks and thrifts between $1.0B and $7.5B in assets located in Northeast and Mid-Atlantic regions. Median reflects the most recent 5 quarters of reported results. Data sourced from SNL Financial. 41.8% 41.8% 41.5% 41.6% 43.5% 42.2% 25.0% 35.0% 45.0% 55.0% 65.0% 75.0% 85.0% 95.0% Q1 2015 Q2 2015 Q3 2015 Q4 2015 Q1 2016 Q2 2016 Operating Efficiency Ratio* Includes investments in technology and infrastructure to support our growth Peer Median 1)
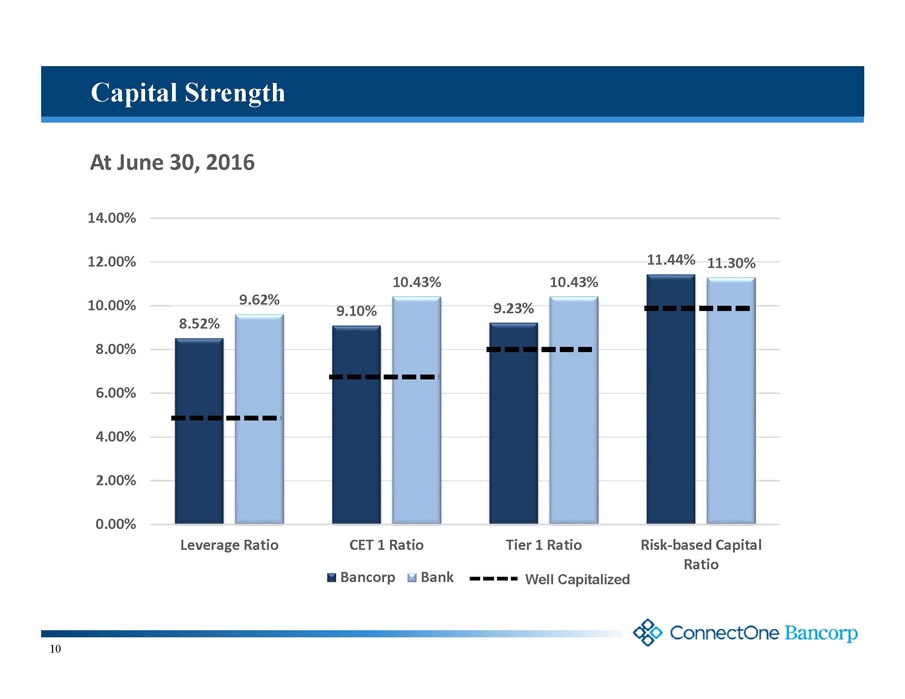
10 Capital Strength 8.52% 9.10% 9.23% 11.44% 9.62% 10.43% 10.43% 11.30% 0.00% 2.00% 4.00% 6.00% 8.00% 10.00% 12.00% 14.00% Leverage Ratio CET 1 Ratio Tier 1 Ratio Risk-based Capital Ratio At June 30, 2016 Bancorp Bank Well Capitalized
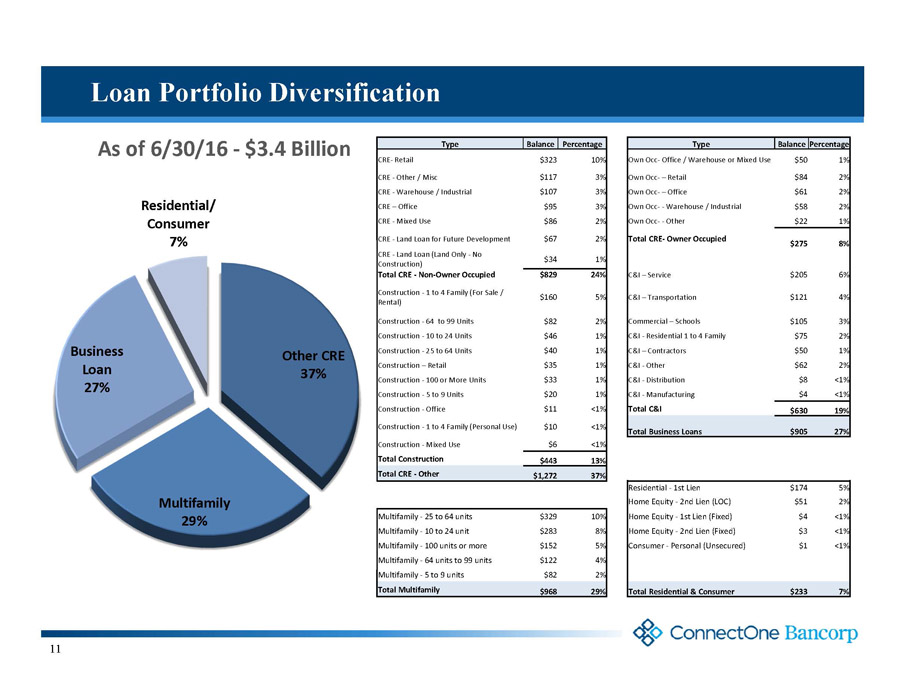
11 Loan Portfolio Diversification As of 6/30/16 -$3.4 Billion Type Balance Percentage Type BalancePercentage CRE-Retail $323 10% Own Occ-Office / Warehouse or Mixed Use $50 1% CRE -Other / Misc $117 3% Own Occ-–Retail $84 2% CRE -Warehouse / Industrial $107 3% Own Occ-–Office $61 2% CRE –Office $95 3% Own Occ--Warehouse / Industrial $58 2% CRE -Mixed Use $86 2% Own Occ--Other $22 1% CRE -Land Loan for Future Development $67 2% Total CRE-Owner Occupied $275 8% CRE -Land Loan (Land Only -No Construction) $34 1% Total CRE -Non-Owner Occupied $829 24% C&I –Service $205 6% Construction -1 to 4 Family (For Sale / Rental) $160 5% C&I –Transportation $121 4% Construction -64 to 99 Units $82 2% Commercial –Schools $105 3% Construction -10 to 24 Units $46 1% C&I -Residential 1 to 4 Family $75 2% Construction -25 to 64 Units $40 1% C&I –Contractors $50 1% Construction –Retail $35 1% C&I -Other $62 2% Construction -100 or More Units $33 1% C&I -Distribution $8 <1% Construction -5 to 9 Units $20 1% C&I -Manufacturing $4 <1% Construction -Office $11 <1% Total C&I $630 19% Construction -1 to 4 Family (Personal Use) $10 <1% Total Business Loans $905 27% Construction -Mixed Use $6 <1% Total Construction $443 13% Total CRE -Other $1,272 37% Residential -1st Lien $174 5% Home Equity -2nd Lien (LOC) $51 2% Multifamily -25 to 64 units $329 10% Home Equity -1st Lien (Fixed) $4 <1% Multifamily -10 to 24 unit $283 8% Home Equity -2nd Lien (Fixed) $3 <1% Multifamily -100 units or more $152 5% Consumer -Personal (Unsecured) $1 <1% Multifamily -64 units to 99 units $122 4% Multifamily -5 to 9 units $82 2% Total Multifamily $968 29% Total Residential & Consumer $233 7% Other CRE 37% Multifamily 29% Business Loan 27% Residential/ Consumer 7%
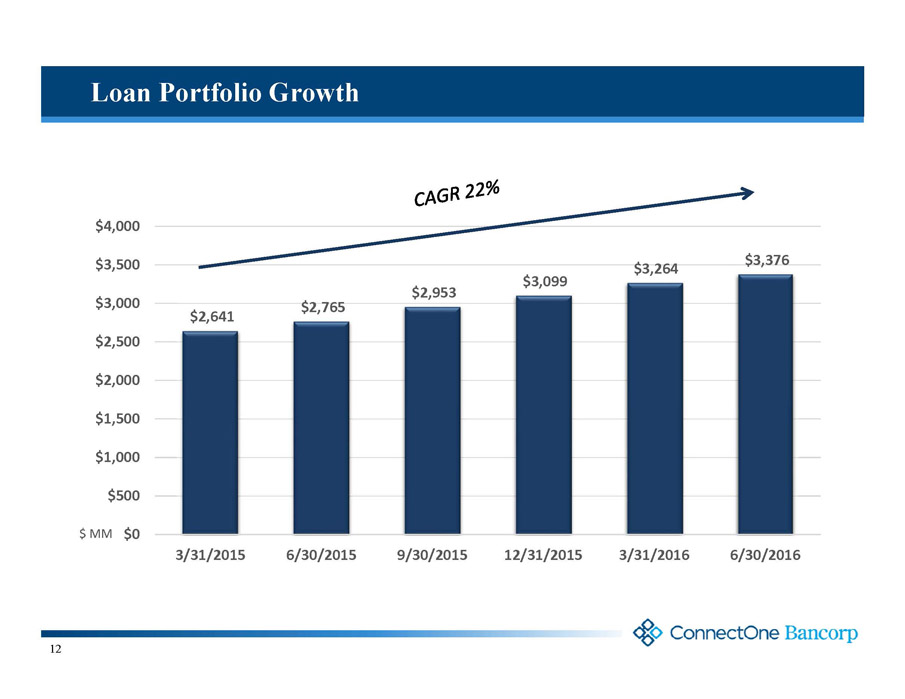
12 Loan Portfolio Growth $2,641 $2,765 $2,953 $3,099 $3,264 $3,376 $0 $500 $1,000 $1,500 $2,000 $2,500 $3,000 $3,500 $4,000 3/31/2015 6/30/2015 9/30/2015 12/31/2015 3/31/2016 6/30/2016 $ MM
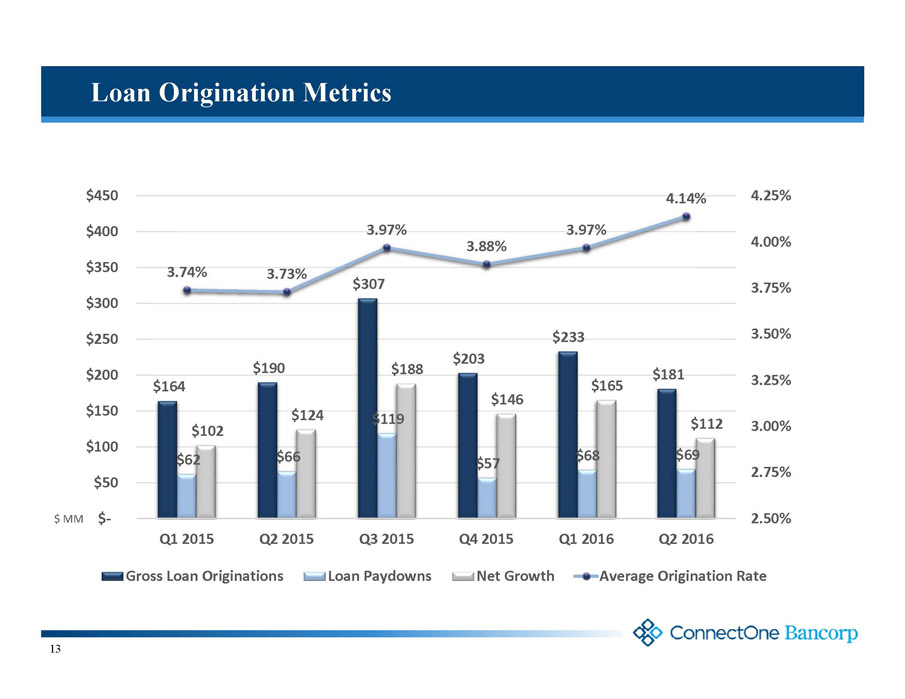
13 Loan Origination Metrics $164 $190 $307 $203 $233 $181 $62 $66 $119 $57 $68 $69 $102 $124 $188 $146 $165 $112 3.74% 3.73% 3.97% 3.88% 3.97% 4.14% 2.50% 2.75% 3.00% 3.25% 3.50% 3.75% 4.00% 4.25% $- $50 $100 $150 $200 $250 $300 $350 $400 $450 Q1 2015 Q2 2015 Q3 2015 Q4 2015 Q1 2016 Q2 2016 Gross Loan Originations Loan Paydowns Net Growth Average Origination Rate $ MM
14 Commitment to Solid Credit Quality □ Comprehensive underwriting standards and processes Disciplined LTV and DSC standards Loan origination process supported by specialized teams of credit analysts □ We stick to what we do best High quality direct commercial lending No reliance on participations or wholesale loan purchases Stay away from riskier lending, e.g., indirect auto, 2ndlien positions, leasing, SBA lending or anything “sub-prime” □ Lending within geographic footprint NYC Metro region economically strong and diverse □ Multi-faceted stress testing Every loan tested during underwriting process Quarterly modeling performed in conjunction with ALCO and ERM processes Annual third-party testing conducted on more than 2/3 rd ’s of the portfolio □ Continued focus on loan monitoring and collection by a team of portfolio managers and loan workout specialists
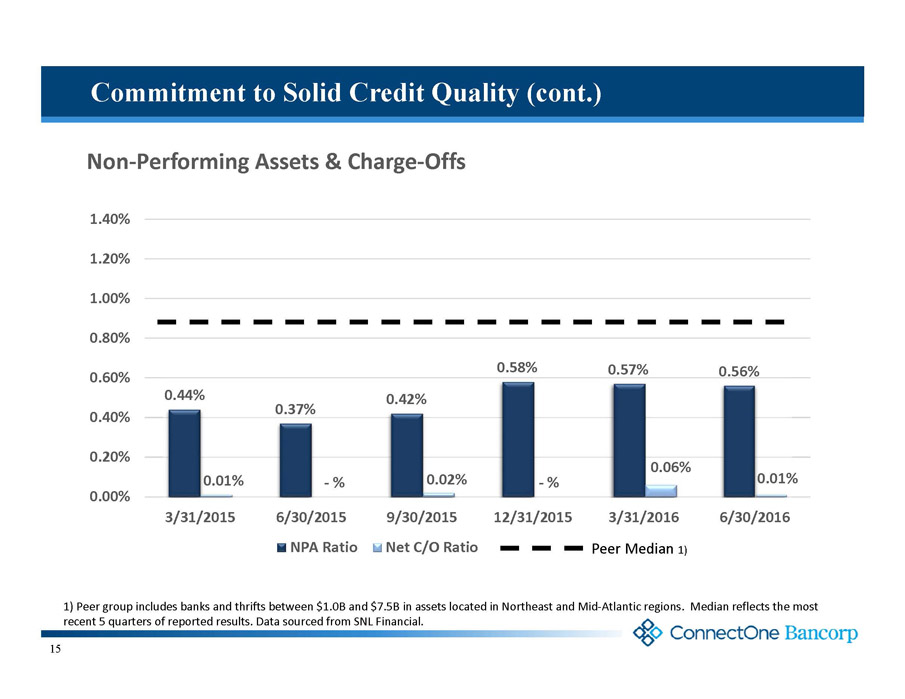
15 Commitment to Solid Credit Quality (cont.) 1) Peer group includes banks and thrifts between $1.0B and $7.5B in assets located in Northeast and Mid-Atlantic regions. Median reflects the most recent 5 quarters of reported results. Data sourced from SNL Financial. 0.44% 0.37% 0.42% 0.58% 0.57% 0.56% 0.01% -% 0.02% -% 0.06% 0.01% 0.00% 0.20% 0.40% 0.60% 0.80% 1.00% 1.20% 1.40% 3/31/2015 6/30/2015 9/30/2015 12/31/2015 3/31/2016 6/30/2016 Non-Performing Assets & Charge-Offs NPA Ratio Net C/O Ratio Peer Median 1)
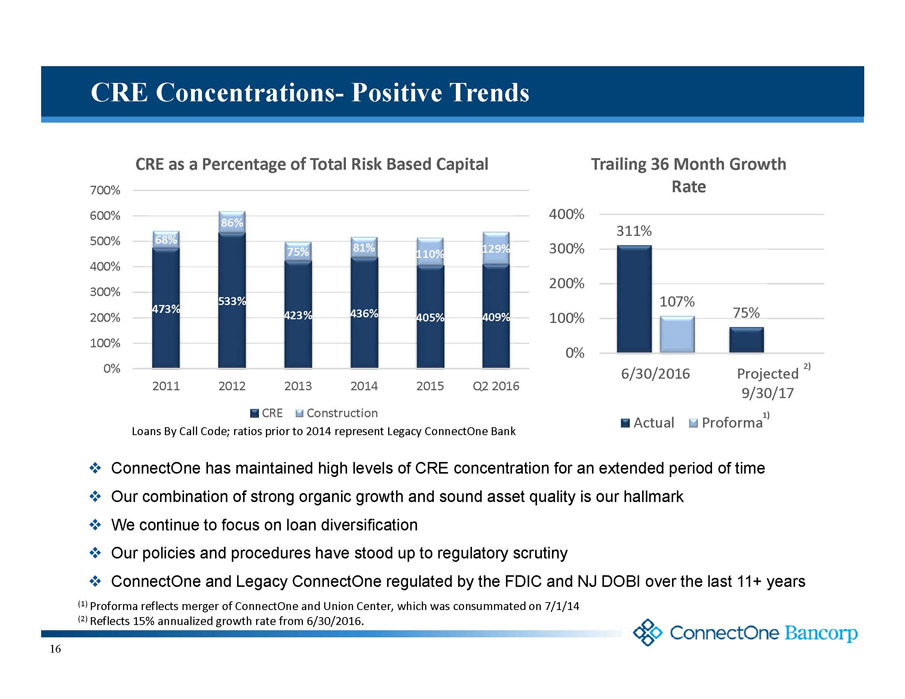
16 CRE Concentrations-Positive Trends □ ConnectOne has maintained high levels of CRE concentration for an extended period of time □ Our combination of strong organic growth and sound asset quality is our hallmark □ We continue to focus on loan diversification □ Our policies and procedures have stood up to regulatory scrutiny □ ConnectOne and Legacy ConnectOne regulated by the FDIC and NJ DOBI over the last 11+ years Loans By Call Code; ratios prior to 2014 represent Legacy ConnectOne Bank 473% 533% 423% 436% 405% 409% 68% 86% 75% 81% 110% 129% 0% 100% 200% 300% 400% 500% 600% 700% 2011 2012 2013 2014 2015 Q2 2016 CRE as a Percentage of Total Risk Based Capital CRE Construction (1) Proformareflects merger of ConnectOne and Union Center, which was consummated on 7/1/14 (2) Reflects 15% annualized growth rate from 6/30/2016. 311% 75% 107% 0% 100% 200% 300% 400% 6/30/2016 Projected 9/30/17 Trailing 36 Month Growth Rate Actual Proforma 1) 2)
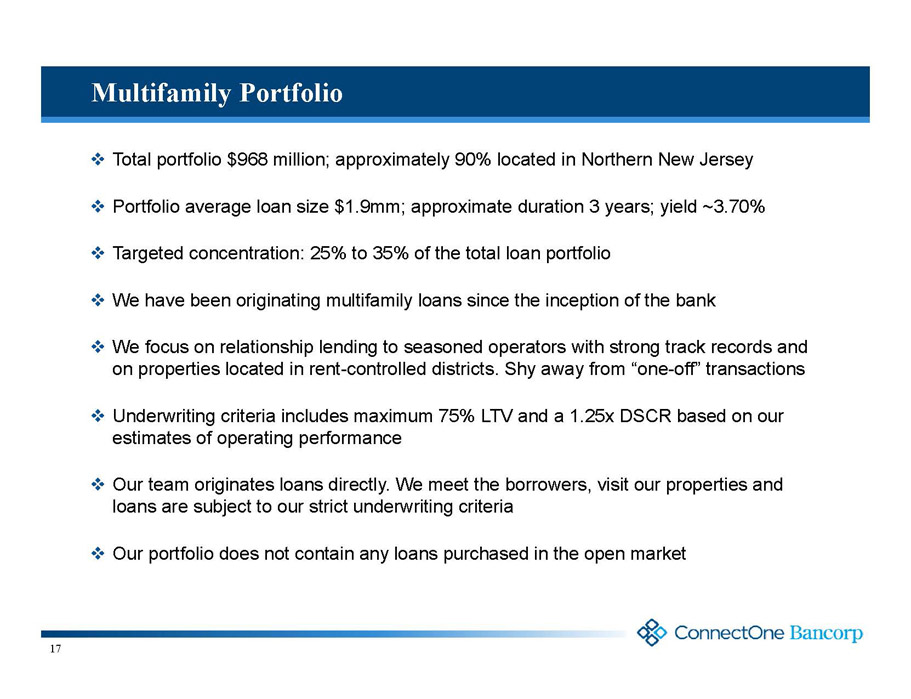
17 Multifamily Portfolio □Total portfolio $968 million; approximately 90% located in Northern New Jersey □Portfolio average loan size $1.9mm; approximate duration 3 years; yield ~3.70% □Targeted concentration: 25% to 35% of the total loan portfolio □We have been originating multifamily loans since the inception of the bank □We focus on relationship lending to seasoned operators with strong track records and on properties located in rent-controlled districts. Shy away from “one-off” transactions □Underwriting criteria includes maximum 75% LTV and a 1.25x DSCR based on our estimates of operating performance □Our team originates loans directly. We meet the borrowers, visit our properties and loans are subject to our strict underwriting criteria □Our portfolio does not contain any loans purchased in the open market
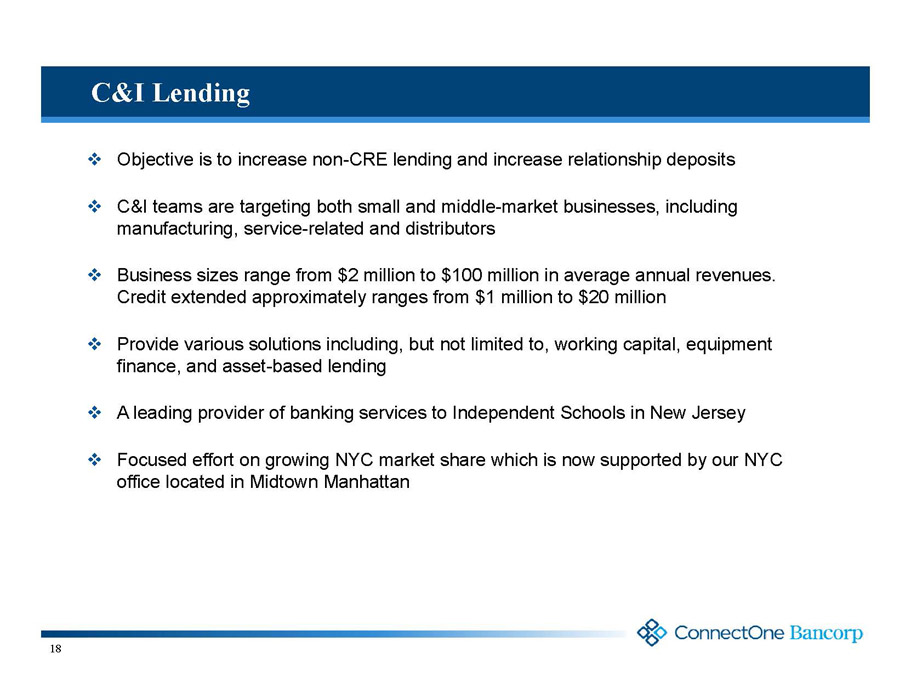
18 C&I Lending □ Objective is to increase non-CRE lending and increase relationship deposits □ C&I teams are targeting both small and middle-market businesses, including manufacturing, service-related and distributors □ Business sizes range from $2 million to $100 million in average annual revenues. Credit extended approximately ranges from $1 million to $20 million □ Provide various solutions including, but not limited to, working capital, equipment finance, and asset-based lending □ A leading provider of banking services to Independent Schools in New Jersey □ Focused effort on growing NYC market share which is now supported by our NYC office located in Midtown Manhattan
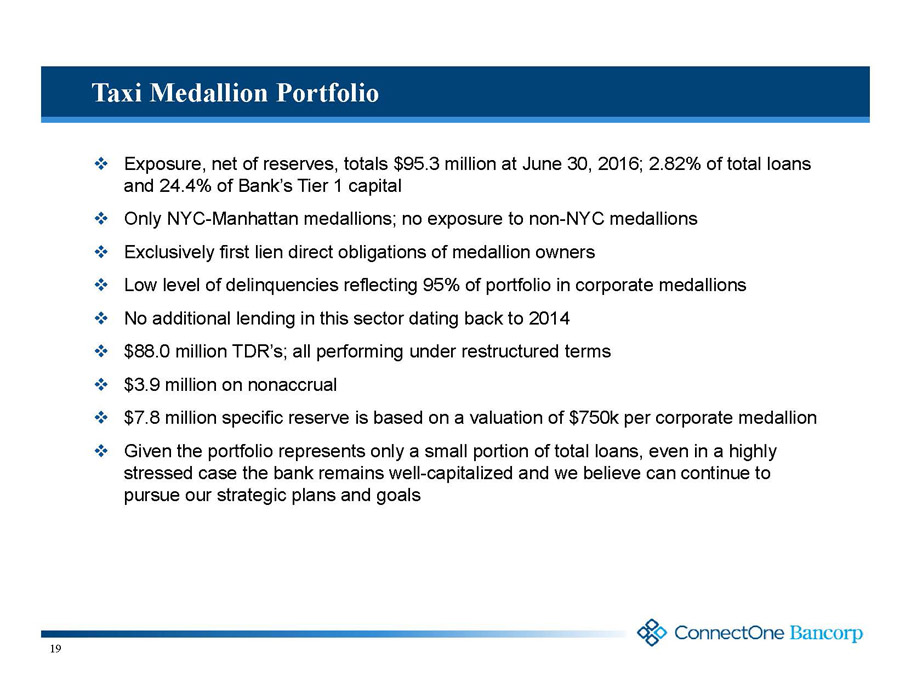
19 Taxi Medallion Portfolio □ Exposure, net of reserves, totals $95.3 million at June 30, 2016; 2.82% of total loans and 24.4% of Bank’s Tier 1 capital □ Only NYC-Manhattan medallions; no exposure to non-NYC medallions □ Exclusively first lien direct obligations of medallion owners □ Low level of delinquencies reflecting 95% of portfolio in corporate medallions □ No additional lending in this sector dating back to 2014 □ $88.0 million TDR’s; all performing under restructured terms □ $3.9 million on nonaccrual □ $7.8 million specific reserve is based on a valuation of $750k per corporate medallion □ Given the portfolio represents only a small portion of total loans, even in a highly stressed case the bank remains well-capitalized and we believe can continue to pursue our strategic plans and goals
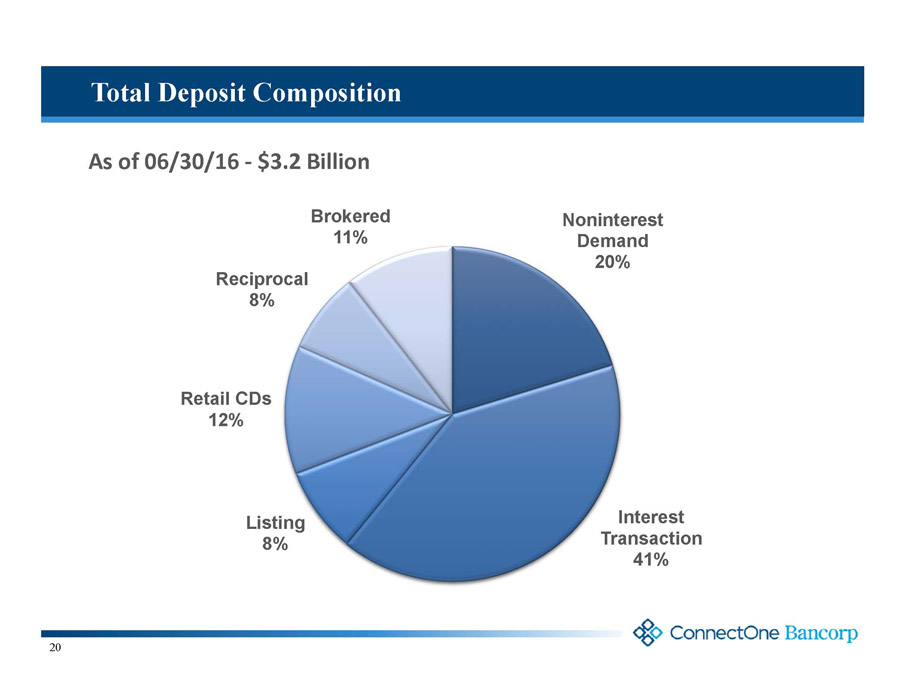
20 Total Deposit Composition Noninterest Demand 20% Interest Transaction 41% Listing 8% Retail CDs 12% Reciprocal 8% Brokered 11% As of 06/30/16 -$3.2 Billion
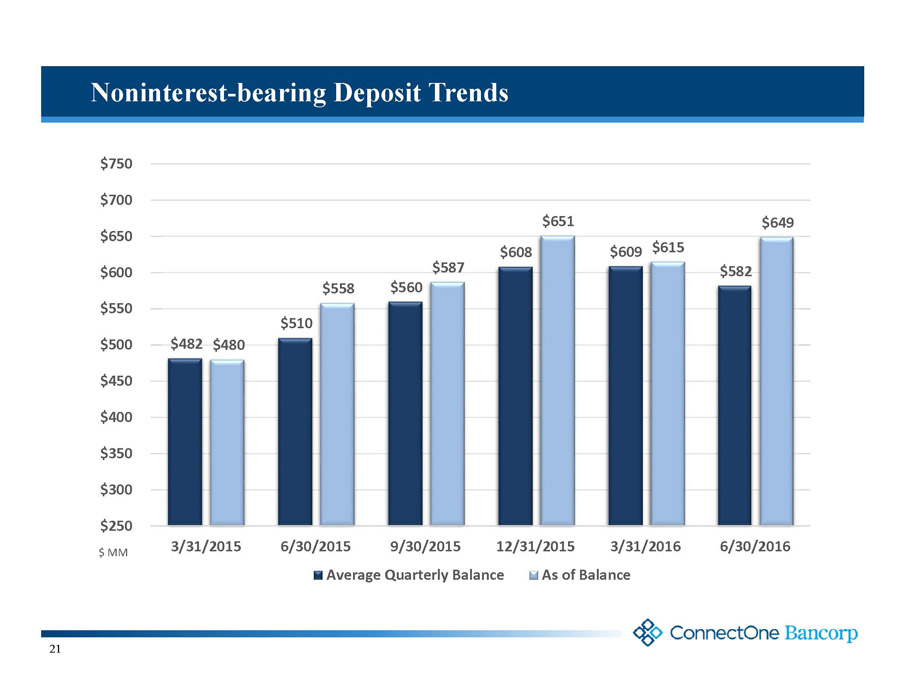
21 Noninterest-bearing Deposit Trends $482 $510 $560 $608 $609 $582 $480 $558 $587 $651 $615 $649 $250 $300 $350 $400 $450 $500 $550 $600 $650 $700 $750 3/31/2015 6/30/2015 9/30/2015 12/31/2015 3/31/2016 6/30/2016 Average Quarterly Balance As of Balance $ MM
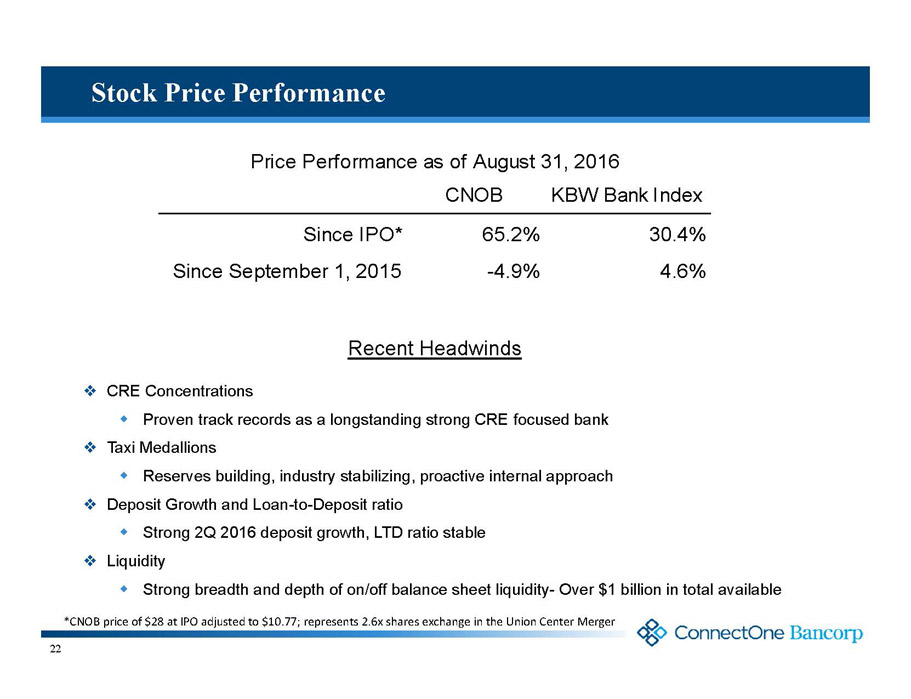
22 Stock Price Performance □ CRE Concentrations Proven track records as a longstanding strong CRE focused bank □ Taxi Medallions Reserves building, industry stabilizing, proactive internal approach □ Deposit Growth and Loan-to-Deposit ratio Strong 2Q 2016 deposit growth, LTD ratio stable □ Liquidity Strong breadth and depth of on/off balance sheet liquidity-Over $1 billion in total available Recent Headwinds CNOB KBW Bank Index Since IPO* 65.2% 30.4% Since September 1, 2015 -4.9% 4.6% Price Performance as of August 31, 2016 *CNOB price of $28 at IPO adjusted to $10.77; represents 2.6x shares exchange in the Union Center Merger
23 Liquidity Management □We focus on core deposit growth, particularly noninterest-bearing demand Recent strategic initiatives have proven successful towards both growing upon existing relationships and attracting new clients □ConnectOne has historically managed a loan-to-deposit ratio over 100%. Our loan to deposit ratio was ~105% at quarter-end □We utilize attractively priced wholesale funding along the curve to manage interest rate risk □We are continuously aiming to build on the breadth and depth of our sources of funds including commercial customers, our retail branch network, public funds, the FHLB, brokered, and listing service □Our philosophy balances liquidity, interest rate risk, and core deposits to support growth, enhance returns, and maximize franchise value
24 Three Ways To Win 1. Organic Growth □ Loan growth rates well in excess of market averages □ Increasing percentage of DDA to total deposits □ Efficient operating structure, with potential to further leverage □ Untapped sources of revenue 2. Expansion through Opportunistic Acquisition □ Skilled acquiror □ Attractive currency relative to smaller in-market participants 3. Franchise Value □ Valuable geographic footprint □ Loyal and profitable client base □ Potentially attractive to both in-market and out-of-market institutions □ Management team and Board committed to shareholder value
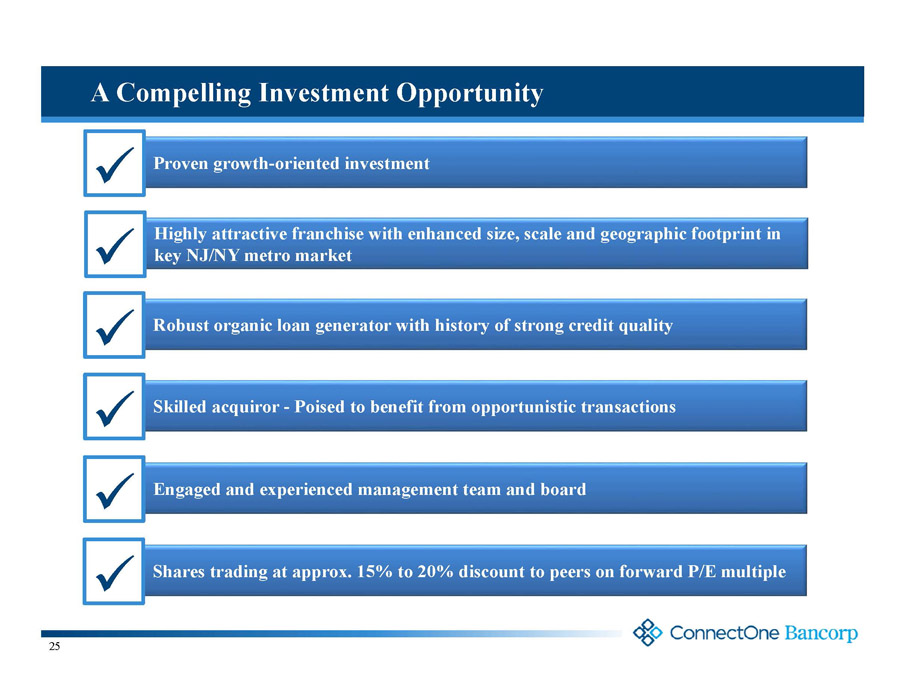
Proven growth-oriented investment Highly attractive franchise with enhanced size, scale and geographic footprint in key NJ/NY metro market Robust organic loan generator with history of strong credit quality Skilled acquiror-Poised to benefit from opportunistic transactions Engaged and experienced management team and board Shares trading at approx. 15% to 20% discount to peers on forward P/E multiple x x x x x x A Compelling Investment Opportunity 25
26
APPENDIX 27
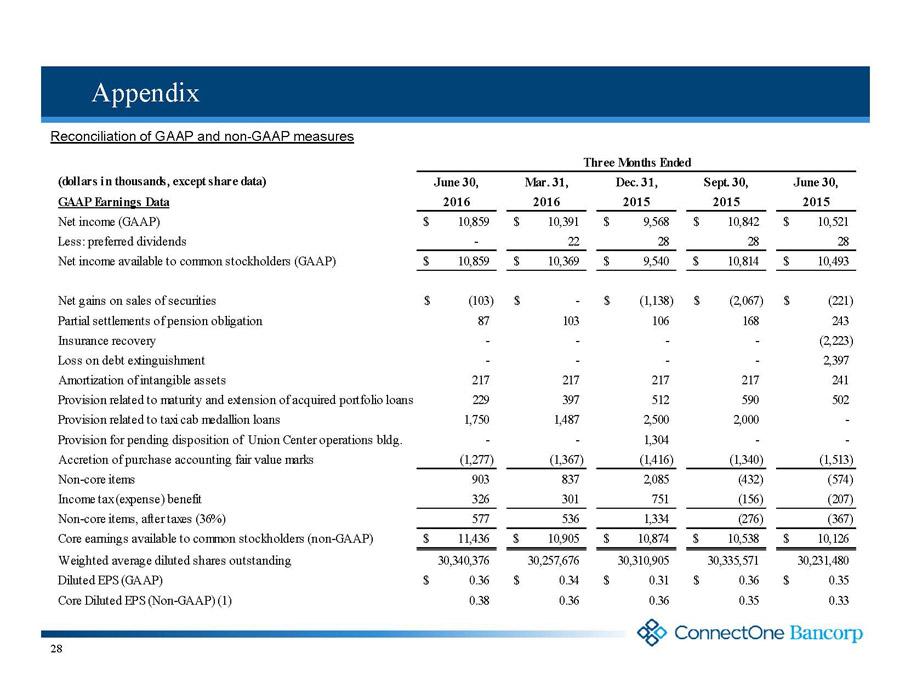
28 Appendix Reconciliation of GAAP and non-GAAP measures (dollars in thousands, except share data) June 30, Mar. 31, Dec. 31, Sept. 30, June 30, GAAP Earnings Data 2016 2016 2015 2015 2015 Net income (GAAP) 10,859$ 10,391$ 9,568$ 10,842$ 10,521$ Less: preferred dividends - 22 28 28 28 Net income available to common stockholders (GAAP) 10,859$ 10,369$ 9,540$ 10,814$ 10,493$ Net gains on sales of securities (103)$ -$ (1,138)$ (2,067)$ (221)$ Partial settlements of pension obligation 87 103 106 168 243 Insurance recovery - - - - (2,223) Loss on debt extinguishment - - - - 2,397 Amortization of intangible assets 217 217 217 217 241 Provision related to maturity and extension of acquired portfolio loans 229 397 512 590 502 Provision related to taxi cab medallion loans 1,750 1,487 2,500 2,000 - Provision for pending disposition of Union Center operations bldg. - - 1,304 - - Accretion of purchase accounting fair value marks (1,277) (1,367) (1,416) (1,340) (1,513) Non-core items 903 837 2,085 (432) (574) Income tax (expense) benefit 326 301 751 (156) (207) Non-core items, after taxes (36%) 577 536 1,334 (276) (367) Core earnings available to common stockholders (non-GAAP) 11,436$ 10,905$ 10,874$ 10,538$ 10,126$ Weighted average diluted shares outstanding 30,340,376 30,257,676 30,310,905 30,335,571 30,231,480 Diluted EPS (GAAP) 0.36$ 0.34$ 0.31$ 0.36$ 0.35$ Core Diluted EPS (Non-GAAP) (1) 0.38 0.36 0.36 0.35 0.33 Three Months Ended
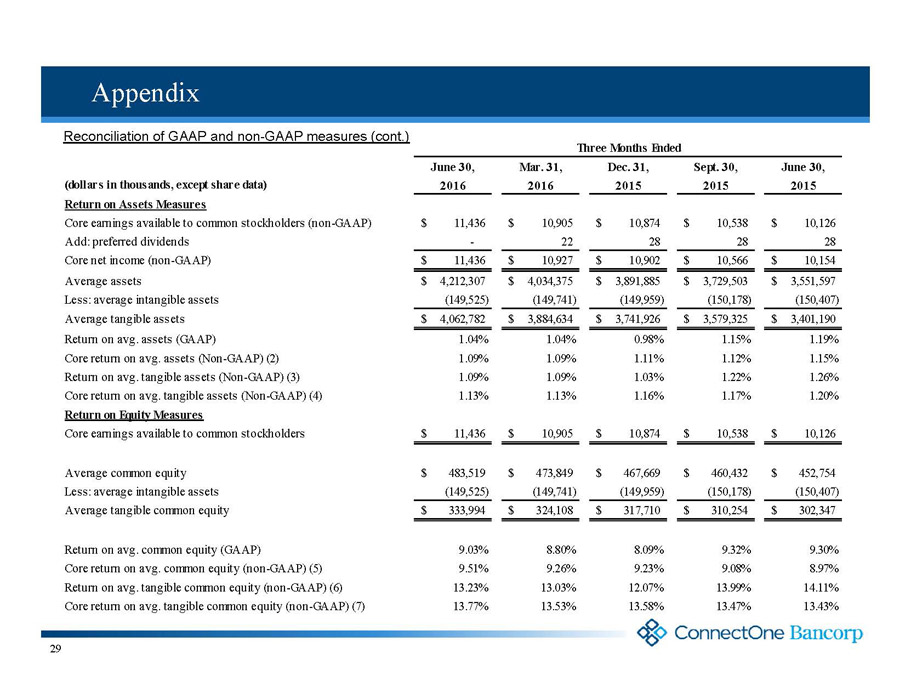
29 Appendix Reconciliation of GAAP and non-GAAP measures (cont.) June 30, Mar. 31, Dec. 31, Sept. 30, June 30, (dollars in thousands, except share data) 2016 2016 2015 2015 2015 Return on Assets Measures Core earnings available to common stockholders (non-GAAP) 11,436$ 10,905$ 10,874$ 10,538$ 10,126$ Add: preferred dividends - 22 28 28 28 Core net income (non-GAAP) 11,436$ 10,927$ 10,902$ 10,566$ 10,154$ Average assets 4,212,307$ 4,034,375$ 3,891,885$ 3,729,503$ 3,551,597$ Less: average intangible assets (149,525) (149,741) (149,959) (150,178) (150,407) Average tangible assets 4,062,782$ 3,884,634$ 3,741,926$ 3,579,325$ 3,401,190$ Return on avg. assets (GAAP) 1.04% 1.04% 0.98% 1.15% 1.19% Core return on avg. assets (Non-GAAP) (2) 1.09% 1.09% 1.11% 1.12% 1.15% Return on avg. tangible assets (Non-GAAP) (3) 1.09% 1.09% 1.03% 1.22% 1.26% Core return on avg. tangible assets (Non-GAAP) (4) 1.13% 1.13% 1.16% 1.17% 1.20% Return on Equity Measures Core earnings available to common stockholders 11,436$ 10,905$ 10,874$ 10,538$ 10,126$ Average common equity 483,519$ 473,849$ 467,669$ 460,432$ 452,754$ Less: average intangible assets (149,525) (149,741) (149,959) (150,178) (150,407) Average tangible common equity 333,994$ 324,108$ 317,710$ 310,254$ 302,347$ Return on avg. common equity (GAAP) 9.03% 8.80% 8.09% 9.32% 9.30% Core return on avg. common equity (non-GAAP) (5) 9.51% 9.26% 9.23% 9.08% 8.97% Return on avg. tangible common equity (non-GAAP) (6) 13.23% 13.03% 12.07% 13.99% 14.11% Core return on avg. tangible common equity (non-GAAP) (7) 13.77% 13.53% 13.58% 13.47% 13.43% Three Months Ended
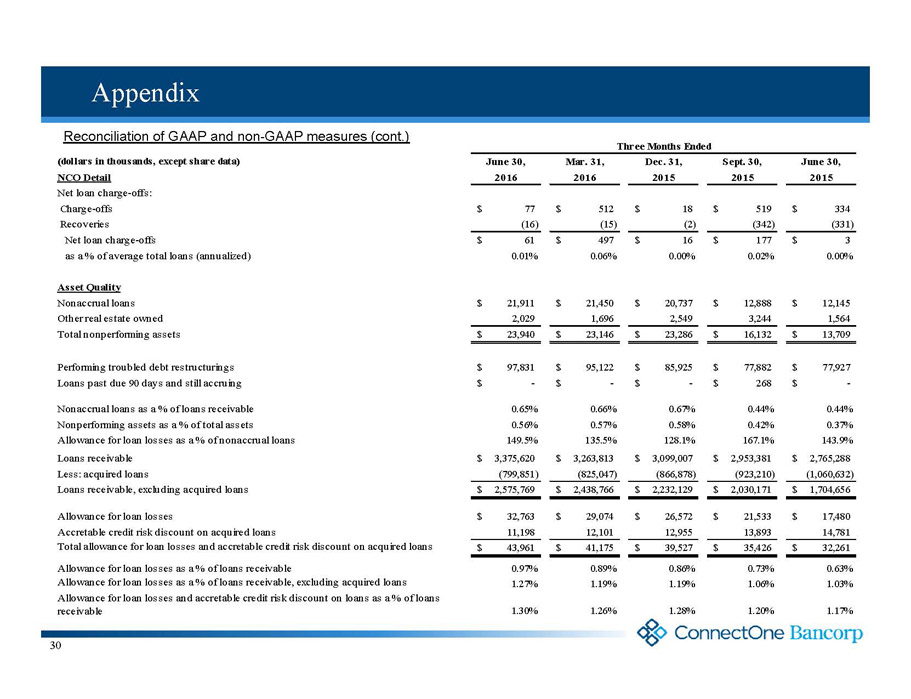
30 Appendix Reconciliation of GAAP and non-GAAP measures (cont.) (dollars in thousands, except share data) June 30, Mar. 31, Dec. 31, Sept. 30, June 30, NCO Detail 2016 2016 2015 2015 2015 Net loan charge-offs: Charge-offs 77$ 512$ 18$ 519$ 334$ Recoveries (16) (15) (2) (342) (331) Net loan charge-offs 61$ 497$ 16$ 177$ 3$ as a % of average total loans (annualized) 0.01% 0.06% 0.00% 0.02% 0.00% Asset Quality Nonaccrual loans 21,911$ 21,450$ 20,737$ 12,888$ 12,145$ Other real estate owned 2,029 1,696 2,549 3,244 1,564 Total nonperforming assets 23,940$ 23,146$ 23,286$ 16,132$ 13,709$ Performing troubled debt restructurings 97,831$ 95,122$ 85,925$ 77,882$ 77,927$ Loans past due 90 days and still accruing -$ -$ -$ 268$ -$ Nonaccrual loans as a % of loans receivable 0.65% 0.66% 0.67% 0.44% 0.44% Nonperforming assets as a % of total assets 0.56% 0.57% 0.58% 0.42% 0.37% Allowance for loan losses as a % of nonaccrual loans 149.5% 135.5% 128.1% 167.1% 143.9% Loans receivable 3,375,620$ 3,263,813$ 3,099,007$ 2,953,381$ 2,765,288$ Less: acquired loans (799,851) (825,047) (866,878) (923,210) (1,060,632) Loans receivable, excluding acquired loans 2,575,769$ 2,438,766$ 2,232,129$ 2,030,171$ 1,704,656$ Allowance for loan losses 32,763$ 29,074$ 26,572$ 21,533$ 17,480$ Accretable credit risk discount on acquired loans 11,198 12,101 12,955 13,893 14,781 Total allowance for loan losses and accretable credit risk discount on acquired loans 43,961$ 41,175$ 39,527$ 35,426$ 32,261$ Allowance for loan losses as a % of loans receivable 0.97% 0.89% 0.86% 0.73% 0.63% Allowance for loan losses as a % of loans receivable, excluding acquired loans 1.27% 1.19% 1.19% 1.06% 1.03% Allowance for loan losses and accretable credit risk discount on loans as a % of loans receivable 1.30% 1.26% 1.28% 1.20% 1.17% Three Months Ended
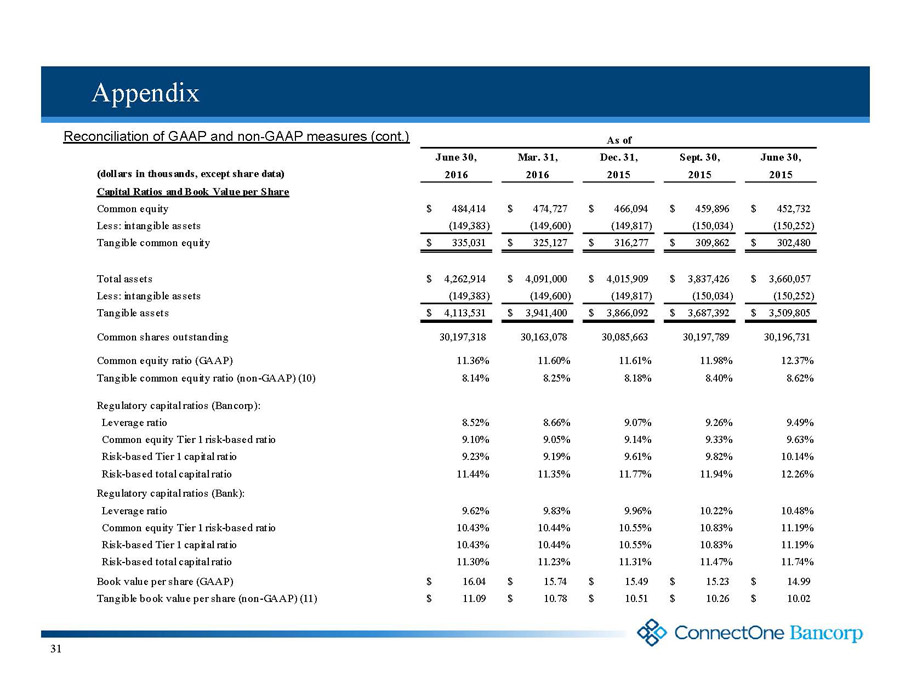
31 Appendix Reconciliation of GAAP and non-GAAP measures (cont.) June 30, Mar. 31, Dec. 31, Sept. 30, June 30, (dollars in thousands, except share data) 2016 2016 2015 2015 2015 Capital Ratios and Book Value per Share Common equity 484,414$ 474,727$ 466,094$ 459,896$ 452,732$ Less: intangible assets (149,383) (149,600) (149,817) (150,034) (150,252) Tangible common equity 335,031$ 325,127$ 316,277$ 309,862$ 302,480$ Total assets 4,262,914$ 4,091,000$ 4,015,909$ 3,837,426$ 3,660,057$ Less: intangible assets (149,383) (149,600) (149,817) (150,034) (150,252) Tangible assets 4,113,531$ 3,941,400$ 3,866,092$ 3,687,392$ 3,509,805$ Common shares outstanding 30,197,318 30,163,078 30,085,663 30,197,789 30,196,731 Common equity ratio (GAAP) 11.36% 11.60% 11.61% 11.98% 12.37% Tangible common equity ratio (non-GAAP) (10) 8.14% 8.25% 8.18% 8.40% 8.62% Regulatory capital ratios (Bancorp): Leverage ratio 8.52% 8.66% 9.07% 9.26% 9.49% Common equity Tier 1 risk-based ratio 9.10% 9.05% 9.14% 9.33% 9.63% Risk-based Tier 1 capital ratio 9.23% 9.19% 9.61% 9.82% 10.14% Risk-based total capital ratio 11.44% 11.35% 11.77% 11.94% 12.26% Regulatory capital ratios (Bank): Leverage ratio 9.62% 9.83% 9.96% 10.22% 10.48% Common equity Tier 1 risk-based ratio 10.43% 10.44% 10.55% 10.83% 11.19% Risk-based Tier 1 capital ratio 10.43% 10.44% 10.55% 10.83% 11.19% Risk-based total capital ratio 11.30% 11.23% 11.31% 11.47% 11.74% Book value per share (GAAP) 16.04$ 15.74$ 15.49$ 15.23$ 14.99$ Tangible book value per share (non-GAAP) (11) 11.09$ 10.78$ 10.51$ 10.26$ 10.02$ As of
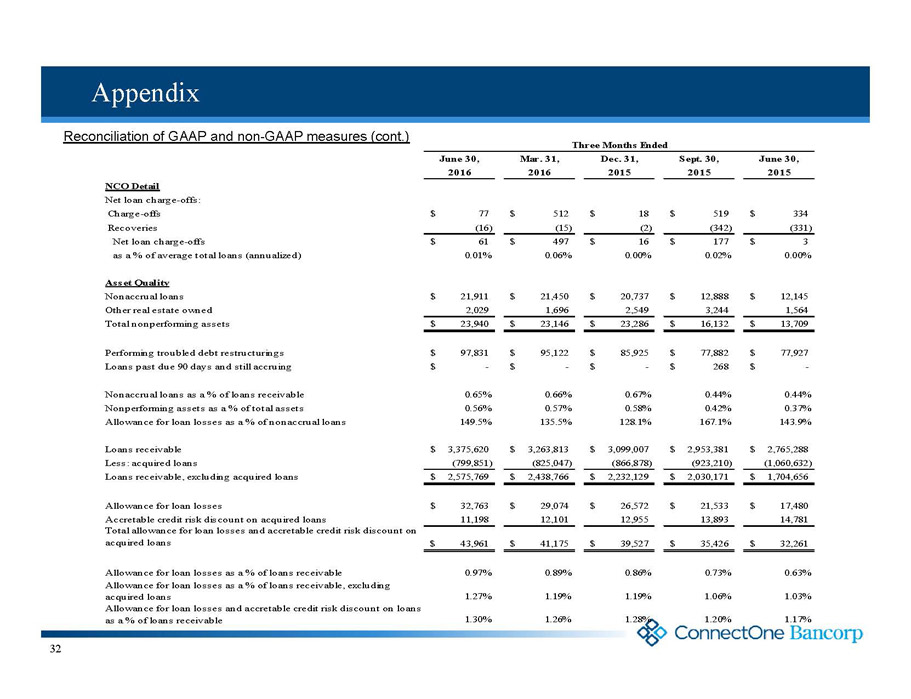
32 Appendix Reconciliation of GAAP and non-GAAP measures (cont.) June 30, Mar. 31, Dec. 31, Sept. 30, June 30, 2016 2016 2015 2015 2015 NCO Detail Net loan charge-offs: Charge-offs 77$ 512$ 18$ 519$ 334$ Recoveries (16) (15) (2) (342) (331) Net loan charge-offs 61$ 497$ 16$ 177$ 3$ as a % of average total loans (annualized) 0.01% 0.06% 0.00% 0.02% 0.00% Asset Quality Nonaccrual loans 21,911$ 21,450$ 20,737$ 12,888$ 12,145$ Other real estate owned 2,029 1,696 2,549 3,244 1,564 Total nonperforming assets 23,940$ 23,146$ 23,286$ 16,132$ 13,709$ Performing troubled debt restructurings 97,831$ 95,122$ 85,925$ 77,882$ 77,927$ Loans past due 90 days and still accruing -$ -$ -$ 268$ -$ Nonaccrual loans as a % of loans receivable 0.65% 0.66% 0.67% 0.44% 0.44% Nonperforming assets as a % of total assets 0.56% 0.57% 0.58% 0.42% 0.37% Allowance for loan losses as a % of nonaccrual loans 149.5% 135.5% 128.1% 167.1% 143.9% Loans receivable 3,375,620$ 3,263,813$ 3,099,007$ 2,953,381$ 2,765,288$ Less: acquired loans (799,851) (825,047) (866,878) (923,210) (1,060,632) Loans receivable, excluding acquired loans 2,575,769$ 2,438,766$ 2,232,129$ 2,030,171$ 1,704,656$ Allowance for loan losses 32,763$ 29,074$ 26,572$ 21,533$ 17,480$ Accretable credit risk discount on acquired loans 11,198 12,101 12,955 13,893 14,781 Total allowance for loan losses and accretable credit risk discount on acquired loans 43,961$ 41,175$ 39,527$ 35,426$ 32,261$ Allowance for loan losses as a % of loans receivable 0.97% 0.89% 0.86% 0.73% 0.63% Allowance for loan losses as a % of loans receivable, excluding acquired loans 1.27% 1.19% 1.19% 1.06% 1.03% Allowance for loan losses and accretable credit risk discount on loans as a % of loans receivable 1.30% 1.26% 1.28% 1.20% 1.17% Three Months Ended
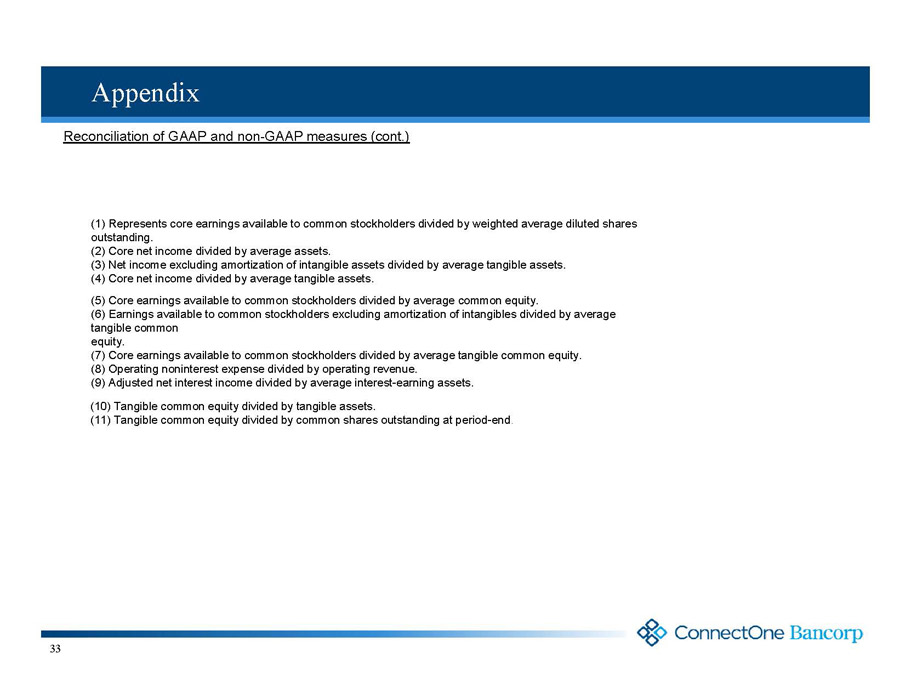
33 Appendix Reconciliation of GAAP and non-GAAP measures (cont.) (1) Represents core earnings available to common stockholders divided by weighted average diluted shares outstanding. (2) Core net income divided by average assets. (3) Net income excluding amortization of intangible assets divided by average tangible assets. (4) Core net income divided by average tangible assets. (5) Core earnings available to common stockholders divided by average common equity. (6) Earnings available to common stockholders excluding amortization of intangibles divided by average tangible common equity. (7) Core earnings available to common stockholders divided by average tangible common equity. (8) Operating noninterest expense divided by operating revenue. (9) Adjusted net interest income divided by average interest-earning assets. (10) Tangible common equity divided by tangible assets. (11) Tangible common equity divided by common shares outstanding at period-end.