Attached files
| file | filename |
|---|---|
| 8-K - 8-K - FULTON FINANCIAL CORP | a8-kinvestorpresentation9x.htm |

D A T A A S O F J U N E 3 0 , 2 0 1 6
U N L E S S O T H E R W I S E N O T E D
INVESTOR PRESENTATION

FORWARD-LOOKING STATEMENTS
This presentation may contain forward-looking statements with respect to Fulton Financial Corporation’s financial
condition, results of operations and business. Do not unduly rely on forward-looking statements. Forward-looking
statements can be identified by the use of words such as “may,” “should,” “will,” “could,” “estimates,” “predicts,”
“potential,” “continue,” “anticipates,” “believes,” “plans,” “expects,” “future,” “intends” and similar expressions which
are intended to identify forward-looking statements. Management’s “2016 Outlook” contained herein is comprised of
forward-looking statements.
Forward-looking statements are not guarantees of future performance and are subject to risks and uncertainties, some
of which are beyond the Corporation’s control and ability to predict, that could cause actual results to differ materially
from those expressed in the forward-looking statements. The Corporation undertakes no obligation, other than as
required by law, to update or revise any forward-looking statements, whether as a result of new information, future
events or otherwise.
A discussion of certain risks and uncertainties affecting the Corporation, and some of the factors that could cause the
Corporation’s actual results to differ materially from those described in the forward-looking statements, can be found
in the sections entitled “Risk Factors” and “Management’s Discussion and Analysis of Financial Condition and Results of
Operations” in the Corporation’s Annual Report on Form 10-K for the year ended December 31, 2015 and Quarterly
Reports on Form 10-Q for the quarters ended March 31, 2016 and June 30, 2016 which have been filed with the
Securities and Exchange Commission and are available in the Investor Relations section of the Corporation’s website
(www.fult.com) and on the Securities and Exchange Commission’s website (www.sec.gov).
The Corporation uses certain non-GAAP financial measures in this presentation. These non-GAAP financial measures
are reconciled to the most comparable GAAP measures at the end of this presentation.
2

WHY FULTON?
• Risk Management Foundation
• Management Depth and Experience
• Stability of Geographic Markets / Franchise Value
• Strong Capital & Reserves
• Commitment to Enhancing Shareholder Value
• Relationship Banking Strategy / Customer Experience
• Quality Loan Growth / Solid Asset Quality
• Attractive Core Deposit Profile
• Prudent Expense Management / Cost Reduction Initiatives
• Balance Sheet Is Positioned for Rising Interest Rates
3

A VALUABLE FRANCHISE
• 243 community banking offices across
the Mid-Atlantic
• Asset size: $18.5 billion
• 3,700+ team members (3,485 FTEs (1))
• Market capitalization: $2.3 billion (2)
4
(1) Full-time equivalent employees.
(2) Based on shares outstanding and the closing price as of June 30, 2016.

STRONG POSITION IN ATTRACTIVE MARKETS
5
Note: Data as of June 30, 2015 per Federal Deposit Insurance Corporation (FDIC) Summary of Deposits. Household Income Data as of June 30, 2015 per SNL Financial LC.
(1) Median HH Income, 2016 – 2021 Projected Population Change and 2016 – 2021 Projected HH Income Change are weighted by deposits in each MSA.
Median
Deposits Market Market Household (HH)
Metropolitan Statistical Area (MSA) (in millions) Rank Share Income Population HH Income
Lancaster, PA 2,826$ 1 25.72% 59,989$ 2.53% 8.62%
Philadelphia-Camden-Wilmington, PA-NJ-DE-MD 2,686 13 0.79% 63,514 1.64% 6.63%
Allentown-Bethlehem-Easton, PA-NJ 1,400 5 8.60% 60,194 1.24% 7.44%
New York-Newark-Jersey City, NY-NJ-PA 1,123 64 0.08% 68,223 2.75% 5.53%
Baltimore-Columbia-Towson, MD 872 9 1.29% 70,839 3.34% 5.20%
York-Hanover, PA 772 4 11.33% 59,123 1.50% 5.20%
Harrisburg-Carlisle, PA 694 5 5.63% 61,028 2.14% 8.80%
Lebanon, PA 688 1 34.10% 58,978 1.97% 8.92%
Reading, P 482 7 3.54% 59,208 0.67% 9.86%
Hagerstown-Martinsburg, MD-WV 454 2 13.70% 57,557 3.46% 4.91%
Top 10 Fulton Financial Corporation MSAs (1) 11,999$ 62,184$ 2.10% 7.22%
Total Franchise (1) 13,812$ 61,860$ 2.20% 7.11%
Nationwide 55,551$ 3.69% 7.77%
2016-2021 Projected Change
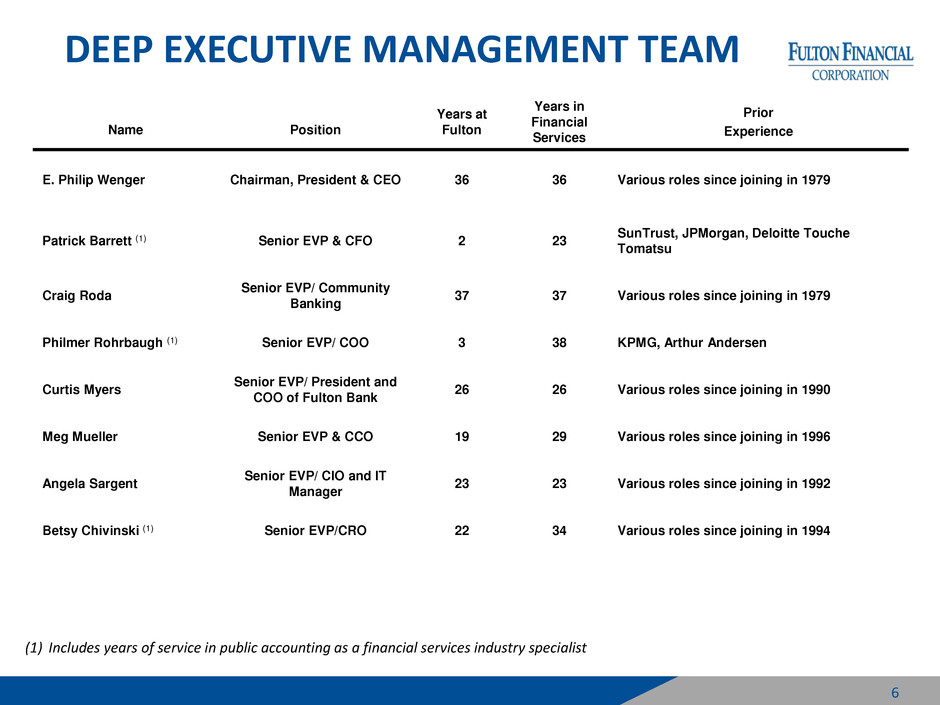
Name
Position
Years at
Fulton
Years in
Financial
Services
Prior
Experience
E. Philip Wenger Chairman, President & CEO 36 36 Various roles since joining in 1979
Patrick Barrett (1) Senior EVP & CFO
2
23
SunTrust, JPMorgan, Deloitte Touche
Tomatsu
Craig Roda
Senior EVP/ Community
Banking
37 37 Various roles since joining in 1979
Philmer Rohrbaugh (1) Senior EVP/ COO 3 38 KPMG, Arthur Andersen
Curtis Myers
Senior EVP/ President and
COO of Fulton Bank
26 26 Various roles since joining in 1990
Meg Mueller Senior EVP & CCO 19 29 Various roles since joining in 1996
Angela Sargent
Senior EVP/ CIO and IT
Manager
23 23 Various roles since joining in 1992
Betsy Chivinski (1) Senior EVP/CRO 22 34 Various roles since joining in 1994
DEEP EXECUTIVE MANAGEMENT TEAM
6
(1) Includes years of service in public accounting as a financial services industry specialist

SECOND QUARTER HIGHLIGHTS
Diluted Earnings Per Share: $0.23 in 2Q16, 4.5% increase from 1Q16 and 9.5% increase from 2Q15
Pre-Provision Net Revenue: $53.3 million, 4.9% increase from 1Q16 and 9.7% increase from 2Q15
Linked Quarter
Loan and Core Deposit Growth: 0.8% increase in average loans, while average core deposits increased 1.6%
Net Interest Income & Margin: Net interest income was flat, reflecting a 3 basis point decrease in net
interest margin, offset by the impact of loan growth
Non-Interest Income(1) & Non-Interest Expense: 9.2% increase in non-interest income and a 1.0% increase in
non-interest expense
Asset Quality: $981,000 increase in provision for credit losses with improvement in all credit metrics.
Annualized net charge-off rate decreased from 20 basis points to 10 basis points.
Year-over-Year
Loan and Core Deposit Growth: 5.9% increase in average loans and 10.2% increase in average core deposits
Net Interest Income & Margin: 4.9% increase in net interest income and net interest margin unchanged
Non-Interest Income(1) & Non-Interest Expense: 4.5% increase in non-interest income and a 2.8% increase in
non-interest expense
Asset Quality: $311,000 increase in provision for credit losses. Improvement in all credit metrics.
7
(1) Excluding securities gains.
INCOME STATEMENT SUMMARY
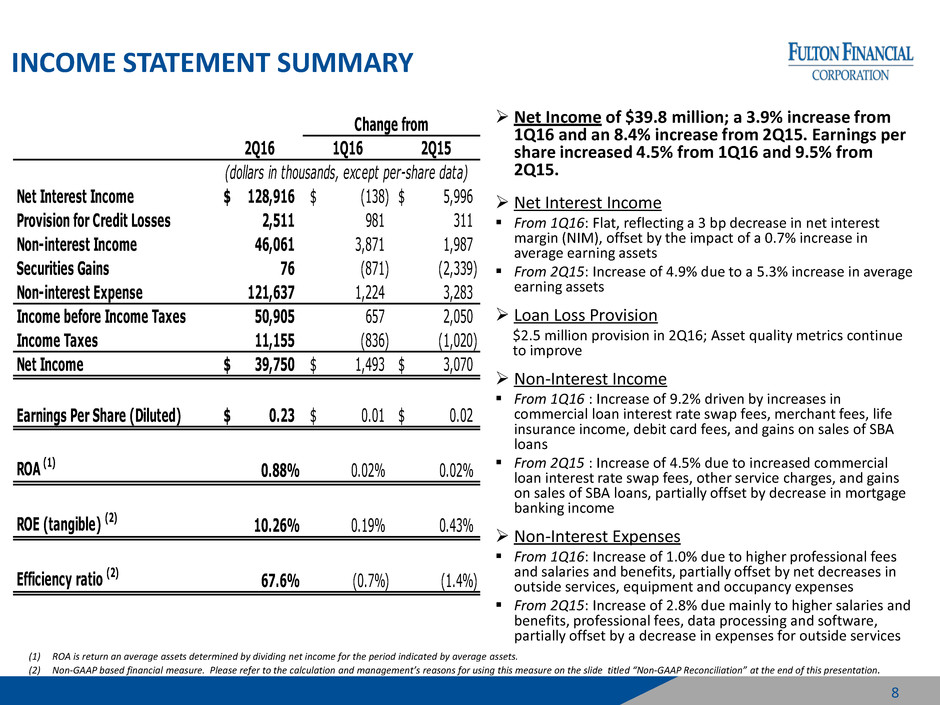
Net Income of $39.8 million; a 3.9% increase from
1Q16 and an 8.4% increase from 2Q15. Earnings per
share increased 4.5% from 1Q16 and 9.5% from
2Q15.
Net Interest Income
From 1Q16: Flat, reflecting a 3 bp decrease in net interest
margin (NIM), offset by the impact of a 0.7% increase in
average earning assets
From 2Q15: Increase of 4.9% due to a 5.3% increase in average
earning assets
Loan Loss Provision
$2.5 million provision in 2Q16; Asset quality metrics continue
to improve
Non-Interest Income
From 1Q16 : Increase of 9.2% driven by increases in
commercial loan interest rate swap fees, merchant fees, life
insurance income, debit card fees, and gains on sales of SBA
loans
From 2Q15 : Increase of 4.5% due to increased commercial
loan interest rate swap fees, other service charges, and gains
on sales of SBA loans, partially offset by decrease in mortgage
banking income
Non-Interest Expenses
From 1Q16: Increase of 1.0% due to higher professional fees
and salaries and benefits, partially offset by net decreases in
outside services, equipment and occupancy expenses
From 2Q15: Increase of 2.8% due mainly to higher salaries and
benefits, professional fees, data processing and software,
partially offset by a decrease in expenses for outside services
8
(1) ROA is return an average assets determined by dividing net income for the period indicated by average assets.
(2) Non-GAAP based financial measure. Please refer to the calculation and management’s reasons for using this measure on the slide titled “Non-GAAP Reconciliation” at the end of this presentation.
2Q16 1Q16 2Q15
Net Interest Income 128,916$ (138)$ 5,996$
Provision for Credit Losses 2,511 981 311
Non-interest Income 46,061 3,871 1,987
Securities Gains 76 (871) (2,339)
Non-interest Expense 121,637 1,224 3,283
Income before Income Taxes 50,905 657 2,050
Income Taxes 11,155 (836) (1,020)
Net Income 39,750$ 1,493$ 3,070$
Earnings Per Share (Diluted) 0.23$ 0.01$ 0.02$
ROA (1) 0.88% 0.02% 0.02%
ROE (tangible) (2) 10.26% 0.19% 0.43%
Efficiency rati (2) 67.6% (0.7%) (1.4%)
(dollars in thousands, except per-share data)
Change from

NET INTEREST INCOME AND MARGIN
Net Interest Income & Net Interest Margin
~ $730
million
~ $610
million
$122.9 $125.7
$127.8 $129.1 $128.9
3.20%
3.18% 3.19%
3.23%
3.20%
0.00%
0.50%
1.00%
1.50%
2.00%
2.50%
3.00%
3.50%
$-
$20.0
$40.0
$60.0
$80.0
$100.0
$120.0
$140.0
Q2 2015 Q3 2015 Q4 2015 Q1 2016 Q2 2016
Net Interest Income
Net Interest Margin (Fully-taxable equivalent basis, or FTE)
Average Interest-Earning Assets & Yields
Average Liabilities & Rates
$2.8 $2.9 $2.8 $2.8 $2.8
$13.2 $13.4 $13.7 $13.9 $14.0
3.74% 3.68% 3.67% 3.72% 3.69%
0.00%
2.00%
4.00%
$-
$3.0
$6.0
$9.0
$12.0
$15.0
$18.0
Q2 2015 Q3 2015 Q4 2015 Q1 2016 Q2 2016
Securities & Other Loans Earni ng Asse t Y ield (FT E)
$13.5 $13.9 $14.2 $14.2 $14.4
$1.4 $1.3
$1.2 $1.4 $1.4
0.77%
0.72% 0.69% 0.70% 0.70%
0.00%
0.20%
0.40%
0.60%
0.80%
1.00%
$-
$3.0
$6.0
$9.0
$12.0
$15.
Q2 2015 Q3 2015 Q4 2015 Q1 2016 Q2 2016
Deposits Borrowings Cost of Interest-bearing Liabilities
($ IN MILLIONS) ($ IN BILLIONS)
($ IN BILLIONS)
9
LOAN PORTFOLIO COMPOSITION & YIELD
10
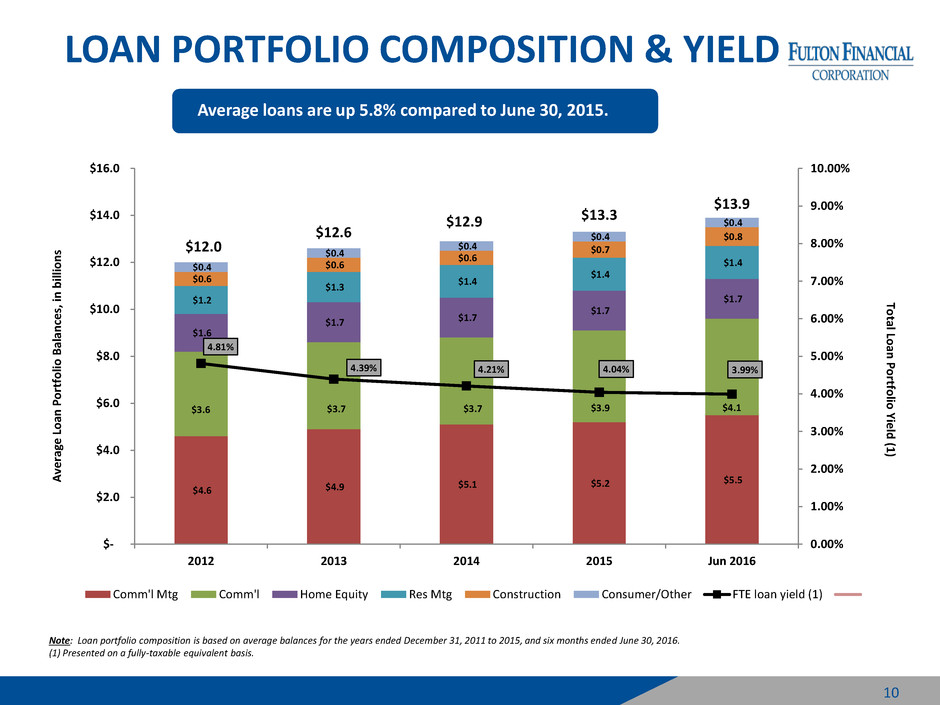
Note: Loan portfolio composition is based on average balances for the years ended December 31, 2011 to 2015, and six months ended June 30, 2016.
(1) Presented on a fully-taxable equivalent basis.
$4.6 $4.9
$5.1 $5.2 $5.5
$3.6 $3.7 $3.7 $3.9 $4.1
$1.6
$1.7 $1.7
$1.7
$1.7 $1.2
$1.3
$1.4
$1.4
$1.4
$0.6
$0.6
$0.6
$0.7
$0.8
$0.4
$0.4
$0.4
$0.4
$0.4
4.81%
4.39% 4.21% 4.04% 3.99%
0.00%
1.00%
2.00%
3.00%
4.00%
5.00%
6.00%
7.00%
8.00%
9.00%
10.00%
$-
$2.0
$4.0
$6.0
$8.0
$10.0
$12.0
$14.0
$16.0
2012 2013 2014 2015 Jun 2016
Comm'l Mtg Comm'l Home Equity Res Mtg Construction Consumer/Other FTE loan yield (1)
$12.9
A
ve
ra
ge
Loa
n
Po
rtf
o
lio
B
al
an
ce
s,
in
b
ill
io
n
s
To
tal
Loa
n
Po
rtf
o
lio
Y
ie
ld
(1
)
Average loans are up 5.8% compared to June 30, 2015.
$12.0
$12.6
$13.3
$13.9

DEPOSIT PORTFOLIO COMPOSITION
11
Note: Deposit composition is based on average balances for the periods indicated.
Average demand and savings up 10.1% compared to the six months ended June 30, 2015; while total
average deposits are up 6.4%.
20%
28%
24%
18%
10%
Time Deposits Non-Int DDA Int DDA
Money Mkt Savings
Six Months Ended June 30, 2016
23%
28% 23%
17%
9%
Time Deposits Non-Int DDA Int DDA
Money Mkt Savings
Six Months Ended June 30, 2015

1) A variety of interest rate scenarios are used to measure the effects of sudden and gradual movements upward and downward in the yield curve. These results are
compared to the results obtained in a flat or unchanged interest rate scenario. Simulation of net interest income is used primarily to measure the Corporation’s short-
term earnings exposure to rate movements. The Corporation’s policy limits the potential exposure of net interest income, in a non-parallel instantaneous shock, to
10% of the base case net interest income for a 100 basis point shock in interest rates, 15% for a 200 basis point shock and 20% for a 300 basis point shock. A "shock" is
an immediate upward or downward movement of interest rates. The shocks do not take into account changes in customer behavior that could result in changes to mix
and/or volumes in the balance sheet, nor do they account for competitive pricing over the forward 12-month period. These results include the effect of implicit and
explicit floors that limit further reduction in interest rates.
2) The actual impact of changes in interest rates on the Corporation’s net interest income may differ materially from the anticipated amounts presented above.
Rate Annual Change in %
Change (1) Net Interest Income (2) Change
+300 bps $ 73.3 million 14.1%
+200 bps $ 49.1 million 9.4%
+100 bps $ 22.5 million 4.3%
- 100 bps $ (15.6) million -3.0%
POSITIONED FOR RISING INTEREST RATE ENVIRONMENT
JUNE 30, 2016
12

ASSET QUALITY
($ IN MILLIONS)
13
Provision for Credit Losses Non-Performing Loans (NPLs) & NPLs to Loans
113.34% 116.81%
118.37% 121.05%
129.26%
1.28% 1.25% 1.24% 1.20% 1.17%
0.00%
1.00%
2.00%
3.00%
0.00%
25.00%
50.00%
75.00%
100.00%
125.00%
150.00%
Q2 2015 Q3 2015 Q4 2015 Q1 2016 Q2 2016
Allowance/NPLs Allowance/Loans
Net Charge-offs (NCOs) and NCOs to Average Loans Allowance for Credit Losses (Allowance) to NPLs & Loans
$12.4
$1.1 $0.7
$6.9
$3.5
0.38%
0.03%
0.02% 0.20%
0.10%
0.00%
0.10%
0.20%
0.30%
0.40%
0.50%
$-
$2.0
$4.0
$6.0
$8.0
$10.0
$12.0
$14.0
Q2 2015 Q3 2015 Q4 2015 1 6 2 2016
NCOs NCOs/Average Loans
$2.2
$1.0
$2.8
$1.5
$2.5
$-
$2.0
$4.0
Q2 2015 Q3 2015 Q4 2015 Q1 2016 Q2 2016
$149.5 $145.0 $144.8
$137.2
$127.7
1.13% 1.07% 1.05% 0.99%
0.90%
0.00%
0.50%
1.00
1.50%
2.00%
$0.0
$20.0
$40.0
$60.0
$80.0
$100.0
$120.0
$140.0
$160.0
Q2 2015 Q3 2015 Q4 2015 Q1 2016 Q2 2016
NPL NPLs/Loans
NON-INTEREST INCOME
($ IN MILLIONS)
Non-interest Income, Excluding Securities Gains
~ $730
million
~ $610
million
$44.1
$43.0
$45.1
$42.2
$46.1
$-
$5.0
$10.0
$15.0
$20.0
$25.0
$30.0
$35.0
$40.0
$45.0
$50.0
Q2 2015 Q3 2015 Q4 2015 Q1 2016 Q2 2016
Mortgage Banking Income & Spreads
Other Non-interest Income
1.62%
1.17%
1.60%
1.28%
1.71%
0.00%
0.50%
1.00%
1.50%
2.00%
2.50%
3.00%
3.50%
4.00%
$(1.0)
$-
$1.0
$2.0
$3.0
$4.0
$5.0
$6.0
Q2 2015 Q3 2015 Q4 2015 Q1 2016 Q2 2016(2)
Gains on Sales Servicing Income Spread on Sales (1)
$5.3
$3.9
$4.3 $4.0
$3.9
$-
$5.0
$10.0
$15.0
$20.0
$25.
$30.0
$35.0
$40.0
$45.0
Q2 2015 Q3 2015 Q4 2015 Q1 2016 Q2 2016
Invt Mgmt & Trust Srvs Deposit Srv Chgs Oth Srv Chgs Other
$38.7 $39.2
$40.7
$38.2
$42.2
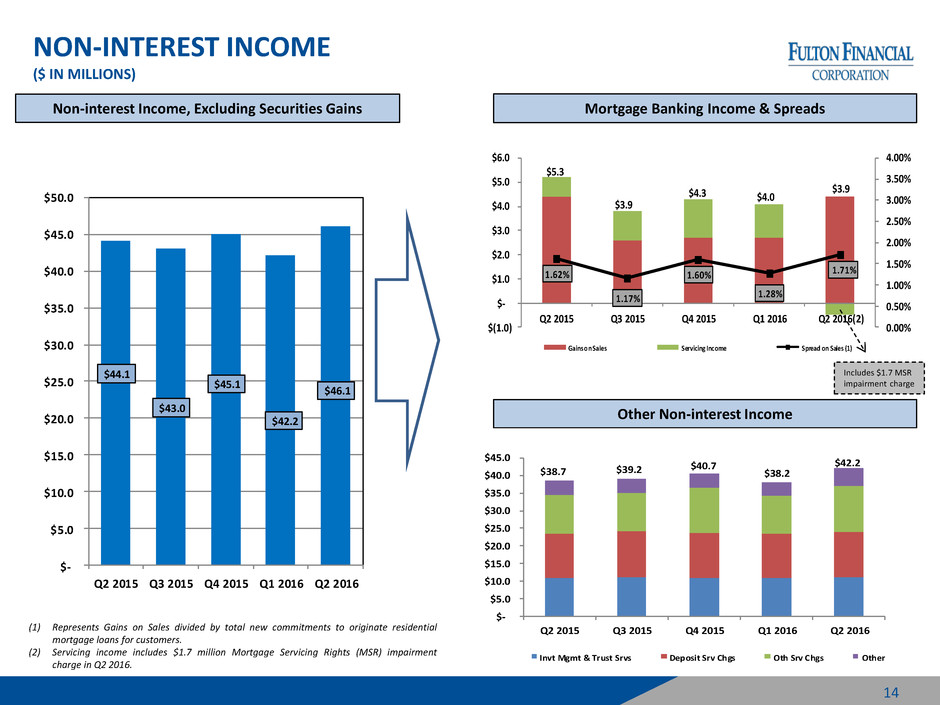
(1) Represents Gains on Sales divided by total new commitments to originate residential
mortgage loans for customers.
(2) Servicing income includes $1.7 million Mortgage Servicing Rights (MSR) impairment
charge in Q2 2016.
14
Includes $1.7 MSR
impairment charge

NON-INTEREST EXPENSES
($ IN MILLIONS)
Non-interest Expense & Efficiency Ratio (1)
~ $730
million
~ $610
million
$118.4 $119.3 $118.4 $120.4
$121.6
68.9% 68.8%
66.6%
68.3% 67.6%
0.0%
10.0%
20.0%
30.0%
40.0%
50.0%
60.0%
70.0%
80.0%
$-
$20.0
$40.0
$60.0
$80.0
$100.0
$120.0
$140.0
Q2 2015 Q3 2015 Q4 2015 Q1 2016 Q2 2016
Salaries and Employee Benefits & Staffing
Other Non-interest Expenses
3,474 3,485
-
2,000
4,000
6,000
$-
$10.0
$20.0
$30.0
$40.0
$50.0
$60.0
$70.0
$80.0
Q2 2015 Q3 2015 Q4 2015 Q1 2016 Q2 2016
Total Salaries Employee Benefits Average Full-time Equivalent Employees
$65.1 $65.3 $65.5
$69.4 $70.0
$-
$10.0
$20.0
$30.0
$40.0
$50.0
$60.0
$70.0
Q2 2015 Q3 2015 Q4 2015 Q1 2016 Q2 2016
Occp & Equip Data Processing & Software Outside Srvs Other
$53.3
$54.0
$52.9
$51.0 $51.6
(1) Non-GAAP based financial measure. Please refer to the calculation and
management’s reasons for using this measure on the slide titled “Non-
GAAP Reconciliation” at the end of this presentation.
15

$1.8 $2.1
$3.2
$4.3
$2.2
$4.6
$1.4
$8.2
$4.5
$2.1
$0.4
$1.4
$0.2
13
26
30
45
47
51
0
10
20
30
40
50
60
$-
$3.0
$6.0
$9.0
$12.0
2011 2012 2013 2014 2015 YTD 6/2016
Salaries & Benefits Expense Outside Consulting Services(1) Temporary Employee Expense Staffing
$0.8$0.1
COMPLIANCE & RISK MANAGEMENT
(1) Represents third-party consulting and legal services directly related to BSA/AML compliance program.
To
tal
E
xp
e
n
se
s,
in
m
ill
io
n
s
• Strengthening Risk Management and Compliance infrastructures
• Address deficiencies within BSA/AML compliance
• BSA/AML enforcement actions at the Corporation and banking subsidiaries
• Significant investments in personnel, outside services and systems
BSA/AML Compliance Program Expenses and Staffing
To
tal
N
u
m
b
e
r o
f Em
p
lo
ye
e
s at
Pe
rio
d
En
d
16

PROFITABILITY & CAPITAL
17
ROA(1) ROE (tangible)(2)
Tangible Common Equity Ratio(2) Diluted Earnings Per Common Share
9.83%
9.11%
10.16% 10.07% 10.26%
0.00%
4.00%
8.00%
12.00%
Q2 2015 Q3 2015 Q4 2015 Q1 2016 Q2 2016
0.86% 0.78%
0.86% 0.86% 0.88%
0.00%
0.20%
0.40%
0.60%
0.80%
1.00%
1.20%
Q2 2015 Q3 2015 Q4 2015 Q1 2016 Q2 2016
(1) ROA is return an average assets determined by dividing net income for the period indicated by average assets
(2) Non-GAAP based financial measure. Please refer to the calculation and management’s reasons for using this measure on the slide titled “Non-GAAP Reconciliation” at the end of this presentation.
8.9% 8.6% 8.7% 8.8% 8.8%
0.0%
4.
8.
12.0
Q2 2015 Q3 2015 Q4 2015 Q1 2016 Q2 2016
$0.21
$0.20
$0.22 $0.22
$0.23
$-
$0.05
$0.10
$0.15
$0.20
$0.25
Q2 2015 Q3 2015 Q4 2015 Q1 2016 Q2 2016

STOCK REPURCHASE PROGRAMS
June 2012 to July 2016
Repurchase Programs (1)
Shares Repurchased 31.9 million
% of Outstanding Shares 15.9% (2)
Amount Repurchased $375 million
Average Purchase Price $11.77
18
demand and savings
(1) Share repurchases completed from June 2012 through July 31, 2016.
(2) Total shares repurchased as a percentage of outstanding common stock on June 30, 2012.
In October 2015, the Board of Directors approved a repurchase program of up to $50 million of the
Corporation’s common stock, or approximately 2.3% of outstanding shares, through December 31,
2016. In 2016, 1.5 million shares, at a total cost of $18.5 million, were repurchased under this plan at
an average cost of $12.48 per share. Up to additional $31.5 million of common shares may be
repurchased under this program.

AVERAGE ASSETS AND ROA, BY BANK
Six Months Ended
Jun 30, 2016
Average Assets
($ Millions) 2016 2015
Fulton Bank, N.A. $9,910 1.07% 1.06%
Lafayette Ambassador Bank 1,528 0.96% 1.07%
The Columbia Bank 2,139 0.90% 0.82%
Fulton Bank of New Jersey 3,719 0.67% 0.76%
FNB Bank, N.A. 358 0.60% 0.72%
Swineford National Bank 305 0.53% 1.43%
Fulton Financial Corporation $18,063 0.87% 0.90%
Six Months Ended Jun 30,
Return on Average Assets (1)
(1) Net Income divided by average assets, annualized.
19

2016 OUTLOOK
The following outlook remains unchanged from prior quarter:
• Loans & Deposits: Annual average growth rate in the mid- to high-single digits
• Asset Quality: Provision driven primarily by loan growth
• Non-Interest Income (Excluding Securities Gains): Mid- to high-single digit growth rate
• Non-Interest Expense (Excluding Loss on Redemption of TruPS): Low- to mid-single digit growth rate
• Capital: Focus on utilizing capital to support growth and provide appropriate returns to our
shareholders
The following outlook has been updated:
• Net Interest Margin
Original: Stable on an annual basis, with modest volatility (+/- 0 to 3 basis points) on a
quarterly basis
Updated: Absent any further rate increases, expect low-single digit quarterly compression
20

APPENDIX

AVERAGE LOAN PORTFOLIO AND YIELDS
22
Note: Yields presented on a fully taxable-equivalent basis, using a 35% federal tax rate and statutory interest expense disallowances.
Balance Yield Q1 2016 Q2 2015 Q1 2016 Q2 2015
Comm'l Mort 5,558$ 4.00% 70$ 347$ (0.03%) (0.15%)
Commercial 4,081 3.81% (14) 245 0.02% 0.02%
Home Equity 1,656 4.10% (18) (39) 0.00% (0.01%)
Resid Mort 1,400 3.78% 19 44 0.00% (0.04%)
Construction 821 3.81% 29 122 (0.01%) (0.16%)
Cons./Other 450 5.72% 27 55 (0.54%) (0.24%)
Total Loans 13,966$ 3.98% 113$ 774$ (0.02%) (0.07%)
(dollars in millions)
Balance FromQ2 2016
Change in
Yield From

AVERAGE CUSTOMER FUNDING AND RATES
23
Balance Rate Q1 2016 Q2 2015 Q1 2016 Q2 2015
Nonint DDA 4,078$ - % 110$ 343$ - % - %
Int DDA 3,454 0.18% 16 301 0.01% 0.05%
Savings/MMDA 3,990 0.19% 57 421 0.01% 0.05%
CD's 2,844 1.06% (24) (183) 0.02% 0.02%
Total Deposits 14,366 0.30% 159 882 0.00% 0.00%
Cash Mgt 259 0.09% 14 (1) 0.00% 0.02%
Total Customer Funding 14,625$ 0.30% 173$ 881$ 0.00% 0.01%
(dollars in millions)
Balance FromQ2 2016
Change In
Rate From
Note: Average customer funding is for the three months ended June 30, 2016..

ENDING LOAN DISTRIBUTION BY STATE
JUNE 30, 2016
24
Comm'l Consumer
Comm'l Mortgage Constr. Res. Mtg. & Other Total
(in thousands)
Pennsylvania 2,955,943$ 2,909,670$ 488,736$ 652,609$ 1,290,859$ 8,297,817$
New Jersey 555,288 1,426,080 183,219 238,100 372,309 2,774,996
Maryland 336,817 576,131 67,531 222,407 288,182 1,491,068
Virginia 129,129 472,861 54,539 257,403 65,469 979,401
Delaware 122,000 250,605 59,674 76,773 102,825 611,877
4,099,177$ 5,635,347$ 853,699$ 1,447,292$ 2,119,644$ 14,155,159$

NON-PERFORMING LOANS(1)
JUNE 30, 2016
25
Comm'l Consumer Ending Loans NPLs/Loans
Comm'l Mortgage Constr. Res. Mtg. & Other Total NPLs by State by State
Pennsylvania 18,661$ 15,065$ 8,175$ 9,361$ 6,724$ 57,986$ 8,297,817$ 0.70%
New Jersey 5,982 15,471 - 7,113 5,264 33,830 2,774,996 1.22%
Maryland 5,858 3,348 440 1,979 2,076 13,701 1,491,068 0.92%
Virginia 5,159 1,572 117 5,752 1,656 14,256 979,401 1.46%
Delaware 3,242 248 3,147 825 499 7,961 611,877 1.30%
38,902$ 35,704$ 11,879$ 25,030$ 16,219$ 127,734$ 14,155,159$ 0.90%
Ending Loans 4,099,177$ 5,635,347$ 853,699$ 1,447,292$ 2,119,644$ 14,155,159$
Non-performing Loan % (6/30/16) 0.95% 0.63% 1.39% 1.73% 0.77% 0.90%
Non-performing Loan % (12/31/15) 1.08% 0.75% 1.56% 2.07% 0.88% 1.05%
(dollars in thousands)
(1) Includes loans ≥ 90 days past due and accruing, and non-accrual loans.

NET CHARGE-OFFS (RECOVERIES)
THREE MONTHS ENDED JUNE 30, 2016
26
Comm'l Consumer Average Loans Charge-Offs to
Comm'l Mortgage Constr. Res. Mtg. & Other Total by State Average Loans
Pennsylvania 29$ 619$ 465$ 91$ 1,172$ 2,376$ 8,179,342$ 0.12%
New Jersey 1,614 (505) (170) 22 1,526 2,487 2,750,849 0.36%
Maryland 51 (1) (944) (178) (150) (1,222) 1,469,044 -0.33%
Virginia 3 - (85) (1) 2 (81) 958,282 -0.03%
Delaware (3) (6) (87) (14) 18 (92) 608,507 -0.06%
1,694$ 107$ (821)$ (80)$ 2,568$ 3,468$ 13,966,024$ 0.10%
Average Loans 4,080,524$ 5,557,680$ 820,881$ 1,399,851$ 2,107,088$ 13,966,024$
Net Charge-offs
(Recoveries) to Average Loans 0.17% 0.01% (0.40%) (0.02%) 0.49% 0.10%
(dollars in thousands)

INVESTMENT PORTFOLIO
JUNE 30, 2016
27
Weighted Avg.
Remaining
Life Amortized Unrealized Estimated
(in years) Cost Gain (Loss) Fair Value
(dollars in millions)
Collateralized mortgage obligations 3.2 702$ 4$ 706$
Mortgage-backed securities 4.3 1,242 26 1,268
State and municipal securities 7.9 333 12 345
Auction rate securities 1.0 107 (9) 98
Corporate debt securities 9.3 95 (3) 92
U.S. Government sponsored agency securities 4.6 - - -
Bank stocks N/A 14 6 20
Other equity securities N/A 1 - 1
Total Investments 4.5 2,494$ 36$ 2,530$
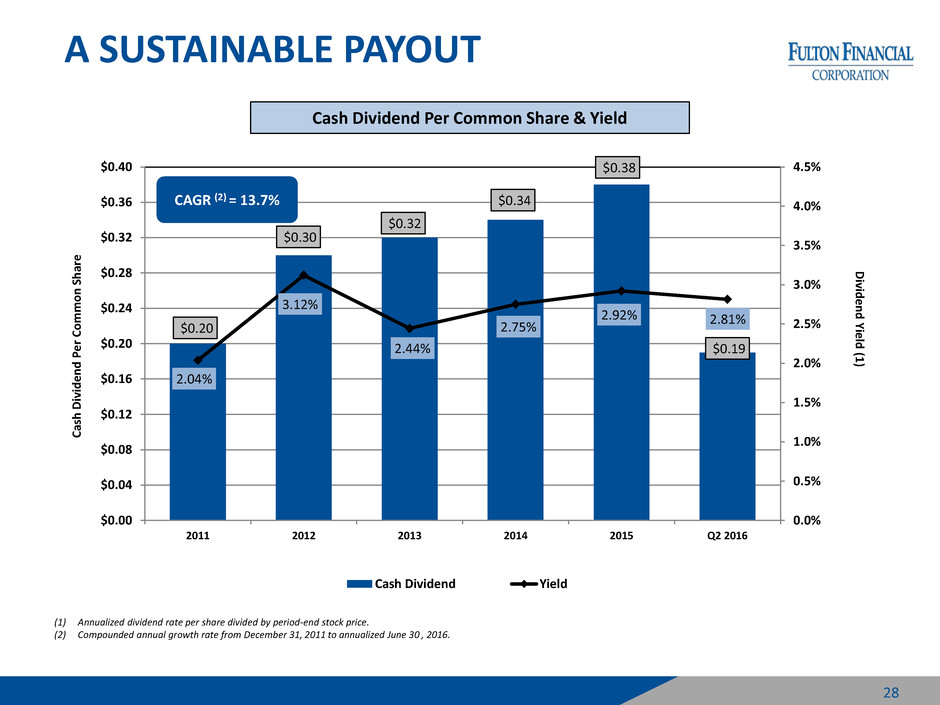
A SUSTAINABLE PAYOUT
$0.20
$0.30
$0.32
$0.34
$0.38
$0.19
2.04%
3.12%
2.44%
2.75%
2.92% 2.81%
0.0%
0.5%
1.0%
1.5%
2.0%
2.5%
3.0%
3.5%
4.0%
4.5%
$0.00
$0.04
$0.08
$0.12
$0.16
$0.20
$0.24
$0.28
$0.32
$0.36
$0.40
2011 2012 2013 2014 2015 Q2 2016
Cash Dividend Yield
28
(1) Annualized dividend rate per share divided by period-end stock price.
(2) Compounded annual growth rate from December 31, 2011 to annualized June 30 , 2016.
Cash Dividend Per Common Share & Yield
CAGR (2) = 13.7%
Cas
h
D
iv
id
e
n
d
Pe
r
C
o
m
m
o
n
S
h
ar
e
D
ivid
e
n
d
Y
ie
ld
(1
)

NON-INTEREST INCOME
(EXCLUDING SECURITIES GAINS)
29
Q2 2016 Q1 2016 Q2 2015 Q1 2016 Q2 2015
Invt Mgt & Trust 11,247$ 10,988$ 11,011$ 259$ 236$
Overdraft & NSF Fees 5,384 5,272 5,353 112 31
Merchant Fees 4,252 3,682 4,088 570 164
Service Charges 3,932 3,820 3,915 112 17
Mortgage Banking Income 3,897 4,030 5,339 (133) (1,442)
Cash Mgt Fees 3,580 3,466 3,369 114 211
Commercial Swap Fees 2,751 1,442 1,026 1,309 1,725
Debit Card Fees 2,719 2,511 2,626 208 93
Credit Card Fees 2,596 2,424 2,474 172 122
Letters of Credit 1,162 1,146 1,174 16 (12)
Other Income 4,541 3,409 3,699 1,132 842
Total Non-Interest Income 46,061$ 42,190$ 44,074$ 3,871$ 1,987$
(in thousands)
Change From

NON-INTEREST EXPENSE
30
Q2 2016 Q1 2016 Q2 2015 Q1 2016 Q2 2015
Salaries & Benefits 70,029$ 69,372$ 65,067$ 657$ 4,962$
Occupancy & Equipment 14,683 15,591 15,144 (908) (461)
Data Proc. & Software 9,429 9,321 8,270 108 1,159
Outside Services 5,508 6,056 8,125 (548) (2,617)
Professional fees 3,353 2,333 2,731 1,020 622
FDIC Insurance 2,960 2,949 2,885 11 75
Supplies & Postage 2,706 2,579 2,726 127 (20)
Marketing 1,916 1,624 2,235 292 (319)
Telecommunications 1,459 1,488 1,617 (29) (158)
Operating Risk Loss 986 540 674 446 312
OREO & Repo Expenses, net 365 638 129 (273) 236
Other Expenses 8,243 7,922 8,751 321 (508)
Total Non-Interest Expenses 121,637$ 120,413$ 118,354$ 1,224$ 3,283$
(in thousands)
Change From

NON-GAAP RECONCILIATION
Note: The Corporation has presented the following non-GAAP (Generally Accepted Accounting Principles) financial measures because it believes
that these measures provide useful and comparative information to assess trends in the Corporation's results of operations and financial condition.
Presentation of these non-GAAP financial measures is consistent with how the Corporation evaluates its performance internally and these non-
GAAP financial measures are frequently used by securities analysts, investors and other interested parties in the evaluation of companies in the
Corporation's industry. Investors should recognize that the Corporation's presentation of these non-GAAP financial measures might not be
comparable to similarly-titled measures of other companies. These non-GAAP financial measures should not be considered a substitute for GAAP
basis measures and the Corporation strongly encourages a review of its condensed consolidated financial statements in their entirety.
31
Jun 30 Sep 30 Dec 31 Mar 31 Jun 30
2015 2015 2015 2016 2016
Efficiency ratio
Non-interest expense 118,354$ 124,889$ 118,439$ 120,413$ 121,637$
Less: Intangible amortization (106) (5) (6) - -
Less: Loss on redemption of TruPS - (5,626) - - -
Numerator 118,248$ 119,258$ 118,433$ 120,413$ 121,637$
Net interest income (fully taxable equivalent) 127,445$ 130,250$ 132,683$ 134,026$ 133,890$
Plus: Total Non-interest income 46,489 44,774 45,839 43,137 46,137
Less: Investment securities gains (2,415) (1,730) (776) (947) (76)
Denominator 171,519$ 173,294$ 177,746$ 176,216$ 179,951$
Efficiency ratio 68.9% 68.8% 66.6% 68.3% 67.6%
Jun 30 Sep 30 Dec 31 Mar 31 Jun 30
2015 2015 2015 2016 2016
Return on Average Shareholders' Equity (ROE) (Tangible)
Net income 36,680$ 34,251$ 38,535$ 38,257$ 39,750$
Plus: Inta g bl amortization, net of tax 69 3 4 - -
N m rator 36,749$ 34,254$ 38,539$ 38,257$ 39,750$
Average shareholders' equity 2,031,788$ 2,022,829$ 2,036,769$ 2,058,799$ 2,089,915$
Less: Average goodwill and intangible assets (531,618) (531,564) (531,556) (531,556) (531,556)
Average tangible shareholders' equity (denominator) 1,500,170$ 1,491,265$ 1,505,213$ 1,527,243$ 1,558,359$
Return on average common shareholders' equity (tangible), annualized 9.83% 9.11% 10.16% 10.07% 10.26%
Three Months Ended
Three Months Ended
(dollars in thousands)
(dollars in thousands)

NON-GAAP RECONCILIATION (CON’T)
32
Jun 30 Sep 30 Dec 31 Mar 31 Jun 30
2015 2015 2015 2016 2016
Tangible Common Equity to Tangible Assets (TCE Ratio)
Shareholders' equity 2,024,817$ 2,025,904$ 2,041,894$ 2,073,309$ 2,106,997$
Less: Intangible assets (531,567) (531,562) (531,556) (531,556) (531,556)
Tangible shareholders' equity (numerator) 1,493,250$ 1,494,342$ 1,510,338$ 1,541,753$ 1,575,441$
Total assets 17,365,462$ 17,838,059$ 17,914,718$ 18,122,254$ 18,479,697$
Less: Intangible assets (531,567) (531,562) (531,556) (531,556) (531,556)
Total tangible assets (denominator) 16,833,895$ 17,306,497$ 17,383,162$ 17,590,698$ 17,948,141$
Tangible Common Equity to Tangible Assets 8.9% 8.6% 8.7% 8.8% 8.8%
Jun 30 Sep 30 Dec 31 Mar 31 Jun 30
2015 2015 2015 2016 2016
Pre-Provision Net Revenue
Net interest income 122,920$ 125,694$ 127,799$ 129,054$ 128,916$
Non-interest income 46,489 44,774 45,839 43,137 46,137
Less: Investment securities gains (2,415) (1,730) (776) (947) (76)
Total Revenue 166,994 168,738 172,862 171,244 174,977
on-interest expense 118,354 124,889 118,439 120,413 121,637
Less: Loss on redemption of TruPS - (5,626) - - -
Total Non-interest expense, as adjusted 118,354 119,263 118,439 120,413 121,637
Pre-Provision Net Revenue 48,640$ 49,475$ 54,423$ 50,831$ 53,340$
Three Months Ended
(dollars in thousands)
(in thousands)

www.fult.com
