Attached files
| file | filename |
|---|---|
| EX-32.1 - EXHIBIT 32.1 - NorthStar Healthcare Income, Inc. | nshiexhibit321-06302016.htm |
| EX-32.2 - EXHIBIT 32.2 - NorthStar Healthcare Income, Inc. | nshiexhibit322-06302016.htm |
| EX-31.2 - EXHIBIT 31.2 - NorthStar Healthcare Income, Inc. | nshiexhibit312-06302016.htm |
| EX-31.1 - EXHIBIT 31.1 - NorthStar Healthcare Income, Inc. | nshiexhibit311-06302016.htm |
UNITED STATES
SECURITIES AND EXCHANGE COMMISSION
Washington, D.C. 20549
FORM 10-Q
QUARTERLY REPORT PURSUANT TO SECTION 13 OR 15(d)
OF THE SECURITIES EXCHANGE ACT OF 1934
For the quarterly period ended June 30, 2016
Commission File Number: 000-55190
NORTHSTAR HEALTHCARE INCOME, INC.
(Exact Name of Registrant as Specified in its Charter)
Maryland | 27-3663988 |
(State or Other Jurisdiction of | (IRS Employer |
Incorporation or Organization) | Identification No.) |
399 Park Avenue, 18th Floor, New York, NY 10022
(Address of Principal Executive Offices, Including Zip Code)
(212) 547-2600
(Registrant’s Telephone Number, Including Area Code)
Indicate by check mark whether the registrant (1) has filed all reports required to be filed by Section 13 or 15(d) of the Securities Exchange Act of 1934 during the preceding 12 months (or for such shorter period that the registrant was required to file such reports), and (2) has been subject to such filing requirements for the past 90 days. Yes ý No o
Indicate by check mark whether the registrant has submitted electronically and posted on its corporate Web site, if any, every Interactive Data File required to be submitted and posted pursuant to Rule 405 of Regulation S-T (§232.405 of this chapter) during the preceding 12 months (or for such shorter period that the registrant was required to submit and post such files). Yes ý No o
Indicate by check mark whether the registrant is a large accelerated filer, an accelerated filer, a non-accelerated filer, or a smaller reporting company. See the definitions of “large accelerated filer,” “accelerated filer” and “smaller reporting company” in Rule 12b-2 of the Exchange Act. (Check one):
Large accelerated filer o | Accelerated filer o | Non-accelerated filer o (Do not check if a smaller reporting company) | Smaller reporting company ý | |||
Indicate by check mark whether the registrant is a shell company (as defined in Rule 12b-2 of the Exchange Act). Yes o No ý
Indicate the number of shares outstanding of each of the registrant’s classes of common stock, as of the latest practicable date:
The Company has one class of common stock, $0.01 par value per share, 183,099,274 shares outstanding as of August 5, 2016.
NORTHSTAR HEALTHCARE INCOME, INC.
FORM 10-Q
TABLE OF CONTENTS
Index | Page | |
2
FORWARD-LOOKING STATEMENTS
This Quarterly Report on Form 10-Q contains certain “forward-looking statements” within the meaning of the Private Securities Litigation Reform Act of 1995, Section 27A of the Securities Act of 1933, as amended, or Securities Act, and Section 21E of the Securities Exchange Act of 1934, as amended, or Exchange Act. Forward-looking statements are generally identifiable by use of forward-looking terminology such as “may,” “will,” “should,” “potential,” “intend,” “expect,” “seek,” “anticipate,” “estimate,” “believe,” “could,” “project,” “predict,” “continue,” “future” or other similar words or expressions. Forward-looking statements are not guarantees of performance and are based on certain assumptions, discuss future expectations, describe plans and strategies, contain projections of results of operations or of financial condition or state other forward-looking information. Such statements include, but are not limited to, those relating to our ability to make distributions to our stockholders, our reliance on our advisor and our sponsor, the operating performance of our investments, our financing needs, the effects of our current strategies and investment activities and our ability to effectively deploy capital. Our ability to predict results or the actual effect of plans or strategies is inherently uncertain, particularly given the economic environment. Although we believe that the expectations reflected in such forward-looking statements are based on reasonable assumptions, our actual results and performance could differ materially from those set forth in the forward-looking statements and you should not unduly rely on these statements. These forward-looking statements involve risks, uncertainties and other factors that may cause our actual results in future periods to differ materially from those forward-looking statements. These factors include, but are not limited to:
• | adverse economic conditions and the impact on the real estate industry, including healthcare real estate; |
• | our dependence on the resources and personnel of our advisor, our sponsor and their affiliates, including our advisor’s ability to manage our portfolio on our behalf; |
• | the performance of our advisor, our sponsor and their affiliates; |
• | our liquidity and access to capital; |
• | our use of leverage; |
• | our ability to make distributions to our stockholders; |
• | the lack of a public trading market for our shares; |
• | the effect of economic conditions on the valuation of our investments; |
• | the effect of paying distributions to our stockholders from sources other than cash flow provided by operations; |
• | the impact of our sponsor’s recently announced merger agreement with NorthStar Realty Finance Corp. and Colony Capital, Inc., including the ability to consummate the merger on the terms contemplated or at all; |
• | our advisor’s and its affiliates’ ability to attract and retain qualified personnel to support our growth and operations and potential changes to key personnel providing management services to us; |
• | our reliance on our advisor and its affiliates and sub-advisors/co-venturers in providing management services to us, the payment of substantial fees to our advisor, the allocation of investments by our advisor and its affiliates among us and the other sponsored or managed companies and strategic vehicles of our sponsor and its affiliates, and various potential conflicts of interest in our relationship with our sponsor; |
• | a change in the ownership or management of our sponsor; |
• | the impact of market and other conditions influencing the performance of our investments relative to our expectations and the impact on our actual return on invested equity, as well as the cash provided by these investments; |
• | changes in our business or investment strategy; |
• | the impact of economic conditions on the operators/tenants of the real property that we own as well as on borrowers of the debt we originate and acquire; |
• | the nature and extent of future competition, including new construction in the markets in which our assets are located; |
• | the ability of our tenants, operators and managers to conduct their respective businesses in a manner sufficient to maintain or increase their revenues and to generate sufficient income to make rent payments to us and, in turn, our ability to satisfy our obligations under our borrowings; |
3
• | the ability of our tenants, operators and managers, as applicable, to comply with laws, rules and regulations in the operation of our properties, to deliver high-quality services, to attract and retain qualified personnel and to attract residents and patients; |
• | the ability and willingness of our tenants, operators, managers and other third parties to satisfy their respective obligations to us, including in some cases their obligation to indemnify us from and against various claims and liabilities; |
• | the financial weakness of our tenants, operators and borrowers, including potential bankruptcies and downturns in their businesses, and their legal and regulatory proceedings, which results in uncertainties regarding our ability to continue to realize the full benefit of such tenants’ and operators’ leases and borrowers’ loans and/or expose us to additional liabilities and expenses; |
• | the impact of increased operating costs on our liquidity, financial condition and results of operations or that of our tenants, operators, managers and borrowers and our ability and the ability of our tenants, operators, managers and borrowers to accurately estimate the magnitude of those costs; |
• | changes in the value of our portfolio; |
• | the impact of fluctuations in interest rates; |
• | our ability to realize current and expected returns over the life of our investments; |
• | any failure in our advisor’s and its affiliates’ due diligence to identify relevant facts during our underwriting process or otherwise; |
• | investments in asset classes and structures with which we have less familiarity; |
• | illiquidity of properties or debt investments in our portfolio; |
• | our ability to finance our assets on terms that are acceptable to us, if at all, including our ability to complete securitization financing transactions; |
• | environmental compliance costs and liabilities; |
• | whether we will realize the benefits of the long-term partnership between our sponsor and James F. Flaherty III, a member of our Sponsor’s investment committee and our former director, and potential conflicts that may arise in connection with his interest in American Healthcare Investors, LLC; |
• | risks associated with our joint ventures and unconsolidated entities, including our reliance on joint venture partners, lack of decision making authority and the financial condition of our joint venture partners; |
• | increased rates of loss or default and decreased recovery on our investments; |
• | the degree and nature of our competition; |
• | the effectiveness of our portfolio management techniques and strategies; |
• | the potential failure to maintain effective internal controls and disclosure controls and procedures; |
• | regulatory requirements with respect to our business and the healthcare industry generally, as well as the related cost of compliance; |
• | the extent and timing of future healthcare reform and regulation, including changes in reimbursement policies, procedures and rates; |
• | legislative and regulatory changes, including changes to laws governing the taxation of real estate investment trusts, or REITs, and changes to laws affecting non-traded REITs and alternative investments generally; |
• | our ability to maintain our qualification as a REIT for federal income tax purposes and limitations imposed on our business by our status as a REIT; |
• | the loss of our exemption from registration under the Investment Company Act of 1940, as amended; |
• | availability of opportunities to acquire equity, debt and securities investments in the healthcare real estate sector; |
• | general volatility in capital markets; |
4
• | the adequacy of our cash reserves and working capital; and |
• | other risks associated with investing in our targeted investments, including changes in our industry, interest rates, the securities markets, the general economy or the capital markets and real estate markets specifically. |
The foregoing list of factors is not exhaustive. All forward-looking statements included in this Quarterly Report on Form 10-Q are based on information available to us on the date hereof and we are under no duty to update any of the forward-looking statements after the date of this report to conform these statements to actual results.
Factors that could have a material adverse effect on our operations and future prospects are set forth in our filings with the United States Securities and Exchange Commission, or the SEC, including Part I, Item 1A of our Annual Report on Form 10-K for the fiscal year ended December 31, 2015 and in Part II, Item 1A of this Quarterly Report on Form 10-Q under the heading “Risk Factors.” The risk factors set forth in our filings with the SEC could cause our actual results to differ significantly from those contained in any forward-looking statement contained in this report.
5
PART I. Financial Information
Item 1. Financial Statements
NORTHSTAR HEALTHCARE INCOME, INC. AND SUBSIDIARIES
CONSOLIDATED BALANCE SHEETS
(Dollars in Thousands, Except Per Share Data)
June 30, 2016 (Unaudited) | December 31, 2015 | ||||||
Assets | |||||||
Cash | $ | 144,165 | $ | 354,229 | |||
Restricted cash | 31,285 | 15,612 | |||||
Operating real estate, net | 1,720,933 | 832,253 | |||||
Investments in unconsolidated ventures (refer to Note 4) | 414,993 | 534,541 | |||||
Real estate debt investments, net | 193,004 | 192,934 | |||||
Receivables, net | 8,744 | 8,016 | |||||
Deferred costs and intangible assets, net | 35,661 | 44,261 | |||||
Other assets | 14,580 | 20,382 | |||||
Total assets(1) | $ | 2,563,365 | $ | 2,002,228 | |||
Liabilities | |||||||
Mortgage notes payable, net | $ | 1,216,643 | $ | 570,985 | |||
Due to related party | 56 | 443 | |||||
Escrow deposits payable | 3,646 | 2,046 | |||||
Distribution payable | 10,086 | 10,002 | |||||
Accounts payable and accrued expenses | 21,540 | 10,234 | |||||
Other liabilities | 3,889 | 3,018 | |||||
Total liabilities(1) | 1,255,860 | 596,728 | |||||
Commitments and contingencies | |||||||
Equity | |||||||
NorthStar Healthcare Income, Inc. Stockholders’ Equity | |||||||
Preferred stock, $0.01 par value, 50,000,000 shares authorized, no shares issued and outstanding as of June 30, 2016 and December 31, 2015 | — | — | |||||
Common stock, $0.01 par value, 400,000,000 shares authorized, 182,307,094 and 179,137,202 shares issued and outstanding as of June 30, 2016 and December 31, 2015, respectively | 1,823 | 1,791 | |||||
Additional paid-in capital | 1,643,292 | 1,614,452 | |||||
Retained earnings (accumulated deficit) | (342,996 | ) | (216,099 | ) | |||
Total NorthStar Healthcare Income, Inc. stockholders’ equity | 1,302,119 | 1,400,144 | |||||
Non-controlling interests | 5,386 | 5,356 | |||||
Total equity | 1,307,505 | 1,405,500 | |||||
Total liabilities and equity | $ | 2,563,365 | $ | 2,002,228 | |||
__________________________________________________________
(1) | Represents the consolidated assets and liabilities of NorthStar Healthcare Income Operating Partnership, LP (the “Operating Partnership”). The Operating Partnership is a consolidated variable interest entity (“VIE”), of which the Company is the sole general partner and owns approximately 99.99%. As of June 30, 2016, the assets and liabilities of the Operating Partnership include $472.5 million and $294.0 million of assets and liabilities, respectively, of certain VIEs that are consolidated by the Operating Partnership. Refer to Note 2. “Summary of Significant Accounting Policies”. |
Refer to accompanying notes to consolidated financial statements.
6
NORTHSTAR HEALTHCARE INCOME, INC. AND SUBSIDIARIES
CONSOLIDATED STATEMENTS OF OPERATIONS
(Dollars in Thousands, Except Per Share Data)
(Unaudited)
Three Months Ended June 30, | Six Months Ended June 30, | ||||||||||||||
2016 | 2015 | 2016 | 2015 | ||||||||||||
Revenues | |||||||||||||||
Resident fee income | $ | 25,244 | $ | 12,132 | $ | 50,285 | $ | 15,980 | |||||||
Rental income | 37,586 | 5,740 | 56,021 | 9,647 | |||||||||||
Interest income | 5,005 | 3,648 | 10,040 | 7,208 | |||||||||||
Other revenue | 194 | — | 469 | — | |||||||||||
Total revenues | 68,029 | 21,520 | 116,815 | 32,835 | |||||||||||
Expenses | |||||||||||||||
Property operating expenses | 34,982 | 8,739 | 58,379 | 11,486 | |||||||||||
Interest expense | 13,044 | 3,431 | 21,527 | 5,078 | |||||||||||
Transaction costs | 249 | 3,127 | 1,531 | 4,542 | |||||||||||
Asset management and other fees - related party | 8,452 | 17,829 | 28,080 | 20,543 | |||||||||||
General and administrative expenses | 8,722 | 4,224 | 16,558 | 7,101 | |||||||||||
Depreciation and amortization | 13,429 | 4,697 | 25,252 | 6,382 | |||||||||||
Total expenses | 78,878 | 42,047 | 151,327 | 55,132 | |||||||||||
Other income (loss) | |||||||||||||||
Realized gain (loss) on investments and other | 411 | — | 411 | — | |||||||||||
Gain (loss) on consolidation of unconsolidated venture (refer to Note 3) | — | — | 6,408 | — | |||||||||||
Income (loss) before equity in earnings (losses) of unconsolidated ventures and income tax benefit (expense) | (10,438 | ) | (20,527 | ) | (27,693 | ) | (22,297 | ) | |||||||
Equity in earnings (losses) of unconsolidated ventures | (17,432 | ) | (5,351 | ) | (31,469 | ) | (8,941 | ) | |||||||
Income tax benefit (expense) | (33 | ) | 208 | (7,124 | ) | 553 | |||||||||
Net income (loss) | (27,903 | ) | (25,670 | ) | (66,286 | ) | (30,685 | ) | |||||||
Net (income) loss attributable to non-controlling interests | 34 | 151 | 119 | 152 | |||||||||||
Net income (loss) attributable to NorthStar Healthcare Income, Inc. common stockholders | $ | (27,869 | ) | $ | (25,519 | ) | $ | (66,167 | ) | $ | (30,533 | ) | |||
Net income (loss) per share of common stock, basic/diluted | $ | (0.15 | ) | $ | (0.22 | ) | $ | (0.37 | ) | $ | (0.27 | ) | |||
Weighted average number of shares of common stock outstanding, basic/diluted | 181,717,986 | 118,095,010 | 180,934,241 | 113,757,105 | |||||||||||
Distributions declared per share of common stock | $ | 0.17 | $ | 0.17 | $ | 0.34 | $ | 0.33 | |||||||
Refer to accompanying notes to consolidated financial statements.
7
NORTHSTAR HEALTHCARE INCOME, INC. AND SUBSIDIARIES
CONSOLIDATED STATEMENTS OF EQUITY
(Dollars and Shares in Thousands)
Common Stock | Additional Paid-in Capital | Retained Earnings (Accumulated Deficit) | Total Company’s Stockholders’ Equity | Non-controlling Interests | Total Equity | |||||||||||||||||||||
Shares | Amount | |||||||||||||||||||||||||
Balance as of December 31, 2014 | 97,972 | $ | 980 | $ | 875,205 | $ | (45,458 | ) | $ | 830,727 | $ | 1,258 | $ | 831,985 | ||||||||||||
Net proceeds from issuance of common stock | 76,761 | 767 | 696,724 | — | 697,491 | — | 697,491 | |||||||||||||||||||
Issuance and amortization of equity-based compensation | 12 | — | 115 | — | 115 | — | 115 | |||||||||||||||||||
Non-controlling interests - contributions | — | — | — | — | — | 4,472 | 4,472 | |||||||||||||||||||
Shares redeemed for cash | (407 | ) | (4 | ) | (3,924 | ) | — | (3,928 | ) | — | (3,928 | ) | ||||||||||||||
Distributions declared | — | — | — | (88,271 | ) | (88,271 | ) | — | (88,271 | ) | ||||||||||||||||
Proceeds from distribution reinvestment plan | 4,799 | 48 | 46,332 | — | 46,380 | — | 46,380 | |||||||||||||||||||
Net income (loss) | — | — | — | (82,370 | ) | (82,370 | ) | (374 | ) | (82,744 | ) | |||||||||||||||
Balance as of December 31, 2015 | 179,137 | $ | 1,791 | $ | 1,614,452 | $ | (216,099 | ) | $ | 1,400,144 | $ | 5,356 | $ | 1,405,500 | ||||||||||||
Net proceeds from issuance of common stock | 81 | 1 | 295 | — | 296 | — | 296 | |||||||||||||||||||
Issuance and amortization of equity-based compensation | 14 | — | 68 | — | 68 | — | 68 | |||||||||||||||||||
Non-controlling interests - contributions | — | — | — | — | — | 149 | 149 | |||||||||||||||||||
Shares redeemed for cash | (551 | ) | (6 | ) | (5,232 | ) | — | (5,238 | ) | — | (5,238 | ) | ||||||||||||||
Distributions declared | — | — | — | (60,730 | ) | (60,730 | ) | — | (60,730 | ) | ||||||||||||||||
Proceeds from distribution reinvestment plan | 3,626 | 37 | 33,709 | — | 33,746 | — | 33,746 | |||||||||||||||||||
Net income (loss) | — | — | — | (66,167 | ) | (66,167 | ) | (119 | ) | (66,286 | ) | |||||||||||||||
Balance as of June 30, 2016 (Unaudited) | 182,307 | $ | 1,823 | $ | 1,643,292 | $ | (342,996 | ) | $ | 1,302,119 | $ | 5,386 | $ | 1,307,505 | ||||||||||||
Refer to accompanying notes to consolidated financial statements.
8
NORTHSTAR HEALTHCARE INCOME, INC. AND SUBSIDIARIES
CONSOLIDATED STATEMENTS OF CASH FLOWS
(Dollars in Thousands)
(Unaudited)
Six Months Ended June 30, | |||||||
2016 | 2015 | ||||||
Cash flows from operating activities: | |||||||
Net income (loss) | $ | (66,286 | ) | $ | (30,685 | ) | |
Adjustments to reconcile net income (loss) to net cash provided by (used in) operating activities: | |||||||
Equity in (earnings) losses of unconsolidated ventures | 31,469 | 8,941 | |||||
Depreciation and amortization | 25,252 | 6,382 | |||||
Straight-line rental income | (686 | ) | (1,445 | ) | |||
Amortization of premium/accretion of discount on investments | (10 | ) | 92 | ||||
Amortization of deferred financing costs | 923 | 634 | |||||
Amortization of equity-based compensation | 68 | 48 | |||||
Deferred income tax (benefit) expense, net | 7,026 | (782 | ) | ||||
Realized (gain) loss on investments and other | (411 | ) | — | ||||
(Gain) loss on consolidation of unconsolidated venture (refer to Note 3) | (6,408 | ) | — | ||||
Distributions from unconsolidated ventures | — | 249 | |||||
Changes in assets and liabilities: | |||||||
Restricted cash | (1,787 | ) | (1,745 | ) | |||
Receivables, net | 778 | (3,134 | ) | ||||
Other assets | (1,018 | ) | 60 | ||||
Due to related party | (387 | ) | (789 | ) | |||
Escrow deposits payable | 563 | 1,142 | |||||
Accounts payable and accrued expenses | (375 | ) | 10,846 | ||||
Other liabilities | (135 | ) | 5,042 | ||||
Net cash provided by (used in) operating activities | (11,424 | ) | (5,144 | ) | |||
Cash flows from investing activities: | |||||||
Acquisition of operating real estate investments, net | (139,618 | ) | (591,708 | ) | |||
Improvement of operating real estate investments | (14,137 | ) | (2,642 | ) | |||
Deferred costs and intangible assets | — | (39,147 | ) | ||||
Acquisition of real estate debt investments | — | 188 | |||||
Repayment on real estate debt investments | (60 | ) | — | ||||
Investment in unconsolidated ventures | (18,911 | ) | (122,268 | ) | |||
Distributions from unconsolidated ventures | 10,393 | 12,010 | |||||
Change in restricted cash | (2,402 | ) | (6,848 | ) | |||
Other assets | 798 | (12,417 | ) | ||||
Net cash provided by (used in) investing activities | (163,937 | ) | (762,832 | ) | |||
Cash flows from financing activities: | |||||||
Borrowing from mortgage notes | — | 503,750 | |||||
Repayment of mortgage notes | (104 | ) | — | ||||
Payment of deferred financing costs | (3,371 | ) | (8,341 | ) | |||
Change in restricted cash | 356 | (9 | ) | ||||
Net proceeds from issuance of common stock | 405 | 235,991 | |||||
Net proceeds from issuance of common stock, related party | — | 1,617 | |||||
Shares redeemed for cash | (5,238 | ) | (1,145 | ) | |||
Distributions paid on common stock | (60,646 | ) | (35,996 | ) | |||
Proceeds from distribution reinvestment plan | 33,746 | 20,097 | |||||
Contributions from non-controlling interests | 149 | 4,308 | |||||
Net cash provided by (used in) financing activities | (34,703 | ) | 720,272 | ||||
Net increase (decrease) in cash | (210,064 | ) | (47,704 | ) | |||
Cash - beginning of period | 354,229 | 267,672 | |||||
Cash - end of period | $ | 144,165 | $ | 219,968 | |||
Refer to accompanying notes to consolidated financial statements.
9
NORTHSTAR HEALTHCARE INCOME, INC. AND SUBSIDIARIES
CONSOLIDATED STATEMENTS OF CASH FLOWS (Continued)
(Dollars in Thousands)
(Unaudited)
Six Months Ended June 30, | |||||||
2016 | 2015 | ||||||
Supplemental disclosure of non-cash investing and financing activities: | |||||||
Accrued cost of capital (refer to Note 7) | $ | — | $ | 558 | |||
Subscriptions receivable, gross | — | 3,506 | |||||
Escrow deposits related to real estate debt investments | 34 | 39 | |||||
Distribution payable | 10,086 | 6,804 | |||||
Other liabilities | — | 2,475 | |||||
Transfer of non-controlling interest in joint venture for controlling interest in consolidated real estate investment (refer to Note 3) | 103,005 | — | |||||
Assumption of mortgage notes payable upon acquisition of operating real estate | 648,211 | — | |||||
Accrued capital expenditures | 361 | — | |||||
Accrued acquisition fees - unconsolidated ventures | — | 13,098 | |||||
Refer to accompanying notes to consolidated financial statements.
10
NORTHSTAR HEALTHCARE INCOME, INC. AND SUBSIDIARIES
NOTES TO CONSOLIDATED FINANCIAL STATEMENTS
(Unaudited)
1. | Business and Organization |
NorthStar Healthcare Income, Inc. (the “Company”) was formed to acquire, originate and asset manage a diversified portfolio of equity, debt and securities investments in healthcare real estate, directly or through joint ventures, with a focus on the mid-acuity senior housing sector, which the Company defines as assisted living (“ALF”), memory care (“MCF”), skilled nursing (“SNF”), independent living (“ILF”) facilities and continuing care retirement communities (“CCRC”), which may have independent living, assisted living, skilled nursing and memory care available on one campus. The Company also invests in other healthcare property types, including medical office buildings (“MOB”), hospitals, rehabilitation facilities and ancillary healthcare services businesses. The Company’s investments are predominantly in the United States, but it also selectively makes international investments. The Company was formed in October 2010 as a Maryland corporation and commenced operations in February 2013. The Company elected to be taxed as a real estate investment trust (“REIT”) under the Internal Revenue Code of 1986, as amended (the “Internal Revenue Code”), commencing with the taxable year ended December 31, 2013. The Company conducts its operations so as to continue to qualify as a REIT for U.S. federal income tax purposes.
The Company’s equity investments are generally healthcare properties, which are either structured as net leases to healthcare operators or operated through management agreements with independent third-party operators, where applicable through the REIT Investment Diversification and Empowerment Act of 2007 (“RIDEA”) structures that permit the Company, through taxable REIT subsidiaries (“TRS”), to have direct exposure to resident fee income and incur related operating expenses. The Company’s debt investments consist of first mortgage loans and mezzanine loans. The Company currently owns no securities investments.
The Company is externally managed and has no employees. Prior to June 30, 2014, the Company was managed by an affiliate of NorthStar Realty Finance Corp. (NYSE: NRF) (“NorthStar Realty”). Effective June 30, 2014, NorthStar Realty spun-off its asset management business into a separate publicly traded company, NorthStar Asset Management Group Inc. (NYSE: NSAM) (the “Sponsor”). The Sponsor and its affiliates provide asset management and other services to the Company, NorthStar Realty, NorthStar Realty Europe Corp. (NYSE: NRE), other sponsored public retail-focused companies and any other companies the Sponsor and its affiliates may manage in the future (collectively, the “NSAM Managed Companies”), both in the United States and internationally. Concurrent with the spin-off, affiliates of the Sponsor entered into a new advisory agreement with the Company and each of the other NSAM Managed Companies. Pursuant to the Company’s advisory agreement, NSAM J-NSHC Ltd, an affiliate of the Sponsor (the “Advisor”), agreed to manage the day-to-day operations of the Company on terms substantially similar to those set forth in the Company’s prior advisory agreement with NorthStar Healthcare Income Advisor, LLC (the “Prior Advisor”). References to the “Prior Advisor” herein refer to the services performed by and fees paid and accrued to the Prior Advisor during the period prior to June 30, 2014. The spin-off of NorthStar Realty’s asset management business had no impact on the Company’s operations.
In June 2016, the Sponsor announced that it entered into a definitive merger agreement with NorthStar Realty and Colony Capital, Inc. (“Colony”), providing for the combination of the Sponsor, NorthStar Realty and Colony into a wholly-owned subsidiary of the Sponsor, as the surviving publicly-traded company for the combined organization that, upon and following the effective time of the mergers, will be named Colony NorthStar, Inc. (“Colony NorthStar”). As a result of the mergers, Colony NorthStar will be an internally-managed equity REIT, with a diversified real estate and investment management platform. In addition, following the mergers, the Advisor will be a subsidiary of Colony NorthStar. This transaction is expected to close in January 2017, subject to customary closing conditions, including regulatory approvals, and approval by the Sponsor’s, NorthStar Realty’s and Colony’s respective shareholders. There is no guarantee this transaction will close on the contemplated terms or within the anticipated timeframe, or at all. The Company does not expect that this transaction will have a material impact on its operations.
Substantially all the Company’s business is conducted through NorthStar Healthcare Income Operating Partnership, LP (the “Operating Partnership”). The Company is the sole general partner of the Operating Partnership. The limited partners of the Operating Partnership are the Prior Advisor and NorthStar Healthcare Income OP Holdings, LLC (the “Special Unit Holder”), each an affiliate of the Sponsor. The Prior Advisor invested $1,000 in the Operating Partnership in exchange for common units and the Special Unit Holder invested $1,000 in the Operating Partnership and was issued a separate class of limited partnership units (the “Special Units”), which are collectively recorded as non-controlling interests on the accompanying consolidated balance sheets as of June 30, 2016 and December 31, 2015. As the Company issued shares, it contributed substantially all of the proceeds from its continuous, public offerings to the Operating Partnership as a capital contribution. As of June 30, 2016, the Company’s limited partnership interest in the Operating Partnership was 99.99%.
The Company’s charter authorizes the issuance of up to 400.0 million shares of common stock with a par value of $0.01 per share and up to 50.0 million shares of preferred stock with a par value of $0.01 per share. The board of directors of the Company is
11
NORTHSTAR HEALTHCARE INCOME, INC. AND SUBSIDIARIES
NOTES TO CONSOLIDATED FINANCIAL STATEMENTS (Continued)
(Unaudited)
authorized to amend its charter, without the approval of the stockholders, to increase the aggregate number of authorized shares of capital stock or the number of shares of any class or series that the Company has authority to issue.
The Company initially registered to offer up to 100.0 million shares pursuant to its primary offering to the public (the “Initial Primary Offering”) and up to 10.5 million shares pursuant to its distribution reinvestment plan (the “Initial DRP”), which are herein collectively referred to as the Initial Offering. The Initial Offering (including 8.6 million shares reallocated from the Initial DRP) was completed on February 2, 2015 by raising gross proceeds of $1.1 billion. All of the shares initially registered for the Initial Offering were issued.
On February 6, 2015, the Company’s registration statement on Form S-11 was declared effective by the U.S. Securities and Exchange Commission (the “SEC”) for a follow-on public offering (the “Follow-on Offering”) of up to $700.0 million which included up to $500.0 million in shares pursuant to its follow-on primary offering (the “Follow-on Primary Offering”) and up to $200.0 million in shares pursuant to its follow-on distribution reinvestment plan (the “Follow-on DRP”). The Company stopped accepting subscriptions for the Follow-on Offering on December 17, 2015 and all of the shares initially registered (including $159.5 million of shares reallocated from the Follow-on DRP) for the Follow-on Offering were issued on or before January 19, 2016. The Company registered an additional 30.0 million shares to be offered pursuant to DRP beyond the completion of the Follow-on Offering and continues to offer such shares.
The Initial Primary Offering and the Follow-on Primary Offering are collectively referred to as the Primary Offering and the distribution reinvestment plan, including but not limited to, the Initial DRP and Follow-on DRP, are collectively referred to as the DRP. Additionally, the Primary Offering and the Initial DRP and Follow-on DRP are collectively referred to as the Offering.
The Company retained NorthStar Securities, LLC (the “Dealer Manager”), formerly a subsidiary of NorthStar Realty that became a subsidiary of the Sponsor upon completion of the spin-off, to serve as the dealer manager for the Primary Offering.
From inception through August 5, 2016, the Company raised total gross proceeds of $1.8 billion.
2. | Summary of Significant Accounting Policies |
Basis of Quarterly Presentation
The accompanying unaudited consolidated financial statements and related notes of the Company have been prepared in accordance with accounting principles generally accepted in the United States (“U.S. GAAP”) for interim financial reporting and the instructions to Form 10-Q and Rule 10-01 of Regulation S-X. Accordingly, certain information and note disclosures normally included in the consolidated financial statements prepared under U.S. GAAP have been condensed or omitted. In the opinion of management, all adjustments considered necessary for a fair presentation of the Company’s financial position, results of operations and cash flows have been included and are of a normal and recurring nature. The operating results presented for interim periods are not necessarily indicative of the results that may be expected for any other interim period or for the entire year. These consolidated financial statements should be read in conjunction with the Company’s consolidated financial statements and notes thereto included in the Company’s Annual Report on Form 10-K for the fiscal year ended December 31, 2015, which was filed with the SEC.
Principles of Consolidation
The consolidated financial statements include the accounts of the Company, the Operating Partnership and their consolidated subsidiaries. The Company consolidates variable interest entities (“VIE”) where the Company is the primary beneficiary and voting interest entities which are generally majority owned or otherwise controlled by the Company. All significant intercompany balances are eliminated in consolidation.
Variable Interest Entities
A VIE is an entity that lacks one or more of the characteristics of a voting interest entity. A VIE is defined as an entity in which equity investors do not have the characteristics of a controlling financial interest or do not have sufficient equity at risk for the entity to finance its activities without additional subordinated financial support from other parties. The determination of whether an entity is a VIE includes both a qualitative and quantitative analysis. The Company bases its qualitative analysis on its review of the design of the entity, its organizational structure including decision-making ability and relevant financial agreements and the quantitative analysis on the forecasted cash flow of the entity. The Company reassesses its initial evaluation of an entity as a VIE upon the occurrence of certain reconsideration events.
12
NORTHSTAR HEALTHCARE INCOME, INC. AND SUBSIDIARIES
NOTES TO CONSOLIDATED FINANCIAL STATEMENTS (Continued)
(Unaudited)
A VIE must be consolidated only by its primary beneficiary, which is defined as the party who, along with its affiliates and agents, has both the: (i) power to direct the activities that most significantly impact the VIE’s economic performance; and (ii) obligation to absorb the losses of the VIE or the right to receive the benefits from the VIE, which could be significant to the VIE. The Company determines whether it is the primary beneficiary of a VIE by considering qualitative and quantitative factors, including, but not limited to: which activities most significantly impact the VIE’s economic performance and which party controls such activities; the amount and characteristics of its investment; the obligation or likelihood for the Company or other interests to provide financial support; consideration of the VIE’s purpose and design, including the risks the VIE was designed to create and pass through to its variable interest holders and the similarity with and significance to the business activities of the Company and the other interests. The Company reassesses its determination of whether it is the primary beneficiary of a VIE each reporting period. Significant judgments related to these determinations include estimates about the current and future fair value and performance of investments held by these VIEs and general market conditions.
The Company evaluates its investments and financings, including investments in unconsolidated ventures and securitization financing transactions, if any, to determine whether each investment or financing is a VIE. The Company analyzes new investments and financings, as well as reconsideration events for existing investments and financings, which vary depending on type of investment or financing.
The Company adopted the new consolidation guidance (refer to Recent Accounting Pronouncements) on January 1, 2016 which resulted in the identification of several VIEs. Prior to the adoption of the standard, these entities were consolidated under the voting interest model. The most significant consolidated VIEs are the Operating Partnership and certain properties that have non-controlling interests. These entities are VIEs because the non-controlling interests do not have substantive kick-out or participating rights. The Company consolidates these entities because it controls all significant business activities.
The Operating Partnership consolidates certain properties that have non-controlling interests. Included in operating real estate, net on the Company’s consolidated balance sheets as of June 30, 2016 is $427.6 million related to such consolidated VIEs. Included in mortgage notes payable, net on the Company’s consolidated balance sheets as of June 30, 2016 is $288.4 million, collateralized by the real estate assets of the related consolidated VIEs.
As of June 30, 2016, the Company identified unconsolidated VIEs related to its real estate equity investments with a carrying value of $415.0 million. The Company’s maximum exposure to loss as of June 30, 2016 would not exceed the carrying value of its investment in the VIEs and its investment in a $75.0 million mezzanine loan to a subsidiary of one of the VIEs. Based on management’s analysis, the Company determined that it is not the primary beneficiary. Accordingly, these VIEs are not consolidated in the Company’s financial statements as of June 30, 2016. The Company did not provide financial support to its unconsolidated VIEs during the six months ended June 30, 2016. As of June 30, 2016, there were no explicit arrangements or implicit variable interests that could require the Company to provide financial support to its unconsolidated VIEs.
Voting Interest Entities
A voting interest entity is an entity in which the total equity investment at risk is sufficient to enable it to finance its activities independently and the equity holders have the power to direct the activities of the entity that most significantly impact its economic performance, the obligation to absorb the losses of the entity and the right to receive the residual returns of the entity. The usual condition for a controlling financial interest in a voting interest entity is ownership of a majority voting interest. If the Company has a majority voting interest in a voting interest entity, the entity will generally be consolidated. The Company does not consolidate a voting interest entity if there are substantive participating rights by other parties and/or kick-out rights by a single party or a simple majority vote.
The Company performs on-going reassessments of whether entities previously evaluated under the voting interest framework have become VIEs, based on certain events, and therefore subject to the VIE consolidation framework.
Investments in Unconsolidated Ventures
A non-controlling, unconsolidated ownership interest in an entity may be accounted for using the equity method, at fair value or the cost method.
Under the equity method, the investment is adjusted each period for capital contributions and distributions and its share of the entity’s net income (loss). Capital contributions, distributions and net income (loss) of such entities are recorded in accordance with the terms of the governing documents. An allocation of net income (loss) may differ from the stated ownership percentage interest in such entity as a result of preferred returns and allocation formulas, if any, as described in such governing documents. Equity method investments are recognized using a cost accumulation model in which the investment is recognized based on the
13
NORTHSTAR HEALTHCARE INCOME, INC. AND SUBSIDIARIES
NOTES TO CONSOLIDATED FINANCIAL STATEMENTS (Continued)
(Unaudited)
cost to the investor, which includes acquisition fees. The Company records as an expense certain acquisition costs and fees associated with consolidated investments deemed to be business combinations and capitalizes these costs for investments deemed to be acquisitions of an asset, including an equity method investment.
The Company may account for an investment in an unconsolidated entity at fair value by electing the fair value option. The Company may account for an investment that does not qualify for equity method accounting or for which the fair value option was not elected using the cost method if the Company determines the investment in the unconsolidated entity is insignificant. Under the cost method, equity in earnings is recorded as dividends are received to the extent they are not considered a return of capital, which is recorded as a reduction of cost of the investment.
Non-controlling Interests
A non-controlling interest in a consolidated subsidiary is defined as the portion of the equity (net assets) in a subsidiary not attributable, directly or indirectly, to the Company. A non-controlling interest is required to be presented as a separate component of equity on the consolidated balance sheets and presented separately as net income (loss) and comprehensive income (loss) attributable to controlling and non-controlling interests. An allocation to a non-controlling interest may differ from the stated ownership percentage interest in such entity as a result of a preferred return and allocation formula, if any, as described in such governing documents.
Estimates
The preparation of consolidated financial statements in conformity with U.S. GAAP requires management to make estimates and assumptions that could affect the amounts reported in the consolidated financial statements and accompanying notes. Actual results could materially differ from those estimates and assumptions.
Comprehensive Income (Loss)
The Company had no items of other comprehensive income (loss) (“OCI”), so its comprehensive income (loss) is the same as the net income (loss) for all periods presented.
Operating Real Estate
The Company accounts for purchases of operating real estate that qualify as business combinations using the acquisition method, where the purchase price is allocated to tangible assets such as land, building, furniture and fixtures, improvements and other identified intangibles such as in place leases and goodwill. Major replacements and betterments which improve or extend the life of the asset are capitalized and depreciated over their useful life. Ordinary repairs and maintenance are expensed as incurred. Operating real estate is carried at historical cost less accumulated depreciation. Operating real estate is depreciated using the straight-line method over the estimated useful life of the assets, summarized as follows:
Category: | Term: | |
Building | 40 years | |
Building improvements | Lesser of the useful life or remaining life of the building | |
Tenant improvements | Lesser of the useful life or remaining term of the lease | |
Furniture and fixtures | 7 to 10 years | |
Land improvements | 15 years | |
Construction costs incurred in connection with the Company’s investments are capitalized and included in operating real estate, net on the consolidated balance sheets. Construction in progress is not depreciated until the development is substantially completed. Costs directly related to an acquisition deemed to be a business combination are expensed and included in transaction costs in the consolidated statements of operations. The Company evaluates whether a real estate acquisition constitutes a business and whether business combination accounting is appropriate.
When the Company acquires a controlling interest in an existing unconsolidated joint venture, the Company records the consolidated investment at the updated purchase price, which is reflective of fair value. The difference between the carrying value of the Company’s investment in the existing unconsolidated joint venture on the acquisition date and the Company’s share of the fair value of the investment is recorded in gain (loss) on consolidation of unconsolidated venture in the Company’s consolidated statements of operations.
14
NORTHSTAR HEALTHCARE INCOME, INC. AND SUBSIDIARIES
NOTES TO CONSOLIDATED FINANCIAL STATEMENTS (Continued)
(Unaudited)
Real Estate Debt Investments
Debt investments are generally intended to be held to maturity and, accordingly, are carried at cost, net of unamortized loan fees, premium, discount and unfunded commitments. Debt investments that are deemed to be impaired are carried at amortized cost less a loan loss reserve, if deemed appropriate, which approximates fair value. Debt investments where the Company does not have the intent to hold the loan for the foreseeable future or until its expected payoff are classified as held for sale and recorded at the lower of cost or estimated value.
Real Estate Securities
The Company classifies its securities investments as available for sale on the acquisition date, which are carried at fair value. Unrealized gains (losses) are recorded as a component of accumulated OCI in the consolidated statements of equity. However, the Company may elect the fair value option for certain of its available for sale securities, and as a result, any unrealized gains (losses) on such securities are recorded in unrealized gain (loss) on investments and other in the consolidated statements of operations. As of June 30, 2016, the Company does not own any securities investments.
Deferred Costs and Intangible Assets
Deferred Costs
Deferred costs include deferred lease costs. Deferred financing costs represent commitment fees, legal and other third-party costs associated with obtaining financing. These costs are amortized to interest expense over the term of the financing using either the effective interest method or straight-line method depending on the type of financing. Unamortized deferred financing costs are expensed when the associated borrowing is repaid before maturity. Costs incurred in seeking financing transactions, which do not close, are expensed in the period in which it is determined that the financing will not occur. Deferred lease costs consist of fees incurred to initiate and renew operating leases, which are amortized on a straight-line basis over the remaining lease term and are recorded to depreciation and amortization in the consolidated statements of operations.
Identified Intangibles
The Company records acquired identified intangibles based on estimated fair value. In-place lease intangible assets are amortized into depreciation and amortization expense in the consolidated statements of operations on a straight-line basis over the remaining lease or resident agreement term.
Goodwill represents the excess of the purchase price over the fair value of net tangible and intangible assets acquired in a business combination and is not amortized. The Company performs an annual impairment test for goodwill and evaluates the recoverability whenever events or changes in circumstances indicate that the carrying value of goodwill may not be fully recoverable. In making such assessment, qualitative factors are used to determine whether it is more likely than not that the fair value of a reporting unit is less than its carrying value. If the estimated fair value of the reporting unit is less than its carrying value, then an impairment charge is recorded.
Identified intangible assets are recorded in deferred costs and intangible assets, net on the consolidated balance sheets.
The following table presents a summary of deferred costs and intangible assets as of June 30, 2016 and December 31, 2015 (dollars in thousands):
June 30, 2016 (Unaudited) | December 31, 2015 | |||||||
Deferred costs and intangible assets: | ||||||||
In-place lease value, net | $ | 12,743 | $ | 21,307 | ||||
Goodwill | 22,112 | 22,112 | ||||||
Other intangible assets | 380 | 380 | ||||||
Subtotal intangible assets | 35,235 | 43,799 | ||||||
Deferred financing and other costs, net | 426 | 462 | ||||||
Total | $ | 35,661 | $ | 44,261 | ||||
15
NORTHSTAR HEALTHCARE INCOME, INC. AND SUBSIDIARIES
NOTES TO CONSOLIDATED FINANCIAL STATEMENTS (Continued)
(Unaudited)
The Company recorded $3.5 million and $8.6 million of in-place lease and deferred lease cost amortization expense for the three and six months ended June 30, 2016, respectively. The Company recorded $1.7 million of in-place lease and deferred lease cost amortization expense for the three and six months ended June 30, 2015.
Acquisition Fees and Expenses
The total of all acquisition fees and expenses for an investment, including acquisition fees to the Advisor, cannot exceed, in the aggregate, 6.0% of the contract purchase price of such investment unless such excess is approved by a majority of the directors, including independent directors. For the six months ended June 30, 2016 and 2015, total acquisition fees and expenses did not exceed the allowed limit for any investment. An acquisition fee incurred related to an equity investment will generally be expensed as incurred. An acquisition fee paid to the Advisor related to the acquisition of an equity or debt investment in an unconsolidated joint venture is included in investments in unconsolidated ventures on the consolidated balance sheets. An acquisition fee paid to the Advisor related to the origination or acquisition of debt investments is included in debt investments, net on the consolidated balance sheets and is amortized to interest income over the life of the investment using the effective interest method. The Company records as an expense certain acquisition costs and fees associated with transactions deemed to be business combinations in which it consolidates the asset and capitalizes these costs for transactions deemed to be acquisitions of an asset, including an equity investment.
Other Assets
The following table presents a summary of other assets as of June 30, 2016 and December 31, 2015 (dollars in thousands):
June 30, 2016 (Unaudited) | December 31, 2015 | |||||||
Other assets: | ||||||||
Investment deposits and pending deal costs | $ | 6,683 | $ | 6,629 | ||||
Remainder interest in condominium units(1) | 4,964 | 5,401 | ||||||
Deferred tax assets | — | 7,026 | ||||||
Prepaid expenses | 1,949 | 790 | ||||||
Other | 984 | 536 | ||||||
Total | $ | 14,580 | $ | 20,382 | ||||
__________________________________________________________
(1) | Represents future interests in property subject to life estates (“Remainder Interest”). |
Revenue Recognition
Operating Real Estate
Rental income includes rental and escalation income from operating real estate and is derived from leasing of space to various types of tenants and healthcare operators. Rental revenue recognition commences when the tenant takes possession of the leased space and the leased space is substantially ready for its intended use. The leases are for fixed terms of varying length and generally provide for annual rentals and expense reimbursements to be paid in monthly installments. Rental income from leases is recognized on a straight-line basis over the term of the respective leases. The excess of rents recognized over amounts contractually due pursuant to the underlying leases are included in unbilled rent receivable on the consolidated balance sheets. The Company amortizes any tenant inducements as a reduction of revenue utilizing the straight-line method over the term of the lease. Escalation income represents revenue from tenant/operator leases which provide for the recovery of all or a portion of the operating expenses and real estate taxes paid by the Company on behalf of the respective property. This revenue is accrued in the same period as the expenses are incurred.
The Company also generates operating income from operating healthcare properties. Revenue related to operating healthcare properties includes resident room and care charges and other resident service charges. Revenue is recognized when such services are provided, generally defined per their resident agreement as the date upon which a resident occupies a room or uses the services and is recorded in resident fee income in the consolidated statements of operations.
In a situation in which a lease(s) associated with a significant tenant have been, or are expected to be, terminated early, the Company evaluates the remaining useful life of depreciable or amortizable assets in the asset group related to the lease that will be terminated (i.e., tenant improvements, above- and below-market lease intangibles, in-place lease value and deferred leasing costs). Based upon consideration of the facts and circumstances surrounding the termination, the Company may write-off or accelerate the
16
NORTHSTAR HEALTHCARE INCOME, INC. AND SUBSIDIARIES
NOTES TO CONSOLIDATED FINANCIAL STATEMENTS (Continued)
(Unaudited)
depreciation and amortization associated with the asset group. Such amounts are included within depreciation and amortization in the consolidated statements of operations.
Real Estate Debt Investments
Interest income is recognized on an accrual basis and any related premium, discount, origination costs and fees are amortized over the life of the investment using the effective interest method. The amortization is reflected as an adjustment to interest income in the consolidated statements of operations. The amortization of a premium or accretion of a discount is discontinued if such loan is reclassified to held for sale.
Real Estate Securities
Interest income is recognized using the effective interest method with any premium or discount amortized or accreted through earnings based on expected cash flow through the expected maturity date of the security. Changes to expected cash flow may result in a change to the yield which is then applied retrospectively for high-credit quality securities that cannot be prepaid or otherwise settled in such a way that the holder would not recover substantially all of the investment or prospectively for all other securities to recognize interest income. As of June 30, 2016, the Company does not own any securities investments.
Credit Losses and Impairment on Investments
Operating Real Estate
The Company’s real estate portfolio is reviewed on a quarterly basis, or more frequently as necessary, to assess whether there are any indicators that the value of its operating real estate may be impaired or that its carrying value may not be recoverable. A property’s value is considered impaired if the Company’s estimate of the aggregate expected future undiscounted cash flow generated by the property is less than the carrying value. In conducting this review, the Company considers U.S. macroeconomic factors, real estate and healthcare sector conditions, together with asset specific and other factors. To the extent an impairment has occurred, the loss is measured as the excess of the carrying value of the property over the estimated fair value and recorded in impairment on operating real estate in the consolidated statements of operations.
An allowance for a doubtful account for a tenant/operator/resident receivable is established based on a periodic review of aged receivables resulting from estimated losses due to the inability of tenant/operator/resident to make required rent and other payments contractually due. Additionally, the Company establishes, on a current basis, an allowance for future tenant/operator/resident credit losses on unbilled rent receivable based on an evaluation of the collectability of such amounts. The Company had an immaterial amount of allowance for doubtful accounts as of June 30, 2016.
Real Estate Debt Investments
Loans are considered impaired when, based on current information and events, it is probable that the Company will not be able to collect principal and interest amounts due according to the contractual terms. The Company assesses the credit quality of the portfolio and adequacy of loan loss reserves on a quarterly basis or more frequently as necessary. Significant judgment of the Company is required in this analysis. The Company considers the estimated net recoverable value of the loan as well as other factors, including but not limited to the fair value of any collateral, the amount and the status of any senior debt, the quality and financial condition of the borrower and the competitive situation of the area where the underlying collateral is located. Because this determination is based on projections of future economic events, which are inherently subjective, the amount ultimately realized may differ materially from the carrying value as of the balance sheet date. If upon completion of the assessment, the estimated fair value of the underlying collateral is less than the net carrying value of the loan, a loan loss reserve is recorded with a corresponding charge to provision for loan losses. The loan loss reserve for each loan is maintained at a level that is determined to be adequate by management to absorb probable losses.
Income recognition is suspended for a loan at the earlier of the date at which payments become 90-days past due or when, in the opinion of the Company, a full recovery of income and principal becomes doubtful. When the ultimate collectability of the principal of an impaired loan is in doubt, all payments are applied to principal under the cost recovery method. When the ultimate collectability of the principal of an impaired loan is not in doubt, contractual interest is recorded as interest income when received, under the cash basis method until an accrual is resumed when the loan becomes contractually current and performance is demonstrated to be resumed. A loan is written off when it is no longer realizable and/or legally discharged. As of June 30, 2016, the Company did not have any impaired real estate debt investments.
17
NORTHSTAR HEALTHCARE INCOME, INC. AND SUBSIDIARIES
NOTES TO CONSOLIDATED FINANCIAL STATEMENTS (Continued)
(Unaudited)
Investments in Unconsolidated Ventures
The Company reviews its investments in unconsolidated ventures for which the Company did not elect the fair value option on a quarterly basis, or more frequently as necessary, to assess whether there are any indicators that the value may be impaired or that its carrying value may not be recoverable. An investment is considered impaired if the projected net recoverable amount over the expected holding period is less than the carrying value. In conducting this review, the Company considers global macroeconomic factors, including real estate sector conditions, together with investment specific and other factors. To the extent an impairment has occurred and is considered to be other than temporary, the loss is measured as the excess of the carrying value of the investment over the estimated fair value and recorded in equity in earnings (losses) of unconsolidated ventures in the consolidated statements of operations.
Real Estate Securities
Securities for which the fair value option is elected are not evaluated for other-than-temporary impairment (“OTTI”) as any change in fair value is recorded in the consolidated statements of operations. Realized losses on such securities are reclassified to realized gain (loss) on investments and other as losses occur.
Securities for which the fair value option is not elected are evaluated for OTTI quarterly. Impairment of a security is considered to be other-than-temporary when: (i) the holder has the intent to sell the impaired security; (ii) it is more likely than not the holder will be required to sell the security; or (iii) the holder does not expect to recover the entire amortized cost of the security. When a security has been deemed to be other-than-temporarily impaired due to (i) or (ii), the security is written down to its fair value and an OTTI is recognized in the consolidated statements of operations. In the case of (iii), the security is written down to its fair value and the amount of OTTI is then bifurcated into: (a) the amount related to expected credit losses; and (b) the amount related to fair value adjustments in excess of expected credit losses. The portion of OTTI related to expected credit losses is recognized in the consolidated statements of operations. The remaining OTTI related to the valuation adjustment is recognized as a component of accumulated OCI in the consolidated statements of equity. The portion of OTTI recognized through earnings is accreted back to the amortized cost basis of the security through interest income, while amounts recognized through OCI are amortized over the life of the security with no impact on earnings. Real estate securities which are not high-credit quality are considered to have an OTTI if the security has an unrealized loss and there has been an adverse change in expected cash flow. The amount of OTTI is then bifurcated as discussed above. As of June 30, 2016, the Company did not own any real estate securities.
Organization and Offering Costs
The Advisor, or its affiliates, was entitled to receive reimbursement for costs paid on behalf of the Company in connection with the Offering. The Company was obligated to reimburse the Advisor for organization and offering costs to the extent the aggregate of selling commissions, dealer manager fees and other organization and offering costs do not exceed 15% of gross offering proceeds from the Primary Offering. The Advisor did not expect reimbursable organization and offering costs, including costs incurred in connection with the Follow-on Offering but excluding selling commissions and dealer manager fees, to exceed $22.5 million, or 1.5% of the total proceeds available to be raised from the Primary Offering. Based on gross proceeds of $1.7 billion from the Primary Offering, the Company incurred reimbursable organizational and offering costs, excluding selling commissions and dealer manager fees, of 1.0%, which was less than the 1.5% expected. The Company recorded organization and offering costs each period based upon an allocation determined by the expectation of total organization and offering costs to be reimbursed. Organization costs were recorded as an expense in general and administrative expenses in the consolidated statements of operations and offering costs were recorded as a reduction to equity.
Income Taxes
The Company elected to be taxed as a REIT and to comply with the related provisions of the Internal Revenue Code beginning in its taxable year ended December 31, 2013. Accordingly, the Company will generally not be subject to U.S. federal income tax to the extent of its distributions to stockholders as long as certain asset, income and share ownership tests are met. To maintain its qualification as a REIT, the Company must annually distribute at least 90% of its REIT taxable income to its stockholders and meet certain other requirements. The Company may also be subject to certain state, local and franchise taxes. Under certain circumstances, federal income and excise taxes may be due on its undistributed taxable income. If the Company were to fail to meet these requirements, it would be subject to U.S. federal income tax, which could have a material adverse impact on its results of operations and amounts available for distributions to its stockholders. The Company believes that all of the criteria to maintain the Company’s REIT qualification have been met for the applicable periods, but there can be no assurance that these criteria will continue to be met in subsequent periods.
18
NORTHSTAR HEALTHCARE INCOME, INC. AND SUBSIDIARIES
NOTES TO CONSOLIDATED FINANCIAL STATEMENTS (Continued)
(Unaudited)
The Company made a joint election to treat certain subsidiaries as TRS which may be subject to U.S. federal, state and local income taxes. In general, a TRS of the Company may perform non-customary services for tenants/operators/residents of the Company, hold assets that the Company cannot hold directly and may engage in any real estate or non-real estate-related business.
Certain subsidiaries of the Company are subject to taxation by federal, state and foreign authorities for the periods presented. The Company and its U.S. subsidiaries will file a consolidated federal income tax return. Income taxes are accounted for by the asset/liability approach in accordance with U.S. GAAP. Deferred taxes, if any, represent the expected future tax consequences when the reported amounts of assets and liabilities are recovered or paid. Such amounts arise from differences between the financial reporting and tax bases of assets and liabilities and are adjusted for changes in tax laws and tax rates in the period which such changes are enacted. A provision for income tax represents the total of income taxes paid or payable for the current period, plus the change in deferred taxes. Current and deferred taxes are provided on the portion of earnings (losses) recognized by the Company with respect to its interest in the TRS. Deferred income tax assets and liabilities are calculated based on temporary differences between the Company’s U.S. GAAP consolidated financial statements and the federal and state income tax basis of assets and liabilities as of the consolidated balance sheet date. The Company evaluates the realizability of its deferred tax assets (e.g., net operating loss and capital loss carryforwards) and recognizes a valuation allowance if, based on the available evidence, it is more likely than not that some portion or all of its deferred tax assets will not be realized. When evaluating the realizability of its deferred tax assets, the Company considers estimates of expected future taxable income, existing and projected book/tax differences, tax planning strategies available and the general and industry specific economic outlook. This realizability analysis is inherently subjective, as it requires the Company to forecast its business and general economic environment in future periods. Changes in estimate of deferred tax asset realizability, if any, are included in provision for income tax benefit (expense) in the consolidated statements of operations. In the first quarter of 2016, the Company recorded a $7.0 million valuation allowance as it determined it will be unable to utilize a $7.0 million deferred tax asset. As of June 30, 2016, there are no changes in the facts and circumstances to indicate that the Company should release the valuation allowance.
The Company recorded a net income tax expense of less than $0.1 million and $7.1 million for the three and six months ended June 30, 2016, respectively. The Company recorded an income tax benefit of $0.2 million and $0.6 million for the three and six months ended June 30, 2015, respectively.
Recent Accounting Pronouncements
In May 2014, the Financial Accounting Standards Board (“FASB”) issued an accounting update requiring a company to recognize as revenue the amount of consideration it expects to be entitled to in connection with the transfer of promised goods or services to customers. The accounting standard update will replace most of the existing revenue recognition guidance currently promulgated by U.S. GAAP. In July 2015, the FASB decided to delay the effective date of the new revenue standard by one year. The effective date of the new revenue standard for the Company will be January 1, 2018. The Company is in the process of evaluating the impact, if any, of the update on its consolidated financial position, results of operations and financial statement disclosures.
In February 2015, the FASB issued updated guidance that changes the rules regarding consolidation. The pronouncement eliminates specialized guidance for limited partnerships and similar legal entities and removes the indefinite deferral for certain investment funds. The new guidance is effective for annual periods and interim periods within those annual periods beginning after December 15, 2015, with early adoption permitted. The Company adopted this guidance in the first quarter 2016 and determined the Company’s Operating Partnership is considered a VIE. The Company is the primary beneficiary of the VIE, the VIE’s assets can be used for purposes other than the settlement of the VIE’s obligations and the Company’s partnership interest is considered a majority voting interest. As such, this standard resulted in the identification of additional VIEs, however it did not have a material impact on the Company’s consolidated financial position or results of operations.
In January 2016, the FASB issued an accounting update that addresses certain aspects of recognition, measurement, presentation, and disclosure of financial instruments. The new guidance is effective for fiscal years, and interim periods within those years, beginning after December 15, 2017. The Company is currently assessing the impact, if any, of the guidance on the Company’s consolidated financial position, results of operations and financial statement disclosures.
In February 2016, the FASB issued an accounting update that requires lessees to present right-of-use assets and lease liabilities on the balance sheet. The new guidance is to be applied using a modified retrospective approach at the beginning of the earliest comparative period in the financial statements and is effective for fiscal years beginning after December 15, 2018, including interim periods within those fiscal years. Early adoption is permitted. The Company is evaluating the impact, if any, that this guidance will have on its consolidated financial position, results of operations and financial statement disclosures.
19
NORTHSTAR HEALTHCARE INCOME, INC. AND SUBSIDIARIES
NOTES TO CONSOLIDATED FINANCIAL STATEMENTS (Continued)
(Unaudited)
In March 2016, the FASB issued guidance which eliminates the requirement for an investor to retroactively apply the equity method when its increase in ownership interest (or degree of influence) in an investee triggers equity method accounting. The update requires that the equity method investor add the cost of acquiring the additional interest in the investee to the current basis of the investor’s previously held interest and adopt the equity method of accounting as of the date the investment become qualified for equity method accounting. The update should be applied prospectively upon their effective date to increases in the level of ownership interests or degree of influence that results in the adoption of the equity method. The guidance is effective for fiscal years beginning after December 15, 2016 and interim periods within those fiscal years. Early adoption is permitted. The Company is evaluating the impact, if any, that this guidance will have on its consolidated financial position, results of operations and financial statement disclosures.
In March 2016, the FASB issued guidance which amends several aspects of the accounting for equity-based payment transactions, including the income tax consequences, classification of awards as either equity or liabilities, and classification on the statements of cash flows. The guidance is effective for interim and annual reporting periods in fiscal years beginning after December 15, 2017. The Company is evaluating the impact, if any, that this guidance will have on its consolidated financial position, results of operations and financial statement disclosures.
In June 2016, the FASB issued guidance which changes how entities will measure credit losses for most financial assets and certain other instruments that are not measured at fair value through net income. Additionally, entities will have to disclose significantly more information including information used to track credit quality by year of origination for most financing receivables. The new guidance is effective for fiscal years, and interim periods within those years, beginning after December 15, 2019. Early adoption is permitted. The Company is evaluating the impact, if any, that this guidance will have on its consolidated financial position, results of operations and financial statement disclosures.
3. | Operating Real Estate |
The following table presents operating real estate, net as of June 30, 2016 and December 31, 2015 (dollars in thousands):
June 30, 2016 (Unaudited) | December 31, 2015 | |||||||
Land | $ | 318,901 | $ | 140,734 | ||||
Land improvements | 8,425 | 8,384 | ||||||
Buildings and improvements | 1,378,113 | 664,555 | ||||||
Tenant improvements | 3,214 | 1,522 | ||||||
Construction in progress | 18,319 | 9,119 | ||||||
Furniture and fixtures | 29,997 | 27,325 | ||||||
Subtotal | 1,756,969 | 851,639 | ||||||
Less: Accumulated depreciation | (36,036 | ) | (19,386 | ) | ||||
Operating real estate, net | $ | 1,720,933 | $ | 832,253 | ||||
Real Estate Acquisitions
In March 2016, the Company acquired NorthStar Realty’s 60.0% interest in a joint venture (the “Winterfell JV”) which owned 32 private pay independent living facilities (the “Winterfell portfolio”) for a purchase price of $534.5 million, excluding escrows and subject to customary proration and adjustments. The transaction was approved by the Company’s board of directors, including all of its independent directors, and validated by an independent third-party appraisal for the Winterfell portfolio. The Company originally acquired a 40.0% equity interest in the Winterfell JV in May 2015. The Company accordingly now owns 100.0% of the equity in the Winterfell portfolio as of March 1, 2016 and consolidates the portfolio. Prior to March 1, 2016, the Company accounted for its equity investment in the Winterfell JV as an unconsolidated venture under the equity method and as of December 31, 2015, the carrying value of the Company’s investment was $95.7 million. For the three months ended March 31, 2016, the Company recognized $1.4 million in equity in earnings and received $0.6 million cash distributions.
20
NORTHSTAR HEALTHCARE INCOME, INC. AND SUBSIDIARIES
NOTES TO CONSOLIDATED FINANCIAL STATEMENTS (Continued)
(Unaudited)
The following table summarizes operating real estate acquisitions for the six months ended June 30, 2016 (dollars in thousands):
Acquisition Date | Type | Portfolio | Amount(1) | Properties | Units | Location | Financing | Company’s Equity | Ownership Interest | Transaction Costs | ||||||||||||||||||
March 2016 | Operating Facilities | Winterfell | $ | 904,985 | 32 | 3,985 | Various | $ | 648,211 | $ | 261,484 | 100.0% | $ | 1,347 | ||||||||||||||
_________________________________________________
(1) | Represents the purchase price for 100% of the Winterfell JV equity interests, including deferred costs and other assets, and may be adjusted upon completion of the final purchase price allocation. |
The preliminary allocation of the purchase price of the assets acquired and liabilities assumed from the acquisition of the Winterfell portfolio was allocated 20% to land and 80% to buildings. In connection with the consolidation of the Winterfell portfolio on March 1, 2016, the Company recognized a gain on consolidation of unconsolidated venture of $6.4 million, which was calculated as the difference between the carrying value of the Company’s investment in the existing unconsolidated joint venture on the acquisition date and the Company’s share of the fair value of the retained equity interest.
For business combinations achieved in stages, the acquisition date fair value of the Company’s unconsolidated venture immediately before the acquisition date is determined through the Company’s underwriting process, which includes the use of estimated cash flows projections and available market data, such as relevant discount and capitalization rates. Refer to Item 2. “Management’s Discussion and Analysis of Financial Condition and Results of Operations” for additional details of the Company’s underwriting process. The acquisition-date fair value of the equity interest in the Winterfell portfolio immediately before the acquisition date, as well as the gain on consolidation of unconsolidated venture, are as follows (dollars in thousands):
Winterfell Portfolio | ||||
Contract purchase price | $ | 890,834 | ||
Net consideration funded at closing, excluding consideration financed by debt | (139,618 | ) | ||
Debt assumed | (648,211 | ) | ||
Fair value of retained equity interest | 103,005 | |||
Investment in unconsolidated venture(1) | (96,597 | ) | ||
Gain on consolidation of unconsolidated venture | $ | 6,408 | ||
_________________________________________________
(1) | Represents carrying value of investment in unconsolidated venture at March 1, 2016. |
From the acquisition date of March 1, 2016 through June 30, 2016, the Company recorded aggregate revenue and net loss attributable to the Winterfell portfolio of $39.0 million and $0.5 million, respectively, in its consolidated statements of operations. The net loss is primarily attributable to transaction costs and depreciation expense.
The following presents unaudited consolidated pro forma results of operations based on the Company’s historical financial statements and adjusted for the acquisition of the Winterfell portfolio and related borrowings as if it occurred on January 1, 2015. The unaudited pro forma amounts were prepared for comparable purposes only and are not indicative of what actual consolidated results of operations of the Company would have been, nor are they indicative of the consolidated results of operations in the future and exclude transaction costs (dollars in thousands, except per share data):
Three Months Ended June 30, | Six Months Ended June 30, | |||||||||||||||
2016 | 2015 | 2016 | 2015 | |||||||||||||
Pro forma total revenues | $ | 68,301 | $ | 50,228 | $ | 136,030 | $ | 90,257 | ||||||||
Pro forma net income (loss) attributable to NorthStar Healthcare Income, Inc. common stockholders | (27,558 | ) | (21,927 | ) | (68,985 | ) | (47,968 | ) | ||||||||
Pro forma net income (loss) per share of common stock, basic/diluted | $ | (0.15 | ) | $ | (0.18 | ) | $ | (0.38 | ) | $ | (0.42 | ) | ||||
4. | Investments in Unconsolidated Ventures |
The following is a description of the Company’s investments in unconsolidated ventures, all of which are accounted for under the equity method. The Company evaluates whether disclosure of summarized financial statement information is required for any individually significant investment in unconsolidated ventures, refer to Summarized Financial Data below.
21
NORTHSTAR HEALTHCARE INCOME, INC. AND SUBSIDIARIES
NOTES TO CONSOLIDATED FINANCIAL STATEMENTS (Continued)
(Unaudited)
Eclipse Joint Venture
In May 2014, the Company, through a general partnership with NorthStar Realty (refer to Note 7), entered into a joint venture with an affiliate of Formation Capital, LLC (“Formation”) to acquire an interest in a $1.1 billion healthcare real estate portfolio comprised of over 8,500 units/beds across 44 ALFs and 36 SNFs, located primarily in Florida, Illinois, Oregon and Texas (“Eclipse”). The Company contributed $23.4 million for a 5.6% interest in the joint venture. As of June 30, 2016 and December 31, 2015, the carrying value of the Company’s investment was $16.7 million and $17.4 million, respectively, both of which include $1.3 million of capitalized acquisition costs. For the three and six months ended June 30, 2016, the Company recognized $0.2 million and $0.3 million in equity in earnings and received cash distributions of $0.5 million and $1.0 million, respectively. For the three and six months ended June 30, 2015, the Company recognized $0.2 million and $0.4 million in equity in earnings and received cash distributions of $0.6 million and $1.2 million, respectively.
Envoy Joint Venture
In June 2014, the Company made a subordinate interest investment of $5.0 million which was exchanged for an 11.4% limited partner interest in a joint venture (“Envoy”), with affiliates of Formation and Safanad Management Limited in September 2014. The joint venture owns a $145.0 million portfolio, subject to certain earn-out provisions, of 14 SNFs comprised of 1,658 beds and located in Virginia, Maryland and Pennsylvania. As of June 30, 2016 and December 31, 2015, the carrying value of the Company’s investment was $5.4 million and $5.7 million, respectively, both of which include $0.4 million of capitalized acquisition costs. For the three and six months ended June 30, 2016, the Company recognized $0.1 million in equity in earnings and $0.3 million in equity in losses, respectively, and received no cash distributions in either period. For the three and six months ended June 30, 2015, the Company recognized $0.1 million and $0.2 million in equity in earnings and received cash distributions of $0.2 million and $0.3 million, respectively.
Griffin-American Joint Venture
In December 2014, the Company, through a general partnership with NorthStar Realty (refer to Note 7), acquired an interest in Griffin-American Healthcare REIT II, Inc.’s (“Griffin-American”) healthcare real estate portfolio following completion of the merger of Griffin-American with and into a subsidiary of NorthStar Realty. In connection with the merger, the Company acquired a 14.3% interest in the joint venture for $187.2 million in cash, including a pro rata share of transaction costs. The Griffin-American portfolio includes 297 healthcare real estate properties located throughout the United States and in the United Kingdom, including 148 MOBs, 90 senior housing facilities, 45 SNFs and 14 hospitals.
As of June 30, 2016 and December 31, 2015, the carrying value of the Company’s investment was $166.4 million and $178.1 million, respectively, both of which include $13.4 million of capitalized acquisition costs. For the three and six months ended June 30, 2016, the Company recognized $3.3 million and $6.2 million in equity in losses and received cash distributions of $2.7 million and $5.6 million, respectively. For the three and six months ended June 30, 2015, the Company recognized $1.7 million and $5.7 million in equity in losses and received cash distributions of $3.9 million and $10.7 million, respectively.
Espresso Joint Venture
In July 2015, the Company, together with Formation and Safanad Management Limited, through a joint venture (“Espresso”) acquired the U.S. based operations of Extendicare International Inc. (“Extendicare”), including 152 SNFs and six ALFs located across 12 states, with the largest concentrations in Indiana, Kentucky, Ohio, Michigan and Wisconsin, for a total cost of $1.1 billion. The Company invested $55.0 million in cash for a 36.7% interest in the joint venture. In addition, the Company originated a $75.0 million mezzanine loan to a subsidiary of Espresso, which bears interest at a fixed rate of 10.0% per year and matures in January 2021.
As of June 30, 2016 and December 31, 2015, the carrying value of the Company’s investment, excluding the originated $75.0 million mezzanine loan, was $37.3 million and $41.9 million, respectively, both of which include $7.6 million of capitalized acquisition costs. For the three and six months ended June 30, 2016, the Company recognized $1.9 million and $1.4 million in equity in losses and received cash distributions of $1.5 million and $3.2 million, respectively.
Trilogy Joint Venture
In December 2015, the Company, together with Griffin-American Healthcare REIT III, Inc. (“GAHR3”), through a joint venture (“Trilogy”) acquired approximately 96.0% of the outstanding equity interests of Trilogy Investors, LLC (“Trilogy Investors”) for a total cost of $1.2 billion, while certain members of Trilogy Investors’ pre-closing management team retained approximately 4.0% of the outstanding equity interests. Trilogy Investors owns and/or leases 101 facilities, most of which are integrated senior healthcare
22
NORTHSTAR HEALTHCARE INCOME, INC. AND SUBSIDIARIES
NOTES TO CONSOLIDATED FINANCIAL STATEMENTS (Continued)
(Unaudited)
campuses offering a range of care, including assisted living, memory care, independent living and skilled nursing services, located across Indiana, Ohio, Kentucky and Michigan, as well as an ancillary pharmacy business and an ancillary therapy business that provide services to the facilities and third parties. The Company contributed $201.7 million for a 29.0% interest in Trilogy. In June 2016, in accordance with its obligation under the joint venture agreement, the Company funded an additional capital contribution of $18.8 million for a total contribution of $220.5 million. The additional funding related to certain business initiatives, including the acquisition of additional senior housing and skilled nursing facilities and repayment of certain outstanding obligations.
As of June 30, 2016 and December 31, 2015, the carrying value of the Company’s investment was $189.3 million and $195.7 million, respectively, both of which includes $7.7 million of capitalized acquisition costs. For the three and six months ended June 30, 2016, the Company recognized $12.5 million and $25.3 million in equity in losses and received no cash distributions, respectively.
Winterfell Joint Venture
In March 2016, the Company acquired NorthStar Realty’s 60.0% interest in the Winterfell JV (Refer to Note 3. “Operating Real Estate” for further discussion). As of December 31, 2015, the carrying value of the Company’s investment was $95.7 million.
Summarized Financial Data
The combined balance sheets as of June 30, 2016 and December 31, 2015 and combined statements of operations for the three and six months ended June 30, 2016 and 2015 for the Griffin-American and Trilogy unconsolidated ventures are as follows (dollars in thousands):
June 30, 2016 (Unaudited) | December 31, 2015 | Three Months Ended June 30, | Six Months Ended June 30, | |||||||||||||||||||||||
2016 | 2015 | 2016 | 2015 | |||||||||||||||||||||||
Assets | ||||||||||||||||||||||||||
Total assets | $ | 5,398,553 | $ | 5,436,757 | Total revenues | $ | 297,030 | $ | 98,255 | $ | 597,286 | $ | 196,204 | |||||||||||||
Liabilities and equity | Net income (loss) | $ | (62,895 | ) | $ | (15,136 | ) | $ | (124,146 | ) | $ | (41,022 | ) | |||||||||||||
Total Liabilities | $ | 3,692,580 | $ | 3,646,896 | ||||||||||||||||||||||
Equity | 1,705,973 | 1,789,861 | ||||||||||||||||||||||||
Total liabilities and equity | $ | 5,398,553 | $ | 5,436,757 | ||||||||||||||||||||||
5. | Real Estate Debt Investments |
The following table presents debt investments as of June 30, 2016 (dollars in thousands):
Weighted Average | Floating Rate as % of Principal Amount | ||||||||||||||||||||||||
Asset Type: | Count | Principal Amount | Carrying Value | Allocation by Investment Type(1) | Fixed Rate | Spread over LIBOR(2) | Total Unleveraged Current Yield | ||||||||||||||||||
First mortgage loan(3) | 1 | $ | 14,637 | $ | 14,637 | 7.6 | % | — | % | 8.3 | % | 8.6 | % | 100.0 | % | ||||||||||
Mezzanine loans | 3 | 178,834 | 178,367 | 92.4 | % | 10.0 | % | 10.2 | % | 10.3 | % | 58.1 | % | ||||||||||||
Total/Weighted Average | 4 | $ | 193,471 | $ | 193,004 | 100.0 | % | 10.0 | % | 9.9 | % | 10.2 | % | 61.2 | % | ||||||||||
__________________________________________________________
(1) | Based on principal amount. |
(2) | Includes a fixed minimum London Interbank Offered Rate (“LIBOR”) rate, as applicable. |
(3) | Subject to a 0.3% minimum LIBOR rate (“LIBOR floor”). |
23
NORTHSTAR HEALTHCARE INCOME, INC. AND SUBSIDIARIES
NOTES TO CONSOLIDATED FINANCIAL STATEMENTS (Continued)
(Unaudited)
The following table presents debt investments as of December 31, 2015 (dollars in thousands):
Weighted Average | Floating Rate as % of Principal Amount | ||||||||||||||||||||||||
Asset Type: | Count | Principal Amount | Carrying Value | Allocation by Investment Type(1) | Fixed Rate | Spread over LIBOR(2) | Total Unleveraged Current Yield | ||||||||||||||||||
First mortgage loan(3) | 1 | $ | 14,637 | $ | 14,637 | 7.6 | % | — | % | 8.3 | % | 8.4 | % | 100.0 | % | ||||||||||
Mezzanine loans | 3 | 178,774 | 178,297 | 92.4 | % | 10.0 | % | 10.2 | % | 10.3 | % | 58.0 | % | ||||||||||||
Total/Weighted Average | 4 | $ | 193,411 | $ | 192,934 | 100.0 | % | 10.0 | % | 9.9 | % | 10.2 | % | 61.2 | % | ||||||||||
__________________________________________________________
(1) | Based on principal amount. |
(2) | Includes a fixed minimum LIBOR rate, as applicable. |
(3) | Subject to a 0.3% minimum LIBOR floor. |
The following table presents maturities of debt investments based on principal amount as of June 30, 2016 (dollars in thousands):
Initial Maturity | Maturity Including Extensions(1) | ||||||
July 1 to December 31, 2016 | $ | 45,000 | $ | — | |||
Years Ending December 31: | |||||||
2017 | 73,471 | — | |||||
2018 | — | — | |||||
2019 | — | 118,471 | |||||
2020 | — | — | |||||
Thereafter | 75,000 | 75,000 | |||||
Total | $ | 193,471 | $ | 193,471 | |||
____________________________________________________________
(1) | Assumes that all debt with extension options will qualify for extension at such maturity according to the conditions set forth in the governing documents. |
As of June 30, 2016, the weighted average maturity, including extensions, of debt investments was 3.6 years.
Credit Quality Monitoring
Certain debt investments are secured by direct senior priority liens on real estate properties or by interests in entities that directly own real estate properties, which serve as the primary source of cash for the payment of principal and interest. The Company evaluates its debt investments at least quarterly and differentiates the relative credit quality principally based on: (i) whether the borrower is currently paying contractual debt service in accordance with its contractual terms; and (ii) whether the Company believes the borrower will be able to perform under its contractual terms in the future, as well as the Company’s expectations as to the ultimate recovery of principal at maturity. The Company categorizes a debt investment for which it expects to receive full payment of contractual principal and interest payments as “performing.” The Company will categorize a weaker credit quality debt investment that is currently performing, but for which it believes future collection of all or some portion of principal and interest is in doubt, into a category called “performing with a loan loss reserve.” The Company will categorize a weaker credit quality debt investment that is not performing, which the Company defines as a loan in maturity default and/or past due at least 90 days on its contractual debt service payments, as a non-performing loan (“NPL”). The Company’s definition of an NPL may differ from that of other companies that track NPLs.
As of June 30, 2016, all debt investments were performing in accordance with the contractual terms of their governing documents and were categorized as performing loans. For the six months ended June 30, 2016, three debt investments each contributed more than 10.0% of interest income. As of June 30, 2016, one borrower, Sava Senior Care represented 53.7% of the aggregate principal amount of the Company’s debt investments.
24
NORTHSTAR HEALTHCARE INCOME, INC. AND SUBSIDIARIES
NOTES TO CONSOLIDATED FINANCIAL STATEMENTS (Continued)
(Unaudited)
6. | Borrowings |
The following table presents borrowings as of June 30, 2016 and December 31, 2015 (dollars in thousands):
June 30, 2016 (Unaudited) | December 31, 2015 | ||||||||||||||||||||
Recourse vs. Non-Recourse | Final Maturity | Contractual Interest Rate(1) | Principal Amount(2) | Carrying Value(2) | Principal Amount(2) | Carrying Value(2) | |||||||||||||||
Mortgage notes payable, net | |||||||||||||||||||||
Peregrine Portfolio(3) | |||||||||||||||||||||
Various locations | Non-recourse | Dec-19 | LIBOR + 3.50% | $ | 24,000 | $ | 23,438 | $ | 24,000 | $ | 23,348 | ||||||||||
Watermark Aqua Portfolio | |||||||||||||||||||||
Denver, CO | Non-recourse | Feb-21 | LIBOR + 2.92% | 21,500 | 21,282 | 21,500 | 21,255 | ||||||||||||||
Frisco, TX | Non-recourse | Mar-21 | LIBOR + 3.04% | 20,000 | 19,807 | 20,000 | 19,783 | ||||||||||||||
Milford, OH(4) | Non-recourse | Dec-18 | LIBOR + 3.35% | 10,396 | 10,169 | 10,500 | 10,282 | ||||||||||||||
Arbors Portfolio(5) | |||||||||||||||||||||
Various locations | Non-recourse | Feb-25 | 3.99% | 93,750 | 91,851 | 93,750 | 91,712 | ||||||||||||||
Watermark Fountains Portfolio(6) | |||||||||||||||||||||
Various locations | Non-recourse | Jun-22 | 3.92% | 410,000 | 405,087 | 410,000 | 404,605 | ||||||||||||||
Winterfell Portfolio(7) | |||||||||||||||||||||
Various locations | Non-recourse | Jun-25 | 4.17% | 648,211 | 645,009 | — | — | ||||||||||||||
Total | $ | 1,227,857 | $ | 1,216,643 | $ | 579,750 | $ | 570,985 | |||||||||||||
_____________________________________________________
(1) | Floating rate borrowings are comprised of $41.5 million principal amount at one-month LIBOR and $34.4 million principal amount at three-month LIBOR, including $10.4 million subject to a LIBOR floor of 0.5%. |
(2) | The difference between principal amount and carrying value of mortgage notes payable is attributable to deferred financing costs, net. |
(3) | This mortgage note arrangement has a capacity of up to $30.0 million, subject to certain conditions, secured by four healthcare properties. As of June 30, 2016, the Company has funded approximately $7.0 million into a lender controlled reserve to comply with certain minimum financial coverage ratios, which will be released to the Company once certain conditions are satisfied. |
(4) | The initial maturity is December 2016, with two one-year extensions available at the Company’s option, which may be subject to the satisfaction of certain customary conditions set forth in the governing documents. |
(5) | Comprised of four mortgage notes payable with an aggregate amount of $93.8 million, secured by four healthcare real estate properties. |
(6) | Comprised of $410.0 million principal amount of fixed rate borrowings, secured by 15 healthcare real estate properties. |
(7) | Comprised of 32 individual mortgage notes payable that were assumed as part of the acquisition of the remaining 60.0% interest in the Winterfell portfolio on March 1, 2016. Refer to Note 3 for further discussion. |
The following table presents scheduled principal on borrowings based on final maturity as of June 30, 2016 (dollars in thousands):
July 1 to December 31, 2016 | $ | 128 | ||
Years Ending December 31: | ||||
2017 | 3,516 | |||
2018 | 20,948 | |||
2019 | 44,347 | |||
2020 | 22,378 | |||
Thereafter | 1,136,540 | |||
Total | $ | 1,227,857 | ||
As of June 30, 2016, the Company was in compliance with all of its financial covenants.
7. | Related Party Arrangements |
Advisor
Subject to certain restrictions and limitations, the Advisor is responsible for managing the Company’s affairs on a day-to-day basis and for identifying, acquiring, originating and asset managing investments on behalf of the Company. The Advisor may delegate certain of its obligations to affiliated entities, which may be organized under the laws of the United States or foreign jurisdictions.
25
NORTHSTAR HEALTHCARE INCOME, INC. AND SUBSIDIARIES
NOTES TO CONSOLIDATED FINANCIAL STATEMENTS (Continued)
(Unaudited)
References to the Advisor include the Advisor and any such affiliated entities. For such services, to the extent permitted by law and regulations, the Advisor receives fees and reimbursements from the Company. Below is a description and table of the fees and reimbursements incurred to the Advisor.
In June 2016, the advisory agreement was renewed for an additional one-year term commencing on June 30, 2016, with terms identical to those in effect through June 30, 2016.
Fees to Advisor
Asset Management Fee
The Advisor receives a monthly asset management fee equal to one-twelfth of 1.0% of the sum of the amount funded or allocated for investments, including expenses and any financing attributable to such investments, less any principal received on debt and securities investments (or the proportionate share thereof in the case of an investment made through a joint venture).
Incentive Fee
The Advisor is entitled to receive distributions equal to 15.0% of net cash flows of the Company, whether from continuing operations, repayment of loans, disposition of assets or otherwise, but only after stockholders have received, in the aggregate, cumulative distributions equal to their invested capital plus a 6.75% cumulative, non-compounded annual pre-tax return on such invested capital.
Acquisition Fee
The Advisor also receives fees for providing structuring, diligence, underwriting advice and related services in connection with real estate acquisitions equal to 2.25% of each real estate property acquired by the Company, including acquisition costs and any financing attributable to an equity investment (or the proportionate share thereof in the case of an indirect equity investment made through a joint venture or other investment vehicle) and 1.0% of the amount funded or allocated by the Company to acquire or originate debt investments, including acquisition costs and any financing attributable to such investments (or the proportionate share thereof in the case of an indirect investment made through a joint venture or other investment vehicle). An acquisition fee incurred related to an equity investment is generally expensed as incurred. A fee paid to the Advisor in connection with the acquisition of an equity or debt investment in an unconsolidated joint venture is generally included in investments in unconsolidated ventures on the consolidated balance sheets when the fair value option is not elected for the investment, but is expensed as incurred when the fair value option is elected. A fee paid to the Advisor in connection with the origination or acquisition of debt investments is included in debt investments, net on the consolidated balance sheets and is amortized to interest income over the life of the investment using the effective interest method.
Disposition Fee
For substantial assistance in connection with the sale of investments and based on the services provided, as determined by the Company’s independent directors, the Advisor receives a disposition fee of 2.0% of the contract sales price of each property sold and 1.0% of the contract sales price of each debt investment sold. The Company does not pay a disposition fee upon the maturity, prepayment, workout, modification or extension of a debt investment unless there is a corresponding fee paid by the borrower, in which case the disposition fee is the lesser of: (i) 1.0% of the principal amount of the debt investment prior to such transaction; or (ii) the amount of the fee paid by the borrower in connection with such transaction. If the Company takes ownership of a property as a result of a workout or foreclosure of a debt investment, the Company will pay a disposition fee upon the sale of such property. A disposition fee from the sale of an investment is generally expensed and included in asset management and other fees - related party in the Company’s consolidated statements of operations. A disposition fee for a debt investment incurred in a transaction other than a sale is included in debt investments, net on the consolidated balance sheets and is amortized to interest income over the life of the investment using the effective interest method.
26
NORTHSTAR HEALTHCARE INCOME, INC. AND SUBSIDIARIES
NOTES TO CONSOLIDATED FINANCIAL STATEMENTS (Continued)
(Unaudited)
Reimbursements to Advisor
Operating Costs
The Advisor is entitled to receive reimbursement for direct and indirect operating costs incurred by the Advisor in connection with administrative services provided to the Company. The Advisor allocates, in good faith, indirect costs to the Company related to the Advisor’s and its affiliates’ employees, occupancy and other general and administrative costs and expenses in accordance with the terms of, and subject to the limitations contained in, the advisory agreement with the Advisor. The indirect costs include the Company’s allocable share of the Advisor’s compensation and benefit costs associated with dedicated or partially dedicated personnel who spend all or a portion of their time managing the Company’s affairs, based upon the percentage of time devoted by such personnel to the Company’s affairs. The indirect costs also include rental and occupancy, technology, office supplies, travel and entertainment and other general and administrative costs and expenses. However, there is no reimbursement for personnel costs related to executive officers (although there may be reimbursement for certain executive officers of the Advisor) and other personnel involved in activities for which the Advisor receives an acquisition fee or a disposition fee. The Advisor allocates these costs to the Company relative to its and its affiliates’ other managed companies in good faith and has reviewed the allocation with the Company’s board of directors, including its independent directors. The Advisor updates the board of directors on a quarterly basis of any material changes to the expense allocation and provides a detailed review to the board of directors, at least annually, and as otherwise requested by the board of directors. The Company reimburses the Advisor quarterly for operating costs (including the asset management fee) based on a calculation for the four preceding fiscal quarters not to exceed the greater of: (i) 2.0% of its average invested assets; or (ii) 25.0% of its net income determined without reduction for any additions to reserves for depreciation, loan losses or other similar non-cash reserves and excluding any gain from the sale of assets for that period. Notwithstanding the above, the Company may reimburse the Advisor for expenses in excess of this limitation if a majority of the Company’s independent directors determines that such excess expenses are justified based on unusual and non-recurring factors. The Company calculates the expense reimbursement quarterly based upon the trailing twelve-month period.
Organization and Offering Costs
The Advisor was entitled to receive reimbursement for organization and offering costs paid on behalf of the Company in connection with the Offering. The Company was obligated to reimburse the Advisor, as applicable, for organization and offering costs to the extent the aggregate of selling commissions, dealer manager fees and other organization and offering costs did not exceed 15% of gross proceeds from the Primary Offering. The Advisor did not expect reimbursable organization and offering costs, including costs incurred in connection with the Follow-on Offering but excluding selling commissions and dealer manager fees, to exceed $22.5 million, or 1.5% of the total proceeds available to be raised from the Primary Offering. Based on gross proceeds of $1.7 billion from the Primary Offering, the Company incurred reimbursable organizational and offering costs, excluding selling commissions and dealer manager fees, of 1.0%, which was less than the 1.5% expected. The Company’s independent directors did not determine that any of the organization and offering costs were unfair and commercially unreasonable.
Dealer Manager
Selling Commissions and Dealer Manager Fees
Pursuant to a dealer manager agreement, the Company paid the Dealer Manager selling commissions of up to 7.0% of gross proceeds from the Primary Offering, all of which were reallowed to participating broker-dealers. In addition, the Company paid the Dealer Manager a dealer manager fee of up to 3.0% of gross proceeds from the Primary Offering, a portion of which was typically reallowed to participating broker-dealers and paid to certain employees of the Dealer Manager. No selling commissions or dealer manager fees are paid for sales pursuant to the DRP.
27
NORTHSTAR HEALTHCARE INCOME, INC. AND SUBSIDIARIES
NOTES TO CONSOLIDATED FINANCIAL STATEMENTS (Continued)
(Unaudited)
Summary of Fees and Reimbursements
The following table presents the fees and reimbursements incurred to the Advisor and the Dealer Manager for the three and six months ended June 30, 2016 and 2015 and the amount due to related party as of June 30, 2016 and December 31, 2015 (dollars in thousands):
Three Months Ended June 30, | Six Months Ended June 30, | Due to Related Party as of | ||||||||||||||||||||||||
Type of Fee or Reimbursement | Financial Statement Location | 2016 | 2015 | 2016 | 2015 | June 30, 2016 (Unaudited) | December 31, 2015 | |||||||||||||||||||
Fees to Advisor | ||||||||||||||||||||||||||
Asset management | Asset management and other fees-related party | $ | 8,367 | $ | 3,651 | $ | 15,832 | $ | 6,360 | $ | 15 | $ | 22 | |||||||||||||
Acquisition(1) | Real estate debt investments, net / investments in unconsolidated ventures / asset management and other fees-related party | 85 | 22,216 | 12,248 | 22,202 | 34 | 378 | |||||||||||||||||||
Disposition(1) | Real estate debt investments, net | — | — | — | — | — | — | |||||||||||||||||||
Reimbursements to Advisor | ||||||||||||||||||||||||||
Operating costs(2) | General and administrative expenses | 8,371 | 4,001 | 15,836 | 6,709 | 7 | 4 | |||||||||||||||||||
Organization | General and administrative expenses | — | 57 | — | 63 | — | — | |||||||||||||||||||
Offering | Cost of capital(3) | 23 | 1,867 | 447 | 2,552 | — | 39 | |||||||||||||||||||
Selling commissions / Dealer manager fees | Cost of capital(3) | — | 12,706 | 83 | 25,092 | — | — | |||||||||||||||||||
Total | $ | 56 | $ | 443 | ||||||||||||||||||||||
____________________________________
(1) | Acquisition/disposition fees incurred to the Advisor related to debt investments are generally offset by origination/exit fees paid to the Company by borrowers if such fees are required from the borrower. Acquisition fees related to equity investments are included in asset management and other fees-related party in the consolidated statements of operations. Acquisition fees related to investments in unconsolidated joint ventures are included in investments in unconsolidated ventures on the consolidated balance sheets. The Advisor may determine to defer fees or seek reimbursements. |
(2) | As of June 30, 2016, the Advisor has incurred unreimbursed operating costs on behalf of the Company of $0.8 million, which remain eligible to be allocated to the Company. |
(3) | Cost of capital is included in net proceeds from issuance of common stock in the Company’s consolidated statements of equity. |
NorthStar Realty Purchase of Common Stock
In January 2015, the board of directors of the Company approved an amended and restated distribution support agreement (the “Distribution Support Agreement”) extending the term until February 6, 2017. Pursuant to the Distribution Support Agreement, NorthStar Realty committed to purchase up to an aggregate of $10.0 million in shares of the Company’s common stock at a price of $9.00 per share during the Initial Offering and at $9.18 per share during the Follow-on Offering, if cash distributions exceed modified funds from operations (as computed in accordance with the definition established by the Investment Program Association and adjusted for certain items) to provide additional funds to support distributions to stockholders. In February 2013, NorthStar Realty purchased 222,223 shares of the Company’s common stock for $2.0 million under the Distribution Support Agreement to satisfy the minimum offering requirement, which reduced the total commitment. As of June 30, 2016, including the purchase of shares to satisfy the minimum offering requirement, NorthStar Realty purchased 588,116 shares of the Company’s common stock for $5.3 million. As the Follow-on Offering has now been completed, NorthStar Realty has no further obligation to purchase shares under the Distribution Support Agreement.
28
NORTHSTAR HEALTHCARE INCOME, INC. AND SUBSIDIARIES
NOTES TO CONSOLIDATED FINANCIAL STATEMENTS (Continued)
(Unaudited)
Investments in Joint Ventures
In May 2014, the Company, through a general partnership with NorthStar Realty, acquired a 5.6% interest in the Eclipse portfolio, a $1.1 billion healthcare portfolio, and contributed $23.4 million of cash for its interest in the investment. The purchase was approved by the Company’s board of directors, including all of its independent directors.
In December 2014, the Company, through a general partnership with NorthStar Realty, acquired a 14.3% interest in the Griffin-American portfolio for $187.2 million in cash, including the Company’s pro rata share of transaction costs. The purchase was approved by the Company’s board of directors, including all of its independent directors.
In connection with the acquisition of the Griffin-American portfolio by NorthStar Realty and the Company, the Sponsor acquired a 43.0%, as adjusted, ownership interest in American Healthcare Investors, LLC (“AHI”) and Mr. James F. Flaherty III, a strategic partner of the Sponsor, acquired a 12.3% ownership interest in AHI. AHI is a healthcare-focused real estate investment management firm that co-sponsored and advised Griffin-American, until Griffin-American was acquired by the Company and NorthStar Realty. In connection with the Sponsor’s acquisition of an interest in AHI, AHI provides certain asset management and related services, including property management, to the Advisor, NorthStar Realty and the Company. AHI currently provides such services to the Company with respect to its interest in the Griffin-American portfolio and the Winterfell portfolio. Following the substantial investment of the Company’s Offering proceeds, AHI will provide such services for all of the Company’s assets other than joint ventures with Formation. Consequently, AHI assists the Advisor in managing the Griffin-American and Winterfell portfolios and will assist with other healthcare assets owned by the Company in the future.
In December 2015, the Company, through a joint venture with GAHR3, a REIT sponsored and advised by AHI, acquired a 29% interest in the Trilogy portfolio, a $1.2 billion healthcare portfolio and contributed $201.7 million for its interest. The purchase was approved by the Company’s board of directors, including all of its independent directors. In June 2016, in accordance with its obligation under the joint venture agreement, the Company funded an additional capital contribution of $18.8 million for a total contribution of $220.5 million. The additional funding related to certain business initiatives, including the acquisition of additional senior housing and skilled nursing facilities and repayment of certain outstanding obligations.
In March 2016, the Company acquired NorthStar Realty’s 60.0% interest in the Winterfell JV, which owns the Winterfell portfolio, for a purchase price of $534.5 million, excluding escrows and subject to customary proration and adjustments. The transaction was approved by the Company’s board of directors, including all of its independent directors, and validated by an independent third-party appraisal for the Winterfell portfolio. The Company originally acquired a 40.0% equity interest in the Winterfell JV in May 2015. The Company accordingly now owns 100.0% of the equity in the Winterfell portfolio as of March 2016 and consolidates the portfolio. Prior to March 2016, the Company accounted for its equity investment in the Winterfell JV as an unconsolidated venture under the equity method. For the three months ended March 31, 2016, the Company recognized $1.4 million in equity in earnings and received $0.6 million cash distributions.
Origination of Mezzanine Loan
In July 2015, the Company originated a $75.0 million mezzanine loan to a subsidiary of Espresso, which bears interest at a fixed rate of 10.0% per year and matures in January 2021.
8. | Equity-Based Compensation |
The Company adopted a long-term incentive plan, as amended (the “Plan”), which it may use to attract and retain qualified officers, directors, employees and consultants, as well as an independent directors compensation plan, which is a component of the Plan. Pursuant to the Plan, as of June 30, 2016, the Company’s independent directors were granted a total of 55,670 shares of restricted common stock for an aggregate $540,000, based on the share price on the date of each grant. The restricted stock granted prior to 2015 generally vests quarterly over four years and the restricted stock granted in and subsequent to 2015 generally vests quarterly over two years. However, the stock will become fully vested on the earlier occurrence of: (i) the termination of the independent director’s service as a director due to his or her death or disability; or (ii) a change in control of the Company.
The Company recognized equity-based compensation expense of $34,749 and $18,834 for the three months ended June 30, 2016 and 2015, and $68,499 and $48,133 for the six months ended June 30, 2016 and 2015, respectively, related to the issuance of restricted stock to the independent directors, which was recorded in general and administrative expenses in the consolidated statements of operations. Unvested shares totaled 29,163 and 21,950 as of June 30, 2016 and December 31, 2015, respectively.
29
NORTHSTAR HEALTHCARE INCOME, INC. AND SUBSIDIARIES
NOTES TO CONSOLIDATED FINANCIAL STATEMENTS (Continued)
(Unaudited)
9. | Stockholders’ Equity |
Common Stock
The Company stopped accepting subscriptions for the Follow-on Offering on December 17, 2015 and all of the shares initially registered for the Follow-on Offering were issued on or before January 19, 2016. For the six months ended June 30, 2016, the Company issued 0.1 million shares of common stock generating gross proceeds of $0.8 million. For the six months ended June 30, 2015, the Company issued 25.9 million shares of common stock generating gross proceeds of $260.3 million. From inception through June 30, 2016, the Company issued 173.4 million shares of common stock generating gross proceeds of $1.7 billion in the Primary Offering.
Distribution Reinvestment Plan
The Company adopted a DRP through which common stockholders may elect to reinvest an amount equal to the distributions declared on their shares in additional shares of the Company’s common stock in lieu of receiving cash distributions. In December 2015, the Company registered an additional 30.0 million shares to be offered pursuant to the DRP and continues to offer such shares.
In April 2016, the DRP was amended and restated to provide that, effective on ten days’ notice, the price per share purchased pursuant to the DRP was $8.63, which is equal to the estimated value per share of the Company’s common stock as of December 31, 2015, until such time as the Company establishes a new estimated per share value, at which time the purchase price will adjust to 100% of such estimated value per share. The Company expects that the next estimated value per share will be based upon assets and liabilities as of December 31, 2016. Prior to this amendment, the purchase price per share pursuant to the Initial DRP and the Follow-on DRP was $9.50 and $9.69, respectively.
No selling commissions or dealer manager fees are paid on shares issued pursuant to the DRP. The board of directors of the Company may amend, suspend or terminate the DRP for any reason upon ten-days’ notice to participants, except that the Company may not amend the DRP to eliminate a participant’s ability to withdraw from the DRP.
For the six months ended June 30, 2016, the Company issued 3.6 million shares of common stock totaling $33.7 million of gross offering proceeds pursuant to the DRP. For the year ended December 31, 2015, the Company issued 4.8 million shares of common stock totaling $46.4 million of gross offering proceeds pursuant to the DRP. From inception through June 30, 2016, the Company issued 9.8 million shares of common stock, generating gross offering proceeds of $92.8 million pursuant to the DRP.
Distributions
Distributions to stockholders are declared quarterly by the board of directors of the Company and are paid monthly based on a daily amount of $0.00184426 per share, which is equivalent to an annualized distribution amount of $0.675 per share of the Company’s common stock. Distributions are generally paid to stockholders on the first business day of the month following the month for which the distribution has accrued.
The following table presents distributions declared for the six months ended June 30, 2016 (dollars in thousands):
Distributions(1) | ||||||||||||
Period | Cash | DRP | Total | |||||||||
January | $ | 4,538 | $ | 5,735 | $ | 10,273 | ||||||
February | 4,258 | 5,375 | 9,633 | |||||||||
March | 4,612 | 5,717 | 10,329 | |||||||||
April | 4,466 | 5,562 | 10,028 | |||||||||
May | 4,619 | 5,762 | 10,381 | |||||||||
June | 4,495 | 5,591 | 10,086 | |||||||||
Total | $ | 26,988 | $ | 33,742 | $ | 60,730 | ||||||
_________________________________________________
(1) | Represents distributions declared for the period, even though such distributions are actually paid to stockholders the month following such period. |
30
NORTHSTAR HEALTHCARE INCOME, INC. AND SUBSIDIARIES
NOTES TO CONSOLIDATED FINANCIAL STATEMENTS (Continued)
(Unaudited)
Share Repurchase Program
The Company adopted a share repurchase program that may enable stockholders to sell their shares to the Company in limited circumstances (the “Share Repurchase Program”). The Company may not repurchase shares unless a stockholder has held shares for one year. However, the Company may repurchase shares held less than one year in connection with a stockholder’s death or qualifying disability. The Company is not obligated to repurchase shares under the Share Repurchase Program. The Company may amend, suspend or terminate the Share Repurchase Program at its discretion at any time, subject to certain notice requirements. For the six months ended June 30, 2016, the Company repurchased 550,981 shares of common stock for $5.2 million at an average price of $9.51 per share. For the year ended December 31, 2015, the Company repurchased 406,544 shares of common stock for a $3.9 million at an average price of $9.66 per share pursuant to the Share Repurchase Program. The Company funds repurchase requests received during a quarter with proceeds set aside for that purpose which are not expected to exceed proceeds received from its DRP. As of June 30, 2016, there were no unfulfilled repurchase requests.
10. | Non-controlling Interests |
Operating Partnership
Non-controlling interests include the aggregate limited partnership interests in the Operating Partnership held by limited partners, other than the Company. Income (loss) attributable to the non-controlling interests is based on the limited partners’ ownership percentage of the Operating Partnership. Income (loss) allocated to the Operating Partnership non-controlling interests for the three and six months ended June 30, 2016 and 2015 was de minimis.
Other
Other non-controlling interests represent third-party equity interests in ventures that are consolidated with the Company’s financial statements. Net income (loss) attributable to the other non-controlling interests was de minimis and a $0.1 million loss for the three and six months ended June 30, 2016, respectively, and a $0.2 million loss for both the three and six months ended June 30, 2015.
11. | Fair Value |
Fair Value Measurement
The fair value of financial instruments is categorized based on the priority of the inputs to the valuation technique and categorized into a three-level fair value hierarchy. The fair value hierarchy gives the highest priority to quoted prices in active markets for identical assets or liabilities (Level 1) and the lowest priority to unobservable inputs (Level 3). If the inputs used to measure the financial instruments fall within different levels of the hierarchy, the categorization is based on the lowest level input that is significant to the fair value measurement of the instrument.
Financial assets and liabilities recorded at fair value on the consolidated balance sheets are categorized based on the inputs to the valuation techniques as follows:
Level 1. | Quoted prices for identical assets or liabilities in an active market. |
Level 2. | Financial assets and liabilities whose values are based on the following: |
a) | Quoted prices for similar assets or liabilities in active markets. |
b) | Quoted prices for identical or similar assets or liabilities in non-active markets. |
c) | Pricing models whose inputs are observable for substantially the full term of the asset or liability. |
d) | Pricing models whose inputs are derived principally from or corroborated by observable market data for substantially the full term of the asset or liability. |
Level 3. | Prices or valuation techniques based on inputs that are both unobservable and significant to the overall fair value measurement. |
31
NORTHSTAR HEALTHCARE INCOME, INC. AND SUBSIDIARIES
NOTES TO CONSOLIDATED FINANCIAL STATEMENTS (Continued)
(Unaudited)
Fair Value of Financial Instruments
U.S. GAAP requires disclosure of fair value about all financial instruments. The following disclosure of estimated fair value of financial instruments was determined by the Company using available market information and appropriate valuation methodologies. Considerable judgment is necessary to interpret market data and develop estimated fair value. Accordingly, the estimates presented herein are not necessarily indicative of the amounts the Company could realize on disposition of the financial instruments. The use of different market assumptions and/or estimation methodologies may have a material effect on estimated fair value.
The following table presents the principal amount, carrying value and fair value of certain financial assets and liabilities as of June 30, 2016 and December 31, 2015 (dollars in thousands):
June 30, 2016 (Unaudited) | December 31, 2015 | ||||||||||||||||||||||
Principal Amount | Carrying Value | Fair Value | Principal Amount | Carrying Value | Fair Value | ||||||||||||||||||
Financial assets:(1) | |||||||||||||||||||||||
Real estate debt investments, net | $ | 193,471 | $ | 193,004 | $ | 197,911 | $ | 193,411 | $ | 192,934 | $ | 194,277 | |||||||||||
Financial liabilities:(1) | |||||||||||||||||||||||
Mortgage notes payable, net | $ | 1,227,857 | $ | 1,216,643 | $ | 1,194,494 | $ | 579,750 | $ | 570,985 | $ | 576,106 | |||||||||||
_____________________________
(1) | The fair value of other financial instruments not included in this table is estimated to approximate their carrying value. |
Disclosure about fair value of financial instruments is based on pertinent information available to management as of the reporting date. Although management is not aware of any factors that would significantly affect fair value, such amounts have not been comprehensively revalued for purposes of these consolidated financial statements since that date and current estimates of fair value may differ significantly from the amounts presented herein.
Real Estate Debt Investments
For debt investments, fair value was approximated by comparing the current yield to the estimated yield for newly originated loans with similar credit risk or the market yield at which a third party might expect to purchase such investment. Fair value was determined assuming fully-extended maturities regardless of structural or economic tests required to achieve such extended maturities. These fair value measurements of debt are generally based on unobservable inputs and, as such, are classified as Level 3 of the fair value hierarchy.
Mortgage Notes Payable, Net
For mortgage notes payable, the Company primarily uses rates currently available with similar terms and remaining maturities to estimate fair value. These measurements are determined using comparable U.S. Treasury rates as of the end of the reporting period. These fair value measurements are based on observable inputs, and as such, are classified as Level 2 of the fair value hierarchy.
12. Segment Reporting
The Company conducts its business through the following four segments, which are based on how management reviews and manages its business:
• | Real Estate Equity - Focused on equity investments, directly or through joint ventures, with a focus on properties in the mid-acuity senior housing sector, which the Company defines as ALF, MCF, SNF, ILF and CCRC. The Company’s equity investments may also include MOB, hospitals, rehabilitation facilities and ancillary healthcare services businesses. The Company’s investments are predominantly in the United States, but it also selectively makes international investments. The Company’s healthcare properties generally operate under net leases or through management agreements with independent third-party operators. |
• | Real Estate Debt - Focused on originating, acquiring and asset managing healthcare-related debt investments and may include first mortgage loans, subordinate interests and mezzanine loans and participations in such loans, as well as preferred equity interests. |
• | Healthcare-Related Securities - Focused on investing in and asset managing healthcare-related securities primarily consisting of commercial mortgage-backed securities and other securities backed primarily by loans secured by healthcare properties. |
32
NORTHSTAR HEALTHCARE INCOME, INC. AND SUBSIDIARIES
NOTES TO CONSOLIDATED FINANCIAL STATEMENTS (Continued)
(Unaudited)
• | Corporate - The corporate segment includes corporate level asset management and other fees - related party and general and administrative expenses. |
The Company primarily generates rental and resident fee income from real estate equity investments and interest income on the real estate debt investments. As of June 30, 2016, the Company did not own any real estate securities. For the six months ended June 30, 2016, gross revenues from two of the Company’s operators, Watermark Retirement Communities and Holiday Retirement Communities were 52.5% and 33.8%, respectively, of total revenues. The following tables present segment reporting for the three and six months ended June 30, 2016, and 2015 (dollars in thousands):
Statement of Operations: | ||||||||||||||||
Three Months Ended June 30, 2016 | Real Estate Equity | Real Estate Debt | Corporate(1) | Total | ||||||||||||
Rental and resident fee income | $ | 62,830 | $ | — | $ | — | $ | 62,830 | ||||||||
Interest income | — | 5,005 | — | 5,005 | ||||||||||||
Other revenue | 194 | — | — | 194 | ||||||||||||
Property operating expenses | (34,982 | ) | — | — | (34,982 | ) | ||||||||||
Interest expense | (13,044 | ) | — | — | (13,044 | ) | ||||||||||
Transaction costs | (249 | ) | — | — | (249 | ) | ||||||||||
Asset management and other fees - related party | — | — | (8,452 | ) | (8,452 | ) | ||||||||||
General and administrative expenses | (247 | ) | (25 | ) | (8,450 | ) | (8,722 | ) | ||||||||
Depreciation and amortization | (13,429 | ) | — | — | (13,429 | ) | ||||||||||
Realized gain (loss) on investments and other | 411 | — | — | 411 | ||||||||||||
Income (loss) before equity in earnings (losses) of unconsolidated ventures and income tax benefit (expense) | 1,484 | 4,980 | (16,902 | ) | (10,438 | ) | ||||||||||
Equity in earnings (losses) of unconsolidated ventures | (17,432 | ) | — | — | (17,432 | ) | ||||||||||
Income tax benefit (expense) | (33 | ) | — | — | (33 | ) | ||||||||||
Net income (loss) | $ | (15,981 | ) | $ | 4,980 | $ | (16,902 | ) | $ | (27,903 | ) | |||||
_________________________________________________
(1) | Includes unallocated asset management fee-related party and general and administrative expenses. |
Statement of Operations: | ||||||||||||||||
Three Months Ended June 30, 2015 | Real Estate Equity | Real Estate Debt | Corporate(1) | Total | ||||||||||||
Rental and resident fee income | $ | 17,872 | $ | — | $ | — | $ | 17,872 | ||||||||
Interest income | — | 3,648 | — | 3,648 | ||||||||||||
Property operating expenses | (8,739 | ) | — | — | (8,739 | ) | ||||||||||
Interest expense | (3,229 | ) | — | (202 | ) | (3,431 | ) | |||||||||
Transaction costs | (3,127 | ) | — | — | (3,127 | ) | ||||||||||
Asset management and other fees - related party | — | — | (17,829 | ) | (17,829 | ) | ||||||||||
General and administrative expenses | (36 | ) | (19 | ) | (4,169 | ) | (4,224 | ) | ||||||||
Depreciation and amortization | (4,697 | ) | — | — | (4,697 | ) | ||||||||||
Income (loss) before equity in earnings (losses) of unconsolidated ventures and income tax benefit (expense) | (1,956 | ) | 3,629 | (22,200 | ) | (20,527 | ) | |||||||||
Equity in earnings (losses) of unconsolidated ventures | (5,351 | ) | — | — | (5,351 | ) | ||||||||||
Income tax benefit (expense) | 208 | — | — | 208 | ||||||||||||
Net income (loss) | $ | (7,099 | ) | $ | 3,629 | $ | (22,200 | ) | $ | (25,670 | ) | |||||
_________________________________________________
(1) | Includes unallocated asset management fee-related party and general and administrative expenses. |
33
NORTHSTAR HEALTHCARE INCOME, INC. AND SUBSIDIARIES
NOTES TO CONSOLIDATED FINANCIAL STATEMENTS (Continued)
(Unaudited)
Statement of Operations: | ||||||||||||||||
Six Months Ended June 30, 2016 | Real Estate Equity | Real Estate Debt | Corporate(1) | Total | ||||||||||||
Rental and resident fee income | $ | 106,306 | $ | — | $ | — | $ | 106,306 | ||||||||
Interest income | — | 10,040 | — | 10,040 | ||||||||||||
Other revenue | 469 | — | — | 469 | ||||||||||||
Property operating expenses | (58,379 | ) | — | — | (58,379 | ) | ||||||||||
Interest expense | (21,527 | ) | — | — | (21,527 | ) | ||||||||||
Transaction costs | (1,531 | ) | — | — | (1,531 | ) | ||||||||||
Asset management and other fees - related party | — | — | (28,080 | ) | (28,080 | ) | ||||||||||
General and administrative expenses | (505 | ) | (49 | ) | (16,004 | ) | (16,558 | ) | ||||||||
Depreciation and amortization | (25,252 | ) | — | — | (25,252 | ) | ||||||||||
Realized gain (loss) on investments and other | 411 | — | — | 411 | ||||||||||||
Gain (loss) on consolidation of unconsolidated venture | 6,408 | — | — | 6,408 | ||||||||||||
Income (loss) before equity in earnings (losses) of unconsolidated ventures and income tax benefit (expense) | 6,400 | 9,991 | (44,084 | ) | (27,693 | ) | ||||||||||
Equity in earnings (losses) of unconsolidated ventures | (31,469 | ) | — | — | (31,469 | ) | ||||||||||
Income tax benefit (expense) | (7,124 | ) | — | — | (7,124 | ) | ||||||||||
Net income (loss) | $ | (32,193 | ) | $ | 9,991 | $ | (44,084 | ) | $ | (66,286 | ) | |||||
(1) | Includes unallocated asset management fee-related party and general and administrative expenses. |
Statement of Operations: | ||||||||||||||||
Six Months Ended June 30, 2015 | Real Estate Equity | Real Estate Debt | Corporate(1) | Total | ||||||||||||
Rental and resident fee income | $ | 25,627 | $ | — | $ | — | $ | 25,627 | ||||||||
Interest income | — | 7,208 | — | 7,208 | ||||||||||||
Property operating expenses | (11,486 | ) | — | — | (11,486 | ) | ||||||||||
Interest expense | (4,677 | ) | — | (401 | ) | (5,078 | ) | |||||||||
Transaction costs | (4,542 | ) | — | — | (4,542 | ) | ||||||||||
Asset management and other fees - related party | — | — | (20,543 | ) | (20,543 | ) | ||||||||||
General and administrative expenses | (50 | ) | (39 | ) | (7,012 | ) | (7,101 | ) | ||||||||
Depreciation and amortization | (6,382 | ) | — | — | (6,382 | ) | ||||||||||
Income (loss) before equity in earnings (losses) of unconsolidated ventures and income tax benefit (expense) | (1,510 | ) | 7,169 | (27,956 | ) | (22,297 | ) | |||||||||
Equity in earnings (losses) of unconsolidated ventures | (8,941 | ) | — | — | (8,941 | ) | ||||||||||
Income tax benefit (expense) | 553 | — | — | 553 | ||||||||||||
Net income (loss) | $ | (9,898 | ) | $ | 7,169 | $ | (27,956 | ) | $ | (30,685 | ) | |||||
_________________________________________________
(1) | Includes unallocated asset management fee-related party and general and administrative expenses. |
The following table presents total assets by segment as of June 30, 2016 and December 31, 2015 (dollars in thousands):
Balance Sheets: | Real Estate Equity | Real Estate Debt | Corporate(1) | Total | ||||||||||||
June 30, 2016 (Unaudited): | ||||||||||||||||
Total Assets | $ | 2,240,747 | $ | 194,508 | $ | 128,110 | $ | 2,563,365 | ||||||||
December 31, 2015: | ||||||||||||||||
Total Assets | $ | 1,460,392 | $ | 194,451 | $ | 347,385 | $ | 2,002,228 | ||||||||
_________________________________________________
(1) | Primarily includes unrestricted cash balances. |
34
NORTHSTAR HEALTHCARE INCOME, INC. AND SUBSIDIARIES
NOTES TO CONSOLIDATED FINANCIAL STATEMENTS (Continued)
(Unaudited)
13. | Subsequent Events |
Distribution Reinvestment Plan
For the period from July 1, 2016 through August 5, 2016, the Company issued 1.3 million shares pursuant to the DRP, representing gross proceeds of $11.4 million.
Distributions
On August 10, 2016, the board of directors of the Company approved a daily cash distribution of $0.001844262 per share of common stock for each of the three months ended December 31, 2016. Distributions are generally paid to stockholders on the first business day of the month following the month for which the distribution was accrued.
Share Repurchases
From July 1, 2016 through August 5, 2016, the Company repurchased 0.5 million shares for a total of $4.7 million or a weighted average price of $8.94 per share under the Share Repurchase Program that enables stockholders to sell their shares to the Company in certain circumstances, including death or a qualifying disability. The Company funds repurchase requests received during a quarter with proceeds set aside for that purpose which are not expected to exceed proceeds received from its DRP.
35
Item 2. Management’s Discussion and Analysis of Financial Condition and Results of Operations
The following discussion should be read in conjunction with our consolidated financial statements and notes thereto included in Item 1. “Financial Statements” of this report. References to “we,” “us” or “our” refer to NorthStar Healthcare Income, Inc. and its subsidiaries unless the context specifically requires otherwise.
Introduction
We were formed to acquire, originate and asset manage a diversified portfolio of equity, debt and securities investments in healthcare real estate, directly or through joint ventures, with a focus on the mid-acuity senior housing sector, which we define as assisted living, or ALF, memory care, or MCF, skilled nursing, or SNF, independent living, or ILF, facilities and continuing care retirement communities, or CCRC, which may have independent living, assisted living, skilled nursing and memory care available on one campus. We also invest in other healthcare property types, including medical office buildings, or MOB, hospitals, rehabilitation facilities and ancillary healthcare services businesses. Our investments are predominantly in the United States, but we also selectively make international investments. We were formed in October 2010 as a Maryland corporation and commenced operations in February 2013. We elected to be taxed as a real estate investment trust, or REIT, under the Internal Revenue Code of 1986, as amended, or the Internal Revenue Code, commencing with the taxable year ended December 31, 2013. We conduct our operations so as to continue to qualify as a REIT for U.S. federal income tax purposes.
Our equity investments are generally healthcare properties, which are either structured as net leases to healthcare operators or operated through management agreements with independent third-party operators, where applicable through the REIT Investment Diversification and Empowerment Act of 2007, or RIDEA, structures that permit us, through taxable REIT subsidiaries, or TRS, to have direct exposure to resident fee income and incur related operating expenses. Our debt investments consist of first mortgage loans and mezzanine loans. As of June 30, 2016, we did not own any securities investments.
We are externally managed and have no employees. Prior to June 30, 2014, we were managed by an affiliate of NorthStar Realty Finance Corp. (NYSE: NRF), or NorthStar Realty. Effective June 30, 2014, NorthStar Realty spun-off its asset management business into a separate publicly traded company, NorthStar Asset Management Group Inc. (NYSE: NSAM), or our Sponsor. Our Sponsor and its affiliates provide asset management and other services to us, NorthStar Realty, NorthStar Realty Europe Corp. (NYSE: NRE), other sponsored public retail-focused companies and any other companies our Sponsor and its affiliates may manage in the future, or collectively the NSAM Managed Companies, both in the United States and internationally. As of June 30, 2016, NSAM had an aggregate of $40.0 billion of assets under management, adjusted for commitments to acquire or sell certain investments by NSAM and the NSAM Managed Companies. Concurrent with the spin-off, affiliates of our Sponsor entered into a new advisory agreement with us and each of the other NSAM Managed Companies. Pursuant to our advisory agreement, NSAM J-NSHC Ltd, an affiliate of our Sponsor, or our Advisor, agreed to manage our day-to-day operations on terms substantially similar to those set forth in our prior advisory agreement with NorthStar Healthcare Income Advisor, LLC, or our Prior Advisor. References to our Prior Advisor herein refer to the services performed by and fees paid and accrued to our Prior Advisor during the period prior to June 30, 2014. The spin-off of NorthStar Realty’s asset management business had no impact on our operations.
In June 2016, our Sponsor announced that it entered into a definitive merger agreement with NorthStar Realty and Colony Capital, Inc., or Colony, providing for the combination of our Sponsor, NorthStar Realty and Colony into a wholly-owned subsidiary of our Sponsor, as the surviving publicly-traded company for the combined organization that, upon and following the effective time of the mergers, will be named Colony NorthStar, Inc., or Colony NorthStar. As a result of the mergers, Colony NorthStar will be an internally-managed equity REIT, with a diversified real estate and investment management platform. In addition, following the mergers, our Advisor will be a subsidiary of Colony NorthStar. This transaction is expected to close in January 2017, subject to customary closing conditions, including regulatory approvals, and approval by our Sponsor’s, NorthStar Realty’s and Colony’s respective shareholders. There is no guarantee this transaction will close on the contemplated terms or within the anticipated timeframe, or at all. We do not expect that this transaction will have a material impact on our operations.
Our primary investment types are as follows:
• | Real Estate Equity - Our equity investments, directly or through joint ventures, focus on properties in the mid-acuity senior housing sector, which we define as ALF, MCF, SNF, ILF and CCRC. Our equity investments may also include MOB, hospitals, rehabilitation facilities and ancillary healthcare services businesses. Our investments are predominantly in the United States, but we also selectively make international investments. Our healthcare properties generally operate under net leases or through management agreements with independent third-party operators. |
• | Real Estate Debt - Our debt investment business focuses on originating, acquiring and asset managing healthcare-related debt investments and may include first mortgage loans, subordinate interests and mezzanine loans and participations in such loans, as well as preferred equity interests. |
36
• | Healthcare-Related Securities - Our securities investments may include commercial mortgage-backed securities, or CMBS, and other securities backed primarily by loans secured by healthcare properties. |
We believe that our targeted investment types are complementary to each other due to overlapping sources of investment opportunities, common reliance on real estate fundamentals and ability to apply similar portfolio management and servicing skills to maximize value and to protect capital.
We initially registered to offer up to 100.0 million shares pursuant to our primary offering to the public, or our Initial Primary Offering, and up to 10.5 million shares pursuant to our distribution reinvestment plan, or our Initial DRP, which are herein collectively referred to as our Initial Offering. Our Initial Offering (including 8.6 million shares reallocated from our Initial DRP) was completed on February 2, 2015 by raising gross proceeds of $1.1 billion. All of the shares initially registered for our Initial Offering were issued.
On February 6, 2015, our registration statement on Form S-11 was declared effective by the U.S. Securities and Exchange Commission, or SEC, for a follow-on public offering, or our Follow-on Offering, of up to $700.0 million, which included up to $500.0 million in shares pursuant to our follow-on primary offering, or our Follow-on Primary Offering, and up to $200.0 million in shares pursuant to our follow-on distribution reinvestment plan, or our Follow-on DRP. We stopped accepting subscriptions for our Follow-on Offering on December 17, 2015 and all of the shares initially registered (including $159.5 million of shares reallocated from our Follow-on DRP) for our Follow-on Offering were issued on or before January 19, 2016. We registered an additional 30.0 million shares to be offered pursuant to our DRP beyond the completion of our Follow-on Offering and continue to offer such shares.
Our Initial Primary Offering and our Follow-on Primary Offering are collectively referred to as our Primary Offering and our distribution reinvestment plan, including but not limited to our Initial DRP and Follow-on DRP are collectively referred to as our DRP. Additionally, our Primary Offering and our Initial DRP and our Follow-on DRP are collectively referred to as our Offering.
NorthStar Securities, LLC, or our Dealer Manager, formerly a subsidiary of NorthStar Realty that became a subsidiary of our Sponsor upon completion of the spin-off, served as the dealer manager for our Primary Offering.
From inception through August 5, 2016, we raised total gross proceeds of $1.8 billion.
Our Investments
The following table presents our investments as of June 30, 2016, adjusted for commitments to acquire certain investments through August 5, 2016 (dollars in thousands):
Investment Type: | Number of Properties | Amount(1)(2) | % of Total | Capacity | Primary Locations | |||||||||||
Real estate equity(3) | ||||||||||||||||
MOB | 148 | $ | 315,237 | 9.2 | % | 6.0 million | square feet | IN, TX, NY, GA, TN | ||||||||
Net lease | ||||||||||||||||
Senior housing facilities(4) | 109 | 568,981 | 16.6 | % | 6,096 | units | NY, CA, FL, UK, WA | |||||||||
SNF | 244 | 454,702 | 13.2 | % | 26,438 | beds | PA, MI, KY, IN, WI | |||||||||
Hospital | 14 | 40,772 | 1.2 | % | 817 | beds | CA, TX, MO, UT, GA | |||||||||
Operating | ||||||||||||||||
Senior housing facilities(4) | 98 | 1,502,752 | 43.8 | % | 11,809 | units | CA, TX, WA, NY, MO | |||||||||
SNF | 67 | 344,248 | 10.0 | % | 6,674 | beds | IN, OH, MI, KY, MA | |||||||||
Ancillary(5) | NA | 14,731 | 0.4 | % | N/A | IN, OH, MI, KY | ||||||||||
Total real estate equity | 680 | 3,241,423 | 94.4 | % | ||||||||||||
Real estate debt | ||||||||||||||||
First mortgage loan | 14,637 | 0.4 | % | |||||||||||||
Mezzanine loans | 178,834 | 5.2 | % | |||||||||||||
Total real estate debt | 193,471 | 5.6 | % | |||||||||||||
Total investments | $ | 3,434,894 | 100.0 | % | ||||||||||||
____________________________________
(1) | Based on cost for real estate equity investments, which includes purchase price allocations related to net intangibles, deferred costs, other assets, if any, and adjusted for subsequent capital expenditures. For real estate debt, based on principal amount. |
(2) | Includes our proportionate interest in real estate held through joint ventures of $1.4 billion. |
37
(3) | Classification of investment type based on predominant services provided, but may include other services. |
(4) | Includes ALF, MCF, ILF and CCRC. |
(5) | Includes institutional pharmacy and therapy businesses and lease purchase buy-out options in connection with the Trilogy investment. |
For financial information regarding our reportable segments, refer to Note 12. “Segment Reporting” in our accompanying consolidated financial statements included in Part I Item 1. “Financial Statements.”
Underwriting Process
We use a rigorous investment and underwriting process that has been developed and utilized by our Advisor’s and its affiliates’ senior management teams leveraging their extensive commercial and healthcare real estate expertise over many years and real estate cycles, which focuses on some or all of the following factors designed to ensure each investment is being evaluated appropriately: (i) the historical, projected and overall potential return of the investment; (ii) the property’s historical and projected operating revenues and expenses; (iii) the manager’s and tenant’s expertise, financial strength and reputation; (iv) a review of the existing and projected competition within the market; (v) an analysis of the current and projected valuation of the building; (vi) an assessment of the physical condition of the building; (vii) the overall legal structure of the investment; (viii) the terms of the purchase and sale agreement, management agreement, joint venture agreement, lease agreement and other transactional agreements and obligations; (ix) the availability, terms and obligations of third-party project financing; (x) a third-party’s opinion of the valuation, physical condition and environmental assessment of the building; (xi) the state or federal regulations that may impact the local workforce and payment reimbursement such as Medicaid and Medicare; (xii) the building’s and operator’s licensing survey results; (xiii) the insurance coverages, premiums and claims history of the property and operator; (xiv) the tax and accounting impact of the transaction; (xv) a review of any contingent liabilities in the transaction; (xvi) the expected ability to liquidate the investment through a sale or refinancing; (xvii) the appropriateness and cost of the business plan with repositioning the property; and (xviii) for debt investments, the borrower’s credit, loan agreement terms, collateral securing the loan and the expected ability to pay debt service.
The following section describes the major asset classes in which we may invest and actively manage to maximize value and to protect capital.
Real Estate Equity
Overview
Our real estate equity investment strategy is focused on acquiring interests in healthcare properties, directly or through joint ventures, with a focus on the mid-acuity senior housing sector, which we define as ALF, MCF, SNF, ILF and CCRC. We also invest in other healthcare property types, including MOB, hospitals, rehabilitation facilities and ancillary healthcare services businesses. Our investments are predominantly in the United States, but we also selectively make international investments.
Our equity investments are generally healthcare properties, which are either structured as net leases to healthcare operators or operated through management agreements with independent third-party operators, where applicable under the RIDEA structure, whereby we participate directly in the operational cash flow of a property, generate resident level income from short-term residential agreements and incur customary related operating expenses.
We believe that mid-acuity senior housing facilities may provide an opportunity to generate attractive risk-adjusted returns. Mid-acuity senior housing facilities benefit from positive demographic and economic trends and generally provide the broadest level of services to residents in a cost-effective setting resulting in a longer length of stay for residents and less turnover in tenancy than in some other healthcare settings.
Our Portfolio
As of June 30, 2016, $3.2 billion, or 94.4% of our investments were invested in healthcare real estate equity, adjusted for commitments to acquire certain investments through August 5, 2016. The following presents our real estate equity portfolio diversity across property type and geographic location based on cost:
38
Real Estate Equity by Property Type(1) | Real Estate Equity by Geographic Location | |
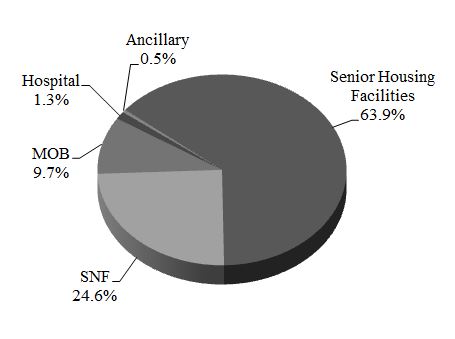 | 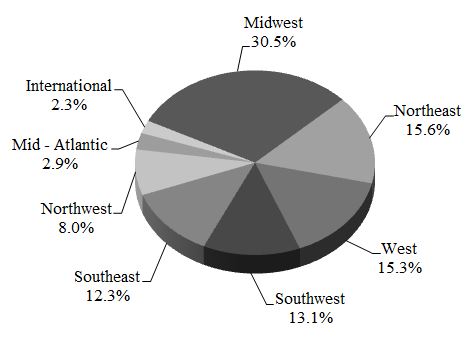 | |
____________________________________
(1) | Classification based on predominant services provided, but may include other services. |
The following table presents a summary of our real estate equity investments as of June 30, 2016, adjusted for commitments to acquire certain investments through August 5, 2016 (dollars in thousands):
Properties(1) | ||||||||||||||||||||
Portfolio | Investment Structure | Amount(2) | Senior Housing Facilities | MOB | SNF | Hospitals | Total | Primary Locations | Ownership Interest | |||||||||||
Direct Investments(3) | ||||||||||||||||||||
Watermark Aqua | Operating Facilities | $ | 108,111 | 3 | — | — | — | 3 | West/Southwest/Midwest | 97.0% | ||||||||||
Peregrine | Net Lease | 36,498 | 4 | — | — | — | 4 | Northeast/Southeast | 100.0% | |||||||||||
Kansas City | Net Lease | 15,000 | 2 | — | — | — | 2 | Midwest | 100.0% | |||||||||||
Arbors | Net Lease | 126,612 | 4 | — | — | — | 4 | Northeast | 100.0% | |||||||||||
Watermark Fountains(4) | Net Lease/Operating Facilities | 656,037 | 16 | — | — | — | 16 | Various | Various | |||||||||||
Winterfell (5) | Operating Facilities | 904,985 | 32 | — | — | — | 32 | Various | 100.0% | |||||||||||
Total Direct Investments | 1,847,243 | 61 | — | — | — | 61 | ||||||||||||||
Joint Venture Investments(6) | ||||||||||||||||||||
Eclipse | Net Lease/Operating Facilities | 59,816 | 44 | — | 36 | — | 80 | Various | 5.6% | |||||||||||
Envoy | Net Lease | 16,472 | — | — | 14 | — | 14 | Mid - Atlantic/Northeast | 11.4% | |||||||||||
Griffin-American | Net Lease/Operating Facilities | 605,418 | 90 | 148 | 45 | 14 | 297 | Various | 14.3% | |||||||||||
Espresso | Net Lease | 326,475 | 6 | — | 152 | — | 158 | Various | 36.7% | |||||||||||
Trilogy(7) | Operating Facilities | 385,999 | 6 | — | 64 | — | 70 | Various | 29.0% | |||||||||||
Total Joint Venture Investments | 1,394,180 | 146 | 148 | 311 | 14 | 619 | ||||||||||||||
Total | $ | 3,241,423 | 207 | 148 | 311 | 14 | 680 | |||||||||||||
_______________________________________
(1) | Classification based on predominant services provided, but may include other services. |
(2) | Includes purchase price allocations related to net intangibles, deferred costs, other assets, if any, and adjusted for subsequent capital expenditures. |
(3) | The net lease properties are leased to four operators, which collectively have an eight year weighted average remaining lease term. The weighted average resident occupancy of our direct investments was 89.1%. |
(4) | Watermark Fountains portfolio consists of six wholly-owned properties and ten properties in which we own a 97.0% interest. One of these properties consists of 19 condominium units in which we hold future interests, or the Remainder Interests. |
(5) | Winterfell portfolio ownership increased to 100% on March 1, 2016. Refer to Note 3 of the notes to consolidated financial statements. |
(6) | Represents our proportionate interest in real estate assets held through unconsolidated joint ventures. |
(7) | Includes institutional pharmacy and therapy businesses and lease purchase buy-out options, which are not subject to property count. |
As of June 30, 2016, our unconsolidated joint venture investments totaling $1.4 billion, comprised 43.0% of our total real estate equity investments portfolio and represented an 18.2% indirect exposure to over $7.7 billion in real estate equity investment alongside our joint venture partners. As of June 30, 2016, our unconsolidated joint venture investments included the following:
•Eclipse Joint Venture, a 5.6% interest in a $1.1 billion portfolio.
39
•Envoy Joint Venture, a 11.4% interest in a $145.0 million portfolio.
•Griffin-American Joint Venture, a 14.3% interest in a $4.1 billion portfolio.
•Espresso Joint Venture, a 36.7% interest in a $1.1 billion portfolio.
•Trilogy Joint Venture, a 29.0% interest in a $1.3 billion portfolio.
Real Estate Debt
Overview
Our real estate debt investment strategy is focused on originating, acquiring and asset managing debt, secured by the same property types that we target for our real estate equity investments, including first mortgage loans, subordinate mortgage and mezzanine loans and participations in such loans and preferred equity interests.
We emphasize direct origination of our debt investments as this allows us a greater degree of control over the terms of the loan, including any origination and other fees and how the investment is underwritten and structured, and it provides us the opportunity to syndicate all or a portion (i.e., senior or subordinate interests) of a loan, if desired. Further, direct origination of debt investments provides for a closer relationship with our borrowers and operators which helps us proactively asset manage the investment.
Our Portfolio
As of June 30, 2016, $193.5 million, or 5.6% of our investments, was invested in real estate debt secured by healthcare facilities, consisting of four loans with an average investment size of $48.4 million. The weighted average extended maturity of our real estate debt portfolio is 3.6 years.
The following table presents a summary of our debt investments as of June 30, 2016 (dollars in thousands):
Weighted Average | Floating Rate as % of Principal Amount | ||||||||||||||||||||||||
Investment Type: | Count | Principal Amount | Carrying Value | Allocation by Investment Type(1) | Fixed Rate | Spread over LIBOR(2) | Total Unleveraged Current Yield | ||||||||||||||||||
First mortgage loan(3) | 1 | $ | 14,637 | $ | 14,637 | 7.6 | % | — | % | 8.3 | % | 8.6 | % | 100.0 | % | ||||||||||
Mezzanine loans | 3 | 178,834 | 178,367 | 92.4 | % | 10.0 | % | 10.2 | % | 10.3 | % | 58.1 | % | ||||||||||||
Total/Weighted average | 4 | $ | 193,471 | $ | 193,004 | 100.0 | % | 10.0 | % | 9.9 | % | 10.2 | % | 61.2 | % | ||||||||||
___________________________________________________
(1) | Based on principal amount. |
(2) | Includes a fixed minimum London Interbank Offered Rate (“LIBOR”) rate, or LIBOR floor, as applicable. |
(3) | Subject to a 0.3% minimum LIBOR rate. |
40
The following presents our real estate debt portfolio diversity across investment type, property type and geographic location based on principal amount:
Real Estate Debt by Investment Type |
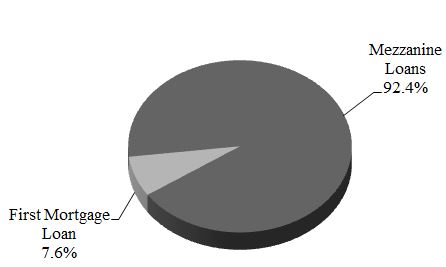 |
Real Estate Debt by Property Type (1) | Real Estate Debt by Geographic Location | |
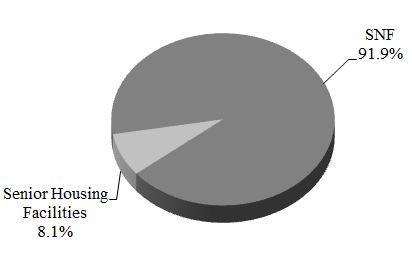 | 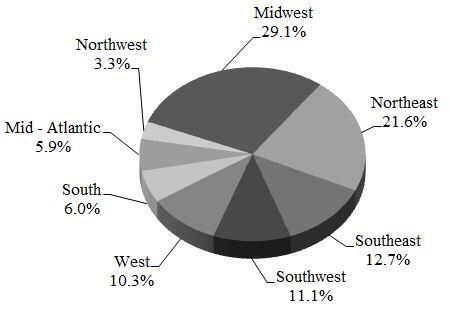 | |
____________________________________
(1) | Classification based on predominant services provided, but may include other services. |
Healthcare-Related Securities
Our healthcare-related securities investment strategy may include investing primarily in CMBS, and may include other healthcare-related securities, backed primarily by loans secured by a variety of healthcare properties. We expect that this asset class will be less than 10% of our total portfolio. As of June 30, 2016, we did not own any securities investments.
Sources of Operating Revenues and Cash Flows
We generate revenues from resident fees, rental income and interest income. Resident fee income from our senior housing operating facilities is recorded when services are rendered and includes resident room and care charges and other resident charges. Rental income is generated from our real estate for the leasing of space to various types of healthcare operators/tenants. Interest income is generated from our debt investments. Additionally, we report our proportionate interest of revenues and expenses from unconsolidated joint ventures which own healthcare real estate.
Profitability and Performance Metrics
We calculate FFO and MFFO (see “Non-GAAP Financial Measures – Funds from Operations and Modified Funds from Operations” for a description of these metrics) to evaluate the profitability and performance of our business.
Outlook and Recent Trends
The U.S. economy demonstrated improvement in 2015, which prompted the Federal Reserve in December 2015 to raise the Federal Funds Rate for the first time in nine years. The U.S. economy continues to show strength through the first half of 2016 with less than 5% unemployment and improvement in the housing market. Despite this, concerns still remain regarding low inflation in
41
the United States, a stronger U.S. dollar, oil price instability, slow global growth and increasing international market volatility. Many other global central banks have been easing monetary policy to combat low inflation and stagnant growth and it is unclear when or if the Federal Reserve will further adjust the Federal Funds Rate especially in light of certain global events described below.
Our business and operations are dependent on the commercial real estate industry generally, which in turn is dependent upon broad economic conditions in the United States, Europe, China and elsewhere. Recently, concerns over the U.S. mortgage market and sustainability of continued growth in the real estate market in the United States have contributed to increased domestic economic uncertainty and the potential for a recessionary environment.
In June 2016, a non-binding referendum was passed in the United Kingdom supporting the exit from the European Union which in turn resulted in considerable instability to global markets and currencies, especially European markets, the U.K.’s economy and the British Pound Sterling. In addition, dramatic political change in the United Kingdom has resulted, including the election of a new Prime Minister in July 2016. Much uncertainty remains as to the process for “Brexit” and the long-term impacts to the global, European and British economies. All of the major European banks have been actively easing monetary policy resulting in a very low, and in some cases negative, interest rate environment. This includes The Bank of England, which remains poised for further monetary and financial policy action should the U.K.’s economy enter a downturn. Despite the unexpected result of the referendum, markets have generally continued to function properly and in some cases recovered from the initial shock (e.g., U.S. equity markets). The potential for ongoing volatility and uncertainty resulting from “Brexit” may have a significant impact on the overall global economic environment.
Commercial real estate fundamentals remain relatively healthy across U.S. property types. Investor demand in 2015 for commercial real estate increased transaction activity and prices as rent and vacancy fundamentals improved across most property sectors. Private capital investment remained aggressive throughout 2015 and, although public markets slowed at the beginning of 2016, continued to remain aggressive in the first half of 2016, leading to continued appreciation in real estate values. However, property price appreciation has slowed and there is speculation that the markets may be entering the late stage of the current real estate cycle and, in certain markets, rent growth and capitalization rate compression has started to slow. In addition, one of the factors that may contribute to periodic volatility in the commercial real estate market is the large amount of maturing commercial real estate debt that may have difficulties being refinanced.
Approximately $1.4 trillion of commercial real estate debt in the United States is scheduled to mature through 2018. While there appears to be a supply of available liquidity to satisfy many of these maturities, April and June 2016 were the two lowest private-label CMBS origination months in four years and industry experts estimate a projected total origination volume of approximately $65 billion for 2016 versus volume of $95 billion in 2015. This trend is potentially one symptom that could point to difficulties in the ability of the market to refinance the large amount of maturing real estate debt and may have a negative impact on the overall real estate market.
A return to weak economic conditions in the future, such as those of the credit crisis of 2008, could reduce a tenant’s/operator’s/resident’s ability to make payments in accordance with the contractual terms and could weaken demand for companies to lease or occupy new space. To the extent that market rental and occupancy rates weaken, property-level cash flow could be negatively affected and therefore, reduce our ability to make distributions to stockholders.
Non-traded REIT capital raising was down year over year by 20% in 2014 (with approximately $16 billion in equity raised) and 2015 sales were down 36% year over year compared to 2014. Despite this declining industry trend, our sponsor continued to gain market share with our non-traded REITs having a 7% market share in 2014 increasing to 13% in 2015 despite the overall decline in this market. In April of 2016, the retail industry experienced the implementation of FINRA 15-02 related to disclosure on broker dealer account statements and the final ruling of the U.S. Department of Labor’s “fiduciary” standard for retirement accounts. Although the final fiduciary rule was more favorable than initial proposals, the impact of both of these events has been a sharp decline in capital raising in the retail market as evidenced by the overall non-traded REIT capital raising being down 57% through June 2016 compared to the first half of 2015.
Although these developments may negatively impact overall non-traded equity sales, these dynamics are not anticipated to impact the Company as we are no longer in our offering period.
42
Healthcare Markets
The healthcare real estate equity and finance markets tend to attract new equity and debt capital more slowly than more traditional commercial real estate property types because of barriers to entry for new investors or lenders to healthcare property owners. Investing in and lending to the healthcare real estate sector requires an in-depth understanding of the specialized nature of healthcare facility operations and the healthcare regulatory environment. While these competitive constraints may create opportunities for attractive investments in the healthcare property sector, they may also provide challenges and risks when seeking attractive terms for our investments.
We believe owners and operators of senior housing facilities and other healthcare properties are benefiting from demographic and economic trends, specifically the aging of the U.S. population whereby Americans aged 65 years old and older are expected to increase from 47.8 million in 2015 to 79.2 million in 2035 (source: U.S. Census Bureau 2014 National Population Projections), and the increasing demand for care for seniors outside of their homes as well as the need for cost efficient care. As a result of these demographic trends, we expect healthcare costs to increase at a faster rate than the available funding from both private sources and government-sponsored healthcare programs. Healthcare spending in the U.S. is projected to increase from $2.6 trillion in 2010 to $4.1 trillion in 2020 (source: CMS) and as healthcare costs increase, insurers, individuals and the U.S. government are pursuing lower cost options for healthcare, and senior housing facilities, such as ALF, MCF, SNF and ILF, are generally more cost effective than higher acuity healthcare settings, such as short or long-term acute-care hospitals, in-patient rehabilitation facilities and other post-acute care settings. For example, recent regulatory changes have created incentives for long-term acute-care hospitals and in-patient rehabilitation facilities to minimize patient lengths of stay and placed limits on the type of patient that can be admitted to these facilities. The growth in total demand for healthcare, broad U.S. demographic changes and the shift towards cost effective community-based settings is resulting in dynamic changes to the healthcare delivery system.
Our skilled nursing facility operators and some of our assisted living tenants may receive a portion of their revenues from governmental payors, primarily Medicare and Medicaid. Changes in reimbursement rates and limits on the scope of services reimbursed to skilled nursing facilities could have a material impact on the operators’ liquidity and financial condition. On July 29, 2016, the Centers for Medicare and Medicaid Services, or CMS, issued its final rule for fiscal year 2017 stating a net increase of 2.4% to Medicare reimbursement rates for skilled nursing facilities. Further rules and regulatory changes, if implemented, that are being proposed by the federal government to improve quality of care and control healthcare spending, may affect reimbursement and increase operating costs to our operators and tenants as they will be required to participate in order to continue to access Medicare and Medicaid funding. In addition, the government is proposing further reimbursement changes via managed care and pooled funding in order to attempt to control cost and share reimbursement risk with healthcare providers. We periodically monitor federal and state reimbursement programs and assess any impact that changes in reimbursement levels or the timing of payments may have on the ability of our tenants/operators to meet their payment obligations.
Despite the growth in the industry and favorable market conditions and demographics, economic uncertainty may have a negative impact, weakening the market’s fundamentals and ultimately reducing a tenant’s/operator’s ability to make rent payments in accordance with the contractual terms of the lease, as well as the possibility for reduced income for our operating investments. In addition, increased development and competitive pressures may have an impact on some of our assets. Although senior housing average occupancy has remained relatively stable since 2014 at approximately 90% (source: NIC MAP 2Q16 Data Release Webinar & Discussion), to the extent that occupancy and market rental rates decline, property-level cash flow could be negatively affected as existing leases renew at lower rates and over longer periods of time and decreased cash flow in turn could impact the value of underlying properties and the borrowers’ ability to service their outstanding loans.
Despite the barriers and constraints to investing in the senior housing sector, the demographics and other market dynamics have resulted in the sector becoming more attractive to investors. Supply and demand fundamentals resulting from compelling demographics, driven by need for healthcare services by an aging population and ongoing consolidation of the fragmented nature of healthcare real estate ownership, create attractive investment opportunities. Merger and acquisition activity in the senior housing real estate market is currently robust and we expect it to remain so into the near term.
Our Strategy
Our primary business objectives are to make investments in our targeted assets that we expect will generate attractive risk-adjusted returns, stable cash flow for distributions and provide downside protection to our stockholders. We will seek to realize growth in the value of our real estate equity investments through appreciation and/or by timing their sale to maximize value. We will continue to identify strategic development opportunities for our existing and future investments that may involve replacing, converting or renovating facilities in our portfolio which, in turn, would allow us to provide an optimal mix of services and enhance the overall value of our assets. We believe that our Advisor and its affiliates have a platform that derives a potential competitive advantage from the combination of experience, proven track record of successfully managing public companies, deep industry relationships and market-leading real estate credit underwriting and capital markets expertise which enables us to manage credit risk across our
43
investments as well as to structure and finance our assets efficiently. We believe that our targeted investment types are complementary to each other due to overlapping sources of investment opportunities, common reliance on real estate fundamentals and ability to apply similar portfolio management and servicing skills to maximize value and to protect capital. We believe that mid-acuity senior housing facilities provide an opportunity to generate attractive risk-adjusted returns. Mid-acuity senior housing facilities benefit from positive demographic and economic trends and generally provide the broadest level of services to residents in a more cost-effective setting resulting in a longer length of stay for residents and less turnover in tenancy than in some other healthcare settings.
We began raising capital in 2013 and completed our Initial Offering on February 2, 2015 and our Follow-on Offering on January 19, 2016. We raised total gross proceeds of $1.8 billion from inception through August 5, 2016. Since the successful completion of our Offering, we have only been raising new equity through our DRP.
The following table presents our investment activity in 2016 and from inception through August 5, 2016, adjusted for commitments to acquire certain investments (dollars in thousands):
Six Months Ended | From Inception through | |||||||
June 30, 2016 | August 5, 2016 | |||||||
Investment Type: | Amount(1)(2) | Amount(1)(3) | ||||||
Real estate equity | $ | 604,623 | $ | 3,241,423 | ||||
Real estate debt | — | 220,887 | ||||||
Total | $ | 604,623 | $ | 3,462,310 | ||||
__________________________________
(1) | Includes initial purchase price, including deferred costs and other assets, and may be adjusted upon completion of the final purchase price allocation. |
(2) | Represents the acquisition of the remaining 60.0% equity interest in the Winterfell portfolio and acquisition of additional senior housing and skilled nursing facilities in the Trilogy portfolio. |
(3) | Includes our proportionate interest in real estate held through joint ventures of $1.4 billion as of June 30, 2016. |
Financing Strategy
We use asset-level financing as part of our investment strategy to prudently leverage our investments while managing refinancing and interest rate risk. Our Advisor is responsible for managing such financing and interest rate risk on our behalf. We consider a variety of financing arrangements such as mortgage notes, credit facilities, securitization financing transactions and other term borrowings. We continue to seek and prefer long-term, non-recourse financing. We may, as circumstances warrant, utilize some level of recourse financing.
Our financing strategy for our real estate equity investments is typically to seek long-term, non-recourse mortgage loans. For our debt and securities investments, we seek to obtain match-funded borrowings whenever possible at rates that provide a positive net spread, generally using credit facilities and securitization financing transactions. Our borrowing levels and terms vary depending upon the nature of the assets and the related financing.
Although we have a limitation on the maximum leverage for our portfolio, which approximates 75% of our assets (excluding indirect leverage held through our unconsolidated joint venture investments), other than intangibles, before deducting loan loss reserves, other non-cash reserves and depreciation, we do not have a targeted debt-to-equity ratio on an asset-by-asset basis, as we believe the appropriate leverage for the particular assets we finance depends on the specific credit characteristics of each asset. We use leverage for the sole purpose of financing our investments and diversifying our equity and we do not employ leverage to speculate on changes in interest rates. We also seek assignable financing when available. Once we have fully invested the proceeds of our Offering, we expect that our financing may approximate 50% of the cost of our investments, excluding indirect leverage held through our unconsolidated joint venture investments.
Portfolio Management
Our Advisor and its affiliates, directly or together with third party sub-advisors, maintain a comprehensive portfolio management process that generally includes oversight by the asset management team, regular management meetings and an exhaustive quarterly credit review process. These processes are designed to enable management to evaluate and proactively identify asset-specific credit issues and trends on a portfolio-wide, sub-portfolio or by asset type basis. Nevertheless, we cannot be certain that our Advisor’s review, or any third parties acting on our or our Advisor’s behalf, will identify all issues within our portfolio due to, among other things, adverse economic conditions or events adversely affecting specific assets; therefore, potential future losses may also stem from issues that are not identified during these credit reviews.
Our Advisor has delegated certain asset management functions in connection with our portfolio to American Healthcare Investors, LLC, or AHI. As of June 30, 2016, AHI provides these asset management services in connection with our Griffin-American and Winterfell portfolios and we expect AHI to provide these asset management services for the balance of our portfolio (other than
44
joint ventures with Formation Capital LLC, or Formation) beginning in the second half of 2016. In addition, Formation provides similar asset management services to us in connection with the Eclipse, Espresso and Envoy joint ventures. Our Advisor’s asset management team, under the direction of its investment committee, supervises AHI and Formation and retains ultimate oversight and responsibility for the management of our portfolio.
Our Advisor’s asset management team, together with AHI or Formation, uses many methods to actively manage our asset base to enhance or preserve our income, value and capital. Our Advisor, together with AHI or Formation, seeks to identify strategic development opportunities for our existing and future investments that may involve replacing, converting or renovating facilities in our portfolio which, in turn, would allow us to provide optimal mix of services and enhance the overall value of our assets. To manage risk, frequent review and dialogue with operators/managers/borrowers and regular inspections of our owned properties and collateral have proven to be an effective process for identifying issues early. In addition, our Advisor, together with AHI or Formation, considers the impact of regulatory changes on the performance of our portfolio. During the quarterly credit review, or more frequently as necessary, investments are put on highly-monitored status, as appropriate, based upon several factors, including missed or late contractual payments, significant declines in performance and other data which may indicate a potential issue in our ability to recover our invested capital from an investment. Each situation depends on many factors, including the number of properties, the type of property, macro and local market conditions impacting supply/demand, cash flow and the financial condition of our operators/managers/borrowers. Our Advisor, together with AHI or Formation, as applicable, uses an experienced asset management team that monitors these factors on our behalf.
Our investments are reviewed on a quarterly basis, or more frequently as necessary, to assess whether there are any indicators that the value of our investments may be impaired or that carrying value may not be recoverable. In conducting these reviews, we consider macroeconomic factors, including real estate sector conditions, together with asset and market specific circumstances among other factors. To the extent an impairment has occurred, the loss will be measured as compared to the carrying amount of the investment. An allowance for a doubtful account for a tenant/operator/resident receivable is established based on a periodic review of aged receivables resulting from estimated losses due to the inability of tenant/operator/resident to make required rent and other payments contractually due. Additionally, we establish, on a current basis, allowance for future operator/tenant credit losses on unbilled rents receivable based upon an evaluation of the collectability of such amounts.
One of our operators, which accounts for 1.1% of the total revenue attributable to our direct investments, recently failed to timely pay its full rental obligations. As a result, we were required to fund additional reserves under the mortgage note payable relating to the portfolio. We have entered into a new lease and related documents with a new operator in connection with the transition of operations. Two of the four properties within the portfolio have transitioned operations to the new operator during the third quarter of 2016, with the remaining properties currently expected to transition operations in 2017.
As of June 30, 2016, except as discussed above, our direct investments were performing in accordance with the contractual terms of their governing documents, in all material respects. However, there can be no assurance that our investments will continue to perform in accordance with the contractual terms of the governing documents or underwriting and we may, in the future, record impairment, as appropriate, if required.
Critical Accounting Policies
Principles of Consolidation
Our consolidated financial statements include the accounts of us, our operating partnership and our consolidated subsidiaries. We consolidate variable interest entities, or VIEs, where we are the primary beneficiary and voting interest entities which are generally majority owned or otherwise controlled by us. All significant intercompany balances are eliminated in consolidation.
Variable Interest Entities
A VIE is an entity that lacks one or more of the characteristics of a voting interest entity. A VIE is defined as an entity in which equity investors do not have the characteristics of a controlling financial interest or do not have sufficient equity at risk for the entity to finance its activities without additional subordinated financial support from other parties. The determination of whether an entity is a VIE includes both a qualitative and quantitative analysis. We base the qualitative analysis on our review of the design of the entity, its organizational structure including decision-making ability and relevant financial agreements and the quantitative analysis on the forecasted cash flow of the entity. We reassess the initial evaluation of an entity as a VIE upon the occurrence of certain reconsideration events.
A VIE must be consolidated only by its primary beneficiary, which is defined as the party who, along with its affiliates and agents, has both the: (i) power to direct the activities that most significantly impact the VIE’s economic performance; and (ii) obligation to absorb the losses of the VIE or the right to receive the benefits from the VIE, which could be significant to the VIE. We determine whether we are the primary beneficiary of a VIE by considering qualitative and quantitative factors, including, but not limited to: which activities most significantly impact the VIE’s economic performance and which party controls such activities; the amount
45
and characteristics of its investment; the obligation or likelihood for us or other interests to provide financial support; consideration of the VIE’s purpose and design, including the risks the VIE was designed to create and pass through to its variable interest holders and the similarity with and significance to our business activities and the other interests. We reassess the determination of whether we are the primary beneficiary of a VIE each reporting period. Significant judgments related to these determinations include estimates about the current and future fair value and performance of investments held by these VIEs and general market conditions.
We evaluate our investments and financings, including investments in unconsolidated ventures and securitization financing transactions, if any, to determine whether each investment or financing is a VIE. We analyze new investments and financings, as well as reconsideration events for existing investments and financings, which vary depending on type of investment or financing.
Voting Interest Entities
A voting interest entity is an entity in which the total equity investment at risk is sufficient to enable it to finance its activities independently and the equity holders have the power to direct the activities of the entity that most significantly impact its economic performance, the obligation to absorb the losses of the entity and the right to receive the residual returns of the entity. The usual condition for a controlling financial interest in a voting interest entity is ownership of a majority voting interest. If we have a majority voting interest in a voting interest entity, the entity will generally be consolidated. We do not consolidate a voting interest entity if there are substantive participating rights by other parties and/or kick-out rights by a single party or through a simple majority vote.
We perform on-going reassessments of whether entities previously evaluated under the voting interest framework have become VIEs, based on certain events, and therefore subject to the VIE consolidation framework.
Investments in Unconsolidated Ventures
A non-controlling, unconsolidated ownership interest in an entity may be accounted for using the equity method, at fair value or the cost method.
Under the equity method, the investment is adjusted each period for capital contributions and distributions and its share of the entity’s net income (loss). Capital contributions, distributions and net income (loss) of such entities are recorded in accordance with the terms of the governing documents. An allocation of net income (loss) may differ from the stated ownership percentage interest in such entity as a result of preferred returns and allocation formulas, if any, as described in such governing documents. Equity method investments are recognized using a cost accumulation model in which the investment is recognized based on the cost to the investor, which includes acquisition fees. We record as an expense certain acquisition costs and fees associated with consolidated investments deemed to be business combinations and capitalize these costs for investments deemed to be acquisitions of an asset, including an equity method investment.
We may account for an investment in an unconsolidated entity at fair value by electing the fair value option. We may account for an investment that does not qualify for equity method accounting or for which the fair value option was not elected using the cost method if we determine the investment in the unconsolidated entity is insignificant. Under the cost method, equity in earnings is recorded as dividends are received to the extent they are not considered a return of capital, which is recorded as a reduction of cost of the investment.
Operating Real Estate
We account for purchases of operating real estate that qualify as business combinations using the acquisition method, where the purchase price is allocated to tangible assets such as land, building, furniture and fixtures, improvements and other identified intangibles such as in place leases and goodwill. Major replacements and betterments which improve or extend the life of the asset are capitalized and depreciated over their useful life. Ordinary repairs and maintenance are expensed as incurred. Operating real estate is carried at historical cost less accumulated depreciation. Operating real estate is depreciated using the straight-line method over the estimated useful life of the assets. Construction costs incurred in connection with our investments are capitalized and included in operating real estate, net on our consolidated balance sheets. Construction in progress is not depreciated until the development is substantially completed. Costs directly related to an acquisition deemed to be a business combination are expensed and included in transaction costs in our consolidated statements of operations. We evaluate whether a real estate acquisition constitutes a business and whether business combination accounting is appropriate.
When we acquire a controlling interest in an existing unconsolidated joint venture, we record the consolidated investment at the updated purchase price, which is reflective of fair value. The difference between the carrying value of our investment in the existing unconsolidated joint venture on the acquisition date and our share of the fair value of the investment’s purchase price is recorded in gain (loss) on consolidation of unconsolidated venture in our consolidated statements of operations.
46
Real Estate Debt Investments
Debt investments are generally intended to be held to maturity and, accordingly, are carried at cost, net of unamortized loan fees, premium, discount and unfunded commitments. Debt investments that are deemed to be impaired are carried at amortized cost less a loan loss reserve, if deemed appropriate, which approximates fair value. Debt investments where we do not have the intent to hold the loan for the foreseeable future or until its expected payoff are classified as held for sale and recorded at the lower of cost or estimated value.
Real Estate Securities
We classify our securities investments as available for sale on the acquisition date, which are carried at fair value. Unrealized gains (losses) are recorded as a component of accumulated other comprehensive income, or OCI, in our consolidated statements of equity. However, we may elect the fair value option for certain of our available for sale securities, and as a result, any unrealized gains (losses) on such securities are recorded in unrealized gain (loss) on investments and other in our consolidated statements of operations. As of June 30, 2016, we do not own any securities investments.
Revenue Recognition
Operating Real Estate
Rental income includes rental and escalation income from operating real estate and is derived from leasing of space to various types of tenants and healthcare operators. Rental revenue recognition commences when the tenant takes possession of the leased space and the leased space is substantially ready for its intended use. The leases are for fixed terms of varying length and generally provide for annual rentals and expense reimbursements to be paid in monthly installments. Rental income from leases is recognized on a straight-line basis over the term of the respective leases. The excess of rents recognized over amounts contractually due pursuant to the underlying leases are included in unbilled rent receivable on the consolidated balance sheets. We amortize any tenant inducements as a reduction of revenue utilizing the straight-line method over the term of the lease. Escalation income represents revenue from tenant/operator leases which provide for the recovery of all or a portion of the operating expenses and real estate taxes paid by us on behalf of the respective property. This revenue is accrued in the same period as the expenses are incurred.
We also generate operating income from operating healthcare properties. Revenue related to operating healthcare properties includes resident room and care charges and other resident service charges. Revenue is recognized when such services are provided, generally defined per their resident agreement as the date upon which a resident occupies a room or uses the services and is recorded in resident fee income in the consolidated statements of operations.
In a situation in which a lease(s) associated with a significant tenant have been, or are expected to be, terminated early, we evaluate the remaining useful life of depreciable or amortizable assets in the asset group related to the lease that will be terminated (i.e., tenant improvements, above- and below-market lease intangibles, in-place lease value and deferred leasing costs). Based upon consideration of the facts and circumstances surrounding the termination, we may write-off or accelerate the depreciation and amortization associated with the asset group. Such amounts are included within depreciation and amortization in our consolidated statements of operations.
Real Estate Debt Investments
Interest income is recognized on an accrual basis and any related premium, discount, origination costs and fees are amortized over the life of the investment using the effective interest method. The amortization is reflected as an adjustment to interest income in our consolidated statements of operations. The amortization of a premium or accretion of a discount is discontinued if such loan is reclassified to held for sale.
Real Estate Securities
Interest income is recognized using the effective interest method with any premium or discount amortized or accreted through earnings based on expected cash flow through the expected maturity date of the security. Changes to expected cash flow may result in a change to the yield which is then applied retrospectively for high-credit quality securities that cannot be prepaid or otherwise settled in such a way that the holder would not recover substantially all of the investment or prospectively for all other securities to recognize interest income. As of June 30, 2016, we do not own any securities investments.
Credit Losses and Impairment on Investments
Operating Real Estate
Our real estate portfolio is reviewed on a quarterly basis, or more frequently as necessary, to assess whether there are any indicators that the value of our operating real estate may be impaired or that its carrying value may not be recoverable. A property’s value
47
is considered impaired if management’s estimate of the aggregate expected future undiscounted cash flow generated by the property is less than the carrying value. In conducting this review, management considers U.S. macroeconomic factors, real estate and healthcare sector conditions, together with asset specific and other factors. To the extent an impairment has occurred, the loss is measured as the excess of the carrying value of the property over the estimated fair value and recorded in impairment on operating real estate in our consolidated statements of operations.
An allowance for a doubtful account for a tenant/operator/resident receivable is established based on a periodic review of aged receivables resulting from estimated losses due to the inability of tenant/operator/resident to make required rent and other payments contractually due. Additionally, we establish, on a current basis, an allowance for future tenant/operator/resident credit losses on unbilled rent receivable based on an evaluation of the collectability of such amounts. We had an immaterial amount of allowance for doubtful accounts as of June 30, 2016.
Real Estate Debt Investments
Loans are considered impaired when, based on current information and events, it is probable that we will not be able to collect principal and interest amounts due according to the contractual terms. We assess the credit quality of the portfolio and adequacy of loan loss reserves on a quarterly basis or more frequently as necessary. Significant judgment of management is required in this analysis. We consider the estimated net recoverable value of the loan as well as other factors, including but not limited to the fair value of any collateral, the amount and the status of any senior debt, the quality and financial condition of the borrower and the competitive situation of the area where the underlying collateral is located. Because this determination is based on projections of future economic events, which are inherently subjective, the amount ultimately realized may differ materially from the carrying value as of the balance sheet date. If upon completion of the assessment, the estimated fair value of the underlying collateral is less than the net carrying value of the loan, a loan loss reserve is recorded with a corresponding charge to provision for loan losses. The loan loss reserve for each loan is maintained at a level that is determined to be adequate by management to absorb probable losses.
Income recognition is suspended for a loan at the earlier of the date at which payments become 90-days past due or when, in the opinion of management, a full recovery of income and principal becomes doubtful. When the ultimate collectability of the principal of an impaired loan is in doubt, all payments are applied to principal under the cost recovery method. When the ultimate collectability of the principal of an impaired loan is not in doubt, contractual interest is recorded as interest income when received, under the cash basis method until an accrual is resumed when the loan becomes contractually current and performance is demonstrated to be resumed. A loan is written off when it is no longer realizable and/or legally discharged. As of June 30, 2016, we did not have any impaired real estate debt investments.
Investments in Unconsolidated Ventures
We review our investments in unconsolidated ventures for which we did not elect the fair value option on a quarterly basis, or more frequently as necessary, to assess whether there are any indicators that the value may be impaired or that its carrying value may not be recoverable. An investment is considered impaired if the projected net recoverable amount over the expected holding period is less than the carrying value. In conducting this review, we consider global macroeconomic factors, including real estate sector conditions, together with investment specific and other factors. To the extent an impairment has occurred and is considered to be other than temporary, the loss is measured as the excess of the carrying value of the investment over the estimated fair value and recorded in equity in earnings (losses) of unconsolidated ventures in our consolidated statements of operations.
Real Estate Securities
Securities for which the fair value option is elected are not evaluated for other-than-temporary impairment, or OTTI, as any change in fair value is recorded in our consolidated statements of operations. Realized losses on such securities are reclassified to realized gain (loss) on investments and other as losses occur.
Securities for which the fair value option is not elected are evaluated for OTTI quarterly. Impairment of a security is considered to be other-than-temporary when: (i) the holder has the intent to sell the impaired security; (ii) it is more likely than not the holder will be required to sell the security; or (iii) the holder does not expect to recover the entire amortized cost of the security. When a security has been deemed to be other-than-temporarily impaired due to (i) or (ii), the security is written down to its fair value and an OTTI is recognized in our consolidated statements of operations. In the case of (iii), the security is written down to its fair value and the amount of OTTI is then bifurcated into: (a) the amount related to expected credit losses; and (b) the amount related to fair value adjustments in excess of expected credit losses. The portion of OTTI related to expected credit losses is recognized in our consolidated statements of operations. The remaining OTTI related to the valuation adjustment is recognized as a component of accumulated OCI in our consolidated statements of equity. The portion of OTTI recognized through earnings is accreted back to the amortized cost basis of the security through interest income, while amounts recognized through OCI are amortized over the life of the security with no impact on earnings. Real estate securities which are not high-credit quality are considered to have an
48
OTTI if the security has an unrealized loss and there has been an adverse change in expected cash flow. The amount of OTTI is then bifurcated as discussed above. As of June 30, 2016, we did not own any real estate securities.
Recent Accounting Pronouncements
In May 2014, the Financial Accounting Standards Board, or FASB, issued an accounting update requiring a company to recognize as revenue the amount of consideration it expects to be entitled to in connection with the transfer of promised goods or services to customers. The accounting standard update will replace most of the existing revenue recognition guidance currently promulgated by accounting principles generally accepted in the United States, or U.S. GAAP. In July 2015, the FASB decided to delay the effective date of the new revenue standard by one year. The effective date of the new revenue standard for us will be January 1, 2018. We are in the process of evaluating the impact, if any, of the update on our consolidated financial position, results of operations and financial statement disclosures.
In February 2015, the FASB issued updated guidance that changes the rules regarding consolidation. The pronouncement eliminates specialized guidance for limited partnerships and similar legal entities and removes the indefinite deferral for certain investment funds. The new guidance is effective for annual periods and interim periods within those annual periods beginning after December 15, 2015, with early adoption permitted. We adopted this guidance in the first quarter 2016 and determined our Operating Partnership is considered a VIE. We are the primary beneficiary of the VIE, the VIE’s assets can be used for purposes other than the settlement of the VIE’s obligations and our partnership interest is considered a majority voting interest. As such, this standard resulted in the identification of additional VIEs, however it did not have a material impact on our consolidated financial position or results of operations.
In January 2016, the FASB issued an accounting update that addresses certain aspects of recognition, measurement, presentation, and disclosure of financial instruments. The new guidance is effective for fiscal years, and interim periods within those years, beginning after December 15, 2017. We are currently assessing the impact, if any, of the guidance on our consolidated financial position, results of operations and financial statement disclosures.
In February 2016, the FASB issued an accounting update that requires lessees to present right-of-use assets and lease liabilities on the balance sheet. The new guidance is to be applied using a modified retrospective approach at the beginning of the earliest comparative period in the financial statements and is effective for fiscal years beginning after December 15, 2018, including interim periods within those fiscal years. Early adoption is permitted. We are evaluating the impact, if any, that this guidance will have on our consolidated financial position, results of operations and financial statement disclosures.
In March 2016, the FASB issued guidance which eliminates the requirement for an investor to retroactively apply the equity method when its increase in ownership interest (or degree of influence) in an investee triggers equity method accounting. The update requires that the equity method investor add the cost of acquiring the additional interest in the investee to the current basis of the investor’s previously held interest and adopt the equity method of accounting as of the date the investment become qualified for equity method accounting. The update should be applied prospectively upon their effective date to increases in the level of ownership interests or degree of influence that results in the adoption of the equity method. The guidance is effective for fiscal years beginning after December 15, 2016 and interim periods within those fiscal years. Early adoption is permitted. We are evaluating the impact, if any, that this guidance will have on our consolidated financial position, results of operations and financial statement disclosures.
In March 2016, the FASB issued guidance which amends several aspects of the accounting for equity-based payment transactions, including the income tax consequences, classification of awards as either equity or liabilities, and classification on the statements of cash flows. The guidance is effective for interim and annual reporting periods in fiscal years beginning after December 15, 2017. We are evaluating the impact, if any, that this guidance will have on our consolidated financial position, results of operations and financial statement disclosures.
In June 2016, the FASB issued guidance which changes how entities will measure credit losses for most financial assets and certain other instruments that are not measured at fair value through net income. Additionally, entities will have to disclose significantly more information including information used to track credit quality by year of origination for most financing receivables. The new guidance is effective for fiscal years, and interim periods within those years, beginning after December 15, 2019. Early adoption is permitted. We are evaluating the impact, if any, that this guidance will have on our consolidated financial position, results of operations and financial statement disclosures.
49
Results of Operations
Comparison of the Three Months Ended June 30, 2016 to June 30, 2015 (dollars in thousands):
Three Months Ended June 30, | Increase (Decrease) | ||||||||||||||
2016 | 2015 | Amount | % | ||||||||||||
Revenues | |||||||||||||||
Resident fee income | $ | 25,244 | $ | 12,132 | $ | 13,112 | 108.1 | % | |||||||
Rental income | 37,586 | 5,740 | 31,846 | 554.8 | % | ||||||||||
Interest income | 5,005 | 3,648 | 1,357 | 37.2 | % | ||||||||||
Other revenue | 194 | — | 194 | N/A | |||||||||||
Total revenues | 68,029 | 21,520 | 46,509 | 216.1 | % | ||||||||||
Expenses | |||||||||||||||
Property operating expenses | 34,982 | 8,739 | 26,243 | 300.3 | % | ||||||||||
Interest expense | 13,044 | 3,431 | 9,613 | 280.2 | % | ||||||||||
Transaction costs | 249 | 3,127 | (2,878 | ) | (92.0 | )% | |||||||||
Asset management and other fees-related party | 8,452 | 17,829 | (9,377 | ) | (52.6 | )% | |||||||||
General and administrative expenses | 8,722 | 4,224 | 4,498 | 106.5 | % | ||||||||||
Depreciation and amortization | 13,429 | 4,697 | 8,732 | 185.9 | % | ||||||||||
Total expenses | 78,878 | 42,047 | 36,831 | 87.6 | % | ||||||||||
Other income (loss) | |||||||||||||||
Realized gain (loss) on investments and other | 411 | — | 411 | N/A | |||||||||||
Income (loss) before equity in earnings (losses) of unconsolidated ventures and income tax benefit (expense) | (10,438 | ) | (20,527 | ) | 10,089 | (49.1 | )% | ||||||||
Equity in earnings (losses) of unconsolidated ventures | (17,432 | ) | (5,351 | ) | (12,081 | ) | 225.8 | % | |||||||
Income tax benefit (expense) | (33 | ) | 208 | (241 | ) | (115.9 | )% | ||||||||
Net income (loss) | $ | (27,903 | ) | $ | (25,670 | ) | $ | (2,233 | ) | 8.7 | % | ||||
Revenues
Resident Fee Income
Resident fee income increased $13.1 million, primarily as a result of the acquisition of the Fountains portfolio in June 2015, which included RIDEA properties, and an increase in occupancy for the three months ended June 30, 2016 as compared to the same period in 2015 for RIDEA properties owned during the entirety of both periods presented.
Rental Income
Rental income increased $31.8 million, primarily as a result of the acquisition of the remaining 60.0% interest in the Winterfell portfolio in March 2016, which is now 100% owned and consolidated, as well as the net lease properties included in the acquisition of the Fountains portfolio in June 2015.
Interest Income
Interest income increased $1.4 million, primarily as a result of the origination of one new debt investment, partially offset by the repayment of two debt investments in 2015.
Other Revenue
Other revenue of $0.2 million for the three months ended June 30, 2016 was a result of community fees and other miscellaneous fees from our real estate equity segment.
Expenses
Property Operating Expenses
Property operating expenses increased $26.2 million, primarily as a result of the acquisition of the RIDEA properties in the Fountains portfolio in June 2015 and the remaining 60% interest in the Winterfell portfolio in March 2016.
50
Interest Expense
Interest expense increased $9.6 million, primarily as a result of the new mortgage notes payable entered into in connection with the acquisition of the Fountains portfolio in June 2015 and the mortgage notes payable assumed in connection with the acquisition of the Winterfell portfolio in March 2016.
Transaction Costs
Transaction costs primarily represent professional fees associated with new investments. Transaction costs for the three months ended June 30, 2016 are a result of professional fees incurred related to the finalization of certain purchase price allocations during the quarter. Transaction costs for the three months ended June 30, 2015 are a result of costs associated with the acquisition of the Fountains portfolio in June 2015.
Asset Management and Other Fees - Related Party
Asset management and other fees - related party decreased $9.4 million, primarily as a result of the acquisition of the Fountains portfolio in June 2015 with no comparable activity during the three months ended June 30, 2016. This decrease was offset by an increase in asset management fees as a result from an increase in our invested assets subsequent to June 30, 2015.
General and Administrative Expenses
General and administrative expenses are incurred at the corporate level and include auditing and professional fees, director fees, organization and other costs associated with operating our business. General and administrative expenses increased $4.5 million, primarily as a result of increased operating costs resulting from increased investment activity subsequent to June 30, 2015.
Depreciation and Amortization
Depreciation and amortization expense increased $8.7 million, primarily as a result of the acquisition of the Fountains portfolio in June 2015 and the remaining 60% interest in the Winterfell portfolio in March 2016.
Other Income (Loss)
Realized Gain (Loss) on Investments and Other
Realized gain on investments and other of $0.4 million for the three months ended June 30, 2016 was a result of a gain on sale of one Remainder Interest in the Watermark Fountains portfolio.
Equity in Earnings (Losses) of Unconsolidated Ventures and Income Tax Benefit (Expense)
Equity in Earnings (Losses) of Unconsolidated Ventures
Equity in losses of unconsolidated ventures increased $12.1 million primarily as a result of depreciation and amortization expense from underlying real estate portfolios acquired subsequent to June 30, 2015, via two separate joint ventures. Excluding depreciation and amortization of $22.9 million for all unconsolidated ventures, equity in earnings of unconsolidated ventures increased $3.1 million primarily as a result of operating income from the two post-June 30, 2015 joint ventures, non-recurring transaction costs incurred in 2015 with the acquisition of a 40% interest in the Winterfell portfolio, partially offset by an unrealized loss in foreign currency exchange at one of our portfolios.
Income Tax Benefit (Expense)
The income tax expense for the three months ended June 30, 2016 was less than $0.1 million related to our RIDEA properties, which operate through TRS. The income tax net benefit for the three months ended June 30, 2015 was $0.2 million related to our RIDEA properties, which operate through TRS.
51
Comparison of the Six Months Ended June 30, 2016 to June 30, 2015 (dollars in thousands):
Six Months Ended June 30, | Increase (Decrease) | ||||||||||||||
2016 | 2015 | Amount | % | ||||||||||||
Revenues | |||||||||||||||
Resident fee income | $ | 50,285 | $ | 15,980 | $ | 34,305 | 214.7 | % | |||||||
Rental income | 56,021 | 9,647 | 46,374 | 480.7 | % | ||||||||||
Interest income | 10,040 | 7,208 | 2,832 | 39.3 | % | ||||||||||
Other revenue | 469 | — | 469 | N/A | |||||||||||
Total revenues | 116,815 | 32,835 | 83,980 | 255.8 | % | ||||||||||
Expenses | |||||||||||||||
Property operating expenses | 58,379 | 11,486 | 46,893 | 408.3 | % | ||||||||||
Interest expense | 21,527 | 5,078 | 16,449 | 323.9 | % | ||||||||||
Transaction costs | 1,531 | 4,542 | (3,011 | ) | (66.3 | )% | |||||||||
Asset management and other fees-related party | 28,080 | 20,543 | 7,537 | 36.7 | % | ||||||||||
General and administrative expenses | 16,558 | 7,101 | 9,457 | 133.2 | % | ||||||||||
Depreciation and amortization | 25,252 | 6,382 | 18,870 | 295.7 | % | ||||||||||
Total expenses | 151,327 | 55,132 | 96,195 | 174.5 | % | ||||||||||
Other income (loss) | |||||||||||||||
Realized gain (loss) on investments and other | 411 | — | 411 | N/A | |||||||||||
Gain (loss) on consolidation of unconsolidated venture | 6,408 | — | 6,408 | N/A | |||||||||||
Income (loss) before equity in earnings (losses) of unconsolidated ventures and income tax benefit (expense) | (27,693 | ) | (22,297 | ) | (5,396 | ) | 24.2 | % | |||||||
Equity in earnings (losses) of unconsolidated ventures | (31,469 | ) | (8,941 | ) | (22,528 | ) | 252.0 | % | |||||||
Income tax benefit (expense) | (7,124 | ) | 553 | (7,677 | ) | (1,388.2 | )% | ||||||||
Net income (loss) | $ | (66,286 | ) | $ | (30,685 | ) | $ | (35,601 | ) | 116.0 | % | ||||
Revenues
Resident Fee Income
Resident fee income increased $34.3 million, primarily as a result of the acquisition of the Fountains portfolio in June 2015, which included RIDEA properties, and an increase in occupancy for the six months ended June 30, 2016 as compared to the same period in 2015 for RIDEA properties owned during the entirety of both periods presented.
Rental Income
Rental income increased $46.4 million, primarily as a result of the acquisition of the remaining 60.0% interest in the Winterfell portfolio in March 2016, which is now 100% owned and consolidated, as well as the net lease properties included in the acquisition of the Fountains portfolio in June 2015.
Interest Income
Interest income increased $2.8 million, primarily as a result of the origination of one new debt investment, partially offset by the repayment of two debt investments in 2015.
Other Revenue
Other revenue of $0.5 million for the six months ended June 30, 2016 was a result of community fees and other miscellaneous fees from our real estate equity segment.
Expenses
Property Operating Expenses
Property operating expenses increased $46.9 million, primarily as a result of the acquisition of the RIDEA properties in the Fountains portfolio in June 2015 and the remaining 60% interest in the Winterfell portfolio in March 2016.
52
Interest Expense
Interest expense increased $16.4 million, primarily as a result of the new mortgage notes payable entered into in connection with the acquisition of the Fountains portfolio in June 2015 and the mortgage notes payable assumed in connection with the acquisition of the Winterfell portfolio in March 2016.
Transaction Costs
Transaction costs primarily represent professional fees associated with new investments. Transaction costs for the six months ended June 30, 2016 are primarily a result of the acquisition of the remaining 60% interest in the Winterfell portfolio in March 2016 and professional fees incurred related to the finalization of certain purchase price allocations related to 2015 investment activities during the current quarter. Transaction costs for the six months ended June 30, 2015 are a result of costs associated with the acquisition of the Fountains portfolio in June 2015.
Asset Management and Other Fees - Related Party
Asset management and other fees - related party increased $7.5 million, primarily as a result of an increase in our invested assets subsequent to June 30, 2015, offset by a decrease in acquisition fees related to a lower level of acquisition activity during the six months ended June 30, 2016.
General and Administrative Expenses
General and administrative expenses are incurred at the corporate level and include auditing and professional fees, director fees, organization and other costs associated with operating our business. General and administrative expenses increased $9.5 million, primarily as a result of increased operating costs from greater investment activity subsequent to June 30, 2015.
Depreciation and Amortization
Depreciation and amortization expense increased $18.9 million, primarily as a result of the acquisition of the Fountains portfolio in June 2015 and the remaining 60% interest in the Winterfell portfolio in March 2016.
Other Income (Loss)
Realized Gain (Loss) on Investments and Other
Realized gain on investments and other of $0.4 million for the six months ended June 30, 2016 was a result of a gain on sale of one Remainder Interest in the Watermark Fountains portfolio.
Gain (loss) on consolidation of unconsolidated venture
The gain of $6.4 million was attributable to an adjustment to the carrying value of our equity investment in the Winterfell portfolio as a result of the acquisition of the remaining equity interest in the portfolio in March 2016.
Equity in Earnings (Losses) of Unconsolidated Ventures and Income Tax Benefit (Expense)
Equity in Earnings (Losses) of Unconsolidated Ventures
Equity in losses of unconsolidated ventures increased $22.5 million primarily as a result of depreciation and amortization expense from underlying real estate portfolios acquired subsequent to June 30, 2015, via two separate joint ventures. Excluding depreciation and amortization of $30.7 million for all unconsolidated ventures, equity in earnings of unconsolidated ventures increased $8.3 million primarily as a result of operating income from the two post-June 30, 2015 joint ventures, non-recurring transaction costs incurred in 2015 with the acquisition of a 40% interest in the Winterfell portfolio, partially offset by an unrealized loss in foreign currency exchange at one of our portfolios.
Income Tax Benefit (Expense)
The income tax expense for the six months ended June 30, 2016 was $7.1 million related to our RIDEA properties, which operate through TRS. In the first quarter of 2016, we recorded a $7.0 million valuation allowance as we determined we will be unable to utilize a $7.0 million deferred tax asset. As of June 30, 2016, there are no changes in the facts and circumstances to indicate that we should release the valuation allowance. The income tax net benefit for the six months ended June 30, 2015 was $0.6 million related to our RIDEA properties, which operate through TRS.
53
Liquidity and Capital Resources
We require capital to fund our investment activities, operating expenses and to make distributions. We obtained the capital required to acquire and manage our healthcare real estate portfolio and conduct our operations from the proceeds of our Offering. We do not currently intend to conduct any future offerings, other than through our DRP. We may access additional capital from secured or unsecured financings from banks and other lenders, net proceeds from asset repayments and sales and from any undistributed funds from our operations. As of August 5, 2016, we had $121.7 million of investable cash.
Offering
From inception through August 5, 2016, we have raised total gross proceeds of $1.8 billion.
We are no longer raising capital from our Offering and we have invested a substantial majority of the net proceeds from our Offering. Since the successful completion of our Offering, we have only been raising new equity capital through our DRP, and as such, do not expect significant new investment activity. However, as investments are repaid or sold, we expect that those proceeds will be reinvested. Our inability to invest these proceeds could reduce our net income and limit our ability to make distributions. Further, we have certain fixed direct and indirect operating expenses, including certain expenses as a publicly-registered REIT. We expect our net income from operations will be sufficient to cover such expenses.
Our charter limits us from incurring borrowings that would exceed 300% of our net assets. We cannot exceed this limit unless any excess in borrowing over such level is approved by a majority of our independent directors. We would need to disclose any such approval to our stockholders in our next quarterly report along with the justification for such excess. An approximation of this leverage calculation, excluding indirect leverage held through our unconsolidated joint venture investments, is 75% of our assets, other than intangibles, before deducting loan loss reserves, other non-cash reserves and depreciation and as of June 30, 2016, our leverage was 49.4%. Once we have fully invested the proceeds of our Offering, we expect that our financing may approximate 50% of the cost of our investments, excluding indirect leverage held through our unconsolidated joint venture investments.
In addition to making investments in accordance with our investment objectives, we use or have used our capital resources to make certain payments to our Advisor, our Prior Advisor and our Dealer Manager. During our organization and offering stage, these payments included payments to our Dealer Manager for selling commissions and dealer manager fees and payments to our Advisor, Prior Advisor or their affiliates, as applicable, for reimbursement of certain organization and offering costs. Total selling commissions, dealer manager fees and reimbursable organization and offering costs through the completion of our Offering was 10.4% of total proceeds raised from our Offering, below the 15.0% maximum allowed. We expect to continue to make payments to our Advisor, or its affiliates, as applicable, in connection with the selection and acquisition or origination of investments, the management of our assets and costs incurred by our Advisor in providing services to us. On June 30, 2014, we entered into a new advisory agreement with our Advisor, on terms substantially similar to those set forth in our prior advisory agreement with our Prior Advisor, which has a one-year term but may be renewed for an unlimited number of successive one-year periods upon the mutual consent of our Advisor and our board of directors, including a majority of our independent directors. We renewed our advisory agreement with our Advisor on June 30, 2016 for an additional one-year term.
Cash Flows
The following presents a summary of our consolidated statements of cash flows for the six months ended June 30, 2016 and 2015 (dollars in thousands):
Six Months Ended June 30, | ||||||||||||
Cash flow provided by (used in): | 2016 | 2015 | Change | |||||||||
Operating activities | $ | (11,424 | ) | $ | (5,144 | ) | $ | (6,280 | ) | |||
Investing activities | (163,937 | ) | (762,832 | ) | 598,895 | |||||||
Financing activities | (34,703 | ) | 720,272 | (754,975 | ) | |||||||
Net increase (decrease) in cash | $ | (210,064 | ) | $ | (47,704 | ) | $ | (162,360 | ) | |||
Six Months Ended June 30, 2016 Compared to June 30, 2015
Operating Activities
Net cash used in operating activities was $11.4 million for the six months ended June 30, 2016 compared to net cash used in operating activities of $5.1 million for the six months ended June 30, 2015. The increase of $6.3 million in net cash used in operating activities was primarily related to investment activity during the period, resulting in an increase in fees paid to our Advisor for the management of our investments, and other general and administrative expenses, transaction costs and interest
54
expense due to additional borrowings on mortgage notes. This is partially offset by the net income generated from our real estate equity and debt investments.
Investing Activities
Net cash used in investing activities was $163.9 million for the six months ended June 30, 2016 compared to $762.8 million for the six months ended June 30, 2015. The decrease of $598.9 million in net cash used in investing activities was primarily related to less real estate equity investment activity for the six months ended June 30, 2016 compared to the six months ended June 30, 2015.
Financing Activities
Net cash used in financing activities was $34.7 million for the six months ended June 30, 2016 compared to net cash provided by financing activities of $720.3 million for the six months ended June 30, 2015. The decrease of $755.0 million in net cash provided by financing activities was primarily related to no new borrowings incurred to finance our investments, as well as fewer proceeds from the issuance of common stock since our Offering has ended. Net cash used in financing activities for the six months ended June 30, 2016 was primarily related to distributions paid on and redemption of our common stock offset by issuance of common stock under our DRP.
Off-Balance Sheet Arrangements
We have certain arrangements which do not meet the definition of off-balance sheet arrangements, but do have some of the characteristics of off-balance sheet arrangements. We have made investments in unconsolidated ventures. Refer to Note 4, “Investments in Unconsolidated Ventures” in Item 1. “Financial Statements” for a discussion of such unconsolidated ventures in our consolidated financial statements. In each case, our exposure to loss is limited to the carrying value of our investment.
Related Party Arrangements
Advisor
Subject to certain restrictions and limitations, our Advisor is responsible for managing our affairs on a day-to-day basis and for identifying, acquiring, originating and asset managing investments on our behalf. Our Advisor may delegate certain of its obligations to affiliated entities, which may be organized under the laws of the United States or foreign jurisdictions. References to our Advisor include our Advisor and any such affiliated entities. For such services, to the extent permitted by law and regulations, our Advisor receives fees and reimbursements from us. Below is a description and table of the fees and reimbursements incurred to our Advisor.
In June 2016, our advisory agreement was renewed for an additional one-year term commencing on June 30, 2016, with terms identical to those in effect through June 30, 2016.
Fees to Advisor
Asset Management Fee
Our Advisor receives a monthly asset management fee equal to one-twelfth of 1.0% of the sum of the amount funded or allocated for investments, including expenses and any financing attributable to such investments, less any principal received on debt and securities investments (or our proportionate share thereof in the case of an investment made through a joint venture).
Incentive Fee
Our Advisor is entitled to receive distributions equal to 15.0% of our net cash flows, whether from continuing operations, repayment of loans, disposition of assets or otherwise, but only after stockholders have received, in the aggregate, cumulative distributions equal to their invested capital plus a 6.75% cumulative, non-compounded annual pre-tax return on such invested capital.
Acquisition Fee
Our Advisor also receives fees for providing structuring, diligence, underwriting advice and related services in connection with real estate acquisitions equal to 2.25% of each real estate property acquired by us, including acquisition costs and any financing attributable to an equity investment (or the proportionate share thereof in the case of an indirect equity investment made through a joint venture or other investment vehicle) and 1.0% of the amount funded or allocated by us to acquire or originate debt investments, including acquisition costs and any financing attributable to such investments (or the proportionate share thereof in the case of an indirect investment made through a joint venture or other investment vehicle). An acquisition fee incurred related to an equity investment is generally expensed as incurred. A fee paid to our Advisor in connection with the acquisition of an equity or debt investment in an unconsolidated joint venture is generally included in investments in unconsolidated ventures on the consolidated balance sheets when the fair value option is not elected for the investment, but is expensed as incurred when the fair value option
55
is elected. A fee paid to our Advisor in connection with the origination or acquisition of debt investments is included in debt investments, net on the consolidated balance sheets and is amortized to interest income over the life of the investment using the effective interest method.
Disposition Fee
For substantial assistance in connection with the sale of investments and based on the services provided, as determined by our independent directors, our Advisor receives a disposition fee of 2.0% of the contract sales price of each property sold and 1.0% of the contract sales price of each debt investment sold. We do not pay a disposition fee upon the maturity, prepayment, workout, modification or extension of a debt investment unless there is a corresponding fee paid by our borrower, in which case the disposition fee is the lesser of: (i) 1.0% of the principal amount of the debt investment prior to such transaction; or (ii) the amount of the fee paid by our borrower in connection with such transaction. If we take ownership of a property as a result of a workout or foreclosure of a debt investment, we will pay a disposition fee upon the sale of such property. A disposition fee from the sale of an investment is generally expensed and included in asset management and other fees - related party in our consolidated statements of operations. A disposition fee for a debt investment incurred in a transaction other than a sale is included in debt investments, net on our consolidated balance sheets and is amortized to interest income over the life of the investment using the effective interest method.
Reimbursements to Advisor
Operating Costs
Our Advisor is entitled to receive reimbursement for direct and indirect operating costs incurred by our Advisor in connection with administrative services provided to us. Our Advisor allocates, in good faith, indirect costs to us related to our Advisor’s and its affiliates’ employees, occupancy and other general and administrative costs and expenses in accordance with the terms of, and subject to the limitations contained in, the advisory agreement with our Advisor. The indirect costs include our allocable share of our Advisor’s compensation and benefit costs associated with dedicated or partially dedicated personnel who spend all or a portion of their time managing our affairs, based upon the percentage of time devoted by such personnel to our affairs. The indirect costs also include rental and occupancy, technology, office supplies, travel and entertainment and other general and administrative costs and expenses. However, there is no reimbursement for personnel costs related to our executive officers (although there may be reimbursement for certain executive officers of our Advisor) and other personnel involved in activities for which our Advisor receives an acquisition fee or a disposition fee. Our Advisor allocates these costs to us relative to its and its affiliates’ other managed companies in good faith and has reviewed the allocation with our board of directors, including our independent directors. Our Advisor updates our board of directors on a quarterly basis of any material changes to the expense allocation and provides a detailed review to the board of directors, at least annually, and as otherwise requested by the board of directors. We reimburse our Advisor quarterly for operating costs (including the asset management fee) based on a calculation for the four preceding fiscal quarters not to exceed the greater of: (i) 2.0% of our average invested assets; or (ii) 25.0% of our net income determined without reduction for any additions to reserves for depreciation, loan losses or other similar non-cash reserves and excluding any gain from the sale of assets for that period. Notwithstanding the above, we may reimburse our Advisor for expenses in excess of this limitation if a majority of our independent directors determines that such excess expenses are justified based on unusual and non-recurring factors. We calculate the expense reimbursement quarterly based upon the trailing twelve-month period.
Organization and Offering Costs
Our Advisor was entitled to receive reimbursement for organization and offering costs paid on behalf of us in connection with our Offering. We are obligated to reimburse our Advisor, or its affiliates, as applicable, for organization and offering costs to the extent the aggregate of selling commissions, dealer manager fees and other organization and offering costs do not exceed 15% of gross proceeds from our Primary Offering. Our Advisor did not expect reimbursable organization and offering costs, including costs incurred in connection with our Follow-on Offering but excluding selling commissions and dealer manager fees, to exceed $22.5 million, or 1.5% of the total proceeds available to be raised from our Primary Offering. Based on gross proceeds of $1.7 billion from the Primary Offering, we incurred reimbursable organizational and offering costs, excluding selling commissions and dealer manager fees, of 1.0%, which was less than the 1.5% expected. Our independent directors did not determine that any of the organization and offering costs were unfair and commercially unreasonable.
Dealer Manager
Selling Commissions and Dealer Manager Fees
Pursuant to a dealer manager agreement, we paid our Dealer Manager selling commissions of up to 7.0% of gross proceeds from our Primary Offering, all of which were reallowed to participating broker-dealers. In addition, we paid our Dealer Manager a dealer manager fee of up to 3.0% of gross proceeds from our Primary Offering, a portion of which was typically reallowed to participating broker-dealers and paid to certain employees of our Dealer Manager. No selling commissions or dealer manager fees are paid for sales pursuant to our DRP.
56
Summary of Fees and Reimbursements
The following table presents the fees and reimbursements incurred to our Advisor and our Dealer Manager for the three and six months ended June 30, 2016 and 2015, and the amount due to related party as of June 30, 2016 and December 31, 2015 (dollars in thousands):
Three Months Ended June 30, | Six Months Ended June 30, | Due to Related Party as of | ||||||||||||||||||||||||
Type of Fee or Reimbursement | Financial Statement Location | 2016 | 2015 | 2016 | 2015 | June 30, 2016 | December 31, 2015 | |||||||||||||||||||
Fees to Advisor | ||||||||||||||||||||||||||
Asset management | Asset management and other fees-related party | $ | 8,367 | $ | 3,651 | $ | 15,832 | $ | 6,360 | $ | 15 | $ | 22 | |||||||||||||
Acquisition(1) | Real estate debt investments, net / investments in unconsolidated ventures / asset management and other fees-related party | 85 | 22,216 | 12,248 | 22,202 | 34 | 378 | |||||||||||||||||||
Disposition(1) | Real estate debt investments, net | — | — | — | — | — | — | |||||||||||||||||||
Reimbursements to Advisor | ||||||||||||||||||||||||||
Operating costs(2) | General and administrative expenses | 8,371 | 4,001 | 15,836 | 6,709 | 7 | 4 | |||||||||||||||||||
Organization | General and administrative expenses | — | 57 | — | 63 | — | — | |||||||||||||||||||
Offering | Cost of capital(3) | 23 | 1,867 | 447 | 2,552 | — | 39 | |||||||||||||||||||
Selling commissions / Dealer manager fees | Cost of capital(3) | — | 12,706 | 83 | 25,092 | — | — | |||||||||||||||||||
Total | $ | 56 | $ | 443 | ||||||||||||||||||||||
_____________________________
(1) | Acquisition/disposition fees incurred to our Advisor related to debt investments are generally offset by origination/exit fees paid to us by borrowers if such fees are required from the borrower. Acquisition fees related to equity investments are included in asset management and other fees-related party in our consolidated statements of operations. Acquisition fees related to investments in unconsolidated joint ventures are included in investments in unconsolidated ventures on our consolidated balance sheets. Our Advisor may determine to defer fees or seek reimbursements. |
(2) | As of June 30, 2016, our Advisor has incurred unreimbursed operating costs on our behalf of $0.8 million that remain eligible to allocate to us. |
(3) | Cost of capital is included in net proceeds from issuance of common stock in our consolidated statements of equity. |
NorthStar Realty Purchase of Common Stock
In January 2015, our board of directors approved an amended and restated distribution support agreement, or our Distribution Support Agreement, extending the term until February 6, 2017. Pursuant to our Distribution Support Agreement, NorthStar Realty committed to purchase up to an aggregate of $10.0 million in shares of our common stock at a price of $9.00 per share during our Initial Offering and at $9.18 per share during our Follow-on Offering, if cash distributions exceed MFFO to provide additional funds to support distributions to stockholders. In February 2013, NorthStar Realty purchased 222,223 shares of our common stock for $2.0 million under our Distribution Support Agreement to satisfy the minimum offering requirement, which reduced the total commitment. As of June 30, 2016, including the purchase of shares to satisfy the minimum offering requirement, NorthStar Realty purchased 588,116 shares of our common stock for $5.3 million. As our Follow-on Offering has now been completed, NorthStar Realty has no further obligation to purchase shares under the Distribution Support Agreement.
Investments in Joint Ventures
In May 2014, we, through a general partnership with NorthStar Realty, acquired a 5.6% interest in the Eclipse portfolio, a $1.1 billion healthcare portfolio, and contributed $23.4 million of cash for our interest in the investment. The purchase was approved by our board of directors, including all of our independent directors.
In December 2014, we, through a general partnership with NorthStar Realty, acquired a 14.3% interest in the Griffin-American portfolio for $187.2 million in cash, including our pro rata share of transaction costs. The purchase was approved by our board of directors, including all of our independent directors.
In connection with the acquisition of the Griffin-American portfolio by NorthStar Realty and us, our Sponsor acquired a 43%, as adjusted, ownership interest in American Healthcare Investors, LLC, or AHI and Mr. James F. Flaherty III, a strategic partner of
57
our Sponsor, acquired a 12.3% ownership interest in AHI. AHI is a healthcare-focused real estate investment management firm that co-sponsored and advised Griffin-American, until Griffin-American was acquired by us and NorthStar Realty. In connection with our Sponsor’s acquisition of an interest in AHI, AHI provides certain asset management and related services, including property management, to our Advisor, NorthStar Realty and us. AHI currently provides such services to us with respect to our interest in the Griffin-American portfolio and Winterfell portfolio. Following the substantial investment of our Offering proceeds, AHI will provide such services for all of our assets other than joint ventures with Formation. Consequently, AHI assists our Advisor in managing the Griffin-American and Winterfell portfolios and will assist with other healthcare assets owned by us in the future.
In December 2015, we, through a joint venture with Griffin-American Healthcare REIT III, Inc., or GAHR3, a REIT sponsored and advised by AHI, acquired a 29% interest in the Trilogy portfolio, a $1.2 billion healthcare portfolio, and contributed $201.7 million for this interest. The purchase was approved by our board of directors, including all of our independent directors. In June 2016, in accordance with its obligation under the joint venture agreement, we funded an additional capital contribution of $18.8 million for a total contribution of $220.5 million. The additional funding related to certain business initiatives, including the acquisition of additional senior housing and skilled nursing facilities and repayment of certain outstanding obligations.
In March 2016, we acquired NorthStar Realty’s 60.0% interest in a joint venture, or the Winterfell JV, which owns 32 private pay independent living facilities, or the Winterfell portfolio, for a purchase price of $534.5 million, excluding escrows and subject to customary proration and adjustments. The transaction was approved by our board of directors, including all of our independent directors, and validated by an independent third-party appraisal for the Winterfell portfolio. We originally acquired a 40.0% equity interest in the Winterfell JV in May 2015. We accordingly now own 100.0% of the equity in the Winterfell portfolio as of March 1, 2016 and consolidate the financial position. Prior to March 1, 2016, we accounted for our equity investment in the Winterfell JV as an unconsolidated venture under the equity method. For the three months ended March 31, 2016, we recognized $1.4 million in equity in earnings and received $0.6 million cash distributions.
Origination of Mezzanine Loan
In July 2015, we originated a $75.0 million mezzanine loan to a subsidiary of our joint venture with Formation and Safanad Management Limited, the Espresso joint venture, which bears interest at a fixed rate of 10.0% per year and matures in January 2021.
Recent Developments
Distribution Reinvestment Plan
For the period from July 1, 2016 through August 5, 2016, we issued 1.3 million shares pursuant to the DRP representing gross proceeds of $11.4 million.
Distributions
On August 10, 2016, our board of directors approved a daily cash distribution of $0.001844262 per share of common stock for each of the three months ended December 31, 2016. Distributions are generally paid to stockholders on the first business day of the month following the month for which the distribution was accrued.
Share Repurchases
From July 1, 2016 through August 5, 2016, we repurchased 0.5 million shares for a total of $4.7 million or a weighted average price of $8.94 per share under a share repurchase program, or our Share Repurchase Program, that enables stockholders to sell their shares to us in certain circumstances, including death or a qualifying disability. We fund repurchase requests received during a quarter with proceeds set aside for that purpose which are not expected to exceed proceeds received from our DRP.
Inflation
Some of our assets and liabilities are interest rate sensitive in nature. As a result, interest rates and other factors may influence our performance. A change in interest rates may correlate with the inflation rate. Substantially all of the leases allow for annual rent increases based on the greater of certain percentages or increase in the relevant consumer price index. Such types of leases generally minimize the risks of inflation on our healthcare properties.
Refer to Item 3. “Quantitative and Qualitative Disclosures About Market Risk” for additional details.
58
Non-GAAP Financial Measures
Funds from Operations and Modified Funds from Operations
We believe that FFO and MFFO, both of which are non-GAAP measures, are additional appropriate measures of the operating performance of a REIT and of us in particular. We compute FFO in accordance with the standards established by the National Association of Real Estate Investment Trusts, or NAREIT, as net income (loss) (computed in accordance with U.S. GAAP), excluding gains (losses) from sales of depreciable property, the cumulative effect of changes in accounting principles, real estate-related depreciation and amortization, impairment on depreciable property owned directly or indirectly and after adjustments for unconsolidated ventures.
Changes in the accounting and reporting rules under U.S. GAAP that have been put into effect since the establishment of NAREIT’s definition of FFO have prompted an increase in the non-cash and non-operating items included in FFO. For instance, the accounting treatment for acquisition fees related to business combinations has changed from being capitalized to being expensed. Additionally, publicly registered, non-traded REITs are typically different from traded REITs because they generally have a limited life followed by a liquidity event or other targeted exit strategy. Non-traded REITs typically have a significant amount of acquisition activity and are substantially more dynamic during their initial years of investment and operation as compared to later years when the proceeds from their initial public offering have been fully invested and when they may seek to implement a liquidity event or other exit strategy. However, it is likely that we will make investments past the acquisition and development stage, albeit at a substantially lower pace.
Acquisition fees paid to our Advisor in connection with the origination and acquisition of debt investments are amortized over the life of the investment as an adjustment to interest income under U.S. GAAP and are therefore included in the computation of net income (loss) and income (loss) before equity in earnings (losses) of unconsolidated ventures and income tax benefit (expense), both of which are performance measures under U.S. GAAP. We adjust MFFO for the amortization of acquisition fees in the period when such amortization is recognized under U.S. GAAP. Acquisition fees are paid in cash that would otherwise be available to distribute to our stockholders. In the event that proceeds from our Offering are not sufficient to fund the payment or reimbursement of acquisition fees and expenses to our Advisor, such fees would be paid from other sources, including new financing, operating cash flow, net proceeds from the sale of investments or from other cash flow. We believe that acquisition fees incurred by us negatively impact our operating performance during the period in which such investments are originated or acquired by reducing cash flow and therefore the potential distributions to our stockholders. However, in general, we earn origination fees for debt investments from our borrowers in an amount equal to the acquisition fees paid to our Advisor, and as a result, the impact of acquisition fees to our operating performance and cash flow would be minimal.
Acquisition fees and expenses paid to our Advisor and third parties in connection with the acquisition of equity investments are considered expenses and are included in the determination of net income (loss) and income (loss) before equity in earnings (losses) of unconsolidated ventures and income tax benefit (expense), both of which are performance measures under U.S. GAAP. Such fees and expenses will not be reimbursed by our Advisor or its affiliates and third parties, and therefore, if there are no further proceeds from the sale of shares of our common stock to fund future acquisition fees and expenses, such fees and expenses will need to be paid from either additional debt, operating earnings, cash flow or net proceeds from the sale of investments or properties. All paid and accrued acquisition fees and expenses will have negative effects on future distributions to stockholders and cash flow generated by us, unless earnings from operations or net sales proceeds from the disposition of other properties are generated to cover the purchase price of the property, these fees and expenses and other costs related to such property.
The origination and acquisition of debt investments and the corresponding acquisition fees paid to our Advisor (and any offsetting origination fees received from our borrowers) associated with such activity is a key operating feature of our business plan that results in generating income and cash flow in order to make distributions to our stockholders. Therefore, the exclusion for acquisition fees may be of limited value in calculating operating performance because acquisition fees affect our overall long-term operating performance and may be recurring in nature as part of net income (loss) and income (loss) before equity in earnings (losses) of unconsolidated ventures and income tax benefit (expense) over our life.
Due to certain of the unique features of publicly-registered, non-traded REITs, the Investment Program Association, or the IPA, an industry trade group, standardized a performance measure known as MFFO and recommends the use of MFFO for such REITs. Management believes MFFO is a useful performance measure to evaluate our business and further believes it is important to disclose MFFO in order to be consistent with the IPA recommendation and other non-traded REITs. MFFO that adjusts for items such as acquisition fees would only be comparable to non-traded REITs that have completed the majority of their acquisition activity and have other similar operating characteristics as us. Neither the SEC nor any other regulatory body has approved the acceptability of the adjustments that we use to calculate MFFO. In the future, the SEC or another regulatory body may decide to standardize permitted adjustments across the non-listed REIT industry and we may need to adjust our calculation and characterization of MFFO.
59
MFFO is a metric used by management to evaluate our future operating performance once our organization and offering and acquisition and development stages are complete and is not intended to be used as a liquidity measure. Although management uses the MFFO metric to evaluate future operating performance, this metric excludes certain key operating items and other adjustments that may affect our overall operating performance. MFFO is not equivalent to net income (loss) as determined under U.S. GAAP. In addition, MFFO is not a useful measure in evaluating net asset value, or NAV since an impairment is taken into account in determining NAV but not in determining MFFO.
We define MFFO in accordance with the concepts established by the IPA and adjust for certain items, such as accretion of a discount and amortization of a premium on borrowings and related deferred financing costs, as such adjustments are comparable to adjustments for debt investments and will be helpful in assessing our operating performance. We also adjust MFFO for the non-recurring impact of the non-cash effect of deferred income tax benefits or expenses, as applicable, as such items are not indicative of our operating performance. Similarly, we adjust for the non-cash effect of unrealized gains or losses on unconsolidated ventures. Our computation of MFFO may not be comparable to other REITs that do not calculate MFFO using the same method. MFFO is calculated using FFO. FFO, as defined by NAREIT, is a computation made by analysts and investors to measure a real estate company’s operating performance. The IPA’s definition of MFFO excludes from FFO the following items:
• | acquisition fees and expenses; |
• | non-cash amounts related to straight-line rent and the amortization of above or below market and in-place intangible lease assets and liabilities (which are adjusted in order to reflect such payments from an accrual basis of accounting under U.S. GAAP to a cash basis of accounting); |
• | amortization of a premium and accretion of a discount on debt investments; |
• | non-recurring impairment of real estate-related investments that meet the specified criteria identified in the rules and regulations of the SEC; |
• | realized gains (losses) from the early extinguishment of debt; |
• | realized gains (losses) on the extinguishment or sales of hedges, foreign exchange, securities and other derivative holdings except where the trading of such instruments is a fundamental attribute of our business; |
• | unrealized gains (losses) from fair value adjustments on real estate securities, including CMBS and other securities, interest rate swaps and other derivatives not deemed hedges and foreign exchange holdings; |
• | unrealized gains (losses) from the consolidation from, or deconsolidation to, equity accounting; |
• | adjustments related to contingent purchase price obligations; and |
• | adjustments for consolidated and unconsolidated partnerships and joint ventures calculated to reflect MFFO on the same basis as above. |
Certain of the above adjustments are also made to reconcile net income (loss) to net cash provided by (used in) operating activities, such as for the amortization of a premium and accretion of a discount on debt and securities investments, amortization of fees, any unrealized gains (losses) on derivatives, securities or other investments, as well as other adjustments.
MFFO excludes non-recurring impairment of real estate-related investments. We assess the credit quality of our investments and adequacy of reserves/impairment on a quarterly basis, or more frequently as necessary. Significant judgment is required in this analysis. With respect to debt investments, we consider the estimated net recoverable value of the loan as well as other factors, including but not limited to the fair value of any collateral, the amount and the status of any senior debt, the prospects for the borrower and the competitive situation of the region where the borrower does business. Fair value is typically estimated based on discounting expected future cash flow of the underlying collateral taking into consideration the discount rate, capitalization rate, occupancy, creditworthiness of major tenants and many other factors. This requires significant judgment and because it is based on projections of future economic events, which are inherently subjective, the amount ultimately realized may differ materially from the carrying value as of the balance sheet date. If the estimated fair value of the underlying collateral for the debt investment is less than its net carrying value, a loan loss reserve is recorded with a corresponding charge to provision for loan losses. With respect to a real estate investment, a property’s value is considered impaired if our estimate of the aggregate future undiscounted cash flow to be generated by the property is less than the carrying value of the property. The value of our investments may be impaired and their carrying values may not be recoverable due to our limited life. Investors should note that while impairment charges are excluded from the calculation of MFFO, investors are cautioned that due to the fact that impairments are based on estimated future undiscounted cash flow and the relatively limited term of a non-traded REIT’s anticipated operations, it could be difficult to recover any impairment charges through operational net revenues or cash flow prior to any liquidity event.
60
We believe that MFFO is a useful non-GAAP measure for non-traded REITs. It is helpful to management and stockholders in assessing our future operating performance once our organization and offering and acquisition and development stages are complete, because it eliminates from net income non-cash fair value adjustments on our real estate securities and acquisition fees and expenses that are incurred as part of our investment activities. However, MFFO may not be a useful measure of our operating performance or as a comparable measure to other typical non-traded REITs if we do not continue to operate in a similar manner to other non-traded REITs, including if we were to extend our acquisition and development stage or if we determined not to pursue an exit strategy.
However, MFFO does have certain limitations. For instance, the effect of any amortization or accretion on debt investments originated or acquired at a premium or discount, respectively, is not reported in MFFO. In addition, realized gains (losses) from acquisitions and dispositions and other adjustments listed above are not reported in MFFO, even though such realized gains (losses) and other adjustments could affect our operating performance and cash available for distribution. Stockholders should note that any cash gains generated from the sale of investments would generally be used to fund new investments. Any mark-to-market or fair value adjustments may be based on many factors, including current operational or individual property issues or general market or overall industry conditions.
Neither FFO nor MFFO is equivalent to net income (loss) or cash flow provided by operating activities determined in accordance with U.S. GAAP and should not be construed to be more relevant or accurate than the U.S. GAAP methodology in evaluating our operating performance. Neither FFO nor MFFO is necessarily indicative of cash flow available to fund our cash needs including our ability to make distributions to our stockholders. FFO and MFFO do not represent amounts available for management’s discretionary use because of needed capital replacement or expansion, debt service obligations or other commitments or uncertainties. Furthermore, neither FFO nor MFFO should be considered as an alternative to net income (loss) as an indicator of our operating performance.
The following table presents a reconciliation of net income (loss) attributable to common stockholders to FFO and MFFO attributable to common stockholders (dollars in thousands):
Three Months Ended June 30, | Six Months Ended June 30, | ||||||||||||||
2016 | 2015 | 2016 | 2015 | ||||||||||||
Funds from operations: | |||||||||||||||
Net income (loss) attributable to NorthStar Healthcare Income, Inc. common stockholders | $ | (27,869 | ) | $ | (25,519 | ) | $ | (66,167 | ) | $ | (30,533 | ) | |||
Adjustments: | |||||||||||||||
Depreciation and amortization | 13,429 | 4,697 | 25,252 | 6,382 | |||||||||||
Depreciation and amortization related to unconsolidated ventures | 22,418 | 7,894 | 44,474 | 14,134 | |||||||||||
Depreciation and amortization related to non-controlling interests | (175 | ) | (95 | ) | (392 | ) | (112 | ) | |||||||
Funds from operations attributable to NorthStar Healthcare Income, Inc. common stockholders | $ | 7,803 | $ | (13,023 | ) | $ | 3,167 | $ | (10,129 | ) | |||||
Modified funds from operations: | |||||||||||||||
Funds from operations attributable to NorthStar Healthcare Income, Inc. common stockholders | $ | 7,803 | $ | (13,023 | ) | $ | 3,167 | $ | (10,129 | ) | |||||
Adjustments: | |||||||||||||||
Acquisition fees and transaction costs | 334 | 17,305 | 13,779 | 18,706 | |||||||||||
Straight-line rental (income) loss | (126 | ) | (787 | ) | (686 | ) | (1,445 | ) | |||||||
Amortization of premiums, discounts and fees on investments and borrowings, net | 473 | 419 | 914 | 748 | |||||||||||
Deferred tax (benefit) expense | — | (557 | ) | 7,026 | (782 | ) | |||||||||
Adjustments related to unconsolidated ventures(1) | 5,249 | 4,367 | 9,163 | 6,315 | |||||||||||
Adjustments related to non-controlling interests | 4 | (130 | ) | (5 | ) | (128 | ) | ||||||||
Realized (gain) loss on investments and other | (411 | ) | — | (411 | ) | — | |||||||||
(Gain) loss on consolidation of unconsolidated venture | — | — | (6,408 | ) | — | ||||||||||
Other | (213 | ) | — | — | — | ||||||||||
Modified funds from operations attributable to NorthStar Healthcare Income, Inc. common stockholders | $ | 13,113 | $ | 7,594 | $ | 26,539 | $ | 13,285 | |||||||
(1) | Primarily represents our proportionate share of transaction costs and amortization of above/below market debt adjustments and deferred financing costs incurred through our investments in unconsolidated ventures. |
61
Distributions Declared and Paid
We generally pay distributions on a monthly basis based on daily record dates. Based on our estimated net asset value per share of $8.63 as of December 31, 2015, our annualized distribution amount represents an effective current yield of 7.8%. From the date of our first investment on April 5, 2013 through June 30, 2016, we paid an annualized distribution amount of $0.675 per share of our common stock. Distributions are generally paid to stockholders on the first business day of the month following the month for which the distribution has accrued.
The following table presents distributions declared for the six months ended June 30, 2016 and year ended December 31, 2015 (dollars in thousands):
Six Months Ended June 30, 2016 | Year Ended December 31, 2015 | |||||||||||
Distributions(1) | ||||||||||||
Cash | $ | 26,988 | $ | 38,972 | ||||||||
DRP | 33,742 | 49,299 | ||||||||||
Total | $ | 60,730 | $ | 88,271 | ||||||||
Sources of Distributions(1) | ||||||||||||
FFO(2) | $ | 3,167 | 5 | % | $ | — | — | % | ||||
Offering proceeds - Distribution support | — | — | % | 2,614 | 3 | % | ||||||
Offering proceeds - Other | 57,563 | 95 | % | 85,657 | 97 | % | ||||||
Total | $ | 60,730 | 100 | % | $ | 88,271 | 100 | % | ||||
Cash Flow Provided by (Used in) Operations | $ | (11,424 | ) | $ | (8,563 | ) | ||||||
_______________________________________________________
(1) | Represents distributions declared for such period, even though such distributions are actually paid to stockholders the month following such period. |
(2) | From inception of our first investment on April 5, 2013 through June 30, 2016, we declared $177.0 million in distributions. Cumulative FFO for the period from April 5, 2013 through June 30, 2016 was $(19.7) million. |
Distributions in excess of our cash flow provided by operations were paid using Offering proceeds, including from the purchase of additional shares by NorthStar Realty. Over the long-term, we expect that our distributions will be paid entirely from cash flow provided by operations. However, our operating performance cannot be accurately predicted and may deteriorate in the future due to numerous factors, including our ability to raise and invest capital at favorable yields, the financial performance of our investments in the current real estate and financial environment, the type and mix of our investments and accounting of our investments in accordance with U.S. GAAP. Future distributions declared and paid may exceed cash flow provided by operations. To the extent distributions are paid from sources other than FFO, the ownership interest of our public stockholders will be diluted.
Item 3. Quantitative and Qualitative Disclosures About Market Risk
We are primarily subject to interest rate risk and credit risk. These risks are dependent on various factors beyond our control, including monetary and fiscal policies, domestic and international economic conditions and political considerations. Our market risk sensitive assets, liabilities and related derivative positions (if any) are held for investment and not for trading purposes.
Interest Rate Risk
Changes in interest rates may affect our net income as a result of changes in interest expense incurred in connection with floating-rate borrowings used to finance our equity investments, as well as changes in net interest income of our real estate debt investments. As of June 30, 2016, 6.2% of our total borrowings were floating rate liabilities and 61.2% of our real estate debt investments were floating rate investments. Of the floating rate liabilities, 100% related to our directly owned operating real estate equity investment mortgage notes payable.
Our interest rate risk management objectives are to limit the impact of interest rate changes on earnings, prepayment penalties and cash flows and to lower overall borrowing costs by borrowing primarily at fixed rates or variable rates with the lowest margins available and by evaluating hedging opportunities.
For longer duration, relatively stable real estate cash flows such as those derived from net lease assets, we seek to use fixed rate financing. For real estate cash flows with greater growth potential such as properties operating under a RIDEA structure, we may
62
use floating rate financing which provides prepayment flexibility and may provide a better match between underlying cash flow projections and potential increases in interest rates.
Our debt investments bear interest at either a floating or fixed-rate. The interest rate on our floating-rate assets is a fixed spread over an index such as LIBOR and typically reprices every 30 days based on LIBOR in effect at the time. Currently, some of our floating-rate debt investments have a fixed minimum LIBOR floor. We will not benefit from an increase in LIBOR until it is in excess of the LIBOR floors. Given the frequent and periodic repricing of our floating-rate assets, changes in benchmark interest rates are unlikely to materially affect the value of our floating-rate portfolio. Changes in short-term rates will, however, affect income from our investments and expenses from our borrowings. As of June 30, 2016, a hypothetical 100 basis point increase in interest rates (including the effect of the interest rate floor) would increase interest income by $1.2 million and interest expense by $0.8 million, respectively, for a net income increase of $0.4 million annually.
A change in interest rates could affect the value of our fixed-rate debt investments. For instance, an increase in interest rates would result in a higher required yield on investments, which would decrease the value on existing fixed-rate investments in order to adjust their yields to current market levels. As of June 30, 2016, we had one fixed-rate debt investment with a carrying value of $74.5 million.
Credit Spread Risk
The value of our fixed and floating-rate investments also changes with market credit spreads. This means that when market-demanded risk premium, or credit spread, increases, the value of our fixed and floating-rate assets decrease and vice versa. Fixed-rate assets are valued based on a market credit spread over the rate payable on fixed-rate U.S. Treasury of like maturity. This means that their value is dependent on the yield demanded on such assets by the market, based on their credit relative to U.S. Treasuries. The floating-rate debt and securities investments are valued based on a market credit spread over the applicable LIBOR. Demand for a higher yield on investments results in higher or “wider” spread over the benchmark rate (usually the applicable U.S. Treasury yield) to value these assets. Under these conditions, the value of our portfolio should decrease. Conversely, if the spread used to value these assets were to decrease or “tighten,” the value of these assets should increase.
Credit Risk
We are subject to the credit risk of the operators or managers of our healthcare properties. We undertake a rigorous credit evaluation of each healthcare operator prior to acquiring healthcare properties. This analysis includes an extensive due diligence investigation of the operator or manager’s business as well as an assessment of the strategic importance of the underlying real estate to the operator or manager’s core business operations. Where appropriate, we may seek to augment the operator or manager’s commitment to the facility by structuring various credit enhancement mechanisms into the underlying leases, management agreements or joint venture arrangements. These mechanisms could include security deposit requirements or guarantees from entities we deem creditworthy. In addition, we actively monitor lease coverage at each facility within our healthcare portfolio. The extent of pending or future healthcare regulation may have a material impact on the valuation and financial performance of this portion of our portfolio. For the six months ended June 30, 2016, gross revenues from two of our operators, Watermark Retirement Communities and Holiday Retirement Communities, represented 52.5% and 33.8%, respectively, of our total revenues attributable to direct investments.
Credit risk in our debt investments relates to each individual borrower’s ability to make required interest and principal payments on scheduled due dates. We seek to manage credit risk through our Advisor’s comprehensive credit analysis prior to making an investment, actively monitoring our portfolio and the underlying credit quality, including subordination and diversification of our portfolio. Our analysis is based on a broad range of real estate, financial, economic and borrower-related factors which we believe are critical to the evaluation of credit risk inherent in a transaction. For the six months ended June 30, 2016, three debt investments each contributed more than 10.0% of interest income. As of June 30, 2016, one borrower, Sava Senior Care represented 53.7% of the aggregate principal amount of our debt investments.
63
Item 4. Controls and Procedures
Disclosure Controls and Procedures
As of the end of the period covered by this report, management conducted an evaluation as required under Rules 13a-15(b) and 15d-15(b) under the Securities Exchange Act of 1934, as amended, or Exchange Act, under the supervision and with the participation of the Company’s Chief Executive Officer and Chief Financial Officer of the effectiveness of the Company’s disclosure controls and procedures (as defined in Rules 13a-15(e) and 15d-15(e) under the Exchange Act).
Based on this evaluation, the Company’s Chief Executive Officer and Chief Financial Officer concluded that, as of the end of the period covered by this report, the Company’s disclosure controls and procedures are effective. Notwithstanding the foregoing, a control system, no matter how well designed and operated, can provide only reasonable, not absolute, assurance that it will detect or uncover failures to disclose material information otherwise required to be set forth in the Company’s periodic reports.
Internal Control over Financial Reporting
Changes in Internal Control over Financial Reporting.
Except as set forth below, there have not been any changes in the Company’s internal control over financial reporting (as defined in Rules 13a-15(f) and 15d-15(f) under the Exchange Act) during the most recent fiscal quarter that materially affected, or are reasonably likely to materially affect, the Company’s internal control over financial reporting.
We acquired the remaining 60% interest in the Winterfell portfolio on March 1, 2016. SEC guidance permits management to omit an assessment of an acquired business’ internal control over financial reporting from management’s assessment of internal control over financial reporting for a period not to exceed one year from the date of the acquisition. We are in the process of evaluating the existing controls and procedures of the Winterfell portfolio and, accordingly, we have not assessed the Winterfell portfolio’s internal control over financial reporting as of June 30, 2016.
64
PART II. Other Information
Item 1. Legal Proceedings
We may be involved in various litigation matters arising in the ordinary course of our business. Although we are unable to predict with certainty the eventual outcome of any litigation, in the opinion of management, any current legal proceedings are not expected to have a material adverse effect on our financial position or results of operations.
Item 1A. Risk Factors
There are no material changes from the risk factors previously disclosed in our Annual Report on Form 10-K for the fiscal year ended December 31, 2015, as filed with the SEC on March 28, 2016, except as noted below.
If we pay distributions from sources other than our cash flow provided by operations, we will have less cash available for investments and your overall return may be reduced.
Our organizational documents permit us to pay distributions from any source, including Offering proceeds, borrowings or sales of assets. We have not established a limit on the amount of proceeds we may use to fund distributions. Until the proceeds from our Offering are fully invested and otherwise during the course of our existence, we may not generate sufficient cash flow from operations to fund distributions. For the six months ended June 30, 2016, we declared distributions of $60.7 million compared to cash used in operating activities of $11.4 million and $60.7 million, or 100.0%, of the distributions declared during this period were paid using proceeds from our Offering. For the year ended December 31, 2015, we declared distributions of $88.3 million compared to cash used in operations of $8.6 million and $88.3 million, or 100.0%, of the distributions declared during this period were paid using proceeds from our Offering. If we pay distributions from sources other than our cash flow provided by operations, we will have less cash available for investments and your overall return may be reduced.
Our Sponsor, the parent company of our Advisor, announced that it entered into a merger agreement with Colony and NorthStar Realty, which could have an adverse impact on our business.
In June 2016, NSAM, our Sponsor and the parent company of our Advisor, announced that it entered into a merger agreement with Colony and NorthStar Realty, providing for the combination of NSAM, NorthStar Realty and Colony, which following the effective time of the mergers, will be publicly-traded and named Colony NorthStar, Inc., or Colony NorthStar. As a result of the mergers, Colony NorthStar will be an internally-managed equity REIT, with a diversified real estate and investment management platform. In addition, as a result of the mergers, our Advisor and Dealer Manager will be subsidiaries of Colony NorthStar.
The proposed mergers may be time consuming and disruptive to NSAM’s business operations, including its service to us as our Advisor and our Sponsor. It is also expected that, as part of the mergers, there will be changes to the composition of NSAM’s board of directors, certain members of its senior management team and certain members of our Advisor’s investment committee. In addition, it may be difficult for Colony NorthStar to address integration challenges following the completion of the mergers, and the anticipated benefits of the integration of the three companies may not be realized fully or at all. These changes to our Sponsor and our Advisor could be disruptive to our business and operations, as we are dependent on our Advisor for the management of our day-to-day affairs. Further, the completion of the mergers may give rise to additional conflicts of interest and competition for investment opportunities among Colony NorthStar, us and other companies managed by Colony NorthStar.
The proposed mergers are subject to customary closing conditions and there can be no assurance that they will be consummated. In the event that the proposed mergers are not consummated, NSAM will have expended considerable resources but neither we nor NSAM will realize any expected benefits of the proposed mergers. In addition, if the merger transaction is consummated, any value created for NSAM’s stockholders may not result in the creation of value for our stockholders.
Item 2. Unregistered Sales of Equity Securities and Use of Proceeds
Use of Proceeds from Registered Securities
On August 7, 2012, our registration statement on Form S-11 (File No. 333-170802), covering our Initial Offering of up to 110,526,315 shares of common stock was declared effective under Securities Act of 1933, as amended, or the Securities Act. We completed our Initial Offering on February 2, 2015 and all of the shares initially registered were issued.
On February 6, 2015, our registration statement on Form S-11 (File No. 333-199125), covering our Follow-on Offering of up to $700.0 million which included up to $500.0 million in shares pursuant to our Follow-on Primary Offering and up to $200.0 million in shares pursuant to our Follow-on DRP, was declared effective under the Securities Act. We offered shares of common stock pursuant to our Follow-on Offering at $10.20 per share with discounts available to certain categories of purchasers and shares of common stock pursuant to our DRP at $9.69 per share. We stopped accepting subscriptions for our Follow-on Offering on December 17, 2015 and all of the shares initially registered for our Offering were issued on or before January 19, 2016. We registered an
65
additional 30.0 million shares to be offered pursuant to our DRP beyond the completion of our Offering and continue to offer such shares.
As of June 30, 2016, we issued the following shares of common stock and raised the following gross proceeds (dollars and shares in thousands):
Shares | Proceeds | |||||
Primary Offering | 173,438 | $ | 1,742,290 | |||
DRP | 9,764 | 92,833 | ||||
Total | 183,202 | $ | 1,835,123 | |||
For the period from the commencement of our Follow-on Offering through June 30, 2016, we issued 69.1 million shares of common stock generating total gross proceeds of $700.0 million pursuant to our Follow-on Offering, including 4.2 million shares of common stock and $40.5 million of gross proceeds pursuant to our Follow-on DRP.
From the commencement of our Offering through June 30, 2016, we incurred $117.5 million in selling commissions, $52.1 million in dealer manager fees and $11.5 million in other offering costs in connection with the issuance and distribution of our registered securities and $138.8 million of these costs have been reallowed to third parties.
From the commencement of our Offering through June 30, 2016, the net proceeds to us from our Offering, after deducting the total expenses incurred described above, were $1.6 billion. From the commencement of our Offering through June 30, 2016, we used proceeds of $1.1 billion to purchase real estate equity investments, $219.4 million to acquire and originate real estate debt investments and $73.1 million to pay our Advisor acquisition fees.
Purchases of Equity Securities by the Issuer and Affiliated Purchasers
We adopted our Share Repurchase Program effective August 7, 2012, as amended on April 7, 2016, which enables stockholders to sell their shares to us in limited circumstances. We may not repurchase shares unless a stockholder has held shares for at least one year. However, we may repurchase shares held for less than one year in connection with a stockholder’s death or qualifying disability. We will repurchase shares within two years of such death or qualifying disability of a stockholder at the higher of the price paid for the shares, as adjusted for any stock dividends, combinations, splits, recapitalizations or any similar transaction with respect to the shares of common stock, or our estimated value per share. A qualifying disability is a disability as such term is defined in Section 72(m)(7) of the Internal Revenue Code that arises after the purchase of the shares requested to be repurchased. We are not obligated to repurchase shares under our Share Repurchase Program. Except in the case of death or qualifying disability (as described above), the price paid for shares redeemed under the Share Repurchase Program for requests received after April 30, 2016 is 100% of the most recently disclosed estimated value per share.
We fund repurchase requests received during a quarter with proceeds set aside for that purpose which are not expected to exceed proceeds received from our DRP. However, to the extent that the aggregate DRP proceeds are not sufficient to fund repurchase requests, our board of directors may, in its sole discretion, choose to use other sources of funds. Our board of directors may, in its sole discretion, amend, suspend or terminate our Share Repurchase Program at any time provided that any amendment that adversely affects the rights or obligations of a participant (as determined in the sole discretion of our board of directors) will only take effect upon ten days’ prior written notice except that changes in the number of shares that can be repurchased during any calendar year will take effect only upon ten business days’ prior written notice. In addition, our Share Repurchase Program will terminate in the event a secondary market develops for our shares or if our shares are listed on a national exchange or included for quotation in a national securities market.
66
For the three months ended June 30, 2016, we repurchased shares of our common stock as follows:
Period | Total Number of Shares Purchased | Average Price Paid Per Share | Total Number of Shares Purchased as Part of Publicly Announced Plan or Program | Maximum Approximate Dollar Value of Shares that May Yet Be Purchased Under the Plan or Program | ||||||||
April 1 to April 30 | 266,860 | $ | 9.50 | 266,860 | (1) | |||||||
May 1 to May 31 | — | — | — | (1) | ||||||||
June 1 to June 30 | — | — | — | (1) | ||||||||
Total | 266,860 | $ | 9.50 | 266,860 | ||||||||
________________________
(1) | Subject to funds being available, we will limit the number of shares repurchased pursuant to our Share Repurchase Program to: (i) 5.0% of the weighted average number of shares of our common stock outstanding during the prior calendar year; and (ii) those that could be funded from the net DRP proceeds in the prior calendar year plus such additional funds as may be reserved for that purpose by our board of directors; provided, however, that the above volume limitations shall not apply to repurchases requested within two years after the death or qualifying disability of a stockholder. |
As of June 30, 2016, we had no unfulfilled repurchase requests.
Unregistered Sales of Equity Securities
On June 24, 2016, we granted 4,635 shares of restricted common stock at $8.63 per share to each of our independent directors for an aggregate of 13,905 shares of restricted common stock, pursuant to our independent director compensation plan. These shares were issued pursuant to an exemption from registration under Section 4(a)(2) of the Securities Act for transactions not involving a public offering.
67
Item 6. Exhibits
Exhibit Number | Description of Exhibit | |
3.1 | Articles of Amendment and Restatement of NorthStar Healthcare Income, Inc. (filed as Exhibit 3.1 to Pre-Effective Amendment No. 7 to the Company’s Registration Statement on Form S-11 (File No. 333-170802) and incorporated herein by reference) | |
3.2 | Certificate of Correction of the Articles of Amendment and Restatement of NorthStar Healthcare Income, Inc. (filed as Exhibit 3.2 to the Company’s Quarterly Report on Form 10-Q for the quarter ended September 30, 2012 and incorporated herein by reference) | |
3.3 | Fourth Amended and Restated Bylaws of NorthStar Healthcare Income, Inc. (filed as Exhibit 3.3 to the Company’s Quarterly Report on Form 10-Q for the quarter ended June 30, 2013 and incorporated herein by reference) | |
31.1* | Certification by the Chief Executive Officer pursuant to 17 CFR 240.13a-14(a)/15(d)-14(a), as adopted pursuant to Section 302 of the Sarbanes-Oxley Act of 2002 | |
31.2* | Certification by the Chief Financial Officer pursuant to 17 CFR 240.13a-14(a)/15(d)-14(a), as adopted pursuant to Section 302 of the Sarbanes-Oxley Act of 2002 | |
32.1* | Certification by the Chief Executive Officer pursuant to Rule 13a-14(b) under the Securities Exchange Act of 1934 and 18 U.S.C. Section 1350, as adopted pursuant to Section 906 of the Sarbanes-Oxley Act of 2002 | |
32.2* | Certification by the Chief Financial Officer pursuant to Rule 13a-14(b) under the Securities Exchange Act of 1934 and 18 U.S.C. Section 1350, as adopted pursuant to Section 906 of the Sarbanes-Oxley Act of 2002 | |
101* | The following materials from the NorthStar Healthcare Income, Inc. Quarterly Report on Form 10-Q for the quarterly period ended June 30, 2016, formatted in XBRL (eXtensible Business Reporting Language): (i) Consolidated Balance Sheets as of June 30, 2016 (unaudited) and December 31, 2015; (ii) Consolidated Statements of Operations (unaudited) for the three and six months ended June 30, 2016 and 2015; (iii) Consolidated Statements of Equity for the six months ended June 30, 2016 (unaudited) and the year ended December 31, 2015; (iv) Consolidated Statements of Cash Flows (unaudited) for the six months ended June 30, 2016 and 2015; and (v) Notes to Consolidated Financial Statements (unaudited) | |
______________________________________________________
* | Filed herewith |
68
SIGNATURES
Pursuant to the requirements of Section 13 or 15(d) of the Securities Exchange Act of 1934, the Registrant has duly caused this report to be signed on its behalf by the undersigned thereunto duly authorized.
NorthStar Healthcare Income, Inc. | ||||
Date: | August 11, 2016 | By: | /s/ RONALD J. JEANNEAULT | |
Name: | Ronald J. Jeanneault | |||
Title: | Chief Executive Officer and President | |||
By: | /s/ FRANK V. SARACINO | |||
Name: | Frank V. Saracino | |||
Title: | Chief Financial Officer and Treasurer | |||
69