Attached files
| file | filename |
|---|---|
| 8-K - 8-K - Cotiviti Holdings, Inc. | cotv-20160810x8k.htm |
|
|
Safe harbor Forward-Looking Statements This presentation contains forward-looking statements within the meaning of the “safe harbor” provisions of the Private Securities Litigation Reform Act of 1995. These statements are subject to risks and uncertainties. All statements other than statements of historical fact or relating to present facts or current conditions included in this presentation are forward-looking statements. Forward-looking statements give our current expectations and projections relating to our financial condition, results of operations, plans, objectives, future performance and business. You can identify forward-looking statements by the fact that they do not relate strictly to historical or current facts. These statements may include words such as “anticipate,” “estimate,” “expect,” “project,” “seek,” “plan,” “intend,” “believe,” “will,” “may,” “could,” “continue,” “likely,” “should,” and other words. The forward-looking statements contained in this presentation are based on assumptions that we have made in light of our industry experience and our perceptions of historical trends, current conditions, expected future developments and other factors that we believe are appropriate under the circumstances. These statements are not guarantees of performance or results. These assumptions and our future performance or results involve risks and uncertainties (many of which are beyond our control). Important factors that could cause actual results to differ materially from those in the forward-looking statements include regional, national or global political, economic, business, competitive, market and regulatory conditions and the following: our inability to successfully leverage our existing client base by expanding the volume of claims reviewed and cross-selling additional solutions; improvements to healthcare claims and retail billing processes reducing the demand for our solutions or rendering our solutions unnecessary; healthcare spending fluctuations; our clients declining to renew their agreements with us or renewing at lower performance fee levels; inability to develop new client relationships; delays in implementing our solutions; system interruptions or failures, including cyber-security breaches, identity theft or other disruptions that could compromise our information; our failure to innovate and develop new solutions for our clients; our failure to comply with applicable privacy, security and data laws, regulations and standards; changes in regulations governing healthcare administration and policies, including governmental restrictions on the outsourcing of functions such as those that we provide; loss of a large client; consolidation among healthcare payers or retailers; slow development of the healthcare payment accuracy market; negative publicity concerning the healthcare payment industry or patient confidentiality and privacy; significant competition for our solutions; our inability to protect our intellectual property rights, proprietary technology, information, processes and know-how; compliance with current and future regulatory requirements; declines in contracts awarded through competitive bidding or our inability to re-procure contracts through the competitive bidding process; our failure to accurately estimate the factors upon which we base our contract pricing; our inability to manage our growth; our inability to successfully integrate and realize synergies from the merger of Connolly Superholdings, Inc. and iHealth Technologies, Inc. in May 2014 or any future acquisitions or strategic partnerships; our failure to maintain or upgrade our operational platforms; our failure to reprocure our Medicare Recovery Audit Contractor program contract; litigation, regulatory or dispute resolution proceedings, including claims or proceedings related to intellectual property infringements; our inability to expand our retail business; our inability to manage our relationships with information suppliers, software vendors or utility providers; fluctuation in our results of operations; changes in tax rates; risks associated with international operations; our inability to realize the book value of intangible assets; our success in attracting and retaining qualified employees and key personnel; and general economic, political and market forces and dislocations beyond our control. Additional factors or events that could cause our actual performance to differ from these forward-looking statements may emerge from time to time, and it is not possible for us to predict all of them. Should one or more of these risks or uncertainties materialize, or should any of our assumptions prove incorrect, our actual financial condition, results of operations, future performance and business may vary in material respects from the performance projected in these forward-looking statements. Any forward-looking statement made by us in this presentation speaks only as of the date on which it is made. We undertake no obligation to publicly update or revise any forward-looking statement, whether as a result of new information, future developments or otherwise, except as may be required by law. Market data and industry information used throughout this presentation are based on management’s knowledge of the industry and the good faith estimates of management. We also relied, to the extent available, upon management’s review of independent industry surveys and publications and other publicly available information prepared by a number of third party sources. All of the market data and industry information used in this presentation involves a number of assumptions and limitations, and you are cautioned not to give undue weight to such estimates. Although we believe that these sources are reliable, we cannot guarantee the accuracy or completeness of this information, and we have not independently verified this information. While we believe the estimated market position, market opportunity and market size information included in this presentation are generally reliable, such information, which is derived in part from management’s estimates and beliefs, is inherently uncertain and imprecise. Projections, assumptions and estimates of our future performance and the future performance of the industry in which we operate are necessarily subject to a high degree of uncertainty and risk due to a variety of factors, including those described above. These and other factors could cause results to differ materially from those expressed in our estimates and beliefs and in the estimates prepared by independent parties. Non-GAAP Financial Measures We present Adjusted EBITDA and Free Cash Flow to help us describe our operating performance. Our presentation of Adjusted EBITDA and Free Cash Flow are intended as a supplemental measures of our performance that are not required by, or presented in accordance with, U.S. generally accepted accounting principles (“GAAP”). Adjusted EBITDA should not be considered as an alternative to operating income (loss), net income (loss), earnings per share or any other performance measures derived in accordance with U.S. GAAP as measures of operating performance or operating cash flows or as measures of liquidity. Our presentation of Adjusted EBITDA and Free Cash Flow should not be construed to imply that our future results will be unaffected by these items. See the appendix to this presentation for a reconciliation of Adjusted EBITDA to net income (loss). |
|
|
Strategic Overview Doug Williams, CEO |
|
|
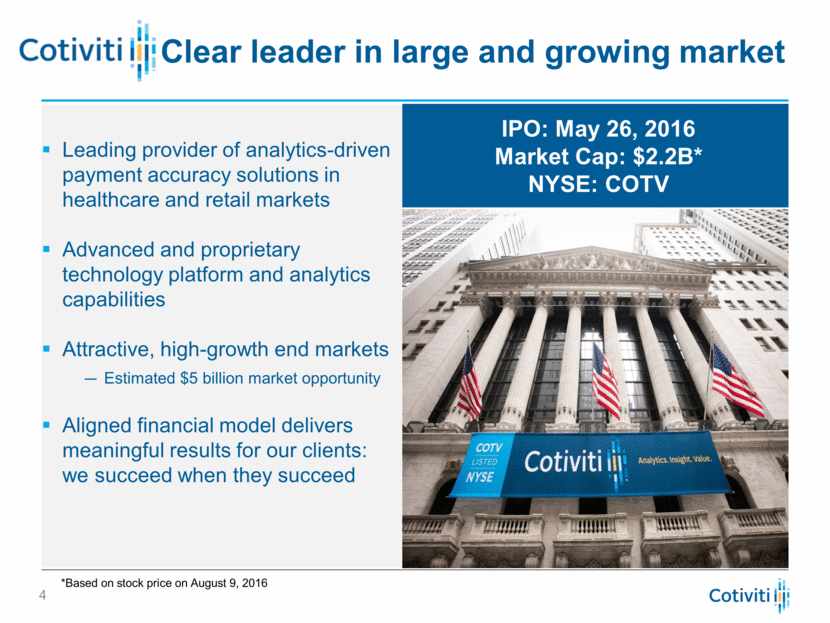
Clear leader in large and growing market Leading provider of analytics-driven payment accuracy solutions in healthcare and retail markets Advanced and proprietary technology platform and analytics capabilities Attractive, high-growth end markets Estimated $5 billion market opportunity Aligned financial model delivers meaningful results for our clients: we succeed when they succeed IPO: May 26, 2016 Market Cap: $2.2B* NYSE: COTV *Based on stock price on August 9, 2016 |
|
|
First Half 2016 Highlights: 19% revenue growth; 58% net income increase; 20% adjusted EBITDA increase On track to exceed 2015 $3.2 billion of savings for clients Significant progress towards capturing estimated $5 billion market opportunity Expanding engagements with existing clients New client wins Cross-selling solutions Demonstrated Record of Growth |
|
|
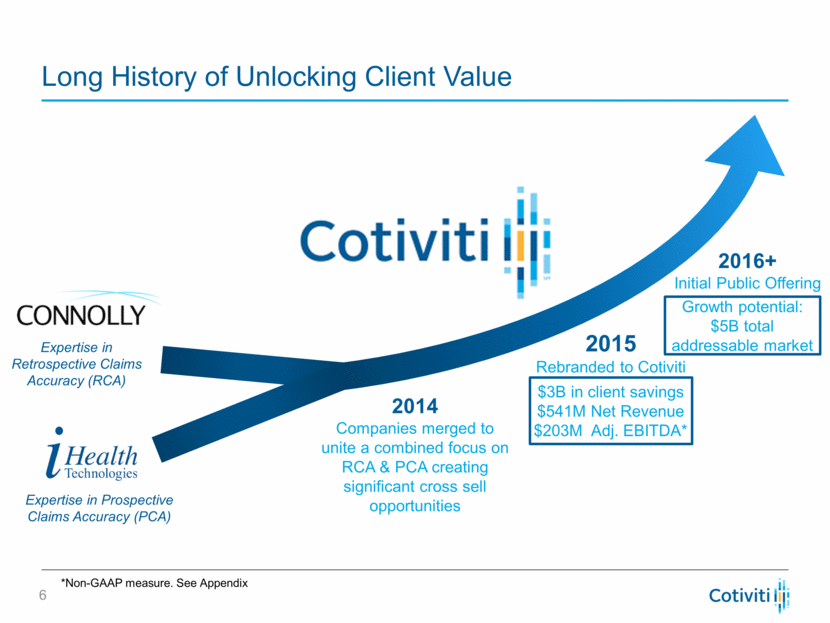
Long History of Unlocking Client Value Expertise in Retrospective Claims Accuracy (RCA) Expertise in Prospective Claims Accuracy (PCA) 2014 Companies merged to unite a combined focus on RCA & PCA creating significant cross sell opportunities 2015 Rebranded to Cotiviti 2016+ Initial Public Offering $3B in client savings $541M Net Revenue $203M Adj. EBITDA* Growth potential: $5B total addressable market *Non-GAAP measure. See Appendix |
|
|
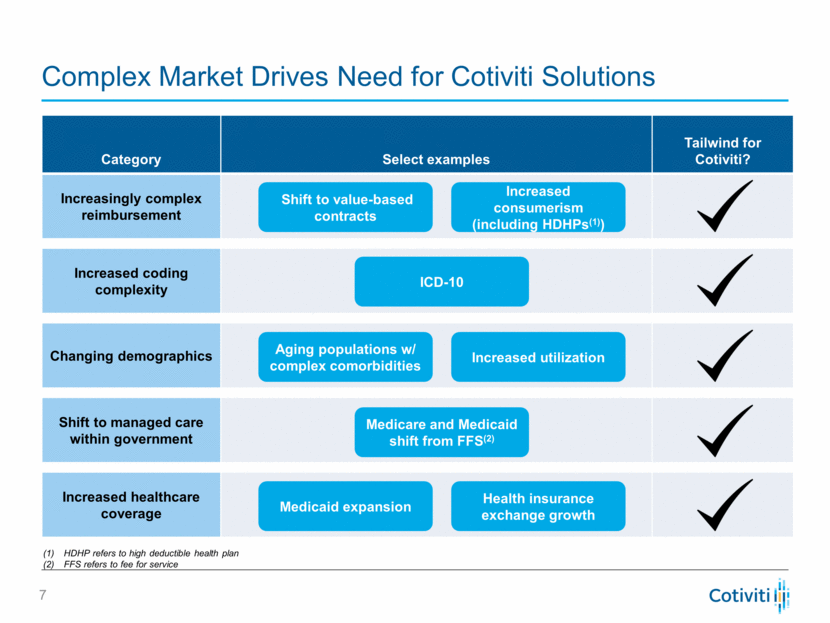
Tailwind for Cotiviti? Category Select examples Increasingly complex reimbursement Increased coding complexity Changing demographics Shift to managed care within government Increased healthcare coverage Complex Market Drives Need for Cotiviti Solutions Shift to value-based contracts Increased consumerism (including HDHPs(1)) ICD-10 Aging populations w/ complex comorbidities Increased utilization Medicare and Medicaid shift from FFS(2) Medicaid expansion Health insurance exchange growth HDHP refers to high deductible health plan FFS refers to fee for service |
|
|
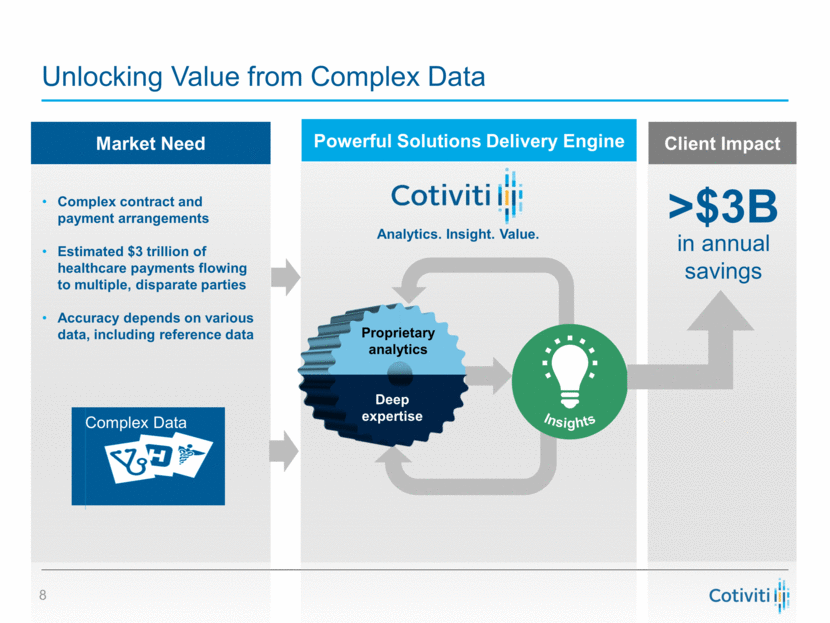
Insights Analytics. Insight. Value. Unlocking Value from Complex Data Powerful Solutions Delivery Engine Client Impact Market Need Proprietary analytics Deep expertise Complex contract and payment arrangements Estimated $3 trillion of healthcare payments flowing to multiple, disparate parties Accuracy depends on various data, including reference data >$3B in annual savings Complex Data |
|
|
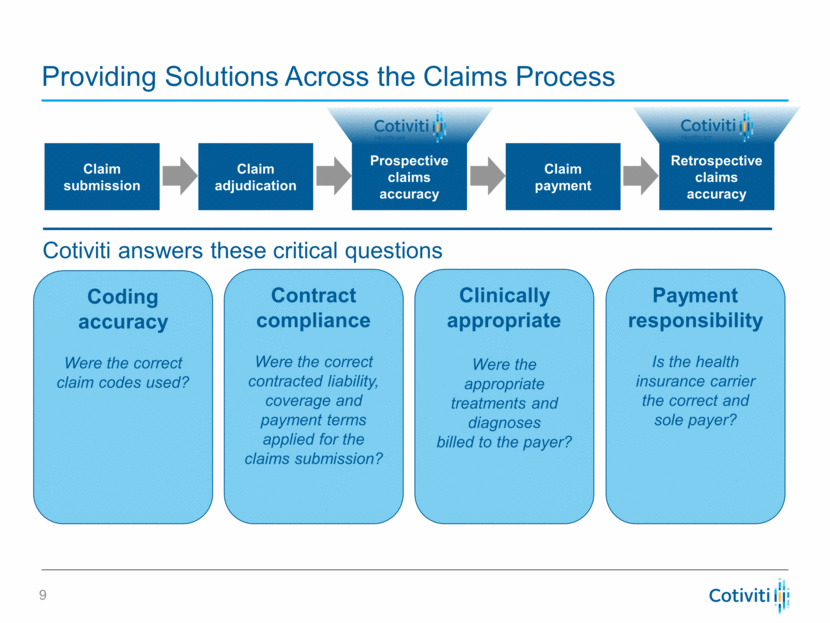
Providing Solutions Across the Claims Process Payment responsibility Is the health insurance carrier the correct and sole payer? Clinically appropriate Were the appropriate treatments and diagnoses billed to the payer? Coding accuracy Were the correct claim codes used? Contract compliance Were the correct contracted liability, coverage and payment terms applied for the claims submission? Cotiviti answers these critical questions Claim submission Claim adjudication Prospective claims accuracy Claim payment Retrospective claims accuracy |
|
|
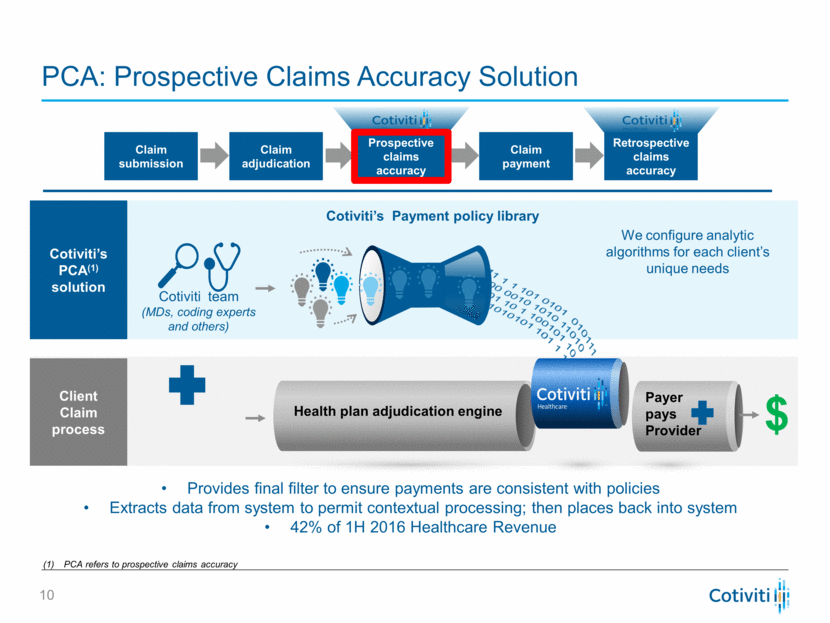
PCA: Prospective Claims Accuracy Solution Health plan adjudication engine Cotiviti’s PCA(1) solution Client Claim process Cotiviti team (MDs, coding experts and others) Cotiviti’s Payment policy library We configure analytic algorithms for each client’s unique needs Payer pays Provider $ Provides final filter to ensure payments are consistent with policies Extracts data from system to permit contextual processing; then places back into system 42% of 1H 2016 Healthcare Revenue PCA refers to prospective claims accuracy Claim submission Claim adjudication Claim payment Retrospective claims accuracy Prospective claims accuracy |
|
|
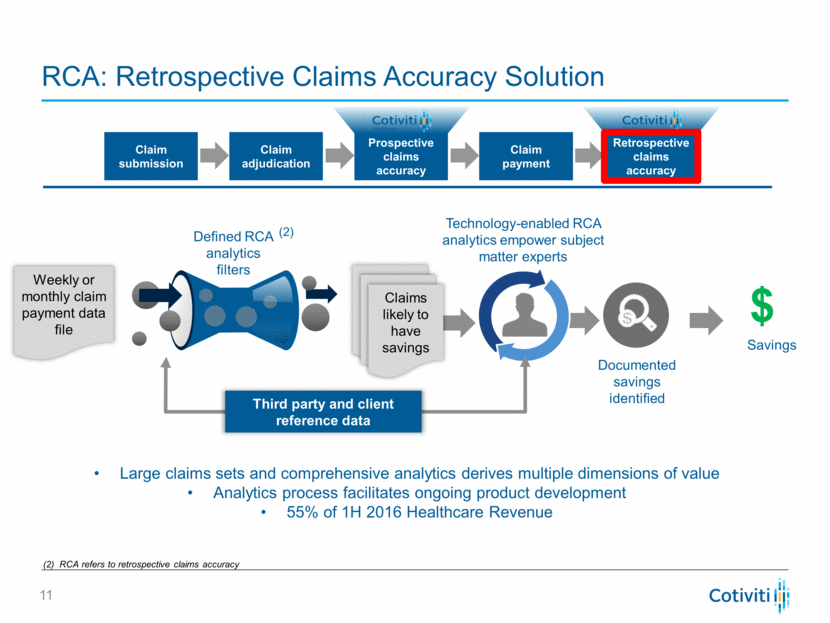
RCA: Retrospective Claims Accuracy Solution Defined RCA analytics filters Weekly or monthly claim payment data file Claims likely to have savings Technology-enabled RCA analytics empower subject matter experts Documented savings identified Savings $ Third party and client reference data (2) Large claims sets and comprehensive analytics derives multiple dimensions of value Analytics process facilitates ongoing product development 55% of 1H 2016 Healthcare Revenue (2) RCA refers to retrospective claims accuracy Claim submission Claim adjudication Prospective claims accuracy Claim payment Retrospective claims accuracy |
|
|
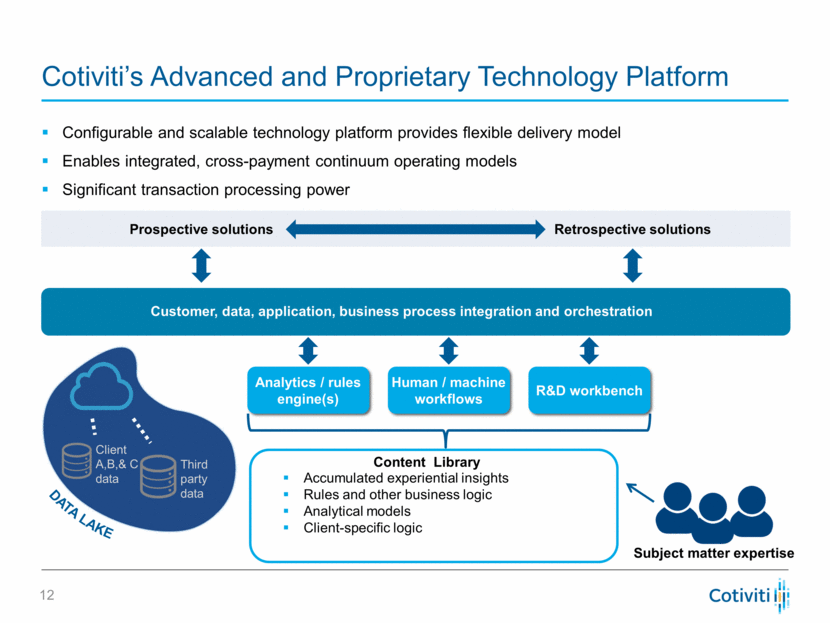
Cotiviti’s Advanced and Proprietary Technology Platform Configurable and scalable technology platform provides flexible delivery model Enables integrated, cross-payment continuum operating models Significant transaction processing power Customer, data, application, business process integration and orchestration Analytics / rules engine(s) Client A,B,& C data Third party data DATA LAKE Human / machine workflows R&D workbench Prospective solutions Retrospective solutions Subject matter expertise Content Library Accumulated experiential insights Rules and other business logic Analytical models Client-specific logic |
|
|
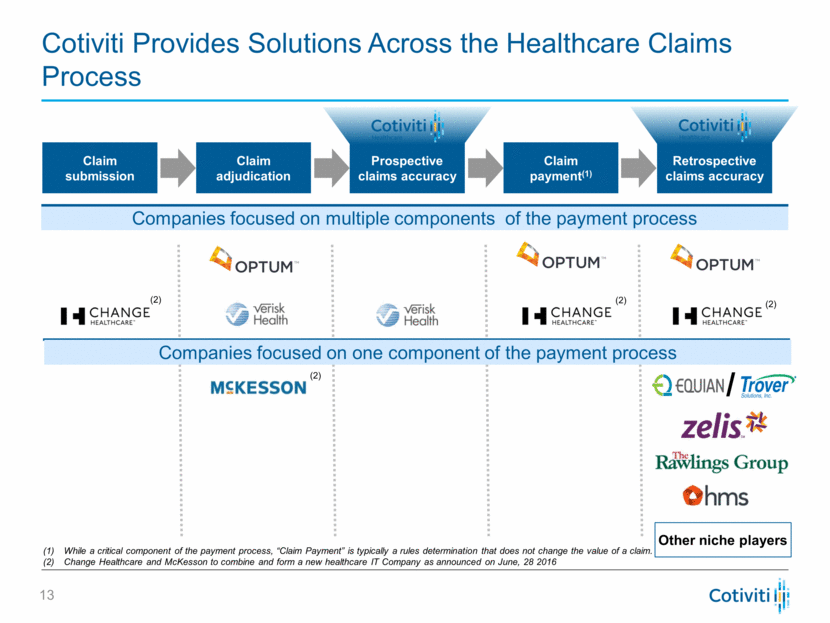
Cotiviti Provides Solutions Across the Healthcare Claims Process / While a critical component of the payment process, “Claim Payment” is typically a rules determination that does not change the value of a claim. Change Healthcare and McKesson to combine and form a new healthcare IT Company as announced on June, 28 2016 Claim submission Claim adjudication Prospective claims accuracy Claim payment(1) Retrospective claims accuracy Companies focused on multiple components of the payment process Companies focused on one component of the payment process Other niche players (2) (2) (2) (2) |
|
|
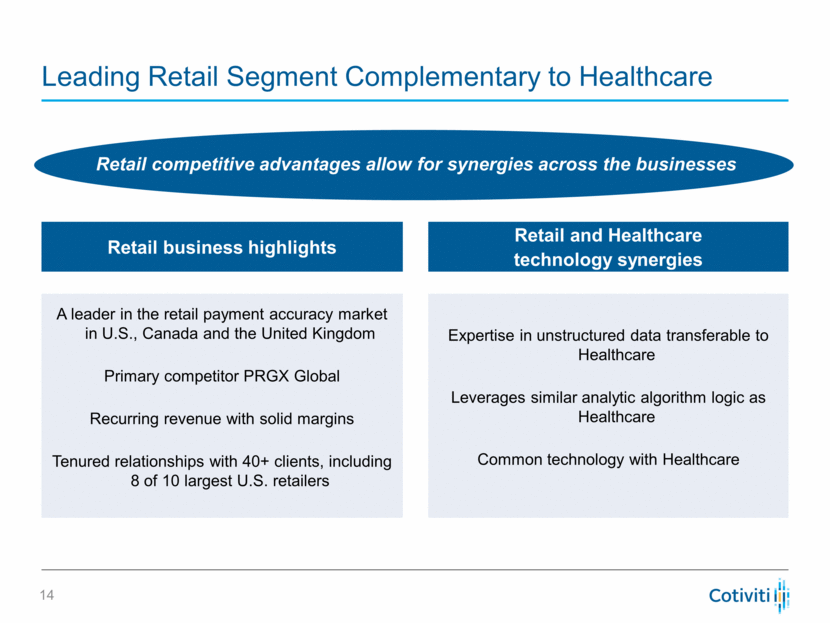
Leading Retail Segment Complementary to Healthcare Retail business highlights A leader in the retail payment accuracy market in U.S., Canada and the United Kingdom Primary competitor PRGX Global Recurring revenue with solid margins Tenured relationships with 40+ clients, including 8 of 10 largest U.S. retailers Expertise in unstructured data transferable to Healthcare Leverages similar analytic algorithm logic as Healthcare Common technology with Healthcare Retail and Healthcare technology synergies Retail competitive advantages allow for synergies across the businesses |
|
|
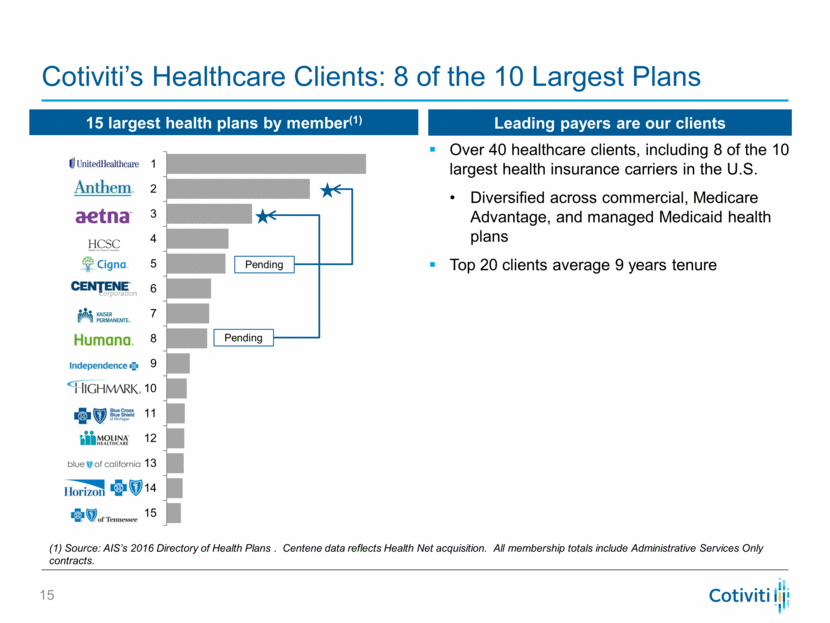
Cotiviti’s Healthcare Clients: 8 of the 10 Largest Plans 15 largest health plans by member(1) Pending Pending (1) Source: AIS’s 2016 Directory of Health Plans . Centene data reflects Health Net acquisition. All membership totals include Administrative Services Only contracts. Over 40 healthcare clients, including 8 of the 10 largest health insurance carriers in the U.S. Diversified across commercial, Medicare Advantage, and managed Medicaid health plans Top 20 clients average 9 years tenure Leading payers are our clients 1 2 3 4 5 6 7 8 9 10 11 12 13 14 15 |
|
|
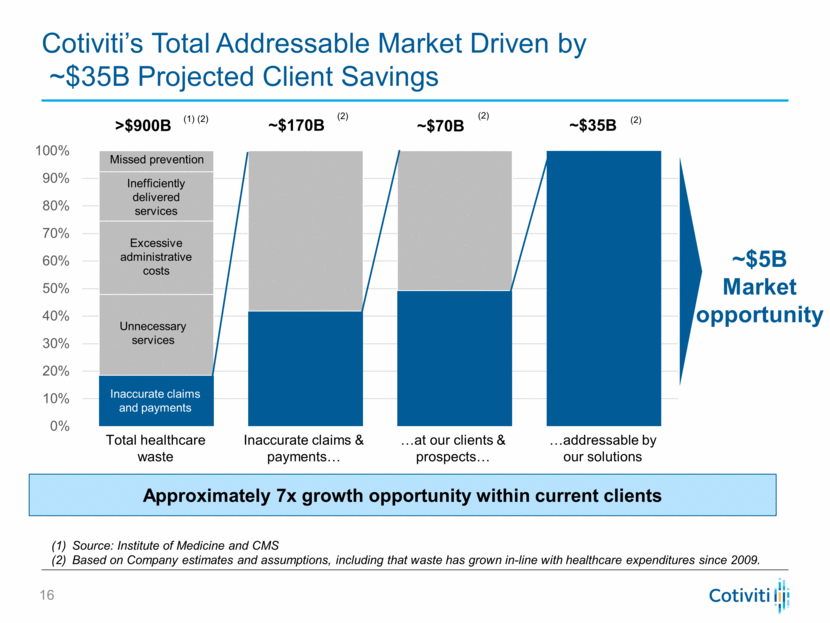
Cotiviti’s Total Addressable Market Driven by ~$35B Projected Client Savings ~$5B Market opportunity Source: Institute of Medicine and CMS Based on Company estimates and assumptions, including that waste has grown in-line with healthcare expenditures since 2009. (1) (2) >$900B Inaccurate claims and payments ~$170B ~$70B ~$35B (2) (2) (2) Approximately 7x growth opportunity within current clients Inaccurate claims and payments Unnecessary services Excessive administrative costs Inefficiently delivered services Missed prevention 0% 10% 20% 30% 40% 50% 60% 70% 80% 90% 100% Total healthcare waste Inaccurate claims & payments at our clients & prospects addressable by our solutions |
|
|
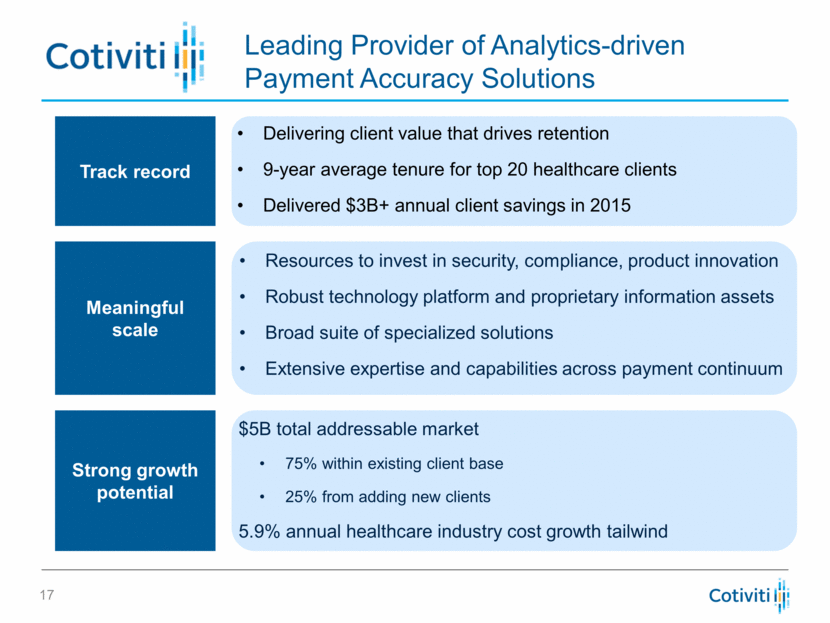
Leading Provider of Analytics-driven Payment Accuracy Solutions Track record Meaningful scale Strong growth potential Delivering client value that drives retention 9-year average tenure for top 20 healthcare clients Delivered $3B+ annual client savings in 2015 Resources to invest in security, compliance, product innovation Robust technology platform and proprietary information assets Broad suite of specialized solutions Extensive expertise and capabilities across payment continuum $5B total addressable market 75% within existing client base 25% from adding new clients 5.9% annual healthcare industry cost growth tailwind |
|
|
Growth Opportunities and Financial Overview Steve Senneff, CFO |
|
|
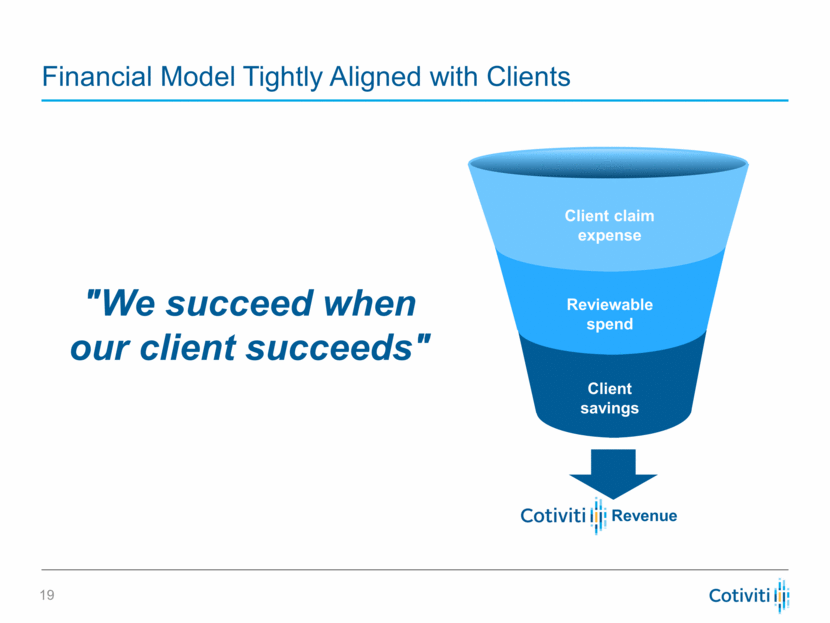
Financial Model Tightly Aligned with Clients Revenue Clear Client Value Client claim expense Reviewable spend Client savings "We succeed when our client succeeds" |
|
|
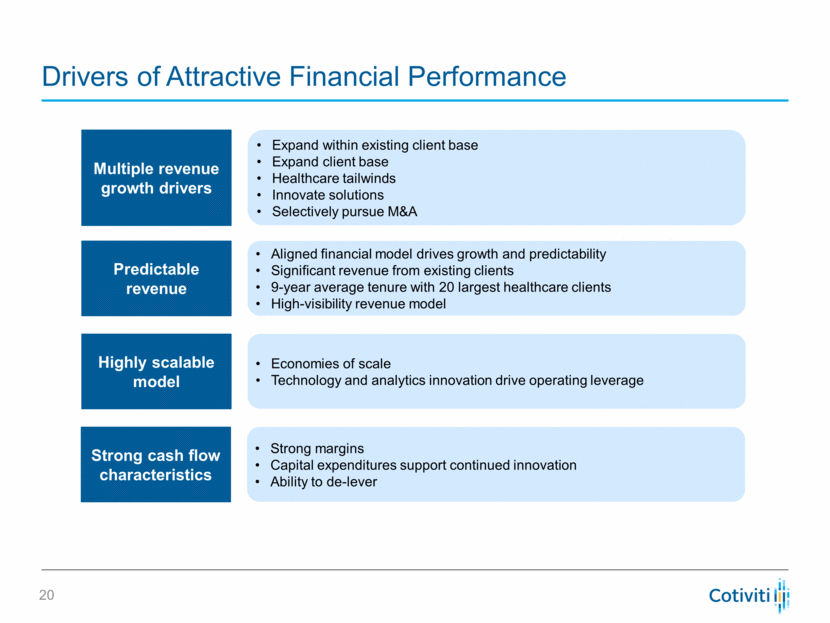
Drivers of Attractive Financial Performance Expand within existing client base Expand client base Healthcare tailwinds Innovate solutions Selectively pursue M&A Multiple revenue growth drivers Aligned financial model drives growth and predictability Significant revenue from existing clients 9-year average tenure with 20 largest healthcare clients High-visibility revenue model Predictable revenue Economies of scale Technology and analytics innovation drive operating leverage Highly scalable model Strong margins Capital expenditures support continued innovation Ability to de-lever Strong cash flow characteristics |
|
|
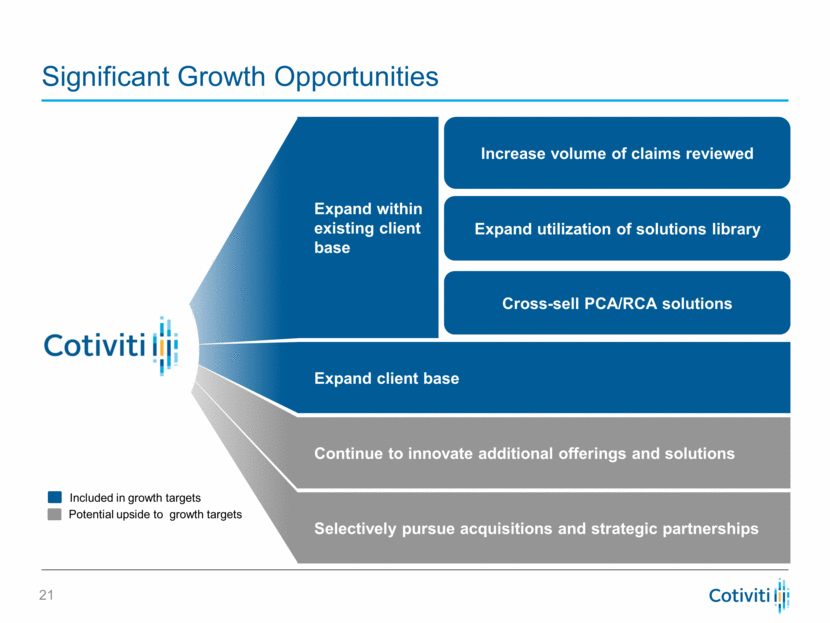
Significant Growth Opportunities Increase volume of claims reviewed Cross-sell PCA/RCA solutions Expand within existing client base Expand client base Continue to innovate additional offerings and solutions Selectively pursue acquisitions and strategic partnerships Expand utilization of solutions library Included in growth targets Potential upside to growth targets |
|
|
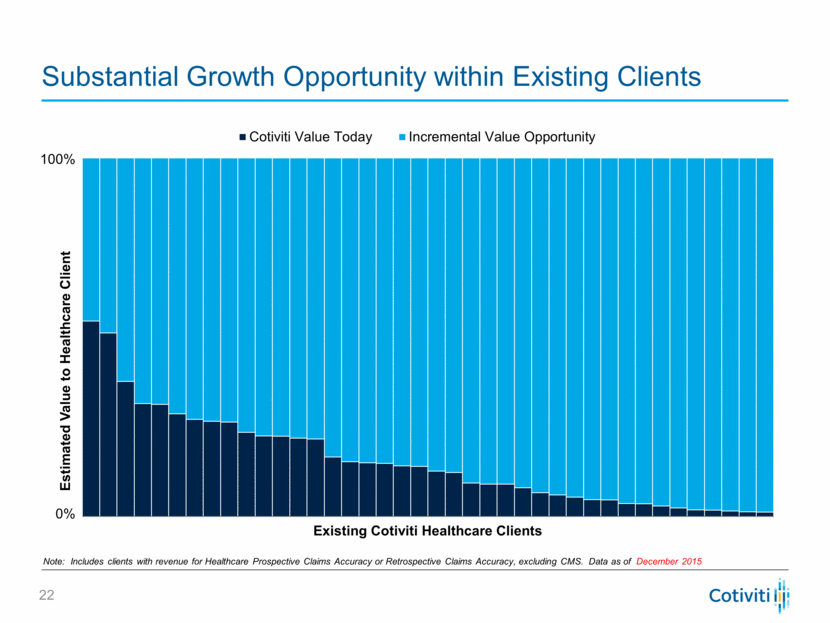
Substantial Growth Opportunity within Existing Clients 100% 0% Note: Includes clients with revenue for Healthcare Prospective Claims Accuracy or Retrospective Claims Accuracy, excluding CMS. Data as of December 2015 Estimated Value to Healthcare Client Existing Cotiviti Healthcare Clients Cotiviti Value Today Incremental Value Opportunity |
|
|
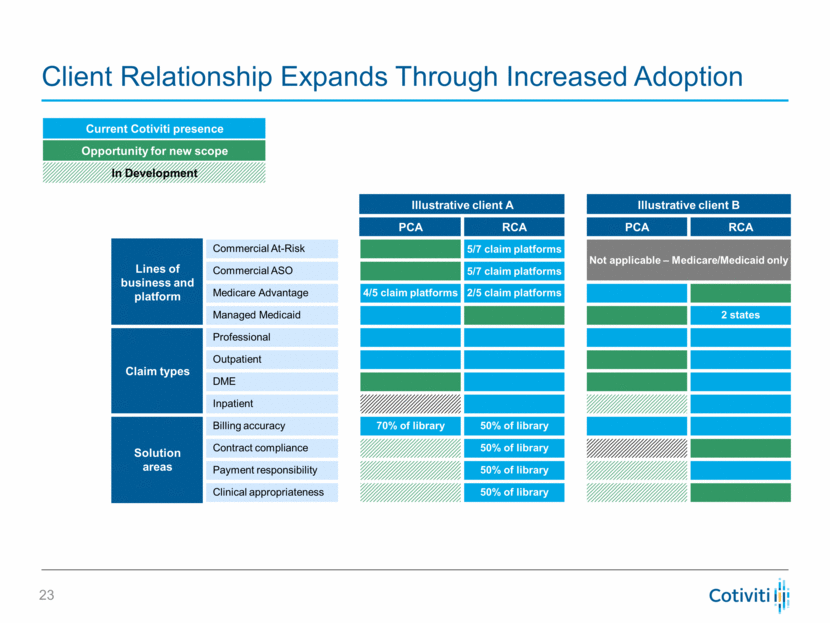
Client Relationship Expands Through Increased Adoption Illustrative client A Illustrative client B PCA RCA PCA RCA Lines of business and platform Commercial At-Risk 5/7 claim platforms Not applicable – Medicare/Medicaid only Commercial ASO 5/7 claim platforms Medicare Advantage 4/5 claim platforms 2/5 claim platforms Managed Medicaid 2 states Claim types Professional Outpatient DME Inpatient Solution areas Billing accuracy 70% of library 50% of library Contract compliance 50% of library Payment responsibility 50% of library Clinical appropriateness 50% of library Current Cotiviti presence Opportunity for new scope In Development |
|
|
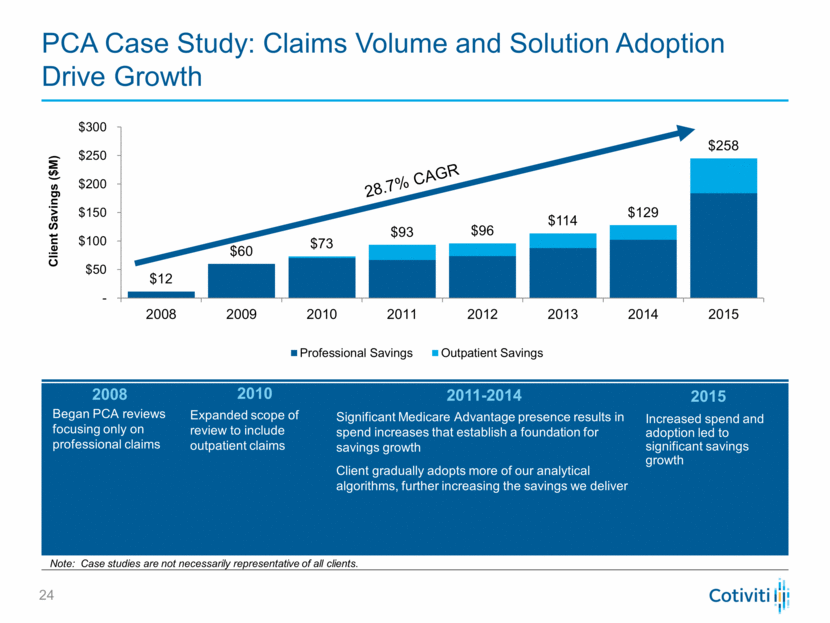
PCA Case Study: Claims Volume and Solution Adoption Drive Growth 2008 Began PCA reviews focusing only on professional claims 2011-2014 Significant Medicare Advantage presence results in spend increases that establish a foundation for savings growth Client gradually adopts more of our analytical algorithms, further increasing the savings we deliver 2015 Increased spend and adoption led to significant savings growth 28.7% CAGR Note: Case studies are not necessarily representative of all clients. 2010 Expanded scope of review to include outpatient claims Client Savings ($M) $12 $60 $73 $93 $96 $114 $129 $258 - $50 $100 $150 $200 $250 $300 2008 2009 2010 2011 2012 2013 2014 2015 Professional Savings Outpatient Savings |
|
|
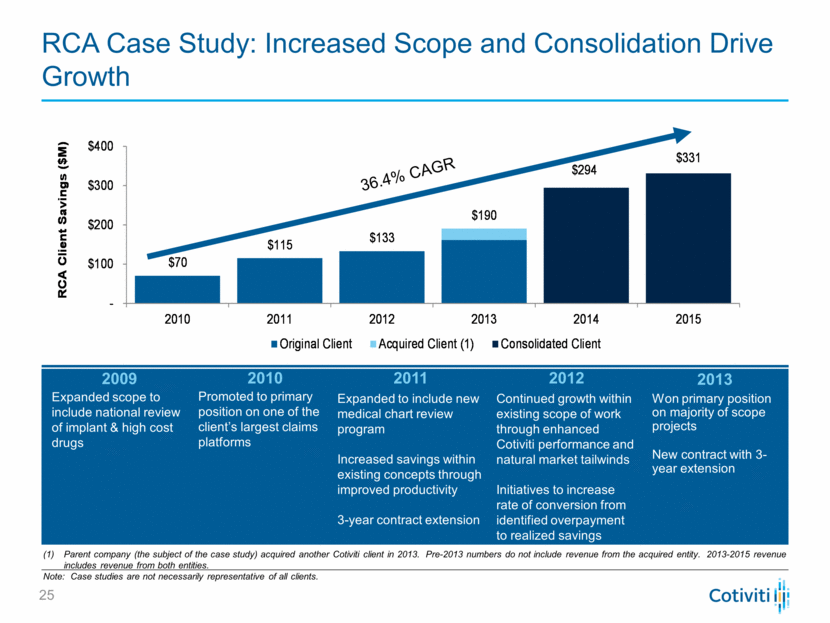
RCA Case Study: Increased Scope and Consolidation Drive Growth 2009 Expanded scope to include national review of implant & high cost drugs 2010 Promoted to primary position on one of the client’s largest claims platforms 2011 Expanded to include new medical chart review program Increased savings within existing concepts through improved productivity 3-year contract extension 2012 Continued growth within existing scope of work through enhanced Cotiviti performance and natural market tailwinds Initiatives to increase rate of conversion from identified overpayment to realized savings 2013 Won primary position on majority of scope projects New contract with 3-year extension 36.4% CAGR Parent company (the subject of the case study) acquired another Cotiviti client in 2013. Pre-2013 numbers do not include revenue from the acquired entity. 2013-2015 revenue includes revenue from both entities. Note: Case studies are not necessarily representative of all clients. $70 $115 $133 $190 $294 $331 - $100 $200 $300 $400 2010 2011 2012 2013 2014 2015 Original Client Acquired Client (1) Consolidated Client RCA Client Savings ($M) |
|
|
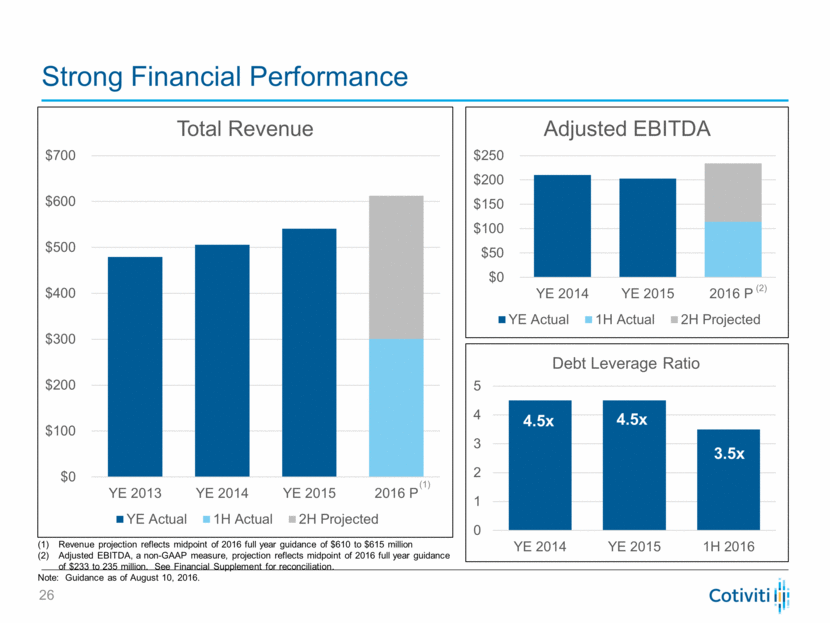
Strong Financial Performance (1) Revenue projection reflects midpoint of 2016 full year guidance of $610 to $615 million Adjusted EBITDA, a non-GAAP measure, projection reflects midpoint of 2016 full year guidance of $233 to 235 million. See Financial Supplement for reconciliation. Note: Guidance as of August 10, 2016. (2) 4.5x 4.5x 3.5x 0 1 2 3 4 5 YE 2014 YE 2015 1H 2016 Debt Leverage Ratio $0 $100 $200 $300 $400 $500 $600 $700 YE 2013 YE 2014 YE 2015 2016 P Total Revenue YE Actual 1H Actual 2H Projected $0 $50 $100 $150 $200 $250 YE 2014 YE 2015 2016 P Adjusted EBITDA YE Actual 1H Actual 2H Projected |
|
|
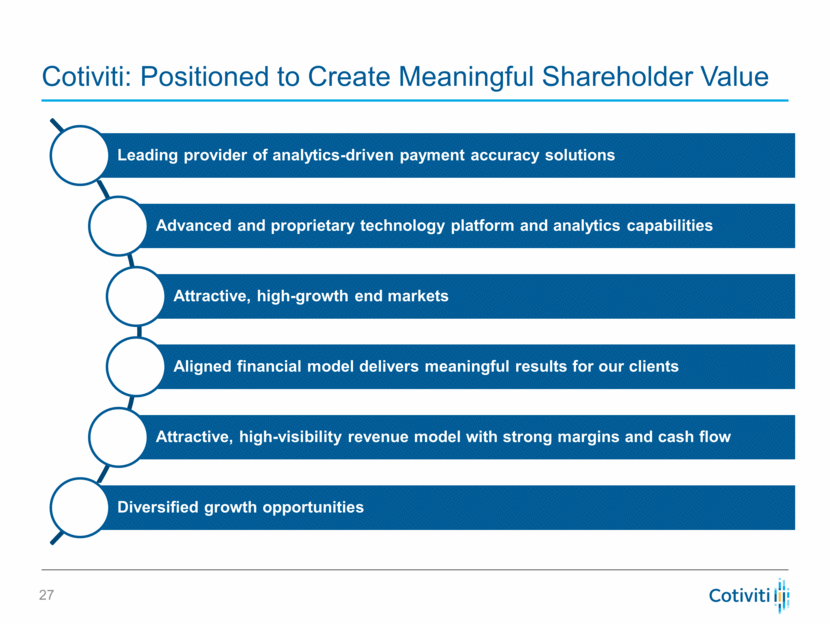
Cotiviti: Positioned to Create Meaningful Shareholder Value Leading provider of analytics-driven payment accuracy solutions Advanced and proprietary technology platform and analytics capabilities Attractive, high-growth end markets Aligned financial model delivers meaningful results for our clients Attractive, high-visibility revenue model with strong margins and cash flow Diversified growth opportunities |
|
|
0 Analytics. Insight. Value. |
|
|
Financial Supplement as of June 30, 2016 |
|
|
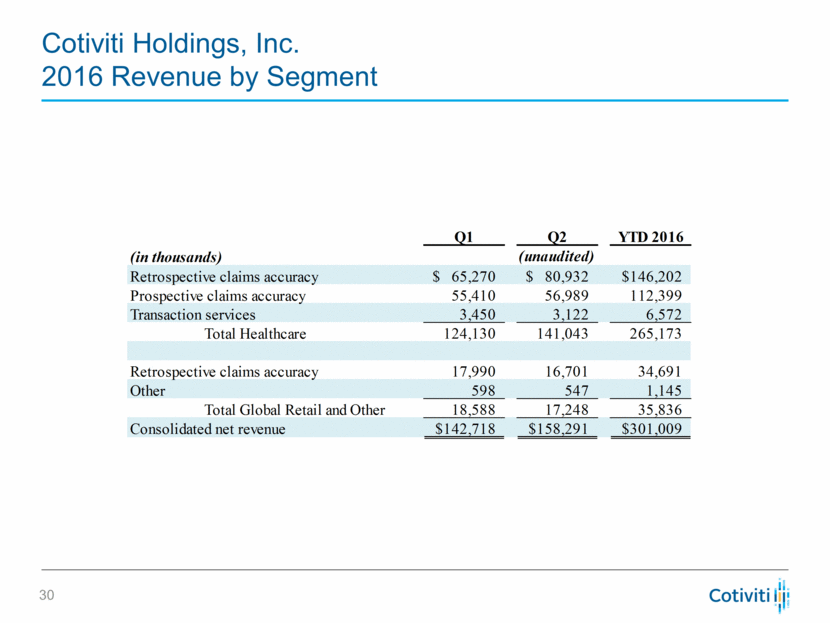
Cotiviti Holdings, Inc. 2016 Revenue by Segment Q1 Q2 YTD 2016 (in thousands) Retrospective claims accuracy 65,270 $ 80,932 $ 146,202 $ Prospective claims accuracy 55,410 56,989 112,399 Transaction services 3,450 3,122 6,572 Total Healthcare 124,130 141,043 265,173 Retrospective claims accuracy 17,990 16,701 34,691 Other 598 547 1,145 Total Global Retail and Other 18,588 17,248 35,836 Consolidated net revenue 142,718 $ 158,291 $ 301,009 $ (unaudited) |
|
|
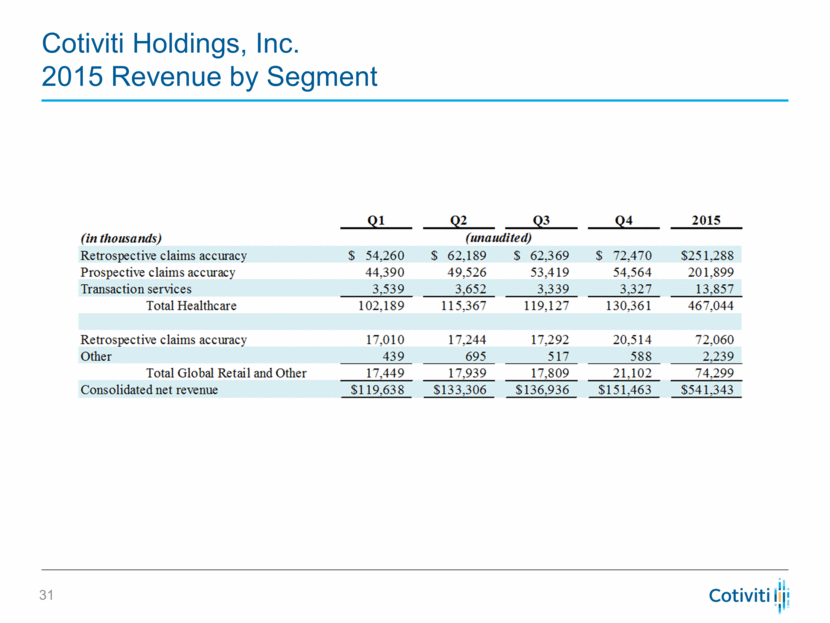
Cotiviti Holdings, Inc. 2015 Revenue by Segment |
|
|
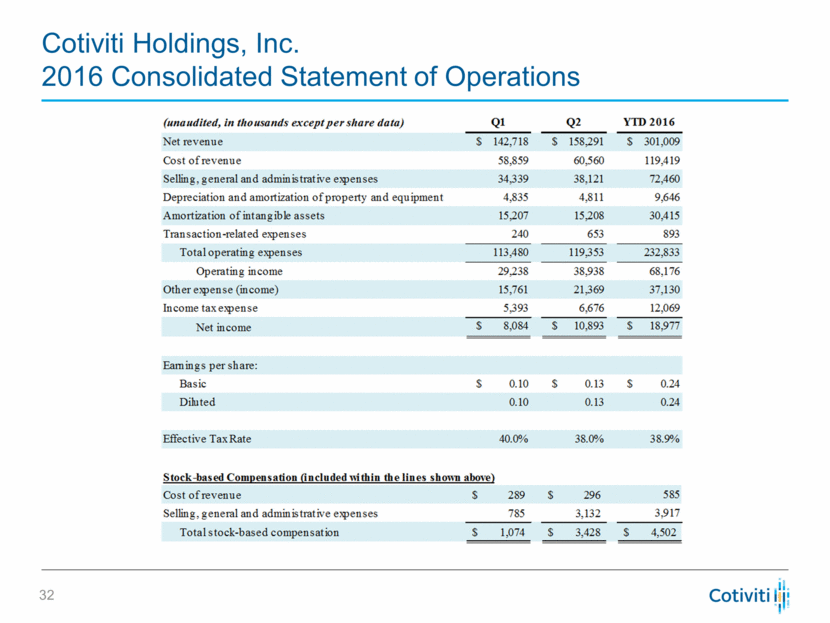
Cotiviti Holdings, Inc. 2016 Consolidated Statement of Operations |
|
|
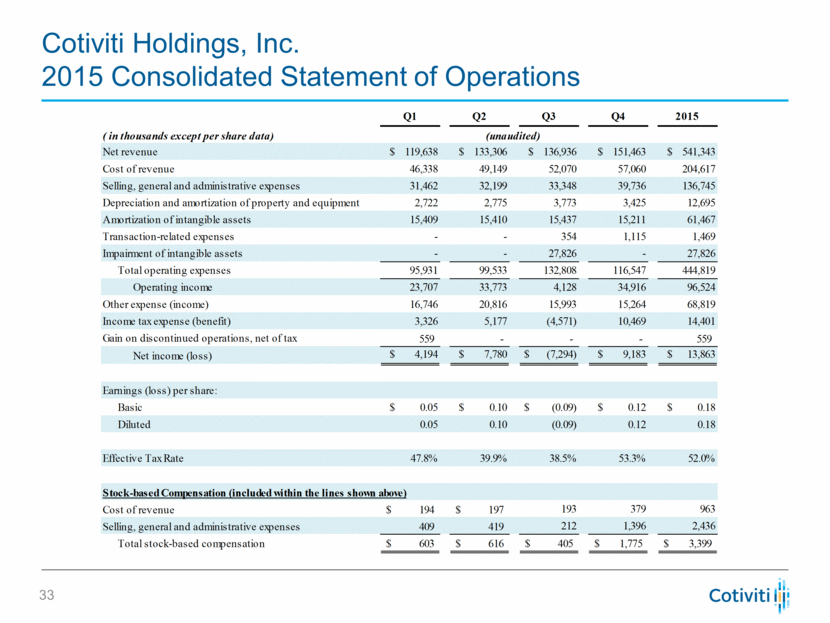
Cotiviti Holdings, Inc. 2015 Consolidated Statement of Operations Q1 Q2 Q3 Q4 2015 ( in thousands except per share data) Net revenue $ 119,638 $ 133,306 $ 136,936 $ 151,463 $ 541,343 Cost of revenue 46,338 49,149 52,070 57,060 204,617 Selling, general and administrative expenses 31,462 32,199 33,348 39,736 136,745 Depreciation and amortization of property and equipment 2,722 2,775 3,773 3,425 12,695 Amortization of intangible assets 15,409 15,410 15,437 15,211 61,467 Transaction-related expenses - - 354 1,115 1,469 Impairment of intangible assets - - 27,826 - 27,826 Total operating expenses 95,931 99,533 132,808 116,547 444,819 Operating income 23,707 33,773 4,128 34,916 96,524 Other expense (income) 16,746 20,816 15,993 15,264 68,819 Income tax expense (benefit) 3,326 5,177 (4,571) 10,469 14,401 Gain on discontinued operations, net of tax 559 - - - 559 Net income (loss) $ 4,194 $ 7,780 $ (7,294) $ 9,183 $ 13,863 Earnings (loss) per share: Basic $ 0.05 $ 0.10 $ (0.09) $ 0.12 $ 0.18 Diluted 0.05 0.10 (0.09) 0.12 0.18 Effective Tax Rate 47.8% 39.9% 38.5% 53.3% 52.0% Stock-based Compensation (included within the lines shown above) Cost of revenue 194 $ 197 $ 193 379 963 Selling, general and administrative expenses 409 419 212 1,396 2,436 Total stock-based compensation 603 $ 616 $ 405 $ 1,775 $ 3,399 $ (unaudited) |
|
|
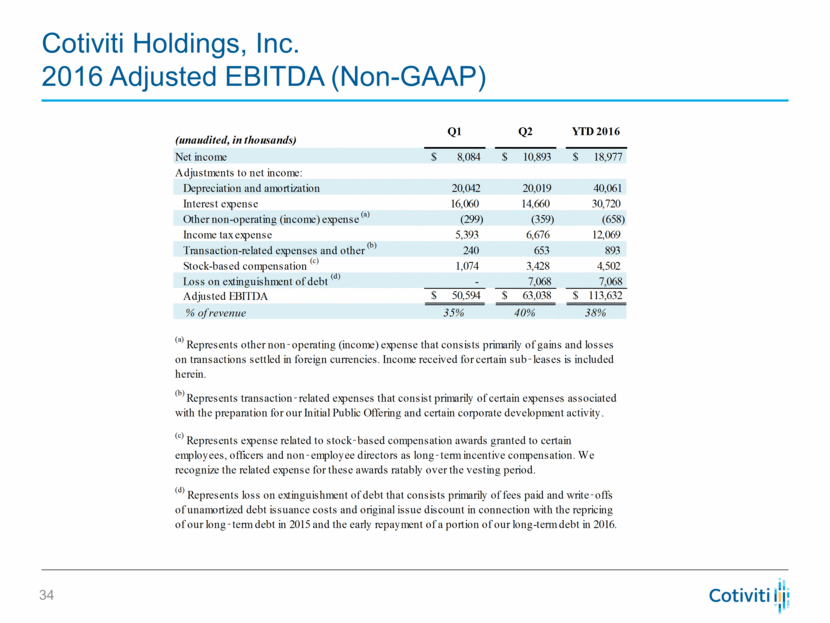
Cotiviti Holdings, Inc. 2016 Adjusted EBITDA (Non-GAAP) (unaudited, in thousands) Q1 Q2 YTD 2016 Net income $ 8,084 $ 10,893 $ 18,977 Adjustments to net income: Depreciation and amortization 20,042 20,019 40,061 Interest expense 16,060 14,660 30,720 Other non-operating (income) expense (a) (299) (359) (658) Income tax expense 5,393 6,676 12,069 Transaction-related expenses and other (b) 240 653 893 Stock-based compensation (c) 1,074 3,428 4,502 Loss on extinguishment of debt (d) - 7,068 7,068 Adjusted EBITDA $ 50,594 $ 63,038 $ 113,632 % of revenue 35% 40% 38% (c) Represents expense related to stock ? based compensation awards granted to certain employees, officers and non ? employee directors as long ? term incentive compensation. We recognize the related expense for these awards ratably over the vesting period. (d) Represents loss on extinguishment of debt that consists primarily of fees paid and write ? offs of unamortized debt issuance costs and original issue discount in connection with the repricing of our long ? term debt in 2015 and the early repayment of a portion of our long-term debt in 2016. (a) Represents other non ? operating (income) expense that consists primarily of gains and losses on transactions settled in foreign currencies. Income received for certain sub ? leases is included herein. (b) Represents transaction ? related expenses that consist primarily of certain expenses associated with the preparation for our Initial Public Offering and certain corporate development activity. |
|
|
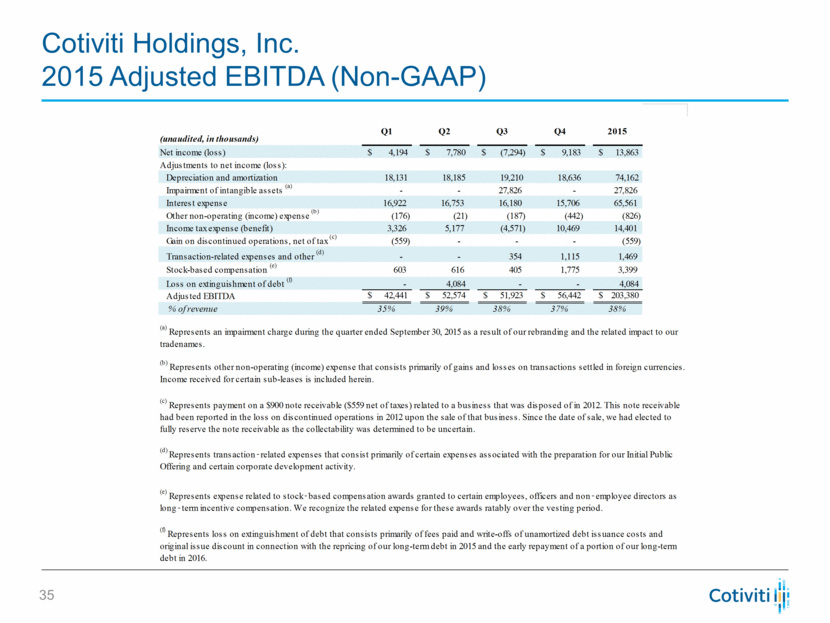
Cotiviti Holdings, Inc. 2015 Adjusted EBITDA (Non-GAAP) (unaudited, in thousands) Q1 Q2 Q3 Q4 2015 Net income (loss) $ 4,194 $ 7,780 $ (7,294) $ 9,183 $ 13,863 Adjustments to net income (loss): Depreciation and amortization 18,131 18,185 19,210 18,636 74,162 Impairment of intangible assets (a) - - 27,826 - 27,826 Interest expense 16,922 16,753 16,180 15,706 65,561 Other non-operating (income) expense (b) (176) (21) (187) (442) (826) Income tax expense (benefit) 3,326 5,177 (4,571) 10,469 14,401 Gain on discontinued operations, net of tax (c) (559) - - - (559) Transaction-related expenses and other (d) - - 354 1,115 1,469 Stock-based compensation (e) 603 616 405 1,775 3,399 Loss on extinguishment of debt (f) - 4,084 - - 4,084 Adjusted EBITDA $ 42,441 $ 52,574 $ 51,923 $ 56,442 $ 203,380 % of revenue 35% 39% 38% 37% 38% (e) Represents expense related to stock ? based compensation awards granted to certain employees, officers and non ? employee directors as long ? term incentive compensation. We recognize the related expense for these awards ratably over the vesting period. (f) Represents loss on extinguishment of debt that consists primarily of fees paid and write-offs of unamortized debt issuance costs and original issue discount in connection with the repricing of our long-term debt in 2015 and the early repayment of a portion of our long-term debt in 2016. (a) Represents an impairment charge during the quarter ended September 30, 2015 as a result of our rebranding and the related impact to our tradenames. (b) Represents other non-operating (income) expense that consists primarily of gains and losses on transactions settled in foreign currencies. Income received for certain sub-leases is included herein. (c) Represents payment on a $900 note receivable ($559 net of taxes) related to a business that was disposed of in 2012. This note receivable had been reported in the loss on discontinued operations in 2012 upon the sale of that business. Since the date of sale, we had elected to fully reserve the note receivable as the collectability was determined to be uncertain. (d) Represents transaction ? related expenses that consist primarily of certain expenses associated with the preparation for our Initial Public Offering and certain corporate development activity. |
|
|
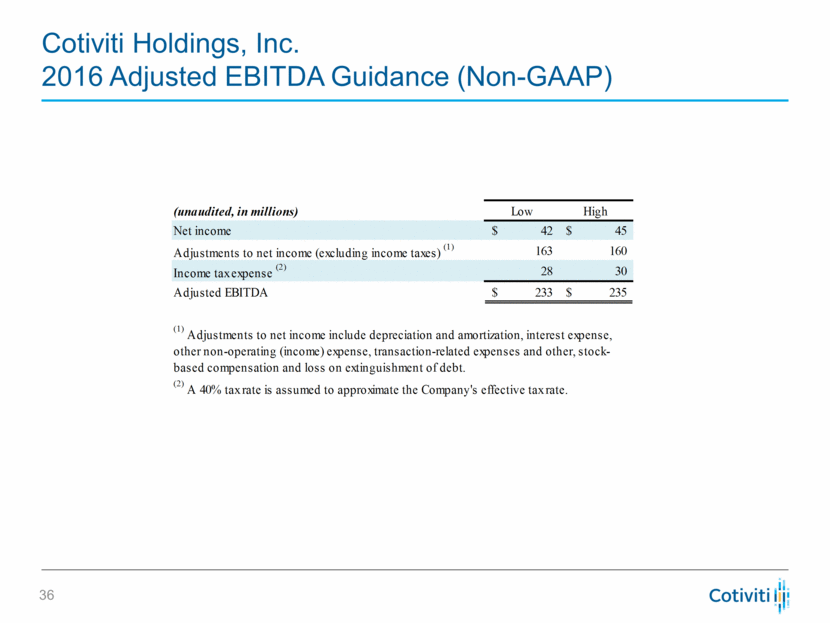
Cotiviti Holdings, Inc. 2016 Adjusted EBITDA Guidance (Non-GAAP) (unaudited, in millions) Low High Net income 42 $ 45 $ Adjustments to net income (excluding income taxes) (1) 163 160 Income tax expense (2) 28 30 Adjusted EBITDA 233 $ 235 $ (1) Adjustments to net income include depreciation and amortization, interest expense, other non-operating (income) expense, transaction-related expenses and other, stock- based compensation and loss on extinguishment of debt. (2) A 40% tax rate is assumed to approximate the Company's effective tax rate. |
|
|
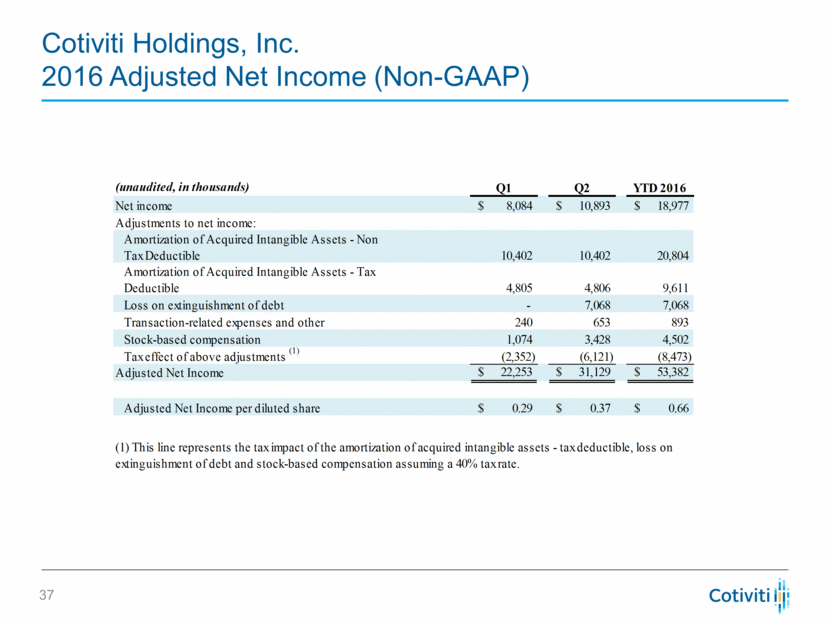
Cotiviti Holdings, Inc. 2016 Adjusted Net Income (Non-GAAP) (unaudited, in thousands) Q1 Q2 YTD 2016 Net income $ 8,084 $ 10,893 $ 18,977 Adjustments to net income: Amortization of Acquired Intangible Assets - Non Tax Deductible 10,402 10,402 20,804 Amortization of Acquired Intangible Assets - Tax Deductible 4,805 4,806 9,611 Loss on extinguishment of debt - 7,068 7,068 Transaction-related expenses and other 240 653 893 Stock-based compensation 1,074 3,428 4,502 Tax effect of above adjustments (1) (2,352) (6,121) (8,473) Adjusted Net Income $ 22,253 $ 31,129 $ 53,382 Adjusted Net Income per diluted share $ 0.29 $ 0.37 $ 0.66 (1) This line represents the tax impact of the amortization of acquired intangible assets - tax deductible, loss on extinguishment of debt and stock-based compensation assuming a 40% tax rate. |
|
|
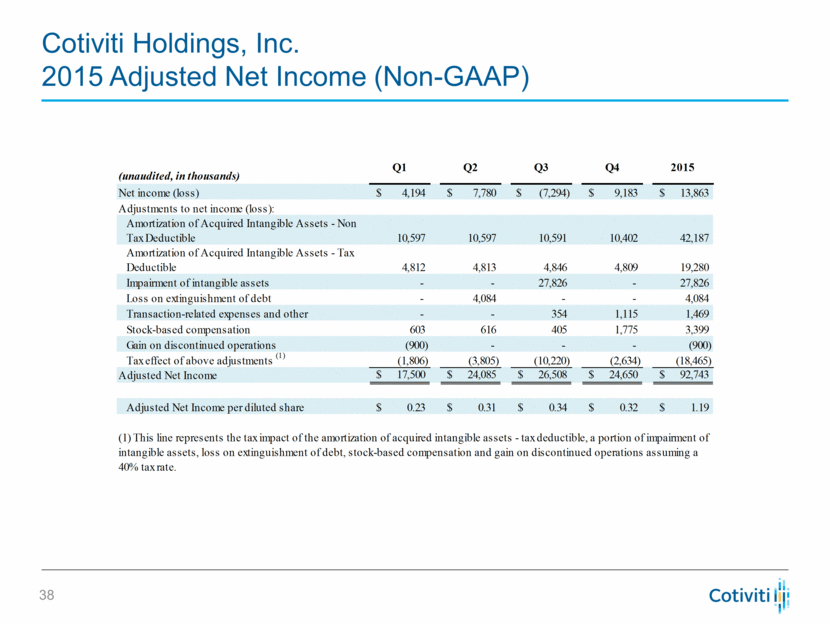
Cotiviti Holdings, Inc. 2015 Adjusted Net Income (Non-GAAP) (unaudited, in thousands) Q1 Q2 Q3 Q4 2015 Net income (loss) $ 4,194 $ 7,780 $ (7,294) $ 9,183 $ 13,863 Adjustments to net income (loss): Amortization of Acquired Intangible Assets - Non Tax Deductible 10,597 10,597 10,591 10,402 42,187 Amortization of Acquired Intangible Assets - Tax Deductible 4,812 4,813 4,846 4,809 19,280 Impairment of intangible assets - - 27,826 - 27,826 Loss on extinguishment of debt - 4,084 - - 4,084 Transaction-related expenses and other - - 354 1,115 1,469 Stock-based compensation 603 616 405 1,775 3,399 Gain on discontinued operations (900) - - - (900) Tax effect of above adjustments (1) (1,806) (3,805) (10,220) (2,634) (18,465) Adjusted Net Income $ 17,500 $ 24,085 $ 26,508 $ 24,650 $ 92,743 Adjusted Net Income per diluted share $ 0.23 $ 0.31 $ 0.34 $ 0.32 $ 1.19 (1) This line represents the tax impact of the amortization of acquired intangible assets - tax deductible, a portion of impairment of intangible assets, loss on extinguishment of debt, stock-based compensation and gain on discontinued operations assuming a 40% tax rate. |
|
|
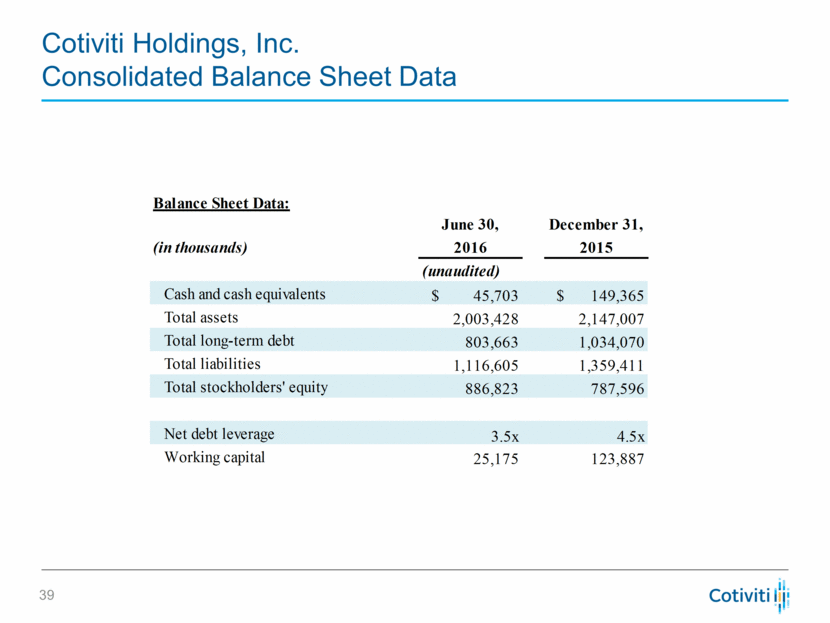
Cotiviti Holdings, Inc. Consolidated Balance Sheet Data Balance Sheet Data: June 30, December 31, (in thousands) 2016 2015 (unaudited) Cash and cash equivalents $ 45,703 $ 149,365 Total assets 2,003,428 2,147,007 Total long-term debt 803,663 1,034,070 Total liabilities 1,116,605 1,359,411 Total stockholders' equity 886,823 787,596 Net debt leverage 3.5x 4.5x Working capital 25,175 123,887 |
|
|
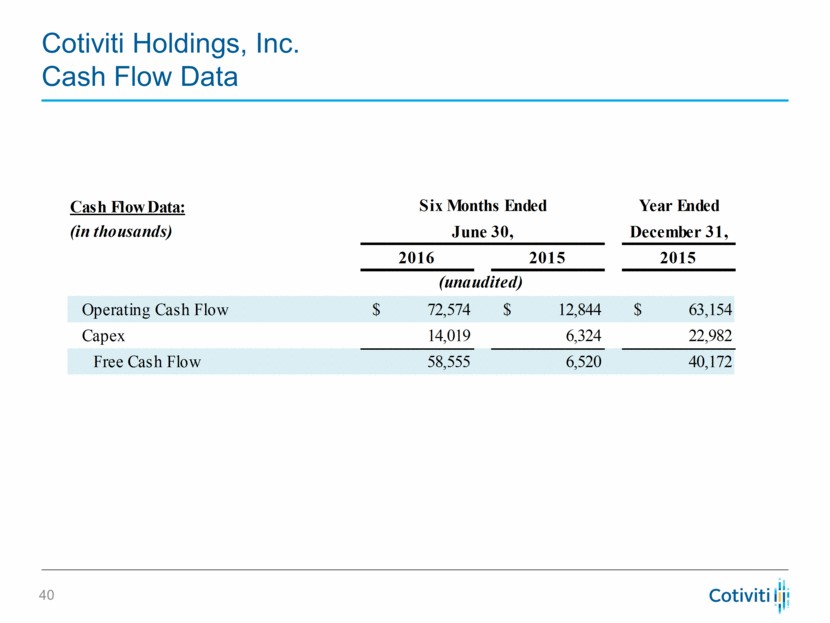
Cotiviti Holdings, Inc. Cash Flow Data Cash Flow Data: Year Ended (in thousands) December 31, 2016 2015 2015 Operating Cash Flow $ 72,574 $ 12,844 $ 63,154 Capex 14,019 6,324 22,982 Free Cash Flow 58,555 6,520 40,172 June 30, Six Months Ended (unaudited) |
|
|
0 Analytics. Insight. Value. |


