Attached files
| file | filename |
|---|---|
| 8-K - 8-K - RENASANT CORP | form8-k_3q16investorpresen.htm |

3rd Quarter 2016 Investor Presentation

This presentation contains forward-looking statements within the meaning of the Private
Securities Litigation Reform Act of 1995. Congress passed the Private Securities Litigation Act of 1995 in an
effort to encourage companies to provide information about companies’ anticipated future financial
performance. This act provides a safe harbor for such disclosure, which protects the companies from
unwarranted litigation if actual results are different from management expectations. This news release may
contain, or incorporate by reference, statements which may constitute “forward-looking statements” within
the meaning of Section 27A of the Securities Act of 1933, as amended, and Section 21E of the Securities
Exchange Act of 1934, as amended. Such forward looking statements usually include words such as
“expects,” “projects,” “anticipates,” “believes,” “intends,” “estimates,” “strategy,” “plan,” “potential,”
“possible” and other similar expressions.
Prospective investors are cautioned that any such forward-looking statements are not
guarantees for future performance and involve risks and uncertainties, and that actual results may differ
materially from those contemplated by such forward-looking statements. Important factors currently
known to management that could cause actual results to differ materially from those in forward-looking
statements include significant fluctuations in interest rates, inflation, economic recession, significant
changes in the federal and state legal and regulatory environment, significant underperformance in our
portfolio of outstanding loans, and competition in our markets. We undertake no obligation to update or
revise forward-looking statements to reflect changed assumptions, the occurrence of unanticipated events
or changes to future operating results over time.
2

More than 175 banking, lending, financial services and insurance offices
3
Western
30%
Northern
22% Eastern
26%
Central
22%
Portfolio Loans
Western
44%
Northern
13%
Eastern
26%
Central
17%
Total Deposits

4
Enhance Profitability
Capitalize on
Opportunities
Aggressively Manage
Problem Credits
Build Capital Ratios
• Focus on highly-accretive acquisition opportunities
• Leverage existing markets
• Seek new markets
• New lines of business
• Selective balance sheet growth
• Maintain dividend
• Prudently manage capital
• Identify problem assets and risks early
• Quarantine troubled assets
• Superior returns
• Revenue growth / Expense control
• Net interest margin expansion / mitigate interest rate risk
• Loan growth
• Core deposit growth

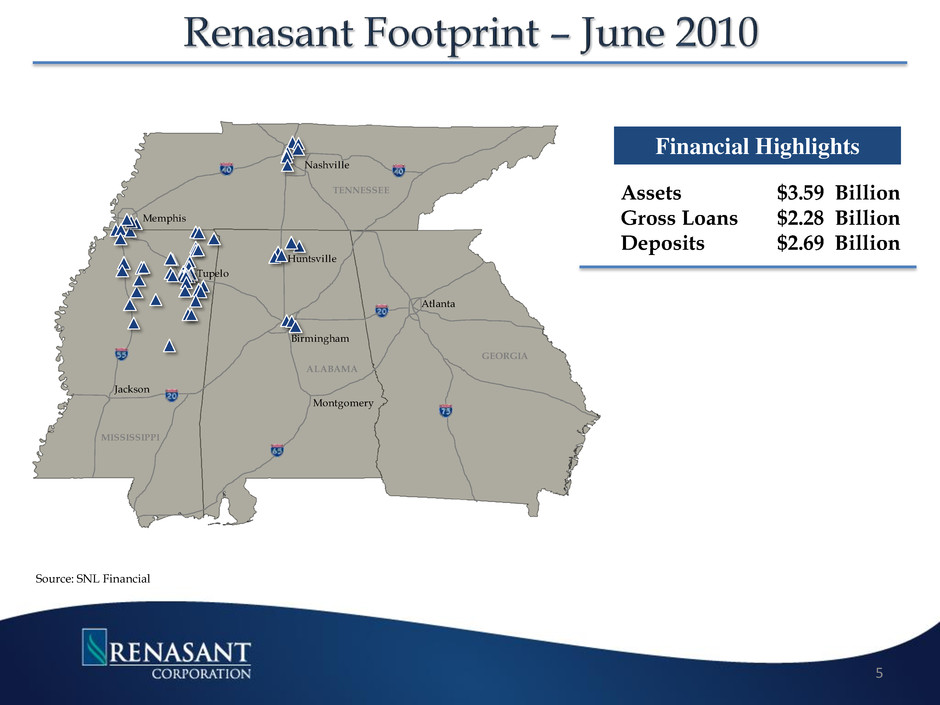
Nashville
Memphis
TENNESSEE
Tupelo
Jackson
MISSISSIPPI
Birmingham
Huntsville
Montgomery
Atlanta
GEORGIA
ALABAMA
Source: SNL Financial
5
Financial Highlights
Assets $3.59 Billion
Gross Loans $2.28 Billion
Deposits $2.69 Billion

6
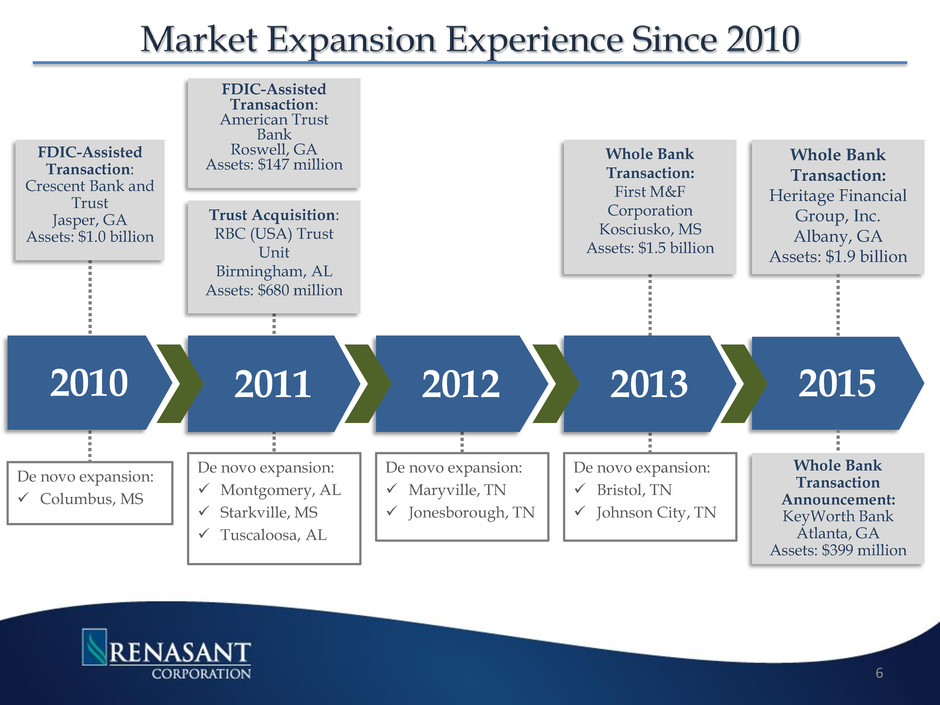
De novo expansion:
Columbus, MS
2010
De novo expansion:
Montgomery, AL
Starkville, MS
Tuscaloosa, AL
De novo expansion:
Maryville, TN
Jonesborough, TN
FDIC-Assisted
Transaction:
Crescent Bank and
Trust
Jasper, GA
Assets: $1.0 billion
FDIC-Assisted
Transaction:
American Trust
Bank
Roswell, GA
Assets: $147 million
Trust Acquisition:
RBC (USA) Trust
Unit
Birmingham, AL
Assets: $680 million
Whole Bank
Transaction:
First M&F
Corporation
Kosciusko, MS
Assets: $1.5 billion
2011 2013
De novo expansion:
Bristol, TN
Johnson City, TN
2015
Whole Bank
Transaction:
Heritage Financial
Group, Inc.
Albany, GA
Assets: $1.9 billion
2012
Whole Bank
Transaction
Announcement:
KeyWorth Bank
Atlanta, GA
Assets: $399 million

Over 175 banking, lending, financial services and insurance offices
7
Assets $8.5 billion
Gross Loans $6.0 billion
Deposits $6.7 billion
Highlights

8
Enhance Profitability
Capitalize on
Opportunities
Aggressively Manage
Problem Credits
Build Capital Ratios
• Focus on highly-accretive acquisition opportunities
• Leverage existing markets
• Seek new markets
• New lines of business
• Selective balance sheet growth
• Maintain dividend
• Prudently manage capital
• Identify problem assets and risks early
• Quarantine troubled assets
• Superior returns
• Revenue growth / Expense control
• Net interest margin expansion / mitigate interest rate risk
• Loan growth
• Core deposit growth

• Managed deposit mix by
emphasizing core deposit growth
while allowing higher-priced,
non-core deposits to erode
• Significantly paid down high-
cost borrowings
• Restructured asset mix by
redeploying excess cash levels
into higher yielding investments
and loans
• Loan demand will drive
deposit/funding growth going
forward
(in millions)
9
4,179 4,268 4,249
5,736 5,746
5,903 5,826 5,752 5,805 5,882 5,899
7,911 7,926
8,146
8,530
$0
$1,000
$2,000
$3,000
$4,000
$5,000
$6,000
$7,000
$8,000
$9,000
Total Assets Deposits

2011 2012 2013 2014 1Q15 2Q15 3Q15 4Q15 1Q16 2Q16
Non-
Acquired
$2,242 $2,573 $2,886 $3,268 $3,274 $3,408 $3,607 $3,830 $4,075 $4,292
Acquired
Covered*
$339 $237 $182 $143 $126 $121 $101 $93 $45 $42
Acquired - - $813 $577 $554 $508 $1,570 $1,490 $1,453 $1,631
Total Loans $2,581 $2,810 $3,881 $3,988 $3,954 $4,037 $5,278 $5,413 $5,573 $5,965
• Non-acquired loans increased
$218M or 21.4% (annualized)
during 2Q16
• New loan production during
2Q16 totaled $347M at a
weighted average rate of 4.3%.
• Company maintained strong
pipelines throughout all
markets which will continue to
drive further loan growth
$0
$1,000,000
$2,000,000
$3,000,000
$4,000,000
$5,000,000
$6,000,000
2012 2013 2014 1Q15 2Q15 3Q15 4Q15 1Q16 2Q16
Non-Acquired Acquired Covered Acquired
10
*Covered loans are subject to loss-share agreements with FDIC

• Loans totaled $5.965B
28% of portfolio is acquired and carried at fair value
• Owner occupied/C&I loans comprise 32% of the non covered
loan portfolio
Const
8% Land Dev
4%
1-4 Family
29%
Non Owner
Occupied
25%
Owner Occupied
20%
C&I
12%
Consumer
2%
Non-Covered Loans $5.9B
11

DDA
9%
Other Int
Bearing
Accts
26%
Time
Deposits
37% Borrowed
Funds
28%
4Q 2008
Cost of Funds
2.81%
$3.28B
DDA
20% Other Int
Bearing
Accts
50%
Time
Deposits
22%
Borrowed
Funds
8%
2Q 2016
$7.3B
Cost of Funds
.38%
-
200,000
400,000
600,000
800,000
1,000,000
1,200,000
1,400,000
1,600,000
2011 2012 2013 2014 1Q15 2Q15 3Q15 4Q15 1Q16 2Q16
Non Interest Bearing Demand Deposits
• Non-interest bearing deposits
represent 22% of deposits, up
from 12% at year end 2008
• Less reliance on borrowed
funds
Borrowed funds as a percentage
of funding sources declined
from 28% at year end 2008 to
8% at the end of 2Q16
12

0.00%
1.00%
2.00%
3.00%
4.00%
5.00%
6.00%
0.00%
1.00%
2.00%
3.00%
4.00%
5.00%
6.00%
2012 2013 1Q14 2Q14 3Q14 4Q14 1Q15 2Q15 3Q15 4Q15 1Q16 2Q16
Marg
in
Y
ie
ld
/C
os
t
Yield on Earning Assets Cost of Funds Margin
2011 2012 2013 2014 1Q15 2Q15 3Q15 4Q15 1Q16 2Q16
Net Interest
Income
129,286 133,338 157,133 202,482 48,781 51,614 68,612 72,351 70,054 77,157
Net Interest
Margin
3.77% 3.94% 3.96% 4.12% 4.02% 4.17% 4.09% 4.33% 4.21% 4.29%
Yield on
Earning
Assets
4.92% 4.67% 4.53% 4.59% 4.45% 4.57% 4.42% 4.65% 4.57% 4.66%
Cost of Funds 1.11% 0.72% 0.57% 0.47% 0.43% 0.41% 0.33% 0.32% 0.37% .38%
13

22%
6%
39%
8%
15%
10%
2Q16
$34.3M*
Svc Chgs
Insurance
Mtg Inc
Wealth Mgmt
Fees & Comm
Other
• Diversified sources of noninterest income
Less reliant on NSF
• Opportunities for growing Non Interest Income
Expansion of Trust Division Wealth Management
Services into larger, metropolitan markets
Expansions within our de novo operations
Expansion of the Mortgage Division within new
markets
Fees derived from higher penetration and usage of
debit cards and deposit charges
*Non interest income excludes gains from securities transactions and gains from acquisitions
39%
6%
11%
5%
27%
12%
1Q08
$13.9M*
Svc Chgs
Insurance
Mtg Inc
Wealth Mgmt
Fees & Comm
Other
-
10,000
20,000
30,000
40,000
4Q13 1Q14 2Q14 3Q14 4Q14 1Q15 2Q15 3Q15 4Q15 1Q16 2Q16
Non Interest Income*
14

• Continued focus on managing
noninterest expenses and
improving efficiency
• Provided resources for nine
de novo expansions since 2010
• Fluctuations in mortgage loan
expense driven by higher
mortgage production
• Incurred merger related
expenses during 2010, 2011,
2013, 2014, 2015 and 2016
15
40.00%
45.00%
50.00%
55.00%
60.00%
65.00%
70.00%
75.00%
80.00%
85.00%
90.00%
2010 2011 2012 2013 1Q14 2Q14 3Q14 4Q14 1Q15 2Q15 3Q15 4Q15 1Q16 2Q16
Efficiency Ratio* Efficiency Ratio ex. Mortgage*
*Excludes debt extinguishment penalties, amortization of intangibles and merger-related expenses from noninterest expense and profit (loss) on sales of
securities and gains on acquisitions from noninterest income

16
Enhance Profitability
Capitalize on
Opportunities
Aggressively Manage
Problem Credits
Build Capital Ratios
• Focus on highly-accretive acquisition opportunities
• Leverage existing markets
• Seek new markets
• New lines of business
• Selective balance sheet growth
• Maintain dividend
• Prudently manage capital
• Identify problem assets and risks early
• Quarantine troubled assets
• Superior returns
• Revenue growth / Expense control
• Net interest margin expansion / mitigate interest rate risk
• Loan growth
• Core deposit growth

Non-acquired NPAs
approaching pre-credit cycle
levels.
0.00%
1.00%
2.00%
3.00%
4.00%
5.00%
6.00%
7.00%
2010 2011 2012 2013 2014 1Q15 2Q15 3Q15 4Q15 1Q16 2Q16
Non-Acquired Acquired Covered Acquired
75
22
As a percentage of total assets
83
17
Non-
Acquired
Acquired
Covered
Acquired
NPL’s $12.0M $4.2M $27.0M
ORE $9.6M $2.6M $17.1M
Total
NPA’s $21.6M $6.8M $44.1M
83
22

*Ratios excludes loans and assets acquired in connection with the recent acquisitions or loss share transactions
0.00%
50.00%
100.00%
150.00%
200.00%
250.00%
300.00%
350.00%
400.00%
$-
$1,000
$2,000
$3,000
$4,000
$5,000
$6,000
4Q13 1Q14 2Q14 3Q14 4Q14 1Q15 2Q15 3Q15 4Q15 1Q16 2Q16
($)Provision for Loan Losses ($)Net Charge Offs Coverage Ratio*
• Net charge-offs in 2Q16 totaled
$191K compared to $1.59 million
in 2Q15
• Provision for loan losses totaled
$1.43 million in 2Q16 compared
to $1.18 million in 2Q15.
Allowance for Loan Losses as % of Non-Acquired Loans*
2010 2011 2012 2013 2014 1Q15 2Q15 3Q15 4Q15 1Q16 2Q16
2.07% 1.98% 1.72% 1.65% 1.29% 1.29% 1.23% 1.17% 1.11% 1.05% 1.03%
18

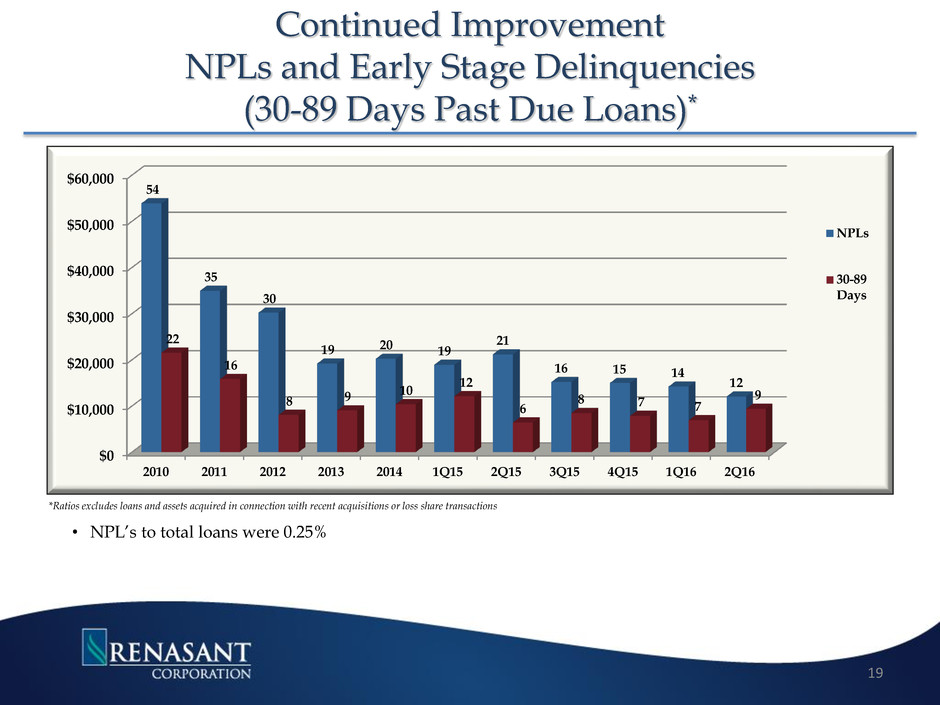
$0
$10,000
$20,000
$30,000
$40,000
$50,000
$60,000
2010 2011 2012 2013 2014 1Q15 2Q15 3Q15 4Q15 1Q16 2Q16
54
35
30
19 20 19
21
16 15 14
12
22
16
8 9
10
12
6
8 7 7
9
NPLs
30-89
Days
Continued Improvement
NPLs and Early Stage Delinquencies
(30-89 Days Past Due Loans)*
• NPL’s to total loans were 0.25%
19
*Ratios excludes loans and assets acquired in connection with recent acquisitions or loss share transactions

20
Enhance Profitability
Capitalize on
Opportunities
Aggressively Manage
Problem Credits
Build Capital Ratios
• Focus on highly-accretive acquisition opportunities
• Leverage existing markets
• Seek new markets
• New lines of business
• Selective balance sheet growth
• Maintain dividend
• Prudently manage capital
• Identify problem assets and risks early
• Quarantine troubled assets
• Superior returns
• Revenue growth / Expense control
• Net interest margin expansion / mitigate interest rate risk
• Loan growth
• Core deposit growth

4.50%
5.00%
5.50%
6.00%
6.50%
7.00%
7.50%
8.00%
2009 2010 2011 2012 2013 2014 1Q15 2Q15 3Q15 4Q15 1Q16 2Q16
Tangible Common Equity Ratio*
Renasant
Capital 2009 2010 2011 2012 2013 2014 1Q15 2Q15 3Q15 4Q15 1Q16 2Q16
Tangible
Common
Equity*
6.34% 6.76% 7.35% 7.71% 6.64% 7.52% 7.65% 7.78% 7.40% 7.54% 7.52% 7.79%
Leverage 8.68% 8.97% 9.44% 9.86% 8.68% 9.53% 9.74% 9.89% 8.95% 9.16% 9.19% 9.18%
Tier 1 Risk
Based
11.12% 13.58% 13.32% 12.74% 11.41% 12.45% 12.47% 12.52% 11.46% 11.51% 11.38% 11.56%
Total Risk
Based
12.37% 14.83% 14.58% 14.00% 12.58% 13.54% 13.51% 13.55% 12.27% 12.32% 12.17% 12.31%
Tier 1
Common
Equity
N/A N/A N/A N/A N/A N/A 10.35% 10.45% 9.92% 9.99% 9.88% 10.13%
• Maintained dividend throughout economic
downturn
• Regulatory capital ratios are above the
minimum for well-capitalized classification
• Capital level positions the Company for
future growth and geographic expansion
• Did not participate in the TARP program
21
* See slide 29 for reconciliation of Non-GAAP disclosure to GAAP

22
$8.5B franchise well positioned in attractive
markets in the Southeast
Merger with KeyWorth added $399M in
assets, $347M in deposits, $284M in loans
and 4 branches in Atlanta MSA
Strategic focus on expanding footprint
• Acquisition
• De Novo
• New lines of business
Opportunity for further profitability
improvement
Organic loan growth
Core deposit growth
Revenue growth
Declining credit costs
Strong capital position
Consistent dividend payment history

Appendix
23

Birmingham leads the state in the health care industry with an annual payroll
of approximately $2.9 billion, followed by Huntsville with $998 million
Honda, Hyundai, Mercedes-Benz increasingly large presence
Merger with HBOS added approximately $90.0 million in loans, $141 million
in deposits and 9 branches
13.4%
0.3% 0.6%
1.4%
0.6%
17.4%
7.4%
8.3%
0.7%
0.0%
5.0%
10.0%
15.0%
20.0%
C
ha
m
be
rs
, A
L
Je
ffe
rs
on
, A
L
Le
e,
A
L
M
ad
is
on
, A
L
M
on
tg
om
er
y,
A
L
M
or
ga
n,
A
L
Sh
el
by
, A
L
Ta
lla
de
ga
, A
L
Tu
sc
al
oo
sa
, A
L
Montgomery
Huntsville
Birmingham
24
Deposit Market Share by County – Top 5 Presence in 4 of 9 counties
3 4 4 2
Deposit
Market
Share
Rank 16 17 14 14 14
Alabama Deposit Market Share
Source: SNL Financial
Green highlighting denotes top 5 deposit market share in respective county
Deposit data as of 6/30/15
Deposits Market
Rank Institution ($mm) Share Branches
1 Regions Financial Corp. $22,262 24.4 % 236
2 Banco Bilbao Vizcaya Argentaria SA 11,828 13.0 89
3 Wells Fargo & Co. 8,921 9.8 139
4 Synovus Financial Corp. 3,922 4.3 41
5 BB&T Corp. 3,465 3.8 88
6 ServisFirst Bancshares Inc. 3,326 3.6 11
7 PNC Financial Services Group Inc. 2,922 3.2 69
8 Cadence Bancorp LLC 2,038 2.2 25
9 Trustmark Corp. 1,325 1.5 41
10 Bryant Bank 1,135 1.2 14
15 Renasant Corp. 866 1.0 21
RNST Branches

2.8%
2.6%
2.9%
0.0%
1.0%
2.0%
3.0%
4.0%
Al
ac
hu
a,
FL
Co
lu
m
bi
a,
FL
M
ar
io
n,
FL
Entered the Florida market through the acquisition of Heritage Financial Group, Inc.
(Nasdaq: HBOS), which closed on 7/1/15
Moved into FL with 8 full-services branches along I-75
Florida has the 19th largest economy in the world, if it were a country
Publix Super Markets, Southern Wine & Spirits, and JM Family Enterprises are all
headquartered in Florida
Florida projected population growth is approximately 6.0% compared to the national
average of 3.7%
25
Deposit Market Share by County – Top 5 Presence in 0 of 3 counties
Deposit
Market
Share
Rank
9
Florida Deposit Market Share
6 8
Source: SNL Financial
Deposit data as of 6/30/15
Deposits Market
Rank Institution ($mm) Share Branches
1 Bank of America Corp. $97,951 20.0 % 580
2 Wells Fargo & Co. 75,101 15.3 652
3 SunTrust Banks Inc. 46,343 9.5 492
4 JPMorgan Chase & Co. 24,929 5.1 394
5 Regions Financial Corp. 19,299 3.9 353
6 BB&T Corp. 16,892 3.4 325
7 EverBank Financial Corp 16,601 3.4 12
8 Citigroup Inc. 16,114 3.3 55
9 BankUnited Inc. 12,510 2.6 96
10 Toronto-Dominion Bank 10,865 2.2 156
101 Renasant Corp. 286 0.1 8
Jacksonville
Miami
Tampa
Orlando
Tallahassee
RNST Branches
10
10
95
Gainesville
Ocala

11.0%
7.6%
1.1%
13.3%
0.5%
5.3%
18.6%
0.4%
15.9%
26.7%
2.3%
0.4%
1.8%
27.5%
9.2%
2.5%
0.0%
13.3%
9.7%
0.7%
14.2%
0.0%
8.0%
16.0%
24.0%
32.0%
Ap
plin
g, G
A
Bar
tow
, G
A
Bib
b, G
A
Bu
lloc
h, G
A
Ch
ath
am
, G
A
Ch
ero
kee
, G
A
Co
ok,
GA
De
Ka
lb,
GA
Do
ugh
erty
, G
A
Eff
ing
ham
, G
A
For
syt
h, G
A
Ful
ton
, G
A
Gw
inn
ett,
GA
Jeff
Da
vis
, G
A
Lee
, G
A
Low
nd
es,
GA
Mu
sco
gee
, G
A
Pic
ken
s, G
A
Tat
tna
ll, G
A
Tro
up,
GA
Wo
rth
, G
A
Entered the North GA market through two FDIC loss share transactions
12 full-service locations
Expanded services include mortgage and wealth management personnel
Grew GA presence by completing acquisition of Heritage Financial Group, Inc. ($1.7 billion in assets)
Added 20 full-service branches and 4 mortgage offices
Significantly ramps up our mortgage division
Enhanced GA presence by acquisition of KeyWorth Bank ($408 million in assets)
Approximately $284 million in loans, $347 million in deposits, and 4 full-service branches
Recently established an asset based lending division headquartered in Atlanta
26
Deposit Market Share by County – Top 5 Presence in 11 of 21 counties
5 6 3 8 2 5
Deposit
Market
Share
Rank
4 2 2 13 3 4
Georgia Deposit Market Share
Source: SNL Financial
RNST data pro forma for pending acquisition of KeyWorth Bank
Green highlighting denotes top 5 deposit market share in respective county
Deposit data as of 6/30/15
Deposits Market
Rank Institution ($mm) Share Branches
1 SunTrust Banks Inc. $45,147 21.5 % 245
2 Wells Fargo & Co. 33,477 15.9 284
3 Bank of America Corp. 31,657 15.0 183
4 Synovus Financial Corp. 12,978 6.2 118
5 BB&T Corp. 11,856 5.6 161
6 Regions Financial Corp. 6,205 3.0 131
7 United Community Banks Inc. 5,260 2.5 71
8 Bank of the Oza ks Inc. 4,444 2.1 74
9 State Bank Financial Corp. 2,795 1.3 26
10 PNC Financial Services Group Inc. 2,702 1.3 74
14 Renasant Corp. 1,763 0.8 3611 4 16 3 12 14 21 11 13
Atlanta
Savannah
Albany
RNST Branches
Acquired KeyWorth Branches

27
Deposit Market Share by County – Top 5 Presence in 23 of 27 counties
5 1
Entered the Columbus, MS market in November 2010 and opened an office in Starkville, home of
Mississippi State University, during late Q3 ‘11
Columbus Air Force Base trains 1/3 of the nation’s pilots, with an economic impact of $250 million
Yokohama Tire Corporation announces plans to locate new commercial tire plant in West Point with an initial
investment of $300 million and potentially more than $1 billion.
The Tupelo/Lee County
Recently completed a $12 million aquatic center and a $4 million expansion of the Elvis Presley Birthplace and
Museum
Hosts one of the largest furniture markets in the U.S.
Oxford, Tupelo and Columbus were noted by American Express as three of the best small towns in
America for business
4 2 4 2 3 7 3
Deposit
Market
Share
Rank
2 3 4 1 6 5 2 4 5 2 4 2 7 3 3 2 2 10
Mississippi Deposit Market Share
Source: SNL Financial
Green highlighting denotes top 5 deposit market share in respective county
Deposit data as of 6/30/15
Deposits Market
Rank Institution ($mm) Share Branches
1 Regions Financial Corp. $7,023 14.2 % 138
2 Trustmark Corp. 6,864 13.9 129
3 BancorpSouth Inc. 5,295 10.7 98
4 Renasant Corp. 2,879 5.8 70
5 Hancock Holding Co. 2,856 5.8 39
6 BancPlus Corp. 2,049 4.1 59
7 Community Bancshares of Mississippi Inc. 2,020 4.1 35
8 Citizens National Banc Corp. 981 2.0 26
9 Planters Holding Co. 924 1.9 19
10 BankFirst Capital Corp. 777 1.6 11
7.9%
51.6%
9.0%
30.2%
5.6%
46.9%
24.2%
6.0%
16.7%
0.6%
11.9%10.8%
41.1%
7.3%8.3%
24.2%
9.8%
5.3%
23.3%
9.9%
28.7%28.0%
5.1%
11.5%10.4%
28.1%
20.9%
0.0%
15.0%
30.0%
45.0%
60.0%
Alc
orn
, M
S
Atta
la, M
S
Boli
var,
MS
Cal
hou
n, M
S
Chi
cka
saw
, MS
Cho
ctaw
, MS
Cla
y, M
S
Des
oto,
MS
Gre
nad
a, M
S
Hin
ds,
MS
Hol
mes
, MS
Lafa
yett
e, M
S
Lee
, MS
Low
nde
s, M
S
Mad
ison
, MS
Mo
nro
e, M
S
Mo
ntg
ome
ry, M
S
Nes
hob
a, M
S
Okt
ibbe
ha,
MS
Pan
ola,
MS
Pon
toto
c, M
S
Pre
ntis
s, M
S
Ran
kin,
MS
Tish
om
ingo
, MS
Uni
on,
MS
Win
ston
, MS
Yal
obu
sha
, MS
RNST Branches
Tupelo
Jackson

2.3%
10.4%
1.3% 1.2% 0.8% 1.3%
2.1%
0.6%
0.0%
3.0%
6.0%
9.0%
12.0%
Bl
ou
nt
, T
N
Cr
oc
ke
tt,
T
N
Da
vi
ds
on
, T
N
Sh
elb
y,
T
N
Su
lli
va
n,
T
N
Su
m
ne
r,
TN
W
as
hi
ng
to
n,
T
N
W
ill
iam
so
n,
T
N
Our Tennessee Operations
The Knoxville/Maryville MSA location opened in late Q2 ‘12
East Tennessee operations currently have 4 full-service branches, $238 million in
loans and $106 million in deposits
New lending teams added in both Memphis and Nashville during 2013
New Healthcare Lending Group added in Nashville during 2015
Tennessee ranked 7th best state to do business, per Area Development magazine
Driven by VW, Nissan and GM, Tennessee named the #1 state in the nation for
automotive manufacturing strength
Unemployment rate continues to improve declining to 5.7% from 6.6% on a Y-O-Y
basis.
28
Deposit Market Share by County – Top 5 Presence in 1 of 8 counties
Deposit
Market
Share
Rank
3 12 15 14 18 9
Tennessee Deposit Market Share
Deposits Market
Rank Institution ($mm) Share Branches
1 First Horizon National Corp. $17,958 13.7 % 167
2 Regions Financial Corp. 17,635 13.4 239
3 SunTrust Banks Inc. 13,617 10.4 146
4 Bank of America Corp. 10,537 8.0 59
5 Pinnacle Financial Partners Inc. 6,389 4.9 44
6 U.S. Bancorp 2,711 2.1 104
7 BB&T Corp. 2,480 1.9 49
8 First South Bancorp Inc. 2,103 1.6 49
9 Wells Fargo & Co. 1,742 1.3 19
10 Wilson Bank Holding Co. 1,709 1.3 25
22 Renasant Corp. 809 0.6 15
14 22
Source: SNL Financial
Green highlighting denotes top 5 deposit market share in respective county
Deposit data as of 6/30/15
In the Nashville market, Hospital Corporation of American announced an
expansion that will create 2,000 jobs
Nashville housing sales increased 17.6% Y-O-Y
The median home price increased approximately 5.8% on a Y-O-Y basis
The Memphis MSA market ranked #1 for Logistics Leaders both nationally and
globally
Bass Pro Shops, $70 million hotel in conjunction with their Pyramid flagship store
to open in 2015
Electrolux has begun the hiring of some 1,200 workers from its expansion
announcement in 2010
Nashville
Knoxville
Memphis
RNST Branches
40

29
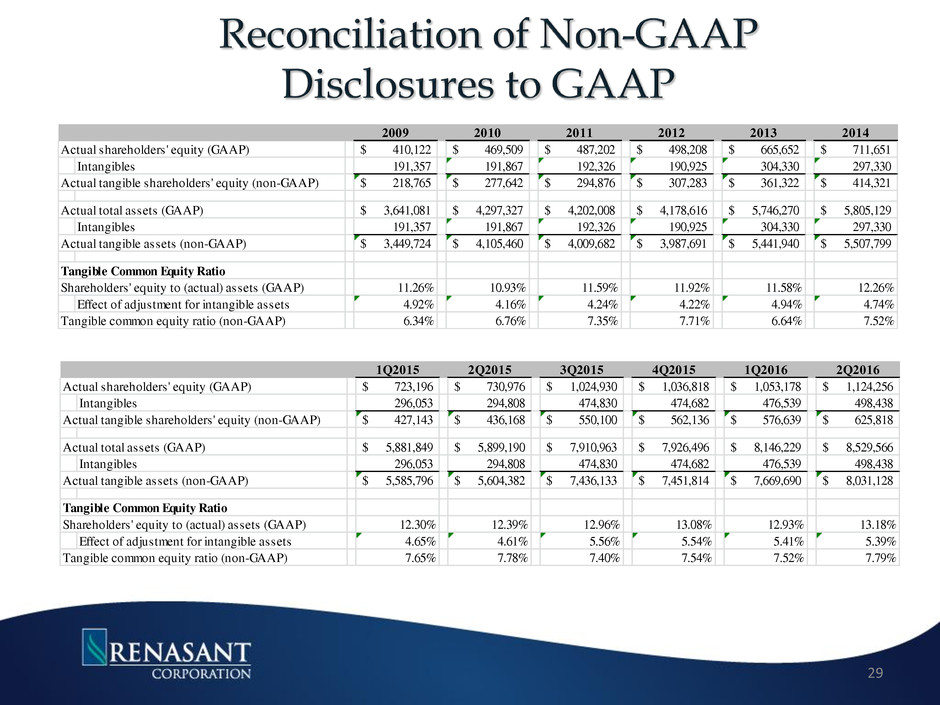
2009 2010 2011 2012 2013 2014
Actual shareholders' equity (GAAP) 410,122$ 469,509$ 487,202$ 498,208$ 665,652$ 711,651$
Intangibles 191,357 191,867 192,326 190,925 304,330 297,330
Actual tangible shareholders' equity (non-GAAP) 218,765$ 277,642$ 294,876$ 307,283$ 361,322$ 414,321$
Actual total assets (GAAP) 3,641,081$ 4,297,327$ 4,202,008$ 4,178,616$ 5,746,270$ 5,805,129$
Intangibles 191,357 191,867 192,326 190,925 304,330 297,330
Actual tangible assets (non-GAAP) 3,449,724$ 4,105,460$ 4,009,682$ 3,987,691$ 5,441,940$ 5,507,799$
Tangible Common Equity Ratio
Shareholders' equity to (actual) assets (GAAP) 11.26% 10.93% 11.59% 11.92% 11.58% 12.26%
Effect of adjustment for intangible assets 4.92% 4.16% 4.24% 4.22% 4.94% 4.74%
Tangible common equity ratio (non-GAAP) 6.34% 6.76% 7.35% 7.71% 6.64% 7.52%
1Q2015 2Q2 15 3Q2 15 4Q2015 1Q20 6 2Q2 16
Actual shareholders' equity (GAAP) 723,196$ 730,976$ 1,024,930$ 1,036,818$ 1,053,178$ 1,124,256$
Intangibles 296,053 294,808 474,830 474,682 476,539 498,438
Actual tangibl shareholders' equity (non-GAAP) 427,143$ 436,168$ 550,100$ 562,136$ 576,639$ 625,818$
Actual total assets (GAAP) 5,881,8 9$ 5,899,190$ 7,910,963$ 7,926,496$ 8,14 ,229$ 8,529, 66$
Intangibles 296,053 294,808 474,830 474,682 476,539 498,438
Actual tangible assets (non-GAAP) 5,585,796$ 5,604,382$ 7,436,133$ 7,451,814$ 7,669,690$ 8,031,128$
Tangible Common Equity Ratio
Shareholders' equity to (actual) assets (GAAP) 12.30% 12.39% 12.96% 13.08% 12.93% 13.18%
Effect of adjustment for intangible assets 4.65% 4.61% 5.56% 5.54% 5.41% 5.39%
Tangible common equity ratio (non-GAAP) 7.65% 7.78% 7.40% 7.54% 7.52% 7.79%

E. Robinson McGraw
Chairman and
Chief Executive Officer
Kevin D. Chapman
Executive Vice President and
Chief Financial Officer
209 TROY STREET
TUPELO, MS 38804-4827
PHONE: 1-800-680-1601
FACSIMILE: 1-662-680-1234
WWW.RENASANT.COM
WWW.RENASANTBANK.COM
30
