Attached files
| file | filename |
|---|---|
| EX-99.1 - EX-99.1 - MYERS INDUSTRIES INC | d238067dex991.htm |
| 8-K - FORM 8-K - MYERS INDUSTRIES INC | d238067d8k.htm |
 AUGUST
3, 2016
| MYERS INDUSTRIES, INC.
SECOND
QUARTER
EARNINGS
PRESENTATION
Exhibit 99.2 |
 2 Statements in this presentation concerning the Company’s goals, strategies, and expectations for business and financial results
may be "forward-looking statements" within the
meaning of the Private Securities Litigation Reform Act of 1995 and are based on current indicators and expectations. Whenever you read a statement that is not simply a statement of historical fact (such as
when we describe what we "believe," "expect," or
"anticipate" will occur, and other similar statements), you must remember that our expectations may not be correct, even though we believe they are reasonable. We do not guarantee that the transactions and
events described will happen as described (or that they will
happen at all). You should review this presentation with the
understanding that actual future results may be materially different from what
we expect. Many of the factors that will determine these
results are beyond our ability to control or predict. You are cautioned not to put undue reliance on any forward-looking statement. We do not intend, and undertake no obligation, to update these forward-looking statements. These statements
involve
a number of risks and uncertainties that could cause actual results to differ materially from those expressed or implied in the applicable statements. Such risks include: (1) Changes in the markets within the Company’s business segments (2) Changes in trends and demands in the markets in which the Company competes
(3) Unanticipated downturn in business relationships with customers or their
purchases (4) Competitive pressures on sales and
pricing (5) Raw material availability, increases in raw material
costs, or other production costs (6) Harsh weather
conditions (7) Future economic and financial conditions in the
United States and around the world (8) Inability of the Company to
meet future capital requirements (9) Claims, litigation and
regulatory actions against the Company (10) Changes in laws and
regulations affecting the Company Myers Industries, Inc.
encourages investors to learn more about these risk factors. A detailed explanation of these factors is available in the Company’s publicly filed quarterly and annual reports, which can be found online at www.myersind.com and at
the SEC.gov website.
SAFE
HARBOR
STATEMENT
|
 Q2 2016 SUMMARY
» Sales below expectations; solid margins due to operational discipline » Net sales $144.1M, a decrease of 12% to prior year » Organic (11%); currency (1%) » Difficult capital spending environment in several key markets » Gross margin +10 basis points to 30.9% » Lower input costs » Positive mix from product line rationalizations » Operational improvements » GAAP EPS from continuing operations $0.19 vs. $0.35 in 2015 » Adjusted EPS from continuing operations $0.21 vs. $0.30 in 2015 » Free cash flow YTD ($13.6M) vs. ($12.4M) in 2015 » Cash from operations flat; capital spending up slightly 3 SOFTER MARKET CONDITIONS PARTICULARLY IN CAPITAL SPENDING |
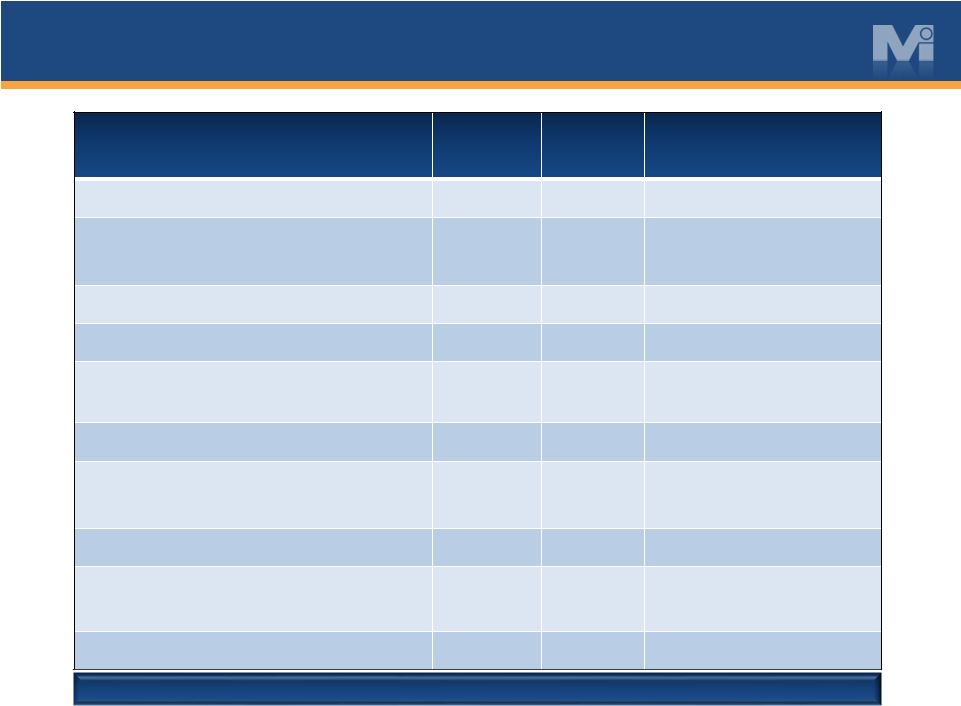 CONTINUING OPERATIONS
Q2 2015 Q2 2016 NET SALES $ 164.3 $ 144.1 (11%) ORGANIC GROSS PROFIT GROSS MARGIN $ 50.6 30.8% $ 44.5 30.9% +10 BPS SG&A $ 30.8 $ 32.0 3.9% INCREASE IMPAIRMENT CHARGES $ 0.0 $ 1.3 OPERATING INCOME OPERATING MARGIN $ 19.7 12.0% $ 11.2 7.7% -430 BPS NET INTEREST EXPENSE $ 2.5 $ 2.1 INCOME FROM CONTINUING OPS BEFORE INCOME TAXES $ 17.3 $ 9.1 INCOME TAX EXPENSE $ 6.4 $ 3.4 INCOME FROM CONTINUING OPS INCOME MARGIN $ 10.9 6.6% $ 5.7 4.0% EPS FROM CONTINUING OPS $ 0.35 $ 0.19 4 Q2 GAAP FINANCIAL SUMMARY IN $MILLIONS EXCEPT EPS AND PERCENTAGES |
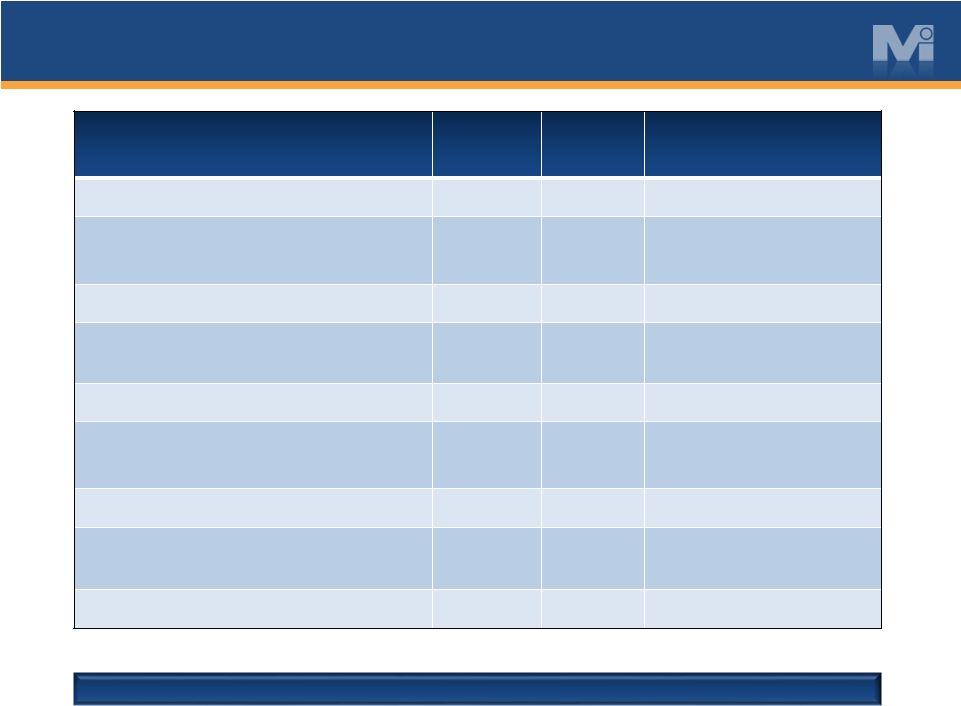 CONTINUING OPERATIONS
Q2 2015 Q2 2016 NET SALES $ 164.3 $ 144.1 (11%) ORGANIC GROSS PROFIT GROSS MARGIN $ 50.6 30.8% $ 44.5 30.9% +10 BPS ADJ. SG&A $ 33.4 $ 32.8 (1.8%) DECREASE ADJ. OPERATING INCOME OPERATING MARGIN $ 17.2 10.5% $ 11.7 8.1% -240 BPS NET INTEREST EXPENSE $ 2.5 $ 2.1 ADJ. INCOME
FROM CONTINUING OPS BEFORE INCOME TAXES $ 14.7 $ 9.7 INCOME TAX EXPENSE $ 5.3 $ 3.5 NORMALIZED RATE 36% ADJ. INCOME
FROM CONTINUING OPS INCOME MARGIN $ 9.4 5.7% $ 6.2 4.3% ADJ. EPS FROM CONTINUING OPS $ 0.30 $ 0.21 5 Q2 ADJUSTED FINANCIAL SUMMARY $20.5M ADJUSTED EBITDA; IN LINE WITH Q1 IN $MILLIONS EXCEPT EPS AND PERCENTAGES SEE APPENDIX FOR RECONCILIATIONS FROM GAAP TO ADJUSTED RESULTS |
 |
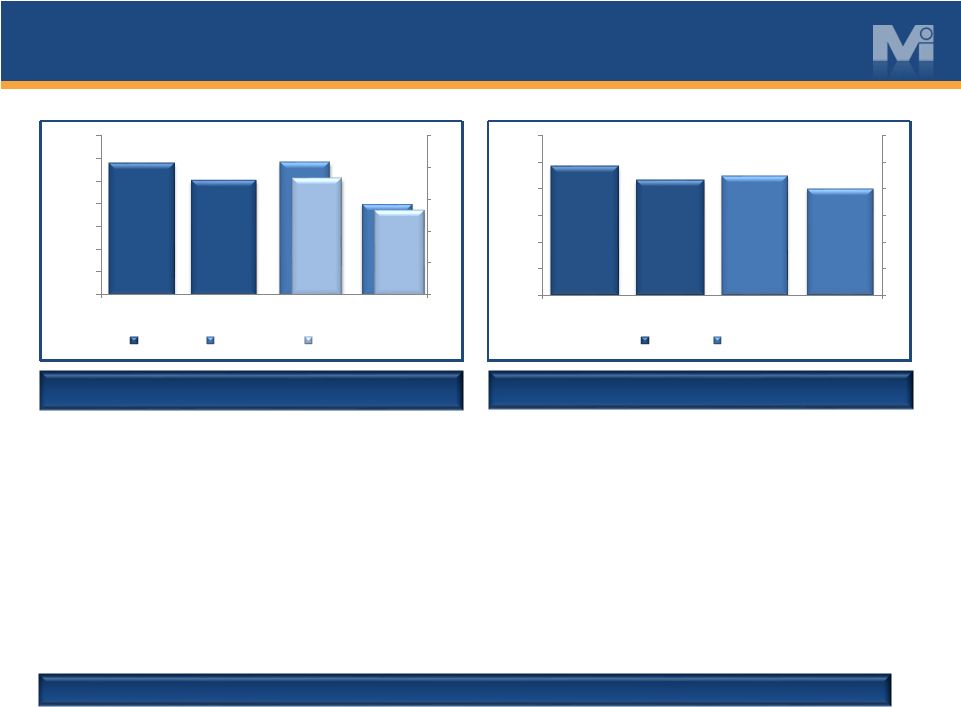 » Sales down 11%: » Capital spending down and general market indicators mixed; muted Q2 seasonal uptick » Retread markets remains slow » Sales team initiative progressing; good progress made in quarter but still early part of transformation » Gaining share at auto dealers » Two new wins in highway marking tape product line » Favorable mix in Q2; margin flat » Sales initiative targeting higher margin products » Sales down 13%; down 12% organic: » Low capital spending environment in key agriculture, food processing and beverage markets » Consumer sales softer than forecasted » Continue to gain share in automotive; new wins at several RV accounts » Steady progress in industrial markets » Solid margins in Q2 despite lower sales: » Favorable input costs and various product line rationalizations Q2 2016 SEGMENT RESULTS 7 COMMERCIAL EXECUTION CONTINUES TO BE THE PRIORITY DISTRIBUTION $ Millions $ Millions MATERIAL HANDLING $115.8 $100.9 $20.8 $14.3 $18.3 $13.3 0 5 10 15 20 25 $0.0 $20.0 $40.0 $60.0 $80.0 $100.0 $120.0 $140.0 Q2 2015 Q2 2016 Q2 2015 Q2 2016 Net Sales GAAP Op Inc. Adj. Op Inc. $48.6 $43.2 $4.5 $4.0 0 1 2 3 4 5 6 $0.0 $10.0 $20.0 $30.0 $40.0 $50.0 $60.0 Q2 2015 Q2 2016 Q2 2015 Q2 2016 Net Sales Op Inc. |
 2016 OUTLOOK
AND STRATEGIC UPDATE Outlook » Lowering prior outlook; FY revenue expected to be down mid-to-high single digits » Capital spending in key end markets will continue to be below prior year » Mixed market indicators and sales transformation in Distribution segment Strategic Update » Business level strategies: » Completed strategic marketing work » Identified key initiatives and process improvements » Themes: » Commercial execution » Protect the core » Simplify » Next steps: » Prioritizing certain cost actions to protect commercial investments 8 LOWERING OUTLOOK ;
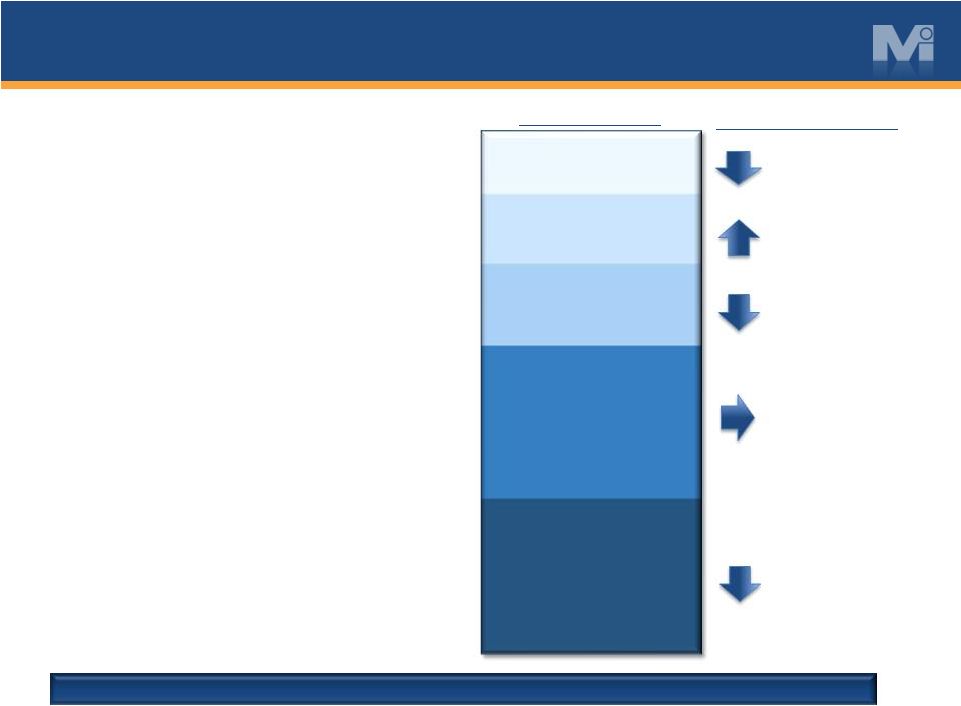
GOOD PROGRESS ON STRATEGY CONSUMER 12% VEHICLE 13% FOOD & BEVERAGE 16% AUTO AFTERMARKET 30% INDUSTRIAL 29% LOW SINGLE DIGITS HIGH SINGLE DIGITS LOW SINGLE DIGITS MID-TEENS
PERCENT
OF 2015 SALES MYE 2016 GROWTH OUTLOOK FLAT |
 APPENDIX
9 |
 2016 KEY
ASSUMPTIONS
» Capital expenditures: $15 - $18 million » Interest expense: $8 - $10 million » D&A: $35 - $37 million » Effective tax rate (normalized): 36% 10 |
 RECONCILIATION
OF NON-GAAP MEASURES
11 MYERS INDUSTRIES, INC. RECONCILIATION OF NON-GAAP FINANCIAL MEASURES CONSOLIDATED SELLING, GENERAL AND ADMINISTRATIVE EXPENSES (UNAUDITED) (Dollars in thousands) Note on Reconciliation of Income and Earnings Data: Selling, general and administrative expenses excluding the items above in the text of this presentation and in this reconciliation chart is a non-GAAP financial measure that Myers Industries, Inc. calculates according to the schedule above using GAAP amounts from the unaudited Condensed Consolidated Statement of Operations. The Company believes that the excluded items are not primarily related to core operational activities. The Company believes that selling, general and administrative expenses excluding items that are not primarily related to core operating activities is generally viewed as providing useful information regarding a company's operating profitability. Management uses selling, general and administrative expenses excluding these items as well as other financial measures in connection with its decision-making activities. Selling, general and administrative expenses excluding these items should not be considered in isolation or as a substitute for selling, general and administrative expenses prepared in accordance with GAAP. The Company's method for calculating selling, general and administrative expenses excluding these items may not be comparable to methods used by other companies. Quarter Ended Six Months Ended June 30, 2016 June 30, 2015 June 30, 2016 June 30, 2015 Selling, general and administrative expenses as reported
$ 32,041
$ 30,839
$ 70,538
$ 69,880
Restructuring expenses and other adjustments in
selling, general and administrative
expenses Material Handling
segment 2,335
2,561
-
2,470
Distribution segment
-
-
-
(53)
Corporate
(1,550)
-
(3,561)
(1,806)
Selling, general and administrative expenses as
adjusted $ 32,826
$ 33,400
$ 66,977
$ 70,491
|
 RECONCILIATION
OF NON-GAAP MEASURES
12 MYERS INDUSTRIES, INC. RECONCILIATION OF NON-GAAP FINANCIAL MEASURES INCOME (LOSS) BEFORE TAXES BY SEGMENT (UNAUDITED) (Dollars in millions, except per share data) Note on Reconciliation of Income and Earnings Data: Income (loss) excluding the items above in the text of this presentation and in this reconciliation chart is a non-GAAP financial measure that Myers Industries, Inc. calculates according to the schedule above using GAAP amounts from the unaudited Condensed Consolidated Statement of Operations. The Company believes that the excluded items are not primarily related to core operational activities. The Company believes that income (loss) excluding items that are not primarily related to core operating activities is generally viewed as providing useful information regarding a company's operating profitability. Management uses income (loss) excluding these items as well as other financial measures in connection with its decision-making activities. Income (loss) excluding these items should not be considered in isolation or as a substitute for income (loss) prepared in accordance with GAAP. The Company's method for calculating income (loss) excluding these items may not be comparable to methods used by other companies. *Income taxes are calculated using the normalized effective tax rate for each year. The normalized rate used above is 36%.
Quarter Ended June30,
Six Months Ended June30,
2016
2015
2016
2015
Material Handling
Operating income as reported
$
14,333
$
20,846
$
21,774
$
34,253
Litigation reserve reversal
-
(3,010)
-
(3,010)
Asset impairments
1,329
-
9,874
-
Reduction to contingent liability
(2,335)
(2,335)
Restructuring expenses and other
adjustments -
449
-
540
Operating income as adjusted
13,327
18,285
29,313
31,783
Distribution
Operating income as reported
3,966
4,508
6,502
7,999
Restructuring expenses and other
adjustments -
-
-
53
Operating income as adjusted
3,966
4,508
6,502
8,052
Corporate Expense
Corporate expense as reported
(7,133)
(5,612)
(15,981)
(15,794)
CFO severance related costs
-
-
2,011
-
Environmental reserve
1,550
-
1,550
-
Professional, legal fees and other
adjustments -
-
-
1,806
Corporate expense as adjusted
(5,583)
(5,612)
(12,420)
(13,988)
Continuing Operations
Operating income as reported
11,166
19,742
12,295
26,458
Total of all adjustments above
544
(2,561)
11,100
(611)
Operating income as adjusted
11,710
17,181
23,395
25,847
Interest expense, net
(2,053)
(2,467)
(4,072)
(5,169)
Income before taxes as adjusted
9,657
14,714
19,323
20,678
Income tax expense*
(3,477)
(5,253)
(6,956)
(7,382)
Income from continuing operations as
adjusted $
6,180
$
9,461
$
12,367
$
13,296
Adjusted earnings per diluted share from continuing
operations $
0.21
$
0.30
$
0.41
$
0.42 |
 RECONCILIATION
OF NON-GAAP MEASURES
13 MYERS INDUSTRIES, INC. RECONCILIATION OF NON-GAAP FINANCIAL MEASURES COMBINED STATEMENTS OF INCOME (UNAUDITED) (Dollars in thousands) Note on Reconciliation of Income and Earnings Data: EBITDA as adjusted is a financial measure that Myers Industries, Inc. calculates according to the schedule above using amounts from the unaudited Reconciliation of Non-GAAP Financial Measures Income (Loss) Before Taxes By Segment and GAAP amounts from the unaudited Condensed Consolidated Statement of Operations. The Company believes that EBITDA as adjusted provides useful information regarding a company's operating profitability. Management uses EBITDA as adjusted as well as other financial measures in connection with its decision-making activities. EBITDA as adjusted should not be considered in isolation or as a substitute for net income (loss), income (loss) before taxes or other consolidated income data prepared in accordance with GAAP. The Company's method for calculating EBITDA as adjusted may not be comparable to methods used by other companies. Quarter Ended TTM 30-Sep-14 31-Dec-14 31-Mar-15 30-Jun-15 30-Jun-15 Net Income as Reported Continuing Operations $
(3,618)
$
1,489 $
2,622
$
10,925 $ 11,418
Add: tax expense
(1,697)
991
1,392
6,350
7,036
Add: net interest expense
2,637
2,647
2,702
2,467
10,453
Add: depreciation
6,719
6,424
6,489
6,801
26,433
Add: amortization
2,814
2,724
2,638
2,641
10,817
EBITDA
6,855
14,275
15,843
29,184
66,157
Add: one-time unusual charges
8,988
1,031
1,950
(2,561)
9,408
EBITDA As Adjusted
15,843
15,306
17,793
26,623
75,565
Quarter
Ended
TTM
30-Sep-15
31-Dec-15
31-Mar-16
30-Jun-16
30-Jun-16
Net Income as Reported Continuing
Operations
$
631 $
(125)
$
(3,336) $
5,684
$
2,854 Add: tax expense 218 (151) 2,446 3,429 5,942 Add: net interest expense 1,729 2,100 2,019 2,053 7,901 Add: depreciation 5,926 5,496 6,000 6,283 23,705 Add: amortization 2,575 2,413 2,499 2,482 9,969 EBITDA 11,079 9,733 9,628 19,931 50,371 Add: one-time unusual charges 3,318 2,906 10,556 544 17,324 EBITDA As Adjusted 14,397 12,639 20,184 20,475 67,695 |
 |