Attached files
| file | filename |
|---|---|
| EX-99.1 - EX-99.1 - VEECO INSTRUMENTS INC | a16-15786_1ex99d1.htm |
| 8-K - 8-K - VEECO INSTRUMENTS INC | a16-15786_18k.htm |
Exhibit 99.2
Q2 2016 Conference Call Veeco Instruments Inc. August 1, 2016

Safe Harbor To the extent that this presentation discusses expectations or otherwise makes statements about the future, such statements are forward-looking and are subject to a number of risks and uncertainties that could cause actual results to differ materially from the statements made. These items include the risk factors discussed in the Business Description and Management's Discussion and Analysis sections of Veeco's Annual Report on Form 10-K for the year ended December 31, 2015 and subsequent Quarterly Reports on Form 10-Q and current reports on Form 8-K. Veeco does not undertake any obligation to update any forward-looking statements to reflect future events or circumstances after the date of such statements.
CEO Introduction John Peeler
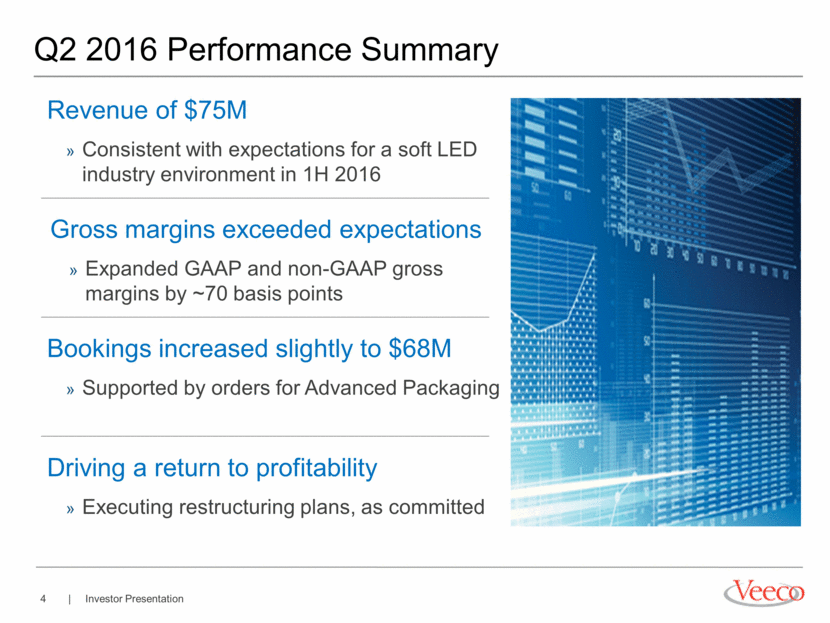
Revenue of $75M Consistent with expectations for a soft LED industry environment in 1H 2016 Driving a return to profitability Executing restructuring plans, as committed Bookings increased slightly to $68M Supported by orders for Advanced Packaging Q2 2016 Performance Summary Gross margins exceeded expectations Expanded GAAP and non-GAAP gross margins by ~70 basis points
CFO Financial Review Sam Maheshwari
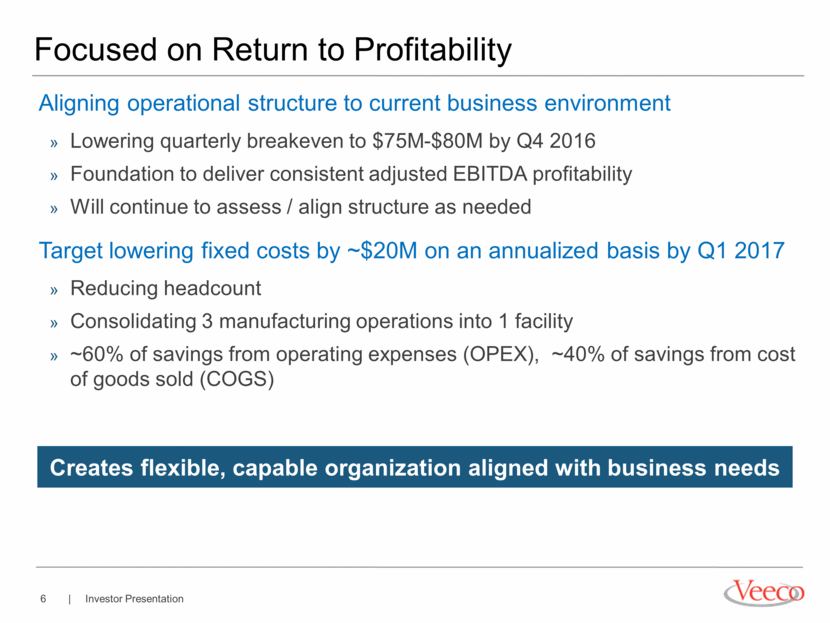
Focused on Return to Profitability Aligning operational structure to current business environment Lowering quarterly breakeven to $75M-$80M by Q4 2016 Foundation to deliver consistent adjusted EBITDA profitability Will continue to assess / align structure as needed Target lowering fixed costs by ~$20M on an annualized basis by Q1 2017 Reducing headcount Consolidating 3 manufacturing operations into 1 facility ~60% of savings from operating expenses (OPEX), ~40% of savings from cost of goods sold (COGS) Creates flexible, capable organization aligned with business needs Validate accuracy of modifying top graphic to “mid-70’s by Q1 17”
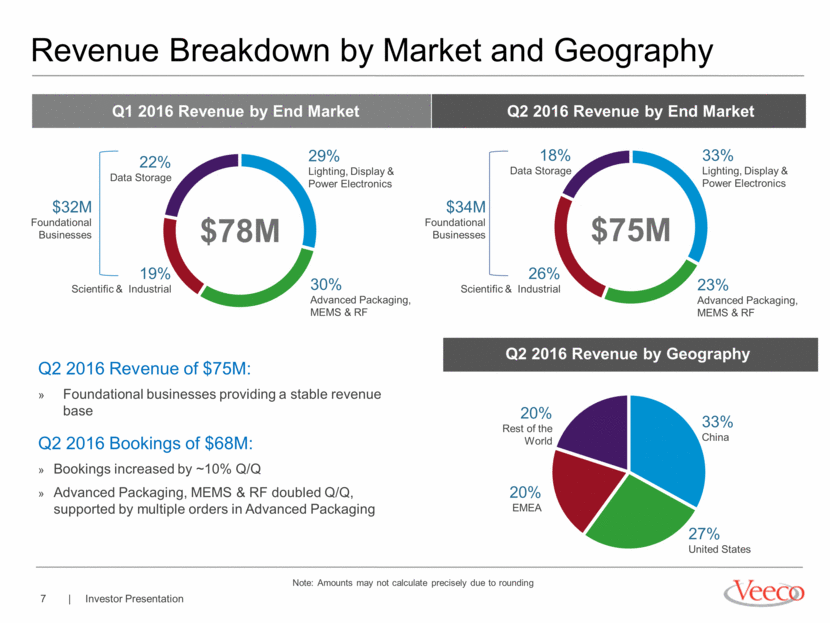
23% Advanced Packaging, MEMS & RF Revenue Breakdown by Market and Geography Note: Amounts may not calculate precisely due to rounding 33% Lighting, Display & Power Electronics 26% Scientific & Industrial 18% Data Storage Q2 2016 Revenue by End Market $75M 27% United States 33% China 20% EMEA 20% Rest of the World Q2 2016 Revenue by Geography Q2 2016 Revenue of $75M: Foundational businesses providing a stable revenue base Q2 2016 Bookings of $68M: Bookings increased by ~10% Q/Q Advanced Packaging, MEMS & RF doubled Q/Q, supported by multiple orders in Advanced Packaging 30% Advanced Packaging, MEMS & RF 22% Data Storage 19% Scientific & Industrial 29% Lighting, Display & Power Electronics Q1 2016 Revenue by End Market $78M $34M Foundational Businesses $32M Foundational Businesses
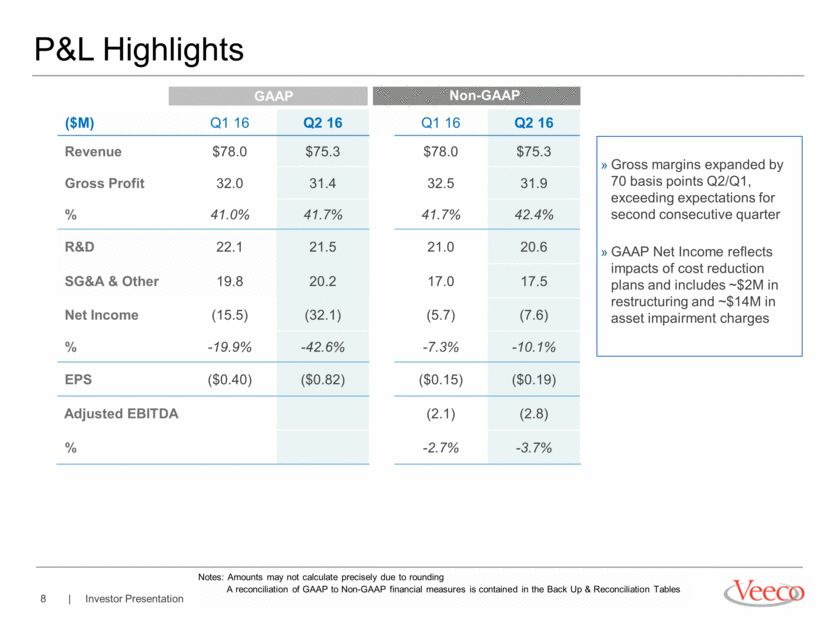
P&L Highlights ($M) Q1 16 Q2 16 Q1 16 Q2 16 Revenue $78.0 $75.3 $78.0 $75.3 Gross Profit 32.0 31.4 32.5 31.9 % 41.0% 41.7% 41.7% 42.4% R&D 22.1 21.5 21.0 20.6 SG&A & Other 19.8 20.2 17.0 17.5 Net Income (15.5) (32.1) (5.7) (7.6) % -19.9% -42.6% -7.3% -10.1% EPS ($0.40) ($0.82) ($0.15) ($0.19) Adjusted EBITDA (2.1) (2.8) % -2.7% -3.7% GAAP Non-GAAP Gross margins expanded by 70 basis points Q2/Q1, exceeding expectations for second consecutive quarter GAAP Net Income reflects impacts of cost reduction plans and includes ~$2M in restructuring and ~$14M in asset impairment charges Notes: Amounts may not calculate precisely due to rounding A reconciliation of GAAP to Non-GAAP financial measures is contained in the Back Up & Reconciliation Tables
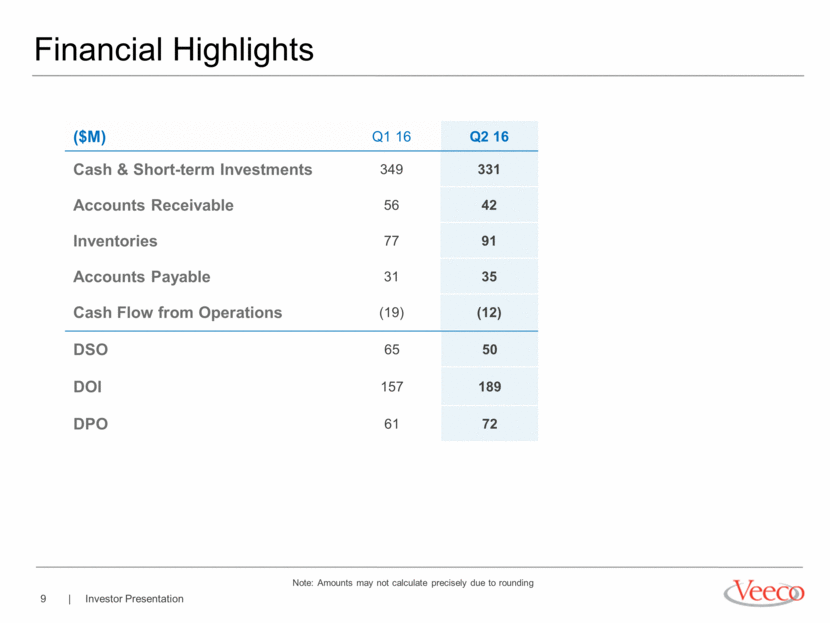
($M) Q1 16 Q2 16 Cash & Short-term Investments 349 331 Accounts Receivable 56 42 Inventories 77 91 Accounts Payable 31 35 Cash Flow from Operations (19) (12) Financial Highlights DSO 65 50 DOI 157 189 DPO 61 72 Note: Amounts may not calculate precisely due to rounding
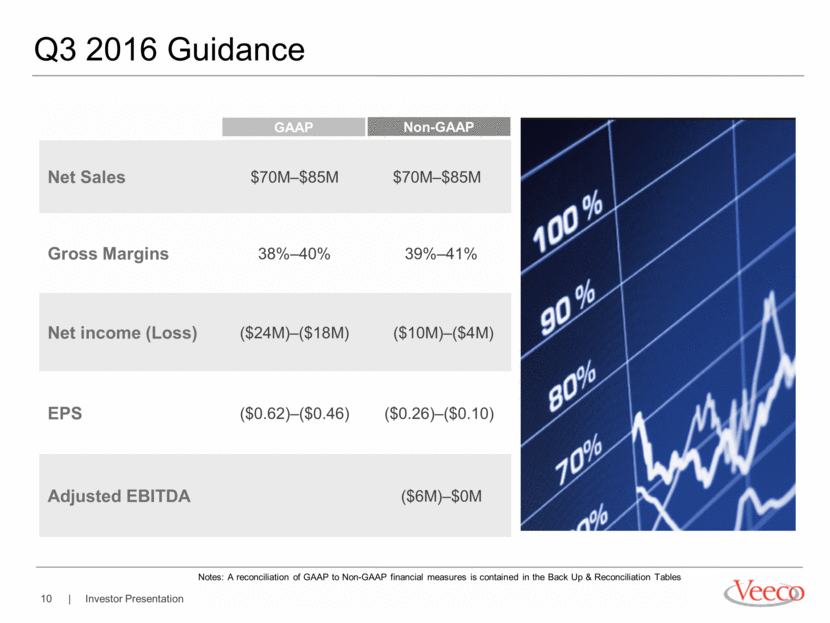
Q3 2016 Guidance Net Sales $70M–$85M $70M–$85M Gross Margins 38%–40% 39%–41% Net income (Loss) ($24M)–($18M) ($10M)–($4M) EPS ($0.62)–($0.46) ($0.26)–($0.10) Adjusted EBITDA ($6M)–$0M Non-GAAP GAAP Notes: A reconciliation of GAAP to Non-GAAP financial measures is contained in the Back Up & Reconciliation Tables
Business Update & Outlook

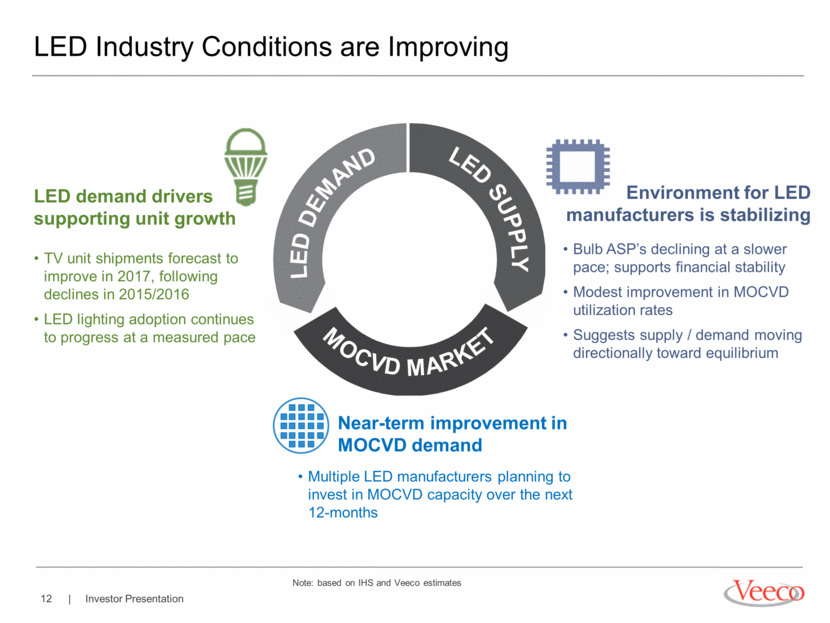
LED Industry Conditions are Improving Environment for LED manufacturers is stabilizing LED demand drivers supporting unit growth LED SUPPLY LED DEMAND MOCVD MARKET TV unit shipments forecast to improve in 2017, following declines in 2015/2016 LED lighting adoption continues to progress at a measured pace Bulb ASP’s declining at a slower pace; supports financial stability Modest improvement in MOCVD utilization rates Suggests supply / demand moving directionally toward equilibrium Note: based on IHS and Veeco estimates Multiple LED manufacturers planning to invest in MOCVD capacity over the next 12-months Near-term improvement in MOCVD demand
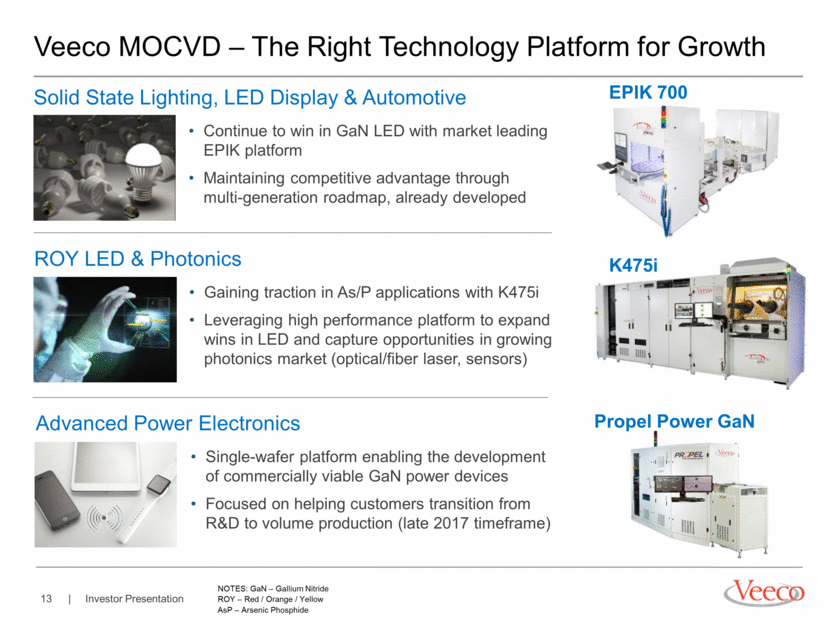
Veeco MOCVD – The Right Technology Platform for Growth Solid State Lighting, LED Display & Automotive Continue to win in GaN LED with market leading EPIK platform Maintaining competitive advantage through multi-generation roadmap, already developed ROY LED & Photonics Gaining traction in As/P applications with K475i Leveraging high performance platform to expand wins in LED and capture opportunities in growing photonics market (optical/fiber laser, sensors) Advanced Power Electronics Single-wafer platform enabling the development of commercially viable GaN power devices Focused on helping customers transition from R&D to volume production (late 2017 timeframe) EPIK 700 K475i Propel Power GaN NOTES: GaN – Gallium Nitride ROY – Red / Orange / Yellow AsP – Arsenic Phosphide
Veeco PSP – Versatility Generating Multiple Growth Levers Expand Served Markets Extend Global Reach Capture New Applications Market leader for single-wafer solvent clean with unique ImmJET™ technology Leveraging process advantages and existing infrastructure to expand into under-represented regions in Asia Established positions in core markets: MEMS, RF and Compound Semi (i.e. LED, power electronics, IR sensors) Demonstrating our unique technology + process advantage to expand in Advanced Packaging (2.5D and 3D) Single-wafer technology and process flexibility make PSP ideal for the most complex applications (result in precise process control) Device trends towards higher densities and tighter dimensions require precise process control (new opportunities) Compound Semi MEMS & RF Advanced Packaging MLO Strip Wafer thin Wet etch TSV reveal
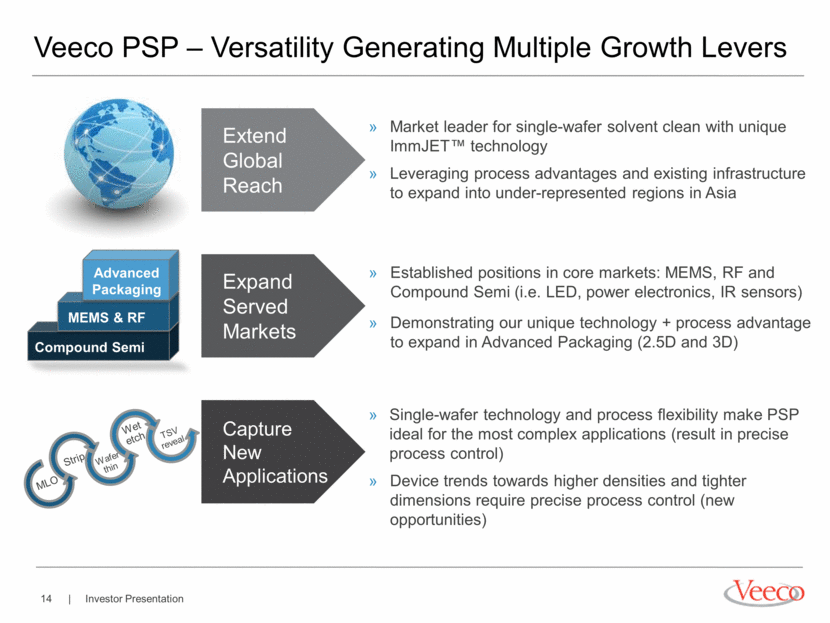
Expanding our footprint Investing in adjacent market opportunities to diversify revenues Advanced Power Electronics Advanced Packaging Focusing on our Strategic Objectives Maintaining operational focus Right sizing the business to improve profitability through the cycles Lowering fixed costs by ~$20M on an annualized basis by Q1 2017 Strengthening our core Building on our foundational business to capture opportunities in core markets Data Storage, Scientific & Industrial Lighting & Display MEMS & RF
Q&A
Back Up & Reconciliation Tables
Note On Reconciliation Tables These tables include financial measures adjusted for the impact of certain items; these financial measures are therefore not calculated in accordance with U.S. generally accepted accounting principles (“GAAP”). These Non-GAAP financial measures exclude items such as: share-based compensation expense; charges relating to restructuring initiatives; non-cash asset impairments; certain other non-operating gains and losses; and acquisition-related items such as transaction costs, non-cash amortization of acquired intangible assets, and incremental transaction-related compensation. These Non-GAAP financial measures may be different from Non-GAAP financial measures used by other companies. Non-GAAP financial measures should not be considered a substitute for, or superior to, measures of financial performance prepared in accordance with GAAP. By excluding these items, Non-GAAP financial measures are intended to facilitate meaningful comparisons to historical operating results, competitors' operating results, and estimates made by securities analysts. Management is evaluated on key performance metrics including adjusted EBITDA, which is used to determine management incentive compensation as well as to forecast future periods. These Non-GAAP financial measures may be useful to investors in allowing for greater transparency of supplemental information used by management in its financial and operational decision-making. In addition, similar Non-GAAP financial measures have historically been reported to investors; the inclusion of comparable numbers provides consistency in financial reporting. Investors are encouraged to review the reconciliation of the Non-GAAP financial measures used in this news release to their most directly comparable GAAP financial measures.
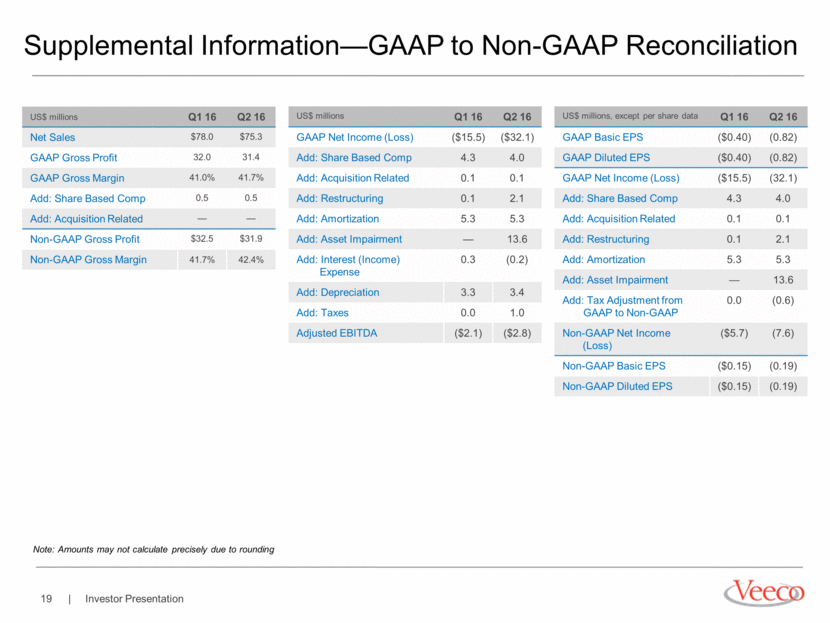
Supplemental Information—GAAP to Non-GAAP Reconciliation US$ millions Q1 16 Q2 16 Net Sales $78.0 $75.3 GAAP Gross Profit 32.0 31.4 GAAP Gross Margin 41.0% 41.7% Add: Share Based Comp 0.5 0.5 Add: Acquisition Related — — Non-GAAP Gross Profit $32.5 $31.9 Non-GAAP Gross Margin 41.7% 42.4% US$ millions Q1 16 Q2 16 GAAP Net Income (Loss) ($15.5) ($32.1) Add: Share Based Comp 4.3 4.0 Add: Acquisition Related 0.1 0.1 Add: Restructuring 0.1 2.1 Add: Amortization 5.3 5.3 Add: Asset Impairment — 13.6 Add: Interest (Income) Expense 0.3 (0.2) Add: Depreciation 3.3 3.4 Add: Taxes 0.0 1.0 Adjusted EBITDA ($2.1) ($2.8) US$ millions, except per share data Q1 16 Q2 16 GAAP Basic EPS ($0.40) (0.82) GAAP Diluted EPS ($0.40) (0.82) GAAP Net Income (Loss) ($15.5) (32.1) Add: Share Based Comp 4.3 4.0 Add: Acquisition Related 0.1 0.1 Add: Restructuring 0.1 2.1 Add: Amortization 5.3 5.3 Add: Asset Impairment — 13.6 Add: Tax Adjustment from GAAP to Non-GAAP 0.0 (0.6) Non-GAAP Net Income (Loss) ($5.7) (7.6) Non-GAAP Basic EPS ($0.15) (0.19) Non-GAAP Diluted EPS ($0.15) (0.19) Note: Amounts may not calculate precisely due to rounding
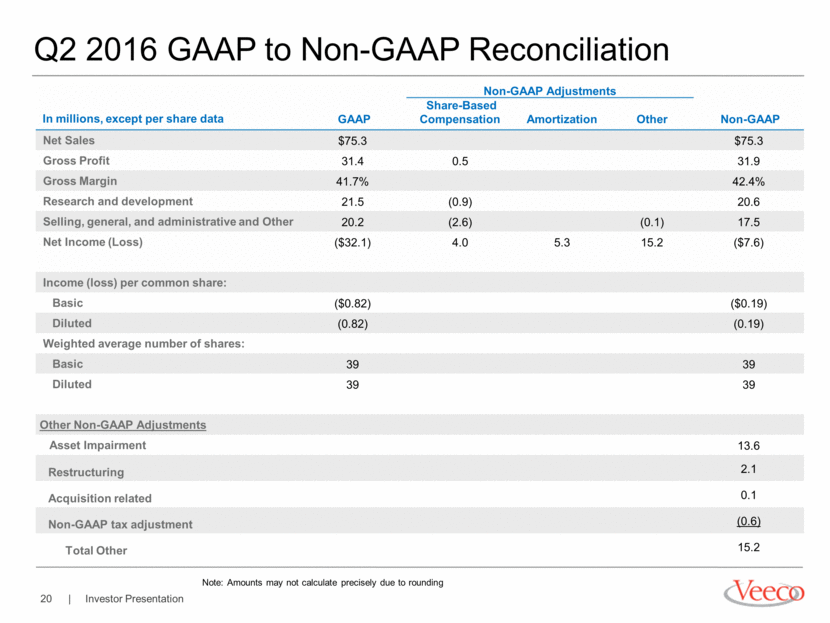
Q2 2016 GAAP to Non-GAAP Reconciliation Non-GAAP Adjustments In millions, except per share data GAAP Share-Based Compensation Amortization Other Non-GAAP Net Sales $75.3 $75.3 Gross Profit 31.4 0.5 31.9 Gross Margin 41.7% 42.4% Research and development 21.5 (0.9) 20.6 Selling, general, and administrative and Other 20.2 (2.6) (0.1) 17.5 Net Income (Loss) ($32.1) 4.0 5.3 15.2 ($7.6) Income (loss) per common share: Basic ($0.82) ($0.19) Diluted (0.82) (0.19) Weighted average number of shares: Basic 39 39 Diluted 39 39 Other Non-GAAP Adjustments Asset Impairment 13.6 Restructuring 2.1 Acquisition related 0.1 Non-GAAP tax adjustment (0.6) Total Other 15.2 Note: Amounts may not calculate precisely due to rounding
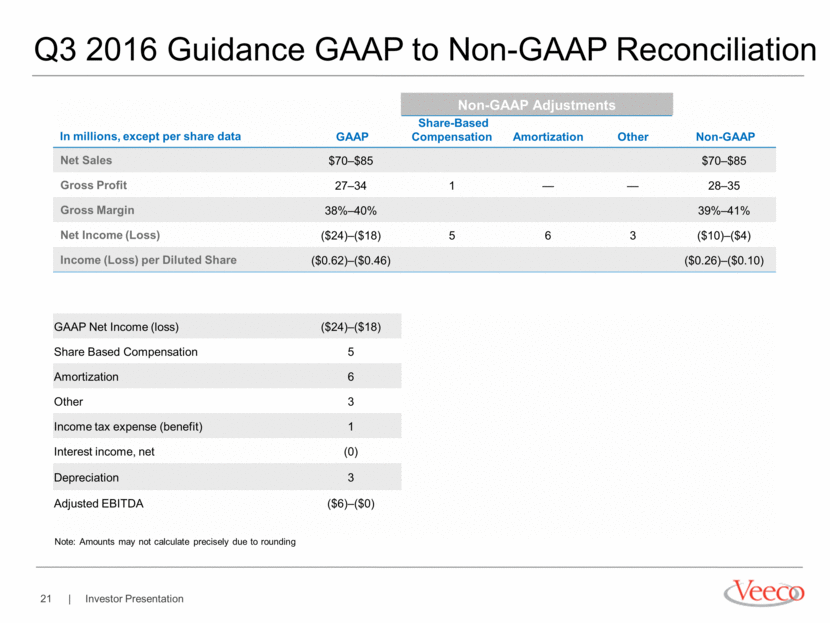
Q3 2016 Guidance GAAP to Non-GAAP Reconciliation Non-GAAP Adjustments In millions, except per share data GAAP Share-Based Compensation Amortization Other Non-GAAP Net Sales $70–$85 $70–$85 Gross Profit 27–34 1 — — 28–35 Gross Margin 38%–40% 39%–41% Net Income (Loss) ($24)–($18) 5 6 3 ($10)–($4) Income (Loss) per Diluted Share ($0.62)–($0.46) ($0.26)–($0.10) GAAP Net Income (loss) ($24)–($18) Share Based Compensation 5 Amortization 6 Other 3 Income tax expense (benefit) 1 Interest income, net (0) Depreciation 3 Adjusted EBITDA ($6)–($0) Note: Amounts may not calculate precisely due to rounding Non-GAAP Adjustments
