Attached files
| file | filename |
|---|---|
| EX-32.2 - CERTIFICATION - I-Minerals Inc | exhibit32-2.htm |
| EX-32.1 - CERTIFICATION - I-Minerals Inc | exhibit32-1.htm |
| EX-31.2 - CERTIFICATION - I-Minerals Inc | exhibit31-2.htm |
| EX-31.1 - CERTIFICATION - I-Minerals Inc | exhibit31-1.htm |
UNITED STATES
SECURITIES AND EXCHANGE COMMISSION
Washington, D.C. 20549
FORM 10-K
[ x ] ANNUAL REPORT PURSUANT TO SECTION 13 OR 15(d) OF THE SECURITIES EXCHANGE ACT OF 1934
For the fiscal year ended: April 30, 2016
[ ] TRANSITION REPORT PURSUANT TO SECTION 13 OR 15(d) OF THE SECURITIES EXCHANGE ACT OF 1934
For the transition period from _______ to _______
Commission file number: 000-55321
![]()
I-MINERALS INC.
(Exact name of registrant as specified in its charter)
| British Columbia, Canada | 20-4644299 |
| (State or other jurisdiction of incorporation or organization) | (I.R.S. Employer Identification No.) |
Suite 880, 580 Hornby Street, Vancouver, BC,
Canada V6C 3B6
(Address of principal executive offices)(Zip Code)
(877) 303-6573
Registrant’s telephone number, including area code
Not applicable
(Former name or former address if changed since last
report)
Securities registered under section 12(g) of the Exchange Act: Common shares with no par value.
Indicate
by check mark if the registrant is a well-known season issuer, as defined in
Rule 405 of the Securities Act.
Yes [ ] No [X]
Indicate
by check mark if the registrant is not required to file reports pursuant to
Section 13 or 15(d) of the Exchange Act.
Yes [ ] No [X]
Indicate
by check mark whether the registrant (1) has filed all reports required to be
filed by Section 13 or 15(d) of the Securities Exchange Act of 1934 during the
preceding 12 months (or for such shorter period that the registrant was
required to file such reports), and (2) has been subject to such filing
requirements for the past 90 days.
Yes [X] No [ ]
Indicate
by check mark whether the registrant has submitted electronically and posted on
its corporate Web site, if any, every Interactive Data File required to be
submitted and posted pursuant to Rule 405 of Regulation S-T (§232.405 of this
chapter) during the preceding 12 months (or for such shorter period that the
registrant was required to submit and post such files).
Yes [X] No [ ]
Indicate by check mark if disclosure of delinquent filers pursuant to Item 405 of Regulation S-K is not contained herein, and will not be contained, to the best of Registrant’s knowledge, in definitive proxy or information statements incorporated by reference in Part III of this Form 10-K or any amendment to this Form 10-K. [ ]
Indicate by check mark whether the registrant is a large accelerated filer, an accelerated filer, a non-accelerated filer, or a smaller reporting company.
| Large accelerated filer [ ] | Accelerated filer [ ] |
| Non-accelerated filer [ ] (Do not check if a smaller reporting company) | Smaller reporting company [X] |
Indicate
by check mark whether the registrant is a shell company (as defined in rule
12b-2 of the Exchange Act).
Yes [ ] No [X]
The aggregate market value of the voting stock held by non-affiliates of the registrant was approximately $11.5 million, based upon the closing sale price of the registrant’s common stock as reported by the TSX Venture Exchange on October 31, 2015 and converted to USD based on the Bank of Canada noon rate as of the same date.
As of July 27, 2016, the registrant had 87,308,952 outstanding shares of common stock.
I-Minerals Inc.
INDEX
3
CAUTIONARY NOTE REGARDING FORWARD-LOOKING STATEMENTS
Certain statements contained in this Annual Report constitute "forward-looking statements.” These statements, identified by words such as “plan,” "anticipate,” "believe,” "estimate,” "should,” "expect" and similar expressions include our expectations and objectives regarding our future financial position, operating results and business strategy. Forward-looking statements involve known and unknown risks, uncertainties, assumptions and other factors that may cause our actual results, performance or achievements to be materially different from any future results, performance or achievements expressed or implied by the forward-looking statements. Such factors include, among others, general business, economic, competitive, political and social uncertainties; the actual results of current exploration activities; changes in project parameters as plans continue to be refined; changes in labour costs or other costs of production; future mineral prices; equipment or processes to operate as anticipated; accidents, labour disputes and other risks of the mining industry, including but not limited to environmental hazards, cave-ins, pit-wall failures, flooding, rock bursts and other acts of God or unfavourable operating conditions and losses; delays in obtaining governmental approvals or financing or in the completion of development or construction activities, as well as those factors discussed in the section titled "Risk Factors" in this Annual Report.
Forward looking statements are based on a number of material factors and assumptions, including the results of exploration and drilling activities, the availability and final receipt of required approvals, licenses and permits, that sufficient working capital is available to complete proposed exploration and drilling activities, that contracted parties provide goods and/or services on the agreed time frames, the equipment necessary for exploration is available as scheduled and does not incur unforeseen break downs, that no labour shortages or delays are incurred and that no unusual geological or technical problems occur. While we consider these assumptions may be reasonable based on information currently available to it, they may prove to be incorrect. Actual results may vary from such forward-looking information for a variety of reasons, including but not limited to risks and uncertainties disclosed in the section titled “Risk Factors” in this Annual Report.
We intend to discuss in our Quarterly Reports and Annual Reports any events or circumstances that occurred during the period to which such documents relate that are reasonably likely to cause actual events or circumstances to differ materially from those disclosed in this Annual Report. New factors emerge from time to time, and it is not possible for management to predict all of such factors and to assess in advance the impact of each such factor on our business or the extent to which any factor, or combination of such factors, may cause actual results to differ materially from those contained in any forwarding looking statement.
CAUTIONARY NOTE TO U.S. INVESTORS REGARDING ESTIMATES OF MEASURED, INDICATED AND INFERRED RESOURCES AND PROVEN AND PROBABLE RESERVES
The terms “mineral reserve”, “proven mineral reserve” and “probable mineral reserve” as used in this Annual Report are Canadian mining terms as defined in accordance with Canadian National Instrument 43-101 – Standards of Disclosure for Mineral Projects (“NI 43-101”) and the Canadian Institute of Mining, Metallurgy and Petroleum (the “CIM”) – CIM Definition Standards on Mineral Resources and Mineral Reserves, adopted by the CIM Council, as amended (the “CIM Definition Standards”). These definitions differ from the definitions in the United States Securities and Exchange Commission (“SEC”) Industry Guide 7 (“SEC Industry Guide 7”) under the United States Securities Act of 1933, as amended (the “Securities Act”). Under SEC Industry Guide 7 standards, a “final” or “bankable” feasibility study is required to report reserves, the three-year historical average price is used in any reserve or cash flow analysis to designate reserves, and the primary environmental analysis or report must be filed with the appropriate governmental authority.
In addition, the terms “mineral resource”, “measured mineral resource”, “indicated mineral resource” and “inferred mineral resource” are defined in and required to be disclosed by NI 43-101; however, these terms are not defined terms under SEC Industry Guide 7 and are normally not permitted to be used in reports and registration statements filed with the SEC. Investors are cautioned not to assume that all or any part of a mineral deposit in these categories will ever be converted into reserves. “Inferred mineral resources” have a great amount of uncertainty as to their existence, and great uncertainty as to their economic and legal feasibility. It cannot be assumed that all, or any part, of an inferred mineral resource will ever be upgraded to a higher category. Under Canadian rules, estimates of inferred mineral resources may not form the basis of feasibility or pre-feasibility studies, except in rare cases. Investors are cautioned not to assume that all or any part of an inferred mineral resource exists or is economically or legally mineable. Disclosure of unit measures in a resource is permitted disclosure under Canadian regulations; however, the SEC only permits issuers to report mineralization that does not constitute “reserves” by SEC standards as in place tonnage and grade without reference to unit measures.
Accordingly, information contained in this Annual Report and any documents incorporated by reference herein contain descriptions of our mineral deposits that may not be comparable to similar information made public by U.S. companies subject to the reporting and disclosure requirements under the United States federal securities laws and the rules and regulations thereunder.
4
As used in this Annual Report, unless the context otherwise requires, “we,” “us,” “our,” the “Company” and “I-Minerals” refers to I-Minerals Inc. All dollar amounts in this registration statement are in U.S. dollars unless otherwise stated.
PART I
Item 1. Business.
General
We were incorporated under the laws of British Columbia, Canada in 1984. In 2004, we changed our corporate jurisdiction from a British Columbia company to a Canadian corporation. In December 2011, we amended our articles to change our name from “i-minerals inc.” to “I-Minerals Inc.”
The company engaged in the development of our Helmer-Bovill industrial minerals property (the “Helmer-Bovill Property”). The Helmer-Bovill Property, in which we hold a 100% interest, is comprised of 11 mineral leases totaling 5,140.64 acres located approximately 6 miles southwest of Bovill, Latah County, Idaho.
We acquired the Helmer-Bovill Property from Idaho Industrial Minerals (“IIM”) pursuant to an Assignment Agreement with Contingent Right of Reverter (the “IIM Agreement”) dated August 12, 2002, as amended August 10, 2005, August 10, 2008 and January 21, 2010, between I-Minerals USA (formerly Alchemy Kaolin Corporation), our wholly owned subsidiary, and IIM. Under the terms of the IIM Agreement, we issued a total of 1,800,000 common shares to IIM.
Our principal executive office is located at Suite 880, 580 Hornby Street, Vancouver, British Columbia, Canada and our telephone number is (877) 303-6573.
To date, we have not earned significant revenues from the operation of our mineral properties. Accordingly, we are dependent on debt and equity financing as its primary source of operating working capital. Our capital resources are largely determined by the strength of the junior resource markets and by the status of our projects in relation to these markets, and its ability to compete for investor support of its projects.
Our Principal Projects
Our activities at the Helmer-Bovill Property are focused on developing the Bovill Kaolin Project and the WBL Tailings Project.
The Bovill Kaolin Project
Our lead project, the Bovill Kaolin Project, is a strategically located long term resource of high purity quartz, potassium feldspar (“K-spar”), halloysite and kaolinite formed through weathering of a border phase of the Idaho Batholith causing all minerals to be contained within a fine white clay-sand mixture referred to as “primary clay.” The Bovill Kaolin Project is located within 3 miles of state highways with electricity and natural gas already at the property boundary.
Since 2010, our exploration work has focused diamond drilling on the Bovill Kaolin Project. To date, a total of 258 diamond drill holes have been drilled totaling 28,251 feet. As a result of these drill campaigns, four deposits have been identified: Kelly’s Hump, Kelly’s Hump South, Middle Ridge and WBL.
In June 2014, we completed an updated pre-feasibility study on the Bovill Kaolin Project (the “2014 PFS”) and on March 8, 2016, we announced the economic results of our full feasibility study (the “2016 FS”), which included the following highlights:
-
Updated
Measured and Indicated Resource Estimate
- Measured Resources of 5.7 million tons containing 76.5% quartz/K-spar sand, 12.3% Kaolinite and 4.0% Halloysite.
- Indicated Resources of 15.5 million tons containing 57.0% quartz/K-spar sand, 15.5% Kaolinite and 2.8% Halloysite.
- 667,000 tons of contained halloysite, 3,119,000 tons of contained kaolinite and 13,235,000 tons of contained quartz/K-spar.
- Updated Mineral Reserves. All figures are in thousands of tons.
5
| Reserve | Proven | Probable | Total P&P |
| Tons (1000s) | 4,155 | 4,548 | 8,702 |
| Halloysite % | 4.8 | 4.0 | 4.4 |
| Halloysite Tons (1000s) | 200 | 182 | 382 |
| Kaolinite % | 11.1 | 12.5 | 11.8 |
| Kaolinite Tons (1000s) | 460 | 568 | 1,028 |
| Sand % | 77.8 | 76.8 | 77.3 |
| Sand Tons (1000s) | 3,234 | 3,491 | 6,725 |
Note that values
presented here have been rounded to reflect the level of accuracy.
Proven and Probable
Mineral Reserves are presented using a $57.00 NSR cutoff grade.
-
Economic
Analysis
- US$386 million Pre-Tax NPV; US$250 million After Tax NPV using a 6% discount rate.
- 31.6% Pre-Tax IRR; 25.8% After Tax IRR.
- Initial Capital Cost of $108.3 million and Total Life of Mine capital costs $120.0 million.
- Life of Mine in excess of 25 years with a stripping ratio of 0.54:1 (waste:ore).
- 3 year estimated after tax payback.
The full National Instrument (“NI”) 43-101 report was filed on www.sedar.com on April 20, 2016 and is available on the Company’s website. Going forward our focus is to complete the detailed engineering and commence efforts to raise the capital necessary to build the mine.
See “Properties – Helmer-Bovill Property – 2016 Feasibility Study”.
The WBL Tailings Project
We also plan to continue limited seasonal mining operations at the WBL Tailings Project. The WBL Tailings Project is feldspathic sands deposited as tailings from clay mining operations during the period from 1961 to 1974. In September 2012, we received approval of our Mine Plan of Operations (“MPO”) from the Idaho Department of Lands. The MPO allows us to mine up to 50,000 tons per annum of feldspathic sands from June to October for a period of 10 years. From 2013 through 2015 approximately 5,000 tons of tailings was extracted and sold to a local cement company and a local contractor.
Three Year History
During the last three fiscal years, our operations have focused on completing an extensive diamond drill program on the Bovill Kaolin Project, acquiring a 100% interest in the Helmer-Bovill Property, completion of the 2016 FS and initial submittal of the mine permit application to the State of Idaho.
Drill Programs at Bovill Kaolin Project
We have completed two extensive diamond drill programs on the Helmer-Bovill Property for the Bovill Kaolin Project totaling over 25,000 feet, most recently in 2013 where 167 diamond drill holes totaling 17,811 feet were completed at the Middle Ridge, Kelly Hump and Kelly South deposits. These programs allowed us to better define our four key deposits at the Bovill Kaolin Project and complete both our 2014 PFS and 2016 FS. See “Properties – Helmer-Bovill Property”.
WBL Tailings Project
In September 2012, we received approval of our MPO from the Idaho Department of Lands. The MPO allows us to mine up to 50,000 tons per annum from feldspathic sands from June to October for a period of 10 years. Shortly thereafter, we completed our first production and inaugural sales feldspathic sand from the WBL Tailings Project.
In November 2013, we entered into an agreement with Pre-Mix, Inc. of Pullman Washington (“Pre-Mix”) pursuant to which we sold 3,000 tons of sand tailings to Pre-Mix.
6
On April 28, 2014, we entered into a new contract with Pre-Mix for the sale of up to 30,000 tons per annum of screened K-spar / quartz sand. Under the terms of the contract, Pre-Mix is solely responsible for the operating costs to process and remove the K-spar / quartz sand. The term of the contract is until December 31, 2018 and may be extended for a further two years through the mutual consent of the parties.
During 2014 and 2015 approximately 5,000 tons of sand tailings from our WBL Tailings Project were sold generating limited revenues to date due to associated road improvement costs. It is important to note that the State of Idaho permits that allow us to produce the feldspathic sands from the WBL Tailings Project are essentially the same permits as we have applied for to bring the much larger Bovill Kaolin Deposit into production.
Acquisition of Helmer-Bovill Property
In January 2013, we acquired a 100% interest in our Helmer-Bovill Property. In order to acquire the Helmer-Bovill Property, we issued a total of 1,800,000 common shares, of which 1,300,000 common shares were issued as the final payment to IIM.
On December 2, 2015, we settled all lawsuits relating to the Helmer-Bovill Property pursuant to the terms of Global Settlement and Absolute Release Agreement (the “Settlement Agreement”) dated October 29, 2015 among us, Idaho Industrial Minerals, LLC (“IIM”), Hoodoo Resources, LLC (“Hoodoo”), the principal of Hoodoo, Robert Lemke (“Lemke”), Brent Thomson (“Thomson”), The Thomson Family Trust (the “Thomson Trust”) (IIM, Hoodoo, Lemke, Thomson and the Thomson Trust collectively referred to as the “Plaintiffs”), the Estate of Philip Nisbet (the “Nisbet Estate”), Allen Ball (“Ball”), the Allen Ball and Connie Ball Family Trust (the “Ball Trust”), Ball Ventures, LLC (“BV”) and BVNR Natural Resources LLC (“BVNR”) (Ball, the Ball Trust, BV and BVNR collectively referred to as the “Ball Entities”) and Northwest Kaolin, Inc. (“NWK”). Under the terms of the Settlement Agreement, we paid IIM the aggregate sum of $100,000 (the “I-Minerals Payment”) for the release of any and all claims made against us under the lawsuits by the Ball Entities and the Plaintiffs. In addition, IIM and NWK have expressly acknowledged and agreed that, upon receipt of the I-Minerals Payment, we have fulfilled all of our duties and obligations under the terms of the IIM Agreement relating to our Helmer-Bovill Property, and that any and all rights and claims of IIM and NWK to the mineral leases making up the Helmer-Bovill Property will be released and extinguished. See “Legal Proceedings” below.
Industrial Minerals
In carrying out our activities at the Bovill Kaolin Project, we are focused on the development and, based upon the positive results of the 2016 FS, raising sufficient capital to build the mine and commence the extraction of the industrial minerals set forth below.
Kaolin
Kaolin is a raw material used in the ceramic industry, especially in fine porcelains. Large quantities of kaolin are used in paper coating, filler, paint, plastics, fiberglass, catalysts, and other specialty applications. It is also used as a key ingredient in natural pesticides that are suitable for organic farming applications.
When kaolin is heated to about 850°, it is transformed into a dehydrated phase called "metakaolin." Metakaolin is considered a premium material as it adds strength and durability to cement based products. When metakaolin is added to cement-based mortars, it causes an aggressive reaction with calcium hydroxide (lime), turning the lime into a cementitious material yielding cement with enhanced performance characteristics including increased strength; reduced permeability; greater durability; effective control of efflorescence; and control of degradation caused by Alkali-Silica Reaction. A bridge deck in a northern climate where it is subject to the wear and tear associated with plowing and salting is a prime metakaolin application. We are continuing long term testing process of several metakaolin products produced from the Bovill Kaolin deposits and have received ASTM C-618 certification for two of our products indicating the Bovill Metakaolin is an accredited pozzolan that meets all strength and water consumption requirements. ASTM C-618 certification is a prerequisite for sales into the cement industry. Additional testing is focused on optimizing the fineness of the grind or particle size to create the metakaolin product that provides the greatest strength while meeting the water requirement criteria.
Our target market for metakaolin is the North American concrete and infrastructure industry. Premium white metakaolin is currently priced at $500 per ton in the Pacific Northwest due to the transportation costs to bring it from the southeastern USA. We are targeting applications where color is not as important and pricing used in the 2016 FS is $231 per ton. The 2016 FS forecasts average annual production of about 40,000 tons of Bovill Metakaolin and the Company has non-binding letters of interest from various cement and construction companies for tonnage well in excess of this amount.
7
Halloysite
We plan to sell Halloysite on a worldwide basis. Halloysite is chemically identical to kaolin. When water is added to the kaolin chemistry its plate like structure takes on a tubular shape, identified as halloysite. Much of the value of halloysite is generated by its tubular shape which can only be seen through very powerful microscopes and are commonly referred to as halloysite nanotubes and abbreviated as HNTs.
Historically, the primary use of halloysite has been in the manufacture of porcelain, bone china, and fine china where the combination of low iron and titanium content together with the hollow tubular shape of the mineral grains yields ceramic bodies with exceptional whiteness and translucency. However, the HNTs microscopic tubular shape is rapidly finding uses outside of the ceramics industry. Applications in commercial production would include use as a suspension agent in glaze preparations as well as in filters and inkjets, and as an ingredient in special paints applied to ships to prevent barnacles from growing on the ships’ hull. HNTs are also being increasingly used in plastic and polymer applications where the addition of HNTs increases strength while reducing the weight of these compounds. Perhaps the most exciting uses for HNTs are in life science applications where the inside of the hollow tube can be filled with active ingredients and as the clay tube erodes the active ingredients are released. Used in this manner the HNTs are a delivery vector made of natural materials.
The largest supplier of commercial halloysite product available at present is located in Maturi Bay, New Zealand. There is limited production in Poland, Turkey and China, and a development stage project in Utah with negligible commercial production. The largest halloysite supplier in the ceramics industry sells halloysite at a price from $135 to $3,000 per ton. The majority of imported halloysite in the United States for the ceramics industry is sold at a price of approximately $700 per ton.
Our halloysite is differentiated from those known halloysite deposits due to the high aspect ratio (the ratio of the length of the tube to the diameter of the tube) and by minimal levels of trace elements such as lead. We are not targeting ceramic applications with our halloysite and instead focusing on the life science and plastic and polymer applications. Third party research has indicated we have arguably the best halloysite for life science applications as the New Zealand deposit contains about 10% Cristobalite – a silica oxide that has been categorized as a carcinogen and the other deposits capable of meaningful commercial production have poorer aspect ratios and higher heavy metal / trace element content.
The Company is planning on producing two halloysite products. The first branded HalloPure will be about 70% halloysite and 30% kaolinite and will target the plastic and polymer and certain filtration applications. The second is branded ULTRA Hallopure and will be in excess of 90% halloysite and less than 10% kaolinite. Both are considered high value products. In the 2016 FS, halloysite production varied from about 10,000 tons to 15,000 tons per year, split equally between the two halloysite products. HalloPure was priced at about $700 per ton and ULTRA Hallopure at about $1,400 per ton.
To date we have received interest in our HNTs from a number of companies in a wide range of industries including: personal care products, nano-composites, fire retardants, biocides, plastic fillers, animal feed, paint, and ceramics. Most of these companies have received samples of our products produced at recent pilot plants with some companies receiving up to 50 kg for bench scale product testing. We have also provided samples free of charge to several universities to help with the development of other new HNT applications. Currently the Company has non-binding expressions of interest approximately equal to forecast production.
Quartz
Quartz (SiO2 or silicon dioxide) is crystalline silica, the second most common mineral in the crust of the earth. It is known for its hardness and is well known for its use in glass. However, different types of glass require different SiO2 purity levels with some types of glass requiring the SiO2 content in quartz to have purity levels in the 97-99% range to be suitable. Although silicon dioxide is abundant, not all deposits are chemically identical, with the SiO2 purity and the levels of various trace element impurities varying across different deposits. Contamination of quartz can be from mineral and fluid inclusions and non-silica elements entering atomic sites usually occupied by silicon and oxygen. Our quartz operations at the Bovill Kaolin Project will focus on two levels of purity in excess of 99.8% SiO2 and is prepared to introduce a third product as market conditions warrant.
The Company has branded the quartz products TrueQ. The least pure product is True Q1 where the “1” indicates the material has been processed once through flotation. The high purity product is True Q3 where the “3” indicates the material has been floated three times to remove the maximum amount of impurities possible. Bench scale production at the recent pilot plant indicates the True Q1 will grade 99.86% SiO2 or higher and the True Q3 99.97% SiO2 or higher. The True Q1 will be offered in three different grinds or particle size: 50 mesh, 200 mesh and 325 mesh. “Mesh” references the number of openings in a 1 inch by 1 inch screen. As additional work and expense is required to further grind the basic 50 mesh product into finer grained products (200 or 325 mesh products), the finer grind products sell at higher prices than the basic 50 mesh product.
8
The 2016 FS foresees total quartz production (True Q1 and True Q3) of approximately 108,000 tons per year. The higher value True Q3 markets will be harder to enter due to more stringent testing and competition. Accordingly, the 2016 FS does not foresee reaching full True Q3 production capacity until the third year of production with a significant discount offered to gain business in the first year. Pricing for the True Q1 ranges from $100 to $350 per ton depending on the fineness of grind (particle size) together with the customer’s volume and delivery method. Once markets for the True Q3 have been established (2 year delay) the 2016 FS contemplates a price of approximately $600 per ton. Currently the Company has non-binding expressions of interest equal to two or three times production capacity from producers of sodium silicate, paint, solar glass, optical glass, art glass, glass bulbs, and liquid crystal display (“LCD”) glass in North American and Asia.
Potassium-Feldspar (“K-spar”)
K-spar is primarily used in ceramic bodies and glazes. We have run several pilot plants to produce K-spar. Grades have varied between 12.2% K2O and 13.1% K2O with low iron and high alumina. A high quality K-spar product has high K2O, high alumina and low iron. Iron tends to cause a darkening of the glaze when the ceramics are heated to high temperatures in a kiln. The quality of the K-spar produced in the pilot plant exceeds virtually all other commercially available K-spar products. The North American market is currently in short supply and the sole producer is offering a product of 9.5% - 10.0% K2O and about twice the iron (Fe) content of our K-spar. The shortage is driven by the largest producer in the United States shut down production at its Georgia operations in December 2014 when it ran out of reserves after 57 years of production. This company is attempting to service the North American market with a more expensive European K-spar product. The ceramics industry has extensively tested our K-spar product and it has been favorably written up in trade publications. Interest in the K-spar product that will be marketed under the brand name Fortispar is very strong.
Similar to quartz, we will offer our Fortispar in three grinds or particle sizes; a basic 30 mesh product as well as 200 and 325 mesh fine grind products. Fortispar will be sold primarily into K-spar North American ceramics and glass industries. We also plan to focus on producers of high clarity glass, ceramics, sanitary ware, tableware, and paint. Industrial and marine paint manufacturers also use an ultra-fine grind variety of feldspar. Pricing of our Fortispar product in the 2016 FS ranged from $217 per ton for the basic 30 mesh product up to $400 per ton for small quantiles of the fine ground product. We currently have non-binding expressions of interest in our K-spar product in excess of our production capacity.
Competition
With the completion of the 2016 FS, upon receipt of our mine permit, we will be a development stage company. We compete with other mineral resource exploration and development companies for financing. Many of the mineral resource exploration and development companies with whom we compete have greater financial and technical resources than we do. Accordingly, these competitors may be able to spend greater amounts on acquisitions of mineral properties of merit, on exploration of their mineral properties and on development of their mineral properties. In addition, they may be able to afford greater geological expertise in the targeting and exploration of mineral properties. This competition could result in competitors having mineral properties of greater quality and interest to prospective investors who may finance additional exploration and development. This competition could adversely impact our ability to finance further exploration and to achieve the financing necessary for us to develop our mineral properties.
Government Regulations
Mining operations and exploration activities are subject to various national, state, and local laws and regulations in the United States, which govern prospecting, development, mining, production, exports, taxes, labor standards, occupational health, waste disposal, protection of the environment, mine safety, hazardous substances and other matters. We will obtain the licenses, permits or other authorizations currently required to conduct our exploration program. We believe that we are in compliance in all material respects with applicable mining, health, safety and environmental statutes and the regulations passed thereunder in Idaho and the United States.
In Idaho, our exploration activities are regulated by the Idaho Department of Lands (“IDL”) pursuant to the Idaho Rules Governing Exploration Surface Mining and Closure of Cyanidation Facilities pursuant to the Idaho Administrative Procedure Act. In order to carry out surface exploration and drilling activities, a company is required to file a Notification of Exploration with the IDL. In 2000, we filed our original Notification of Exploration with the IDL, which has been subsequently amended, for our surface exploration and drilling programs on the Helmer-Bovill Property.
9
In order to carry out mining activities, we are required to obtain a Mine Plan for Operations and Reclamation Plan (“MPO”). In 2012, we completed a MPO for the extraction of sand tailings on the WBL Tailings Project. The MPO permits us to mine the sand tailings between May to October for a period of 10 years (2012 – 2022). In May of 2016 we applied for an MPO for mining activities on the Bovill Kaolin Project. The IDL has responded to our initial submission and we are in the final stages of responding to the IDL inquiries. Management believes that receipt of the MPO in the third calendar quarter of 2016 is a reasonable expectation.
All leases are subject to rental fees of US$1.00 per acre each year and a production royalty of 5.0% based on gross proceeds. The production royalty is prepaid at a rate of US$500 per lease for the first five years and increases to US$1,000 per lease for the second five years of the lease.
Mining operations are also regulated by Mine and Safety Health Administration (“MSHA”). MSHA inspectors will periodically visit projects to monitor health and safety for the workers, and to inspect equipment and installations for code requirements. Although we are not engaged in mining operations, we require all of our workers to have completed safety training courses when working on our project.
Other regulatory requirements monitor the following:
| (a) | Explosives and explosives handling. |
| (b) | Use and occupancy of site structures associated with mining. |
| (c) | Hazardous materials and waste disposal. |
| (d) | State Historic site preservation. |
| (e) | Archaeological and paleontological finds associated with mining. |
We believe that we are in compliance with all laws and plans to continue to comply with the laws in the future. We believe that compliance with the laws will not adversely affect its business operations. There is however no assurance that any change in government regulation in the future will not adversely affect our business operations.
Environmental Liability
We will have to sustain the cost of reclamation and environmental remediation for all exploration work undertaken. Both reclamation and environmental remediation refer to putting disturbed ground back as close to its original state as possible. Other potential pollution or damage must be cleaned up and renewed along standard guidelines outlined in the usual permits. Reclamation is the process of bringing the land back to its natural state after completion of exploration activities. Environmental remediation refers to the physical activity of taking steps to remediate, or remedy, any environmental damage caused. The amount of these costs is not known at this time as we do not know the extent of the exploration program that will be undertaken beyond completion of the recommended work program. Because there is presently no information on the size, tenor, or quality of any resource or reserve at this time, it is impossible to assess the impact of any capital expenditures on earnings, our competitive position or us in the event that a potentially economic deposit is discovered.
In the application for the MPO, costs are estimated for reclamation after 12 months of work, which would include construction, and for reclamation of the entire project and the IDL must agree to those costs. Once the MPO is granted, I-Minerals must submit a surety or cash bond for the first 12 months to begin activities. After the first 12 months, the bond is increased to the full costs estimated to clean up the entire project.
Permits and regulations will control all aspects of the production program if the project continues to that stage. Examples of regulatory requirements include:
| (i) | Water discharge will have to meet drinking water standards; |
| (ii) | Dust generation will have to be minimal or otherwise re-mediated; |
| (iii) | Dumping of material on the surface will have to be re-contoured and re-vegetated with natural vegetation; |
| (iv) | An assessment of all material to be left on the surface will need to be environmentally benign; |
| (v) | Ground water will have to be monitored for any potential contaminants; |
| (vi) | The socio-economic impact of the project will have to be evaluated and if deemed negative, will have to be re-mediated; and |
| (vii) | There will have to be an impact report of the work on the local fauna and flora including a study of potentially endangered species. |
A reclamation bond of US$7,600 has been posted to cover the current plan of operations. The Storm Water Pollution Prevention Plan (SWPPP) has been publicly noted without objection as of November 16, 2012. The Company does not view the current environmental liability to be material as of April 30, 2016 as the amount is estimated to be below $5,000.
10
Employees
As of the date of this registration statement, we have five full time employees, four in Idaho plus our Chief Executive Officer in Utah.
Research and Development
We have not incurred any research and development expenditures since our inception.
Patents and Trademarks
As of February 23, 2016, The United States Patent and Trademark Office issued the company Certificates of Registration for the following marks: FortisparÒ (K feldspar), TrueQÒ (quartz), HalloPureÒ (standard halloysite), and ULTRA HalloPureÒ (high purity halloysite).
Item 1A. Risk Factors.
An investment in our common shares involves a high degree of risk. You should carefully consider the risks described below and the other information in this registration statement before investing in our common shares. If any of the following risks occur, our business, operating results and financial condition could be seriously harmed. The trading price of our common shares could decline due to any of these risks, and you may lose all or part of your investment.
Risks Related To Our Business
We lack an operating history and have losses which we expect to continue into the future. As a result, we may have to suspend or cease exploration activities and if we do not obtain sufficient financing, our business will fail.
To date, we have been involved primarily in the acquisition, exploration and development of our mineral properties. We have no operating history upon which an evaluation of our future success or failure can be made. Our ability to achieve and maintain profitability and positive cash flow is dependent upon: (i) our ability to locate a profitable mineral property, and (ii) our ability to generate revenues.
For the next twelve months, management anticipates that the minimum cash requirements to fund our permitting activities, begin longer duration mine building activities and our general continued operations will be approximately $2,500,000. Accordingly, we do not have sufficient funds on hand to meet our planned expenditures over the next twelve months and will be required to raise additional financing.
Obtaining financing would be subject to a number of factors, including the market prices for industry minerals. These factors may make the timing, amount, terms or conditions of additional financing unavailable to us. Since our inception, we have relied on equity financings and loans to fund our operations. We have not attained profitable operations and are dependent upon obtaining financing to pursue our plan of operation.
Because we are an exploration stage company, our business has a high risk of failure.
We are an exploration stage company that has incurred net losses since inception, we have not attained profitable operations and we are dependent upon obtaining adequate financing to complete our exploration activities. The success of our business operations will depend upon our ability to obtain further financing to complete our planned exploration program and to attain profitable operations. If we are not able to complete a successful exploration program and attain sustainable profitable operations, then our business will fail.
Our financial statements include disclosures expressing substantial doubt about our ability to continue as a going concern; as a result we could have difficulty finding additional financing.
Our financial statements have been prepared assuming that we will continue as a going concern. We have not generated significant revenues from our main operations since inception and have accumulated losses. As a result, our financial statements include disclosures expressing substantial doubt about our ability to continue as a going concern. Our ability to continue our operations depends on our ability to complete equity or debt financings or generate profitable operations. Such financings may not be available or may not be available on reasonable terms. Our financial statements do not include any adjustments that could result from the outcome of this uncertainty.
11
We do not have sufficient financial resources to operate for the next twelve months.
Our financial statements have been prepared assuming that we will continue as a going concern. We have not generated significant revenues from our main operations since inception and have accumulated losses. Our ability to continue our operations depends on our ability to complete equity or debt financings or generate profitable operations. Such financings may not be available or may not be available on reasonable terms. Our financial statements do not include any adjustments that could result from the outcome of this uncertainty.
Because of the unique difficulties and uncertainties inherent in mineral exploration ventures, we face a high risk of business failure.
You should be aware of the difficulties normally encountered by mineral exploration companies and the high rate of failure of such enterprises. The likelihood of success must be considered in light of the problems, expenses, difficulties, complications and delays encountered in connection with the exploration of the mineral properties that we plan to undertake. These potential problems include, but are not limited to, unanticipated problems relating to exploration, and additional costs and expenses that may exceed current estimates.
Although we have known mineral reserves, there are uncertainties related to mineral reserve and mineralization estimates.
There are numerous uncertainties inherent in estimating proven and probable reserves and mineralization, including many factors beyond our control. The estimation of reserves and mineralization is a subjective process and the accuracy of any such estimates is a function of the quality of available data and of engineering and geological interpretation and judgment. Results of drilling, metallurgical testing and production and the evaluation of mine plans subsequent to the date of any estimate may justify revision of such estimates. No assurances can be given that the volume and grade of reserves recovered and rates of production will not be less than anticipated. Assumptions about prices are subject to greater uncertainty and industrial mineral prices have fluctuated widely in the past. Declines in the market price of industrial minerals also may render reserves or mineralization containing relatively lower grades of ore uneconomic to exploit. Changes in operating and capital costs and other factors including, but not limited to, short-term operating factors such as the need for sequential development of ore bodies and the processing of new or different ore grades, may materially and adversely affect reserves
Because of the inherent dangers involved in mineral exploration, there is a risk that we may incur liability or damages as we conduct our business.
The search for valuable minerals involves numerous hazards. As a result, we may become subject to liability for such hazards, including pollution, cave-ins and other hazards against which we cannot insure or against which we may elect not to insure. At the present time we have no coverage to insure against these hazards. The payment of such liabilities may result in our inability to complete our planned exploration program and/or obtain additional financing to fund our exploration program.
Because the prices of minerals fluctuate, if the price of minerals for which we are exploring decreases below a specified level, it may no longer be profitable to explore for those minerals and we will cease operations.
The profitability of mining operations is directly related to the market price of the industrial minerals being mined. The market price of industrial minerals may fluctuate widely and is affected by numerous factors beyond the control of any mining company. These factors include expectations with respect to the rate of inflation, the exchange rates of the dollar and other currencies, interest rates, global or regional political, economic or banking crises, and a number of other factors. If the market prices of the mineral commodities we plan to explore decline, this will have a negative effect on the availability of financing to us.
We may be required to defend title to the leases that comprise our Helmer-Bovill Property.
Title to mineral properties involves certain inherent risks due to the difficulties of determining the validity of certain claims, as well as the potential for problems arising from the frequently ambiguous conveyance history characteristic of many mineral properties. Although we have taken steps to verify title to mineral leases in which we have an interest, these procedures do not guarantee our title. Such properties may be subject to prior agreements or transfers and title may be affected by undetected defects.
12
There are environmental risks associated with mineral exploration.
Environmental risks are inherent with mining operations. The legal framework governing this area is constantly developing, therefore we are unable to fully ascertain any future liability that may arise from the implementation of any new laws or regulations, although such laws and regulations are typically strict and may impose severe penalties (financial or otherwise). Our proposed activities of, as with any exploration, may have an environmental impact which may result in unbudgeted delays, damage, loss and other costs and obligations including, without limitation, rehabilitation and/or compensation. There is also a risk that our operations and financial position may be adversely affected by the actions of environmental groups or any other group or person opposed in general to our activities and, in particular, the proposed exploration and mining by us within the State of Idaho.
We face significant competition in the mineral exploration industry.
We compete with other mining and exploration companies possessing greater financial resources and technical facilities than we do. Due to our weaker competitive position, we may have greater difficulty in hiring and retaining qualified personnel to conduct our planned exploration and development activities, which could cause delays in our exploration programs.
There may be barriers in entering the market as we will be a new supplier of industrial mineral products.
We will be a new supplier of industrial mineral products. Accordingly, we will be competing with more established industrial mineral companies that currently supply the ceramics and glass industries with industry mineral products. Accordingly, the ceramics, glass and other industries may be reluctant to terminate existing supply relationships and retain our company as a supplier of industrial mineral products to them. In the event that we are unable to be retained by these industries, our operations may be negatively impacted.
Demand for our metakaolin products will be dependent on funding for infrastructure projects.
Metakaolin is significantly more expensive than other kaolin products, such as, fly ash. In the United States, the funding for infrastructure projects is low. As a result, fly ash is commonly used for infrastructure products due to its low cost. Accordingly, our future customers may be unable or unwilling to purchase our metakaolin products unless funding infrastructure projects is increased.
If we are unable to hire and retain key personnel, we may not be able to implement our business plan and our business will fail
Our success will largely depend on our ability to hire highly qualified personnel with experience in geological exploration. These individuals may be in high demand and we may not be able to attract the staff we need. In addition, we may not be able to afford the high salaries and fees demanded by qualified personnel, or may lose such employees after they are hired. Currently, we have not hired any key personnel. Our failure to hire key personnel when needed could have a significant negative effect on our business.
Risks Related To The Ownership of Our Shares
There has been a very limited public trading market for our securities in the United States, and the market for our securities in the United States may continue to be limited and be sporadic and highly volatile. Trading in our shares on the TSX Venture Exchange has sometimes been sporadic.
There is currently a limited public market for our common shares. Our common shares trade in Canada on the TSX Venture Exchange and over the counter in the United States on the OTCQX market place. We cannot assure you that an active market for our shares will be established or maintained in the future. The OTCQX is not a national securities exchange, and many companies have experienced limited liquidity when traded through this quotation system. Trading in our shares on the TSX Venture Exchange has sometimes been sporadic. Holders of our common shares may, therefore, have difficulty selling their shares, should they decide to do so. In addition, there can be no assurances that such markets will continue or that any shares, which may be purchased, may be sold without incurring a loss. The market price of our shares, from time to time, may not necessarily bear any relationship to our book value, assets, past operating results, financial condition or any other established criteria of value, and may not be indicative of the market price for the shares in the future.
In addition, the market price of our common stock may be volatile, which could cause the value of our common shares to decline. Securities markets experience significant price and volume fluctuations. This market volatility, as well as general economic conditions, could cause the market price of our common shares to fluctuate substantially. Many factors that are beyond our control may significantly affect the market price of our shares. These factors include:
13
| (a) | price and volume fluctuations in stock markets; |
| (b) | changes in our operating results; |
| (c) | any increase in losses from levels expected by securities analysts; |
| (d) | changes in regulatory policies or law; |
| (e) | operating performance of companies comparable to us; and |
| (f) | general economic trends and other external factors. |
Even if an active market for our common shares is established, stockholders may have to sell their shares at prices substantially lower than the price they paid for the shares or might otherwise receive than if an active public market existed.
We will likely conduct further offerings of our equity securities in the future, in which case your proportionate interest may become diluted.
Since our inception, we have relied on such sales of our common shares to fund our operations. We will likely be required to conduct additional equity offerings in the future to finance our current projects or to finance subsequent projects that we decide to undertake. If common shares are issued in return for additional funds, the price per share could be lower than that paid by our current shareholders. We anticipate continuing to rely on equity sales of our common shares in order to fund our business operations. If we issue additional shares, your percentage interest in us could become diluted.
If we are, or were, a U.S. real property holding corporation, non-U.S. holders of our common stock or other security convertible into our common stock could be subject to U.S. federal income tax on the gain from the sale, exchange or other disposition of such security.
If we are or ever have been a U.S. real property holding corporation (a “USRPHC”) under the Foreign Investment Real Property Tax Act of 1980, as amended (“FIRPTA”) and applicable United States Treasury regulations (collectively, the “FIRPTA Rules”), unless an exception applies, certain non-U.S. investors in our common stock (or options or warrants for our common stock) would be subject to U.S. federal income tax on the gain from the sale, exchange or other disposition of shares of our common stock (or such options or warrants), and such non-U.S. investor would be required to file a United States federal income tax return. In addition, the purchaser of such common stock, option or warrant would be required to withhold from the purchase price an amount equal to 10% of the purchase price and remit such amount to the U.S. Internal Revenue Service.
We have not conducted a formal analysis of whether we are or have ever been a USRPHC. However, we believe that we may be a USRPHC. In general, under the FIRPTA Rules, a company is a USRPHC if its interests in U.S. real property comprise at least 50% of the fair market value of its assets. If we are or were a USRPHC, so long as our common stock is “regularly traded on an established securities market” (as defined under the FIRPTA Rules), a non-U.S. holder who, actually or constructively, holds or held no more than 5% of our common shares not subject to U.S. federal income tax on the gain from the sale, exchange or other disposition of our common shares under FIRPTA. In addition, other interests in equity of a USRPHC may qualify for this exception if, on the date such interest was acquired, such interests had a fair market value no greater than the fair market value on that date of 5% of our common shares. Any of our common shares (or owners of options or warrants for our common shares) that are non-U.S. persons should consult their tax advisors to determine the consequences of investing in our common shares (or options or warrants).
The recently enacted JOBS Act will allow us to postpone the date by which we must comply with certain laws and regulations and to reduce the amount of information provided in reports filed with the SEC. We cannot be certain if the reduced disclosure requirements applicable to “emerging growth companies” will make our common stock less attractive to investors.
We are and we will remain an "emerging growth company" until the earliest to occur of (i) the last day of the fiscal year during which our total annual revenues equal or exceed $1 billion (subject to adjustment for inflation), (ii) the last day of the fiscal year following the fifth anniversary of our initial public offering, (iii) the date on which we have, during the previous three-year period, issued more than $1 billion in non-convertible debt securities, or (iv) the date on which we are deemed a "large accelerated filer" (with at least $700 million in public float) under the Exchange Act. For so long as we remain an "emerging growth company" as defined in the JOBS Act, we may take advantage of certain exemptions from various reporting requirements that are applicable to other public companies that are not "emerging growth companies" as described in further detail in the risk factors below. We cannot predict if investors will find our common stock less attractive because we will rely on some or all of these exemptions. If some investors find our common stock less attractive as a result, there may be a less active trading market for our common stock and our stock price may be more volatile. If we avail ourselves of certain exemptions from various reporting requirements, as is currently our plan, our reduced disclosure may make it more difficult for investors and securities analysts to evaluate us and may result in less investor confidence.
14
As an “emerging growth company” we are permitted to adopt accounting standards within the same timeframes as private companies. This may make it more difficult to compare our financial statements to the financial statements of other public companies.
Pursuant to the JOBS Act, as an “emerging growth company”, we are permitted to adopt new or revised accounting standards issued by the Public Company Accounting Oversight Board (PCAOB) on the same date as private companies rather than other public companies. The JOBS Act permits us to “opt out” of these extended transition periods, however we have not elected to opt out of these rules. This may make it more difficult to compare of our financial statements with other public companies that are not “emerging growth companies”.
The JOBS Act allows us to postpone the date by which we must comply with certain laws and regulations intended to protect investors and to reduce the amount of information provided in reports filed with the SEC.
We meet the definition of an “emerging growth company” and so long as we continue to qualify as an “emerging growth company,” we will, among other things:
- be exempt from the provisions of Section 404(b) of the Sarbanes-Oxley Act requiring that its independent registered public accounting firm provide an attestation report on the effectiveness of its internal control over financial reporting;
- be exempt from the "say on pay” provisions (requiring a non-binding shareholder vote to approve compensation of certain executive officers) and the "say on golden parachute” provisions (requiring a non-binding shareholder vote to approve golden parachute arrangements for certain executive officers in connection with mergers and certain other business combinations) of The Dodd–Frank Wall Street Reform and Consumer Protection Act (Dodd-Frank Act) and certain disclosure requirements of the Dodd-Frank Act relating to compensation of Chief Executive Officers;
- be permitted to omit the detailed compensation discussion and analysis from proxy statements and reports filed under the Exchange Act, as amended and instead provide a reduced level of disclosure concerning executive compensation; and
- be exempt from any rules that may be adopted by the PCAOB requiring mandatory audit firm rotation or a supplement to the auditor’s report on the financial statements.
We currently intend to take advantage of all of the reduced regulatory and reporting requirements that will be available to it so long as it qualifies as an “emerging growth company”. We have elected not to opt out of the extension of time to comply with new or revised financial accounting standards available under Section 102(b)(1) of the JOBS Act. Among other things, this means that our independent registered public accounting firm will not be required to provide an attestation report on the effectiveness of our internal control over financial reporting so long as we qualify as an “emerging growth company”, which may increase the risk that weaknesses or deficiencies in the internal control over financial reporting go undetected. Likewise, so long as we qualify as an “emerging growth company”, we may elect not to provide certain information, including certain financial information and certain information regarding compensation of executive officers, which would otherwise have been required to provide in filings with the SEC, which may make it more difficult for investors and securities analysts to evaluate us. As a result, investor confidence in our company and the market price of our common stock may be adversely affected.
Notwithstanding the above, we are also currently a “smaller reporting company”, meaning that we are not an investment company, an asset-backed issuer, or a majority-owned subsidiary of a parent company that is not a smaller reporting company and have a public float of less than $75 million and annual revenues of less than $50 million during the most recently completed fiscal year. In the event that we are still considered a “smaller reporting company”, at such time we cease being an “emerging growth company”, the disclosure we will be required to provide in our SEC filings will increase, but will still be less than it would be if we were not considered either an “emerging growth company” or a “smaller reporting company”. Specifically, similar to “emerging growth companies”, “smaller reporting companies” are able to provide simplified executive compensation disclosures in their filings; are exempt from the provisions of Section 404(b) of the Sarbanes-Oxley Act requiring that independent registered public accounting firms provide an attestation report on the effectiveness of internal control over financial reporting; are not required to conduct say-on-pay and frequency votes until annual meetings occurring on or after January 21, 2013; and have certain other decreased disclosure obligations in their SEC filings, including, among other things, only being required to provide two years of audited financial statements in annual reports. Decreased disclosures in our SEC filings due to our status as an “emerging growth company” or “smaller reporting company” may make it harder for investors to analyze the Company’s results of operations and financial prospects.
15
Our securities are considered a penny stock.
Because our securities are considered a penny stock, shareholders will be more limited in their ability to sell their shares. The SEC has adopted rules that regulate broker-dealer practices in connection with transactions in penny stocks. Penny stocks are generally equity securities with a price of less than $5.00, other than securities registered on certain national securities exchanges or quoted on the NASDAQ system, provided that current price and volume information with respect to transactions in such securities is provided by the exchange or quotation system. Because our securities constitute “penny stocks” within the meaning of the rules, the rules apply to us and to our securities. The rules may further affect the ability of owners of shares to sell our securities in any market that might develop for them. As long as the trading price of our common shares is less than $5.00 per share, the common shares will be subject to Rule 15g-9 under the Exchange Act. The penny stock rules require a broker-dealer, prior to a transaction in a penny stock, to deliver a standardized risk disclosure document prepared by the SEC, that:
| 1. | contains a description of the nature and level of risk in the market for penny stocks in both public offerings and secondary trading; |
| 2. | contains a description of the broker’s or dealer’s duties to the customer and of the rights and remedies available to the customer with respect to a violation to such duties or other requirements of securities laws; |
| 3. | contains a brief, clear, narrative description of a dealer market, including bid and ask prices for penny stocks and the significance of the spread between the bid and ask price; |
| 4. | contains a toll-free telephone number for inquiries on disciplinary actions; |
| 5. | defines significant terms in the disclosure document or in the conduct of trading in penny stocks; and |
| 6. | contains such other information and is in such form, including language, type, size and format, as the SEC shall require by rule or regulation. |
The broker-dealer also must provide, prior to effecting any transaction in a penny stock, the customer with: (a) bid and offer quotations for the penny stock; (b) the compensation of the broker-dealer and its salesperson in the transaction; (c) the number of shares to which such bid and ask prices apply, or other comparable information relating to the depth and liquidity of the market for such shares; and (d) a monthly account statements showing the market value of each penny stock held in the customer’s account. In addition, the penny stock rules require that prior to a transaction in a penny stock not otherwise exempt from those rules; the broker-dealer must make a special written determination that the penny stock is a suitable investment for the purchaser and receive the purchaser’s written acknowledgment of the receipt of a risk disclosure statement, a written agreement to transactions involving penny stocks, and a signed and dated copy of a written suitably statement. These disclosure requirements may have the effect of reducing the trading activity in the secondary market for our shares.
Item 1B. Unresolved Staff Comments.
None
Item 2. Properties.
We currently do not own any real property. We currently sub lease on a month to month basis an office space located at Suite 880, 580 Hornby Street, Vancouver, BC Canada V6C 3B6, consisting of approximately 256 square feet at a cost of $1,500 per month.
HELMER-BOVILL PROPERTY
We own a 100% interest in our lead mineral project called the Helmer-Bovill Property. Our activities at the Helmer-Bovill Property are focused on developing the Bovill Kaolin Project and the WBL Tailings Project, which are located within the Helmer-Bovill Property.
16
We acquired the Helmer-Bovill Property from Idaho Industrial Minerals (“IIM”) pursuant to an Assignment Agreement with Contingent Right of Reverter dated August 12, 2002, as amended August 10, 2005, August 10, 2008 and January 21, 2010 (as amended, the “IIM Agreement”), between I-Minerals USA (formerly Alchemy Kaolin Corporation), our wholly owned subsidiary, and IIM. Under the terms of the IIM Agreement, IIM retained a contingent right of reverter with respect to the mineral lease applications (or the mineral leases acquired thereby) underlying the Helmer-Bovill Property if we failed meet our obligation to issue to IIM a total of 1,800,000 shares of our common stock, in tranches, based upon the completion of certain deliverables, and subject to such conditions as imposed by the TSX Venture Exchange. On January 22, 2013, we delivered the final tranche of the shares issuable to IIM. As such, we believe that the contingent right of reverter set out in the IIM Agreement has been extinguished, and that we have fulfilled all of our obligations under the IIM Agreement.
However, shortly after our delivery of the final tranche of shares to IIM, two minority members of IIM attempted to derivatively (and on behalf of IIM) reject our tender of shares. These minority members of IIM claimed that the deliverables were not completed and the right of reverter could be exercised. The majority member of IIM brought suit against the two minority members claiming that no such derivative right exists, that the minority members had no right or authority to reject the shares on behalf of IIM, and that we had fully complied with the terms of the IIM. We have since been brought into that lawsuit. Court-ordered mediation was held on May 28, 2015, in the lawsuit filed against the Company by Hoodoo Resources, LLC, and the Brent Thomson Family Trust (collectively, "the Plaintiffs"). The mediation sought to resolve the Plaintiffs’ claims against the Company, as well as the Company’s claims against the Plaintiffs.
Mediation was successful and the Plaintiffs and the Company entered into an agreement in principle to settle the parties’ claims against one another that was documented in a Binding Settlement Term Sheet. Thereafter, on December 2, 2015, we settled all lawsuits relating to the Helmer-Bovill Property pursuant to the terms of the Settlement Agreement. Under the terms of the Settlement Agreement, we paid IIM the aggregate sum of $100,000 (the “I-Minerals Payment”) for the release of any and all claims made against us under the lawsuits by the Ball Entities and the Plaintiffs. In addition, IIM and NWK have expressly acknowledged and agreed that, upon receipt of the I-Minerals Payment, we have fulfilled all of our duties and obligations under the terms of the IIM Agreement relating to our Helmer-Bovill Property, and that any and all rights and claims of IIM and NWK to the mineral leases making up the Helmer-Bovill Property will be released and extinguished. Refer to “Legal Proceedings” below for further information.
The technical information appearing below concerning the Helmer-Bovill Property is derived from the technical report titled Bovill Kaolin Project, Latah County, Idaho, USA, NI 43-101 Technical Report - Feasibility Study, Prepared For I-Minerals USA, Inc. with contributing consultants GBM Engineers LLC, Mine Development Associates. HDR Engineering Inc., SRK Consulting (U.S.), Inc., Tetra Tech, Compiled By GBM Project Number: 0530.
Description of Property
The Helmer-Bovill Property is a development stage open pit mining operation which will produce quartz sand, K- feldspar sand, kaolinite clay and halloysite clay. The area has been mined historically for similar products.
The Helmer-Bovill Property is located at geographical coordinates 46° 52' 43.5" N. latitude and 116° 25' 47.2" W longitude (State Plane, NAD 83, Zone 1103, Idaho West: 1 900 717 N, 2 454 671 E) in Latah County, Idaho, USA. The property currently totals 5,140.6 acres. The mineral leases are not adjoining, but are situated within three surveyed townships near the town of Bovill, Idaho.
17
Figure 1. Location of the Helmer-Bovill Property
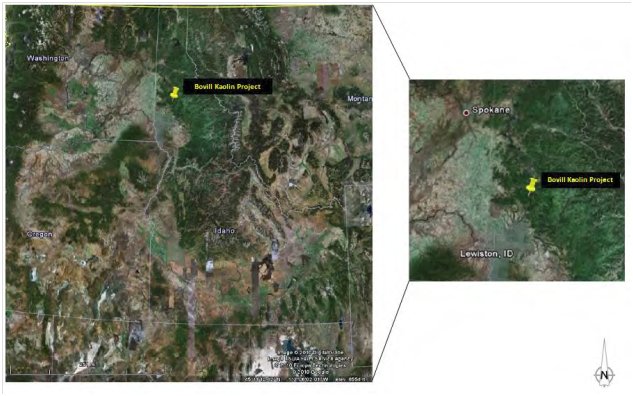
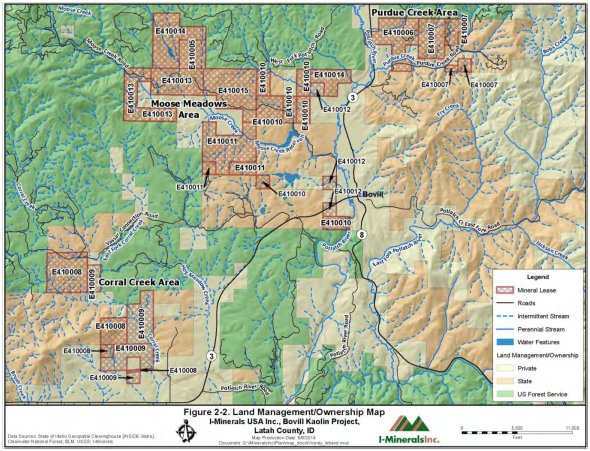
Figure 2. Location of Mineral Leases
18
Figure 3. Location of Deposits

The Helmer-Bovill Property area is located on endowment lands owned and administered by the IDL. These and other IDL holdings across the state of Idaho were granted to the state in 1890 by the federal government on the condition they produce maximum long-term financial returns for public schools and other beneficiaries. Therefore, IDL has a mandate for these lands to produce revenue to support the state’s public school system and other state institutions. To achieve this, IDL manages these properties primarily for profit through the production of timber, livestock grazing, and the extraction of mineable materials.
The State of Idaho endowments lands fall in two categories referred to as Fee Simple (FS) and Minerals Only (MO). The FS lands are where the State owns both mineral and surface rights. The MO lands are where the State owns mineral rights but someone else owns surface rights. The majority of the lands held by us are FS. All mineral resources and mineral reserves described in this report are located on FS lands. By way of our mineral leases, we have surface rights and legal access to the Helmer-Bovill Property provided it meets all permitting and bonding requirements administered by IDL. In the State of Idaho, mineral leases are not required to be physically located in the field. The mineral leases are currently described only on paper by the U.S. Public Land Survey Grid.
In 2002, we acquired from IIM, through our wholly owned subsidiary Alchemy Kaolin Corporation, 16 State of Idaho mineral lease applications in Latah County, Idaho, to cover deposits of feldspar, kaolin, and quartz located near Bovill, Idaho. In 2003, we converted these applications to ten mineral leases and subsequently obtained two more mineral leases. Renewal applications for all 12 leases were filed on April 27, 2012 with a US$3,000 application fee. As part of the renewal process, Idaho converted the 12 mineral leases into 10 revised mineral leases which were issued on February 28, 2013. Subsequently, during 2013 the State of Idaho granted one additional mineral lease to us. At this time, we hold 11 mineral leases totaling 5,140.64 acres. All current leases are valid until 2023. Due to recent changes in the law, we are exploring various options for renewal. All leases are subject to rental fees of US$1.00/acre/y and a production royalty of 5 percent of gross proceeds.
The production royalty is prepaid at a rate of US$500 per lease for the first five years, and increases to US$1,000 per lease for the second five years of the lease. The surface rights of the 11 mineral leases are owned by both the State of Idaho and some private landowners. However, the surface right of the mineral leases specific to the resource estimation contained in this report are all owned and administered by the State of Idaho. The U.S. Army Corps of Engineers (“USACE”) owns the surface rights of all waterways located within the mineral lease boundaries.
19
The details of the mineral leases that comprise the Helmer-Bovill Property are summarized below:
Table 4-1: Mineral Leases
|
Mineral Lease No. |
Township | Range | Section | Legal Description |
Endow- ment |
Status | Acres |
| E410005 | 41 North | 1 West | 16 | Govt Lots 1-2, N2SE | PS | FS | 172 |
| E410006 | 41 North | 1 East | 18 | Pt Gov Lot 2, NE, E2NW, W2SE, W2SESE | PS | FS | 377.75 |
| E410007 | 41 North | 1 East | 17 | W2NE, W2NENE, SESE | PS | FS | 140 |
| E410007 | 41 North | 1 East | NW, N2SW, S2SWSE | CI | FS | 260 | |
| E410008 | 40 North | 1 West | 6 | Govt Lots 9-11, SENW, E2SW, SWNE, W2SE | CI | FS | 370.8 |
| E410008 | 40 North | 1 West | 8 | SW | CI | FS | 160 |
| E410008 | 40 North | 1 West | 17 | NWNW and right of way in S2NE and N2SE | CI | FS | 53.17 |
| E410009 | 40 North | 1 West | 6 | E2SE | CI | MO | 80 |
| E410009 | 40 North | 1 West | 8 | S2NE, NENE, SE | CI | MO | 280 |
| E410009 | 40 North | 1 West | 17 | S2NW, NENW, N2NE, SENE, NWSE less right of way | CI | MO | 269.5 |
| E410010 | 41 North | 1 West | 23 | Govt Lots 5-8, E2SW | PS | FS | 242.44 |
| E410010 | 41 North | 1 West | 23 | Govt Lots 1-4, W2SE | NS | FS | 242.52 |
| E410010 | 41 North | 1 West | 35 | NWNW | PS | FS | 40 |
| E410010 | 41 North | 1 West | 36 | SESW, SWSE | PS | FS | 80 |
| E410011 | 41 North | 1 West | 27 | Govt Lots 1, 2, and 4 | PS | FS | 117.19 |
| E410011 | 41 North | 1 West | 27 | Gov Lot 3, W2NW, SENW, S2NE, N2S2, NENE | NS | FS | 438.73 |
| E410012 | 41 North | 1 West | 24 | Govt Lot 3 | PE | MO | 41.41 |
| E410012 | 41 North | 1 West | 36 | NENW, NESW | PS | MO | 80 |
| E410013 | 41 North | 1 West | 20 | W2NE, NENE, W2SE, SESE | NS | FS | 240 |
| E410013 | 41 North | 1 West | 21 | N2, S2SW | NS | FS | 400 |
| E410014 | 41 North | 1 West | 16 | Gov Lots 3 and 4, NW, N2SW, S2NE | PS | FS | 413.78 |
| E410014 | 41 North | 1 West | 24 | Gov Lot 2, E2NW, NWNE | PE | FS | 161.35 |
| E410015 | 41 North | 1 West | 22 | N2SE, SESE, N2, NESW | NS | FS | 480 |
| Total | 5140.64 | ||||||
The WBL Tailings Project is located on mineral lease E410013 and covers an area of approximately 650 feet wide by 900 feet long.
Location, Access and Infrastructure
The Helmer-Bovill Property is accessed by road from the town of Lewiston by following U.S Highway #12 to State Highway ID-3 N to Deary and then State Highway ID-8 E for 4 mi, then turning left on Moose Creek Road/National Forest Road 381 and following for 5.5 miles. ID-3 S/ID-8 W is an improved two lane road, while Moose Creek Road/National Forest Development Road 381 is a dirt/gravel road that provides access to State and Federal lands. In addition, access to specific areas to be mined will require either upgrades to former logging roads or construction of new access roads.
The nearest, large communities are Moscow, Idaho, which lies about 28 miles west-southwest of the Property, and Lewiston, Idaho, which lies about 33 miles to the southwest. Transport to the Helmer-Bovill Property would utilize standard over-highway vehicles.
Electric power would be provided by Avista Corp., but we would be required to construct approximately four miles of power lines.
Natural gas is available to the Helmer-Bovill Property from a natural gas pipeline that extends from Moscow to Bovill and is available to be utilized for this processing facility. Approximately two miles of pipeline would need to be constructed.
Water needed for processing would come from new wells located at the process site. Groundwater from drilled wells is typically used to serve domestic needs within the vicinity of the Property. Additional water is also available in a small reservoir north of the Helmer-Bovill Property. We intend to apply for water rights to this reservoir in the near future.
The region has a long history of clay production, forestry and farming. A labor force skilled in heavy equipment operation, trucking, and general labor exists within the surrounding communities and rural areas.
There are several suitable locations for potential tailings storage, mining waste disposal, and potential processing plants.
The WBL Tailings Project is mined using a loader and/or excavator or backhoe. If required, on-site power will be supplied by a diesel or gasoline power generator. Fuel supply will generally be provided by pickup truck fuel transfer tanks (typically 90 to 150 gallons). If fuel is temporarily stored on site, secondary containment will be used (either double-walled tanks or a secondary containment wall), and if fuel storage volume exceeds 1320 gallons, a Spill Prevention, Control Countermeasure plan will be developed in accordance with federal regulations. Water will be used only as dust control and will be taken from the WLB pits. Bottled water will be provided, as necessary for drinking water for employees and contractors.
20
Royalties, Agreements and Encumbrances
We have rights to develop the Project through minerals leases issued by the State of Idaho (Leases). These Leases were acquired from IIM and are held by I-Minerals, based on an Assignment Agreement with Contingent Right of Reverter (the Agreement), dated August 12, 2002, between I-Minerals USA (formerly Alchemy Kaolin Corporation) and IIM. The Agreement has been subject to several amendments and ratifications between the parties, dated effective August 10, 2005, August 10, 2008, and January 21, 2010. Under the terms of the Agreement, I-Minerals acquired a 100 percent interest in the property by issuing a total of 1.75 million shares of our common stock to IIM. These shares were issued on a staged basis with the final block of shares was delivered on January 23, 2013.
The State of Idaho retains a 5 percent gross production royalty due upon commencement of any mineral production.
Environmental Liabilities
The Leases we hold cover areas of historic open pit mining. These areas include open pit mines, waste dumps and tailings areas. At this time, there are no known environmental liabilities associated with the exploration work we have conducted, and all activities to date are covered under general State and Federal authorizations for exploratory work. We submitted an original bond of US$750 to the IDL to cover environmental liabilities associated with its exploration work. This bond remained in place throughout the work, but it was refunded in December 2012. On November 1, 2010, the State of Idaho revised its bonding program, and since that time, we have been paying a reclamation bond of US$100 per lease per year. IDL also requires bonding for each individual Land Use Permit for exploration work requested. At present, IDL is holding a cash bond of $6,203. All reclamation bonding is current through October 31, 2016, and the IDL has approved all reclamation conducted to date.
Permits
We are currently permitted for the following activities at the Bovill Project site (IDL mineral leased lands).
Exploration Activities
We conducted exploration activities in accordance with Idaho Administrative Procedure Act (IDAPA) 20.03.02.060 – Exploration Operations and Required Reclamation. We originally filed a Notification of Exploration (NOE) with the IDL in 2000, which was later amended for surface exploration and drilling programs. Exploration disturbances have been reclaimed, and approved by the IDL.
Mining Activities
We are permitted through an approved Mine Plan of Operations and Reclamation Plan from IDL for the mining of approximately 10 acres of feldspathic sands from June through October for up to 10 years (2012 through 2022). These feldspathic sands were deposited as tailings from clay mining operations that occurred on or near our mineral leases between 1956 and 1974. These activities are conducted under a National Pollutant Discharge Elimination System’s (NPDES) 2008 Multi-Sector General Permit (MSGP) for Stormwater Discharges Associated with Industrial Activities (Permit Number IDR05CU73). The stormwater permit became effective on November 8, 2012, and has been extended until June 4, 2020.
Permits to be Acquired for the Project
A review of Project plans identified a range of environmental permits, review processes, and authorizations required for construction, operation, and closure. Development of the Project will require approval of a Plan of Operations and Reclamation Plan by IDL (IDAPA 20.03.02), and an updated NOI for coverage under the NPDES MSGP for industrial activities (Sector J3: Mineral Mining and Dressing/Clay, Ceramic, and Refractory Materials). In addition, a State air quality permit will be required for emission sources, including dryer stacks and fugitive dust. Closure of the mine requires IDL approval of a detailed Mine Site Reclamation and Tailings Closure Plan. Also, monitoring of certain resources will likely be mandated through the State mine permitting process as well as through the Federal NDPES stormwater general permit.
21
A goal of the Project design is to avoid disturbances in jurisdictional wetlands or other waters, so that a Clean Water Act Section 404 permit will not be required, or at most, be limited to Section 404(e) Nationwide Permit 14 (nationwide permit) for minor fill. No federal lands or federal permits (except for the stormwater general permits) are anticipated in the Project plans, and as such, a National Environmental Policy Act (NEPA) environmental review of the proposed Project is not anticipated (other than resource information required as part of the stormwater general permits).
Climate and Physiography
The climate at the Helmer-Bovill Property is characterized by an estimated average annual precipitation of 38.82 inches, with the highest values recorded between October and March (71% of the annual precipitation). The average annual minimum and maximum temperatures are 30.1°F and 55.7°F, respectively; with average monthly minimum and maximum temperatures ranging from 18.5°F to 41.7°F and 41.1°F to 83.3°F, respectively.
The average total snowfall ranges from 0.1 inches in October to 37.3 inches in January, with an annual average of 100.9 inches. Average snow depth ranges from 1.0 inches in November to 23.0 inches in February, with an annual average snow depth of 6.0 inches.
The average elevation is about 3,000 ft. above mean sea level, with a topographic relief of about 200 ft. The area is largely covered with soil, but old workings (pits and trenches) and road cuts provide exposure to the underlying bedrock geology. The Helmer-Bovill Property is located on the west side of the Potlatch River drainage area.
The Helmer-Bovill Property area consists of low foothills and ridges alternating with relatively wide, flat basins. Forested areas occupy the slopes and ridge tops which are managed primarily for timber production. Conifer forest makes up approximately 50% of the overall Helmer-Bovill Property area. Forest stands were observed to be early seral, highly fragmented, and lacking in the ecological functions and values of older, more contiguous forests. Grasslands occur in the basins alongside sinuous intermittent and perennial stream channels. The Helmer-Bovill Property area is currently permitted for livestock grazing. Most of the Helmer-Bovill Property area has been disturbed by previous mining, forestry and grazing activities and, as such, contain predominantly disturbance oriented plant communities. Non-forested meadows or pasture areas are intensively grazed resulting in a proliferation of non-native vegetation and soil compaction and erosion.
Surface waters primarily consist of small, meandering, intermittent stream channels that flow toward the Potlatch River. These channels are typically located in the level “flats” between low hills or ridgelines and dry up by mid or late summer. Most streams are hydrologically altered by high- density road construction, historic mining, and cattle grazing. Grazing has also eliminated much of the woody growth along most stream channels resulting in eroded channels and sedimentation. Other surface waters include several old clay mining pits and small dams that have developed into water catchment basins as well as emergent wetlands flanking the stream channels. Groundwater appears in scattered locations as either springs or seepage discharge along streams or edges of wetlands. Native soils predominate in the area.
History
U.S. Bureau of Mines (“USBM”) and United States Geological Survey (“USGS”) (1942-1947)
During World War II, the clays in eastern Washington and northern Idaho were examined as a possible source of alumina and a substitute for foreign bauxite ores. Domestic bauxite reserves were being depleted, and the importation of foreign bauxites was handicapped by transportation difficulties. Both the USGS and USBM conducted extensive field studies that were followed by the drilling of 650 holes that totaled about 20,252 ft.
USBM (1953-1963)
In 1953 the USBM continued their search for viable clay deposits. They also investigated the potential of the contained silica sand for the glass industry. The USBM tested the Benson and Olsen clay deposits between Troy and Deary, and then moved on to the Bovill deposits. Ninety-seven samples were collected from 1,325 ft. of drilling over an area covering 750 ft. x 350 ft. that is located 1.5 miles southwest of Bovill near State Highway 8.
A.P. Green Refractories Company (1956-1993)
In 1956, A.P. Green Refractories Company purchased all the remaining assets of Troy Brick and Clay and acquired a lease, being located north of Helmer, from which they produced refractory clay. They processed the clay by air flotation to produce two grades of refractory clay. Production continued until the early 1990’s when Hammond Engineering purchased one pit from A.P. Green. This pit produced transported clay for ceramic applications. Total production from the area during this period is estimated to be 250,000 tons.
22
J.R. Simplot Company (1956-1974)
In 1956, the J.R. Simplot Company (“Simplot”) of Boise, Idaho, acquired leases covering the Bovill deposits. In a cooperative program, Simplot and USBM drilled 240 holes (99 of which were on 50 ft. centers) and conducted washing, pyrometric, mineralogical, and beneficiation tests. By 1962, Simplot had built a clay plant, the Miclasil facility, for the production of paper fillers and specialty ceramics. Production initially came from pits in the Bovill deposit, which are in transported clay of the Latah formation directly south of the plant. Simplot shifted production to residual clay deposits in the granodiorite, as this source proved more satisfactory for paper filler. The pits exploited by Simplot for residual clays were the WBL north and south pits and the Moose Creek Clay Mine, and the Stanford pit. Simplot operated their plant until 1974, when it was sub-leased to Clayburn Industries of British Columbia. Clayburn operated the property only a few years, calcining clay that was shipped to Canada and processed into super-duty and 70% alumina bricks. In 1994 the plant was dismantled and the property partially reclaimed.
Several Companies (1983-1986)
During the mid-1980’s, a number of companies began exploration work in the Helmer-Bovill area to identify clays suitable for use as paper fillers and coaters. The University of Indiana, Nord Resources, Miles Industrial Mineral Research, and Cominco American conducted work on the Helmer-Bovill area deposits. In 1985-1986, the Erikson- Nisbet Partnership formed a consortium of companies to develop new processes for beneficiation of the clays, but the introduction of precipitated calcium carbonate fillers for paper reduced the demand for kaolin fillers.
Regional Geology
The regional geology is dominated by Precambrian sedimentary rocks of the Belt Supergroup (“Belt”), which have been strongly deformed and intruded with granitic phases of the Idaho Batholith during the Cretaceous age Sevier Orogeny.
During the Middle Proterozoic, the area was dominated by a large intra-cratonic basin that was subsiding along syn-sedimentary faults. The basin sediments comprise the Belt which range in age from about 1,470 to 1,400 Ma. The oldest units consist of the Lower Belt sequence, these are overlain by the Middle Belt Carbonates and the youngest are the Missoula Group.
The Belt sediments are believed to have remained relatively stable until approximately 1,350 Ma when portions of the basin were affected by compressional tectonics of the East Kootenay Orogeny. This orogeny was followed by rifting of the basin during the late Proterozoic-early Paleozoic when large portions of the sediments were transported away and the western margin of North America was developed.
The next major tectonic event occurred during the Cretaceous Sevier Orogeny. Early compressional tectonics dominated the area forming large-scale folds, reverse and thrust faults. During the late Cretaceous, the Bitterroot Lobe of the Idaho Batholith was emplaced in the region. The intrusive rocks described below were formed during this event.
The most recent, significant, geologic event was the deposition of the Columbia River Basalts (“CRB”). The CRB consist of a large plateau flow sequence of Miocene age (6 to 17 Ma). The lavas are distributed over an extensive area covering portions of Idaho, Oregon, and Washington. Minor extensional block faulting has resulted in much of the present landscape.
Local Geology
Belt Series
The Precambrian metasediments of the Belt series are the oldest rocks in the Bovill-Moscow area and form the basement for the entire area. The Belt series rocks crop out primarily in the northern and eastern sections of the Helmer-Bovill Property. They form a high-grade metamorphic facies assemblage that includes gneiss, schist, and minor meta-quartzite, meta-argillite, and meta-siltite.
Thatuna Granodiorite
Granitoid intrusive rocks of Cretaceous age underlie a large portion of the Helmer-Bovill area and form part of the Thatuna batholith. Thatuna lithologies consist predominantly of granodiorite with subordinate adamellite, tonalite, and granite. The principal mineral constituents are quartz, plagioclase feldspar, K-spar, and biotite with trace to minor amounts of muscovite, garnet, and epidote. The batholith is medium- to coarse-grained granular, and porphyritic textures are common. Erosion of the Thatuna batholith developed a mature topography where it is exposed in Latah County.
23
Recent geological mapping identified a previously undescribed phase of the Thatuna batholith, referred to as the Kmcp. The Kmcp is interpreted to be a border zone of the intrusion that occurs along the interface between the main-stage, coarse-grained, and porphyritic Thatuna batholith and the Precambrian Belt series roof rocks. Intrusion into cooler roof rocks resulted in a distinctive and texturally diverse unit characterized by dominant granular medium-grained and subordinate coarse-grained and pegmatoid textures, the lack of well-developed porphyritic textures and the presence of Precambrian xenolithic paragneiss, paraschist and metasiltite blocks inherited from the roof rocks. Where unaltered, the Kmcp intrusive rocks contain a primary assemblage of plagioclase, K-spar, quartz, biotite, and muscovite, and are predominantly of granodioritic to granitic composition. The porphyritic main body of the Thatuna batholith does not appear to crop out within the mapped part of the Helmer-Bovill area.
The Kmcp derives its distinctive character from high-level interaction with the Precambrian metasedimentary roof rocks. More rapid cooling in the contact zone produced a dominant medium-grained, non-porphyritic, granodioritic unit in contrast to the coarser-grained, porphyritic granodiorite lithology that characterizes the deeper main stage of the batholith. In the roof zone, hydrous mineral-bearing xenolithic blocks of the Precambrian Belt series metasediments were entrained by the intruding magma and outgassed of their volatile component. The outgassing contributes to the creation of pockets of hydrous granitic liquid proximal to the Precambrian blocks. These pockets crystallized subsequently into coarse-grained to pegmatoid granite pods that are distributed within the larger body of medium-grained granodiorite. Owing to the physicochemical conditions of crystallization within the hydrous pods of granitic liquid, the resultant solidified rocks show a stronger tendency toward higher proportions of K-feldspar relative to plagioclase and higher K2O/Na2O ratios than does the dominant medium-grained granodiorite.
Weathered Thatuna Granitoid
The exposed Thatuna batholith was subjected to intense weathering in a tropical or near-tropical climate during the Miocene epoch, while the Columbia River basalts were erupted and the Latah formation sediments were deposited. In response to the strong weathering, much of the feldspar and at least some of the mica in the igneous body were altered to one or more varieties of clay minerals. The depth limit of weathering may initially have been fairly consistent; however, subsequent erosion has left a variable weathering profile with thickness roughly dependent on topography. At present, the depth of weathering may exceed 100 ft. along ridges and be less than 3 ft. in some valleys.
Of particular importance is the weathering of the feldspar in the granitoids to halloysitic to kaolinitic clays. It was the presence of kaolinitic clay deposits that provided the initial impetus for economic mineral development in north Idaho. Plagioclase feldspar is the least stable phase in the weathering environment, and it alters to form clay well before K-spar and muscovite. K-spar and the micas are relatively resistant to alteration during all but the most intense weathering. Quartz is impervious to alteration throughout the weathering cycle. In the Helmer-Bovill area, pits that were mined for kaolin in residual deposits contained mostly quartz, halloysite, kaolinite, and K-spar. The waste material is primarily quartz and K-feldspar, with plagioclase accounting for only a minor proportion of the total feldspar.
Potato Hill Volcanics
The Potato Hill volcanic rocks contain silicic to intermediate volcanic rocks and include lava flow and pyroclastic flow units, as well as hypabyssal intrusive rocks. They form much of the rock along the western edge of the Helmer embayment at Potato Hill, and along the southern edge of the Thatuna. Many of the pyroclastic flows contain abundant xenolithic clasts of older granodiorite and Belt metasediments.
The individual flows are 3 to 50 ft. thick and the complete sequence exceeds 900 ft. in thickness. The flow units generally contain 3% to 10% phenocrysts of feldspar and quartz distributed in an aphanitic matrix of devitrified volcanic glass. Accessory minerals include magnetite, hornblende, apatite, and zircon. Some lithic-rich pyroclastic flow units carry up to 20% fragments. The saprolitic weathering that is well-developed in the older rocks has not appreciably affected the Potato Hill volcanics.
Columbia River Basalts
The First Normal member of the Grande Ronde formation, the Priest Rapids member of the Wanapum formation, and the Onaway member of the Saddle Mountain formation (oldest to youngest, respectively) are all Columbia River basalt flows mapped in the Helmer-Bovill area. The Grande Ronde formation flow occurs in the southern portion of the Helmer-Bovill area and consists of fine-grained to very fine-grained aphyric basalt. The Priest Rapids flow is a medium to course-grained basalt with microphenocrysts of plagioclase and olivine in a groundmass of intergranular pyroxene, ilmenite, and devitrified glass. It crops out in increasing abundance to the southwest toward Deary. Saddle Mountain basalts are found much further to the west. The importance of the Columbia River basalts to the genesis of the Latah formation is that the episodic basaltic extrusion dammed streams and formed lakes into which kaolin-rich sediments eroded from weathered granitoid and Precambrian metasediments were deposited.
24
Latah Formation
The Latah formation can be described as lake bed sediments that, although local in origin and distributed in disconnected basins, occur over an area 175 miles long and 75 miles wide in eastern Washington and northern Idaho. Episodic flows of the Columbia River basalts blocked streams and formed lakes that collected sediments eroded from surrounding rocks. In the Helmer-Bovill area, a major basin termed the Helmer embayment occurs over an area of approximately 25 to 30 square miles. Latah formation sediments are described as clay, silt, sand and minor gravel deposits that are laterally equivalent with and overlie flows of Columbia River basalts. The clays are white, yellow, red and brown in color, kaolinite-rich, and range from a few feet to several tens of feet in thickness.
Palouse Formation
The Palouse Formation comprises mixed loess and flood plain sediments of Pleistocene age. It ranges in thickness from 3 to 35 ft. in thickness and averages 10 ft. thick in the Helmer embayment. The unconsolidated layers also include volcanic ash from the eruption of various Cascade Range volcanoes.
Mineralization
The Helmer-Bovill Property hosts four different deposit types. These include primary Na-feldspar deposits, residual K-spar-quartz-kaolinite-halloysite deposits, transported clay deposits and K-spar-quartz tailings deposits (which are located at the WBL Tailings Project).
The primary Na-feldspar deposits are hosted within granitic border phases of the Thatuna granodiorite. The transported clay deposits are hosted primarily within the Latah formation. This formation was deposited primarily in shallow lakes dammed by Columbia River Basalts. Extensive weathering of feldspathic source terrains constitutes the provenance of these clays. The residual deposits are derived from saprolitic weathering of the Thatuna granodiorite-granitic phases. In general, Na-feldspar alters to kaolinite and halloysite. These clays are accompanied by residual K-spar and quartz and are the subject of this report.
The WBL Tailings Project hosts K-spar and quartz. The tailings were deposited on a gently east-northeast sloping hillside and also with an impoundment structure located at the base of the slope. Exploration trenches indicate the tailings are in excess of 17 ff. deep in most places. In general, the sloping portions of the tailings are composed of coarser material and the flat lying portions at the base of the slope are composed of relatively finder materials. The tailings appear to be continuous based on observations from test pits.
Feldspars
The unweathered Thatuna Batholith represents a source carrying a high total feldspar abundance, of which a significant proportion is Na-feldspar. In the strongly weathered Thatuna Batholith rocks plagioclase (Na-feldspar) shows nearly complete alteration to a kaolin mineral, but much of the K-spar survives alteration.
Quartz
Exploration and drilling results indicate that the quartz in the Thatuna batholithic rocks is relatively free of Fe-bearing mica or oxide inclusions. The analytical values for the trace elements in the quartz are very near or below detection limits for the electron microprobe and indicate that quartz from the Moose Meadows area is essentially free of impurities. This data suggests that the area has excellent potential to produce a glass-grade product that might be processed further into feed stocks for the high purity quartz market.
Clay Minerals
The kaolinite group of clay minerals includes four minerals that are similar chemically, but differ with regard to crystal structure. Two of these kaolinite group minerals, kaolinite and halloysite are the major clay minerals in the Helmer-Bovill area clay deposits. Crystal structure differences are important and control properties relevant to their commercial applications. Kaolinite occurs as distinct platelets, whereas halloysite forms tubes and spheroids. Although halloysite also has a plate-like crystal form, imperfections in its crystal lattice cause the crystal to “roll up” into the tubular forms. There are two varieties of halloysite, the four-water variety and the two-water variety. The two-water variety is a dehydrated version of the four-water halloysite and is almost impossible to distinguish from poorly crystallized kaolinite. Both varieties of tubular halloysite and poorly crystallized kaolinite exhibit poor viscosity.
25
Residual clays developed on weathered granitoid in the Helmer-Bovill area are a mixture of halloysite and kaolinite, with the concentration of total clay dependent upon the degree of weathering. Drilling shows that halloysite content decreases with depth as the effects of weathering diminish. In tests on two samples from the WBL north pit, GMT (2005) demonstrated that there is a significant halloysite fraction in the residual clay. The work done by GMT indicates that the quality of the residual clay from the WBL pit is high enough to be used in some high-end specialty paper, paint, and ceramic markets. Work done by I-Minerals and further continued by GMT show that a wet process using proven gravity separation equipment can produce a high-quality halloysite product that will gain attention of halloysite markets.
Deposit Type
The mineral deposit consists of residual deposits containing primarily K-spar, quartz and clays. The mineral deposit is underlain by the Thatuna Batholith, composed mainly of Na-feldspar, K-spar and quartz. Weathering has created a residual saprolite horizon which directly overlies the bedrock from which it was derived. During the natural processes of weathering, the original plagioclase feldspars (Na-feldspar) have preferentially broken down to produce the clays kaolinite and halloysite. The K-spars have resisted weathering to a degree and much of the original component remains as free grains. Similarly, the quartz component of the host rock remains as free grains in the weathered material.
Minerals of economic interest include the following:
- Halloysite clay, an aluminosilicate with hollow tubular morphology in the submicron range
- Kaolinite clay, hydrated aluminum silicate used in ceramics, rubber, plastics, etc and when calcined becomes a metakaolin clay, or dehydroxylated kaolin clay, which is reactive (Pozzolan) and enhances the strength, density and durability of concrete and ceramics
- K-feldspar, uniquely suited to ceramic formulations requiring an alumina source
- Quartz, silicon dioxide (SiO2) a component of various types of glass.
Exploration, Drilling and Bulk Sampling/Pilot Testing
Exploration Programs
During the period from 1999 through the end of 2001, the exploration work included the acquisition of over 6,000 acres of mineral lease applications, the compilation of an extensive file on the results of previous operations, and new drilling programs.
During 2002 and 2003, geologic mapping and petrographic studies were performed. An electron microprobe analytical study was conducted on field samples, quartz products and feldspar products from earlier work. Following petrographic and microprobe studies, select intervals of residual deposits from the 2000-2001 drilling program were sent to Mineral Resource Laboratory (MRL) for process testing.
Since 2003, all exploration work completed on the property has involved diamond core drilling. The Mineral Resource estimate in this study report is based on data and information gathered during these diamond drilling programs.
The exploration work we conducted was used to target generalized rock types and their weathering by-products. The work was successful in defining four target areas which were subsequently tested by diamond drilling. SRK Consulting (SRK) reviewed the exploration procedures and sampling methods as part of the pre-feasibility study completed in 2014 and found that the work was conducted by trained professionals to industry standards for a deposit of this type. SRK also stated that the exploration methods were successful in defining their intended targets and that similar techniques would be appropriate to expand the resource base if necessary.
Drilling Programs
During 2000-2001, a 41-hole diamond drill program was completed at the Property, focused on both bedrock feldspar deposits and residual deposits. Approximately 50% of the drill holes penetrated residual deposits at or very near the surface. A total of 4,063 ft. were drilled during this program. All holes were surveyed by Rim Rock Surveying.
In 2003, a 12-hole, diamond drill program was completed at the Project, testing for residual deposits over a broad area. A total of 1,333 ft. were drilled in this program. The core was split, sampled, and described in detail within a previous Technical Report and in petrographic reports prepared for I-Minerals All holes were surveyed with a hand held GPS with an accuracy of several meters.
26
In 2007, a 28-hole, diamond drill program was conducted to further evaluate the residual deposits. Six holes were located in the WBL Pit area on 200 to 600 ft spacing. The remaining holes were spread over the entire property to test those areas believed to be underlain by the weathered Thatuna granodiorite, establishing several new prospective areas. A total of 3,529 ft were drilled during this program. The six holes located at WBL Pit were surveyed by Jamar and Associates and all remaining holes were surveyed by handheld GPS with an accuracy of several meters.
In 2010, a 10-hole, diamond drilling program was completed in the WBL Pit and Middle Ridge areas. Five holes were completed in each area, on 400 to 900 ft spacing. A total of 1,195 ft were drilled in this program. All holes were surveyed by Taylor Engineering with a differential GPS with centimetre accuracy.
In 2011, a 66-hole, diamond drilling program was conducted in the WBL Pit and Middle Ridge areas. At Middle Ridge, 45 holes were drilled and at WBL, 21 holes were drilled. These holes were mostly located on 200 ft spacing with a few on 400 ft. A total of 7,747 ft were drilled during this program. All holes were surveyed by Taylor Engineering with a differential GPS with centimetre accuracy.
In 2013, a 167-hole, diamond drilling program was conducted in the Middle Ridge deposit and in two new areas referred to as Kelly’s Hump North and South. At Middle Ridge, 21 additional holes were completed to provide a drill pattern on 100 ft spacing in the area hosting higher halloysite grades. In the Kelly’s Hump area, a phase one program was completed with 17 holes spread though out the elevated area of the north south trending ridge. These were generally spaced at approximately 400-800 ft with all but one, located in the northern area. A Phase 2 program was completed with 113 additional holes on 100 ft spacing in the Kelly’s Hump North area, and 16 holes on 200 ft spacing in the Kelly’s Hump South area.. A total of 17,811 ft. were drilled during this program. The drill hole locations were first laid out by Taylor Engineering with a differential GPS and then once the drill rig was set up any offsets were measured with a tape measure.
The drillhole database supporting the resource estimation of this report consists of 322 diamond core drillholes totaling 35,909 ft. The shallowest hole is 20 ft, the deepest is 260 ft, and the average is 112 ft. All drillholes are oriented vertically and none of the holes have down hole deviation surveys. Since all of the drilling is relatively shallow the lack of down hole deviation survey has no material impact on the sample location. Since many of the older drillholes are located with a hand held GPS their elevations do not match the current, high resolution topographic surface. For this reason, all drillhole supporting the resource estimation of this report, are draped onto the high resolution topography to provide a uniform basis of elevation control. Typically, the sample recovery was very good ranging from 60 to 100%. The average core recovery is 87%.
27
Figure 4. Drill Hole Locations
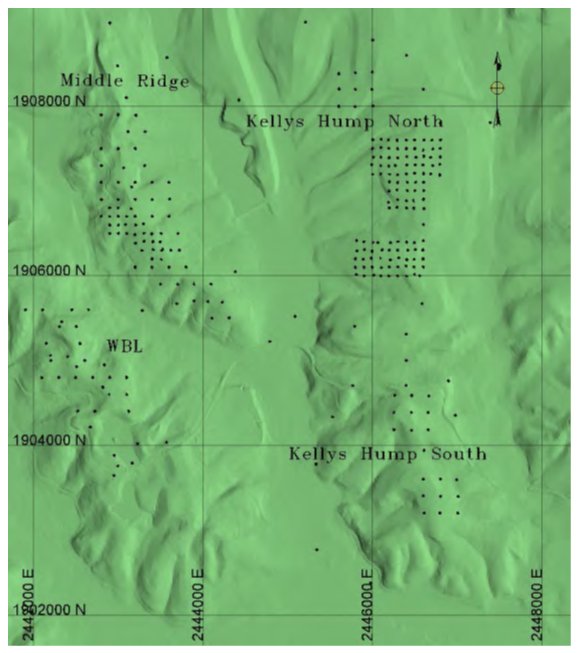
Historical Testing
Various investigators have undertaken mineralogical, beneficiation, and product characterization testing programs on material taken from our Helmer-Bovill property. This testing includes primary material from the Bovill deposit, as well as secondary material—referred to as WBL Tailings—that was generated from a previous kaolin clay mining operation at the site during the 1960s and 1970s.
Much of the process developed to recover the minerals was conducted by two principal investigators: Ginn Mineral Technology (GMT) and the Mineral Research Laboratory (MRL) of North Carolina State University. GMT completed the developmental work on the clay (halloysite and kaolinite) circuit, using bench-scale (pounds of material) and pilot plant (hundreds of pounds) process demonstrations. Similarly, MRL carried out the development work on the sand circuit (k-spar and quartz), also employing bench-scale and pilot plant process demonstrations. Both service providers produced products of a suitable grade and quality for detailed characterization, and suitable for commercial production.
The bench-scale testwork conducted by GMT demonstrated the responsiveness of the clay to conventional physical and chemical beneficiation methods. The bench-scale testing results were further reinforced with five pilot plant demonstrations. The first two were conducted in July 2008 and July 2010, and were modest in scale. Subsequently, three additional small-scale pilot tests were conducted to explore alternative process flowsheet arrangements. The data generated from these tests confirmed the results of the previous tests, both quantitatively and qualitatively, including definition of the circuit for the recovery of halloysite.
28
Additional testing and development was conducted in 2011 and 2012 on bulk samples and composites to confirm previous work and generate material for product development. Process development work focused on assessing alternative physical separation technologies for the kaolinite/halloysite separation preparation. The results from this more recent testing confirmed the previous work, which improves the confidence in the viability of the process to generate saleable products.
Historical kaolinite mining activities on the property generated a feldspathic sand tailings material, which is referred to as WBL Tailings. These tailings are considered representative of the sand fraction of the material derived from the Bovill resource. Primary material from the historical WBL pit was also used in testing. The sand material was prepared from the sand separated from the clay as part of the clay testwork programs undertaken by GMT.
Initial testing on the WBL Tailings focused on recovery of K-feldspar from quartz including unit operations, operating conditions, and general equipment arrangement. A basic set of parameters for conventional beneficiation methods was established at the bench test level. Later, a comprehensive pilot plant campaign was undertaken based on the findings of the bench-scale testing. The objective was to determine engineering and operating data that would facilitate the design of a commercial process plant. A 35-ton bulk sample of WBL Tailings was processed on a continuous basis, facilitating the preparation of a sizable quantity of product concentrates as well as the optimization of unit operations. The process employed conventional unit operations and was successful in achieving the stated objectives.
MRL was also retained to provide design the quartz purification process. Mirroring previous development work on the K-feldspar flowsheet, MRL performed bench-scale testing to provide preliminary data to design and plan a more comprehensive pilot plant campaign. Pilot campaigns were conducted in late 2011 and again mid-2012, which demonstrated the ability to produce suitable quartz products from both WBL Tailings and primary material. Due to constraints on material, budget, and time, the processing regime was not optimised during these campaigns.
Initial Clay Testing
GMT reported on a clay processing pilot plant trial that used material sourced from the Kelly’s Hump location (Drill Hole RC13-5263). The sample was extracted from a depth of 10 ft to 15 ft and totalled about 12,000 lbs.
The primary purpose of the testwork was to optimize the separation of halloysite from kaolinite. Other stated objectives of the work were to optimize the brightness of the halloysite by employing physical and chemical beneficiation methods, and to produce a metakaolin product and assess its pozzolanic properties. The testing undertaken by GMT was conducted using American Society for Testing and Materials (ASTM) and Technical Association of the Pulp and Paper Industry (TAPPI) standards in line with previous testing campaigns and industry practice.
The bulk sample was processed to remove the sand component (+325 mesh). Reconciliation and mass balancing determined that approximately 78% of the feed mass reports to the +325 mesh sand fraction, with the other 22% reporting to the fine clay fraction. The sand fraction was then shipped to MRL for further feldspathic sand testing.
As shown in Table 0-2, a two-stage beneficiation process employing both centrifugation and differential flotation yielded the brightest product. Differential flotation also produced the highest grade halloysite, exceeding 90%. Final product processing then explored cleaning the concentrates with either acid leaching or magnetic separation, or cleaning them with a combined magnetic separation with acid leaching step. A single-stage processing route with magnetic separation alone was the most effective in improving the brightness of the finished products by removing mica gangue from the concentrate. Further improvements were realized with the inclusion of an acid leaching stage for the non-magnetic product. Finally, a coarse kaolinite product was prepared from the 3” hydrocyclone underflow for conversion into metakaolin. The sample was prepared by calcining the kaolinite at 850°C for appraisal as a pozzolanic material.
Table 0-2: Clay Processing Product Recoveries
| ID | Process flow description |
Stage yield
(%) |
Cumulative yield (%) | TAPPI brightness (%) |
| 1 | +325 mesh screened fraction | 78 | 78 | NA |
| 2 | -325 mesh screened fraction | 22 | 22 | 63.00 |
| 3 | 3” hydrocyclone overflow | 90 | 19.8 | 64.43 |
| 4 | 50% classification of overflow (fine) | 50 | 9.9 | 71.98 |
| 5 | 50% classification of overflow (coarse) | 50 | 9.9 | 52.1 |
| 6 | 35%/50% classification of overflow (fine) | 33 | 6.5 | 73.51 |
| 7 | 35%/50% classification of overflow (coarse) | 67 | 13.3 | 56.07 |
| 8 | Differential flotation of Item 4 | 71 | 7.0 | 75.72 |
The clay testwork demonstrated the ability to produce varying grades of halloysite and kaolinite concentrates. The extent of the process to be deployed in the commercial plant will largely be determined by the size and value of the halloysite product markets. Market research indicates that there is a market for both standard-grade and high-purity halloysite, and therefore, differential flotation is incorporated in the process flowsheet. Market research also shows that while there is a limited market for the type of kaolin produced from Bovill ores, there is a robust market for metakaolin. Therefore, all of the Bovill kaolin will be converted to metakaolin.
29
Current Testing
The current testwork is mainly focussed on the development of both sand and clay circuits, further product definition and characterization, and initial OEM equipment testing in preparation for detailed engineering. Previous testwork on the feldspathic sands provided engineering definition sufficient for the completion of engineering and feasibility assessment. However, additional testing in 2015 confirmed earlier results, optimized the processing scheme, and added some refinements regarding purification of the products.
Representative Sample Collection
In mid-2014, bulk metallurgical samples were collected from 9 trenches using an excavator. The trench locations were selected based on the local geology and results from adjacent drill holes. Selection of the sample locations was reviewed and approved by SRK’s Principal Resource Geologist, Dr. Bart Stryhas.
The mineral composition of the deposit is relatively homogeneous with the exception of halloysite content. The selected sample locations are in the expected mining areas, and either rich in halloysite (6 locations in the Kelly’s Hump area and two locations in the Middle Ridge area) or void of halloysite (one location in the Kelly’s Hump South area).
Depth of the ore-bearing layer, and depth of the overburden were also considered when selecting the sample locations. The depth to the ore layer (weathered granodiorite) was determined for each hole, and an excavator dug through the overburden to the top of the mineralized layer to approximately 5 feet below. The samples were collected, placed in large bulk bags, and shipped to GMT for clay and sand separation. The samples were not blended in the field, but were sent to GMT in three discrete samples; Kelly’s Hump (halloysite rich), Kelly’s Hump South (halloysite void), and Middle Ridge (halloysite rich). GMT processed the clay fraction and shipped the sand to MRL for additional bench and pilot scale testing.
While these samples cannot be considered statistically representative of the entire ore body, they are characteristic of the ore that is expected to be encountered during the mining and processing of the Bovill Project. The sampling techniques, and the metallurgical samples collected are considered suitable for bench and pilot plant metallurgical testing to define and confirm the process recovery scheme and final product quality.
Table 13‑3: Current Testwork
| Description | Organization | Report Title | Report Date |
| Halloysite and Kaolin Processing Trials | Ginn Mineral Technology | Production Trials of the Kelly’s Hump and Middle Ridge Crude Resource Ore | January 2015 |
| Processing for brightness improvement | Ginn Mineral Technology | Middle Ridge Differential Flotation Product Brightness Optimization | April 2015 |
| Ore characteristics and impact crushing tests | Stedman Machine Company | Test Results for GBM Engineers/I-Minerals | May 2015 |
| Tailings thickening and filtration testing | Bilfinger Water Technologies, Inc. | Filtration Test Report No. LAB315090 | July 20, 2015 |
| Slurry rheology and filtration tests on kaolin, and halloysite products | Resource Development Inc. | Bovill Rheology and Filtration Results | September 22, 2015 |
| Synopsis of sand bench and pilot scale testing | North Carolina State University – Mineral Research Laboratory | TBD | March 2016 |
Clay Processing
The samples described in Section 13.2.1 were shipped to GMT in Sandersville, Georgia, USA. GMT received 26.3 tons of Kelly’s Hump (halloysite-rich) material, 4.4 tons of Kelly’s Hump (void of halloysite) material, and 6.3 tons of Middle Ridge (halloysite-rich) material for production scale trials. Results of the trials were reported in January 2015.
Each of the three samples was treated individually. The halloysite-rich samples from Kelly’s Hump and Middle Ridge were treated in a similar manner, whereas the Kelly’s Hump South sample was treated using an abbreviated program due to its lack of contained halloysite.
30
Figure 13.3 presents the processing scheme used for the two samples containing halloysite, and Figure 13.4 presents the processing scheme for the Kelly’s Hump South sample.
Table 13-4 summarizes the key material balance data of the three samples after processing according the processing schemes presented above. The most significant difference in the products is the brightness values. At greater than 70% brightness, the Middle Ridge products were much higher than the other two resource products. Product from Kelly’s Hump South had the lowest brightness, at 47%.
Recovery of Clay Products
Combined clay products (halloysite together with kaolinite) in the ore account for 16-18% of the total feed. The clays are separated from the other constituents in the ore based on particle size and apparent density. Virtually 100% of the clay is recovered as standard purity halloysite, high purity halloysite or kaolinite (metakaolin).
The split of recovery between standard grade halloysite and high purity halloysite is dictated more by market conditions than any inherent differences in the products. The market for high purity halloysite will be satisfied first with the market for standard grade being satisfied on a secondary basis. If necessary, any remaining halloysite can be blended with kaolinite and calcined to create metakaolin.
Kaolinite recovery is 100% of this constituent in the ore with the only loss being in the calcining step, where the kaolinite is heated to about 850o Celsius. The conversion of kaolinite to metakaolin by calcining removes most of the water of hydration and results in approximately 10% loss of mass. As a result, the recovery of kaolinite is effectively 90% of the amount of kaolinite in the feed.
Sand Recovery
Feldspathic sand (k-feldspar together with quartz) makes up approximately 75% of the material in the ore. Processing of the sand involves separation of the quartz from the potassium feldspar and purification of the resulting separate streams. In this process there is removal and rejection of iron bearing minerals (muscovite and biotite) and losses of fines to the tailings stream. Testwork results show that the recovery of quartz and potassium feldspar from the ore feed is approximately 58.5% each which is equivalent to approximately 78% recovery from the sand component in the feed.
Overall Product Recovery
The sum of all products recovered from the feed ore is approximately 61%. The remaining 39% is lost to tailings as sand fines or impurities removed in the upgrading of the sand product
Table 13-4: Product Yields
|
PROCESS FLOW DESCRIPTION |
Kelly’s Hump | Middle Ridge | Kelly’s Hump South | ||||
|
Process Recovery / Yield
% |
Yield from Total Dry Resource
% |
Process Recovery / Yield
% |
Yield from Total Dry Resource
% |
Process Recovery / Yield
% |
Yield from Total Dry Resource
% |
||
| + 325 Screened Fraction + Sand | 76.8 | 76.8 | 77.9 | 77.9 | 76.2 | 76.2 | |
| < 325 Screened Fraction (clays and waste) | 23.2 | 23.2 | 22.1 | 22.1 | 23.8 | 23.8 | |
| 3” Hydrocyclone Overflow (combined clays) | 88.1 | 20.4 | 83.3 | 18.4 | 83.5 | 19.9 | |
| 50% Classification of Overflow (halloysite) | Fine Fraction | 43.8 | 8.9 | 46.6 | 46.6 | NA | NA |
| 50% Classification of Underflow (kaolinite) | Coarse Fraction | 56.2 | 11.5 | 53.4 | 53.4 | NA | NA |
| Differential Flotation from 50% Classification Fine Fraction Of Overflow (high purity halloysite) | 58.2 | 5.2 | 58.5 | 5.0 | NA | NA | |
31
As shown in Table 0-4, regardless of the ore source, the sand portion (+325 mesh), makes up 76-77% of the sample. This portion reports to the sand processing area of the plant. In the case of the 2014 bulk sample, the sand portion was shipped to MRL for further testing.
The clay fraction of the ore (-325 mesh) contains the kaolinite and halloysite clays in addition to grit, which is rejected in the 3” cyclone operation. The cyclone underflow, which contains the grit, reports to tailings and makes up approximately 4% of the ore (in the case of the 2014 bulk samples). This material is categorized as waste in the mineral resource and mineral reserve estimates. The 3” cyclone overflow contains the clays (18-20% of the total feed) which are further processed using a centrifuge to separate standard-grade (70%) halloysite (50% classification of overflow) and kaolinite (50% classification of underflow). The halloysite is further concentrated using differential flotation to high-purity halloysite (+90%). Recent tests by First Test Minerals showed 96% halloysite contained in a sample of high purity halloysite. Because essentially all of the material in the 3” cyclone overflow is recovered into one of the three final clay products, the process recovery of the clays from this point is 100%.
Drillhole Database
The drillhole database supporting the resource estimation consists of 338 diamond core drillholes totaling 37,416 ft. The shallowest hole is 20 ft, the deepest is 260 ft and the average is 111 ft. The block model was subdivided into four model areas based primarily on the geographic location and somewhat by sample support represented by the average drill spacing. The WBL area is drilled mainly on 200 ft centers. The Middle Ridge area has an inner portion drilled on 100 ft spacing which is flanked by drilling on 200 ft spacing. The Kelly’s Hump North area is mainly drilled on 100 ft spacing with one area drilled on 200 ft spacing. The Kelly’s Hump South area is all drilled on 200 ft spacing. Each sample within the drillhole database is characterized by the relative proportions of sand, kaolinite clay, halloysite clay, and waste. The sum of these four components equals 100% of each sample. These four variables were estimated as the resource material of this report.
32
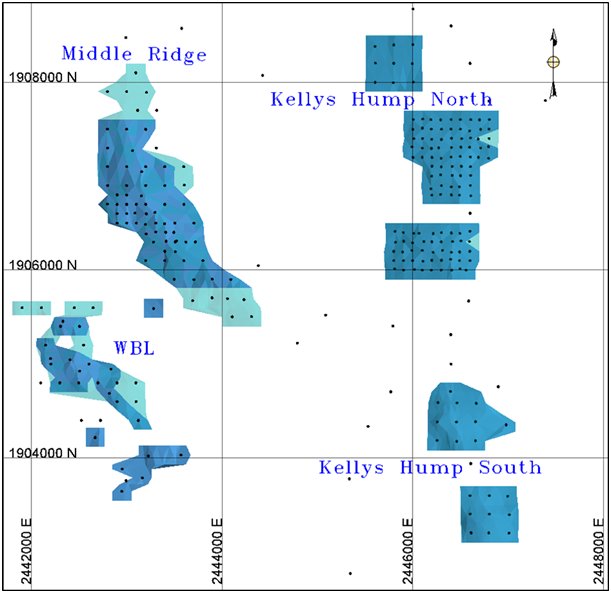
Figure 14-1: Drillhole Locations (Black Dots), Clay Shell >=10% (Blue), Clay Shell >1-<10% (Teal Mineral Resources are classified under the categories of Measured, Indicated and Inferred according to CIM guidelines. Classification of the resources reflects the relative confidence of the grade estimates and the continuity of the mineralization. This classification is based on several factors, including sample spacing relative to geological and geo-statistical observations regarding the continuity of mineralization; data verification to original sources; specific gravity determinations; accuracy of drill collar locations; accuracy of topographic surface; quality of the assay data; and many other factors that may influence the confidence of the mineral estimation. No single factor controls the resource classification, but rather each factor influences the result.
The Mineral Resources are classified as “Measured” and “Indicated” based on the drillhole spacing. Measured resources are assigned where the average drillhole spacing is 100 ft. or less, while all other areas, where drillhole spacing averages 200 ft, are classified as “Indicated”.
33
Table 0-5: Indicated Mineral Resource Statement, (as of 26 October 2015)
| Classification | Location |
Tons (M) |
Qtz & K-feldspar Sand (%) |
Kaolinite (%) |
Halloysite (%) |
Qtz & K-feldspar and Tons (000s) |
Kaolinite Tons (000s) |
Halloysite Tons (000s) |
| Measured | Kelly’s Hump | 3.54 | 75.98 | 13.08 | 3.86 | 2,688 | 463 | 137 |
| Middle Ridge | 2.18 | 77.43 | 10.95 | 4.15 | 1,690 | 239 | 91 | |
| All | 5.72 | 76.53 | 12.27 | 3.97 | 4,378 | 702 | 226 | |
| Indicated | Kelly’s Hump | 7.50 | 55.22 | 14.81 | 2.77 | 4,140 | 1,110 | 208 |
| Middle Ridge | 5.14 | 58.85 | 17.91 | 3.61 | 3,023 | 920 | 185 | |
| WBL Pit | 2.90 | 58.43 | 13.31 | 1.62 | 1,694 | 386 | 47 | |
| All | 15.53 | 57.02 | 15.56 | 2.83 | 8,857 | 2,416 | 440 | |
| Measured and Indicated | Kelly’s Hump | 11.04 | 61.87 | 14.26 | 3.12 | 6,828 | 1,574 | 344 |
| Middle Ridge | 7.32 | 64.39 | 15.83 | 3.77 | 4,713 | 1,159 | 276 | |
| WBL Pit | 2.90 | 58.43 | 13.31 | 1.62 | 1,694 | 386 | 47 | |
| All | 21.26 | 62.27 | 14.67 | 3.14 | 13,235 | 3,119 | 667 |
Source: SRK
MINERAL RESERVE ESTIMATES
Pit Designs
Detailed pit designs were completed including three pit designs in the Kelly’s Hump area, one design in the South Kelly’s Hump area, and two designs in the Middle Ridge area. The total ultimate pit is considered the combination of the three designs and is below in the figure titled “Ultimate Pits and Dumps”.
34
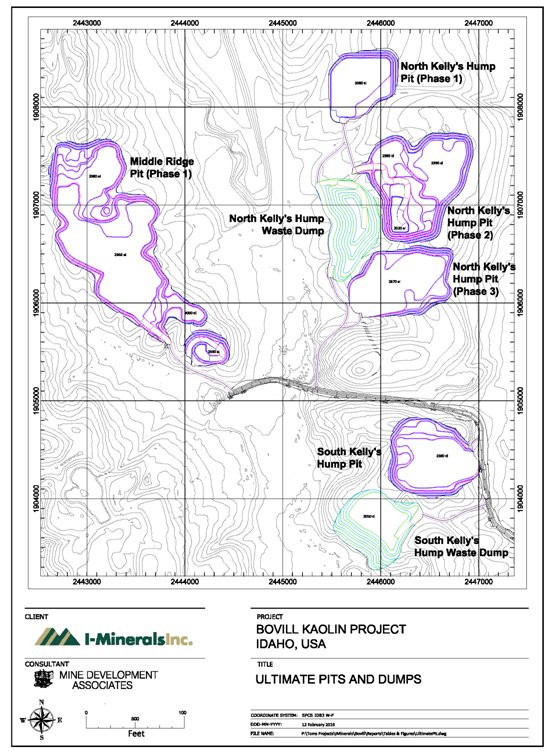
Mineral Reserves
Mineral reserves for the project were developed by applying relevant economic criteria in order to define the economically extractable portions of the resource. MDA developed the reserves to meet NI 43-101 standards. The NI 43-101 standards rely on the CIM Definition Standards on Mineral Resources and Mineral Reserves adopted by the CIM council. CIM standards define Proven and Probable Mineral Reserves as follows:
Table 0-1 reports the Proven and Probable reserves based on the pit designs discussed in previous sections for each case. Table 0-2 shows the reserves and associated waste by pit phase. The reserves are shown to be economically viable based on cash flows provided by GBM. MDA has reviewed the cash flows and believes they are reasonable for the statement of Proven and Probable reserves.
35
Table 0-1: Proven and Probable Reserves
| Reserve | Proven | Probable | Total P&P |
| K Tons | 4,155 | 4,548 | 8,702 |
| Halloysite % | 4.8 | 4.0 | 4.4 |
| Halloysite K Tons | 200 | 182 | 382 |
| Kaolinite % | 11.1 | 12.5 | 11.8 |
| Kaolinite K Tons | 460 | 568 | 1,028 |
| Sand % | 77.8 | 76.8 | 77.3 |
| Sand K Tons | 3,234 | 3,491 | 6,725 |
| NSR | $165 | $160 | $162 |
Notes on Mineral Reserves:
Reserves are based on a $57.00 NSR cutoff grade and
pit designs.
Rounding
of numbers in mineral reserves listed above may cause apparent inconsistencies
Table 0-2: Proven and Probable Reserves by Phase with Associated Waste
| Pit Phase | Proven and Probable Reserves | Waste K Tons | Total K Tons | Strip Ratio | |||||||
| K Tons | Halloy % |
Halloy K Tons |
Kaolin % |
Kaolin K Tons |
Sand % |
Sand K Tons |
NSR $/ton | ||||
| North Kelly's Hump Phase 1 | 525 | 7.8 | 41 | 11.4 | 60 | 73.6 | 386 | $ 181 | 386 | 911 | 0.73 |
| North Kelly's Hump Phase 2 | 1,949 | 4.9 | 96 | 10.6 | 208 | 78.4 | 1,528 | $ 165 | 1,017 | 2,967 | 0.52 |
| North Kelly's Hump Phase 3 | 1,036 | 3.8 | 39 | 12.4 | 129 | 77.8 | 806 | $ 160 | 580 | 1,616 | 0.56 |
| South Kelly's Hump Phase 1 | 1,326 | 2.7 | 36 | 14.7 | 195 | 75.9 | 1,006 | $ 154 | 750 | 2,076 | 0.57 |
| Middle Ridge Phase 1 | 3,713 | 4.5 | 168 | 11.4 | 425 | 77.3 | 2,870 | $ 163 | 1,831 | 5,544 | 0.49 |
| Middle Ridge Phase 2 | 153 | 1.7 | 3 | 8.1 | 12 | 85.1 | 130 | $ 147 | 160 | 313 | 1.04 |
| Total | 8,702 | 4.4 | 382 | 11.8 | 1,028 | 77.3 | 6,725 | $ 162 | 4,724 | 13,426 | 0.54 |
Cautionary Note to U.S. Investors: This section and other sections of this document contain the terms “measured mineral resources,” “indicated mineral resources,” “inferred mineral resources,” “proven mineral reserves,” and “probable mineral reserves” as defined in accordance with NI 43-101. Please note the following regarding these terms:
- “Measured mineral resources” and “indicated mineral resources”. We advise U.S. investors that although these terms are recognized and required by Canadian regulations, these terms are not defined in SEC Industry Guide 7 and the SEC does not normally permit such terms to be used in reports and registration statements filed with the SEC. U.S. investors are cautioned not to assume that any part or all of the mineral deposits in these categories will ever be converted into reserves.
- “Inferred mineral resources”. We advise U.S. investors that although this term is recognized by Canadian regulations, the SEC does not recognize it. “Inferred mineral resources” have a great amount of uncertainty as to their existence, and great uncertainty as to their economic and legal feasibility. It cannot be assumed that all or any part of an inferred mineral resource will ever be upgraded to a higher category. Under Canadian rules, estimates of inferred mineral resources may not form the basis of a feasibility study or pre-feasibility study, except in rare cases. The SEC normally only permits an issuer to report mineralization that does not constitute “reserves” as in-place tonnage and grade without reference to unit measures. U.S. investors are cautioned not to assume that any part or all of an inferred mineral resource exists or is economically or legally minable.
- “Proven mineral reserves” and “probable mineral reserves”. The definitions of proven and probable mineral reserves used in NI 43-101 differ from the definitions for “proven reserves” and “probable reserves” as found in SEC Industry Guide 7. Accordingly, our disclosures of mineral reserves herein may not be comparable to information from U.S. companies subject to reporting and disclosure requirements of the SEC.
36
Cautionary Note To All Investors Concerning Economic Assessments That Include Mineral Resources: Mineral resources that are not mineral reserves have no demonstrated economic viability.
Material Types
Material was broken into ore and waste categories for the purpose of scheduling. The waste consists of material inside of pit designs that is not included in Proven and Probable reserves
Ore definition used a $57.00 cut-off grade to be consistent with Proven and Probable reserves. In addition, ore was further defined into Low-Sand (below 75% sands), Med-Sand (above 75% sands), and High-Sand (above 80% sands). These cut-off grades were chosen because they provided reasonable amounts of halloysite, kaolinite, and sand products within the pit designs. This was important to provide some variability for blending of materials to maintain a generally consistent blend of the three different products.
Mining Method
The Project is planned as an open-pit, truck and excavator operation. The truck and excavator method provides reasonable cost benefits and selectivity for this type of deposit. Only open-pit mining methods are considered for mining at Bovill.
The material to be mined consists of clays and soils, and as such, no drilling or blasting is anticipated. Most sampling will be done from mining faces, however some auger drilling will be done where additional ore control data is required.
Product Markets
Products to be recovered by the Bovill Kaolin Project operation include:
- Quartz
- Potassium feldspar (K-feldspar)
- Metakaolin
- Halloysite
Information for this marketing study has been taken from landscaping studies carried out by Charles River Associates; independent studies carried out by DURTEC and First Test Minerals Ltd; the Roskill database; and trade analysis, combined with our internal marketing data including interviews, meetings and background information from clients. Our customer marketing program has been ongoing for over five years, refining the products offered and markets to be served.
Quartz
All three grades of quartz are high-purity and low iron, and comparable to existing quartz products currently available in the marketplace from U.S.-based competitors. The grades all range from 99.86% to 99.97% silica (SiO2). The purest silica grade is aimed at high value markets, including chemicals manufacturing, solar glass, LCD, and lighting glass; while the other grades are potentially aimed at higher volume markets such as ceramics and container glass.
Through extensive market research, I-Minerals identified a potential market of 234,500 t/y, which more than covers the proposed production levels of 108,000 t/y. The majority of interest is for I-Minerals’ TrueQ™1 product, outlined at 126,000 t/y, which reflects the volume consumed by the glass industry. However, the focus of production will be on higher value applications, and interest has also been demonstrated for significant volumes of TrueQ™3.
The high-purity quartz market is very competitive, and I-Minerals will face aggressive competition from existing suppliers in the quartz markets, particularly to supply the high-purity quartz product, TrueQ™3. For sales into container glass and ceramics markets, transportation and logistics to volume quartz purchasers will be critical and form a significant portion of costs, especially to those located in eastern U.S.
Potassium Feldspar
The Project will produce high-grade K-feldspar, which gives it advantages over other feldspathic minerals in specialist ceramic and glass applications. Sources of K-feldspar are far less common than other feldspars, and it can therefore command a price premium. There is only one main supplier of high-grade K-feldspar in the U.S. (Pacer), although this material has a lower potassium oxide (K2O) content (minimum 9.5% K2O) than the proposed production from I-Minerals (minimum 13% K2O). Additional domestic demand for K-feldspar is met by imports.
37
Customer interest is varied, and includes a range of companies from major tableware and glass producers to smaller ceramic mineral suppliers, as well as more specialist applications. I-Minerals identified markets for 39,200 t/y of its K-feldspar products, Fortispar™, in the U.S. domestic market, representing over 83% of proposed production. There has also been interest in this product from export markets.
Metakaolin
Metakaolin, produced by calcining kaolin at 650-800°C, is a highly reactive pozzolan suitable for use as a cementing material in concrete. I-Minerals’ metakaolin grade meets the specifications and standards for the U.S. concrete industry. Metakaolin particles are nearly ten times smaller than cement particles, which enables the production of a denser, more impervious concrete that is more durable and also has superior mechanical properties than concrete produced with conventional cement. The addition of metakaolin also reduces the setting time for the concrete and the alkali-sulfate reaction. Metakaolin with a lower brightness, as will be produced by I-Minerals, is used in larger volume industrial applications in construction, and in structural concrete, such as bridge decks, tunnels, and cooling towers.
The metakaolin will compete with other pozzolans, such as fumed silica and flyash. Fumed silica is a much more expensive product, while flyash is cheaper but has limitations. Metakaolin is also produced in the State of Georgia, but this is a much whiter product, and finds applications in more decorative markets such as swimming pools and kitchen work surfaces. However, additional freight costs to the northwestern U.S. will make Georgia metakaolin a more expensive pozzolan in that region.
There has been significant interest in the proposed production from the Project, and a potential market has been identified that more than covers production, particularly in the northwestern U.S. The market identified is 71,451 t/y, although current production is forecast at 45,000 t/y. Prospective customers in Colorado, Montana, and Wyoming have expressed interest in metakaolin, particularly for use in mitigating the effects of acid-erosion. One of the main causes of concrete deterioration in the U.S. is from de-icing salt and marine salt.
Halloysite
Halloysite is derived from the weathering of feldspar to kaolinite, and subsequent additional weathering to halloysite. Halloysite is an alumina-silicate clay mineral, which occurs in a number of different colors. Commercial high-quality deposits are relatively rare and are currently mined in China, Turkey, New Zealand and the U.S.
The principal market for halloysite is in the production of porcelain and bone china, but more recently it has been used in technical ceramics for use in molecular sieves and in the manufacture of honeycomb catalysts.
Our halloysite has a unique structure which could be advantageous in securing new markets. It can be used as a carrier for active ingredients in cosmetics, personal care products, and pharmaceuticals; and has applications in nanotechnology, clean technologies, and environmental protection. Halloysite can also be used as a filler in polymers, and in trials, benefits have been demonstrated with its use in compounded polymers (for example nylon-6 and polypropylene). Its addition could be used to enhance flexural and impact strength. Our halloysite can also be used in volume market applications, such as animal feed and tile production. In tile production, halloysite produces a tough filter-cake, illustrative of its high green strength that imparts benefits in fast-fired tile production.
The market for our halloysite is one area where there could be significant upside potential when these developments in the life sciences, clean technologies, and nanotechnology are realized. However, many of these markets are currently in research and development, and are still unproven. Therefore, pricing levels and market sizes are speculative for the most part, and are not included as identified markets or for input into pricing models.
We have identified markets of 8,566 t for its halloysite grades, accounting for around 70% of its proposed production. Of this, 4,442 t are in North America, with larger volumes identified for fast-fired tiles and animal feed. Another 4,742 t are overseas, mainly in Europe, for higher value sales into polymer compounding. There are other potential market opportunities in South Korea, Taiwan, China, South America, and Europe, but these were not included in the total identified markets.
Commodity Prices
Unlike many other commodities, such as metals, grain, or oil, there are no fixed terminal or future exchanges, nor price indices, specifically for industrial minerals. Typically, the prices obtained from commodity exchanges can provide a bench-mark or reference point for the industry. However, in the industrial minerals industry, prices are dictated by confidential contracts between buyers and sellers, and are based on a number of factors including grades, quality, quantity, geographical location, and transportation mode (bulk, containers, bagged), and therefore, prices can vary widely with each transaction.
38
Due to the highly competitive nature of the industrial minerals industry, contract prices are highly confidential and not presented in public documents.
Indicated prices for quartz range widely and depend on a number of factors including both chemical and physical specification, volumes, and transportation mode (bulk, containers, bagged), amongst others. Based on indications from suppliers, prices range from US$120/t to over US$800/t. To achieve an average high-grade quartz price, a composite price was compiled from known data and weighted by the volumes and prices from various end use applications. These include solar glass, LCD, decorative and optical glass, borosilicate glass, and lighting glass. This average value excludes the flat glass volume market, which is our main sales focus, and the identified tonnage for this sector exceeds proposed production levels when cumulatively added to other market sectors. The incremental average value for the high-purity quartz grades is placed at US$295/t, ex-works. These identified markets cover 75% of proposed production assuming that I-Minerals will meet all the necessary specifications for these higher value markets.
Pricing of feldspar is also opaque, reflecting the varying specifications of the material (including alumina, sodium and potassium contents), and their physical characteristics and impurities. K-feldspar prices range from US$200/t to US$350/t. To achieve an average price, a composite price was compiled from known data and weighted by the volumes and prices from various end use applications. The incremental average value for the K-feldspar grades is placed at US$251/t, ex-works.
Historically, metakaolin prices in the U.S. have been based on the high-brightness, white kaolin produced in Georgia. However, we will produce a different product which is reflected in its price of US$225/t ex-works, and is based on an acceptance price by all those who committed to a letter of intent.
Pricing of halloysite is also complex, as many of the applications are developing, and there is a wide differential in price level depending on the amount of processing, specification, volume, and end-use industry. For volume applications, such as animal feed, average pricing is US$700-$720/t. For polymer pricing, the indications range between US$2,000-$6,000/t, illustrating the wide variation. For the purposes of pricing the halloysite, a weighted average is used, which would include bulk volumes at lower prices and include allowances for some much lower volume sales at higher values into the identified markets. This method gives an average price of US$1,054/t for the halloysite into potential identified markets across the board.
Capital Cost Summary
The total initial capital investment for the Project is estimated to be US$108,123,204. Sustaining capital of US$11,775,070 is required, bringing the total LoM capital investment to US$120,033,272.
The total LoM capital for the Project is reported in Table 0-3. The total expenditure shown accounts for sustaining capital planned to be spent over the 26 years of operation.
Table 0-3 Capital Cost Estimate
| Total Capital Investment |
Initial Capital (US$ 000s) |
Sustaining Capital (US$000s) |
Total LoM Capital (US$ 000s) |
| Total Capital Investment | 108,258 | 11,775 | 120,033 |
| FIXED CAPITAL TOTAL | 97,773 | 11,230 | 109,548 |
| DIRECT TOTAL | 65,054 | 11,230 | 76,284 |
| General | 4,059 | 6,001 | 10,059 |
| Mining | 1,334 | 84 | 1,418 |
| Process | 50,764 | 0 | 50,764 |
| Waste Management | 3,167 | 5,145 | 8,312 |
| Infrastructure and Utilities | 5,731 | 0 | 5,731 |
| INDIRECT TOTAL | 32,718 | 546 | 33,264 |
| Engineering & Procurement | 10,200 | 0 | 10,200 |
| Construction Management | 5,204 | 0 | 5,204 |
| Field Indirect | 5,314 | 0 | 5,314 |
| Contingency | 12,000 | 546 | 12,546 |
| WORKING CAPITAL TOTAL | 10,485 | 0 | 10,485 |
| Cash Reserve | 9,687 | 0 | 9,687 |
| Inventory | 798 | 0 | 798 |
39
Operating Cost Estimate
The total operating cost for the Project is summarized in Table 0-4 and graphically presented in Figure 21-1.
Table 0-4 OPEX Summary
| Area |
Avg US$/yr
(000s) |
Avg. US$/t ROM | Avg. US$/t Product | % | |
| 000 | General – Subtotal | 3,888 | 11.62 | 19.01 | 20.69 |
| 000 | General and Administration | 2,615 | 7.81 | 12.78 | 13.92 |
| 000 | General - Utilities - Gas | 3 | 0.01 | 0.02 | 0.02 |
| 000 | General - Utilities - Power | 124 | 0.37 | 0.61 | 0.66 |
| 000 | General - Mobile Equipment lease | 168 | 0.50 | 0.82 | 0.89 |
| 000 | General - Consumables - Raw Water Pumping | 3 | 0.01 | 0.02 | 0.02 |
| 000 | General - Consumables - Diesel | 161 | 0.09 | 0.15 | 0.17 |
| 000 | General - Mobile Equip. Maintenance. | 161 | 0.48 | 0.79 | 0.86 |
| 000 | General - Labor | 782 | 2.34 | 3.82 | 4.16 |
| 100 | Mining – Subtotal | 2,960 | 8.84 | 14.47 | 15.75 |
| 100 | Contract Mining Cost | 2,616 | 7.82 | 12.79 | 13.92 |
| 100 | Owners Mining Cost | 344 | 1.03 | 1.68 | 1.83 |
| 200 | Processing Plant – Subtotal | 10,652 | 31.83 | 52.07 | 56.70 |
| 200 | Processing - Reagents | 1,165 | 3.48 | 5.69 | 6.20 |
| 200 | Processing - Maint. & Operating spares | 798 | 2.39 | 3.90 | 4.25 |
| 200 | Processing - Utilities | 3,869 | 11.56 | 18.91 | 20.59 |
| 200 | Processing - Consumables | 1,071 | 3.20 | 5.24 | 5.70 |
| 200 | Processing - Labor | 3,749 | 11.20 | 18.33 | 19.95 |
| 300 | Waste Management - Tailings | 449 | 1.34 | 2.19 | 2.39 |
| 400 | Product Handling – Bulk Bags | 840 | 2.51 | 4.11 | 4.47 |
| TOTAL OPERATING COST | 18,789 | 56.14 | 91.84 | 100.00 | |
Note: Based on nameplate 346,000 tpa throughput
The economic analysis was conducted over a range of discount rates, and results are presented in Table 0-5. Sensitivity analyses were conducted on the base case to demonstrate the sensitivity of the Project’s NPV to increases or decreases in the operating income, OPEX, CAPEX, recovery, and/or average product price.
Table 0-5 DCF Model Results
| Discount Rate (%) |
Post Tax NPV
(US$ millions) |
Pre Tax NPV
(US$ millions) |
| 4 | 300.6 | 460.8 |
| 6 | 249.8 | 385.8 |
| 8 | 208.1 | 324.4 |
At a 6% discount rate, the model shows a post-tax NPV of US$249.8 million with an IRR of 25.8%, and payback period of 3.7 years. This result reflects an economically feasible project, and justifies advancing to the next step of development
GBM considers that the Bovill Kaolin Project has demonstrated, to within ±15% accuracy, the potential to profitably mine and process the various ore deposits. A variety of end markets have been identified for the quartz, K-feldspar, metakaolin, and halloysite products produced by the proposed operation, with product pricing typical within the industrial minerals industry.
Of particular note is that all recovered material in the resource estimation contains sufficient sand, kaolinite, or halloysite to be profitably mined. In addition, the current mineral reserve estimate reflects limitations to existing, yet potentially expanding, markets as the mineral resource has the ability to support a larger operation.
Based on the mineral reserves and mine plan, approximately 5.3 million tons of mineral product will be produced over the anticipated mine life of 26 years. The economic analysis returned a post-tax NPV of US$249.8 million and an IRR of 25.8%.
The Project is most sensitive to product recovery rate and the average product price. The project is less sensitive to capital expenditure, process operating cost, and mining operating cost.
40
This result reflects a technically and economically feasible project, which GBM recommends to move to further investment and development.
Current Activities
Bovill Kaolin Project
Based on the results of the 2016 FS, which demonstrate that the Project is both technically and economically feasible, it is recommended that I-Minerals pursue a program of further investment and development to complete the engineering, procurement and construction of the Project. The following activities are recommended to be undertaken as early as possible in the next phase of development, as both have schedule and completion impacts:
- Confirmation testwork needs to be completed for final equipment selection, as well as to finalize the process plant water balance and utilities consumptions. The confirmation testwork is expected to cost about US$100,000 and take approximately 4 months to complete.
- Activities required to bring electricity and gas to the site should be expedited, as this currently impacts the overall project completion.
Pilot plant work is ongoing at MRL in North Carolina to confirm product quality characteristics and generate additional samples for our continued product marketing efforts. We have also initiated preliminary contact with institutional investors that may have an interest in participating in the debt or equity components of the Capital Costs. The detailed engineering and construction time is forecast to be a minimum of 18 months and a maximum of 30 months from the completion of the production financing to raise the capital costs as set out in the 2016 FS. The estimated cost for the completion of longer lead time engineering work, utilities surveys, marketing work and financing activities (general and admin) set forth below:
| Study Items | Project Costs |
| Project Management | $340,000 |
| Marketing | 540,000 |
| Conceptual Engineering | 100,000 |
| Environmental and Permitting | 120,000 |
| Electrical and Gas Studies | 100,000 |
| Hydrogeological Work | 60,000 |
| Metallurgical Testwork | 260,000 |
| General & Admin | 920,000 |
| Total Cost | $2,440,000 |
In addition to the above expenditures, we are reviewing the potential of undertaking a land swap with the IDL wherein we would buy a property within Latah County of equal value to our Helmer Bovill property and trade this property for the surface rights at Helmer Bovill. Owning the surface rights at Helmer Bovill may reduce the bonding requirements and strengthen our land tenure. The estimated cost of such land swap would be $3 to $4 million of which about 25% would need to be paid as earnest money in the next 12 months.
WBL Tailings Project
We plan to continue production of the sand tailings at the WBL Tailings Project. In April 2014, we entered into a new contract with Pre-Mix for the sale of up to 30,000 tons per annum of screened K-spar / quartz sand. Under the terms of the contract, Pre-Mix is solely responsible for the operating costs to process and remove the K-spar / quartz sand.
In order to excavate the sand tailings at the WBL Tailings Project, Pre-Mix uses its own backhoe, trucks and screen to remove the sand tailings. As a result, production facilities are not required to excavate the sand tailings from the WB Tailings Project.
41
To date, we have sold a total of 1,456 tons of sand tailings to Pre-Mix for total revenues of $1,456.
Item 3. Legal Proceedings.
Derivative Complaint
We were named as a defendant in a lawsuit in Latah County, State of Idaho, Case No. CV 2014-1306 (the “Latah County Lawsuit”). The plaintiffs who filed the Latah County Lawsuit, Hoodoo Resources, LLC (“Hoodoo”) and Brent Thomson as trustee for the Brent Thomson Family Trust (the “Thomson Family Trust”) (Hoodoo and the Thomson Family Trust are sometimes collectively referred to as the “Plaintiffs”), alleged both direct claims and derivative claims on behalf of Idaho Industrial Minerals, LLC (“IIM”). The Plaintiffs’ claims were initially brought on June 6, 2014, as third-party claims in response to a complaint filed against Hoodoo and the Thomson Family Trust by another IIM member, the Selling Security Holder, which owns a 25% interest in IIM. The Selling Security Holder’s lawsuit against Hoodoo and the Thomson Family Trust was filed in Ada County, State of Idaho, Case No. CV OC 1401549. The Selling Security Holder also filed a separate action against the Plaintiffs in Nez Perce County, State of Idaho, Case No. CV 14 02312.
On December 2, 2015, all of the foregoing lawsuits were settled pursuant to the terms of the Settlement Agreement. Under the terms of the Settlement Agreement, we paid IIM the aggregate sum of $100,000 (the “I-Minerals Payment”) for the release of any and all claims made against us under the lawsuits by the Ball Entities and the Plaintiffs. In addition, IIM and NWK expressly acknowledged and agreed that we have fulfilled all of our duties and obligations under the terms of the IIM Agreement relating to our Helmer-Bovill Property, and that any and all rights and claims of IIM and NWK to the mineral leases making up the Helmer-Bovill Property are released and extinguished.
Legal Action against Unimin
In July, 2014, we announced the engagement of Dr. Thomas Gallo, a former employee of Unimin Corporation (“Unimin”), as a consultant to oversee our ceramic test work and market development. On August 13, 2014, Unimin obtained a Temporary Restraining Order which restrained and enjoined Dr. Gallo from disclosing to us specifications of Unimin’s process in producing high purity quartz. On September 17, 2014, the North Carolina Court of Justice denied Unimin’s Motion for a Preliminary Injunction (the “P.I. Motion”) pursuant to Rule 65 of the North Carolina Rules of Civil Procedure and determined “Unimin has failed to present sufficient evidence to show that it is will succeed on the merits of its claims.” On December 2, 2014, Unimin filed a voluntary dismissal of its lawsuit against the Company and Dr. Gallo.
On March 24, 2015, we filed a suit for Abuse of Process, Malicious Prosecution and Unfair and Deceptive Trade Practices against Unimin arising out of the dismissed Injunction Action. All three claims are centered around I-Minerals’ contention that under the guise of a lawsuit to protect Unimin’s confidential, proprietary, and/or trade secret information, Unimin was actually attempting to gain information and documents from competitors, to interfere with the business relationships of competitors, to stifle lawful market competition, and to prevent Dr. Gallo from plying his general skills and knowledge in manufacturing high purity quartz. Unimin sought a Motion to Dismiss, but on September 18, 2015, Unimin’s efforts failed. In the words of Judge Max O. Connor of the United States District Court for the Western District of North Carolina: “The court finds that such allegations are more than sufficient to plausibly allege willful acts whereby Defendants allegedly sought to use the existence of the proceeding to gain advantage of the plaintiff in respect to a collateral matter.”
The purpose of our legal action is to attempt to recover costs, attorneys’ fees and other damages associated with what we believe are Abuse of Process, Malicious Prosecution and Unfair and Deceptive Trade Practices as noted above.
Item 4. Mine Safety Disclosures.
Pursuant to Section 1503(a) of the Dodd-Frank Wall Street Reform and Consumer Protection Act (The “Dodd-Frank Act”), issuers that are operators, or that have a subsidiary that is an operator, of a coal or other mine in the United States are required to disclose in their periodic reports filed with the SEC information regarding specified health and safety violations, orders and citations, related assessments and legal actions, and mining-related fatalities. During the fiscal year ended April 30, 2015, our U.S. exploration properties were not subject to regulation by the Federal Mine Safety and Health Administration (“MSHA”) under the Federal Mine Safety and Health Act of 1977 (the "Mine Act").
PART II
Item 5. Market for Registrant’s Common Equity, Related Stockholder Matters and Issuer Purchases of Equity Securities.
42
Holders of Our Shares
As of the date of this Form 10-K, there were 131 registered shareholders.
Market Information
Our common shares trade in Canada on the TSX Venture Exchange under the symbol “IMA,” and over-the-counter in the United States on the OTCQX marketplace under the symbol “IMAHF.” The following is the high and low close information for our common stock during each fiscal quarter of our last two fiscal years on the TSX Venture Exchange and the OTCQX. In June 2016 our shares ceased trading on the OTCQX and began trading on the OTCQB as a result of our change in accounting policy from International Financial Reporting Standards (IFRS) to US GAAP. Under US GAAP all property exploration costs must be expensed rather than capitalized to the balance sheet as is the accepted methodology under IFRS. As a result of the write off of the property costs we did not meet the OTCQX asset requirements whereas we would have, had we continued to report under IFRS.
| TSXV | OTCQX** | |||||||||||
| High | Low | High | Low | |||||||||
| CAD | USD* | CAD | USD* | USD | USD | |||||||
| Q1 ended Jul. 31, 2014 | $ | 0.38 | $ | 0.35 | $ | 0.19 | $ | 0.17 | $ | 0.28 | $ | 0.20 |
| Q2 ended Oct. 31, 2014 | $ | 0.23 | $ | 0.21 | $ | 0.19 | $ | 0.18 | $ | 0.31 | $ | 0.16 |
| Q3 ended Jan. 31, 2015 | $ | 0.27 | $ | 0.24 | $ | 0.18 | $ | 0.15 | $ | 0.17 | $ | 0.15 |
| Q4 ended Apr. 30, 2015 | $ | 0.245 | $ | 0.20 | $ | 0.135 | $ | 0.11 | $ | 0.21 | $ | 0.11 |
| Q1 ended Jul. 31, 2015 | $ | 0.28 | $ | 0.21 | $ | 0.28 | $ | 0.21 | $ | 0.22 | $ | 0.22 |
| Q2 ended Oct. 31, 2015 | $ | 0.28 | $ | 0.21 | $ | 0.26 | $ | 0.19 | $ | 0.20 | $ | 0.20 |
| Q3 ended Jan. 31, 2016 | $ | 0.26 | $ | 0.18 | $ | 0.25 | $ | 0.18 | $ | 0.18 | $ | 0.18 |
| Q4 ended Apr. 30, 2016 | $ | 0.295 | $ | 0.235 | $ | 0.195 | $ | 0.155 | $ | 0.22 | $ | 0.15 |
* Converted from
CAD to USD at the Bank of Canada noon rate for the particular closing date.
** High and
low bid information for the OTCQX was not available for the above periods. For
the periods presented, prices represent high and low closing prices during the
period.
Bid quotations entered on the OTCQX reflect inter-dealer prices, without retail mark-up, markdown or commission and may not represent actual transactions.
Dividend Rights
We have never declared, nor paid, any dividend since our incorporation and we do not foresee paying any dividend in the near future since all available funds will be used to conduct exploration activities. Any future payment of dividends will depend on our financing requirements and financial condition and other factors which the board of directors, in its sole discretion, may consider appropriate.
Under the Canada Business Corporations Act, we are prohibited from declaring or paying dividends if there are reasonable grounds for believing that:
| (a) | We are, or after the payment of the dividend, we would be, unable to pay our liabilities as they become due; or |
| (b) | The realizable value of our assets would, after giving effect to the dividend, be less than the aggregate of our liabilities and the stated capital of all classes. |
Equity Compensation Plan Information
The following table sets forth details of all our equity compensation plans as of April 30, 2016. As at April 30, 2016, our equity compensation plans consisted solely of our Stock Option Plan, which was approved by our shareholders on November 18, 2015.
43
| Plan Category | Number of securities to be issued upon exercise of outstanding options, warrants and rights | Weighted-average exercise price of outstanding options, warrants and rights | Number of securities remaining available for future issuance under equity compensation plans (excluding securities reflected in column (a)) |
| Equity compensation plans approved by security holders | 5,835,000 | CAD$0.20 | 2,797,895 |
| Equity compensation plans not approved by security holders | - | - | - |
| Total | 5,835,000 | CAD$0.20 | 2,797,895 |
Stock Option Plan
We received shareholder approval, on November 18, 2015, of our “rolling” stock option plan (the “Stock Option Plan”) whereby 10% of the number of our issued and outstanding shares at any given time may be reserved for issuance pursuant to the exercise of options. The TSX Venture Exchange requires that listed companies that have “rolling” stock option plans in place receive shareholder approval of such plans on a yearly basis at the Company’s annual general meeting.
The Stock Option Plan was established to provide incentive to directors, officers, employees, management company employees and consultants who are eligible to participate in the Stock Option Plan.
Terms of the Stock Option Plan
Options may be granted under the Stock Option Plan to such service providers of us and our affiliates, if any, as the Board of Directors may from time to time designate. The exercise price of option grants will be determined by the Board of Directors, but cannot be lower than the price permitted by the TSX Venture Exchange. The Stock Option Plan provides that the number of common shares that may be reserved for issuance to any one individual upon exercise of all stock options held by such individual may not exceed 5% of the issued common shares, if the individual is a director or officer, or 2% of the issued common shares, if the individual is a consultant or engaged in providing investor relations services, on a yearly basis. Subject to earlier termination, all options granted under the Stock Option Plan will expire not later than the date that is five years from the date that such options are granted. In the event that an optionee ceases to be a director, officer, employee or consultant, the option will terminate within ninety days. In the event of the death of an optionee, the options will only be exercisable within 12 months of such death. Options granted under the Stock Option Plan are not transferable or assignable other than by will or other testamentary instrument or pursuant to the laws of succession.
Sale of Unregistered Securities
All unregistered sales of equity securities during the period covered by the Annual Report were previously disclosed in our current reports on Form 8-K and our Quarterly Reports on Form 10-Q.
Item 6. Selected Financial Data.
None.
Item 7. Management’s Discussion and Analysis of Financial Condition and Results of Operations.
You should read the following discussion and analysis of our financial condition and results of operations together with our financial statements and related notes appearing elsewhere in this report. This discussion and analysis contains forward-looking statements that involve risks, uncertainties and assumptions. Our actual results may differ materially from those anticipated in these forward-looking statements as a result of many factors, including, but not limited to, those set forth under “Risk Factors and Uncertainties” and elsewhere in this document. See “Cautionary Note Regarding Forward-Looking Statements” above.
44
Plan of Operation
During the next twelve to eighteen months, our plan of operation is to complete the mine permitting and get all of the longer lead time engineering tasks such as the electricity and gas planning underway. In the interim we will continue to strengthen our customer list and continue discussions to raise the capital to fund the mine construction
Engineering work on the Bovill Kaolin Project
As recommended in the 2016 FS, we are about to begin the contemplated utility surveys and are undertaking additional pilot plant work to produce customer samples for marketing purposes and the related testwork for final equipment selection, as well as to finalize the process plant water balance and utilities consumptions. This work together with the General and Administrative expenses related in part to our continuing financing efforts are estimated to cost about US$2,440,000 before taking into consideration any possible land swap with the IDL.
Outlook
Our focus continues to be the detailed assessment of all of our mineral assets and advancing the Bovill Kaolin Project towards production. With the FS now completed, the next steps are the final permitting activities with the mine permit expected in the third calendar quarter of 2016.
A second bulk sample has been sent to Ginn Mineral Research with separation of the clay minerals (kaolin and halloysite) now complete. The sand fraction from the second bulk sample has been delivered to Minerals Research Laboratory at North Carolina State University (“MRL”). Processing of the sand fraction (quartz and K-spar) from the initial bulk sample is now completed at MRL. Samples of all quartz and K-spar products, including fine grind products, have been delivered to the company for distribution to prospective customers for testing purposes. The current round of pilot scale separations has also confirmed grades and separation characteristics of all areas of the deposits. The earlier processing of the bulk samples at Ginn Mineral Research created halloysite and metakaolin products samples for marketing purposes that are also being distributed for testing purposes. Interest from companies pursuing research and development of life science and polymer applications with our halloysite is particularly encouraging, MRL is also undertaking some optimization work on a bench scale to see how high a K2O feldspar product can be produced. Results to date are very encouraging with select bench scale results exceeding 14% K20, a very high potassium level for any K-spar. This work should be completed in the third calendar quarter of 2016 and is expected to transition to a multi-ton pilot plant.
Based upon opportunities identified in the Charles Rivers report, internal marketing efforts and customer leads generated through the website, strong interest has been generated in all of the Company’s mineral products with ever increasing interest in the K-spar. Samples continue to be sent to customers for testing and the response has generally been very favorable.
Results of Operation
Year ended April 30, 2016
We recorded a loss of $4,601,846 ($0.06 per share) for the year ended April 30, 2016 as compared to a loss of $2,006,836 ($0.03 per share) for the year ended April 30, 2015. The increase in the loss recorded in the year ended April 30, 2016 as compared to the year ended April 30, 2015 is the net result of changes to a number of expenses. Of note are the following items:
- Management and consulting fees of $245,755 (2015 - $414,180) are comprised of fees to manage our Company and stock-based compensation. The stock-based compensation recognized in the current period was $105,606 (2015 - $309,723). Approximately half of the fees to manage our Company are charged to management and consulting fees and the other half is charged to mineral property expenditures.
- Mineral property expenditures of $2,881,230 (2015 - $1,981,733) are costs incurred on our Helmer-Bovill Property. The main expenses incurred during the current year included engineering and consulting ($1,734,460) and mineral analysis and processing ($541,223). We were working on completing a feasibility study during the current year. In the prior year, the Company incurred $814,215 of engineering and consulting expenditures and mineral analysis and processing of $547,133 as part of updating the pre-feasibility study.
45
- General and miscellaneous expenses of $580,862 (2015 - $357,405) are comprised of office and telephone expenses, payroll taxes, medical benefits, insurance premiums, travel expenses, promotional expenses, shareholder communication fees, transfer agent fees and filing fees. The increase during the current year was due primarily to an increase marketing activities of our property as well as investor relations activities.
- Professional fees of $338,644 (2015 - $677,182) include legal fees, audit fees and financial consulting fees. The decrease in fees in the current year was due to the transition from IFRS to US GAAP during the prior year, as well as a reduction of legal fees relating to the IIM litigation and legal fees relating to the Unimin Temporary Restraining Order.
- Loss on settlement of liabilities of $31,512 (2015 – $nil) represents the change in fair value of common shares between the date the Company agreed to settled liabilities for common shares and the date that the common shares were ultimately issued. The Company used common shares to settle interest payable pursuant to promissory notes and second promissory notes.
- Accretion expense of $372,266 (2015 - $136,189) is the amortization of the fair value of bonus shares and bonus warrants issued to the lender of the promissory notes and the second promissory notes. The bonus shares and bonus warrants are amortized over the life of the promissory notes.
- Interest expense of $1,161,339 (2015 - $683,765) is from promissory notes and second promissory notes that bear interest at a rate of 12% per year. Interest increased as additional funds were advanced.
- We recorded a gain on change in fair value of derivative liabilities of $1,019,786 (2015 – gain of $2,246,040). The change in fair value of derivative liabilities is based on the change in remaining term of derivative instruments and our stock price. The derivatives include warrants as well as stock options granted to non-employees. The derivative liabilities do not represent cash liabilities.
Liquidity and Capital Resources
Our aggregate operating, investing and financing activities during the year ended April 30, 2016 resulted in a net cash outflow of $143,687 (2015 – outflow of $332,896). As at April 30, 2016, we had working capital deficiency of $7,930,867, including cash of $128,353. Included in the working capital deficiency are the Promissory Notes and the Second Promissory Notes which are due beginning in December 2016.
During the year ended April 30, 2016, we used $5,105,601 on cash flows from operations before changes in non-cash operating working capital items (2015 - $3,800,979). The increase in these cash flows was due primarily to an increase in mineral property expenditures. During the year ended April 30, 2016, we spent $nil on investing activities (2015 - $7,274) and we received $3,644,449 from financing activities (2015 - $2,859,185).
We are being financed by advances pursuant to Promissory Notes and Second Promissory Notes advanced by BV Lending LLC, an entity controlled by Allen L. Ball, a member of our Board of Directors and our largest shareholder. BV Lending agreed to advance up to $5,787,280 pursuant to the Promissory Notes. The final advance pursuant to the Promissory Notes was received in January 2015 and the balance due at April 30, 2016 was $5,787,280. On February 18, 2015, we entered into the Second Promissory Notes with BV Lending pursuant to which BV Lending agreed to advance up to an additional $4,463,000. On November 20, 2015, the Second Promissory Notes were amended with BV Lending agreeing to an advance an additional $1,000,000. The balance due pursuant to the Second Promissory Notes at April 30, 2016 was $5,257,000.
The Promissory Notes are due as to $3,000,000 on December 2, 2016 and the balance due on December 31, 2016. Certain conditions may result in early repayment.
The Second Promissory Notes mature as to $1,000,000 on December 2, 2016, $2,000,000 on June 2, 2017 and the balance due on December 2, 2017. Certain conditions may result in early repayment.
We have not as yet put into commercial production any mineral properties and as such have no operating revenues. Accordingly, we are dependent on debt and equity financing as its primary source of operating working capital. Our capital resources are largely determined by the strength of the junior resource markets and by the status of our projects in relation to these markets, and our ability to compete for investor support of our projects.
We remain dependent on additional financing to fund development requirements on the Helmer-Bovill property and for general corporate costs. With respect to funds required for capital cost items once a feasibility study is completed, State-sponsored debt financing instruments may be available on attractive terms, and we intend to pursue such financial instruments to cover portions of the capital costs associated with placing the Bovill Kaolin deposits into production.
We do not have the ability to internally generate sufficient cash flows to support our operations for the next twelve months. We are currently receiving funds from a company controlled by a director of the Company through promissory notes. We have no formal plan in place to address this going concern issue but consider that we will be able to obtain additional funds by equity financing and/or debt financing; however, there is no assurance of additional funding being available. As a result, our auditors have expressed substantial doubt in their auditors’ report in the financial statements for the year ended April 30, 2016 about our ability to continue as a going concern.
46
Off-Balance Sheet Arrangements
We have no significant off-balance sheet arrangements that have or are reasonably likely to have a current or future effect on our financial condition, changes in financial condition, revenues or expenses, results of operations, liquidity, capital expenditures or capital resources that is material to shareholders.
Critical Accounting Policies
Measurement Uncertainty
The preparation of these consolidated financial statements in conformity with US GAAP requires us to make estimates and assumptions that affect the reported amounts of assets and liabilities and disclosure of contingent assets and liabilities at the date of the consolidated financial statements and the reported amounts of revenues and expenses during the reporting period. We regularly evaluate estimates and assumptions related to the useful life and recoverability of long lived assets, stock-based compensation, valuation of convertible debentures and derivative liabilities, and deferred income tax asset valuation allowances. We base our estimates and assumptions on current facts, historical experience and various other factors that it believes to be reasonable under the circumstances, the results of which form the basis for making judgments about the carrying values of assets and liabilities and the accrual of costs and expenses that are not readily apparent from other sources. The actual results experienced by us may differ materially and adversely from our estimates. To the extent there are material differences between the estimates and the actual results, future results of operations will be affected. The most significant estimates with regard to our condensed consolidated financial statements relate to the determination of fair values of derivative liabilities and stock-based transactions.
Stock-based Compensation
We account for all stock-based payments and awards under the fair value based method. Stock-based payments to non-employees are measured at the fair value of the consideration received, or the fair value of the equity instruments issued, or liabilities incurred, whichever is more reliably measurable.
The fair value of stock-based payments to non-employees is periodically re-measured until the counterparty performance is complete, and any change therein is recognized over the vesting period of the award and in the same manner as if we had paid cash instead of paying with or using equity based instruments. The cost of the stock-based payments to non-employees that are fully vested and non-forfeitable as at the grant date is measured and recognized at that date, unless there is a contractual term for services in which case such compensation would be amortized over the contractual term.
We account for the granting of stock options to employees using the fair value method whereby all awards to employees will be recorded at fair value on the date of the grant. The fair value of all stock options is expensed over their vesting period with a corresponding increase to additional paid-in capital.
Compensation costs for stock-based payments that do not include performance conditions are recognized on a straight-line basis. Compensation cost associated with a share based award having a performance condition is recognized on the probable outcome of that performance condition during the requisite service period. Share based awards with a performance condition are accrued on an award by award basis.
We use the Black-Scholes option valuation model to calculate the fair value of stock options at the date of the grant. Option pricing models require the input of highly subjective assumptions, including the expected price volatility. Changes in these assumptions can materially affect the fair value estimates.
Derivative Liabilities
We evaluate our financial instruments and other contracts to determine if those contracts or embedded components of those contracts qualify as derivatives to be separately accounted for in accordance with ASC 815. The result of this accounting treatment is that the fair value of the embedded derivative is marked-to-market at each balance sheet date and recorded as a liability and the change in fair value is recorded in the consolidated statement of loss. Upon conversion or exercise of a derivative instrument, the instrument is marked to fair value at the conversion date and then that fair value is reclassified to equity.
The classification of derivative instruments, including whether such instruments should be recorded as liabilities or as equity, is re-assessed at the end of each reporting period. Derivative instruments that become subject to reclassification are reclassified at the fair value of the instrument on the reclassification date. Derivative instrument liabilities will be classified in the balance sheet as current or non-current based on whether or not settlement of the derivative instrument is expected within 12 months of the balance sheet date.
47
We use the Black-Scholes option valuation model to value derivative liabilities. This model uses Level 3 inputs in the fair value hierarchy established by ASC 820 Fair Value Measurement.
Item 7A. Quantitative and Qualitative Disclosures About Market Risk.
Not applicable.
48
Item 8. Financial Statements and Supplementary Data.
![]()
I-Minerals Inc.
Consolidated
Financial Statements
April
30, 2016 and 2015
(Expressed
in US dollars)
49
| Tel: 604 688 5421 Fax: 604 688 5132 www.bdo.ca |
BDO Canada LLP 600 Cathedral Place 925 West Georgia Street Vancouver BC V6C 3L2 Canada |
Report of Independent Registered Public Accounting Firm
To the Shareholders and Board of Directors
I-Minerals Inc.
We have audited the accompanying consolidated balance sheets of I-Minerals Inc. as of April 30, 2016 and 2015, and the related consolidated statements of loss, capital deficit, and cash flows for the years then ended. These financial statements are the responsibility of the Company’s management. Our responsibility is to express an opinion on these financial statements based on our audit.
We conducted our audits in accordance with the standards of the Public Company Accounting Oversight Board (United States). Those standards require that we plan and perform the audit to obtain reasonable assurance about whether the financial statements are free of material misstatement. The Company is not required to have, nor were we engaged to perform, an audit of its internal control over financial reporting. Our audit included consideration of internal control over financial reporting as a basis for designing audit procedures that are appropriate in the circumstances, but not for the purpose of expressing an opinion on the effectiveness of the Company’s internal control over financial reporting. Accordingly, we express no such opinion. An audit also includes examining, on a test basis, evidence supporting the amounts and disclosures in the financial statements, assessing the accounting principles used and significant estimates made by management, as well as evaluating the overall financial statement presentation. We believe that our audits provides a reasonable basis for our opinion.
In our opinion, the consolidated financial statements referred to above present fairly, in all material respects, the consolidated financial position of I-Minerals Inc. at April 30, 2016 and 2015, and the consolidated results of its operations and its consolidated cash flows for the years then ended, in conformity with accounting principles generally accepted in the United States of America.
The accompanying consolidated financial statements have been prepared assuming that the Company will continue as a going concern. As described in Note 1 to the consolidated financial statements, the Company had not yet achieved profitable operations as at April 30, 2016, had an accumulated deficit of $31,357,511 at April 30, 2016 and the Company expects to incur further losses in the development of its business. These conditions raise substantial doubt about the Company’s ability to continue as a going concern. Management’s plans in regard to these matters are also described in Note 1. The consolidated financial statements do not include any adjustments that might result from the outcome of this uncertainty.
/s/ BDO Canada LLP
Chartered Professional Accountants
Vancouver, Canada
July 26, 2016
BDO Canada LLP, a Canadian limited liability partnership, is a member of BDO International Limited, a UK company limited by guarantee, and forms part of the international BDO network of independent member firms.
50
|
I-Minerals Inc. Consolidated Balance Sheets April 30, 2016 and 2015 |
| (Expressed in US dollars) |
| Notes | 2016 $ |
2015 $ |
|||||
| ASSETS | |||||||
| Current assets | |||||||
| Cash | 128,353 | 272,040 | |||||
| Receivables | 21,747 | 33,500 | |||||
| Prepaids | 45,498 | 252,819 | |||||
| 195,598 | 558,359 | ||||||
| Equipment | 7,985 | 14,632 | |||||
| Mineral property interest | 3 | 305,850 | 305,850 | ||||
| Deposits | 14,932 | 14,932 | |||||
| TOTAL ASSETS | 524,365 | 893,773 | |||||
| LIABILITIES | |||||||
| Current liabilities | |||||||
| Accounts payable and accrued liabilities | 4,10 | 1,023,137 | 876,844 | ||||
| Promissory notes | 5 | 5,678,107 | - | ||||
| Second promissory notes | 6 | 909,419 | - | ||||
| Derivative liabilities | 2,7,8 | 515,802 | 1,245,456 | ||||
| 8,126,465 | 2,122,300 | ||||||
| Promissory notes | 5 | - | 5,543,991 | ||||
| Second promissory notes | 6 | 3,871,395 | 1,432,565 | ||||
| TOTAL LIABILITIES | 11,997,860 | 9,098,856 | |||||
| CAPITAL DEFICIT | |||||||
| Capital Stock | |||||||
| Authorized: | |||||||
| Unlimited common shares with no par value | |||||||
| Issued and fully paid: 86,328,952 (April 30, 2015 - 79,255,728) | 8 | 17,963,265 | 16,586,067 | ||||
| Additional paid-in capital | 1,839,639 | 1,827,780 | |||||
| Commitment to issue shares | 5,6 | 81,112 | 136,735 | ||||
| Deficit | (31,357,511 | ) | (26,755,665 | ) | |||
| TOTAL CAPITAL DEFICIT | (11,473,495 | ) | (8,205,083 | ) | |||
| TOTAL LIABILITIES AND CAPITAL DEFICIT | 524,365 | 893,773 |
On behalf of the Board
| “Thomas M. Conway” | Director | “W. Barry Girling” | Director |
The accompanying notes are an integral part of these consolidated financial statements.
51
|
I-Minerals Inc. Consolidated Statements of Loss For the years ended April 30, 2016 and 2015 |
| (Expressed in US dollars) |
| Notes | 2016 $ |
2015 $ |
|||||
| OPERATING EXPENSES | |||||||
| Amortization | 6,647 | 5,985 | |||||
| Management and consulting fees | 8,10 | 245,755 | 414,180 | ||||
| Mineral property expenditures | 2,881,230 | 1,981,733 | |||||
| General and miscellaneous | 580,862 | 357,405 | |||||
| Professional fees | 338,644 | 677,182 | |||||
| (4,053,138 | ) | (3,436,485 | ) | ||||
| OTHER (EXPENSE) INCOME | |||||||
| Foreign exchange (loss) gain | (3,377 | ) | 3,563 | ||||
| Loss on settlement of liabilities | 5,6 | (31,512 | ) | - | |||
| Accretion expense | 5,6 | (372,266 | ) | (136,189 | ) | ||
| Interest expense | 5,6 | (1,161,339 | ) | (683,765 | ) | ||
| Change in fair value of derivative liabilities | 2,7,8 | 1,019,786 | 2,246,040 | ||||
| LOSS FOR THE YEAR | (4,601,846 | ) | (2,006,836 | ) | |||
| Loss per share – basic and diluted | (0.06 | ) | (0.03 | ) | |||
| Weighted average number of shares outstanding | 83,299,436 | 77,666,169 |
The accompanying notes are an integral part of these consolidated financial statements.
52
|
I-Minerals Inc. Consolidated Statements of Cash Flows For the years ended April 30, 2016 and 2015 |
| (Expressed in US dollars) |
| 2016 $ |
2015 $ |
|||||
| OPERATING ACTIVITIES | ||||||
| Loss for the year | (4,601,846 | ) | (2,006,836 | ) | ||
| Items not involving cash: | ||||||
| Amortization | 6,647 | 5,985 | ||||
| Stock-based compensation | 105,606 | 309,723 | ||||
| Loss on settlement of liabilities | 31,512 | - | ||||
| Accretion expense | 372,266 | 136,189 | ||||
| Change in fair value of derivative liabilities | (1,019,786 | ) | (2,246,040 | ) | ||
| Change in non-cash operating working capital items: | ||||||
| Receivables | 11,753 | (21,886 | ) | |||
| Prepaids | 207,321 | (155,426 | ) | |||
| Accounts payable and accrued liabilities | 1,098,391 | 793,484 | ||||
| Cash flows used in operating activities | (3,788,136 | ) | (3,184,807 | ) | ||
| INVESTING ACTIVITIES | ||||||
| Deposits paid | - | (6,204 | ) | |||
| Purchase of equipment | - | (1,070 | ) | |||
| Cash flows used in investing activities | - | (7,274 | ) | |||
| FINANCING ACTIVITIES | ||||||
| Proceeds from exercise of stock options and warrants | 4,449 | 9,185 | ||||
| Promissory notes received | - | 1,233,000 | ||||
| Second promissory notes received | 3,640,000 | 1,617,000 | ||||
| Cash flows from financing activities | 3,644,449 | 2,859,185 | ||||
| DECREASE IN CASH | (143,687 | ) | (332,896 | ) | ||
| CASH, BEGINNING OF THE YEAR | 272,040 | 604,936 | ||||
| CASH, END OF THE YEAR | 128,353 | 272,040 | ||||
| SUPPLEMENTAL CASH FLOW INFORMATION (Note 12) | ||||||
| Interest paid | - | - | ||||
| Taxes paid | - | - |
The accompanying notes are an integral part of these consolidated financial statements.
53
|
I-Minerals Inc. Consolidated Statements of Capital Deficit For the years ended April 30, 2016 and 2015 |
| (Expressed in US dollars) |
| Number of Shares # |
Amount $ |
Commitment to Issue Shares $ |
Additional Paid-in Capital $ |
Accumulated Deficit $ |
Total Capital Deficit $ |
|||||||||||||
| Balance at April 30, 2014 | 76,019,706 | 15,935,039 | 79,223 | 1,548,395 | (24,748,829 | ) | (7,186,172 | ) | ||||||||||
| Issued during the year: | ||||||||||||||||||
| Shares issued pursuant to the exercise of stock options | 100,000 | 9,185 | - | - | - | 9,185 | ||||||||||||
| Shares issued as a debt discount | 772,760 | 168,000 | (79,223 | ) | - | - | 88,777 | |||||||||||
| Shares issuable as a debt discount | - | - | 136,735 | - | - | 136,735 | ||||||||||||
| Shares issued to settle accounts payable and accrued liabilities | 2,363,262 | 466,272 | - | 57,594 | - | 523,866 | ||||||||||||
| Transfer of value on exercise of stock options | - | 7,571 | - | (7,571 | ) | - | - | |||||||||||
| Share-based payments | - | - | - | 229,362 | - | 229,362 | ||||||||||||
| Loss for the year | - | - | - | - | (2,006,836 | ) | (2,006,836 | ) | ||||||||||
| Balance at April 30, 2015 | 79,255,728 | 16,586,067 | 136,735 | 1,827,780 | (26,755,665 | ) | (8,205,083 | ) | ||||||||||
| Issued during the year: | ||||||||||||||||||
| Shares issued as a debt discount | 1,832,108 | 409,031 | (136,735 | ) | - | - | 272,296 | |||||||||||
| Shares issuable as a debt discount | - | - | 81,112 | - | - | 81,112 | ||||||||||||
| Shares issued to settle accounts payable and accrued liabilities | 5,216,116 | 963,718 | - | 19,892 | - | 983,610 | ||||||||||||
| Shares issued on exercise of warrants | 25,000 | 4,449 | - | - | - | 4,449 | ||||||||||||
| Share-based payments – vesting | - | - | - | 3,333 | - | 3,333 | ||||||||||||
| Reallocation of vested options to liabilities | - | - | - | (11,366 | ) | - | (11,366 | ) | ||||||||||
| Loss for the year | - | - | - | - | (4,601,846 | ) | (4,601,846 | ) | ||||||||||
| Balance at April 30, 2016 | 86,328,952 | 17,963,265 | 81,112 | 1,839,639 | (31,357,511 | ) | (11,473,495 | ) |
The accompanying notes are an integral part of these consolidated financial statements.
54
|
I-Minerals Inc. Notes to the Consolidated Financial Statements For the years ended April 30, 2016 and 2015 |
| (Expressed in US dollars except where otherwise indicated) |
| 1. | NATURE OF BUSINESS AND BASIS OF PRESENTATION AND LIQUIDITY: |
| I-Minerals Inc. (the “Company”) was incorporated under the laws of British Columbia, Canada, in 1984. The Company is listed for trading on the TSX Venture Exchange under the symbol “IMA” and the OTCQX marketplace under the symbol “IMAHF”. |
| The Company’s principal business is the development of the Helmer-Bovill industrial mineral property (“the Property”) located in Latah County, Idaho. The Helmer-Bovill property is comprised of eleven mineral leases that host potentially economic deposits of feldspar, quartz and kaolinitic clays, primarily kaolinite and halloysite. |
| Basis of Presentation and Liquidity |
| The accompanying consolidated financial statements have been prepared by the Company in accordance with accounting principles generally accepted in the United States of America (“US GAAP”) on the basis that the Company will continue as a going concern, which assumes that the Company will be able to meet its obligations and continue its operations for the next year. Realization values may be substantially different from carrying values as shown and these financial statements do not give effect to adjustments that would be necessary to the carrying values and classification of assets and liabilities should the Company be unable to continue as a going concern. At April 30, 2016, the Company had not yet achieved profitable operations, had an accumulated deficit of $31,357,511 since inception and expects to incur further losses in the development of its business, all of which casts substantial doubt upon the Company’s ability to continue as a going concern and, therefore, that it may be unable to realize its assets and discharge its liabilities in the normal course of business. |
| The Company’s ability to continue as a going concern is dependent upon its ability to complete a feasibility study, to obtain the necessary financing to develop the Property and to meet its obligations and repay its liabilities arising from normal business operations when they come due. Although the Company has been successful in the past in obtaining financing, there is no assurance that it will be able to obtain adequate financing in the future or that such financing will be on terms advantageous to the Company. The Company is currently receiving funds from a company controlled by a director of the Company through promissory notes (Notes 5, 6 and 14). Management has no formal plan in place to address this concern but considers that the Company will be able to obtain additional funds by equity financing and/or promissory notes; however there is no assurance of additional funding being available. The Company has historically satisfied its capital needs primarily by issuing equity securities and/or promissory notes. Management plans to continue to provide for its capital needs by issuing equity securities and/or promissory notes. |
| 2. | SUMMARY OF SIGNIFICANT ACCOUNTING POLICIES: |
| Basis of Presentation and Principles of Consolidation |
| The consolidated financial statements include the accounts of the Company and its subsidiaries, i-Minerals USA, Inc. and CKD Ventures Ltd. All inter-company accounts and transactions have been eliminated. The Company’s fiscal year-end is April 30th. |
| Use of Estimates |
| The preparation of these consolidated financial statements in conformity with US GAAP requires management to make estimates and assumptions that affect the reported amounts of assets and liabilities and disclosure of contingent assets and liabilities at the date of the consolidated financial statements and the reported amounts of revenues and expenses during the reporting period. The Company regularly evaluates estimates and assumptions related to the useful life and recoverability of long lived assets, stock-based compensation, amortization of Promissory Notes and Second Promissory Notes financing fees, valuation of derivative liabilities, and deferred income tax asset valuation allowances. The Company bases its estimates and assumptions on current facts, historical experience and various other factors that it believes to be reasonable under the circumstances, the results of which form the basis for making judgments about the carrying values of assets and liabilities and the accrual of costs and expenses that are not readily apparent from other sources. The actual results experienced by the Company may differ materially and adversely from the Company’s estimates. To the extent there are material differences between the estimates and the actual results, future results of operations will be affected. |
55
|
I-Minerals Inc. Notes to the Consolidated Financial Statements For the years ended April 30, 2016 and 2015 |
| (Expressed in US dollars except where otherwise indicated) |
| Cash |
| The Company considers all highly liquid instruments with maturity of three months or less at the time of issuance to be cash equivalents. As at April 30, 2016 and 2015, the Company had no cash equivalents. |
| Equipment |
| Equipment is carried at cost and is amortized over the estimated useful economic lives using the declining balance method at an annual rate of 30%. |
| Mineral Property Acquisition Costs |
| Mineral property acquisition costs are capitalized when incurred and will be amortized using the units-of-production method following the commencement of production. If a mineral property is subsequently abandoned or impaired, any capitalized costs will be expensed in the period of abandonment or impairment. The Company’s property has yet to reach the production stage. |
| Acquisition costs include cash consideration and the fair market value of shares issued on the acquisition of mineral property claims. |
| Mineral Property Exploration Costs |
| Mineral property exploration costs are expensed as incurred. When it has been determined that a mineral property can be economically developed as a result of establishing proven and probable reserves and all permits are received, the costs incurred to develop such property are capitalized. Such costs will be amortized using the units-of-production method over the estimated useful life of the probable reserve. If mineral properties are subsequently abandoned or impaired, any capitalized costs will be charged to operations. |
| Impairment of Long-Lived Assets |
| Management tests long-lived assets to be held and used for recoverability whenever events or changes in circumstances indicate that their carrying amount may not be recoverable. Impairment is considered to exist if the future cash flows on an undiscounted basis are less than the carrying amount of the long-lived asset. An impairment loss is measured and recorded based on the difference between book value and fair value of the asset group, as determined through the application of a present value technique using expected future cash flows to estimate fair value in the absence of a market price. In estimating future cash flows, assets are grouped at the lowest level for which there is identifiable cash flows that are largely independent of cash flows from other asset groups. |
| Debt Issuance Costs |
| Debt issue costs in connection with debt financings are capitalized as an asset and amortized over the term of the debt using the effective interest method. |
| Debt issuance costs paid to the purchaser of the debt are considered to be a reduction of the debt proceeds and a component of debt discount. Subsequently, the costs comprising this debt discount are amortized as financing fees over the term of the promissory notes using the effective interest method. During the year ended April 30, 2016, the Company amortized financing fees totaling $372,266 (2015 – $136,189). |
56
|
I-Minerals Inc. Notes to the Consolidated Financial Statements For the years ended April 30, 2016 and 2015 |
| (Expressed in US dollars except where otherwise indicated) |
| Financial Instruments and Fair Value Measures |
| The book value of cash, accounts receivable, accounts payable and accrued liabilities approximate their fair values due to the immediate or short-term maturity of those instruments. The fair value hierarchy under US GAAP is based on three levels of inputs, of which the first two are considered observable and the last unobservable, that may be used to measure fair value which are the following: |
| Level 1 - | quoted prices (unadjusted) in active markets for identical assets or liabilities; |
| Level 2 - | observable inputs other than Level I, quoted prices for similar assets or liabilities in active prices whose inputs are observable or whose significant value drivers are observable; and |
| Level 3 - | assets and liabilities whose significant value drivers are unobservable by little or no market activity and that are significant to the fair value of the assets or liabilities. |
| The Company’s Promissory Notes and Second Promissory Notes are based on Level 2 inputs in the ASC 820 fair value hierarchy. The Company calculated the fair value of these instruments by discounting future cash flows using rates representative of current borrowing rates. At April 30, 2016, the Promissory Notes had a fair value of $5,659,462 (2015 – $5,479,007) and the Second Promissory Notes had a fair value of $5,044,374 (2015 - $1,532,123). |
| The Company had certain Level 3 liabilities required to be recorded at fair value on a recurring basis in accordance with US GAAP as at April 30, 2016 and 2015. As at April 30, 2016, the Company’s Level 3 liabilities consisted of the warrants issued in connection with the Company’s offering of equity units in a private placement and warrants issued as financing fees as well as the grant of share purchase options to non-employees. |
| The resulting Level 3 liabilities have no active market and are required to be measured at their fair value each reporting period based on information that is unobservable. |
| A summary of the Company’s Level 3 liabilities for the years ended April 30, 2016 and 2015 is as follows: |
| 2016 $ |
2015 $ |
||||||
| Warrants (Note 7) | |||||||
| Beginning fair value | 1,128,841 | 3,211,386 | |||||
| Issuance | 176,493 | 130,890 | |||||
| Change in fair value | (978,739 | ) | (2,213,435 | ) | |||
| Ending fair value | 326,595 | 1,128,841 | |||||
| Non-employee options (Note 8(c)) | |||||||
| Beginning fair value | 116,615 | 68,859 | |||||
| Fair value of options granted | 102,273 | - | |||||
| Fair value of options on vesting | 11,366 | 80,361 | |||||
| Change in fair value | (41,047 | ) | (32,605 | ) | |||
| Ending fair value | 189,207 | 116,615 | |||||
| Total Level 3 liabilities | 515,802 | 1,245,456 |
| Certain assets and liabilities are measured at fair value on a nonrecurring basis; that is, the instruments are not measured at fair value on an ongoing basis but are subject to fair value adjustments only in certain circumstances (for example, when there is evidence of impairment). There were no assets or liabilities measured at fair value on a nonrecurring basis during the years ended April 30, 2016 and 2015. |
57
|
I-Minerals Inc. Notes to the Consolidated Financial Statements For the years ended April 30, 2016 and 2015 |
| (Expressed in US dollars except where otherwise indicated) |
| Earnings (Loss) Per Share |
| The basic loss per common share is computed by dividing net loss available to common stockholders by the weighted average number of common shares outstanding. Diluted loss per common share is computed similar to basic loss per common share except that the denominator is increased to include the number of additional common shares that would have been outstanding if the potential common shares had been issued and if the additional common shares were dilutive. For the year ended April 30, 2016, loss per share excludes 12,027,780 (2015 – 30,384,168) potentially dilutive common shares (related to outstanding options and warrants) as their effect was anti-dilutive. |
| Foreign Currency Translation |
| The Company’s functional and reporting currency is the US dollar. Monetary assets and liabilities denominated in foreign currencies are translated using the exchange rate prevailing at the balance sheet date and non-monetary items are translated at exchange rates prevailing when the assets were acquired or obligations incurred. Gains and losses arising on translation or settlement of foreign currency denominated transactions or balances are included in the determination of income. |
| Income Taxes |
| The Company accounts for income taxes using the asset and liability method. The asset and liability method provides that deferred tax assets and liabilities are recognized for the expected future tax consequences of temporary differences between the financial reporting and tax bases of assets and liabilities, and for operating loss and tax credit carry-forwards. Deferred tax assets and liabilities are measured using the currently enacted tax rates and laws that will be in effect when the differences are expected to reverse. The Company records a valuation allowance to reduce deferred tax assets to the amount that is believed more likely than not to be realized. |
| The Company has adopted the provisions of FASB ASC 740 "Income Taxes" regarding accounting for uncertainty in income taxes. The Company initially recognizes tax positions in the financial statements when it is more likely than not the position will be sustained upon examination by the tax authorities. Such tax positions are initially and subsequently measured as the largest amount of tax benefit that is greater than 50% likely of being realized upon ultimate settlement with the tax authority, assuming full knowledge of the position and all relevant facts. Application requires numerous estimates based on available information. The Company considers many factors when evaluating and estimating its tax positions and tax benefits, and its recognized tax positions and tax benefits may not accurately anticipate actual outcomes. As additional information is obtained, there may be a need to periodically adjust the recognized tax positions and tax benefits. These periodic adjustments may have a material impact on the consolidated statements of operations. When applicable, the Company classifies penalties and interest associated with uncertain tax positions as a component of income tax expense in its consolidated Statement of Income (Loss). |
| Stock-Based Compensation |
| The Company accounts for all stock-based payments and awards under the fair value based method. Stock-based payments to non-employees are measured at the fair value of the consideration received, or the fair value of the equity instruments issued, or liabilities incurred, whichever is more reliably measurable. |
| The fair value of stock-based payments to non-employees is periodically re-measured until the counterparty performance is complete, and any change therein is recognized over the vesting period of the award and in the same manner as if the Company had paid cash instead of paying with or using equity based instruments. The cost of the stock-based payments to non-employees that are fully vested and non-forfeitable as at the grant date is measured and recognized at that date, unless there is a contractual term for services in which case such compensation would be amortized over the contractual term. |
58
|
I-Minerals Inc. Notes to the Consolidated Financial Statements For the years ended April 30, 2016 and 2015 |
| (Expressed in US dollars except where otherwise indicated) |
| The Company accounts for the granting of stock options to employees using the fair value method whereby all awards to employees will be recorded at fair value on the date of the grant. The fair value of all stock options is expensed over their vesting period with a corresponding increase to additional paid-in capital. |
| Compensation costs for stock-based payments that do not include performance conditions are recognized on a straight-line basis. Compensation cost associated with a share based award having a performance condition is only recognized over the requisite service period if it is probable. Share based awards with a performance condition are accrued on an award by award basis. |
| The Company uses the Black-Scholes option valuation model to calculate the fair value of stock options at the date of the grant. Option pricing models require the input of highly subjective assumptions, including the expected price volatility. Changes in these assumptions can materially affect the fair value estimates. |
| Derivative Liabilities |
| The Company evaluates its financial instruments and other contracts to determine if those contracts or embedded components of those contracts qualify as derivatives to be separately accounted for in accordance with ASC 815. The result of this accounting treatment is that the fair value of the embedded derivative is marked-to-market at each balance sheet date and recorded as a liability and the change in fair value is recorded in the consolidated statement of loss. Upon conversion or exercise of a derivative instrument, the instrument is marked to fair value at the conversion date and then that fair value is reclassified to equity. |
| The classification of derivative instruments, including whether such instruments should be recorded as liabilities or as equity, is re-assessed at the end of each reporting period. Derivative instruments that become subject to reclassification are reclassified at the fair value of the instrument on the reclassification date. Derivative instrument liabilities will be classified in the balance sheet as current or non-current based on whether or not settlement of the derivative instrument is expected within 12 months of the balance sheet date. |
| The Company uses the Black-Scholes option valuation model to value derivative liabilities. This model uses Level 3 inputs in the fair value hierarchy established by ASC 820 Fair Value Measurement. |
| Concentration of Risk |
| The Company is subject to interest rate risk on its debt financings. The Company generally uses fixed interest rates for sources of debt financing with the objective of minimizing its cost of borrowing. |
| Comparative Figures |
| Certain of the prior period’s figures may have been reclassified in conformity with the current period’s financial statement presentation. |
| New Accounting Pronouncements |
| (i) Effective August 2014, FASB issued Accounting Standards update (“ASU”) 2014-15, Presentation of Financial Statements – Going Concern (Subtopic 205-40 –Disclosure of Uncertainties about an Entity’s Ability to Continue as a Going Concern. The update essentially requires management of all entities, for annual and interim periods, to evaluate whether there are conditions or events, considered in the aggregate, that raise substantial doubt about the entity’s ability to continue as a going concern within one year after the date the financial statements are issued. |
| If conditions or events raise substantial doubt about an entity’s ability to continue as a going concern, but the substantial doubt is alleviated as a result of consideration of management’s plans, the entity should disclose information that enables users of the financial statements to understand all of the following: |
| 1. | Principal conditions or events that raised substantial doubt about the entity’s ability to continue as a going concern (before consideration of management’s plans). |
| 2. | Management’s evaluation of the significance of those conditions or events in relation to the entity’s ability to meet its obligations. |
| 3. | Management’s plans that alleviated substantial doubt about the entity’s ability to continue as a going concern. |
59
|
I-Minerals Inc. Notes to the Consolidated Financial Statements For the years ended April 30, 2016 and 2015 |
| (Expressed in US dollars except where otherwise indicated) |
| If conditions or events raise substantial doubt about an entity’s ability to continue as a going concern, and substantial doubt is not alleviated after consideration of management’s plans, an entity should include a statement in the footnotes indicating that there is substantial doubt about the entity’s ability to continue as a going concern within one year after the date that the financial statements are issued (or available to be issued). Additionally, the entity should disclose information that enables users of the financial statements to understand all of the following: |
| 1. | Principal conditions or events that raise substantial doubt about the entity’s ability to continue as a going concern. |
| 2. | Management’s evaluation of the significance of those conditions or events in relation to the entity’s ability to meet its obligations. |
| 3. | Management’s plans that are intended to mitigate the conditions or events that raise substantial doubt about the entity’s ability to continue as a going concern. |
| This update will come into effect for the annual period ending after December 15, 2016, and for annual periods and interim periods thereafter. The Company is assessing the impact of this standard. |
| (ii) In February, 2015, the FASB issued ASU 2015-02, Consolidation (Topic 810) – Amendments to the Consolidation Analysis which focuses on the consolidation evaluation for reporting organizations (public and private companies and not-for-profit organizations) that are required to evaluate whether they should consolidate certain legal entities. In addition to reducing the number of consolidation models from four to two, the new standard simplifies the standards and improves current GAAP by: |
|
| The ASU will be effective for periods beginning after December 15, 2015, for public companies. Early adoption is permitted, including adoption in an interim period. The Company is assessing the impact of this standard. |
| 3. | MINERAL PROPERTY INTEREST: |
| Helmer-Bovill Property – Latah County, Idaho |
| The Company entered into a purchase and sale agreement with Idaho Industrial Minerals LLC (“IIM”), a company in which one of the Company’s directors has a 25% interest, under which the Company had the right to acquire a 100% interest in 11 lease applications that comprise the Helmer-Bovill property by issuing to IIM a total of 1,750,000 shares of the Company. During fiscal 2009, 50,000 shares were issued in return for an extension of the agreement. During fiscal 2010, the terms of the agreement were further amended and the agreement was extended until August 2013. Under the terms of the amended agreement, the shares were to be issued based on certain development-based benchmarks being attained as follows: |
|
60
|
I-Minerals Inc. Notes to the Consolidated Financial Statements For the years ended April 30, 2016 and 2015 |
| (Expressed in US dollars except where otherwise indicated) |
| On January 21, 2013, the Company issued the final 1,300,000 shares to IIM. With the issuances of the final tranches of shares, the Company has now fulfilled all its obligations under the purchase and sale agreement with IIM (Note 11). |
| During the year ended April 30, 2012, the Company acquired an undivided 100% interest in two State of Idaho mineral leases contiguous to the Helmer-Bovill Property. The Company paid $10,000 and issued 50,000 shares at the fair value of $15,170. |
| The State of Idaho mineral leases are subject to a 5% production royalty on gross sales. |
| 4. | ACCOUNTS PAYABLE AND ACCRUED LIABILITIES: |
| April 30, 2016 $ |
April 30, 2015 $ |
||||||
| Trade payables | 307,316 | 383,977 | |||||
| Amounts due to related parties (Note 10) | 189,501 | 175,789 | |||||
| Interest payable on promissory notes and second promissory notes | 526,320 | 317,078 | |||||
| Total accounts payable and accrued liabilities | 1,023,137 | 876,844 |
| 5. | PROMISSORY NOTES: |
| April 30, 2016 $ |
April 30, 2015 $ |
||||||
| Promissory notes | 5,678,107 | 5,543,991 | |||||
| Total promissory notes | 5,678,107 | 5,543,991 |
| On September 13, 2013 and January 27, 2014, the Company entered into agreements with a company controlled by a director of the Company (the “Lender”) pursuant to which $5,787,280 was advanced to the Company in tranches (the “Promissory Notes”). The Promissory Notes were to mature as to $1,000,000 on December 31, 2015, $2,000,000 on June 30, 2016 and the balance due on December 31, 2016. On December 4, 2014, the maturity dates of the Promissory Notes were amended so that the maturity dates are the later of the original maturity dates and one year after resolution of the IIM litigation. The IIM litigation was settled on December 2, 2015. The Company recorded this amendment of the terms of the debt as a modification of debt having no impact on the Company’s Statement of Loss. The Promissory Notes now mature as to $3,000,000 on December 2, 2016 and the balance due on December 31, 2016. Certain conditions may result in early repayment including immediate repayment in the event a person currently not related to the Company acquires more than 40% of the outstanding common shares of the Company. |
| The following table outlines the estimated cash payments required in order to repay the principal balance of the Promissory Notes: |
| 2017 $ |
2018 $ |
2019 $ |
2020 $ |
2021 $ |
Total $ |
|
| 5,787,280 | - | - | - | - | 5,787,280 |
| The Promissory Notes bear interest at the rate of 12% per annum and during the year ended April 30, 2016, the Company recorded interest of $696,376 (2015 - $653,319). Interest is payable semi-annually as calculated on May 31st and November 30th. Interest is to be paid either in cash or in common shares at the option of the Lender. In July 2015, the Company settled $345,616 of interest payable on the Promissory Notes by the issuance of 1,980,840 common shares at the fair value of $373,142 based on their quoted market price at the date of issuance. Accordingly, the Company recorded a loss on settlement of liabilities of $27,526. The interest settled was for the period from December 1, 2014 to May 31, 2015. In December 2015, the Company settled $348,188 of interest payable by the issuance of 1,844,982 common shares at the fair value of $335,741. The Company recorded an increase in additional paid-in capital on extinguishment of debt of $12,447. The interest settled was for the period from June 1, 2015 to November 30, 2015. |
61
|
I-Minerals Inc. Notes to the Consolidated Financial Statements For the years ended April 30, 2016 and 2015 |
| (Expressed in US dollars except where otherwise indicated) |
| During the year ended April 30, 2015, the Company settled $523,866 of interest payable on the Promissory Notes by the issuance of 2,363,262 common shares at the fair value of $466,272 based on their quoted market price at the date of issuance. Accordingly, the Company recorded an increase in additional paid-in capital on extinguishment of debt of $57,594. The interest settled was for the period from January 1, 2014 to November 30, 2014. |
| The Company and the Lender agreed that the Lender would receive bonus shares equal to 6% of each loan tranche advanced divided by the Company’s common share market price where, for purposes of calculating the number of shares issuable for each loan tranche, the Company’s common share market share price is discounted by 25% as allowed by regulation. The amount of bonus shares issued were subject to a minimum price of CAD$0.105 and a maximum of 1,720,649 bonus shares. In addition, the Company would issue the Lender an equal number of share purchase warrants for each loan tranche advanced. Each bonus share purchase warrant entitles the Lender to purchase one common share of the Company at a price equal to the greater of (a) the market price of the Company’s common shares on the date of the advance and (b) the volume weighted average price of the Company’s common shares over the twenty trading days immediately prior to the date of the advance. The bonus share purchase warrants expire on the earlier of (a) December 1, 2016 and (b) the date the advance has been repaid in full, including interest. |
| During the year ended April 30, 2016, the Company issued 13,588 bonus shares to the Lender at the fair value of $2,640, based on their quoted market price at the date the advances were received. At April 30, 2015, the $2,640 was recorded in commitment to issue shares. |
| During the year ended April 30, 2015, the Company issued 772,760 bonus shares to the Lender at the fair value of $168,000, based on their quoted market price at the date the advances were received, including 313,350 shares having a fair value of $79,223 that the Company had previously committed to issue. The Company was committed to issuing an additional 13,588 bonus shares to the Lender at the fair value of $2,640. The fair value of the bonus shares was determined by reference to the trading price of the Company’s common shares on the date the advances were received. |
| The fair value of 472,998 bonus share purchase warrants committed to be issued (based on advances received during the period) during the year ended April 30, 2015 of $60,161 was estimated using the Black-Scholes option pricing model with the following weighted average assumptions: stock price – CAD$0.23; exercise price – CAD$0.24; expected risk-free interest rate – 1.15%; expected life – 2.2 years; expected volatility – 113% and expected dividend rate – 0%. |
| The aggregate finance fees (bonus shares and bonus warrants) are recorded against the Promissory Notes balance and are being amortized to the Statement of Loss over the life of the Promissory Notes, based on the later of the original maturity dates and one year after the resolution of the IIM litigation using the effective interest method. The unamortized debt discount as at April 30, 2016 is $109,173 (2015 – $243,289). |
| The Promissory Notes are collateralized by the Company’s Helmer-Bovill Property. |
| 6. | SECOND PROMISSORY NOTES: |
| April 30, 2016 $ |
April 30, 2015 $ |
||||||
| Second promissory notes | 4,780,814 | 1,432,565 | |||||
| Total second promissory notes | 4,780,814 | 1,432,565 |
62
|
I-Minerals Inc. Notes to the Consolidated Financial Statements For the years ended April 30, 2016 and 2015 |
| (Expressed in US dollars except where otherwise indicated) |
| On February 18, 2015, the Company entered into an agreement with a company controlled by a director of the Company (the “Lender”) pursuant to which up to $4,463,000 will be advanced to the Company in tranches (the “Second Promissory Notes”). On December 1, 2015, the Company entered into an amending agreement whereby the Lender agreed to advance an additional $1,000,000 in tranches. As at April 30, 2016, $5,257,000 had been advanced to the Company. The Second Promissory Notes mature as to $1,000,000 on December 2, 2016, $2,000,000 on June 2, 2017 and the balance due on December 2, 2017. Certain conditions may result in early repayment including immediate repayment in the event a person currently not related to the Company acquires more than 40% of the outstanding common shares of the Company. Debt issuance costs will be amortized over the estimated maturity life of the promissory notes. |
| The following table outlines the estimated cash payments required in order to repay the principal balance of the Second Promissory Notes: |
| 2017 $ |
2018 $ |
2019 $ |
2020 $ |
2021 $ |
Total $ |
|
| 1,000,000 | 4,257,000 | - | - | - | 5,257,000 |
| The Second Promissory Notes bear interest at the rate of 12% per annum and during the year ended April 30, 2016, the Company recorded interest of $464,963 (2015 - $30,446). Interest is payable semi-annually as calculated on May 31st and November 30th. Interest is to be paid either in cash or in common shares at the option of the Lender. In July 2015, the Company settled $50,049 of interest payable on the Second Promissory Notes by the issuance of 286,845 common shares at the fair value of $54,035. Accordingly, the Company recorded a loss on settlement of liabilities of $3,986. The interest settled was for the period from January 8, 2015 to May 31, 2015. In December 2015, the Company settled $208,245 of interest payable by the issuance of 1,103,449 common shares at the fair value of $200,800. The Company recorded an increase in additional paid-in capital on extinguishment of debt of $7,445. The interest settled was for the period from June 1, 2015 to November 30, 2015. |
| The Company and the Lender agreed that the Lender is to receive bonus shares equal to 7.5% of each loan tranche advanced divided by the Company’s common share market price. In addition, the Company will issue the Lender an equal number of share purchase warrants for each loan tranche advanced. Each bonus share purchase warrant will entitle the Lender to purchase one common share of the Company at a price equal to the greater of (a) the market price of the Company’s common shares on the date of the advance and (b) the volume weighted average price of the Company’s common shares over the twenty trading days immediately prior to the date of the advance. The bonus share purchase warrants expire on the earlier of (a) December 31, 2018 and (b) the date the advance has been repaid in full, including interest. |
| During the year ended April 30, 2016, the Company issued 1,818,520 bonus shares to the Lender at the fair value of $406,391, based on their quoted market price at the date the advances were received, including 679,985 shares having a fair value of $134,095 that the Company had committed to issue as at April 30, 2015. At April 30, 2016, the Company was committed to issuing an additional 349,325 bonus shares to the Lender at the fair value of $81,112. The fair value of the bonus shares was determined by reference to the trading price of the Company’s common shares on the date the advances were received. |
| The fair value of 1,487,860 bonus share purchase warrants committed to be issued (based on advances received during the period) during the year ended April 30, 2016 of $176,493 was estimated using the Black-Scholes option pricing model with the following weighted average assumptions: stock price – CAD$0.225; exercise price – CAD$0.268; expected risk-free interest rate – 0.96%; expected life – 1.41 years; expected volatility – 76% and expected dividend rate – 0%. |
63
|
I-Minerals Inc. Notes to the Consolidated Financial Statements For the years ended April 30, 2016 and 2015 |
| (Expressed in US dollars except where otherwise indicated) |
| The fair value of 679,985 bonus share purchase warrants committed to be issued (based on advances received during the period) during the year ended April 30, 2015 of $70,729 was estimated using the Black-Scholes option pricing model with the following weighted average assumptions: stock price – CAD$0.20; exercise price – CAD$0.22; expected risk-free interest rate – 1.17%; expected life – 3.8 years; expected volatility – 96% and expected dividend rate – 0%. |
| The aggregate finance fees (bonus shares and bonus warrants) are recorded against the Second Promissory Notes balance and are being amortized to the Statement of Loss over the life of the Second Promissory Notes, based on two years after the resolution of the IIM litigation, using the effective interest method. The unamortized debt discount as at April 30, 2016 is $476,186 (2015 – $184,435). |
| The Second Promissory Notes are collateralized by the Company’s Helmer-Bovill Property. |
| 7. | WARRANT LIABILITIES: |
| The Company has share purchase warrants exercisable into common shares at an exercise price denominated in Canadian dollars. As a variable amount of US dollars are exercisable into a fixed number of common shares, the share purchase warrants are classified as derivative liabilities. |
| The Company records the fair value of the share purchase warrants in accordance with ASC 815, “Derivatives and Hedging”. The Company uses the Black-Scholes option pricing model to calculate the fair values of the derivative liabilities. The fair value of the derivative liability is revalued on each balance sheet date with corresponding gains and losses recorded in the consolidated statement of loss. |
| $ | ||||
| Balance, April 30, 2014 | 3,211,386 | |||
| Bonus warrants issuable pursuant to Promissory Notes (Note 5) | 60,161 | |||
| Bonus warrants issuable pursuant to Second Promissory Notes (Note 6) | 70,729 | |||
| Change in fair value of warrant derivatives | (2,213,435 | ) | ||
| Balance, April 30, 2015 | 1,128,841 | |||
| Bonus warrants issuable pursuant to Second Promissory Notes (Note 6) | 176,493 | |||
| Change in fair value of warrant derivatives | (978,739 | ) | ||
| Balance, April 30, 2016 | 326,595 |
| Warrant Derivative Liabilities |
| At April 30, 2016, the Company determined the fair value of Warrant Derivative Liabilities to be $326,595 (2015 - $1,128,841) as estimated using the Black-Scholes option pricing model with the following weighted average assumptions: |
| 2016 | 2015 | ||||||
| Stock price (CAD$) | 0.23 | 0.25 | |||||
| Exercise price (CAD$) | 0.27 | 0.38 | |||||
| Risk-free interest rate (%) | 0.96 | 1.11 | |||||
| Expected life (years) | 1.41 | 0.79 | |||||
| Expected volatility (%) | 76 | 87 | |||||
| Expected dividends ($) | Nil | Nil |
64
|
I-Minerals Inc. Notes to the Consolidated Financial Statements For the years ended April 30, 2016 and 2015 |
| (Expressed in US dollars except where otherwise indicated) |
| 8. | SHARE CAPITAL: |
| Common shares |
| a) | Authorized: |
| Unlimited number of common shares, without par value. |
| The holders of common shares are entitled to receive dividends which are declared from time to time, and are entitled to one vote per share at meetings of the Company. All shares are ranked equally with regards to the Company’s residual assets. |
| b) | Stock transactions: |
| During the year ended April 30, 2016, the Company completed the following stock transactions: |
| i) | On July 10, 2015, the Company issued 1,085,297 common shares with a fair value of $228,775 including 693,573 shares having a fair value of $136,735 which the Company had committed to issue at April 30, 2015. The common shares were issued as debt discounts pursuant to the Promissory Notes and the Second Promissory Notes (Notes 5 and 6). |
| ii) | On July 14, 2015, the Company issued 2,267,685 common shares with a fair value of $427,177 as settlement of accrued interest payable on Promissory Notes and Second Promissory Notes (Notes 5 and 6). |
| iii) | On December 15, 2015, the Company issued 2,948,431 common shares with a fair value of $536,541 as settlement of accrued interest payable on Promissory Notes and Second Promissory Notes (Notes 5 and 6). |
| iv) | On January 5, 2016, the Company issued 746,811 common shares with a fair value of $180,256. The common shares were issued as debt discounts pursuant to the Second Promissory Notes (Note 6). |
| v) | On January 29, 2016, the Company issued 25,000 shares on the exercise of share purchase warrants. |
| During the year ended April 30, 2015, the Company completed the following stock transactions: |
| i) | On May 7, 2014, the Company issued 100,000 common shares on the exercise of stock options with an exercise price of CAD$0.10 per common share resulting in gross proceeds of CAD$10,000 ($9,185). |
| ii) | On July 31, 2014, the Company issued 412,193 common shares with a fair value of $96,000 including 313,350 shares having a fair value of $79,223 for which the Company had committed to issue at April 30, 2014. The common shares were issued as a debt discount pursuant to the Promissory Notes. |
| iii) | On August 12, 2014, the Company issued 741,233 common shares with a fair value of $152,701 as settlement of accrued interest payable on Promissory Notes (Note 5). |
| iv) | On December 17, 2014, the Company issued 1,622,029 common shares with a fair value of $313,571 as settled of accrued interest payable on Promissory Notes (Note 5). |
| v) | On January 13, 2015, the Company issued 360,567 common shares with a fair value of $72,000. The common shares were issued as a debt discount pursuant to the Promissory Notes (Note 5). |
| c) | Stock options: |
65
|
I-Minerals Inc. Notes to the Consolidated Financial Statements For the years ended April 30, 2016 and 2015 |
| (Expressed in US dollars except where otherwise indicated) |
| The Company has granted stock options under the terms of its Stock Option Plan (the “Plan”). The Plan provides that the directors of the Company may grant options to purchase common shares to directors, officers, employees and service providers of the Company on terms that the directors of the Company may determine are within the limitations set forth in the Plan. The maximum number of shares available under the Plan is limited to 10% of the issued common shares. The maximum term of stock options is ten years. All stock options vest on the date of grant, unless otherwise stated. As at April 30, 2016, the Company had 2,797,895 stock options available for grant pursuant to the Plan (2015 - 2,790,573). |
| The Company’s stock options outstanding as at April 30, 2016 and 2015 and the changes for the years then ended are as follows: |
| Number Outstanding |
Weighted Average Exercise Price (in CAD$) |
||||||
| Balance outstanding at April 30, 2014 | 4,160,000 | 0.26 | |||||
| Granted | 2,425,000 | 0.25 | |||||
| Exercised | (100,000 | ) | 0.10 | ||||
| Expired | (1,250,000 | ) | 0.40 | ||||
| Forfeited | (100,000 | ) | 0.25 | ||||
| Balance outstanding at April 30, 2015 | 5,135,000 | 0.22 | |||||
| Granted | 1,200,000 | 0.25 | |||||
| Expired | (500,000 | ) | 0.40 | ||||
| Balance outstanding at April 30, 2016 | 5,835,000 | 0.21 | |||||
| Balance exercisable at April 30, 2016 | 5,225,000 | 0.21 |
| The intrinsic value of options exercised during the year ended April 30, 2015 was CAD$18,000 based on a stock price of CAD$0.28 on the date of exercise. |
| Summary of stock options outstanding at April 30, 2016: |
| Security | Number Outstanding | Exercise
Price (CAD$) |
Expiry Date | Remaining Contractual Life (years) |
|
| Stock options | 1,300,000 | 0.10 | July 30, 2018 | 2.25 | |
| Stock options | 260,000 | 0.15 | July 30, 2018 | 2.25 | |
| Stock options | 300,000 | 0.25 | July 30, 2018 | 2.25 | |
| Stock options | 200,000 | 0.25 | November 19, 2018 | 2.56 | |
| Stock options | 150,000 | 0.25 | January 8, 2019 | 2.69 | |
| Stock options | 300,000 | 0.25 | May 23, 2019 | 3.06 | |
| Stock options | 150,000 | 0.25 | December 16, 2017 | 1.63 | |
| Stock options | 1,975,000 | 0.25 | January 29, 2020 | 3.75 | |
| Stock options | 200,000 | 0.25 | August 4, 2020 | 4.27 | |
| Stock options | 1,000,000 | 0.25 | February 25, 2018 | 1.82 |
| The weighted average grant date fair value of stock options granted during the years ended April 30, 2016 and 2015 of CAD$0.11 (2015 – CAD$0.16) was estimated using the Black-Scholes option pricing model with the following weighted average assumptions: |
| 2016 | 2015 | ||||||
| Stock price (CAD$) | 0.23 | 0.22 | |||||
| Exercise price (CAD$) | 0.25 | 0.25 | |||||
| Risk-free interest rate (%) | 1.0 | 2.0 | |||||
| Expected life (years) | 2.5 | 4.9 | |||||
| Expected volatility (%) | 86 | 94 | |||||
| Expected dividends ($) | Nil | Nil |
66
|
I-Minerals Inc. Notes to the Consolidated Financial Statements For the years ended April 30, 2016 and 2015 |
| (Expressed in US dollars except where otherwise indicated) |
| Expected volatility was determined by reference to the historical volatility of the Company’s common shares trading on the TSX Venture Exchange. |
| Non-Employee Stock Options |
| In accordance with the guidance of ASC 815-40-15, stock options awarded to non-employees that are fully vested and exercisable in Canadian dollars are required to be accounted for as derivative liabilities because they are considered not to be indexed to the Company’s stock due to their exercise price being denominated in a currency other than the Company’s functional currency. Stock options awarded to non-employees that are not vested are accounted for as equity awards until the terms associated with their vesting requirements have been met. As at April 30, 2016, there were no non-employee stock option awards that had not vested (2015 – 112,500). |
| The non-employee stock options are accounted for at their respective fair values and are summarized as follows for the years ended April 30, 2016 and 2015: |
| 2016 $ |
2015 $ |
||||||
| Fair value of non-employee options, beginning of the period | 116,615 | 68,859 | |||||
| Fair value of options granted | 102,273 | - | |||||
| Fair value of options on vesting | 11,366 | 80,361 | |||||
| Change in fair value of non-employee stock options during the period | (41,047 | ) | (32,605 | ) | |||
| Fair value of non-employee options, end of the period | 189,207 | 116,615 |
| The Company determined the fair value of its non-employee stock options as at April 30, 2016 and 2015 using the Black-Scholes option pricing model with the following weighted average assumptions: |
| 2016 | 2015 | ||||||
| Stock price (CAD$) | 0.23 | 0.25 | |||||
| Exercise price (CAD$) | 0.23 | 0.19 | |||||
| Risk-free interest rate (%) | 1.34 | 1.23 | |||||
| Expected life (years) | 2.43 | 3.82 | |||||
| Expected volatility (%) | 87 | 101 | |||||
| Expected dividends ($) | Nil | Nil |
| The non-employee options are required to be re-valued with the change in fair value of the liability recorded as a gain or loss on the change of fair value of derivative liability and included in other items in the Company’s Consolidated Statements of Loss at the end of each reporting period. The fair value of the options will continue to be classified as a liability until such time as they are exercised, expire or there is an amendment to the respective agreements that renders these financial instruments to be no longer classified as a liability. |
| As at April 30, 2016, the unamortized compensation cost of options is $41,579 and the intrinsic value of options expected to vest is $124,516 (CAD$156,250). |
| Share-based payments are classified in the Company’s Statement of Loss during the years ended April 30, 2016 and 2015 as follows: |
67
|
I-Minerals Inc. Notes to the Consolidated Financial Statements For the years ended April 30, 2016 and 2015 |
| (Expressed in US dollars except where otherwise indicated) |
| 2016 $ |
2015 $ |
||||||
| Management and consulting fees | 105,606 | 309,723 | |||||
| 105,606 | 309,723 |
| d) | Share purchase warrants: |
| A summary of fully-exercisable share purchase warrants as at April 30, 2016 and 2015 and the changes for the years then ended are as follows: |
| Number Outstanding |
Weighted
Average Exercise Price (CAD$) |
||||||
| Balance at April 30, 2014 | 23,402,612 | 0.38 | |||||
| Issued | 1,152,983 | 0.23 | |||||
| Balance at April 30, 2015 | 24,555,595 | 0.37 | |||||
| Issued | 1,487,860 | 0.25 | |||||
| Expired | (20,175,000 | ) | 0.40 | ||||
| Exercised | (25,000 | ) | 0.25 | ||||
| Balance at April 30, 2016 | 5,843,455 | 0.27 |
| Summary of warrants outstanding and issuable at April 30, 2016: |
| Security | Number Outstanding | Exercise
Price ($CAD) |
Expiry Date | |
| Warrants | 1,550,000 | 0.40 | January 31, 2017 | |
| Warrants | 667,520 | 0.14 | December 1, 2016(1) | |
| Warrants | 122,142 | 0.14266 | December 1, 2016(1) | |
| Warrants | 104,119 | 0.165 | December 1, 2016(1) | |
| Warrants | 76,723 | 0.17 | December 1, 2016(1) | |
| Warrants | 87,818 | 0.17223 | December 1, 2016(1) | |
| Warrants | 111,762 | 0.185 | December 1, 2016(1) | |
| Warrants | 132,208 | 0.217 | December 1, 2016(1) | |
| Warrants | 62,002 | 0.222 | December 1, 2016(1) | |
| Warrants | 58,181 | 0.225 | December 1, 2016(1) | |
| Warrants | 165,326 | 0.23 | December 1, 2016(1) | |
| Warrants | 51,202 | 0.25 | December 1, 2016(1) | |
| Warrants | 92,357 | 0.276 | December 1, 2016(1) | |
| Warrants | 200,091 | 0.28 | December 1, 2016(1) | |
| Warrants | 45,439 | 0.29 | December 1, 2016(1) | |
| Warrants | 96,261 | 0.292 | December 1, 2016(1) | |
| Warrants | 52,459 | 0.305 | December 1, 2016(1) | |
| Warrants | 730,848 | 0.22 | December 31, 2018(1) | |
| Warrants | 96,278 | 0.227 | December 31, 2018(1) | |
| Warrants | 242,545 | 0.23 | December 31, 2018(1) | |
| Warrants | 89,798 | 0.239 | December 31, 2018(1) | |
| Warrants | 194,344 | 0.24 | December 31, 2018(1) | |
| Warrants | 37,203 | 0.245 | December 31, 2018(1) | |
| Warrants | 85,308 | 0.25 | December 31, 2018(1) | |
| Warrants | 77,941 | 0.255 | December 31, 2018(1) | |
| Warrants | 192,206 | 0.259 | December 31, 2018(1) | |
| Warrants | 126,843 | 0.265 | December 31, 2018(1) | |
| Warrants | 198,750 | 0.272 | December 31, 2018(1) | |
| Warrants | 95,781 | 0.291 | December 31, 2018(1) |
68
|
I-Minerals Inc. Notes to the Consolidated Financial Statements For the years ended April 30, 2016 and 2015 |
| (Expressed in US dollars except where otherwise indicated) |
| Notes: |
| (1) | The warrants are exercisable until the earlier of the date disclosed or the date that the promissory note or second promissory note advance, including interest, is repaid (Notes 5 and 6). |
| 9. | INCOME TAXES: |
| A reconciliation of the income tax provision computed at statutory rates to the reported income tax provision for the years ended April 30, 2016 and 2015 is as follows: |
| 2016 $ |
2015 $ |
||||||
| Statutory tax rate | 26.00% | 26.00% | |||||
| Loss before income taxes | (4,601,846 | ) | (2,006,836 | ) | |||
| Expected income tax recovery | (1,196,000 | ) | (522,000 | ) | |||
| Increase (decrease) in income tax recovery resulting from: | |||||||
| Derivative liability | (265,000 | ) | (584,000 | ) | |||
| Other permanent differences | 126,000 | 118,000 | |||||
| Share issue costs | (106,000 | ) | (44,000 | ) | |||
| Effect of change in statutory rate and other | - | 37,000 | |||||
| Foreign income taxed at foreign rate | (277,000 | ) | (195,000 | ) | |||
| Impact of over-provision in previous year | - | 68,000 | |||||
| Increase in valuation allowance | 1,718,000 | 1,122,000 | |||||
| Income tax expense | - | - |
| The significant components of the Company’s deferred income tax assets and liabilities after applying enacted corporate tax rates at April 30, 2016 and 2015 are as follows: |
| 2016 $ |
2015 $ |
||||||
| Deferred income tax assets (liabilities) | |||||||
| Operating losses carried forward | 7,455,000 | 6,033,000 | |||||
| Resource property | 1,284,000 | 1,048,000 | |||||
| Capital assets | 3,000 | 1,000 | |||||
| Share issuance costs | 140,000 | 82,000 | |||||
| Other | 18,000 | 18,000 | |||||
| Valuation allowance | (8,900,000 | ) | (7,182,000 | ) | |||
| Net deferred income tax asset | - | - |
| At April 30, 2016, the Company has accumulated non-capital losses totalling $8,310,000 (2015 - $6,056,000) in Canada and net operating losses of $15,123,000 (2015 - $12,736,000) in the USA, which are available to carryforward and offset future years’ taxable income. The losses expire in various amounts from 2022 to 2036. |
69
|
I-Minerals Inc. Notes to the Consolidated Financial Statements For the years ended April 30, 2016 and 2015 |
| (Expressed in US dollars except where otherwise indicated) |
| Uncertain Tax Positions |
| The Company has adopted certain provisions of ASC 740, “Income Taxes”, which prescribes a recognition threshold and measurement attribute for the recognition and measurement of tax positions taken or expected to be taken in income tax returns. The provisions also provide guidance on the de-recognition of income tax assets and liabilities, classification of current and deferred income tax assets and liabilities, and accounting for interest and penalties associated with tax positions. |
| The Company files income tax returns in the U.S. federal jurisdiction, various state and foreign jurisdictions. The Company’s tax returns are subject to tax examinations by U.S. federal and state tax authorities, or examinations by foreign tax authorities until respective statute of limitation. The Company currently has no tax years under examination. The Company is subject to tax examinations by tax authorities for all taxation years commencing after 2003. |
| At April 30, 2016, the Company does not have an accrual relating to uncertain tax positions. It is not anticipated that unrecognized tax benefits would significantly increase or decrease within 12 months of the reporting date. |
| Provision has not been made for U.S. or additional foreign taxes on undistributed earnings of foreign subsidiaries. Such earnings have been and will continue to be reinvested but could become subject to additional tax if they were remitted as dividends, or were loaned to the Company affiliate. It is not practicable to determine the amount of additional tax, if any, that might be payable on the undistributed foreign earnings. |
| 10. | RELATED PARTY TRANSACTIONS: |
| During the year ended April 30, 2016, the Company settled $952,098 of interest payable on the Promissory Notes and Second Promissory Notes owed to a company controlled by a Director by issuing 5,216,116 common shares at the fair value of $963,718 (Notes 5 and 6). |
| During the year ended April 30, 2015, the Company settled $523,866 of interest payable on the Promissory Notes owed to a company controlled by a Director by issuing 2,363,262 common shares at the fair value of $466,272 (Note 5). |
| During the year ended April 30, 2016, management and consulting fees of $96,002 (2015 - $77,588) were charged by RJG Capital Corporation, a wholly-owned company of W. Barry Girling, Director. Wayne Moorhouse, Director, charged $3,093 (2015 - $4,039) in management and consulting fees. $23,557 (2015 - $39,611) was charged by Malaspina Consultants Inc. for the services of Matt Anderson, CFO, and are included in professional fees. |
| Included in accounts payable and accrued liabilities are amounts owed to directors or officers or companies controlled by them. As at April 30, 2016, the amount was $189,501 (2015 – $175,789). All amounts are non-interest bearing, unsecured, and due on demand. |
| The promissory notes and second promissory notes received from a company controlled by a director (Notes 5, 6 and 13) are related party transactions. |
| 11. | SEGMENT DISCLOSURES: |
| The Company considers its business to comprise a single operating segment being the exploration of its resource property. Substantially all of the Company’s long-term assets and operations are located in Latah County, Idaho. |
| 12. | NON-CASH TRANSACTIONS: |
| Investing and financing activities that affect recognized assets or liabilities but that do not result in cash receipts or cash payments are excluded from the consolidated statements of cash flows. During the year ended April 30, 2016, the following transactions were excluded from the consolidated statement of cash flows: |
70
|
I-Minerals Inc. Notes to the Consolidated Financial Statements For the years ended April 30, 2016 and 2015 |
| (Expressed in US dollars except where otherwise indicated) |
| a) | The issuance by the Company of 3,825,822 common shares at the fair value of $708,883 as payment of interest on the Promissory Notes; |
| b) | The issuance by the Company of 1,390,294 common shares at the fair value of $254,835 as payment of interest on the Second Promissory Notes; and |
| c) | The commitment to issue 1,487,860 common shares at the fair value of $353,408 and 1,487,860 warrants at the fair value of $176,493 pursuant to the Second Promissory Notes. |
| During the year ended April 30, 2015, the following transactions were excluded from the consolidated statement of cash flows: |
| a) | The issuance by the Company of 2,363,262 common shares at the fair value of $523,866 as payment of interest on the Promissory Notes; |
| b) | The commitment to issue of 472,998 common shares at the fair value of $98,640 and 472,998 warrants at the fair value of $60,161 pursuant to the Promissory Notes; and, |
| c) | The commitment to issue of 679,985 common shares at the fair value of $134,095 and 679,985 warrants at the fair value of $70,729 pursuant to the Second Promissory Notes. |
| 13. | IIM LITIGATION: |
| On June 6, 2014, the Company was named as a defendant in a lawsuit in Latah County, State of Idaho (the “Latah County Lawsuit”). The plaintiffs who filed the Latah County Lawsuit, Hoodoo Resources, LLC (“Hoodoo”) and Brent Thomson as trustee for the Brent Thomson Family Trust (the “Thomson Family Trust”) (collectively referred to as the “Plaintiffs”), alleged both direct claims and derivative claims on behalf of Idaho Industrial Minerals, LLC (“IIM”). The derivative claims alleged by the Plaintiffs against the Company seeked damages for breach of the terms of the August 10, 2001 agreement, as amended, between the Company and IIM (the “IIM Agreement”) and the return of the Idaho state mineral leases of the Helmer-Bovill Property to IIM. |
| During the year ended April 30, 2016, a court-ordered mediation was held. The mediation was successful and all parties entered into an agreement in principle to settle the parties’ claims against one another that was documented in a Binding Settlement Term Sheet whereby the Company agreed to pay $100,000 of the Plaintiffs legal fees and the Plaintiffs agreed to dismiss the Latah County Lawsuit. On December 2, 2015, the Latah County Lawsuit was dismissed and the Company paid a total of $100,000. |
| 14. | SUBSEQUENT EVENTS: |
| Subsequent to April 30, 2016: |
| a) | The Company received an aggregate of $200,000 of Second Promissory Notes (Note 6). In addition, the Company received $600,000 of other advances from the Lender. |
| b) | On May 19, 2016, the Company granted 1,000,000 stock options to employees of the Company at an exercise price of CDN$0.22 per share up to May 19, 2018. These stock options vested on the date grant. In June 2016, 980,000 of these stock options were exercised for gross proceeds of CDN$215,600 ($167,575). |
| c) | The Company granted 300,000 stock options to a director at an exercise price of CAD$0.30 per share that expire on July 21, 2021. These options vested on the date of grant. |
71
Item 9A. Controls and Procedures.
Disclosure Controls and Procedures
We carried out an evaluation of the effectiveness of our disclosure controls and procedures (as defined in Rules 13a-15(e) and 15d-15(e) of the Exchange Act) as of April 30, 2016 (the “Evaluation Date”). This evaluation was carried out under the supervision and with the participation of our Chief Executive Officer and our Chief Financial Officer. Based upon that evaluation, our Chief Executive Officer and Chief Financial Officer concluded that our disclosure controls and procedures were effective as of the Evaluation Date.
Management's Annual Report on Internal Control Over Financial Reporting
Our management is responsible for establishing and maintaining adequate internal control over financial reporting, as such term is defined in Rules 13a-15(f) and 15d-15(f) under the Exchange Act, for the Company.
Our internal control over financial reporting includes those policies and procedures that: (1) pertain to the maintenance of records that, in reasonable detail, accurately and fairly reflect the transactions and dispositions of our assets; (2) provide reasonable assurance that transactions are recorded as necessary to permit preparation of financial statements in accordance with United States generally accepted accounting principles, and that our receipts and expenditures are being made only in accordance with authorizations of our management and directors; and (3) provide reasonable assurance regarding prevention or timely detection of unauthorized acquisition, use or disposition of our assets that could have a material effect on the financial statements.
Under the supervision and with the participation of our Chief Executive Officer and Chief Financial Officer, management conducted an evaluation of the effectiveness of our internal control over financial reporting, as of the Evaluation Date, based on the framework set forth in Internal Control-Integrated Framework 2013 issued by the Committee of Sponsoring Organizations of the Treadway Commission (COSO). Based on its evaluation under this framework, management concluded that our internal control over financial reporting was effective as of the Evaluation Date.
This annual report does not include an attestation report of our registered public accounting firm regarding internal control over financial reporting. Management's report was not subject to attestation by our registered public accounting firm pursuant to rules of the Securities and Exchange Commission that permit us to provide only management's report in this annual report.
Changes in Internal Control Over Financial Reporting
As of the Evaluation Date, there were no changes in our internal control over financial reporting that occurred during the fiscal year ended April 30, 2016 that have materially affected, or that are reasonably likely to materially affect, our internal control over financial reporting.
Limitations on the Effectiveness of Controls and Procedures
Our management, including our Chief Executive Officer and the Chief Financial Officer, do not expect that the our controls and procedures will prevent all potential error and fraud. A control system, no matter how well conceived and operated, can provide only reasonable, not absolute, assurance that the objectives of the control system are met.
Item 9B. Other Information.
None.
72
PART III
Item 10. Directors, Executive Officers and Corporate Governance.
The following table sets forth the name and positions of our executive officers and directors as of the date hereof.
| Name | Age | Positions |
| Thomas M. Conway | 59 | Chief Executive Officer, President, and Director |
| Matthew Anderson | 33 | Chief Financial Officer |
| Allen L. Ball | 71 | Director |
| W. Barry Girling | 56 | Director |
| Gary Childress | 68 | Director |
| Wayne Moorhouse | 52 | Director |
| John Theobald | 59 | Director |
Set forth below is a brief description of the background and business experience of our executive officers and directors:
Thomas M. Conway has been our Chief Executive Officer and President since January 2011, and a director since October 2010. Mr. Conway holds a B.S.- Mining Engineering (University of Minnesota) and later attended Harvard Business School's Executive MBA program. He has significant expertise in permitting, feasibility and mining. A results-oriented executive, Mr. Conway has 20 years of diverse experience largely with Newmont Mining Corporation ("Newmont") in operations, general management, environmental affairs and risk management. His experience covers domestic and international assignments in open pit and underground operations where he has a record of successfully implementing plans to enhance operations through improved cost control and productivity innovations. His roles at Newmont included Vice President Risk Management, Vice President / General Manager Carlin Operations, Vice President / General Manager Minera Yanacocha.
Matthew Anderson has been our Chief Financial Officer since July 2011. Mr. Anderson holds a Bachelor of Commerce degree from McGill University and obtained his Chartered Accountant designation in 2008 while articling at a large accounting firm. Matt is a Senior Consultant with Malaspina Consultants Inc., a private company that provides accounting and administrative infrastructure to junior public companies. He has worked with Malaspina Consultants Inc. since July 2009. He serves or has served as CFO of several junior public companies including VirtualArmor International Inc., Terra Nova Energy Ltd., EFLO Energy, Inc., Wolfpack Gold Corp., Search Minerals Inc., Dynamic Oil & Gas Exploration Inc., Tigris Uranium Corp. and Explorator Resources Inc.
Allen L. Ball has been a director since March 2002. Mr. Ball is a successful Idaho business man and has been involved in many business ventures including farming, farm implement sales, vending machines, cosmetics industry, mining, timber, construction and related materials, high tech venture capital, commercial car washes, A/R factoring, septic system sales / installation / servicing, lending, real estate development, hospitality, assisted living, pharmaceutical, firearms manufacturing, fishing lodge/outfitting, and motorsports sales, but he is probably most known for his involvement in forming Melaleuca, Inc, which is a manufacturer of wellness products and based in Idaho.
W. Barry Girling has been a director since March 2002. Mr. Girling has been active in various aspects of mineral exploration since 1977. He couples his geological understanding with a B.Com. (Finance) degree to provide consulting services to a number of TSX Venture Exchange companies. He has strong capital markets experience gained as a founder and director of Foundation Resources Inc. and Search Minerals Inc and was a director of Roxgold Inc. from August 2006 through September 2102 completed the re-organization of Roxgold Inc. and the acquisition of its Burkina Faso gold properties. Aside from I-Minerals Inc., Mr. Girling was from November 2012 President and CEO of Birch Hill Gold Corporation until it amalgamated with Canoe Mining Ventures in June of 2014 and continues as a director of BRS Ventures Ltd.
Gary Childress has been a director since November 2013. Mr. Childress has a BS in Ceramic Engineering from Clemson University and has spent much of the last 40 years in industrial minerals or related industries. He has served as General Manager of Edward Orton Ceramic Foundation since September 2001, the primary focus of which is providing products to assist and enhance high temperature processing of ceramics and other materials. Mr. Childress also served as Vice President of Hecla Mining Company from 1994 to 2001 where he was responsible for Heclas's industrial mineral division including acquisitions and project development.
Wayne Moorhouse has been a director since January 6, 2014. Mr. Moorhouse has extensive experience with public companies and has acted as the CFO, corporate secretary or president of a number of TSX and TSX Venture listed resource companies and their subsidiaries. In particular, Mr. Moorehouse served as CFO and corporate secretary of Genco Resources Ltd., a former TSX company that had a producing silver-gold property in Mexico, from June 2003 to October 2010, and as a special advisor to Silvermex Resources Ltd., a company listed on the TSX that was in process of developing advanced stage silver projects, from November 2010 to December 2011. Between January 2012 and September 2013, Mr. Moorhouse served as CFO of Roxgold Inc, a company listed on the TSX Venture Exchange engaged in the exploration of a gold property in Burkina Faso. Currently, Mr. Moorhouse is CFO of Midnight Sun Mining Corp., a company listed on the TSX Venture Exchange engaged in the exploration of properties in Africa and CFO of WPC Resources Inc., a TSX Venture Exchange listed company focused on advancing a portfolio of Canadian gold properties.
73
John Theobald has been a director since July 21, 2016. Mr. Theobald has over thirty-five years in the international mining industry and has been involved with exploration, business development, operations, investments and capital markets. Most recently he was a director of ASX listed High Peak Royalties Ltd, director, CEO & COO of London and TSX listed royalty company Anglo Pacific Group plc, and served as Chairman of First Coal Corporation which was successfully sold to Xstrata plc for C$147 million. From 1999 to 2008 he held a number of senior positions with Sibelco, a major industrial minerals group, where he gained significant experience of kaolin, feldspar, clay and quartz markets and operations. Mr. Theobald has a B.Sc. with Honours in Geology from the University of Nottingham, is a Chartered Engineer with the UK Engineering Council, Fellow of the Institute of Materials Minerals and Mining (UK) and Member of the Institute of Directors (UK).
Term Of Office
Our directors are elected to hold office until the next annual meeting of the shareholders and until their respective successors have been elected and qualified. Our executive officers are appointed by our board of directors and hold office until removed by our board of directors or until their successors are appointed.
Family Relationships
There are no family relationships between our executive officers and directors.
Nominating Committee
Our Board of Directors does not have a separately designed nominating committee. Our entire Board of Directors determines new nominees to the Board, although a formal process has not been adopted. Nominees to our Board are normally the result of recruitment efforts by our Board.
Audit Committee
The Board of Directors has adopted a written charter and terms of reference for the Audit Committee, which sets out the Audit Committee's responsibility for (among other things) reviewing our financial statements and our public disclosure documents containing financial information and reporting on such review to the board of directors, ensuring our compliance with legal and regulatory requirements, overseeing qualifications, engagement, compensation, performance and independence of our external auditors, and reviewing, evaluating and approving the internal control and risk management systems that are implemented and maintained by management.
Mr. Childress, Mr. Moorhouse and Mr. Girling comprises our Audit Committee. Mr. Childress and Mr. Moorhouse are independent directors, as that term is defined in NASDAQ Rule 5605(a)(2). Mr. Moorhouse and Mr. Girling are our Audit Committee financial experts as that term is defined in Item 407(d)(5) of Regulation S-K of the Securities and Exchange Commission.
Other Significant Employees
We have three significant employees as follows:
A. Lamar Long has been our Project Manager since January 26, 2011. Mr. Long coordinates the ongoing Kelly's Basin feasibility study with our principal consultant, SRK Consulting (USA) Inc. and overseas all geological developments, including the design of the Primary Clay deposits prefeasibility study. Prior to being promoted to Project Manager in January 2011, Mr. Long served as Exploration Manager beginning August 2002. Prior to joining us, Mr. Long spent 13 years as the Exploration Manager, Industrial Minerals for Hecla Mining Corporation where he developed, planned and managed all exploration programs for industrial minerals. Earlier in his career Lamar was a Project Geologist for J.M. Huber Corporation for 7 years where he managed industrial minerals projects including a regional exploration program for kaolin in Georgia and South Carolina.
74
Gary L. Nelson (B.S. Metallurgical Engineering) has been our Manager, Metallurgical Operations since September 2007. Mr. Nelson oversees all metallurgical work from both the Kelly's Basin and Primary Clay deposits. He works closely with the engineering consultants in the all economic assessments with a focus on material balances and process facility design. Mr. Nelson has over thirty years of diverse expertise with an emphasis on industrial minerals including economic modeling, project / process development, operations start-up, marketing and market development and environmental reporting. Mr. Nelson is charged with the task of overseeing the completion of the ongoing feasibility study on the Helmer-Bovill property and ultimately the design and procurement of the production facility.
Linda A. Koep has been our Market Development Manager since September 2003. Ms Koep oversees the marketing and sales of all mineral products from both deposits. She has eighteen years of experience in the mining industry including mineral markets and mergers and acquisitions. Ms. Koep develops mineral markets and potential sales, analyzes transportation opportunities, and plans strategy for implementing the company's entry as a producer of industrial minerals. In addition, Ms. Koep is a member of Gonzaga University faculty in Spokane, Washington.
Compliance with Section 16(a) of the Exchange Act
Section 16(a) of the Exchange Act requires our executive officers and directors, and persons who own more than 10% of a registered class of our securities (“Reporting Persons”), to file reports of ownership and changes in ownership with the SEC. Reporting Persons are required by SEC regulations to furnish us with copies of all forms they file pursuant to Section 16(a). Based solely on our review of such reports received by us, we have determined that the following persons have failed to file, on a timely basis, the identified reports required by Section 16(a) of the Exchange Act:
| Name and Principal Position |
Number of Late Insider Reports |
Transactions
Not Timely Reported |
Known Failures to File a Required Form |
|
Alan L. Ball Director and 10% Holder |
One | None | None |
|
BV Natural
Resources LLC 10% Holder |
One | None | None |
|
Cortney Liddard Officer of 10% Holder |
One | None | None |
Code of Ethics
We have not adopted a code of ethics as that term is defined in Item 406 of Regulation S-K. As we have only 5 full time employees, our Board of Directors has determined that it is not necessary to adopt a formal code of ethics at this time. Our Board of Directors will evaluate our Company’s internal procedures on an ongoing basis to determine whether a code of ethics is required. If our Board does determine that a code of ethics is required or advisable, an appropriate code will be adopted at that time.
Item 11. Executive Compensation.
Summary Compensation Table
The following table sets forth the total compensation paid or accrued to our named executive officers, as that term is defined in Item 402(m)(2) of Regulation S-K, during our last two completed fiscal years.
| SUMMARY COMPENSATION TABLE | |||||||||
| Name & Principal Position | Year |
Salary ($) |
Bonus ($) |
Stock Awards ($) |
Option Awards ($)(3) |
Non-Equity Incentive Plan Compen-sation ($) |
Nonqualified Deferred Compen-sation Earnings ($) |
All Other Compen-sation ($) |
Total ($) |
|
Thomas M. Conway(1) President, CEO & Director |
2016 | 150,000 | 0 | 0 | 0 | 0 | 0 | 8,963 | 158,963 |
| 2015 | 150,000 | 0 | 0 | 36,383 | 0 | 0 | 8,963 | 195,346 | |
|
Matthew Anderson(2) CFO |
2016 | 23,557 | 0 | 0 | 0 | 0 | 0 | 0 | 23,557 |
| 2015 | 39,611 | 0 | 0 | 12,128 | 0 | 0 | 0 | 51,739 | |
75
Notes:
| (1) | Mr. Conway is compensated pursuant to the terms of his amended employment agreement dated April 1, 2013, pursuant to which he is paid a salary of $12,500 per month. |
| (2) | Mr. Anderson is compensated pursuant to the terms of his consulting agreement dated October 1, 2011, pursuant to which he is paid an hourly rate. Mr. Anderson’s consulting agreement may be terminated on sixty days’ written notice. |
| (3) | The determination of non-cash value of option awards is based upon the grant date fair value determined using the Black-Scholes Option pricing model, details and assumptions of which are set out in Note 8 the consolidated financial statements for the year ended April 30, 2016. |
Outstanding Equity Awards At Fiscal Year End
The following table provides information concerning unexercised options for each of our named executive officers, as that term is defined in Item 402(m)(2) of Regulation S-K as of our fiscal year end of April 30, 2016.
| Name and Principal Position | Number of Securities Underlying Unexercised Options (#) Exercisable | Number of Securities Underlying Unexercised Options (#) Unexercisable | Equity Incentive Plan Awards: Number of Securities Underlying Unexercised Unearned Options | Option Exercise Price (CAD$) | Option Expiration Date |
|
THOMAS M. CONWAY (1) Chief Executive Officer, President and Director |
150,000 350,000 |
- 50,000 |
- - |
0.40 0.10 |
12/01/2015 07/30/2018 |
| - | 260,000 | - | 0.15 | 07/30/2018 | |
| - | 300,000 | - | 0.25 | 07/30/2018 | |
| 300,000 | - | - | 0.25 | 01/29/2020 | |
|
MATTHEW ANDERSON Chief Financial Officer |
150,000 | - | - | 0.10 | 07/30/2018 |
| 100,000 | - | - | 0.25 | 01/29/2020 |
| (1) | During the year ended April 30, 2014, pursuant to an employment agreement, Mr. Conway was granted 810,000 options as follows: 250,000 exercisable at CAD$0.10 upon the completion of certain events in connection with the Helmer-Bovill property including a pre-feasibility study and permitting, 260,000 exercisable at CAD$0.15 upon the completion of events including the completion of a feasibility study, obtaining additional financing or arranging a joint venture partner, 300,000 options exercisable at CAD$0.25 upon the completion of events including completion of a plant and commercial viability. Of the 250,000 options exercisable at CAD$0.10, there were 200,000 that had vested by April 30, 2016. All of the options awarded in connection with this employment agreement expire on July 30, 2018. |
Exercise prices are determined based on the trading price on the TSX Venture Exchange at the date of grant and based on the judgment of the Board of Directors. No options are granted at a discount to the trading price.
Director Compensation
The following table sets forth the compensation paid to our directors during our April 30, 2016 fiscal year, other than directors who were also named executive officers as that term is defined in Item 402(m)(2). Compensation paid to directors who were also named executive officers during our April 30, 2016 fiscal year is set out in the tables above.
| Name |
Fees Earned or Paid
in Cash ($) |
Stock Awards ($) |
Option Awards ($)(3) |
Non-Equity Incentive Plan Compensation ($) |
Nonqualified Deferred Compensation Earnings ($) |
All Other Compensation ($) |
Total ($) |
| Allen L. Ball | - | - | - | - | - | - | - |
| W. Barry Girling(1) | - | - | - | - | - | 96,002 | 96,002 |
| Gary Childress | - | - | - | - | - | - | - |
| Wayne Moorhouse(2) | 3,093 | - | - | - | - | - | 3,093 |
76
Notes:
| (1) | Management and consulting fees of $96,002 were charged by RJG Capital Corporation, a wholly-owned company of Mr. Girling. |
| (2) | Mr. Moorhouse is compensated at a rate of CAD$1,000 per quarter for acting as Chair of the Audit Committee. |
| (3) | The determination of non-cash value of option awards is based upon the grant date fair value determined using the Black-Scholes Option pricing model, details and assumptions of which are set out in Note 8 the consolidated financial statements for the year ended April 30, 2016. No stock options were granted to the directors during the year ended April 30, 2016. |
Item 12. Security Ownership of Certain Beneficial Owners and Management and Related Stockholder Matters.
The following table sets forth certain information concerning the number of common shares owned beneficially as of July 27, 2016 by: (i) each person (including any group) known to us to own more than five percent (5%) of any class of our voting securities, (ii) each of our directors, (iii) each of our named executive officers; and (iv) officers and directors as a group. Unless otherwise indicated, the shareholders listed possess sole voting and investment power with respect to the shares shown.
| Title of Class | Name and Address of Beneficial Owner | Amount and Nature of Beneficial Ownership | Percentage of Common Shares(1) |
| Directors and Officers | |||
| Common Shares |
THOMAS M. CONWAY Chief Executive Officer, President and Director |
820,000(2) Common Shares Direct |
0.9% |
| Common Shares |
MATTHEW ANDERSON Chief Financial Officer |
250,000(3) Common Shares Direct |
0.3% |
| Common Shares |
ALLEN L. BALL Director |
37,452,050(4) Common Shares Direct |
40.6% |
| Common Shares |
W. BARRY GIRLING Director |
2,323,277(5) Common Shares Direct |
2.6% |
| Common Shares |
GARY CHILDRESS Director |
300,000(6) Common Shares Direct |
0.3% |
| Common Shares |
WAYNE MOORHOUSE Director |
300,000(7) Common Shares Direct |
0.3% |
| Common Shares |
JOHN THEOBALD Director |
300,000(8) Common Shares Direct |
0.3% |
|
All Officers and Directors as a Group (6 persons) |
41,745,327 Common Shares |
43.9% | |
| 5% Shareholders | |||
| Common Shares |
ALLEN L. BALL 6465 South 5th West, Idaho Falls, Idaho 83404 |
37,452,050(4) Common Shares Direct |
40.6% |
Notes:
| (1) | Under Rule 13d-3, a beneficial owner of a security includes any person who, directly or indirectly, through any contract, arrangement, understanding, relationship, or otherwise has or shares: (i) voting power, which includes the power to vote, or to direct the voting of shares; and (ii) investment power, which includes the power to dispose or direct the disposition of shares. Certain shares may be deemed to be beneficially owned by more than one person (if, for example, persons share the power to vote or the power to dispose of the shares). In addition, shares are deemed to be beneficially owned by a person if the person has the right to acquire the shares (for example, upon exercise of an option) within 60 days of the date as of which the information is provided. In computing the percentage ownership of any person, the amount of shares outstanding is deemed to include the amount of shares beneficially owned by such person (and only such person) by reason of these acquisition rights. As a result, the percentage of outstanding shares of any person as shown in this table does not necessarily reflect the person’s actual ownership or voting power with respect to the number of our shares actually outstanding on July 27, 2016. As of July 27, 2016, there were 87,308,952 common shares issued and outstanding. |
77
| (2) | The number of shares listed as beneficially owned by Mr. Conway consists of: (i) 170,000 common shares; (ii) an option to purchase 350,000 common shares at a price of CAD$0.10 per share until July 30, 2018; and (iii) an option to purchase 300,000 common shares at a price of CAD$0.25 per share until January 29, 2020. We have not included Mr. Conway’s following options that are not expected to vest in the next 60 days including: (i) an option to purchase 50,000 common shares at a price of CAD$0.10 per share until July 30, 2018; (ii) an option to purchase 260,000 common shares at a price of CAD$0.15 per share until July 30, 2018; and (iii) an option to purchase 300,000 common shares at a price of CAD$0.25 per share until July 30, 2018. |
| (3) | The number of shares listed as beneficially owned by Mr. Anderson consists of (i) an option to purchase 150,000 common shares at a price of CAD$0.10 per share until July 30, 2018 and (ii) an option to purchase 100,000 common shares at a price of CAD$0.25 per share until January 29, 2020. |
| (4) | The number of shares listed as beneficially owned by Mr. Ball consists of: (i) 250,500 common shares held directly by Mr. Ball, (ii) 352,500 common shares held by the Allen & Connie Ball Family Limited Partnership, (iii) 1,030,000 common shares held by the Allen & Connie Ball Living Trust, (iv) 30,895,652 common shares held by BV Naturally Resources LLC; (v) an option to purchase 150,000 common shares at a price of CAD$0.10 per share until July 30, 2018 held directly by Mr. Ball; (vi) an option to purchase 200,000 common shares at a price of CAD$0.25 per share until January 29, 2020 held directly by Mr. Ball; (vii) 2,125,610 share purchase warrants exercisable at prices from CAD$0.14 to CAD$0.305 per share until December 1, 2016 held by BV Lending, LLC; and (vii) 2,447,788 share purchase warrants exercisable at prices from CAD$0.22 to CAD$0.31 per share until December 31, 2018 held by BV Lending, LLC. |
| (5) | The number of shares listed as beneficially owned by Mr. Girling consists of: (i) 1,298,507 common shares; (ii) an option to purchase 150,000 common shares at a price of CAD$0.10 per share until July 30, 2018; (iii) an option to purchase 300,000 common shares at a price of CAD$0.25 per share until January 29, 2020; and (iv) 574,770 share purchase warrants exercisable at CAD$0.40 per share until January 31, 2017. |
| (6) | The number of shares listed as beneficially owned by Mr. Childress consists of (i) an option to purchase 150,000 common shares at a price of CAD$0.25 per share until November 19, 2018; and (ii) an option to purchase 150,000 common shares at a price of CAD$0.25 per share until January 29, 2020. |
| (7) | The number of shares listed as beneficially owned by Mr. Moorhouse consists of (i) an option to purchase 150,000 common shares at a price of CAD$0.25 per share until January 8, 2019 and (ii) an option to purchase 150,000 common shares at a price of CAD$0.25 per share until January 29, 2020. |
| (8) | The number of shares listed as beneficially owned by Mr. Theobald consists of (i) an option to purchase 300,000 common shares at a price of CAD$0.30 per share until July 21, 2021. |
Changes in Control
We are not aware of any arrangement, which may result in a change in control in the future.
Item 13. Certain Relationships and Related Transactions, and Directors Independence.
Related Transactions
Except as disclosed below, none of the following parties has, during our last two fiscal years, had any material interest, direct or indirect, in any transaction with us or in any presently proposed transaction that has or will materially affect us, in which the Company is a participant and the amount involved exceeds the lesser of $120,000 or 1% of the average of the Company’s total assets for the last two completed fiscal years:
| (i) | Any of our directors or officers; |
| (ii) | Any person proposed as a nominee for election as a director; |
| (iii) | Any person who beneficially owns, directly or indirectly, shares carrying more than 10% of the voting rights attached to our outstanding common shares; |
| (iv) | Any of our promoters; and |
| (v) | Any relative or spouse of any of the foregoing persons who has the same house as such person. |
Compensation Arrangements
During the year ended April 30, 2016, management and consulting fees of $96,002 (2015 - $77,588) were charged by RJG Capital Corporation, a wholly-owned company of W. Barry Girling, Director. Wayne Moorhouse, Director, charged $3,093 (2015 - $4,039) in management and consulting fees. A further $150,000 (2015 - $150,000) in salary was earned by Thomas M. Conway, CEO, and is included with mineral property exploration costs. $23,557 (2015 - $39,611) was charged by Malaspina Consultants Inc. for the services of Matt Anderson, CFO, and are included in professional fees. See “Executive Compensation – Summary Compensation Table” and “Executive Compensation – Director Compensation”.
78
Indebtedness
As at April 30, 2016, we recorded accounts payable and accrued liabilities of $189,501 (2015 - $175,789) in connection with amounts owed to our directors, an officer and a former director. At April 30, 2016, we owed Wayne Moorhouse, Director, $3,923, Tom Conway, CEO and Director, $2,178, RJG Capital Corporation, a company controlled by Barry Girling, $8,400 and Ball Ventures, LLC, a company controlled by Allen L. Ball, $175,000. At April 30, 2015, we owed Wayne Moorhouse, Director, $789 and Ball Ventures, LLC, a company controlled by Allen L. Ball, $175,000. All amounts are non- interest bearing, unsecured, and due on demand.
Loan Agreements with Directors
Promissory Notes
On September 13, 2013 and January 27, 2014, the Company entered into agreements with BV Lending LLC, a company controlled by Allen L. Ball, a director of our Company (the “Lender”) pursuant to which $5,787,280 was advanced to the Company in tranches (the “Promissory Notes”). The Promissory Notes were to mature as to $1,000,000 on December 31, 2015, $2,000,000 on June 30, 2016 and the balance due on December 31, 2016. On December 4, 2014, the maturity dates of the Promissory Notes were amended so that the maturity dates are the later of the original maturity dates and one year after resolution of the IIM litigation. The IIM litigation was settled on December 2, 2015. The Company recorded this amendment of the terms of the debt as a modification of debt having no impact on the Company’s Statement of Loss. The Promissory Notes now mature as to $3,000,000 on December 2, 2016 and the balance due on December 31, 2016. Certain conditions may result in early repayment including immediate repayment in the event a person currently not related to the Company acquires more than 40% of the outstanding common shares of the Company.
The Promissory Notes bear interest at the rate of 12% per annum and during the year ended April 30, 2016, the Company recorded interest of $696,376 (2015 - $653,319). Interest is payable semi-annually as calculated on May 31st and November 30th. Interest is to be paid either in cash or in common shares at the option of the Lender. In July 2015, the Company settled $345,616 of interest payable on the Promissory Notes by the issuance of 1,980,840 common shares at the fair value of $373,142 based on their quoted market price at the date of issuance. Accordingly, the Company recorded a loss on settlement of liabilities of $27,526. The interest settled was for the period from December 1, 2014 to May 31, 2015. In December 2015, the Company settled $348,188 of interest payable by the issuance of 1,844,982 common shares at the fair value of $335,741. The Company recorded an increase in additional paid-in capital on extinguishment of debt of $12,447. The interest settled was for the period from June 1, 2015 to November 30, 2015.
During the year ended April 30, 2015, the Company settled $523,866 of interest payable on the Promissory Notes by the issuance of 2,363,262 common shares at the fair value of $466,272 based on their quoted market price at the date of issuance. Accordingly, the Company recorded an increase in additional paid-in capital on extinguishment of debt of $57,594. The interest settled was for the period from January 1, 2014 to November 30, 2014.
The Company and the Lender agreed that the Lender would receive bonus shares equal to 6% of each loan tranche advanced divided by the Company’s common share market price where, for purposes of calculating the number of shares issuable for each loan tranche, the Company’s common share market share price is discounted by 25% as allowed by regulation. The amount of bonus shares issued were subject to a minimum price of CAD$0.105 and a maximum of 1,720,649 bonus shares. In addition, the Company would issue the Lender an equal number of share purchase warrants for each loan tranche advanced. Each bonus share purchase warrant entitles the Lender to purchase one common share of the Company at a price equal to the greater of (a) the market price of the Company’s common shares on the date of the advance and (b) the volume weighted average price of the Company’s common shares over the twenty trading days immediately prior to the date of the advance. The bonus share purchase warrants expire on the earlier of (a) December 1, 2016 and (b) the date the advance has been repaid in full, including interest.
During the year ended April 30, 2016, the Company issued 13,588 bonus shares to the Lender at the fair value of $2,640, based on their quoted market price at the date the advances were received. At April 30, 2015, the $2,640 was recorded in commitment to issue shares.
During the year ended April 30, 2015, the Company issued 772,760 bonus shares to the Lender at the fair value of $168,000, based on their quoted market price at the date the advances were received, including 313,350 shares having a fair value of $79,223 that the Company had previously committed to issue. The Company was committed to issuing an additional 13,588 bonus shares to the Lender at the fair value of $2,640. The fair value of the bonus shares was determined by reference to the trading price of the Company’s common shares on the date the advances were received.
The fair value of 472,998 bonus share purchase warrants committed to be issued (based on advances received during the period) during the year ended April 30, 2015 of $60,161 was estimated using the Black-Scholes option pricing model with the following weighted average assumptions: stock price – CAD$0.23; exercise price – CAD$0.24; expected risk-free interest rate – 1.15%; expected life – 2.2 years; expected volatility – 113% and expected dividend rate – 0%.
79
The aggregate finance fees (bonus shares and bonus warrants) are recorded against the Promissory Notes balance and are being amortized to the Statement of Loss over the life of the Promissory Notes, based on the later of the original maturity dates and one year after the resolution of the IIM litigation using the effective interest method. The unamortized debt discount as at April 30, 2016 is $109,173 (2015 – $243,289).
The Promissory Notes are collateralized by the Company’s Helmer-Bovill Property.
Second Promissory Notes
On February 18, 2015, we entered into a separate agreement with the Lender pursuant to which up to $4,463,000 will be advanced to us in tranches (the “Second Promissory Notes”). On December 1, 2015, the Company entered into an amending agreement whereby the Lender agreed to advance an additional $1,000,000 in tranches. As at April 30, 2016, $5,257,000 had been advanced to the Company. The Second Promissory Notes mature as to $1,000,000 on December 2, 2016, $2,000,000 on June 2, 2017 and the balance due on December 2, 2017. Certain conditions may result in early repayment including immediate repayment in the event a person currently not related to the Company acquires more than 40% of the outstanding common shares of the Company. Debt issuance costs will be amortized over the estimated maturity life of the promissory notes.
The Second Promissory Notes bear interest at the rate of 12% per annum and during the year ended April 30, 2016, the Company recorded interest of $464,963 (2015 - $30,446). Interest is payable semi-annually as calculated on May 31st and November 30th. Interest is to be paid either in cash or in common shares at the option of the Lender. In July 2015, the Company settled $50,049 of interest payable on the Second Promissory Notes by the issuance of 286,845 common shares at the fair value of $54,035. Accordingly, the Company recorded a loss on settlement of liabilities of $3,986. The interest settled was for the period from January 8, 2015 to May 31, 2015. In December 2015, the Company settled $208,245 of interest payable by the issuance of 1,103,449 common shares at the fair value of $200,800. The Company recorded an increase in additional paid-in capital on extinguishment of debt of $7,445. The interest settled was for the period from June 1, 2015 to November 30, 2015.
The Company and the Lender agreed that the Lender is to receive bonus shares equal to 7.5% of each loan tranche advanced divided by the Company’s common share market price. In addition, the Company will issue the Lender an equal number of share purchase warrants for each loan tranche advanced. Each bonus share purchase warrant will entitle the Lender to purchase one common share of the Company at a price equal to the greater of (a) the market price of the Company’s common shares on the date of the advance and (b) the volume weighted average price of the Company’s common shares over the twenty trading days immediately prior to the date of the advance. The bonus share purchase warrants expire on the earlier of (a) December 31, 2018 and (b) the date the advance has been repaid in full, including interest.
During the year ended April 30, 2016, the Company issued 1,818,520 bonus shares to the Lender at the fair value of $406,391, based on their quoted market price at the date the advances were received, including 679,985 shares having a fair value of $134,095 that the Company had committed to issue as at April 30, 2015. At April 30, 2016, the Company was committed to issuing an additional 349,325 bonus shares to the Lender at the fair value of $81,112. The fair value of the bonus shares was determined by reference to the trading price of the Company’s common shares on the date the advances were received.
The fair value of 1,487,860 bonus share purchase warrants committed to be issued (based on advances received during the period) during the year ended April 30, 2016 of $176,493 was estimated using the Black-Scholes option pricing model with the following weighted average assumptions: stock price – CAD$0.225; exercise price – CAD$0.268; expected risk-free interest rate – 0.96%; expected life – 1.41 years; expected volatility – 76% and expected dividend rate – 0%.
The fair value of 679,985 bonus share purchase warrants committed to be issued (based on advances received during the period) during the year ended April 30, 2015 of $70,729 was estimated using the Black-Scholes option pricing model with the following weighted average assumptions: stock price – CAD$0.20; exercise price – CAD$0.22; expected risk-free interest rate – 1.17%; expected life – 3.8 years; expected volatility – 96% and expected dividend rate – 0%.
The aggregate finance fees (bonus shares and bonus warrants) are recorded against the Second Promissory Notes balance and are being amortized to the Statement of Loss over the life of the Second Promissory Notes, based on two years after the resolution of the IIM litigation, using the effective interest method. The unamortized debt discount as at April 30, 2016 is $476,186 (2015 – $184,435).
80
The Second Promissory Notes are collateralized by the Company’s Helmer-Bovill Property.
IIM Agreement
Allen L. Ball, a member of our board of director, owns a 25% interest in Idaho Industrial Minerals LLC, which is the property vendor in respect of IIM Agreement whereby we acquired a 100% interest in the Helmer-Bovill property.
Director Independence
Our common shares trade in Canada on the TSX Venture Exchange and in the over-the-counter in the United States on the OTCQX market place. Our securities are not listed in the United States on a national securities exchange or an interdealer quotation system.
When assessing the independence of our Board for corporate governance purposes, we apply the rules of the TSX Venture Exchange. Under the rules of the TSX Venture Exchange, we are required to have a minimum of two independent directors. For purposes of the TSX Venture Exchange rules, a director is considered to be “independent” if he or she has no direct or indirect relationship that could, in the view of our Board of Directors, reasonably interfere with the exercise of his or her independent judgment. Under these rules, any person meeting the following criteria would be deemed to have a “material relationship” to us, and to not be independent:
| (a) | Anyone that has been an employee or executive officer within the last 3 years; |
| (b) | Any immediate family member of a person that has been an executive officer within the last 3 years; |
| (c) | Any person that is a partner or employee of our internal or external auditors, or was a partner or employee of our internal or external auditors within the last 3 years and personally worked on our audit during that time; |
| (d) | Any person that has a spouse or a child that shares the person’s home that is a partner of our internal or external auditor; |
| (e) | Any person that is or has been, within the last 3 years, or has an immediate family member that is or has been, within the last 3 years, an executive officer of another entity, if any of our current executive officers serve or served at the same time with that person on the other entity’s compensation committee; and |
| (f) | Any person that received more than $75,000 in direct compensation from us during any 12 month period within the last three years. |
However, when assessing the independence of our directors for purposes of this section, we have applied the definition of independence set out in NASDAQ Rule 5605(a)(2). Generally, NASDAQ Rule 5605(a)(2) provides that a director is independent if he or she is not an executive officer or employee, and does not otherwise have a relationship which, in the opinion of our Board of Directors, would interfere with the exercise of independent judgment in carrying out his or her responsibilities as a director. The following persons are deemed, for purposes of Rule 5605(a)(2) to not be independent:
| (i) | Any person that was employed by us within the last 3 years; |
| (ii) | Any person that accepted, or has an immediate family member that accepted, compensation from us in excess of $120,000 during any 12 month period within the last 3 years; |
| (iii) | Any person that is an immediate family member of another person that is, or was, at any time during the last 3 years, employed as an executive officer of our Company; |
| (iv) | Any person that is, or has an immediate family member that is, a partner, controlling shareholder or executive officer of any organization to which we have made, or from which we have received, payments in excess of the lesser of (A) 5% of the recipients total gross revenues for that year, or (B) $200,000, within the last 3 years; |
| (v) | Any person that is, or has an immediate family member that is, an executive officer of another entity where, at any time during the last 3 years, one of our executive officers served on the compensation committee of that other entity; and |
| (vi) | Any person that is, or has an immediate family member that is, a current partner of our outside auditors or was a partner or employee of our outside auditors during the last 3 years, and personally worked on our audit during that time. |
We have determined that Gary Childress, Wayne Moorhouse and John Theobald are “independent” when applying both the definition of independence required under the rules of the TSX Venture Exchange, and the definition set out in NASDAQ Rule 5605(a)(2). Thomas Conway is not an independent director because of his position as our Chief Executive Officer and President, W. Barry Girling is not independent as he provides consulting services to us, and Allen L. Ball is not independent due to his being our controlling stockholder.
81
Item 14. Principal Accounting Fees and Services.
BDO Canada LLP (“BDO”) is our independent registered public accounting firm.
The following table sets forth the aggregate fees paid or accrued for professional services rendered by BDO for the audit of our annual financial statements for the years ended April 30, 2016 and 2015, and the aggregate fees billed for audit-related services and all other services rendered by BDO for those years.
|
2016 $ |
2015 $ |
|
| Audit fees | 92,990 | 147,568 |
| Tax fees | 7,383 | 7,634 |
| Other | 8,662 | - |
| Total | 92,540 | 155,202 |
The category of “Audit fees” includes fees for our annual audit, quarterly reviews and services rendered in connection with statutory or regulatory filings with the SEC. “Tax fees” include fees incurred in the review and preparation of our annual income tax filings. “Other fees” include fees incurred for the review of other filing documents.
The Audit Committee of our Board of Directors pre-approves the scope and estimated costs of all services rendered by our Principal Accountants.
PART IV
Item 15. Exhibits, Financial Statement Schedules.
(a) Consolidated Financial Statements
| Reports of Independent Registered Public Accounting Firm | |
| Consolidated Balance Sheets | |
| Consolidated Statements of Operations | |
| Consolidated Statements of Stockholders’ Equity | |
| Consolidated Statements of Cash Flows | |
| Notes to the Consolidated Financial Statements | |
82
(b) Exhibits
| 3.1 | Certificate of Continuation.(2) |
| 3.2 | Articles of Continuance.(2) |
| 3.3 | Certificate of Amendment.(2) |
| 3.4 | Articles of Amendment.(2) |
| 3.5 | By-Laws.(2) |
| 10.1 | Assignment Agreement with Contingent Right of Reverter dated August 10, 2002, between the Company, Idaho Industrial Minerals, LLC and Northwest Kaolin Inc.(2) |
| 10.2 | Amendment and Ratifications of Assignment Agreement with Contingent Right of Reverter dated August 10, 2005, between the Company, Idaho Industrial Minerals, LLC and Northwest Kaolin Inc.(2) |
| 10.3 | Second Amendment and Ratifications of Assignment Agreement with Contingent Right of Reverter dated August 10, 2005, between the Company, Idaho Industrial Minerals, LLC and Northwest Kaolin Inc.(2) |
| 10.4 | Third Amendment and Ratifications of Assignment Agreement with Contingent Right of Reverter dated August 10, 2008, between the Company, Idaho Industrial Minerals, LLC and Northwest Kaolin Inc.(2) |
| 10.5 | Fourth Amendment and Ratifications of Assignment Agreement with Contingent Right of Reverter dated January 1, 2010, between the Company, Idaho Industrial Minerals, LLC and Northwest Kaolin Inc.(2) |
| 10.6 | Employment Agreement dated April 1, 2013 between the Company and Thomas M. Conway.(2) |
| 10.7 | Loan Agreement dated September 13, 2013 between the Company and BV Lending LLC.(2) |
| 10.8 | Stock Option Plan.(1) |
| 10.9 | Sales Agreement dated April 28, 2014 between I-Minerals USA, Inc. and Pre-Mix, Inc.(2) |
| 10.10 | Loan Agreement dated February 18, 2015 between the Company and BV Lending LLC.(3) |
| 10.11 | Amendment Agreement dated December 1, 2015 between the Company and BV Lending LLC.(4) |
| 10.12 | Global Settlement and Absolute Agreement dated October 29, 2015 among I-Minerals Inc., Idaho Industrial Minerals, LLC, Hoodoo Resources, LLC, Robert Lemke, Brent Thomson, The Thomson Family Trust, the Estate of Philip Nisbet, Allen Ball, the Allen Ball and Connie Ball Family Trust, Ball Ventures, LLC and BV Natural Resources, LLC.(5) |
| 31.1 | Certification of Chief Executive Officer pursuant to Section 302 of Sarbanes-Oxley Act of 2002 (Rule 13a-14 and 15d-14 of the Exchange Act) |
| 31.2 | Certification of Chief Financial Officer pursuant to Section 302 of Sarbanes-Oxley Act of 2002 (Rule 13a-14 and 15d-14 of the Exchange Act) |
| 32.1 | Certification of Chief Executive Officer pursuant to pursuant to Section 1350 of Title 18 of the United States Code |
| 32.2 | Certification of Chief Financial Officer pursuant to pursuant to Section 1350 of Title 18 of the United States Code |
Notes:
| (1) | Filed as an exhibit to our Registration Statement on Form 10 filed with the SEC on November 17, 2014. |
| (2) | Filed as an exhibit to our Registration Statement on Form 10/A filed with the SEC on December 24, 2014. |
| (3) | Filed as an exhibit to our Current Report on Form 8-K filed with the SEC on March 11, 2015. |
| (4) | Filed as an exhibit to our Current Report on Form 8-K filed with the SEC on December 7, 2015. | |
| (5) | Filed as an exhibit to our Form 10-Q/A filed with the SEC on June 17, 2016. |
83
SIGNATURES
In accordance with Section 13 or 15(d) of the Securities Exchange Act of 1934, the registrant caused this report to be signed on its behalf by the undersigned, thereunto duly authorized.
| I-MINERALS INC. | |||
| Date: | July 27, 2016 | By: | /s/ Thomas M. Conway |
| THOMAS M. CONWAY | |||
| Chief Executive Officer and President | |||
| (Principal Executive Officer) | |||
| Date: | July 27, 2016 | By: | /s/ Matthew Anderson |
| MATTHEW ANDERSON | |||
| Chief Financial Officer | |||
| (Principal Financial Officer and Principal Accounting Officer) |
In accordance with the Securities Exchange Act, this report has been signed below by the following persons on behalf of the registrant and in the capacities and on the dates indicated.
| Date: | July 27, 2016 | By: | /s/ Thomas M. Conway |
| THOMAS M. CONWAY | |||
| Chief Executive Officer, President and Director | |||
| Date: | July 27, 2016 | By: | /s/ Allen L. Ball |
| ALLEN L. BALL | |||
| Director | |||
| Date: | July 27, 2016 | By: | /s/ W. Barry Girling |
| W. BARRY GIRLING | |||
| Director | |||
| Date: | July 27, 2016 | By: | /s/ Gary Childress |
| GARY CHILDRESS | |||
| Director | |||
| Date: | July 27, 2016 | By: | /s/ Wayne Moorhouse |
| WAYNE MOORHOUSE | |||
| Director | |||
| Date: | July 27, 2016 | By: | /s/ John Theobald |
| JOHN THEOBALD | |||
| Director |