Attached files
| file | filename |
|---|---|
| EX-32.2 - CERTIFICATION OF OUR CFO PURSUANT TO SECTION 906 - Keurig Dr Pepper Inc. | dps-ex322_20160630.htm |
| EX-32.1 - CERTIFICATION OF OUR CEO PURSUANT TO SECTION 906 - Keurig Dr Pepper Inc. | dps-ex321_20160630.htm |
| EX-31.2 - CERTIFICATION OF OUR CFO PURSUANT TO SECTION 302 - Keurig Dr Pepper Inc. | dps-ex312_20160630.htm |
| EX-31.1 - CERTIFICATION OF OUR CEO PURSUANT TO SECTION 302 - Keurig Dr Pepper Inc. | dps-ex311_20160630.htm |
| EX-12.1 - COMPUTATION OF RATIO OF EARNINGS TO FIXED CHARGES - Keurig Dr Pepper Inc. | dps-ex121_20160630.htm |
UNITED STATES
SECURITIES AND EXCHANGE COMMISSION
Washington, D.C. 20549
FORM 10-Q
x QUARTERLY REPORT PURSUANT TO SECTION 13 OR 15(d) OF THE SECURITIES EXCHANGE ACT OF 1934
FOR THE QUARTERLY PERIOD ENDED June 30, 2016
OR
o TRANSITION REPORT PURSUANT TO SECTION 13 OR 15(d)
OF THE SECURITIES EXCHANGE ACT OF 1934
For the transition period from to

Commission file number 001-33829
Delaware | 98-0517725 | |
(State or other jurisdiction of | (I.R.S. employer | |
incorporation or organization) | identification number) | |
5301 Legacy Drive, Plano, Texas | 75024 | |
(Address of principal executive offices) | (Zip code) | |
(972) 673-7000
(Registrant's telephone number, including area code)
Indicate by check mark whether the registrant (1) has filed all reports required to be filed by Section 13 or 15(d) of the Securities Exchange Act of 1934 during the preceding 12 months (or for such shorter period that the registrant was required to file such reports), and (2) has been subject to such filing requirements for the past 90 days.
Yes x No o
Indicate by check mark whether the registrant has submitted electronically and posted on its corporate Web site, if any, every Interactive Data File required to be submitted and posted pursuant to Rule 405 of Regulation S-T (§232.405 of this chapter) during the preceding 12 months (or for such shorter period that the registrant was required to submit and post such files).
Yes x No o
Indicate by check mark whether the registrant is a large accelerated filer, an accelerated filer, a non-accelerated filer or a smaller reporting company. See the definitions of "large accelerated filer", "accelerated filer" and "smaller reporting company" in Rule 12b-2 of the Securities Exchange Act of 1934.
Large Accelerated Filer x | Accelerated Filer o | Non-Accelerated Filer o | Smaller Reporting Company o | |||
(Do not check if a smaller reporting company) | ||||||
Indicate by check mark whether the registrant is a shell company (as defined in Rule 12b-2 of the Securities Exchange Act of 1934).
Yes o No x
As of July 25, 2016, there were 185,404,580 shares of the registrant's common stock, par value $0.01 per share, outstanding.
DR PEPPER SNAPPLE GROUP, INC.
FORM 10-Q
INDEX
Page | ||||
ii
PART I - FINANCIAL INFORMATION
ITEM 1. | Financial Statements (Unaudited) |
DR PEPPER SNAPPLE GROUP, INC.
CONDENSED CONSOLIDATED STATEMENTS OF INCOME
For the Three and Six Months Ended June 30, 2016 and 2015
(Unaudited)
For the | For the | ||||||||||||||
Three Months Ended | Six Months Ended | ||||||||||||||
June 30, | June 30, | ||||||||||||||
(in millions, except per share data) | 2016 | 2015 | 2016 | 2015 | |||||||||||
Net sales | $ | 1,695 | $ | 1,655 | $ | 3,182 | $ | 3,106 | |||||||
Cost of sales | 670 | 674 | 1,272 | 1,276 | |||||||||||
Gross profit | 1,025 | 981 | 1,910 | 1,830 | |||||||||||
Selling, general and administrative expenses | 590 | 586 | 1,136 | 1,138 | |||||||||||
Depreciation and amortization | 24 | 26 | 50 | 53 | |||||||||||
Other operating income, net | (1 | ) | — | (1 | ) | — | |||||||||
Income from operations | 412 | 369 | 725 | 639 | |||||||||||
Interest expense | 33 | 28 | 66 | 55 | |||||||||||
Interest income | (1 | ) | (1 | ) | (1 | ) | (1 | ) | |||||||
Other (income) expense, net | (22 | ) | 1 | (23 | ) | — | |||||||||
Income before provision for income taxes and equity in earnings of unconsolidated subsidiaries | 402 | 341 | 683 | 585 | |||||||||||
Provision for income taxes | 142 | 121 | 241 | 208 | |||||||||||
Income before equity in earnings of unconsolidated subsidiaries | 260 | 220 | 442 | 377 | |||||||||||
Equity in earnings of unconsolidated subsidiaries, net of tax | — | — | — | — | |||||||||||
Net income | $ | 260 | $ | 220 | $ | 442 | $ | 377 | |||||||
Earnings per common share: | |||||||||||||||
Basic | $ | 1.40 | $ | 1.15 | $ | 2.37 | $ | 1.96 | |||||||
Diluted | 1.39 | 1.14 | 2.35 | 1.95 | |||||||||||
Weighted average common shares outstanding: | |||||||||||||||
Basic | 185.7 | 191.4 | 186.7 | 192.2 | |||||||||||
Diluted | 186.5 | 192.4 | 187.7 | 193.5 | |||||||||||
Cash dividends declared per common share | $ | 0.53 | $ | 0.48 | $ | 1.06 | $ | 0.96 | |||||||
The accompanying notes are an integral part of these unaudited condensed consolidated financial statements.
1
DR PEPPER SNAPPLE GROUP, INC.
CONDENSED CONSOLIDATED STATEMENTS OF COMPREHENSIVE INCOME
For the Three and Six Months Ended June 30, 2016 and 2015
(Unaudited)
For the | For the | ||||||||||||||
Three Months Ended | Six Months Ended | ||||||||||||||
June 30, | June 30, | ||||||||||||||
(in millions) | 2016 | 2015 | 2016 | 2015 | |||||||||||
Comprehensive income | $ | 245 | $ | 233 | $ | 435 | $ | 365 | |||||||
The accompanying notes are an integral part of these unaudited condensed consolidated financial statements.
2
DR PEPPER SNAPPLE GROUP, INC.
CONDENSED CONSOLIDATED BALANCE SHEETS
As of June 30, 2016 and December 31, 2015
(Unaudited)
June 30, | December 31, | ||||||
(in millions, except share and per share data) | 2016 | 2015 | |||||
Assets | |||||||
Current assets: | |||||||
Cash and cash equivalents | $ | 245 | $ | 911 | |||
Accounts receivable: | |||||||
Trade, net | 642 | 570 | |||||
Other | 58 | 58 | |||||
Inventories | 236 | 209 | |||||
Prepaid expenses and other current assets | 144 | 69 | |||||
Total current assets | 1,325 | 1,817 | |||||
Property, plant and equipment, net | 1,129 | 1,156 | |||||
Investments in unconsolidated subsidiaries | 35 | 31 | |||||
Goodwill | 2,986 | 2,988 | |||||
Other intangible assets, net | 2,658 | 2,663 | |||||
Other non-current assets | 209 | 150 | |||||
Non-current deferred tax assets | 64 | 64 | |||||
Total assets | $ | 8,406 | $ | 8,869 | |||
Liabilities and Stockholders' Equity | |||||||
Current liabilities: | |||||||
Accounts payable | $ | 359 | $ | 277 | |||
Deferred revenue | 64 | 64 | |||||
Short-term borrowings and current portion of long-term obligations | 9 | 507 | |||||
Income taxes payable | 50 | 27 | |||||
Other current liabilities | 688 | 708 | |||||
Total current liabilities | 1,170 | 1,583 | |||||
Long-term obligations | 2,921 | 2,875 | |||||
Non-current deferred tax liabilities | 811 | 787 | |||||
Non-current deferred revenue | 1,150 | 1,181 | |||||
Other non-current liabilities | 212 | 260 | |||||
Total liabilities | 6,264 | 6,686 | |||||
Commitments and contingencies | |||||||
Stockholders' equity: | |||||||
Preferred stock, $0.01 par value, 15,000,000 shares authorized, no shares issued | — | — | |||||
Common stock, $0.01 par value, 800,000,000 shares authorized, 185,403,402 and 187,841,509 shares issued and outstanding for 2016 and 2015, respectively | 2 | 2 | |||||
Additional paid-in capital | 94 | 211 | |||||
Retained earnings | 2,248 | 2,165 | |||||
Accumulated other comprehensive loss | (202 | ) | (195 | ) | |||
Total stockholders' equity | 2,142 | 2,183 | |||||
Total liabilities and stockholders' equity | $ | 8,406 | $ | 8,869 | |||
The accompanying notes are an integral part of these unaudited condensed consolidated financial statements.
3
DR PEPPER SNAPPLE GROUP, INC.
CONDENSED CONSOLIDATED STATEMENTS OF CASH FLOWS
For the Six Months Ended June 30, 2016 and 2015
(Unaudited)
For the | |||||||
Six Months Ended | |||||||
June 30, | |||||||
(in millions) | 2016 | 2015 | |||||
Operating activities: | |||||||
Net income | $ | 442 | $ | 377 | |||
Adjustments to reconcile net income to net cash provided by operating activities: | |||||||
Depreciation expense | 95 | 96 | |||||
Amortization expense | 16 | 16 | |||||
Amortization of deferred revenue | (32 | ) | (32 | ) | |||
Employee stock-based compensation expense | 22 | 21 | |||||
Deferred income taxes | 30 | 19 | |||||
Gain on extinguishment of multi-employer plan withdrawal liability | (21 | ) | — | ||||
Other, net | (50 | ) | (21 | ) | |||
Changes in assets and liabilities, net of effects of acquisition: | |||||||
Trade accounts receivable | (74 | ) | (78 | ) | |||
Other accounts receivable | (5 | ) | (2 | ) | |||
Inventories | (29 | ) | (16 | ) | |||
Other current and non-current assets | (80 | ) | (77 | ) | |||
Other current and non-current liabilities | (33 | ) | (41 | ) | |||
Trade accounts payable | 81 | 18 | |||||
Income taxes payable | 45 | 69 | |||||
Net cash provided by operating activities | 407 | 349 | |||||
Investing activities: | |||||||
Purchase of property, plant and equipment | (68 | ) | (42 | ) | |||
Purchase of intangible assets | — | (1 | ) | ||||
Investment in unconsolidated subsidiaries | (6 | ) | — | ||||
Purchase of cost method investment | (1 | ) | (15 | ) | |||
Proceeds from disposals of property, plant and equipment | 3 | 11 | |||||
Other, net | (7 | ) | — | ||||
Net cash used in investing activities | (79 | ) | (47 | ) | |||
Financing activities: | |||||||
Repayment of senior unsecured notes | (500 | ) | — | ||||
Repurchase of shares of common stock | (303 | ) | (251 | ) | |||
Dividends paid | (190 | ) | (172 | ) | |||
Tax withholdings related to net share settlements of certain stock awards | (31 | ) | (27 | ) | |||
Proceeds from stock options exercised | 12 | 22 | |||||
Excess tax benefit on stock-based compensation | 21 | 20 | |||||
Capital lease payments | (4 | ) | (2 | ) | |||
Other, net | — | 1 | |||||
Net cash used in financing activities | (995 | ) | (409 | ) | |||
Cash and cash equivalents — net change from: | |||||||
Operating, investing and financing activities | (667 | ) | (107 | ) | |||
Effect of exchange rate changes on cash and cash equivalents | 1 | (3 | ) | ||||
Cash and cash equivalents at beginning of period | 911 | 237 | |||||
Cash and cash equivalents at end of period | $ | 245 | $ | 127 | |||
See Note 12 for supplemental cash flow information.
The accompanying notes are an integral part of these unaudited condensed consolidated financial statements.
4
DR PEPPER SNAPPLE GROUP, INC.
CONDENSED CONSOLIDATED STATEMENT OF CHANGES IN STOCKHOLDERS' EQUITY
For the Six Months Ended June 30, 2016
(Unaudited)
Accumulated | ||||||||||||||||||||||
Common Stock | Additional | Other | ||||||||||||||||||||
Issued | Paid-In | Retained | Comprehensive | Total | ||||||||||||||||||
(in millions, except per share data) | Shares | Amount | Capital | Earnings | Loss | Equity | ||||||||||||||||
Balance as of January 1, 2016 | 187.9 | $ | 2 | $ | 211 | $ | 2,165 | $ | (195 | ) | $ | 2,183 | ||||||||||
Shares issued under employee stock-based compensation plans and other | 0.9 | — | — | — | — | — | ||||||||||||||||
Net income | — | — | — | 442 | — | 442 | ||||||||||||||||
Other comprehensive loss | — | — | — | — | (7 | ) | (7 | ) | ||||||||||||||
Dividends declared, $1.06 per share | — | — | 2 | (199 | ) | — | (197 | ) | ||||||||||||||
Stock options exercised and stock-based compensation, net of tax of ($21) | — | — | 24 | — | — | 24 | ||||||||||||||||
Common stock repurchases | (3.4 | ) | — | (143 | ) | (160 | ) | — | (303 | ) | ||||||||||||
Balance as of June 30, 2016 | 185.4 | $ | 2 | $ | 94 | $ | 2,248 | $ | (202 | ) | $ | 2,142 | ||||||||||
The accompanying notes are an integral part of these unaudited condensed consolidated financial statements.
5
DR PEPPER SNAPPLE GROUP, INC.
NOTES TO CONDENSED CONSOLIDATED FINANCIAL STATEMENTS
(Unaudited)
1. | General |
References in this Quarterly Report on Form 10-Q to "DPS" or "the Company" refer to Dr Pepper Snapple Group, Inc. and all entities included in the unaudited condensed consolidated financial statements.
This Quarterly Report on Form 10-Q refers to some of DPS' owned or licensed trademarks, trade names and service marks, which are referred to as the Company's brands. All of the product names included herein are either DPS' registered trademarks or those of the Company's licensors.
BASIS OF PRESENTATION
The accompanying unaudited condensed consolidated financial statements have been prepared in accordance with accounting principles generally accepted in the United States of America ("U.S. GAAP") for interim financial information and in accordance with the instructions to Form 10-Q and Article 10 of Regulation S-X. Accordingly, they do not include all of the information and footnotes required by U.S. GAAP for complete consolidated financial statements. In the opinion of management, all adjustments, consisting principally of normal recurring adjustments, considered necessary for a fair presentation have been included. The preparation of financial statements in conformity with U.S. GAAP requires management to make estimates and assumptions that affect the amounts reported in the financial statements and the accompanying notes. Actual results could differ from these estimates. These unaudited condensed consolidated financial statements should be read in conjunction with the Company's audited consolidated financial statements and the notes thereto in the Company's Annual Report on Form 10-K for the year ended December 31, 2015 ("Annual Report").
PRINCIPLES OF CONSOLIDATION
DPS consolidates all wholly owned subsidiaries. The Company uses the equity method to account for investments in companies if the investment provides the Company with the ability to exercise significant influence over operating and financial policies of the investee. Consolidated net income includes DPS' proportionate share of the net income or loss of these companies. Judgment regarding the level of influence over each equity method investment includes considering key factors such as ownership interest, representation on the board of directors, participation in policy-making decisions and material intercompany transactions.
The Company is also required to consolidate entities that are variable interest entities (“VIEs”) of which DPS is the primary beneficiary. Judgments are made in assessing whether the Company is the primary beneficiary, including determination of the activities that most significantly impact the VIE’s economic performance.
The Company eliminates from its financial results all intercompany transactions between entities included in the unaudited condensed consolidated financial statements and the intercompany transactions with its equity method investees.
USE OF ESTIMATES
The process of preparing DPS' unaudited condensed consolidated financial statements in conformity with U.S. GAAP requires the use of estimates and judgments that affect the reported amount of assets, liabilities, revenue and expenses. These estimates and judgments are based on historical experience, future expectations and other factors and assumptions the Company believes to be reasonable under the circumstances. These estimates and judgments are reviewed on an ongoing basis and are revised when necessary. Changes in estimates are recorded in the period of change. Actual amounts may differ from these estimates.
The following critical accounting estimates are discussed in greater detail in our Annual Report:
•goodwill and other indefinite-lived intangible assets;
•revenue recognition;
•pension benefits;
•risk management programs; and
•income taxes.
6
DR PEPPER SNAPPLE GROUP, INC.
NOTES TO CONDENSED CONSOLIDATED FINANCIAL STATEMENTS
(Unaudited, Continued)
RECLASSIFICATION
Capital lease payments have been reclassified from other, net to the capital lease payments caption within the financing activities section in the unaudited Condensed Consolidated Statements of Cash Flows for the prior period to conform to the current period's presentation, with no impact to total cash provided by (used in) operating, investing or financing activities. This reclassification within the unaudited Condensed Consolidated Statements of Cash Flows also resulted in corresponding changes to the prior period presentation in Note 15.
RECENTLY ISSUED ACCOUNTING STANDARDS
In May 2014, the Financial Accounting Standards Board ("FASB") issued Accounting Standards Update ("ASU") 2014-09, Revenue from Contracts with Customers (Topic 606) ("ASU 2014-09"). The new guidance sets forth a new five-step revenue recognition model which replaces the prior revenue recognition guidance in its entirety and is intended to eliminate numerous industry-specific pieces of revenue recognition guidance that have historically existed in U.S. GAAP. The underlying principle of the new standard is that a business or other organization will recognize revenue to depict the transfer of promised goods or services to customers in an amount that reflects what it expects in exchange for the goods or services. The standard also requires more detailed disclosures and provides additional guidance for transactions that were not addressed completely in the prior accounting guidance. ASU 2014-09 provides alternative methods of initial adoption.
In August 2015, the FASB issued ASU 2015-14, Revenue from Contracts with Customers (Topic 606): Deferral of the Effective Date, which defers the effective date of ASU 2014-09 by one year to December 15, 2017 for interim and annual reporting periods beginning after that date and permitted early adoption of the standard, but not before the original effective date. In March 2016, the FASB issued ASU 2016-08, Revenue from Contracts with Customers (Topic 606): Principal versus Agent Considerations (Reporting Revenue Gross versus Net), which clarifies the implementation guidance on principal versus agent considerations for the new model. In April 2016, the FASB issued ASU 2016-10, Revenue from Contracts with Customers (Topic 606): Identifying Performance Obligations and Licensing, which clarifies the implementation guidance related to identifying performance obligations and licensing for the new model. In May 2016, the FASB issued ASU 2016-12, Revenue from Contracts with Customers (Topic 606): Narrow-Scope Improvements and Practical Expedients, which improves guidance on assessing collectibility, presentation of sales taxes, noncash consideration, and completed contracts and contract modifications at transition. These updates are effective concurrently with Topic 606 (ASU 2014-09).
The Company is currently evaluating the impact that the above standards will have on the consolidated financial statements and does not plan to early adopt these ASUs.
In January 2016, the FASB issued ASU No. 2016-01, Financial Instruments - Overall (Subtopic 825-10): Recognition and Measurement of Financial Assets and Financial Liabilities. The ASU enhances the reporting model for financial instruments, which includes amendments to address aspects of recognition, measurement, presentation and disclosure. The update to the standard is effective for public companies for interim and annual periods beginning after December 15, 2017. The Company is currently evaluating the impact that the standard will have on the consolidated financial statements and will adopt this standard as of January 1, 2018.
In February 2016, the FASB issued ASU 2016-02, Leases (Topic 842) ("ASU 2016-02"). The ASU replaces the prior lease accounting guidance in its entirety. The underlying principle of the new standard is the recognition of lease assets and lease liabilities by lessees for substantially all leases, with an exception for leases with terms of less than twelve months. The standard also requires additional quantitative and qualitative disclosures. ASU 2016-02 is effective for interim and annual reporting periods beginning after December 15, 2018, and early adoption is permitted. The standard requires a modified retrospective approach, which includes several optional practical expedients. The Company is currently evaluating the impact that ASU 2016-02 will have on the consolidated financial statements.
In March 2016, the FASB issued ASU 2016-09, Compensation - Stock Compensation (Topic 718): Improvements to Employee Share Based Payment Accounting ("ASU 2016-09") as part of the FASB simplification initiative. The new standard provides for changes to accounting for stock compensation including 1) excess tax benefits and tax deficiencies related to share based payment awards will be recognized as income tax expense in the reporting period in which they occur; 2) excess tax benefits will be classified as an operating activity in the statement of cash flow; 3) the option to elect to estimate forfeitures or account for them when they occur; and 4) increase tax withholding requirements threshold to qualify for equity classification. The ASU is effective for public companies for annual periods, and interim periods within those annual periods, beginning after December 15, 2016, and early adoption is permitted. The Company is currently evaluating the impact that ASU 2016-09 will have on the consolidated financial statements.
7
DR PEPPER SNAPPLE GROUP, INC.
NOTES TO CONDENSED CONSOLIDATED FINANCIAL STATEMENTS
(Unaudited, Continued)
In June 2016, the FASB issued ASU 2016-13, Financial Instruments - Credit Losses (Topic 326): Measurement of Credit Losses on Financial Instruments ("ASU 2016-13"). The standard provides for a new impairment model which requires measurement and recognition of expected credit losses for most financial assets held. The ASU is effective for public companies for annual periods, and interim periods within those annual periods, beginning after December 15, 2019. The Company is currently evaluating the impact that ASU 2016-13 will have on the consolidated financial statements.
RECENTLY ADOPTED PROVISIONS OF U.S. GAAP
As of January 1, 2016, the Company adopted ASU 2015-16, Business Combinations (Topic 805): Simplifying the Accounting for Measurement-Period Adjustments, on a prospective basis with no impact to the unaudited condensed consolidated financial statements.
In March 2016, the FASB issued ASU 2016-05, Derivatives and Hedging (Topic 815): Effect of Derivative Contract Novations on Existing Hedge Accounting Relationships ("ASU 2016-05"). The ASU clarifies that a change in counterparty to a derivative instrument that has been designated as a hedging instrument under Topic 815 does not require de-designation of that hedging relationship, provided that all other hedge accounting criteria continue to be met. ASU 2016-05 is effective for public companies for annual, and interim periods within those annual periods, beginning after December 15, 2016, and early adoption is permitted. ASU 2016-05 may be adopted on either a prospective basis or a modified retrospective basis. The Company has adopted ASU 2016-05 as of March 31, 2016, on a prospective basis, with no impact to the unaudited condensed consolidated financial statements.
In March 2016, the FASB issued ASU 2016-07, Investments - Equity Method and Joint Ventures (Topic 323): Simplifying the Transition to the Equity Method of Accounting ("ASU 2016-07"). The ASU eliminates the requirement to retroactively adopt the equity method of accounting when an investment qualifies for use of the equity method as a result of an increase in the level of ownership interest or degree of influence. ASU 2016-07 is effective for interim and annual reporting periods beginning after December 15, 2016, and early adoption is permitted. The Company has adopted ASU 2016-07 as of March 31, 2016, on a prospective basis, with no impact to the unaudited condensed consolidated financial statements.
2. | Inventories |
Inventories consisted of the following:
June 30, | December 31, | ||||||
(in millions) | 2016 | 2015 | |||||
Raw materials | $ | 80 | $ | 101 | |||
Spare parts | 17 | 18 | |||||
Work in process | 5 | 4 | |||||
Finished goods | 169 | 123 | |||||
Inventories at first in first out cost | 271 | 246 | |||||
Reduction to last-in, first-out ("LIFO") cost | (35 | ) | (37 | ) | |||
Inventories | $ | 236 | $ | 209 | |||
Approximately $176 million and $154 million of the Company's inventory was accounted for under the LIFO method of accounting as of June 30, 2016 and December 31, 2015, respectively. The reduction to LIFO cost reflects the excess of the current cost of LIFO inventories as of June 30, 2016 and December 31, 2015, over the amount at which these inventories were valued on the unaudited Condensed Consolidated Balance Sheets. For the three and six months ended June 30, 2016, LIFO inventory liquidation increased the Company's gross profit by $2 million. For the three and six months ended June 30, 2015, LIFO inventory liquidation increased the Company's gross profit by $3 million.
3. Investments in Unconsolidated Subsidiaries
On March 24, 2016, the Company acquired an additional 3.8% interest in BA Sports Nutrition, LLC for $6 million, which increased the total ownership interest in the equity method investment to 15.5%. The carrying value of the aggregate investment was $25 million as of June 30, 2016.
8
DR PEPPER SNAPPLE GROUP, INC.
NOTES TO CONDENSED CONSOLIDATED FINANCIAL STATEMENTS
(Unaudited, Continued)
4. | Prepaid Expenses and Other Current Assets and Other Current Liabilities |
The table below details the components of prepaid expenses and other current assets and other current liabilities:
June 30, | December 31, | ||||||
(in millions) | 2016 | 2015 | |||||
Prepaid expenses and other current assets: | |||||||
Customer incentive programs | $ | 66 | $ | 21 | |||
Derivative instruments | 12 | 9 | |||||
Other | 66 | 39 | |||||
Total prepaid expenses and other current assets | $ | 144 | $ | 69 | |||
Other current liabilities: | |||||||
Customer rebates and incentives | $ | 312 | $ | 283 | |||
Accrued compensation | 101 | 133 | |||||
Insurance liability | 46 | 42 | |||||
Interest accrual | 22 | 30 | |||||
Dividends payable | 97 | 90 | |||||
Derivative instruments | 10 | 29 | |||||
Other | 100 | 101 | |||||
Total other current liabilities | $ | 688 | $ | 708 | |||
5. | Debt |
The following table summarizes the Company's long-term obligations:
June 30, | December 31, | ||||||
(in millions) | 2016 | 2015 | |||||
Senior unsecured notes(1) | $ | 2,789 | $ | 3,246 | |||
Capital lease obligations | 141 | 136 | |||||
Subtotal | 2,930 | 3,382 | |||||
Less - current portion | (9 | ) | (507 | ) | |||
Long-term obligations | $ | 2,921 | $ | 2,875 | |||
(1) | The carrying amount includes the unamortized net discount on debt issuances and adjustments of $81 million and $40 million as of June 30, 2016 and December 31, 2015, respectively, related to the change in the fair value of interest rate swaps designated as fair value hedges. See Note 6 for further information regarding derivatives. |
The following table summarizes the Company's short-term borrowings and current portion of long-term obligations:
June 30, | December 31, | ||||||
(in millions) | 2016 | 2015 | |||||
Commercial paper | $ | — | $ | — | |||
Current portion of long-term obligations: | |||||||
Senior unsecured notes | — | 500 | |||||
Capital lease obligations | 9 | 7 | |||||
Short-term borrowings and current portion of long-term obligations | $ | 9 | $ | 507 | |||
9
DR PEPPER SNAPPLE GROUP, INC.
NOTES TO CONDENSED CONSOLIDATED FINANCIAL STATEMENTS
(Unaudited, Continued)
SENIOR UNSECURED NOTES
The Company's senior unsecured notes consisted of the following:
(in millions) | Principal Amount | Carrying Amount | ||||||||||||||
June 30, | June 30, | December 31, | ||||||||||||||
Issuance | Maturity Date | Rate | 2016 | 2016 | 2015 | |||||||||||
2016 Notes(1) | January 15, 2016 | 2.90% | $ | — | $ | — | $ | 500 | ||||||||
2018 Notes | May 1, 2018 | 6.82% | 724 | 723 | 723 | |||||||||||
2019 Notes | January 15, 2019 | 2.60% | 250 | 252 | 250 | |||||||||||
2020 Notes | January 15, 2020 | 2.00% | 250 | 250 | 246 | |||||||||||
2021 Notes | November 15, 2021 | 3.20% | 250 | 257 | 250 | |||||||||||
2022 Notes | November 15, 2022 | 2.70% | 250 | 277 | 265 | |||||||||||
2025 Notes | November 15, 2025 | 3.40% | 500 | 494 | 494 | |||||||||||
2038 Notes | May 1, 2038 | 7.45% | 250 | 289 | 271 | |||||||||||
2045 Notes | November 15, 2045 | 4.50% | 250 | 247 | 247 | |||||||||||
$ | 2,724 | $ | 2,789 | $ | 3,246 | |||||||||||
(1) | On January 15, 2016, the Company used a portion of the net proceeds from the November 2015 issuance of the 2025 and 2045 Notes for repayment of the aggregate principal amount of the 2016 Notes of $500 million at maturity. |
UNSECURED CREDIT AGREEMENT
The following table provides amounts utilized and available under our $500 million revolving line of credit (the "Revolver") and each sublimit arrangement type as of June 30, 2016:
(in millions) | Amount Utilized | Balances Available | |||||
Revolver | $ | — | $ | 500 | |||
Letters of credit | — | 75 | |||||
Swingline advances | — | 50 | |||||
As of June 30, 2016, the Company was in compliance with all financial covenant requirements relating to its unsecured credit agreement.
LETTERS OF CREDIT FACILITIES
In addition to the portion of the Revolver reserved for issuance of letters of credit, the Company has incremental letters of credit facilities. Under these facilities, $120 million is available for the issuance of letters of credit, $60 million of which was utilized as of June 30, 2016 and $60 million of which remains available for use.
10
DR PEPPER SNAPPLE GROUP, INC.
NOTES TO CONDENSED CONSOLIDATED FINANCIAL STATEMENTS
(Unaudited, Continued)
6. Derivatives
DPS is exposed to market risks arising from adverse changes in:
•interest rates;
•foreign exchange rates; and
• | commodity prices affecting the cost of raw materials and fuels, which are recorded in cost of sales and selling, general and administrative ("SG&A") expenses, respectively. |
The Company manages these risks through a variety of strategies, including the use of interest rate contracts, foreign exchange forward contracts, commodity forward and future contracts and supplier pricing agreements. DPS does not hold or issue derivative financial instruments for trading or speculative purposes.
The Company formally designates and accounts for certain interest rate contracts and foreign exchange forward contracts that meet established accounting criteria under U.S. GAAP as either fair value or cash flow hedges. For derivative instruments that are designated and qualify as cash flow hedges, the effective portion of the gain or loss on the derivative instruments is recorded, net of applicable taxes, in Accumulated Other Comprehensive Loss ("AOCL"), a component of Stockholders' Equity in the unaudited Condensed Consolidated Balance Sheets. When net income is affected by the variability of the underlying transaction, the applicable offsetting amount of the gain or loss from the derivative instrument deferred in AOCL is reclassified to net income and is reported as a component of the unaudited Condensed Consolidated Statements of Income. For derivative instruments that are designated and qualify as fair value hedges, the effective change in the fair value of the instrument, as well as the offsetting gain or loss on the hedged item attributable to the hedged risk, are recognized immediately in current-period earnings. For derivatives that are not designated or are de-designated as a hedging instrument, the gain or loss on the instrument is recognized in earnings in the period of change.
Certain interest rate contracts qualify for the "shortcut" method of accounting for hedges under U.S. GAAP. Under the shortcut method, the hedges are assumed to be perfectly effective and no ineffectiveness is recorded in earnings. For all other designated hedges, the Company assesses whether the derivative instrument is effective in offsetting the changes in fair value or variability of cash flows at the inception of the derivative contract. DPS measures hedge ineffectiveness on a quarterly basis throughout the designated period. Changes in the fair value of the derivative instrument that do not effectively offset changes in the fair value of the underlying hedged item throughout the designated hedge period are recorded in earnings each period.
If a fair value or cash flow hedge were to cease to qualify for hedge accounting, or were terminated, the derivatives would continue to be carried on the balance sheet at fair value until settled and hedge accounting would be discontinued prospectively. If the underlying hedged transaction ceases to exist, any associated amounts reported in AOCL would be reclassified to earnings at that time.
11
DR PEPPER SNAPPLE GROUP, INC.
NOTES TO CONDENSED CONSOLIDATED FINANCIAL STATEMENTS
(Unaudited, Continued)
INTEREST RATES
Fair Value Hedges
The Company is exposed to the risk of changes in the fair value of certain fixed-rate debt attributable to changes in interest rates and manages these risks through the use of receive-fixed, pay-variable interest rate swaps. Any ineffectiveness is recorded as interest during the period incurred. The following table presents information regarding these interest rate swaps and the associated hedging relationships:
Impact to the carrying value | ||||||||||||||||||
($ in millions) | Method of | of long-term debt | ||||||||||||||||
Hedging | Number of | measuring | Notional | June 30, | December 31, | |||||||||||||
Period entered | relationship | instruments | effectiveness | value | 2016 | 2015 | ||||||||||||
November 2011 | 2019 Notes | 2 | Short cut method | $ | 100 | $ | 2 | $ | 1 | |||||||||
November 2011 | 2021 Notes | 2 | Short cut method | 150 | 8 | 1 | ||||||||||||
November 2012 | 2020 Notes | 5 | Short cut method | 120 | 2 | (2 | ) | |||||||||||
December 2013 | 2022 Notes | 4 | Cumulative dollar offset(1) | 250 | 28 | 17 | ||||||||||||
February 2015 | 2038 Notes | 1 | Regression | 100 | 41 | 23 | ||||||||||||
$ | 81 | $ | 40 | |||||||||||||||
(1) | The assessment of hedge effectiveness is made by comparing the cumulative change in the fair value of the hedged item attributable to changes in the benchmark interest rate with the cumulative changes in the fair value of the interest rate swap. |
FOREIGN EXCHANGE
Cash Flow Hedges
The Company's Canadian and Mexican businesses purchase inventory through transactions denominated and settled in United States ("U.S.") dollars, a currency different from the functional currency of the those businesses. These inventory purchases are subject to exposure from movements in exchange rates. During the three and six months ended June 30, 2016 and 2015, the Company utilized foreign exchange forward contracts designated as cash flow hedges to manage the exposures resulting from changes in these foreign currency exchange rates. The intent of these foreign exchange contracts is to provide predictability in the Company's overall cost structure. These foreign exchange contracts, carried at fair value, have maturities between one and ten months as of June 30, 2016. The Company had outstanding foreign exchange forward contracts with notional amounts of $29 million and $7 million as of June 30, 2016 and December 31, 2015, respectively.
COMMODITIES
Economic Hedges
DPS centrally manages the exposure to volatility in the prices of certain commodities used in its production process and transportation through forward and future contracts. The intent of these contracts is to provide a certain level of predictability in the Company's overall cost structure. During the three and six months ended June 30, 2016 and 2015, the Company held forward and future contracts that economically hedged certain of its risks. In these cases, a natural hedging relationship exists in which changes in the fair value of the instruments act as an economic offset to changes in the fair value of the underlying items. Changes in the fair value of these instruments are recorded in net income throughout the term of the derivative instrument and are reported in the same line item of the unaudited Condensed Consolidated Statements of Income as the hedged transaction. Unrealized gains and losses are recognized as a component of unallocated corporate costs until the Company's operating segments are affected by the completion of the underlying transaction, at which time the gain or loss is reflected as a component of the respective segment's operating profit ("SOP"). The total notional values of derivatives related to economic hedges of this type were $250 million and $159 million as of June 30, 2016 and December 31, 2015, respectively.
12
DR PEPPER SNAPPLE GROUP, INC.
NOTES TO CONDENSED CONSOLIDATED FINANCIAL STATEMENTS
(Unaudited, Continued)
FAIR VALUE OF DERIVATIVE INSTRUMENTS
The following table summarizes the location of the fair value of the Company's derivative instruments within the unaudited Condensed Consolidated Balance Sheets:
(in millions) | Balance Sheet Location | June 30, 2016 | December 31, 2015 | ||||||
Assets: | |||||||||
Derivative instruments designated as hedging instruments under U.S. GAAP: | |||||||||
Interest rate contracts | Prepaid expenses and other current assets | $ | 10 | $ | 9 | ||||
Interest rate contracts | Other non-current assets | 71 | 33 | ||||||
Derivative instruments not designated as hedging instruments under U.S. GAAP: | |||||||||
Commodity contracts | Prepaid expenses and other current assets | 2 | — | ||||||
Commodity contracts | Other non-current assets | 8 | — | ||||||
Total assets | $ | 91 | $ | 42 | |||||
Liabilities: | |||||||||
Derivative instruments designated as hedging instruments under U.S. GAAP: | |||||||||
Interest rate contracts | Other current liabilities | $ | — | $ | 1 | ||||
Foreign exchange forward contracts | Other current liabilities | 1 | — | ||||||
Interest rate contracts | Other non-current liabilities | — | 1 | ||||||
Derivative instruments not designated as hedging instruments under U.S. GAAP: | |||||||||
Commodity contracts | Other current liabilities | 9 | 28 | ||||||
Commodity contracts | Other non-current liabilities | — | 3 | ||||||
Total liabilities | $ | 10 | $ | 33 | |||||
13
DR PEPPER SNAPPLE GROUP, INC.
NOTES TO CONDENSED CONSOLIDATED FINANCIAL STATEMENTS
(Unaudited, Continued)
IMPACT OF CASH FLOW HEDGES
The following table presents the impact of derivative instruments designated as cash flow hedging instruments under U.S. GAAP to the unaudited Condensed Consolidated Statements of Income and Comprehensive Income:
Amount of (Loss) Gain Recognized in | Amount of Loss Reclassified from AOCL into Income | Location of Loss Reclassified from AOCL into Income | |||||||
(in millions) | Other Comprehensive (Loss) Income ("OCI") | ||||||||
For the three months ended June 30, 2016: | |||||||||
Interest rate contracts | $ | — | $ | (2 | ) | Interest expense | |||
Foreign exchange forward contracts | — | (1 | ) | Cost of sales | |||||
Total | $ | — | $ | (3 | ) | ||||
For the six months ended June 30, 2016: | |||||||||
Interest rate contracts | $ | — | $ | (4 | ) | Interest expense | |||
Foreign exchange forward contracts | (2 | ) | (1 | ) | Cost of sales | ||||
Total | $ | (2 | ) | $ | (5 | ) | |||
For the three months ended June 30, 2015: | |||||||||
Interest rate contracts | $ | 26 | $ | (2 | ) | Interest expense | |||
Total | $ | 26 | $ | (2 | ) | ||||
For the six months ended June 30, 2015: | |||||||||
Interest rate contracts | $ | 15 | $ | (4 | ) | Interest expense | |||
Total | $ | 15 | $ | (4 | ) | ||||
There was no hedge ineffectiveness recognized in earnings for the three and six months ended June 30, 2016 and 2015 with respect to derivative instruments designated as cash flow hedges. During the next 12 months, the Company expects to reclassify pre-tax net losses of $9 million from AOCL into net income.
14
DR PEPPER SNAPPLE GROUP, INC.
NOTES TO CONDENSED CONSOLIDATED FINANCIAL STATEMENTS
(Unaudited, Continued)
IMPACT OF FAIR VALUE HEDGES
The following table presents the impact of derivative instruments designated as fair value hedging instruments under U.S. GAAP to the unaudited Condensed Consolidated Statements of Income:
Amount of Gain | Location of Gain | |||||
(in millions) | Recognized in Income | Recognized in Income | ||||
For the three months ended June 30, 2016: | ||||||
Interest rate contracts | $ | 3 | Interest expense | |||
Total | $ | 3 | ||||
For the six months ended June 30, 2016: | ||||||
Interest rate contracts | $ | 7 | Interest expense | |||
Total | $ | 7 | ||||
For the three months ended June 30, 2015: | ||||||
Interest rate contracts | $ | 5 | Interest expense | |||
Total | $ | 5 | ||||
For the six months ended June 30, 2015: | ||||||
Interest rate contracts | $ | 9 | Interest expense | |||
Total | $ | 9 | ||||
For the three and six months ended June 30, 2016, $1 million and $2 million, respectively, of hedge ineffectiveness charges were recognized in earnings with respect to derivative instruments designated as fair value hedges, respectively. For the three months ended June 30, 2015, a $1 million expense due to hedge ineffectiveness was recognized in earnings with respect to derivative instruments designated as fair value hedges. For the six months ended June 30, 2015, no hedge ineffectiveness was recognized in earnings with respect to derivative instruments designated as fair value hedges.
15
DR PEPPER SNAPPLE GROUP, INC.
NOTES TO CONDENSED CONSOLIDATED FINANCIAL STATEMENTS
(Unaudited, Continued)
IMPACT OF ECONOMIC HEDGES
The following table presents the impact of derivative instruments not designated as hedging instruments under U.S. GAAP to the unaudited Condensed Consolidated Statements of Income:
Amount of Gain (Loss) | Location of Gain (Loss) | |||||
(in millions) | Recognized in Income | Recognized in Income | ||||
For the three months ended June 30, 2016: | ||||||
Commodity contracts(1) | $ | 10 | Cost of sales | |||
Commodity contracts(1) | 8 | SG&A expenses | ||||
Total | $ | 18 | ||||
For the six months ended June 30, 2016: | ||||||
Commodity contracts(1) | $ | 9 | Cost of sales | |||
Commodity contracts(1) | 8 | SG&A expenses | ||||
Total | $ | 17 | ||||
For the three months ended June 30, 2015: | ||||||
Commodity contracts(1) | $ | (1 | ) | Cost of sales | ||
Commodity contracts(1) | (11 | ) | SG&A expenses | |||
Total | $ | (12 | ) | |||
For the six months ended June 30, 2015: | ||||||
Commodity contracts(1) | $ | — | Cost of sales | |||
Commodity contracts(1) | (17 | ) | SG&A expenses | |||
Total | $ | (17 | ) | |||
(1) | Commodity contracts include both realized and unrealized gains and losses. |
Refer to Note 8 for additional information on the valuation of derivative instruments. The Company has exposure to credit losses from derivative instruments in an asset position in the event of nonperformance by the counterparties to the agreements. Historically, DPS has not experienced credit losses as a result of counterparty nonperformance. The Company selects and periodically reviews counterparties based on credit ratings, limits its exposure to a single counterparty under defined guidelines and monitors the market position of the programs upon execution of a hedging transaction and at least on a quarterly basis.
16
DR PEPPER SNAPPLE GROUP, INC.
NOTES TO CONDENSED CONSOLIDATED FINANCIAL STATEMENTS
(Unaudited, Continued)
7. Other Non-Current Assets and Other Non-Current Liabilities
The table below details the components of other non-current assets and other non-current liabilities:
June 30, | December 31, | ||||||
(in millions) | 2016 | 2015 | |||||
Other non-current assets: | |||||||
Customer incentive programs | $ | 58 | $ | 52 | |||
Marketable securities - trading | 33 | 25 | |||||
Derivative instruments | 79 | 33 | |||||
Cost method investments | 16 | 15 | |||||
Other | 23 | 25 | |||||
Total other non-current assets | $ | 209 | $ | 150 | |||
Other non-current liabilities: | |||||||
Long-term payables due to Mondelēz International, Inc. | $ | 27 | $ | 26 | |||
Long-term pension and post-retirement liability | 41 | 40 | |||||
Multi-employer pension plan withdrawal liability(1) | — | 56 | |||||
Insurance liability | 76 | 75 | |||||
Derivative instruments | — | 4 | |||||
Deferred compensation liability | 33 | 25 | |||||
Other | 35 | 34 | |||||
Total other non-current liabilities | $ | 212 | $ | 260 | |||
(1) | During the first quarter of 2016, we negotiated a $35 million lump-sum settlement to fully extinguish the Company's multi-employer pension plan withdrawal liability, which was paid in the second quarter of 2016. As a result of the payment in the second quarter of 2016, we recognized a $21 million gain on the extinguishment of this liability, which is included in Other (income) expense, net, within our unaudited Condensed Consolidated Statements of Income. |
8. Fair Value
Under U.S. GAAP, fair value is defined as the price that would be received to sell an asset or paid to transfer a liability in an orderly transaction between market participants at the measurement date under current market conditions. U.S. GAAP provides a framework for measuring fair value and establishes a three-level hierarchy for fair value measurements based upon the transparency of inputs to the valuation of an asset or liability. The three-level hierarchy for disclosure of fair value measurements is as follows:
Level 1 - Quoted market prices in active markets for identical assets or liabilities.
Level 2 - Observable inputs such as quoted prices for similar assets or liabilities in active markets; quoted prices for identical or similar assets or liabilities in markets that are not active; and model-derived valuations in which all significant inputs and significant value drivers are observable in active markets.
Level 3 - Valuations with one or more unobservable significant inputs that reflect the reporting entity's own assumptions.
17
DR PEPPER SNAPPLE GROUP, INC.
NOTES TO CONDENSED CONSOLIDATED FINANCIAL STATEMENTS
(Unaudited, Continued)
RECURRING FAIR VALUE MEASUREMENTS
The following table presents the fair value hierarchy for those assets and liabilities measured at fair value on a recurring basis as of June 30, 2016 and December 31, 2015:
June 30, 2016 | |||||||||||
Quoted Prices in Active Markets for Identical Assets | Significant Other Observable Inputs | Significant Unobservable Inputs | |||||||||
(in millions) | Level 1 | Level 2 | Level 3 | ||||||||
Commodity contracts | $ | — | $ | 10 | $ | — | |||||
Interest rate contracts | — | 81 | — | ||||||||
Marketable securities - trading | 33 | — | — | ||||||||
Total assets | $ | 33 | $ | 91 | $ | — | |||||
Commodity contracts | $ | — | $ | 9 | $ | — | |||||
Foreign exchange forward contracts | — | 1 | — | ||||||||
Total liabilities | $ | — | $ | 10 | $ | — | |||||
December 31, 2015 | |||||||||||
Quoted Prices in Active Markets for Identical Assets | Significant Other Observable Inputs | Significant Unobservable Inputs | |||||||||
(in millions) | Level 1 | Level 2 | Level 3 | ||||||||
Interest rate contracts | $ | — | $ | 42 | $ | — | |||||
Marketable securities - trading | 25 | — | — | ||||||||
Total assets | $ | 25 | $ | 42 | $ | — | |||||
Commodity contracts | $ | — | $ | 31 | $ | — | |||||
Interest rate contracts | — | 2 | — | ||||||||
Total liabilities | $ | — | $ | 33 | $ | — | |||||
The fair values of marketable securities are determined using quoted market prices from daily exchange traded markets based on the closing price as of the balance sheet date and are classified as Level 1. The fair values of commodity forward and future contracts, interest rate swap contracts and foreign currency forward contracts are determined based on inputs that are readily available in public markets or can be derived from information available in publicly quoted markets. The fair value of commodity forward and future contracts are valued using the market approach based on observable market transactions, primarily underlying commodities futures or physical index prices, at the balance sheet date. Interest rate swap contracts are valued using models based primarily on readily observable market parameters, such as London Interbank Offered Rate forward rates, for all substantial terms of the Company's contracts and credit risk of the counterparties. The fair value of foreign currency forward contracts are valued using quoted forward foreign exchange prices at the reporting date. Therefore, the Company has categorized these contracts as Level 2.
As of June 30, 2016 and December 31, 2015, the Company did not have any assets or liabilities measured on a recurring basis without observable market values that would require a high level of judgment to determine fair value (Level 3).
There were no transfers of financial instruments between the three levels of the fair value hierarchy during the three and six months ended June 30, 2016 and 2015.
18
DR PEPPER SNAPPLE GROUP, INC.
NOTES TO CONDENSED CONSOLIDATED FINANCIAL STATEMENTS
(Unaudited, Continued)
ESTIMATED FAIR VALUE OF THE COMPANY'S FINANCIAL STATEMENT INSTRUMENTS
The carrying values and estimated fair values of the Company's financial instruments that are not required to be measured at fair value in the unaudited Condensed Consolidated Balance Sheet are as follows:
Fair Value Hierarchy Level | June 30, 2016 | December 31, 2015 | |||||||||||||||
(in millions) | Carrying Amount | Fair Value | Carrying Amount | Fair Value | |||||||||||||
Assets: | |||||||||||||||||
Cash and cash equivalents(1) | 1 | $ | 245 | $ | 245 | $ | 911 | $ | 911 | ||||||||
Liabilities: | |||||||||||||||||
Long-term debt – 2016 Notes(2) | 2 | — | — | 500 | 500 | ||||||||||||
Long-term debt – 2018 Notes(2) | 2 | 723 | 797 | 723 | 802 | ||||||||||||
Long-term debt – 2019 Notes(2) | 2 | 252 | 256 | 250 | 248 | ||||||||||||
Long-term debt – 2020 Notes(2) | 2 | 250 | 252 | 246 | 244 | ||||||||||||
Long-term debt – 2021 Notes(2) | 2 | 257 | 265 | 250 | 253 | ||||||||||||
Long-term debt – 2022 Notes(2) | 2 | 277 | 255 | 265 | 241 | ||||||||||||
Long-term debt – 2025 Notes(2) | 2 | 494 | 533 | 494 | 491 | ||||||||||||
Long-term debt – 2038 Notes(2) | 2 | 289 | 366 | 271 | 344 | ||||||||||||
Long-term debt – 2045 Notes(2) | 2 | 247 | 279 | 247 | 244 | ||||||||||||
(1) | Cash equivalents are composed of certificates of deposit, time deposits and other interest-bearing investments with original maturity dates of three months or less. Cash equivalents are recorded at cost, which approximates fair value. |
(2) | The fair value amounts of long term debt were based on current market rates available to the Company. The difference between the fair value and the carrying value represents the theoretical net premium or discount that would be paid or received to retire all debt and related unamortized costs to be incurred at such date. The carrying amount includes the unamortized discounts and issuance costs on the issuance of debt and adjustments related to the change in the fair value of interest rate swaps designated as fair value hedges on the 2019, 2020, 2021, 2022 and 2038 Notes. Refer to Note 6 for additional information regarding derivatives. |
9. Stock-Based Compensation
The Company's Omnibus Stock Incentive Plan of 2009 ( "DPS Stock Plan") provides for various long-term incentive awards, including stock options, restricted stock units ("RSUs") and performance share units ("PSUs").
Beginning in 2016, RSUs granted for certain participants in the DPS Stock Plan will vest ratably over three years. Outstanding RSUs granted prior to January 1, 2016 will continue to vest on a cliff schedule of three years.
Stock-based compensation expense is recorded in SG&A expenses in the unaudited Condensed Consolidated Statements of Income. The components of stock-based compensation expense are presented below:
For the Three Months Ended June 30, | For the Six Months Ended June 30, | ||||||||||||||
(in millions) | 2016 | 2015 | 2016 | 2015 | |||||||||||
Total stock-based compensation expense | $ | 11 | $ | 12 | $ | 22 | $ | 21 | |||||||
Income tax benefit recognized in the statement of income | (4 | ) | (4 | ) | (8 | ) | (7 | ) | |||||||
Stock-based compensation expense, net of tax | $ | 7 | $ | 8 | $ | 14 | $ | 14 | |||||||
19
DR PEPPER SNAPPLE GROUP, INC.
NOTES TO CONDENSED CONSOLIDATED FINANCIAL STATEMENTS
(Unaudited, Continued)
STOCK OPTIONS
The table below summarizes stock option activity for the six months ended June 30, 2016:
Stock Options | Weighted Average Exercise Price | Weighted Average Remaining Contractual Term (Years) | Aggregate Intrinsic Value (in millions) | |||||||||
Outstanding as of January 1, 2016 | 1,231,118 | $ | 58.98 | 8.24 | $ | 42 | ||||||
Granted | 406,858 | 91.98 | ||||||||||
Exercised | (237,146 | ) | 49.71 | 10 | ||||||||
Forfeited or expired | — | — | ||||||||||
Outstanding as of June 30, 2016 | 1,400,830 | 70.14 | 8.39 | 37 | ||||||||
Exercisable as of June 30, 2016 | 497,727 | 55.19 | 7.51 | 21 | ||||||||
As of June 30, 2016, there was $7 million of unrecognized compensation cost related to unvested stock options granted under the DPS Stock Plan that is expected to be recognized over a weighted average period of 1.27 years.
RESTRICTED STOCK UNITS
The table below summarizes RSU activity for the six months ended June 30, 2016. The fair value of RSUs is determined based on the number of units granted and the grant date price of the Company's common stock.
RSUs | Weighted Average Grant Date Fair Value | Weighted Average Remaining Contractual Term (Years) | Aggregate Intrinsic Value (in millions) | |||||||||
Outstanding as of January 1, 2016 | 1,497,416 | $ | 55.40 | 1.03 | $ | 140 | ||||||
Granted | 351,548 | 91.98 | ||||||||||
Vested and released | (591,470 | ) | 44.14 | 54 | ||||||||
Forfeited | (19,413 | ) | 68.91 | |||||||||
Outstanding as of June 30, 2016 | 1,238,081 | 70.96 | 1.29 | 120 | ||||||||
As of June 30, 2016, there was $51 million of unrecognized compensation cost related to unvested RSUs granted under the DPS Stock Plan that is expected to be recognized over a weighted average period of 1.27 years.
During the six months ended June 30, 2016, 591,470 shares subject to previously granted RSUs vested. A majority of these vested RSUs were net share settled. The Company withheld 187,478 shares based upon the Company's closing stock price on the vesting date to settle the employees' minimum statutory obligation for applicable income and other employment taxes. Subsequently, the Company remitted the required funds to the appropriate taxing authorities.
Total payments for the employees' tax obligations to the relevant taxing authorities were $19 million and $22 million for the six months ended June 30, 2016 and 2015, respectively, and are reflected as a financing activity within the unaudited Condensed Consolidated Statements of Cash Flows. These payments were used for tax withholdings related to the net share settlements of RSUs and dividend equivalent units ("DEUs"). These payments had the effect of share repurchases by the Company as they reduced the number of shares that would have otherwise been issued on the vesting date and were recorded as a reduction of additional paid-in capital.
20
DR PEPPER SNAPPLE GROUP, INC.
NOTES TO CONDENSED CONSOLIDATED FINANCIAL STATEMENTS
(Unaudited, Continued)
PERFORMANCE SHARE UNITS
The table below summarizes PSU activity for the six months ended June 30, 2016. The fair value of PSUs is determined based on the number of units granted and the grant date price of the Company's common stock.
PSUs | Weighted Average Grant Date Fair Value | Weighted Average Remaining Contractual Term (Years) | Aggregate Intrinsic Value (in millions) | |||||||||
Outstanding as of January 1, 2016 | 443,374 | $ | 55.54 | 0.88 | $ | 41 | ||||||
Granted | 103,815 | 66.19 | ||||||||||
Performance adjustment(1) | 172,500 | 43.82 | ||||||||||
Vested and released | (345,000 | ) | 43.82 | 32 | ||||||||
Forfeited | — | — | ||||||||||
Outstanding as of June 30, 2016 | 374,689 | 64.56 | 1.38 | 36 | ||||||||
(1) | For PSUs which vested during the six months ended June 30, 2016, the Company awarded additional PSUs, as actual results measured at the end of the performance period exceeded target performance levels. |
As of June 30, 2016, there was $14 million of unrecognized compensation cost related to unvested PSUs granted under the DPS Stock Plan that is expected to be recognized over a weighted average period of 1.37 years.
During the six months ended June 30, 2016, 345,000 units subject to previously granted PSUs vested. A majority of these vested PSUs were net share settled. The Company withheld 119,084 shares based upon the Company's closing stock price on the vesting date to settle the employees' minimum statutory obligation for the applicable income and other employment taxes. Subsequently, the Company remitted the required funds to the appropriate taxing authorities.
Total payments for the employees' tax obligations to the relevant taxing authorities were $12 million and $5 million for the six months ended June 30, 2016 and 2015, respectively, and are reflected as a financing activity within the unaudited Condensed Consolidated Statements of Cash Flows. These payments were used for tax withholdings related to the net share settlements of PSUs and DEUs. These payments had the effect of share repurchases by the Company as they reduced the number of shares that would have otherwise been issued on the vesting date and were recorded as a reduction of additional paid-in capital.
21
DR PEPPER SNAPPLE GROUP, INC.
NOTES TO CONDENSED CONSOLIDATED FINANCIAL STATEMENTS
(Unaudited, Continued)
10. Earnings Per Share
Basic earnings per share ("EPS") is computed by dividing net income by the weighted average number of common shares outstanding for the period. Diluted EPS reflects the assumed conversion of all dilutive securities. The following table presents the basic and diluted EPS and the Company's basic and diluted shares outstanding:
For the Three Months Ended June 30, | For the Six Months Ended June 30, | ||||||||||||||
(in millions, except per share data) | 2016 | 2015 | 2016 | 2015 | |||||||||||
Basic EPS: | |||||||||||||||
Net income | $ | 260 | $ | 220 | $ | 442 | $ | 377 | |||||||
Weighted average common shares outstanding | 185.7 | 191.4 | 186.7 | 192.2 | |||||||||||
Earnings per common share — basic | $ | 1.40 | $ | 1.15 | $ | 2.37 | $ | 1.96 | |||||||
Diluted EPS: | |||||||||||||||
Net income | $ | 260 | $ | 220 | $ | 442 | $ | 377 | |||||||
Weighted average common shares outstanding | 185.7 | 191.4 | 186.7 | 192.2 | |||||||||||
Effect of dilutive securities: | |||||||||||||||
Stock options | 0.2 | 0.2 | 0.2 | 0.3 | |||||||||||
RSUs | 0.6 | 0.8 | 0.7 | 1.0 | |||||||||||
PSUs | — | — | 0.1 | — | |||||||||||
Weighted average common shares outstanding and common stock equivalents | 186.5 | 192.4 | 187.7 | 193.5 | |||||||||||
Earnings per common share — diluted | $ | 1.39 | $ | 1.14 | $ | 2.35 | $ | 1.95 | |||||||
Stock options, RSUs, PSUs and DEUs totaling 0.6 million and 0.4 million shares were excluded from the diluted weighted average shares outstanding for the three and six months ended June 30, 2016, respectively, as they were not dilutive. Stock options, RSUs, PSUs and DEUs totaling 0.4 million and 0.3 million shares were excluded from the diluted weighted average shares outstanding for the three and six months ended June 30, 2015, respectively, as they were not dilutive.
Under the terms of our RSU and PSU agreements, unvested RSU and PSU awards contain forfeitable rights to dividends and DEUs. Because the DEUs are forfeitable, they are defined as non-participating securities. As of June 30, 2016, there were 55,533 DEUs, which will vest at the time that the underlying RSU or PSU vests.
Through 2015, the Company's Board of Directors (the "Board") authorized a total aggregate share repurchase plan of $4 billion. In February 2016, the Board authorized an additional $1 billion of share repurchases. The Company repurchased and retired 1.4 million shares of common stock valued at approximately $124 million and 3.4 million shares of common stock valued at approximately $303 million for the three and six months ended June 30, 2016, respectively. The Company repurchased and retired 1.5 million shares of common stock valued at approximately $116 million and 3.2 million shares of common stock valued at approximately $251 million for the three and six months ended June 30, 2015, respectively. These amounts were recorded as a reduction of equity in the unaudited Condensed Consolidated Statement of Equity. As of June 30, 2016, $1,348 million remains available for share repurchases under the Board's authorization.
22
DR PEPPER SNAPPLE GROUP, INC.
NOTES TO CONDENSED CONSOLIDATED FINANCIAL STATEMENTS
(Unaudited, Continued)
11. Accumulated Other Comprehensive Loss
The following tables provide a summary of changes in the balances of each component of AOCL, net of taxes:
(in millions) | Foreign Currency Translation | Change in Pension Liability | Cash Flow Hedges | Accumulated Other Comprehensive Loss | |||||||||||
Balance as of April 1, 2016 | $ | (117 | ) | $ | (36 | ) | $ | (34 | ) | $ | (187 | ) | |||
OCI before reclassifications | (18 | ) | 1 | — | (17 | ) | |||||||||
Amounts reclassified from AOCL | — | — | 2 | 2 | |||||||||||
Net current year OCI | (18 | ) | 1 | 2 | (15 | ) | |||||||||
Balance as of June 30, 2016 | $ | (135 | ) | $ | (35 | ) | $ | (32 | ) | $ | (202 | ) | |||
(in millions) | Foreign Currency Translation | Change in Pension Liability | Cash Flow Hedges | Accumulated Other Comprehensive Loss | |||||||||||
Balance as of January 1, 2015 | $ | (61 | ) | $ | (40 | ) | $ | (36 | ) | $ | (137 | ) | |||
OCI before reclassifications | (64 | ) | — | (2 | ) | (66 | ) | ||||||||
Amounts reclassified from AOCL | — | 4 | 4 | 8 | |||||||||||
Net current year OCI | (64 | ) | 4 | 2 | (58 | ) | |||||||||
Balance as of December 31, 2015 | (125 | ) | (36 | ) | (34 | ) | (195 | ) | |||||||
OCI before reclassifications | (10 | ) | — | (1 | ) | (11 | ) | ||||||||
Amounts reclassified from AOCL | — | 1 | 3 | 4 | |||||||||||
Net current year OCI | (10 | ) | 1 | 2 | (7 | ) | |||||||||
Balance as of June 30, 2016 | $ | (135 | ) | $ | (35 | ) | $ | (32 | ) | $ | (202 | ) | |||
23
DR PEPPER SNAPPLE GROUP, INC.
NOTES TO CONDENSED CONSOLIDATED FINANCIAL STATEMENTS
(Unaudited, Continued)
The following table presents the amount of loss reclassified from AOCL into the unaudited Condensed Consolidated Statements of Income:
For the Three Months Ended June 30, | For the Six Months Ended June 30, | ||||||||||||||||
(in millions) | Location of Loss Reclassified from AOCL into Income | 2016 | 2015 | 2016 | 2015 | ||||||||||||
Loss on cash flow hedges: | |||||||||||||||||
Interest rate contracts | Interest expense | $ | (2 | ) | $ | (2 | ) | $ | (4 | ) | $ | (4 | ) | ||||
Foreign exchange forward contracts | Cost of sales | (1 | ) | — | (1 | ) | — | ||||||||||
Total | (3 | ) | (2 | ) | (5 | ) | (4 | ) | |||||||||
Income tax benefit | (1 | ) | — | (2 | ) | (1 | ) | ||||||||||
Total | $ | (2 | ) | $ | (2 | ) | $ | (3 | ) | $ | (3 | ) | |||||
Defined benefit pension and postretirement plan items: | |||||||||||||||||
Amortization of actuarial losses, net | SG&A expenses | (1 | ) | (1 | ) | $ | (2 | ) | $ | (2 | ) | ||||||
Total | (1 | ) | (1 | ) | (2 | ) | (2 | ) | |||||||||
Income tax benefit | (1 | ) | (1 | ) | (1 | ) | (1 | ) | |||||||||
Total | $ | — | $ | — | $ | (1 | ) | $ | (1 | ) | |||||||
Total reclassifications | $ | (2 | ) | $ | (2 | ) | $ | (4 | ) | $ | (4 | ) | |||||
24
DR PEPPER SNAPPLE GROUP, INC.
NOTES TO CONDENSED CONSOLIDATED FINANCIAL STATEMENTS
(Unaudited, Continued)
12. Supplemental Cash Flow Information
The following table details supplemental cash flow disclosures of non-cash investing and financing activities:
For the Six Months Ended June 30, | |||||||
(in millions) | 2016 | 2015 | |||||
Supplemental cash flow disclosures of non-cash investing and financing activities: | |||||||
Dividends declared but not yet paid | $ | 98 | $ | 92 | |||
Capital expenditures included in accounts payable and other current liabilities | 15 | 11 | |||||
Capital lease additions | 9 | 19 | |||||
Supplemental cash flow disclosures: | |||||||
Interest paid | $ | 48 | $ | 47 | |||
Income taxes paid | 167 | 119 | |||||
13. Commitments and Contingencies
LEGAL MATTERS
The Company is occasionally subject to litigation or other legal proceedings. The Company does not believe that the outcome of these, or any other, pending legal matters, individually or collectively, will have a material adverse effect on the results of operations, financial condition or liquidity of the Company.
Arbitration Ruling
In June 2012, a subsidiary of the Company made a request for arbitration as a result of a deadlock related to their Mexican joint venture, Industria Embotelladora de Bebidas Mexicanas. In March 2016, the International Court of Arbitration of the International Chamber of Commerce (the "Court") completed the arbitration and agreed with the Company's subsidiary that a deadlock existed. Additionally, the Court awarded Acqua Minerale San Benedetto S.P.A. ("San Benedetto") approximately $4 million, which the Company recorded during the first quarter of 2016 in SG&A expenses.
On July 26, 2016, the Company's subsidiary and San Benedetto entered into a letter of intent to settle the deadlock, pursuant to which the Company's subsidiary will purchase the shares of the joint venture owned by San Benedetto. The purchase of San Benedetto’s interest in the joint venture is subject to certain closing conditions, including the entry into a definitive purchase agreement.
14. Segments
As of June 30, 2016 and December 31, 2015 and for the three and six months ended June 30, 2016 and 2015, the Company's operating structure consisted of the following three operating segments:
• | The Beverage Concentrates segment reflects sales of the Company's branded concentrates and syrup to third-party bottlers primarily in the U.S. and Canada. Most of the brands in this segment are carbonated soft drink brands. |
• | The Packaged Beverages segment reflects sales in the U.S. and Canada from the manufacture and distribution of finished beverages and other products, including sales of the Company's own brands and third-party brands, through both our Direct Store Delivery system and our Warehouse Direct system. |
• | The Latin America Beverages segment reflects sales in Mexico, the Caribbean, and other international markets from the manufacture and distribution of concentrates, syrup and finished beverages. |
Segment results are based on management reports. Net sales and SOP are the significant financial measures used to assess the operating performance of the Company's operating segments. Intersegment sales are recorded at cost and are eliminated in the Consolidated Statements of Operations. “Unallocated corporate costs” are excluded from our measurement of segment performance and include stock-based compensation expense, unrealized commodity derivative gains and losses, and certain general corporate expenses.
25
DR PEPPER SNAPPLE GROUP, INC.
NOTES TO CONDENSED CONSOLIDATED FINANCIAL STATEMENTS
(Unaudited, Continued)
Information about the Company's operations by operating segment is as follows:
For the Three Months Ended June 30, | For the Six Months Ended June 30, | ||||||||||||||
(in millions) | 2016 | 2015 | 2016 | 2015 | |||||||||||
Segment Results – Net sales | |||||||||||||||
Beverage Concentrates | $ | 342 | $ | 330 | $ | 629 | $ | 615 | |||||||
Packaged Beverages | 1,225 | 1,188 | 2,322 | 2,241 | |||||||||||
Latin America Beverages | 128 | 137 | 231 | 250 | |||||||||||
Net sales | $ | 1,695 | $ | 1,655 | $ | 3,182 | $ | 3,106 | |||||||
For the Three Months Ended June 30, | For the Six Months Ended June 30, | ||||||||||||||
(in millions) | 2016 | 2015 | 2016 | 2015 | |||||||||||
Segment Results – SOP | |||||||||||||||
Beverage Concentrates | $ | 230 | $ | 222 | $ | 417 | $ | 405 | |||||||
Packaged Beverages | 209 | 190 | 384 | 331 | |||||||||||
Latin America Beverages | 24 | 27 | 39 | 44 | |||||||||||
Total SOP | 463 | 439 | 840 | 780 | |||||||||||
Unallocated corporate costs | 52 | 70 | 116 | 141 | |||||||||||
Other operating income, net | (1 | ) | — | (1 | ) | — | |||||||||
Income from operations | 412 | 369 | 725 | 639 | |||||||||||
Interest expense, net | 32 | 27 | 65 | 54 | |||||||||||
Other (income) expense, net | (22 | ) | 1 | (23 | ) | — | |||||||||
Income before provision for income taxes and equity in earnings of unconsolidated subsidiaries | $ | 402 | $ | 341 | $ | 683 | $ | 585 | |||||||
15. Guarantor and Non-Guarantor Financial Information
The Company's outstanding senior unsecured notes (the "Notes") are fully and unconditionally guaranteed by substantially all of the Company's existing and future direct and indirect domestic subsidiaries (except one immaterial subsidiary associated with charitable purposes) (the "Guarantors"), as defined in the indentures governing the Notes. The Guarantors are 100% owned either directly or indirectly by the Company and jointly and severally guarantee, subject to the release provisions described below, the Company's obligations under the Notes. None of the Company's subsidiaries organized outside of the U.S. or immaterial subsidiaries used for charitable purposes (collectively, the "Non-Guarantors") guarantee the Notes. The subsidiary guarantees with respect to the Notes are subject to release upon the occurrence of certain events, including the sale of all or substantially all of a subsidiary's assets, the release of the subsidiary's guarantee of other indebtedness of the Company, the Company's exercise of its legal defeasance option with respect to the Notes and the discharge of the Company's obligations under the applicable indenture.
The following schedules present the financial information for Dr Pepper Snapple Group, Inc. (the "Parent"), Guarantors and Non-Guarantors. The consolidating schedules are provided in accordance with the reporting requirements of Rule 3-10 under SEC Regulation S-X for guarantor subsidiaries.
26
DR PEPPER SNAPPLE GROUP, INC.
NOTES TO CONDENSED CONSOLIDATED FINANCIAL STATEMENTS
(Unaudited, Continued)
Condensed Consolidating Statements of Income | |||||||||||||||||||
For the Three Months Ended June 30, 2016 | |||||||||||||||||||
(in millions) | Parent | Guarantors | Non-Guarantors | Eliminations | Total | ||||||||||||||
Net sales | $ | — | $ | 1,561 | $ | 195 | $ | (61 | ) | $ | 1,695 | ||||||||
Cost of sales | — | 631 | 100 | (61 | ) | 670 | |||||||||||||
Gross profit | — | 930 | 95 | — | 1,025 | ||||||||||||||
Selling, general and administrative expenses | 1 | 536 | 53 | — | 590 | ||||||||||||||
Depreciation and amortization | — | 22 | 2 | — | 24 | ||||||||||||||
Other operating expense (income), net | — | — | (1 | ) | — | (1 | ) | ||||||||||||
Income from operations | (1 | ) | 372 | 41 | — | 412 | |||||||||||||
Interest expense | 55 | 17 | — | (39 | ) | 33 | |||||||||||||
Interest income | (13 | ) | (25 | ) | (2 | ) | 39 | (1 | ) | ||||||||||
Other expense (income), net | (1 | ) | (23 | ) | 2 | — | (22 | ) | |||||||||||
Income (loss) before provision (benefit) for income taxes and equity in earnings of subsidiaries | (42 | ) | 403 | 41 | — | 402 | |||||||||||||
Provision (benefit) for income taxes | (16 | ) | 147 | 11 | — | 142 | |||||||||||||
Income (loss) before equity in earnings of subsidiaries | (26 | ) | 256 | 30 | — | 260 | |||||||||||||
Equity in earnings of consolidated subsidiaries | 286 | 30 | — | (316 | ) | — | |||||||||||||
Equity in earnings of unconsolidated subsidiaries, net of tax | — | — | — | — | — | ||||||||||||||
Net income | $ | 260 | $ | 286 | $ | 30 | $ | (316 | ) | $ | 260 | ||||||||
27
DR PEPPER SNAPPLE GROUP, INC.
NOTES TO CONDENSED CONSOLIDATED FINANCIAL STATEMENTS
(Unaudited, Continued)
Condensed Consolidating Statements of Income | |||||||||||||||||||
For the Three Months Ended June 30, 2015 | |||||||||||||||||||
(in millions) | Parent | Guarantors | Non-Guarantors | Eliminations | Total | ||||||||||||||
Net sales | $ | — | $ | 1,480 | $ | 181 | $ | (6 | ) | $ | 1,655 | ||||||||
Cost of sales | — | 595 | 85 | (6 | ) | $ | 674 | ||||||||||||
Gross profit | — | 885 | 96 | — | $ | 981 | |||||||||||||
Selling, general and administrative expenses | — | 529 | 57 | — | 586 | ||||||||||||||
Depreciation and amortization | — | 25 | 1 | — | 26 | ||||||||||||||
Other operating (income) expense, net | — | — | — | — | — | ||||||||||||||
Income from operations | — | 331 | 38 | — | 369 | ||||||||||||||
Interest expense | 26 | 13 | — | (11 | ) | 28 | |||||||||||||
Interest income | (10 | ) | — | (2 | ) | 11 | (1 | ) | |||||||||||
Other expense (income), net | — | (1 | ) | 2 | — | 1 | |||||||||||||
Income (loss) before provision (benefit) for income taxes and equity in earnings of subsidiaries | (16 | ) | 319 | 38 | — | 341 | |||||||||||||
Provision (benefit) for income taxes | (6 | ) | 117 | 10 | — | 121 | |||||||||||||
Income (loss) before equity in earnings of subsidiaries | (10 | ) | 202 | 28 | — | 220 | |||||||||||||
Equity in earnings of consolidated subsidiaries | 230 | 28 | — | (258 | ) | — | |||||||||||||
Equity in earnings of unconsolidated subsidiaries, net of tax | — | — | — | — | — | ||||||||||||||
Net income | $ | 220 | $ | 230 | $ | 28 | $ | (258 | ) | $ | 220 | ||||||||
28
DR PEPPER SNAPPLE GROUP, INC.
NOTES TO CONDENSED CONSOLIDATED FINANCIAL STATEMENTS
(Unaudited, Continued)
Condensed Consolidating Statements of Income | |||||||||||||||||||
For the Six Months Ended June 30, 2016 | |||||||||||||||||||
(in millions) | Parent | Guarantors | Non-Guarantors | Eliminations | Total | ||||||||||||||
Net sales | $ | — | $ | 2,928 | $ | 319 | $ | (65 | ) | $ | 3,182 | ||||||||
Cost of sales | — | 1,179 | 158 | (65 | ) | 1,272 | |||||||||||||
Gross profit | — | 1,749 | 161 | — | 1,910 | ||||||||||||||
Selling, general and administrative expenses | 1 | 1,033 | 102 | — | 1,136 | ||||||||||||||
Depreciation and amortization | — | 47 | 3 | — | 50 | ||||||||||||||
Other operating income, net | — | — | (1 | ) | — | (1 | ) | ||||||||||||
Income from operations | (1 | ) | 669 | 57 | — | 725 | |||||||||||||
Interest expense | 108 | 34 | — | (76 | ) | 66 | |||||||||||||
Interest income | (26 | ) | (48 | ) | (3 | ) | 76 | (1 | ) | ||||||||||
Other (income) expense, net | (3 | ) | (24 | ) | 4 | — | (23 | ) | |||||||||||
Income (loss) before provision (benefit) for income taxes and equity in earnings of subsidiaries | (80 | ) | 707 | 56 | — | 683 | |||||||||||||
Provision (benefit) for income taxes | (30 | ) | 256 | 15 | — | 241 | |||||||||||||
Income (loss) before equity in earnings of subsidiaries | (50 | ) | 451 | 41 | — | 442 | |||||||||||||
Equity in earnings of consolidated subsidiaries | 492 | 41 | — | (533 | ) | — | |||||||||||||
Equity in earnings of unconsolidated subsidiaries, net of tax | — | — | — | — | — | ||||||||||||||
Net income | $ | 442 | $ | 492 | $ | 41 | $ | (533 | ) | $ | 442 | ||||||||
29
DR PEPPER SNAPPLE GROUP, INC.
NOTES TO CONDENSED CONSOLIDATED FINANCIAL STATEMENTS
(Unaudited, Continued)
Condensed Consolidating Statements of Income | |||||||||||||||||||
For the Six Months Ended June 30, 2015 | |||||||||||||||||||
(in millions) | Parent | Guarantors | Non-Guarantors | Eliminations | Total | ||||||||||||||
Net sales | $ | — | $ | 2,801 | $ | 319 | $ | (14 | ) | $ | 3,106 | ||||||||
Cost of sales | — | 1,134 | 156 | (14 | ) | 1,276 | |||||||||||||
Gross profit | — | 1,667 | 163 | — | 1,830 | ||||||||||||||
Selling, general and administrative expenses | 1 | 1,031 | 106 | — | 1,138 | ||||||||||||||
Depreciation and amortization | — | 50 | 3 | — | 53 | ||||||||||||||
Other operating income, net | — | — | — | — | — | ||||||||||||||
Income from operations | (1 | ) | 586 | 54 | — | 639 | |||||||||||||
Interest expense | 51 | 27 | — | (23 | ) | 55 | |||||||||||||
Interest income | (20 | ) | — | (4 | ) | 23 | (1 | ) | |||||||||||
Other expense (income), net | (2 | ) | (3 | ) | 5 | — | — | ||||||||||||
Income (loss) before provision (benefit) for income taxes and equity in earnings of subsidiaries | (30 | ) | 562 | 53 | — | 585 | |||||||||||||
Provision (benefit) for income taxes | (11 | ) | 205 | 14 | — | 208 | |||||||||||||
Income (loss) before equity in earnings of subsidiaries | (19 | ) | 357 | 39 | — | 377 | |||||||||||||
Equity in earnings of consolidated subsidiaries | 396 | 39 | — | (435 | ) | — | |||||||||||||
Equity in earnings of unconsolidated subsidiaries, net of tax | — | — | — | — | — | ||||||||||||||
Net income | $ | 377 | $ | 396 | $ | 39 | $ | (435 | ) | $ | 377 | ||||||||
30
DR PEPPER SNAPPLE GROUP, INC.
NOTES TO CONDENSED CONSOLIDATED FINANCIAL STATEMENTS
(Unaudited, Continued)
Condensed Consolidating Statements of Comprehensive Income | |||||||||||||||||||
For the Three Months Ended June 30, 2016 | |||||||||||||||||||
(in millions) | Parent | Guarantors | Non-Guarantors | Eliminations | Total | ||||||||||||||
Comprehensive income (loss) | $ | 245 | $ | 270 | $ | 12 | $ | (282 | ) | $ | 245 | ||||||||
Condensed Consolidating Statements of Comprehensive Income | |||||||||||||||||||
For the Three Months Ended June 30, 2015 | |||||||||||||||||||
(in millions) | Parent | Guarantors | Non-Guarantors | Eliminations | Total | ||||||||||||||
Comprehensive income (loss) | $ | 233 | $ | 226 | $ | 26 | $ | (252 | ) | $ | 233 | ||||||||
Condensed Consolidating Statements of Comprehensive Income | |||||||||||||||||||
For the Six Months Ended June 30, 2016 | |||||||||||||||||||
(in millions) | Parent | Guarantors | Non-Guarantors | Eliminations | Total | ||||||||||||||
Comprehensive income (loss) | $ | 435 | $ | 485 | $ | 45 | $ | (530 | ) | $ | 435 | ||||||||
Condensed Consolidating Statements of Comprehensive Income | |||||||||||||||||||
For the Six Months Ended June 30, 2015 | |||||||||||||||||||
(in millions) | Parent | Guarantors | Non-Guarantors | Eliminations | Total | ||||||||||||||
Comprehensive income (loss) | $ | 365 | $ | 369 | $ | (2 | ) | $ | (367 | ) | $ | 365 | |||||||
31
DR PEPPER SNAPPLE GROUP, INC.
NOTES TO CONDENSED CONSOLIDATED FINANCIAL STATEMENTS
(Unaudited, Continued)
Condensed Consolidating Balance Sheets | |||||||||||||||||||
As of June 30, 2016 | |||||||||||||||||||
(in millions) | Parent | Guarantors | Non-Guarantors | Eliminations | Total | ||||||||||||||
Current assets: | |||||||||||||||||||
Cash and cash equivalents | $ | — | $ | 181 | $ | 64 | $ | — | $ | 245 | |||||||||
Accounts receivable: | |||||||||||||||||||
Trade, net | — | 576 | 66 | — | 642 | ||||||||||||||
Other | 3 | 42 | 13 | — | 58 | ||||||||||||||
Related party receivable | 16 | 32 | — | (48 | ) | — | |||||||||||||
Inventories | — | 195 | 41 | — | 236 | ||||||||||||||
Prepaid expenses and other current assets | 331 | 123 | 11 | (321 | ) | 144 | |||||||||||||
Total current assets | 350 | 1,149 | 195 | (369 | ) | 1,325 | |||||||||||||
Property, plant and equipment, net | — | 1,009 | 120 | — | 1,129 | ||||||||||||||
Investments in consolidated subsidiaries | 7,571 | 630 | — | (8,201 | ) | — | |||||||||||||
Investments in unconsolidated subsidiaries | — | 25 | 10 | — | 35 | ||||||||||||||
Goodwill | — | 2,971 | 15 | — | 2,986 | ||||||||||||||
Other intangible assets, net | — | 2,608 | 50 | — | 2,658 | ||||||||||||||
Long-term receivable, related parties | 3,182 | 6,085 | 301 | (9,568 | ) | — | |||||||||||||
Other non-current assets | 104 | 104 | 1 | — | 209 | ||||||||||||||
Non-current deferred tax assets | 19 | — | 64 | (19 | ) | 64 | |||||||||||||
Total assets | $ | 11,226 | $ | 14,581 | $ | 756 | $ | (18,157 | ) | $ | 8,406 | ||||||||
Current liabilities: | |||||||||||||||||||
Accounts payable | $ | — | $ | 333 | $ | 26 | $ | — | $ | 359 | |||||||||
Related party payable | 25 | 13 | 10 | (48 | ) | — | |||||||||||||
Deferred revenue | — | 63 | 1 | — | 64 | ||||||||||||||
Short-term borrowings and current portion of long-term obligations | — | 9 | — | — | 9 | ||||||||||||||
Income taxes payable | — | 371 | — | (321 | ) | 50 | |||||||||||||
Other current liabilities | 126 | 510 | 52 | — | 688 | ||||||||||||||
Total current liabilities | 151 | 1,299 | 89 | (369 | ) | 1,170 | |||||||||||||
Long-term obligations to third parties | 2,789 | 132 | — | — | 2,921 | ||||||||||||||
Long-term obligations to related parties | 6,085 | 3,483 | — | (9,568 | ) | — | |||||||||||||
Non-current deferred tax liabilities | — | 830 | — | (19 | ) | 811 | |||||||||||||
Non-current deferred revenue | — | 1,122 | 28 | — | 1,150 | ||||||||||||||
Other non-current liabilities | 59 | 144 | 9 | — | 212 | ||||||||||||||
Total liabilities | 9,084 | 7,010 | 126 | (9,956 | ) | 6,264 | |||||||||||||
Total stockholders' equity | 2,142 | 7,571 | 630 | (8,201 | ) | 2,142 | |||||||||||||
Total liabilities and stockholders' equity | $ | 11,226 | $ | 14,581 | $ | 756 | $ | (18,157 | ) | $ | 8,406 | ||||||||
32
DR PEPPER SNAPPLE GROUP, INC.
NOTES TO CONDENSED CONSOLIDATED FINANCIAL STATEMENTS
(Unaudited, Continued)
Condensed Consolidating Balance Sheets | |||||||||||||||||||
As of December 31, 2015 | |||||||||||||||||||
(in millions) | Parent | Guarantors | Non-Guarantors | Eliminations | Total | ||||||||||||||
Current assets: | |||||||||||||||||||
Cash and cash equivalents | $ | — | $ | 859 | $ | 52 | $ | — | $ | 911 | |||||||||
Accounts receivable: | |||||||||||||||||||
Trade, net | — | 516 | 54 | — | 570 | ||||||||||||||
Other | 3 | 40 | 15 | — | 58 | ||||||||||||||
Related party receivable | 11 | 25 | — | (36 | ) | — | |||||||||||||
Inventories | — | 173 | 36 | — | 209 | ||||||||||||||
Prepaid and other current assets | 300 | 55 | 5 | (291 | ) | 69 | |||||||||||||
Total current assets | 314 | 1,668 | 162 | (327 | ) | 1,817 | |||||||||||||
Property, plant and equipment, net | — | 1,041 | 115 | — | 1,156 | ||||||||||||||
Investments in consolidated subsidiaries | 7,062 | 583 | — | (7,645 | ) | — | |||||||||||||
Investments in unconsolidated subsidiaries | — | 20 | 11 | — | 31 | ||||||||||||||
Goodwill | — | 2,972 | 16 | — | 2,988 | ||||||||||||||
Other intangible assets, net | — | 2,610 | 53 | — | 2,663 | ||||||||||||||
Long-term receivable, related parties | 3,159 | 4,989 | 283 | (8,431 | ) | — | |||||||||||||
Other non-current assets | 58 | 90 | 2 | — | 150 | ||||||||||||||
Non-current deferred tax assets | 20 | — | 65 | (21 | ) | 64 | |||||||||||||
Total assets | $ | 10,613 | $ | 13,973 | $ | 707 | $ | (16,424 | ) | $ | 8,869 | ||||||||
Current liabilities: | |||||||||||||||||||
Accounts payable | $ | — | $ | 252 | $ | 25 | $ | — | $ | 277 | |||||||||
Related party payable | 18 | 11 | 7 | (36 | ) | — | |||||||||||||
Deferred revenue | — | 63 | 1 | — | 64 | ||||||||||||||
Short-term borrowings and current portion of long-term obligations | 500 | 7 | — | — | 507 | ||||||||||||||
Income taxes payable | — | 306 | 12 | (291 | ) | 27 | |||||||||||||
Other current liabilities | 126 | 539 | 43 | — | 708 | ||||||||||||||
Total current liabilities | 644 | 1,178 | 88 | (327 | ) | 1,583 | |||||||||||||
Long-term obligations to third parties | 2,746 | 129 | — | — | 2,875 | ||||||||||||||
Long-term obligations to related parties | 4,989 | 3,442 | — | (8,431 | ) | — | |||||||||||||
Non-current deferred tax liabilities | — | 808 | — | (21 | ) | 787 | |||||||||||||
Non-current deferred revenue | — | 1,154 | 27 | — | 1,181 | ||||||||||||||
Other non-current liabilities | 51 | 200 | 9 | — | 260 | ||||||||||||||
Total liabilities | 8,430 | 6,911 | 124 | (8,779 | ) | 6,686 | |||||||||||||
Total stockholders' equity | 2,183 | 7,062 | 583 | (7,645 | ) | 2,183 | |||||||||||||
Total liabilities and stockholders' equity | $ | 10,613 | $ | 13,973 | $ | 707 | $ | (16,424 | ) | $ | 8,869 | ||||||||
33
DR PEPPER SNAPPLE GROUP, INC.
NOTES TO CONDENSED CONSOLIDATED FINANCIAL STATEMENTS
(Unaudited, Continued)
Condensed Consolidating Statements of Cash Flows | |||||||||||||||||||
For the Six Months Ended June 30, 2016 | |||||||||||||||||||
(in millions) | Parent | Guarantors | Non-Guarantors | Eliminations | Total | ||||||||||||||
Operating activities: | |||||||||||||||||||
Net cash (used in) provided by operating activities | $ | (77 | ) | $ | 454 | $ | 30 | $ | — | $ | 407 | ||||||||
Investing activities: | |||||||||||||||||||
Purchase of property, plant and equipment | — | (49 | ) | (19 | ) | — | (68 | ) | |||||||||||
Investment in unconsolidated subsidiaries | — | (6 | ) | — | — | (6 | ) | ||||||||||||
Purchase of cost method investment | — | (1 | ) | — | — | (1 | ) | ||||||||||||
Proceeds from disposals of property, plant and equipment | — | 3 | — | — | 3 | ||||||||||||||
Issuance of related party notes receivable | — | (1,096 | ) | — | 1,096 | — | |||||||||||||
Other, net | (7 | ) | — | — | — | (7 | ) | ||||||||||||
Net cash (used in) provided by investing activities | (7 | ) | (1,149 | ) | (19 | ) | 1,096 | (79 | ) | ||||||||||
Financing activities: | |||||||||||||||||||
Proceeds from issuance of related party debt | 1,096 | — | — | (1,096 | ) | — | |||||||||||||
Repayment of senior unsecured notes | (500 | ) | — | — | — | (500 | ) | ||||||||||||
Repurchase of shares of common stock | (303 | ) | — | — | — | (303 | ) | ||||||||||||
Dividends paid | (190 | ) | — | — | — | (190 | ) | ||||||||||||
Tax withholdings related to net share settlements of certain stock awards | (31 | ) | — | — | — | (31 | ) | ||||||||||||
Proceeds from stock options exercised | 12 | — | — | — | 12 | ||||||||||||||
Excess tax benefit on stock-based compensation | — | 21 | — | — | 21 | ||||||||||||||
Capital lease payments | — | (4 | ) | — | — | (4 | ) | ||||||||||||
Other, net | — | — | — | — | — | ||||||||||||||
Net cash (used in) provided by financing activities | 84 | 17 | — | (1,096 | ) | (995 | ) | ||||||||||||
Cash and cash equivalents — net change from: | |||||||||||||||||||
Operating, investing and financing activities | — | (678 | ) | 11 | — | (667 | ) | ||||||||||||
Effect of exchange rate changes on cash and cash equivalents | — | — | 1 | — | 1 | ||||||||||||||
Cash and cash equivalents at beginning of period | — | 859 | 52 | — | 911 | ||||||||||||||
Cash and cash equivalents at end of period | $ | — | $ | 181 | $ | 64 | $ | — | $ | 245 | |||||||||
34
DR PEPPER SNAPPLE GROUP, INC.
NOTES TO CONDENSED CONSOLIDATED FINANCIAL STATEMENTS
(Unaudited, Continued)
Condensed Consolidating Statements of Cash Flows | |||||||||||||||||||
For the Six Months Ended June 30, 2015 | |||||||||||||||||||
(in millions) | Parent | Guarantors | Non-Guarantors | Eliminations | Total | ||||||||||||||
Operating activities: | |||||||||||||||||||
Net cash (used in) provided by operating activities | $ | (40 | ) | $ | 365 | $ | 24 | $ | — | $ | 349 | ||||||||
Investing activities: | |||||||||||||||||||
Purchase of property, plant and equipment | — | (35 | ) | (7 | ) | — | (42 | ) | |||||||||||
Purchase of intangible assets | — | (1 | ) | — | — | (1 | ) | ||||||||||||
Purchase of cost method investment | — | (15 | ) | — | — | (15 | ) | ||||||||||||
Proceeds from disposals of property, plant and equipment | — | 11 | — | — | 11 | ||||||||||||||
Issuance of related party notes receivable | — | (468 | ) | (20 | ) | 488 | — | ||||||||||||
Net cash (used in) provided by investing activities | — | (508 | ) | (27 | ) | 488 | (47 | ) | |||||||||||
Financing activities: | |||||||||||||||||||
Proceeds from issuance of related party debt | 468 | 20 | — | (488 | ) | — | |||||||||||||
Repurchase of shares of common stock | (251 | ) | — | — | — | (251 | ) | ||||||||||||
Dividends paid | (172 | ) | — | — | — | (172 | ) | ||||||||||||
Tax withholdings related to net share settlements of certain stock awards | (27 | ) | — | — | — | (27 | ) | ||||||||||||
Proceeds from stock options exercised | 22 | — | — | — | 22 | ||||||||||||||
Excess tax benefit on stock-based compensation | — | 20 | — | — | 20 | ||||||||||||||
Capital lease payments | — | (2 | ) | — | — | (2 | ) | ||||||||||||
Other, net | — | 1 | — | — | 1 | ||||||||||||||
Net cash (used in) provided by financing activities | 40 | 39 | — | (488 | ) | (409 | ) | ||||||||||||
Cash and cash equivalents — net change from: | |||||||||||||||||||
Operating, investing and financing activities | — | (104 | ) | (3 | ) | — | (107 | ) | |||||||||||
Effect of exchange rate changes on cash and cash equivalents | — | — | (3 | ) | — | (3 | ) | ||||||||||||
Cash and cash equivalents at beginning of period | — | 186 | 51 | — | 237 | ||||||||||||||
Cash and cash equivalents at end of period | $ | — | $ | 82 | $ | 45 | $ | — | $ | 127 | |||||||||
35
ITEM 2. Management's Discussion and Analysis of Financial Condition and Results of Operations
You should read the following discussion in conjunction with our audited consolidated financial statements and notes thereto in our Annual Report on Form 10-K for the year ended December 31, 2015 ("Annual Report").
This Quarterly Report on Form 10-Q contains forward-looking statements within the meaning of Section 27A of the Securities Act of 1933, as amended, and Section 21E of the Securities Exchange Act of 1934, as amended (the "Exchange Act"), including, in particular, statements about future events, future financial performance, plans, strategies, expectations, prospects, competitive environment, regulation, labor matters and availability of raw materials. Forward-looking statements include all statements that are not historical facts and can be identified by the use of forward-looking terminology such as the words "may," "will," "expect," "anticipate," "believe," "estimate," "plan," "intend" or the negative of these terms or similar expressions in this Quarterly Report on Form 10-Q. We have based these forward-looking statements on our current views with respect to future events and financial performance. Our actual financial performance could differ materially from those projected in the forward-looking statements due to the inherent uncertainty of estimates, forecasts and projections, and our financial performance may be better or worse than anticipated. Given these uncertainties, you should not put undue reliance on any forward-looking statements. All of the forward-looking statements are qualified in their entirety by reference to the factors discussed under "Risk Factors" in Part I, Item 1A of our Annual Report. Forward-looking statements represent our estimates and assumptions only as of the date that they were made. We do not undertake any duty to update the forward-looking statements, and the estimates and assumptions associated with them, after the date of this Quarterly Report on Form 10-Q, except to the extent required by applicable securities laws.
This Quarterly Report on Form 10-Q contains the names of some of our owned or licensed trademarks, trade names and service marks, which we refer to as our brands. All of the product names included in this Quarterly Report on Form 10-Q are either our registered trademarks or those of our licensors.
OVERVIEW
We are a leading integrated brand owner, manufacturer and distributor of non-alcoholic beverages in the United States ("U.S."), Canada and Mexico with a diverse portfolio of flavored (non-cola) carbonated soft drinks ("CSDs") and non-carbonated beverages ("NCBs"), including ready-to-drink teas, juices, juice drinks, water and mixers. Our brand portfolio includes popular CSD brands such as Dr Pepper, Canada Dry, Peñafiel, Squirt, 7UP, Crush, A&W, Sunkist soda and Schweppes, and NCB brands such as Snapple, Hawaiian Punch, Mott's, Clamato, Mr & Mrs T mixers and Rose's. Our largest brand, Dr Pepper, is a leading flavored CSD in the U.S. according to The Nielsen Company. We have some of the most recognized beverage brands in North America, with significant consumer awareness levels and long histories that evoke strong emotional connections with consumers.
We operate as an integrated brand owner, manufacturer and distributor through our three segments. We believe our integrated business model strengthens our route-to-market and provides opportunities for net sales and profit growth through the alignment of the economic interests of our brand ownership and our manufacturing and distribution businesses through both our Direct Store Delivery ("DSD") system and our Warehouse Direct ("WD") delivery system. Our integrated business model enables us to be more flexible and responsive to the changing needs of our large retail customers and allows us to more fully leverage our scale and reduce costs by creating greater geographic manufacturing and distribution coverage.
The beverage market is subject to some seasonal variations. Our beverage sales are generally higher during the warmer months and also can be influenced by the timing of holidays and religious festivals as well as weather fluctuations.
BEVERAGE CONCENTRATES
Our Beverage Concentrates segment is principally a brand ownership business. In this segment we manufacture and sell beverage concentrates in the U.S. and Canada. Most of the brands in this segment are CSD brands. Key brands include Dr Pepper, Canada Dry, Crush, Schweppes, Sunkist soda, 7UP, A&W, Sun Drop, RC Cola, Squirt, Diet Rite, Vernors and the concentrate form of Hawaiian Punch.
Almost all of our beverage concentrates are manufactured at our plant in St. Louis, Missouri.
Beverage concentrates are shipped to third-party bottlers, as well as to our own manufacturing systems, who combine them with carbonation, water, sweeteners and other ingredients, package the combined product in PET containers, glass bottles and aluminum cans, and sell them as finished beverages to retailers. Beverage concentrates are also manufactured into syrup, which is shipped to fountain customers, such as fast food restaurants, who mix the syrup with water and carbonation to create a finished beverage at the point of sale to consumers. Dr Pepper represents most of our fountain channel volume. Concentrate prices historically have been reviewed and adjusted at least on an annual basis.
36
Our Beverage Concentrates brands are sold by our bottlers, including our own Packaged Beverages segment, through all major retail channels including supermarkets, fountains, mass merchandisers, club stores, vending machines, convenience stores, gas stations, small groceries, drug chains and dollar stores.
PACKAGED BEVERAGES
Our Packaged Beverages segment is principally a brand ownership, manufacturing and distribution business. In this segment, we primarily manufacture and distribute packaged beverages and other products, including our brands, third-party owned brands and certain private label beverages, in the U.S. and Canada. Key NCB brands in this segment include Snapple, Hawaiian Punch, Mott's, Clamato, Yoo-Hoo, Deja Blue, ReaLemon, Mr and Mrs T mixers, Nantucket Nectars, Mistic, Garden Cocktail and Rose's. Key CSD brands in this segment include 7UP, Dr Pepper, A&W, Canada Dry, Sunkist soda, Squirt, RC Cola, Vernors, Diet Rite and Sun Drop. Additionally, we distribute third-party brands such as Big Red, AriZona tea, FIJI mineral water, Neuro beverages, Vita Coco coconut water, Bai brands, Sparkling Fruit2O, Body Armor and Hydrive energy drinks. Although the majority of our Packaged Beverages' net sales relate to our brands, we also provide a route-to-market for these third party brand owners seeking effective distribution for their new and emerging brands. These brands give us exposure in certain markets to fast growing segments of the beverage industry with minimal capital investment. We also derive a portion of our sales from bottling beverages and other products for private label owners or others for a fee.
Our Packaged Beverages' products are manufactured in multiple facilities across the U.S. and are sold or distributed to retailers and their warehouses by our own distribution network or by third-party distributors. The raw materials used to manufacture our products include aluminum cans and ends, glass bottles, PET bottles and caps, paper products, sweeteners, juices, water and other ingredients.
We sell our Packaged Beverages' products both through our DSD system and our WD system, both of which include the sales to all major retail channels, including supermarkets, fountains, mass merchandisers, club stores, vending machines, convenience stores, gas stations, small groceries, drug chains and dollar stores.
LATIN AMERICA BEVERAGES
Our Latin America Beverages segment is a brand ownership, manufacturing and distribution business. This segment participates mainly in the carbonated mineral water, flavored CSD, bottled water and vegetable juice categories, with particular strength in carbonated mineral water, vegetable juice categories and grapefruit flavored CSDs. Key brands include Peñafiel, Squirt, Aguafiel, Clamato and Crush.
In Mexico, we manufacture and distribute our products through our bottling operations and third-party bottlers and distributors. We sell our finished beverages through all major Mexican retail channels, including the "mom and pop" stores, supermarkets, hypermarkets, convenience stores and on-premise channels. In the Caribbean, we distribute our products through third-party bottlers and distributors. We have also begun to distribute certain products in other international jurisdictions through various third-party bottlers and distributors.
In Mexico, we also participate in a joint venture to manufacture Aguafiel brand water with Acqua Minerale San Benedetto S.P.A. ("San Benedetto"). See Note 13 of the Notes to our Unaudited Condensed Consolidated Financial Statements for further information.
37
VOLUME
In evaluating our performance, we consider different volume measures depending on whether we sell beverage concentrates or finished beverages.
Beverage Concentrates Sales Volume
In our Beverage Concentrates segment, we measure our sales volume in two ways: (1) "concentrate case sales" and (2) "bottler case sales." The unit of measurement for both concentrate case sales and bottler case sales equals 288 fluid ounces of finished beverage, the equivalent of 24 twelve ounce servings.
Concentrate case sales represent units of measurement for concentrates sold by us to our bottlers and distributors. A concentrate case is the amount of concentrate needed to make one case of 288 fluid ounces of finished beverage. It does not include any other component of the finished beverage other than concentrate. Our net sales in our concentrate businesses are based on our sales of concentrate cases.
Although net sales in our concentrate businesses are based on concentrate case sales, we believe that bottler case sales are also a significant measure of our performance because they measure sales of packaged beverages into retail channels.
Packaged Beverages Sales Volume
In our Packaged Beverages segment, we measure volume as case sales to customers. A case sale represents a unit of measurement equal to 288 fluid ounces of packaged beverage sold by us. Case sales include both our owned brands and certain brands licensed to and/or distributed by us.
Volume in Bottler Case Sales
In addition to sales volume, we measure volume in bottler case sales ("volume (BCS)") as sales of packaged beverages, in equivalent 288 fluid ounce cases, sold by us and our bottling partners to retailers and independent distributors. Our contract manufacturing sales are not included or reported as part of volume (BCS).
Bottler case sales and concentrates and packaged beverage sales volumes are not equal during any given period due to changes in bottler concentrates inventory levels, which can be affected by seasonality, bottler inventory and manufacturing practices and the timing of price increases and new product introductions.
38
EXECUTIVE SUMMARY - FINANCIAL OVERVIEW AND RECENT DEVELOPMENTS
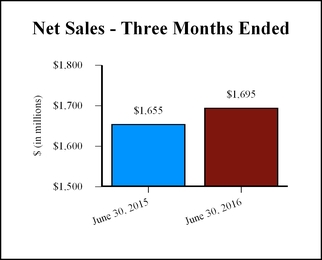
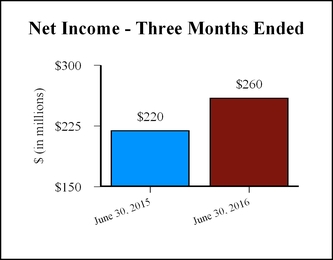
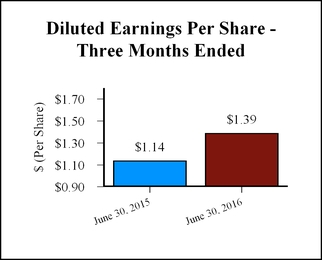
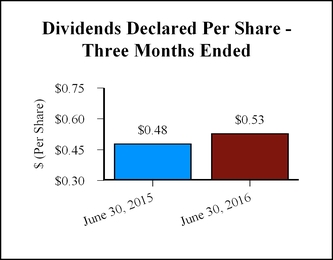
• | During the first quarter of 2016, we negotiated a $35 million lump-sum settlement to fully extinguish the Company's multi-employer pension plan withdrawal liability, which was paid in the second quarter of 2016. As a result of the timing of the payment, we recognized a $21 million gain during the second quarter of 2016 on the extinguishment of this liability, which added $0.06 to diluted earnings per share. |
• | During the three and six months ended June 30, 2016, we repurchased 1.4 million and 3.4 million shares of our common stock valued at approximately $124 million and $303 million, respectively. |
• | We now believe net sales for the year ending December 31, 2016 could increase approximately 2% as compared to the year ended December 31, 2015, while commodity costs for the year ending December 31, 2016 are now expected to decrease cost of sales by approximately 1% on a constant volume/mix basis as compared to the year ended December 31, 2015. |
RESULTS OF OPERATIONS
We eliminate from our financial results all intercompany transactions between entities included in our consolidated financial statements and the intercompany transactions with our equity method investees.
References in the financial tables to percentage changes that are not meaningful are denoted by "NM."
39
Three Months Ended June 30, 2016 Compared to Three Months Ended June 30, 2015
Consolidated Operations
The following table sets forth our unaudited consolidated results of operations for the three months ended June 30, 2016 and 2015:
For the Three Months Ended June 30, | ||||||||||||||||||||
2016 | 2015 | Dollar | Percentage | |||||||||||||||||
(dollars in millions) | Dollars | Percent | Dollars | Percent | Change | Change | ||||||||||||||
Net sales | $ | 1,695 | 100.0 | % | $ | 1,655 | 100.0 | % | $ | 40 | 2 | % | ||||||||
Cost of sales | 670 | 39.5 | 674 | 40.7 | (4) | (1 | ) | |||||||||||||
Gross profit | 1,025 | 60.5 | 981 | 59.3 | 44 | 4 | ||||||||||||||
Selling, general and administrative expenses | 590 | 34.8 | 586 | 35.4 | 4 | 1 | ||||||||||||||
Income from operations | 412 | 24.3 | 369 | 22.3 | 43 | 12 | ||||||||||||||
Interest expense | 33 | 1.9 | 28 | 1.7 | 5 | 18 | ||||||||||||||
Other (income) expense, net | (22 | ) | (1.3 | ) | 1 | 0.1 | (23) | NM | ||||||||||||
Provision for income taxes | 142 | 8.4 | 121 | 7.3 | 21 | 17 | ||||||||||||||
Effective tax rate | 35.3 | % | NM | 35.5 | % | NM | NM | NM | ||||||||||||
Volume (BCS). Volume (BCS) increased 1% for the three months ended June 30, 2016 compared with the three months ended June 30, 2015. In the U.S. and Canada, volume was flat, and in Mexico and the Caribbean, volume increased 6%, compared with the year ago period. Branded CSD and NCB volume increased 1% and 2%, respectively.
In branded CSDs, Squirt increased 8% due to higher sales to our third-party bottlers and product innovation in our Latin America Beverages segment and our Hispanic strategy in the U.S. Schweppes was 9% higher in the current period reflecting increased promotional activity at a large retailer. Peñafiel grew 4% in our Latin America Beverages segment as a result of increased promotional activity and distribution gains. Crush increased 4% reflecting increased promotional activity at a large retailer. These increases were partially offset by a 1% decline in Dr Pepper as declines in our diet were partially offset by increases in our fountain business. Canada Dry, 7UP, A&W and Sunkist soda (our "Core 4 brands") decreased 1% as a 10% decrease in 7UP, a 2% reduction in A&W and a 1% decline in Sunkist soda were partially offset by a 5% increase in Canada Dry. Our other CSD brands in total decreased 2%.
In branded NCBs, our water category increased 25% driven by distribution gains for Bai brands and Fiji, incremental promotional activity behind Bai brands in our club channel and category growth within Mexico for Aguafiel. Clamato grew 14% due to increased promotional activity in Mexico and the U.S., and distribution gains in Mexico. These increases were partially offset by a 5% decline in Hawaiian Punch as a result of higher pricing for our single-serve packages while Snapple decreased 2% as growth from product innovation was more than offset by the effect of liquidating certain Snapple inventories in the prior year. Compared to the prior period, our other NCB brands declined 10% as a result of discontinuing the distribution of Country Time. Mott's was flat compared with the year ago period as volume gains in our sauce products were fully offset by volume losses in juice due to higher pricing on single serve packages.
Net Sales. Net sales increased $40 million, or approximately 2%, for the three months ended June 30, 2016 compared with the three months ended June 30, 2015. The primary factors of the increase in net sales included:
• | Favorable product and package mix, which increased net sales by 2%; |
• | Higher pricing, which increased net sales by 1%; |
• | Increase in shipments, which increased net sales by 1%; and |
• | Unfavorable foreign currency translation of $26 million, which decreased net sales by 2%. |
40
Gross Profit. Gross profit increased $44 million for the three months ended June 30, 2016 compared with the three months ended June 30, 2015. Gross margin of 60.5% for the three months ended June 30, 2016, was higher than the 59.3% gross margin for the three months ended June 30, 2015. The primary drivers of the change in gross margin for the three months ended June 30, 2016 included:
• | Favorable comparison in our mark-to-market activity on commodity derivative contracts, which increased our gross margin by 0.9%; |
• | Lower commodity costs, led by packaging, and net of the change in our LIFO inventory provision, which raised our gross margin by 0.6%; |
• | Ongoing productivity improvements, which increased our gross margin by 0.5%; |
• | Higher net pricing, which raised our gross margin by 0.5%; |
• | Unfavorable product, package and segment mix, which reduced our gross margin by 1.0%; and |
• | Unfavorable foreign currency effects, which decreased our gross margin by 0.3%. |
The favorable mark-to-market activity on commodity derivative contracts for the three months ended June 30, 2016 was $13 million in unrealized gains versus $2 million in unrealized losses in the year ago period.
Selling, General and Administrative Expenses. Selling, general and administrative ("SG&A") expenses increased $4 million for the three months ended June 30, 2016 compared with the three months ended June 30, 2015. The driver of the increase in SG&A expenses was primarily higher people costs. Other drivers of the increase included a non-recurring charge of $4 million related to the transition of a certain employee benefit program, higher incentive compensation and increases in other miscellaneous expenses. These increases were partially offset by $8 million of favorable foreign currency effects, lower logistics costs, primarily driven by lower fuel rates, lower marketing costs and the favorable comparison of the mark-to-market activity on commodity derivative contracts.
Income from Operations. Income from operations increased $43 million to $412 million for the three months ended June 30, 2016 due to the increase in gross profit.
Interest Expense. Interest expense increased $5 million for the three months ended June 30, 2016 compared with the three months ended June 30, 2015 due primarily to the higher average debt balance and higher average interest rates attributable to the issuance of our senior unsecured notes due in 2025 and 2045, which occurred during the fourth quarter of 2015.
Other (Income) Expense, net. Other (income) expense, net increased $23 million for the three months ended June 30, 2016 compared with the three months ended June 30, 2015 as a result of a $21 million gain on the extinguishment of a multi-employer pension plan withdrawal liability. Refer to Note 7 of the Notes to our Unaudited Condensed Consolidated Financial Statements for further discussion.
41
Results of Operations by Segment
The following tables set forth net sales and SOP for our segments for the three months ended June 30, 2016 and 2015, as well as the other amounts necessary to reconcile our total segment results to our consolidated results presented in accordance with accounting principles generally accepted in the United States of America ("U.S. GAAP"):
For the Three Months Ended | |||||||
June 30, | |||||||
(in millions) | 2016 | 2015 | |||||
Segment Results — Net sales | |||||||
Beverage Concentrates | $ | 342 | $ | 330 | |||
Packaged Beverages | 1,225 | 1,188 | |||||
Latin America Beverages | 128 | 137 | |||||
Net sales | $ | 1,695 | $ | 1,655 | |||
For the Three Months Ended | |||||||
June 30, | |||||||
(in millions) | 2016 | 2015 | |||||
Segment Results — SOP | |||||||
Beverage Concentrates | $ | 230 | $ | 222 | |||
Packaged Beverages | 209 | 190 | |||||
Latin America Beverages | 24 | 27 | |||||
Total SOP | 463 | 439 | |||||
Unallocated corporate costs | 52 | 70 | |||||
Other operating income, net | (1 | ) | — | ||||
Income from operations | 412 | 369 | |||||
Interest expense, net | 32 | 27 | |||||
Other (income) expense, net | (22 | ) | 1 | ||||
Income before provision for income taxes and equity in earnings of unconsolidated subsidiaries | $ | 402 | $ | 341 | |||
BEVERAGE CONCENTRATES
The following table details our Beverage Concentrates segment's net sales and SOP for the three months ended June 30, 2016 and 2015:
For the Three Months Ended | ||||||||||||||
June 30, | Dollar | Percentage | ||||||||||||
(in millions) | 2016 | 2015 | Change | Change | ||||||||||
Net sales | $ | 342 | $ | 330 | $ | 12 | 4 | % | ||||||
SOP | 230 | 222 | 8 | 4 | ||||||||||
Net Sales. Net sales increased $12 million for the three months ended June 30, 2016, compared with the three months ended June 30, 2015. The change was due to higher pricing, lower discounts and a 1% increase in concentrate case sales. The lower discounts was the result of a favorable comparison of the annual true-up of our estimated customer incentive liability partially offset by higher discounts primarily driven by our fountain business.
SOP. SOP increased $8 million for the three months ended June 30, 2016, compared with the three months ended June 30, 2015, driven primarily by an increase in net sales partially offset by higher SG&A expenses. The increase in SG&A expenses was the result of higher marketing investments, increased people costs and increases in other operating costs.
42
Volume (BCS). Volume (BCS) was flat for the three months ended June 30, 2016, compared with the three months ended June 30, 2015. Schweppes and Crush had gains of 9% and 6%, respectively, reflecting increased promotional activity at a large retailer. Our Core 4 brands were 1% higher compared to the prior year as a result of a 6% increase in Canada Dry, partially offset by an 8% decrease in 7UP, a 3% reduction in Sunkist soda and a 3% decline in A&W. These increases were fully offset by a 1% reduction in Dr Pepper, as declines in our diet were partially offset by increases in our fountain business, while our other brands in total declined 8%, as a result of discontinuing the distribution of Country Time.
PACKAGED BEVERAGES
The following table details our Packaged Beverages segment's net sales and SOP for the three months ended June 30, 2016 and 2015:
For the Three Months Ended | ||||||||||||||
June 30, | Dollar | Percentage | ||||||||||||
(in millions) | 2016 | 2015 | Change | Change | ||||||||||
Net sales | $ | 1,225 | $ | 1,188 | $ | 37 | 3 | % | ||||||
SOP | 209 | 190 | 19 | 10 | ||||||||||
Volume. Branded CSD volumes decreased 2% for the three months ended June 30, 2016 compared with the three months ended June 30, 2015. Volume for our Core 4 brands decreased 2% compared to the prior year period, led by a 9% decrease in 7UP and a 2% decline in A&W, partially offset by a 6% increase in Canada Dry. Dr Pepper decreased 2% due to declines in TEN and diet. Compared to the prior period, our other CSD brands decreased 5%. These decreases were partially offset by a 6% gain in Squirt.
Branded NCB volumes increased 3% for the three months ended June 30, 2016 compared with the three months ended June 30, 2015. Our water category gained 27% primarily driven by distribution gains for Bai brands and Fiji, and incremental promotional activity behind Bai brands in our club channel. Clamato increased 7% compared to the prior period as a result of increased promotional activity. Our other NCB brands increased 2%, led by Body Armor and Venom. These increases were partially offset by a 5% decline in Hawaiian Punch as a result of higher pricing for our single-serve packages and a 1% decrease in Snapple as growth from product innovation was more than offset by the effect of liquidating certain Snapple inventories in the prior year. Mott's was flat compared to the prior period, as volume gains in our sauce products were fully offset by volume losses in juice due to higher pricing on single serve packages.
Contract manufacturing decreased 9% for the three months ended June 30, 2016 compared with the three months ended June 30, 2015.
Net Sales. Net sales increased $37 million for the three months ended June 30, 2016, compared with the three months ended June 30, 2015. Net sales increased due to favorable product and package mix, as a result of our NCBs, including our allied brands, and higher pricing. These increases were partially offset by a reduction in our contract manufacturing and $2 million of unfavorable foreign currency translation. Compared to the prior period, the net sales impact for branded CSD and NCB volumes was flat.
SOP. SOP increased $19 million for the three months ended June 30, 2016, compared with the three months ended June 30, 2015 as increases in net sales were partially offset by increases in cost of sales and SG&A expenses. Cost of sales increased as a result of higher costs associated with product mix, as a result of our NCBs, including our allied brands, which were partially offset by lower commodity costs, led by packaging, and ongoing productivity improvements. SG&A expenses increased as a result of higher people costs and a non-recurring charge of $4 million related to the transition of a certain employee benefit program, which were partially offset by reductions in our logistics costs, driven primarily by lower fuel rates, and lower marketing investments.
43
LATIN AMERICA BEVERAGES
The following table details our Latin America Beverages segment's net sales and SOP for the three months ended June 30, 2016 and 2015:
For the Three Months Ended | ||||||||||||||
June 30, | Dollar | Percent | ||||||||||||
(in millions) | 2016 | 2015 | Change | Change | ||||||||||
Net sales | $ | 128 | $ | 137 | $ | (9 | ) | (7 | )% | |||||
SOP | 24 | 27 | (3 | ) | (11 | ) | ||||||||
Volume. Sales volume increased 6% for the three months ended June 30, 2016, as compared with the three months ended June 30, 2015. The increase in sales volume was primarily driven by a 9% gain in Squirt primarily due to higher sales to third party bottlers and product innovation, and a 4% increase in Peñafiel as a result of increased promotional activity and distribution gains. Aguafiel increased 18% due to category growth, while Clamato grew 25% driven by distribution gains and increased promotional activity. Our other brands increased 1% compared to the prior period. These increases were partially offset by a 32% decrease in 7UP, driven by declines in Puerto Rico, and a 5% reduction in Crush.
Net Sales. Net sales decreased $9 million for the three months ended June 30, 2016, compared with the three months ended June 30, 2015. Net sales decreased as a result of unfavorable foreign currency translation of $23 million partially offset by increased sales volume, higher pricing and favorable product mix.
SOP. SOP decreased $3 million for the three months ended June 30, 2016, compared with the three months ended June 30, 2015, driven by a decrease in net sales, partially offset by decreases in cost of sales and SG&A expenses. Cost of sales declined in the current period as a result of favorable foreign currency effects and ongoing productivity improvements. These decreases were partially offset by higher costs associated with increased sales volumes and product mix. SG&A expenses declined in the current period as a result of favorable foreign currency effects, partially offset by increased people costs, higher logistics costs and an increase in merchandising costs. The impact of the favorable foreign currency effects, which decreased cost of sales and SG&A expenses, totaled $14 million.
Six Months Ended June 30, 2016 Compared to Six Months Ended June 30, 2015
Consolidated Operations
The following table sets forth our unaudited consolidated results of operations for the six months ended June 30, 2016 and 2015:
For the Six Months Ended June 30, | ||||||||||||||||||||
2016 | 2015 | Dollar | Percentage | |||||||||||||||||
($ in millions) | Dollars | Percent | Dollars | Percent | Change | Change | ||||||||||||||
Net sales | $ | 3,182 | 100.0 | % | $ | 3,106 | 100.0 | % | $ | 76 | 2 | % | ||||||||
Cost of sales | 1,272 | 40.0 | 1,276 | 41.1 | (4 | ) | — | |||||||||||||
Gross profit | 1,910 | 60.0 | 1,830 | 58.9 | 80 | 4 | ||||||||||||||
Selling, general and administrative expenses | 1,136 | 35.7 | 1,138 | 36.6 | (2 | ) | — | |||||||||||||
Income from operations | 725 | 22.8 | 639 | 20.6 | 86 | 13 | ||||||||||||||
Interest expense | 66 | 2.1 | 55 | 1.8 | 11 | 20 | ||||||||||||||
Other (income) expense, net | (23 | ) | (0.7 | ) | — | — | (23 | ) | NM | |||||||||||
Provision for income taxes | 241 | 7.6 | 208 | 6.7 | 33 | 16 | ||||||||||||||
Effective tax rate | 35.3 | % | NM | 35.6 | % | NM | NM | NM | ||||||||||||
Volume (BCS). Volume (BCS) increased 1% for the six months ended June 30, 2016 compared with the six months ended June 30, 2015. In the U.S. and Canada, volume grew 1%, and in Mexico and the Caribbean, volume increased 6%, compared with the year ago period. Branded CSD volumes grew 1% while NCB volumes increased 2%.
44
In branded CSDs, Dr Pepper grew 1% driven by increases in our fountain business partially offset by declines in our diet. Schweppes increased 9% reflecting increased promotional activity at a large retailer. Squirt increased 6% as a result of higher sales to third party bottlers and product innovation in our Latin America Beverages segment and our Hispanic strategy in the U.S. Peñafiel grew 4% due primarily to increased promotional activity and distribution gains in our Latin America Beverages segment. Crush increased 5% reflecting increased promotional activity at a large retailer. These increases were partially offset by a 2% decrease in our Core 4 brands compared to the year ago period, driven by a 10% decrease in 7UP, a 3% decline in Sunkist soda and a 2% decrease in A&W, partially offset by a 4% increase in Canada Dry. Our other CSD brands declined 1% compared with the year ago period.
In branded NCBs, growth was primarily driven by our water category which grew 23%, due to distribution gains for Bai brands and Fiji, increased promotional activity behind Bai brands in our club channel and category growth within Mexico for Aguafiel. Clamato grew 12% due to increased promotional activity in Mexico and the U.S., and distribution gains in Mexico. Snapple increased 1% as distribution gains and product innovation was partially offset by the effect of liquidating certain Snapple inventories in the prior year. These increases were partially offset by a 6% decrease in Hawaiian Punch as a result of higher pricing for our single-serve packages and a 2% decline in Mott's due to higher pricing on single serve juice packages, partially offset by gains in our sauce products. Compared with the year ago period, our other NCB brands in total were 6% lower as a result of discontinuing the distribution of Country Time.
Net Sales. Net sales increased $76 million, or approximately 2%, for the six months ended June 30, 2016 compared with the six months ended June 30, 2015. The primary drivers of the increase in net sales included:
• | Favorable product and package mix, which increased net sales by 3%; |
• | Higher pricing, which increased net sales by 1%; |
• | Increase in shipments, which increased net sales by 1%; |
• | Unfavorable foreign currency translation of $47 million, which decreased net sales by 2%; and |
• | Unfavorable segment mix, which decreased net sales by 1%. |
Gross Profit. Gross profit increased $80 million for the six months ended June 30, 2016 compared with the six months ended June 30, 2015. Gross margin was 60.0% for the six months ended June 30, 2016 compared to the gross margin of 58.9% for the six months ended June 30, 2015. The primary drivers of the change in gross margin included:
• | Lower commodity costs, led by packaging, which increased our gross margin by 0.8%; |
• | Favorable comparison in our mark-to-market activity on commodity derivative contracts, which raised our gross margin by 0.6%; |
• | Higher net pricing, which increased our gross margin by 0.5%; |
• | Ongoing productivity improvements, which raised our gross margin by 0.4%; |
• | Unfavorable product, package and segment mix, which decreased our gross margin by 0.8%; |
• | Unfavorable foreign currency effects, which lowered our gross margin by 0.3%; and |
• | An increase in our other manufacturing costs, which reduced our gross margin by 0.1%. |
The favorable mark-to-market activity on commodity derivative contracts for the six months ended June 30, 2016 was $16 million in unrealized gains versus $4 million in unrealized losses in the year ago period.
SG&A Expenses. SG&A expenses decreased $2 million for the six months ended June 30, 2016 compared with the six months ended June 30, 2015. The drivers of the decrease in SG&A expenses were lower marketing investments, favorable foreign currency effects of $16 million, lower logistics costs, driven by lower fuel rates, and the favorable comparison of the mark-to-market activity on commodity derivative contracts. These decreases were almost entirely offset by higher people costs, higher incentive compensation, a $4 million arbitration award related to our Mexican joint venture, a non-recurring charge of $4 million related to the transition of a certain employee benefit program and increases in other miscellaneous expenses.
Income from Operations. Income from operations increased $86 million to $725 million for the six months ended June 30, 2016 due primarily to the increase in gross profit.
45
Interest Expense. Interest expense increased $11 million for the six months ended June 30, 2016 compared with the six months ended June 30, 2015 due primarily to the higher average debt balance and higher average interest rates attributable to the issuance of our senior unsecured notes due in 2025 and 2045, which occurred during the fourth quarter of 2015.
Other (Income) Expense, net. Other (income) expense, net increased $23 million for the six months ended June 30, 2016 compared with the six months ended June 30, 2015 as a result of a $21 million gain on the extinguishment of a multi-employer pension plan withdrawal liability. Refer to Note 7 of the Notes to our Unaudited Condensed Consolidated Financial Statements for further discussion.
Results of Operations by Segment
The following tables set forth net sales and SOP for our segments for the six months ended June 30, 2016 and 2015, as well as the other amounts necessary to reconcile our total segment results to our consolidated results presented in accordance with U.S. GAAP:
For the Six Months Ended | |||||||
June 30, | |||||||
(in millions) | 2016 | 2015 | |||||
Segment Results — Net sales | |||||||
Beverage Concentrates | $ | 629 | $ | 615 | |||
Packaged Beverages | 2,322 | 2,241 | |||||
Latin America Beverages | 231 | 250 | |||||
Net sales | $ | 3,182 | $ | 3,106 | |||
For the Six Months Ended | |||||||
June 30, | |||||||
(in millions) | 2016 | 2015 | |||||
Segment Results — SOP | |||||||
Beverage Concentrates | $ | 417 | $ | 405 | |||
Packaged Beverages | 384 | 331 | |||||
Latin America Beverages | 39 | 44 | |||||
Total SOP | 840 | 780 | |||||
Unallocated corporate costs | 116 | 141 | |||||
Other operating income, net | (1 | ) | — | ||||
Income from operations | 725 | 639 | |||||
Interest expense, net | 65 | 54 | |||||
Other (income) expense, net | (23 | ) | — | ||||
Income before provision for income taxes and equity in earnings of unconsolidated subsidiaries | $ | 683 | $ | 585 | |||
46
BEVERAGE CONCENTRATES
The following table details our Beverage Concentrates segment's net sales and SOP for the six months ended June 30, 2016 and 2015:
For the Six Months Ended | ||||||||||||||
June 30, | Dollar | Percent | ||||||||||||
(in millions) | 2016 | 2015 | Change | Change | ||||||||||
Net sales | $ | 629 | $ | 615 | $ | 14 | 2 | % | ||||||
SOP | 417 | 405 | 12 | 3 | ||||||||||
Net Sales. Net sales increased $14 million for the six months ended June 30, 2016 compared with the six months ended June 30, 2015. The increase was due to higher pricing and a 1% increase in concentrate case sales. These drivers were partially offset by higher discounts and $3 million of unfavorable foreign currency translation. The higher discounts was driven by our fountain business partially offset by a favorable comparison of the annual true-up of our estimated customer incentive liability.
SOP. SOP increased $12 million for the six months ended June 30, 2016 compared with the six months ended June 30, 2015, primarily driven by an increase in net sales partially offset by higher SG&A expenses. The increase in SG&A expenses was the result of higher people costs and increases in other operating costs, partially offset by $5 million in planned lower marketing investments.
Volume (BCS). Volume (BCS) had a 1% increase for the six months ended June 30, 2016 compared with the six months ended June 30, 2015. Dr Pepper increased 1% compared to the year ago period driven by increases in our fountain business partially offset by declines in our diet. Schweppes and Crush had gains of 9% and 5%, respectively, reflecting increased promotional activity at a large retailer. These increases were partially offset by a 6% decline in our other brands in total as a result of discontinuing the distribution of Country Time. Our Core 4 brands were flat compared to the year ago period as a result of a 5% gain in Canada Dry was fully offset by a 10% reduction in 7UP, a 3% decrease in Sunkist soda and a 1% decline in A&W.
PACKAGED BEVERAGES
The following table details our Packaged Beverages segment's net sales and SOP for the six months ended June 30, 2016 and 2015:
For the Six Months Ended | ||||||||||||||
June 30, | Dollar | Percent | ||||||||||||
(in millions) | 2016 | 2015 | Change | Change | ||||||||||
Net sales | $ | 2,322 | $ | 2,241 | $ | 81 | 4 | % | ||||||
SOP | 384 | 331 | 53 | 16 | ||||||||||
Volume. Branded CSD volumes decreased 3% for the six months ended June 30, 2016 compared with the six months ended June 30, 2015. Volume for our Core 4 brands decreased 3% compared to the prior period, led by a 10% decrease in 7UP, a 3% decrease in A&W and a 4% decline in Sunkist soda, partially offset by a 5% increase in Canada Dry. Dr Pepper decreased 1% due to declines in TEN and diet. Compared to the prior period, our other CSD brands decreased 5%. These decreases were partially offset by a 5% gain in Squirt.
Branded NCB volumes increased 3% for the six months ended June 30, 2016 compared with the six months ended June 30, 2015. Our water category gained 25% due primarily to distribution gains for Bai brands and Fiji, and incremental promotional activity behind Bai brands in our club channel. Snapple gained 2% as growth from product innovation was more than offset by the effect of liquidating certain Snapple inventories in the prior year, while Clamato increased 5% as a result of increased promotional activity. Our other NCB brands were 3% higher compared to the prior period, led by Body Armor and Venom. These increases were partially offset by a 5% decline in Hawaiian Punch as a result of higher pricing for our single-serve packages and a 2% decrease in Mott's due to higher pricing on single serve juice packages, partially offset by gains in our sauce products.
Contract manufacturing decreased 5% for the six months ended June 30, 2016 compared with the six months ended June 30, 2015.
47
Net Sales. Net sales increased $81 million for the six months ended June 30, 2016 compared with the six months ended June 30, 2015. Net sales increased due to favorable product and package mix, as a result of our NCBs, including our allied brands, and higher pricing. These increases were partially offset by lower branded sales volumes, a reduction in our contract manufacturing and $5 million of unfavorable foreign currency translation.
SOP. SOP increased $53 million for the six months ended June 30, 2016, compared with the six months ended June 30, 2015 as increases in net sales were partially offset by increases in cost of sales and SG&A expenses. Cost of sales increased as a result of higher costs associated with product mix, as a result of our NCBs, including our allied brands, which were partially offset by lower commodity costs, led by packaging, and ongoing productivity improvements. SG&A expenses increased as a result of higher people costs, a non-recurring charge of $4 million related to the transition of a certain employee benefit program and increases in other miscellaneous expenses, which were partially offset by reductions in our logistics costs, driven primarily by lower fuel rates, and marketing investments.
LATIN AMERICA BEVERAGES
The following table details our Latin America Beverages segment's net sales and SOP for the six months ended June 30, 2016 and 2015:
For the Six Months Ended | ||||||||||||||
June 30, | Dollar | Percent | ||||||||||||
(in millions) | 2016 | 2015 | Change | Change | ||||||||||
Net sales | $ | 231 | $ | 250 | $ | (19 | ) | (8 | )% | |||||
SOP | 39 | 44 | (5 | ) | (11 | ) | ||||||||
Volume. Sales volume increased 6% for the six months ended June 30, 2016 as compared with the six months ended June 30, 2015. The increase in sales volume was driven by a 4% gain in Peñafiel as a result of increased promotional activity and distribution gains. Squirt increased 6% primarily due to higher sales to third party bottlers and product innovation. Aguafiel grew 17% as a result of category growth. Clamato was 23% higher compared to the prior period due to increased promotional activity and distribution gains. Crush and our other brands grew by 4% and 1%, respectively. These increases were partially offset by a 14% decrease in 7UP driven by declines in Puerto Rico.
Net Sales. Net sales decreased $19 million for the six months ended June 30, 2016 compared with the six months ended June 30, 2015. Net sales decreased as a result of unfavorable foreign currency translation of $40 million and higher discounts, partially offset by increased sales volume, higher pricing and favorable product mix.
SOP. SOP decreased $5 million for the six months ended June 30, 2016 compared with the six months ended June 30, 2015, driven by a decrease in net sales partially offset by decreases in cost of sales and SG&A expenses. Cost of sales declined compared to the prior period as a result of favorable foreign currency effects, lower commodity costs, led by packaging, and ongoing productivity improvements. These decreases were partially offset by higher costs associated with increased sales volumes. SG&A expenses decreased compared to the prior period as a result of favorable foreign currency effects, which were partially offset by a $4 million arbitration award related to our Mexican joint venture, higher people costs, increases in logistic costs and increased merchandising costs. The impact of the favorable foreign currency effects, which decreased cost of sales and SG&A expenses, totaled $26 million.
CRITICAL ACCOUNTING ESTIMATES
The process of preparing our consolidated financial statements in conformity with U.S. GAAP requires the use of estimates and judgments that affect the reported amounts of assets, liabilities, revenue and expenses. Critical accounting estimates are both fundamental to the portrayal of a company’s financial condition and results and require difficult, subjective or complex estimates and assessments. These estimates and judgments are based on historical experience, future expectations and other factors and assumptions we believe to be reasonable under the circumstances. The most significant estimates and judgments are reviewed on an ongoing basis and revised when necessary.
48
We have identified the items described below as our critical accounting estimates:
• | goodwill and other indefinite-lived intangible assets; |
• | revenue recognition; |
• | pension benefits; |
• | risk management programs; and |
• | income taxes. |
These critical accounting estimates are discussed in greater detail in our Annual Report.
LIQUIDITY AND CAPITAL RESOURCES
Trends and Uncertainties Affecting Liquidity
Customer and consumer demand for the Company's products may be impacted by various risk factors discussed under "Risk Factors" in Part I, Item 1A, of our Annual Report, including recession or other economic downturn in the U.S., Mexico and the Caribbean or Canada, which could result in a reduction in our sales volume. Similarly, disruptions in financial and credit markets may impact our ability to manage normal commercial relationships with our customers, suppliers and creditors. These disruptions could have a negative impact on the ability of our customers to timely pay their obligations to us, thus reducing our cash flow, or the ability of our vendors to timely supply materials.
We believe that the following events, trends and uncertainties may also impact liquidity:
• | our continued repurchases of our outstanding common stock pursuant to our repurchase programs; |
• | continued payment of dividends; |
• | continued capital expenditures; |
• | seasonality of our operating cash flows; |
• | our ability to issue unsecured commercial paper notes ("Commercial Paper") on a private placement basis up to a maximum aggregate amount outstanding at any time of $500 million; |
• | fluctuations in our tax obligations; and |
• | future equity investments in allied brands and/or acquisitions of regional bottling companies, distributors and/or distribution rights to further extend our geographic coverage. |
Financing Arrangements
The following descriptions represent our available financing arrangements as of June 30, 2016. As of June 30, 2016, we were in compliance with all covenant requirements for our senior unsecured notes, unsecured credit agreement and commercial paper program.
Commercial Paper Program
On December 10, 2010, we entered into a commercial paper program under which we may issue Commercial Paper on a private placement basis up to a maximum aggregate amount outstanding at any time of $500 million. The maturities of the Commercial Paper will vary, but may not exceed 364 days from the date of issuance. We issue Commercial Paper as needed for general corporate purposes. The program is supported by the Revolver (as defined below). Outstanding Commercial Paper reduces the amount of borrowing capacity available under the Revolver and outstanding amounts under the Revolver reduce the Commercial Paper availability. As of June 30, 2016 and 2015, we had no Commercial Paper outstanding. We had weighted average commercial paper borrowings of $2 million and $1 million during the three and six months ended June 30, 2016, respectively. These borrowings had maturities of 90 days or less and a weighted average annual rate of 0.65% for the three and six months ended June 30, 2016. During the three and six months ended June 30, 2015, we had weighted average commercial paper borrowings of $91 million and $46 million, respectively. These borrowings had maturities of 90 days or less and a weighted average annual rate of 0.51% for the three and six months ended June 30, 2015.
49
Unsecured Credit Agreement
On September 25, 2012, we entered into a five-year unsecured credit agreement (the "Credit Agreement"), which provides for a $500 million revolving line of credit (the "Revolver"). Borrowings under the Revolver bear interest at a floating rate per annum based upon the alternate base rate ("ABR") or the Eurodollar rate, in each case plus an applicable margin which varies based upon our debt ratings. Rates range from 0.000% to 0.300% for ABR loans and from 0.795% to 1.300% for Eurodollar loans. The ABR is defined as the greater of (a) JPMorgan Chase Bank's prime rate, (b) the federal funds effective rate plus 0.500% and (c) the adjusted London Interbank Offered Rate ("LIBOR") for a one month interest period. The adjusted LIBOR is LIBOR for dollars adjusted for a statutory reserve rate set by the Board of Governors of the U.S. Federal Reserve System.
Additionally, the Revolver is available for the issuance of letters of credit and swingline advances not to exceed $75 million and $50 million, respectively. Swingline advances will accrue interest at a rate equal to the ABR plus the applicable margin. Letters of credit and swingline advances will reduce, on a dollar for dollar basis, the amount available under the Revolver.
Refer to Note 5 of the Notes to our Unaudited Condensed Consolidated Financial Statements for discussion of amounts utilized and available under the Revolver.
The Credit Agreement further provides that we may request at any time, subject to the satisfaction of certain conditions, that the aggregate commitments under the facility be increased by a total amount not to exceed $250 million.
The Credit Agreement's representations, warranties, covenants and events of default are generally customary for investment grade credit and include a covenant that requires us to maintain a ratio of consolidated total debt (as defined in the Credit Agreement) to annualized consolidated EBITDA (as defined in the Credit Agreement) of no more than 3.00 to 1.00, tested quarterly. Upon the occurrence of an event of default, among other things, amounts outstanding under the Credit Agreement may be accelerated and the commitments may be terminated. Our obligations under the Credit Agreement are guaranteed by certain of our direct and indirect domestic subsidiaries on the terms set forth in the Credit Agreement. The Credit Agreement has a maturity date of September 25, 2017; however, with the consent of lenders holding more than 50% of the total commitments under the Credit Agreement and subject to the satisfaction of certain conditions, we may extend the maturity date for up to two additional one-year terms.
A facility fee is payable quarterly to the lenders on the unused portion of the commitments available under the Revolver equal to 0.08% to 0.20% per annum, depending upon our credit ratings.
Letters of Credit Facilities
We currently have letters of credit facilities available in addition to the portion of the Revolver reserved for issuance of letters of credit. Under these incremental letters of credit facilities, $120 million is available for the issuance of letters of credit, $60 million of which was utilized as of June 30, 2016 and $60 million of which remains available for use.
Debt Ratings
As of June 30, 2016, our credit ratings were as follows:
Rating Agency | Long-Term Debt Rating | Commercial Paper Rating | Outlook | Date of Last Change |
Moody's | Baa1 | P-2 | Stable | May 18, 2011 |
S&P | BBB+ | A-2 | Stable | November 13, 2013 |
These debt and commercial paper ratings impact the interest we pay on our financing arrangements. A downgrade of one or both of our debt and commercial paper ratings could increase our interest expense and decrease the cash available to fund anticipated obligations.
Cash Management
We primarily fund our liquidity needs from cash flow from operations and cash on hand. We will use amounts available under our financing arrangements as seasonality of our operating cash flows impact short-term liquidity or our senior unsecured notes mature.
50
Capital Expenditures
Capital expenditures were $68 million for the six months ended June 30, 2016. Capital expenditures were primarily related to machinery and equipment, and costs associated with a new manufacturing plant in Mexico. In 2016, we expect to incur annual capital expenditures, net of proceeds from disposals, in an amount approximately 3% of our net sales, which we expect to fund through cash provided by operating activities.
Acquisitions and Investments
We may make future equity investments in allied brands and/or acquisitions of regional bottling companies, distributors and/or distribution rights to further extend our geographic coverage. Any acquisitions may require additional funding for future capital expenditures and possibly restructuring expenses.
Liquidity
Based on our current and anticipated level of operations, we believe that our operating cash flows will be sufficient to meet our anticipated obligations for the next twelve months. To the extent that our operating cash flows are not sufficient to meet our liquidity needs, we may utilize cash on hand or amounts available under our financing arrangements, if necessary.
The following table summarizes our cash activity for the six months ended June 30, 2016 and 2015:
For the Six Months Ended | |||||||
June 30, | |||||||
(in millions) | 2016 | 2015 | |||||
Net cash provided by operating activities | $ | 407 | $ | 349 | |||
Net cash used in investing activities | (79 | ) | (47 | ) | |||
Net cash used in financing activities | (995 | ) | (409 | ) | |||
NET CASH PROVIDED BY OPERATING ACTIVITIES
Net cash provided by operating activities increased $58 million for the six months ended June 30, 2016, as compared to the six months ended June 30, 2015, primarily due to changes in working capital, which included our $35 million multi-employer pension plan settlement payment, and the increase in net income, after adjusting for non-cash items.
NET CASH USED IN INVESTING ACTIVITIES
Cash used in investing activities for the six months ended June 30, 2016 consisted primarily of purchases of property, plant and equipment of $68 million and an additional investment in BA Sports Nutrition, LLC of $6 million. Cash used in investing activities for the six months ended June 30, 2015 consisted primarily of purchases of property, plant and equipment of $42 million and the purchase of a cost method investment in BAI Brands, LLC for $15 million.
NET CASH USED IN FINANCING ACTIVITIES
Cash used in financing activities for the six months ended June 30, 2016 consisted primarily of the repayment of the aggregate principal amount of the 2016 Notes of $500 million, stock repurchases of $303 million and dividend payments of $190 million. Net cash used in financing activities for the six months ended June 30, 2015 consisted primarily of stock repurchases of $251 million and dividend payments of $172 million.
Cash and Cash Equivalents
Cash and cash equivalents decreased $666 million since December 31, 2015 to $245 million as of June 30, 2016 primarily driven by repayment of senior unsecured notes, returns to our stockholders, and capital expenditures, partially offset by operating cash flows.
Our cash balances are used to fund working capital requirements, scheduled debt and interest payments, capital expenditures, income tax obligations, dividend payments and repurchases of our common stock. Cash generated by our foreign operations is generally repatriated to the U.S. periodically as working capital funding requirements in those jurisdictions allow. Foreign cash balances were $64 million and $52 million as of June 30, 2016 and December 31, 2015, respectively. We accrue tax costs for repatriation, as applicable, as cash is generated in those foreign jurisdictions.
51
Total Shareholder Distributions Our Board of Directors (our "Board") declared dividends aggregating $1.06 and $0.96 per share on outstanding common stock during the six months ended June 30, 2016 and 2015, respectively, and we continued common stock repurchases based upon authorizations from our Board. Refer to Part II, Item 2 of this Quarterly Report on Form 10-Q for additional information regarding these repurchases. The following chart details these payments during the six months ended June 30, 2016 and 2015. | 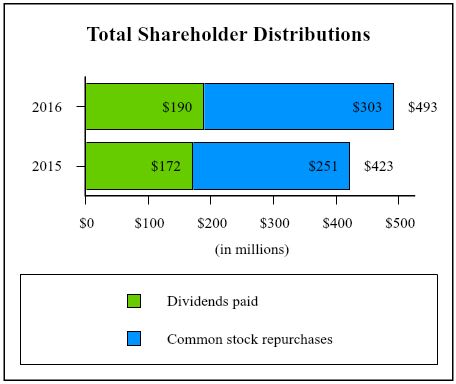 |
Contractual Commitments and Obligations
We enter into various contractual obligations that impact, or could impact, our liquidity. Based on our current and anticipated level of operations, we believe that our proceeds from operating cash flows will be sufficient to meet our anticipated obligations. To the extent that our operating cash flows are not sufficient to meet our liquidity needs, we may utilize cash on hand or amounts available under our financing arrangements, if necessary.
The following table summarizes our contractual obligations and contingencies, as of June 30, 2016, that have significantly changed from the amounts disclosed in our Annual Report:
Payments Due in Year | |||||||||||||||||||||||||||
(in millions) | Total | 2016 | 2017 | 2018 | 2019 | 2020 | After 2020 | ||||||||||||||||||||
Senior unsecured notes(1) | $ | 2,724 | $ | — | $ | — | $ | 724 | $ | 250 | $ | 250 | $ | 1,500 | |||||||||||||
Purchase obligations (2) | 886 | 422 | 206 | 103 | 80 | 44 | 31 | ||||||||||||||||||||
Interest payments | 1,040 | 55 | 110 | 87 | 60 | 56 | 672 | ||||||||||||||||||||
Multi-employer pension plan withdrawal payments(3) | — | — | — | — | — | — | — | ||||||||||||||||||||
Total | $ | 4,650 | $ | 477 | $ | 316 | $ | 914 | $ | 390 | $ | 350 | $ | 2,203 | |||||||||||||
(1) | Amounts represent payment for the senior unsecured notes issued by us. Please refer to Note 5 of the Notes to our Unaudited Condensed Consolidated Financial Statements for further information. |
(2) | Amounts represent payments under agreements to purchase goods or services that are legally binding and that specify all significant terms, including capital obligations and long-term contractual obligations. |
(3) | As of December 31, 2015, this amount represented our contractual payment obligations, which included the associated interest, for our multi-employer pension plan withdrawal liabilities. During the first quarter of 2016, we negotiated a $35 million lump-sum settlement to extinguish these contractual liabilities, which was paid during the second quarter of 2016. |
Through June 30, 2016, there have been no other material changes to the amounts disclosed in our Annual Report.
52
OFF-BALANCE SHEET ARRANGEMENTS
There have been no material changes in off-balance sheet arrangements from those disclosed in our Annual Report.
EFFECT OF RECENT ACCOUNTING PRONOUNCEMENTS
Refer to Note 1 of the Notes to our Unaudited Condensed Consolidated Financial Statements for a discussion of recently issued accounting standards and recently adopted provisions of U.S. GAAP.
53
ITEM 3. Quantitative and Qualitative Disclosures About Market Risk
We are exposed to market risks arising from changes in market rates and prices, including movements in foreign currency exchange rates, interest rates and commodity prices. From time to time, we may enter into derivatives or other financial instruments to hedge or mitigate commercial risks. We do not enter into derivative instruments for speculation, investing or trading.
Foreign Exchange Risk
The majority of our net sales, expenses and capital purchases are transacted in U.S. dollars. However, we have exposure with respect to foreign exchange rate fluctuations. Our primary exposure to foreign exchange rates is the Canadian dollar and Mexican peso against the U.S. dollar. Exchange rate gains or losses related to foreign currency transactions are recognized as transaction gains or losses in our income statement as incurred. As of June 30, 2016, the impact to our income from operations of a 10% change (up or down) in exchange rates is estimated to be an increase or decrease of approximately $21 million on an annual basis.
We use derivative instruments such as foreign exchange forward contracts to manage a portion of our exposure to changes in foreign exchange rates. As of June 30, 2016, we had derivative contracts outstanding with a notional value of $29 million maturing at various dates through April 13, 2017.
Interest Rate Risk
We centrally manage our debt portfolio through the use of interest rate swaps and monitor our mix of fixed-rate and variable rate debt. As of June 30, 2016, the carrying value of our fixed-rate debt, excluding capital lease obligations, was $2,789 million, $720 million of which is designated in fair value hedging relationships and exposed to variability in interest rates.
The following table is an estimate of the impact to the fair value hedges that could result from hypothetical interest rate changes during the term of the financial instruments, based on debt levels as of June 30, 2016:
Sensitivity Analysis | ||||
Hypothetical Change in Interest Rates | Annual Impact to Interest Expense | Change in Fair Value (2) | ||
1-percent decrease(1) | $5 million decrease | $57 million increase | ||
1-percent increase | $7 million increase | $51 million decrease | ||
(1) | We pay an average floating rate, which fluctuates periodically, based on LIBOR and a credit spread, as a result of designated fair value hedges on certain debt instruments. See Note 6 of the Notes to our Unaudited Condensed Consolidated Financial Statements for further information. As we would not expect LIBOR to fall below zero, we calculated the hypothetical change in the interest rate to zero. |
(2) The change in fair value would impact the carrying value of our unsecured senior notes with an offset to our derivative instrument positions. See Notes 4 and 7 of the Notes to our Unaudited Condensed Consolidated Financial Statements for quantification of those positions.
Commodity Risks
We are subject to market risks with respect to commodities because our ability to recover increased costs through higher pricing may be limited by the competitive environment in which we operate. Our principal commodities risks relate to our purchases of PET, aluminum, diesel fuel, corn (for high fructose corn syrup), apple juice concentrate, apples, sucrose and natural gas (for use in processing and packaging).
We utilize commodities forward and future contracts and supplier pricing agreements to hedge the risk of adverse movements in commodity prices for limited time periods for certain commodities. The fair market value of these contracts as of June 30, 2016 was a net asset of $1 million.
As of June 30, 2016, the impact of a 10% change (up or down) in market prices for these commodities where the risk of adverse movements has not been hedged is estimated to be an increase or decrease of approximately $3 million to our income from operations for the remainder of 2016.
54
ITEM 4. Controls and Procedures
Based on evaluation of the effectiveness of our disclosure controls and procedures (as defined in Rule 13a-15(e) and 15d-15(e) of the Exchange Act) our management, including our Chief Executive Officer and Chief Financial Officer, has concluded that, as of June 30, 2016, our disclosure controls and procedures are effective to (i) provide reasonable assurance that information required to be disclosed in the Exchange Act filings is recorded, processed, summarized and reported within the time periods specified by the SEC's rules and forms, and (ii) ensure that information required to be disclosed by us in the reports we file or submit under the Exchange Act are accumulated and communicated to our management, including our Chief Executive Officer and Chief Financial Officer, as appropriate to allow timely decisions regarding required disclosure.
No change in our internal control over financial reporting (as defined in Rule 13a-15(f) of the Exchange Act) occurred during the quarter ended June 30, 2016 that materially affected, or is reasonably likely to materially affect, our internal control over financial reporting.
55
PART II – OTHER INFORMATION
ITEM 1. Legal Proceedings
We are occasionally subject to litigation or other legal proceedings relating to our business. See Note 13 of the Notes to our Unaudited Condensed Consolidated Financial Statements for more information related to commitments and contingencies, which is incorporated herein by reference.
ITEM 1A. Risk Factors
There have been no material changes that we are aware of from the risk factors set forth in Part I, Item 1A in our Annual Report.
ITEM 2. Unregistered Sales of Equity Securities and Use of Proceeds
We repurchased approximately 1.4 million shares of our common stock, valued at approximately $124 million, in the second quarter of 2016. Our share repurchase activity, on a monthly basis, for the quarter ended June 30, 2016 was as follows:
(in thousands, except per share data) | Number of Shares Purchased | Average Price Paid per Share | Total Number of Shares Purchased as Part of Publicly Announced Plans or Programs | Maximum Dollar Value of Shares that May Yet be Purchased Under Publicly Announced Plans or Programs (1) | ||||||||||
Period | ||||||||||||||
April 1, 2016 – April 30, 2016 | 1,205 | $ | 89.08 | 1,205 | $ | 1,365,245 | ||||||||
May 1, 2016 – May 31, 2016 | 69 | 92.07 | 69 | 1,358,949 | ||||||||||
June 1, 2016 – June 30, 2016 | 118 | 91.64 | 118 | 1,348,124 | ||||||||||
For the quarter ended June 30, 2016 | 1,392 | 89.44 | 1,392 | |||||||||||
(1) | As previously disclosed, the Board has authorized us to repurchase an aggregate amount of up to $4 billion of our outstanding common stock in prior years and an additional $1 billion in February 2016. This column discloses the dollar value of shares available to be repurchased pursuant to these programs during the indicated time periods. As of June 30, 2016, there was a remaining balance of $1,348 million authorized for repurchase that had not been utilized. |
56
ITEM 6. Exhibits
2.1 | Separation and Distribution Agreement between Cadbury Schweppes plc and Dr Pepper Snapple Group, Inc. and, solely for certain provisions set forth therein, Cadbury plc, dated as of May 1, 2008 (filed as Exhibit 2.1 to the Company's Current Report on Form 8-K (filed on May 5, 2008) and incorporated herein by reference). |
3.1 | Amended and Restated Certificate of Incorporation of Dr Pepper Snapple Group, Inc. (filed as Exhibit 3.1 to the Company's Current Report on Form 8-K (filed on May 12, 2008) and incorporated herein by reference). |
3.2 | Certificate of Amendment to Amended and Restated Certificate of Incorporation of Dr Pepper Snapple Group, Inc. effective as of May 17, 2012 (filed as Exhibit 3.2 to the Company's Quarterly Report on Form 10-Q (filed July 26, 2012) and incorporated herein by reference). |
3.3 | Certificate of Second Amendment to Amended and Restated Certificate of Incorporation of Dr Pepper Snapple Group, Inc. effective as of May 19, 2016 (filed as Exhibit 3.1 to the Company's Current Report on Form 8-K (filed May 20, 2016) and incorporated herein by reference. |
3.4 | Amended and Restated By-Laws of Dr Pepper Snapple Group, Inc. effective as of January 25, 2016 (filed as Exhibit 3.2 to the Company's Current Report on Form 8-K (filed January 25, 2016) and incorporated herein by reference). |
4.1 | Indenture, dated April 30, 2008, between Dr Pepper Snapple Group, Inc. and Wells Fargo Bank, N.A. (filed as Exhibit 4.1 to the Company's Current Report on Form 8-K (filed on May 1, 2008) and incorporated herein by reference). |
4.2 | Form of 6.12% Senior Notes due 2013 (filed as Exhibit 4.2 to the Company's Current Report on Form 8-K (filed on May 1, 2008) and incorporated herein by reference). |
4.3 | Form of 6.82% Senior Notes due 2018 (filed as Exhibit 4.3 to the Company's Current Report on Form 8-K (filed on May 1, 2008) and incorporated herein by reference). |
4.4 | Form of 7.45% Senior Notes due 2038 (filed as Exhibit 4.4 to the Company's Current Report on Form 8-K (filed on May 1, 2008) and incorporated herein by reference). |
4.5 | Registration Rights Agreement, dated April 30, 2008, between Dr Pepper Snapple Group, Inc., J.P. Morgan Securities Inc., Banc of America Securities LLC, Goldman, Sachs & Co., Morgan Stanley & Co. Incorporated, UBS Securities LLC, BNP Paribas Securities Corp., Mitsubishi UFJ Securities International plc, Scotia Capital (USA) Inc., SunTrust Robinson Humphrey, Inc., Wachovia Capital Markets, LLC and TD Securities (USA) LLC (filed as Exhibit 4.5 to the Company's Current Report on Form 8-K (filed on May 1, 2008) and incorporated herein by reference). |
4.6 | Registration Rights Agreement Joinder, dated May 7, 2008, by the subsidiary guarantors named therein (filed as Exhibit 4.2 to the Company's Current Report on Form 8-K (filed on May 12, 2008) and incorporated herein by reference). |
4.7 | Supplemental Indenture, dated May 7, 2008, among Dr Pepper Snapple Group, Inc., the subsidiary guarantors named therein and Wells Fargo Bank, N.A., as trustee (filed as Exhibit 4.1 to the Company's Current Report on Form 8-K (filed on May 12, 2008) and incorporated herein by reference). |
4.8 | Second Supplemental Indenture dated March 17, 2009, to be effective as of December 31, 2008, among Splash Transport, Inc., as a subsidiary guarantor, Dr Pepper Snapple Group, Inc., and Wells Fargo Bank, N.A., as trustee (filed as Exhibit 4.8 to the Company's Annual Report on Form 10-K (filed on March 26, 2009) and incorporated herein by reference). |
4.9 | Third Supplemental Indenture, dated October 19, 2009, among 234DP Aviation, LLC, as a subsidiary guarantor; Dr Pepper Snapple Group, Inc., and Wells Fargo Bank, N.A., as trustee (filed as Exhibit 4.9 to the Company's Quarterly Report on Form 10-Q (filed November 5, 2009) and incorporated herein by reference). |
4.10 | Indenture, dated as of December 15, 2009, between Dr Pepper Snapple Group, Inc. and Wells Fargo Bank, N.A., as trustee (filed as Exhibit 4.1 to the Company's Current Report on Form 8-K (filed on December 23, 2009) and incorporated herein by reference). |
4.11 | Second Supplemental Indenture, dated as of January 11, 2011, among Dr Pepper Snapple Group, Inc., the guarantors party thereto and Wells Fargo Bank, N.A., as trustee (filed as Exhibit 4.1 to the Company's Current Report on Form 8-K (filed on January 11, 2011) and incorporated herein by reference). |
4.12 | 2.90% Senior Note due 2016 (in global form), dated January 11, 2011, in the principal amount of $500 million (filed as Exhibit 4.2 to the Company's Current Report on Form 8-K (filed on January 11, 2011) and incorporated herein by reference). |
4.13 | Third Supplemental Indenture, dated as of November 15, 2011, among Dr Pepper Snapple Group, Inc., the guarantors party thereto and Wells Fargo Bank, N.A., as trustee (filed as Exhibit 4.1 to the Company's Current Report on Form 8-K (filed on November 15, 2011) and incorporated herein by reference). |
4.14 | 2.60% Senior Note due 2019 (in global form), dated November 15, 2011, in the principal amount of $250 million (filed as Exhibit 4.2 to the Company's Current Report on Form 8-K (filed on November 15, 2011) and incorporated herein by reference). |
4.15 | 3.20% Senior Note due 2021 (in global form), dated November 15, 2011, in the principal amount of $250 million (filed as Exhibit 4.3 to the Company's Current Report on Form 8-K (filed on November 15, 2011) and incorporated herein by reference). |
57
4.16 | Fourth Supplemental Indenture, dated as of November 20, 2012, among Dr Pepper Snapple Group, Inc., the guarantors party thereto and Wells Fargo Bank, N.A., as trustee (filed as Exhibit 4.1 to the Company's Current Report on Form 8-K (filed on November 20, 2012) and incorporated herein by reference). |
4.17 | 2.00% Senior Note due 2020 (in global form), dated November 20, 2012, in the principal amount of $250 million (filed as Exhibit 4.2 to the Company's Current Report on Form 8-K (filed on November 20, 2012) and incorporated herein by reference). |
4.18 | 2.70% Senior Note due 2022 (in global form), dated November 20, 2012, in the principal amount of $250 million (filed as Exhibit 4.3 to the Company's Current Report on Form 8-K (filed on November 20, 2012) and incorporated herein by reference). |
4.19 | Fifth Supplemental Indenture, dated as of November 9, 2015, among Dr Pepper Snapple Group, Inc., the guarantors party thereto and Wells Fargo Bank, N.A., as trustee (filed as Exhibit 4.1 to the Company's Current Report on Form 8-K (filed on November 10, 2015) and incorporated herein by reference). |
4.20 | 3.40% Senior Note due 2025 (in global form), dated November 9, 2015, in the principal amount of $500,000,000 (filed as Exhibit 4.2 to the Company's Current Report on Form 8-K (filed on November 10, 2015) and incorporated herein by reference). |
4.21 | 4.50% Senior Note due 2045 (in global form), dated November 9, 2015, in the principal amount of $250,000,000 (filed as Exhibit 4.3 to the Company's Current Report on Form 8-K (filed on November 10, 2015) and incorporated herein by reference). |
12.1* | Computation of Ratio of Earnings to Fixed Charges. |
31.1* | Certification of Chief Executive Officer of Dr Pepper Snapple Group, Inc. pursuant to Rule 13a-14(a) or 15d-14(a) promulgated under the Exchange Act. |
31.2* | Certification of Chief Financial Officer of Dr Pepper Snapple Group, Inc. pursuant to Rule 13a-14(a) or 15d-14(a) promulgated under the Exchange Act. |
32.1** | Certification of Chief Executive Officer of Dr Pepper Snapple Group, Inc. pursuant to Rule 13a-14(b) or 15d-14(b) promulgated under the Exchange Act, and Section 1350 of Chapter 63 of Title 18 of the United States Code. |
32.2** | Certification of Chief Financial Officer of Dr Pepper Snapple Group, Inc. pursuant to Rule 13a-14(b) or 15d-14(b) promulgated under the Exchange Act, and Section 1350 of Chapter 63 of Title 18 of the United States Code. |
101* | The following financial information from Dr Pepper Snapple Group, Inc.'s Quarterly Report on Form 10-Q for the quarter ended June 30, 2016, formatted in XBRL (eXtensible Business Reporting Language): (i) Condensed Consolidated Statements of Income for the three and six months ended June 30, 2016 and 2015, (ii) Condensed Consolidated Statements of Comprehensive Income for the three and six months ended June 30, 2016 and 2015, (iii) Condensed Consolidated Balance Sheets as of June 30, 2016 and December 31, 2015, (iv) Condensed Consolidated Statements of Cash Flows for the six months ended June 30, 2016 and 2015, (v) Condensed Consolidated Statement of Changes in Stockholders' Equity for the six months ended June 30, 2016, and (vi) the Notes to Condensed Consolidated Financial Statements. |
* Filed herewith.
** Furnished herewith.
58
SIGNATURES
Pursuant to the requirements of Section 12 of the Securities Exchange Act of 1934, the registrant has duly caused this report to be signed on its behalf by the undersigned thereunto duly authorized.
Dr Pepper Snapple Group, Inc. | ||||
By: | /s/ Martin M. Ellen | |||
Name: | Martin M. Ellen | |||
Title: | Executive Vice President and Chief Financial | |||
Officer of Dr Pepper Snapple Group, Inc. | ||||
Date: July 27, 2016 | ||||
59