Attached files
| file | filename |
|---|---|
| EX-99.2 - EXHIBIT 99.2 - IDEX CORP /DE/ | iex-20160719xex992.htm |
| 8-K - 8-K - IDEX CORP /DE/ | iex-20160719x8k.htm |

IDEX Proprietary & Confidential
Second Quarter Earnings
July 19, 2016

IDEX Proprietary & Confidential
Brand names shown in this presentation are registered trademarks of IDEX Corporation and/or its subsidiaries
• IDEX’s Outlook
• Q2 2016 Financial Performance
• Q2 2016 Segment Performance
• Fluid & Metering
• Health & Science
• Fire & Safety / Diversified Products
• 2016 Guidance Detail
• Q&A
1
AGENDA

IDEX Proprietary & Confidential
Brand names shown in this presentation are registered trademarks of IDEX Corporation and/or its subsidiaries
• Dial toll–free: 877.660.6853
• International: 201.612.7415
• Conference ID: #13620006
• Log on to: www.idexcorp.com
2
Replay Information

IDEX Proprietary & Confidential
Brand names shown in this presentation are registered trademarks of IDEX Corporation and/or its subsidiaries
Cautionary Statement Under the Private Securities Litigation Reform Act; Non-GAAP Measures
This presentation and discussion will include forward-looking statements within the meaning of the Private Securities
Litigation Reform Act of 1995, as amended. These statements may relate to, among other things, capital expenditures,
acquisitions, cost reductions, cash flow, revenues, earnings, market conditions, global economies and operating
improvements, and are indicated by words or phrases such as “anticipate,” “estimate,” “plans,” “expects,” “projects,”
“forecasts,” “should,” “could,” “will,” “management believes,” “the company believes,” “the company intends,” and
similar words or phrases. These statements are subject to inherent uncertainties and risks that could cause actual
results to differ materially from those anticipated at the date of this news release. The risks and uncertainties include,
but are not limited to, the following: economic and political consequences resulting from terrorist attacks and wars;
levels of industrial activity and economic conditions in the U.S. and other countries around the world; pricing pressures
and other competitive factors, and levels of capital spending in certain industries – all of which could have a material
impact on order rates and IDEX’s results, particularly in light of the low levels of order backlogs it typically maintains;
its ability to make acquisitions and to integrate and operate acquired businesses on a profitable basis; the relationship
of the U.S. dollar to other currencies and its impact on pricing and cost competitiveness; political and economic
conditions in foreign countries in which the company operates; interest rates; capacity utilization and the effect this has
on costs; labor markets; market conditions and material costs; and developments with respect to contingencies, such
as litigation and environmental matters. Additional factors that could cause actual results to differ materially from those
reflected in the forward-looking statements include, but are not limited to, the risks discussed in the “Risk Factors”
section included in the company’s most recent annual report on Form 10-K filed with the SEC and the other risks
discussed in the company’s filings with the SEC. The forward-looking statements included in this presentation and
discussion are only made as of today’s date, and management undertakes no obligation to publicly update them to
reflect subsequent events or circumstances, except as may be required by law. Investors are cautioned not to rely
unduly on forward-looking statements when evaluating the information in this presentation and discussion.
This presentation contains non-GAAP financial information. Reconciliations of non-GAAP measures are included either
in this presentation or our earnings release for the three-month period ending June 30, 2016, which is available on our
website.
3

IDEX Proprietary & Confidential
Brand names shown in this presentation are registered trademarks of IDEX Corporation and/or its subsidiaries
$0
$50
$100
Q2
$86 $80
2015 2016
16.0%
18.0%
20.0%
22.0%
Q2
21.3% 20.6%
2015 2016
$0.00
$0.50
$1.00
Q2
$0.89
$0.99
2015 2016
$0
$200
$400
$600
Q2
$515 $550
2015 2016
4
IDEX Q2 Financial Performance
Sales EPS
Operating Margin Free Cash Flow
70 bps decrease
11% increase
7% decrease
EPS increased 11 percent with Free Cash Flow over 106 percent of net income
($M, excl. EPS)
Organic: 1% decrease

IDEX Proprietary & Confidential
Brand names shown in this presentation are registered trademarks of IDEX Corporation and/or its subsidiaries
5
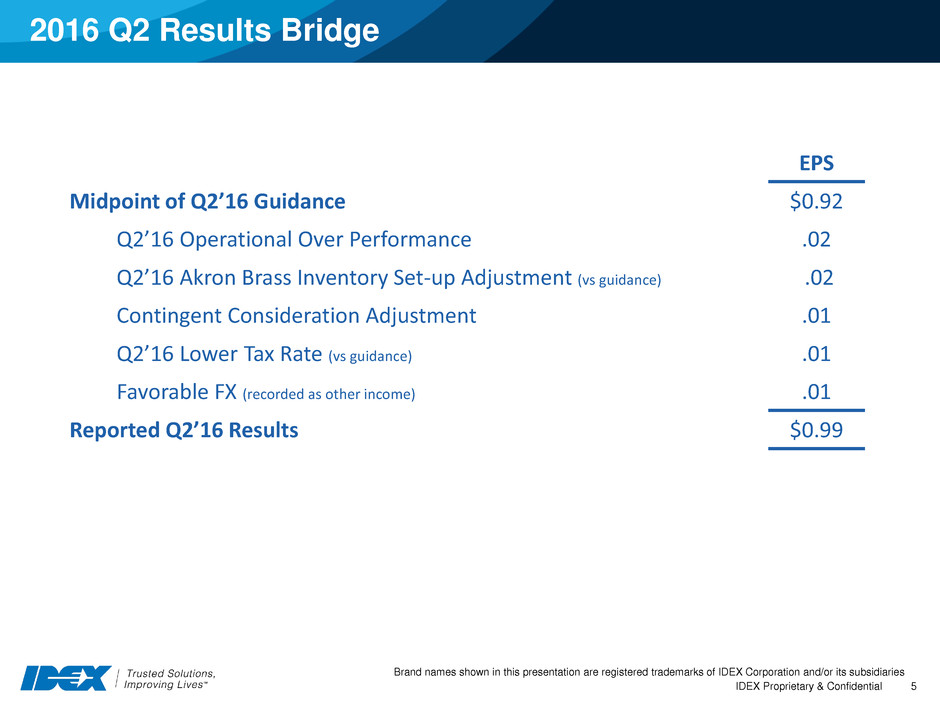
2016 Q2 Results Bridge
EPS
Midpoint of Q2’16 Guidance $0.92
Q2’16 Operational Over Performance .02
Q2’16 Akron Brass Inventory Set-up Adjustment (vs guidance) .02
Contingent Consideration Adjustment .01
Q2’16 Lower Tax Rate (vs guidance) .01
Favorable FX (recorded as other income) .01
Reported Q2’16 Results $0.99

IDEX Proprietary & Confidential
Brand names shown in this presentation are registered trademarks of IDEX Corporation and/or its subsidiaries
6
Fluid & Metering
Orders Sales
Q2 Sales Mix: Organic 1%
Acquisition 2%
Fx 0%
Reported Sales 3%
Q2 Summary:
FMT organic sales increased for first time since Q1 2015
Water market remains strong in North America
North American industrial distribution market showing signs of stabilization
Energy projects that had been delayed for several quarters shipped in Q2
Operating Margin
Organic sales up 1%
$0
$100
$200
$300
Q2
$219 $220
2015 2016
20.0%
22.0%
24.0%
26.0%
Q2
24.1% 24.3%
2015 2016
$0
$100
$200
$300
Q2
$215 $222
2015 2016
Organic: 20 bps increase Organic: 1% decrease Organic: 1% increase
($M)

IDEX Proprietary & Confidential
Brand names shown in this presentation are registered trademarks of IDEX Corporation and/or its subsidiaries
7
Health & Science
Orders Sales Operating Margin
Q2 Sales Mix: Organic -2%
Acquisition/Divestiture 2%
Fx -1%
Reported Sales
-1%
Q2 Summary:
Scientific Fluidics end markets continue to over deliver with positive
outlook for remainder of year
Strong pharma market in Asia continues to drive the MPT platform
Industrial exposed business continues to be soft resulting in the decline in
organic sales
Sealing platform benefitting from strength in semiconductor market
Life Science and semiconductor markets remain strong
$0
$50
$100
$150
$200
Q2
$180 $182
2015 2016
$0
$50
$100
$150
$200
Q2
$188 $187
2015 2016
19.0%
20.0%
21.0%
22.0%
23.0%
Q2
22.3% 22.0%
2015 2016
Organic: Flat Organic: 2% decrease 30 bps decrease
($M)

IDEX Proprietary & Confidential
Brand names shown in this presentation are registered trademarks of IDEX Corporation and/or its subsidiaries
8
Fire & Safety / Diversified
Orders Sales Operating Margin
Q2 Summary:
Excluding the Akron Brass fair value inventory step-up charge of $3.6 million,
operating margin for the segment would have been 26.6%
Integration of Akron Brass and AWG progressing as planned
Dispensing core markets in North America, Asia and Europe remain solid,
with profitability improvements driven by increased X-Smart sales
Rescue continues to see project delays in Asian markets
AWG acquired on July 1st
Q2 Sales Mix: Organic -1%
Acquisition 28%
Fx 0%
Reported Sales 27%
$0
$50
$100
$150
Q2
$106
$127
2015 2016
Organic: 9% decrease
$0
$50
$100
$150
Q2
$112
$142
2015 2016
15.0%
20.0%
25.0%
30.0%
Q2
28.1%
24.1%
2015 2016
Organic: 1% decrease 400 bps decrease
($M)

IDEX Proprietary & Confidential
Brand names shown in this presentation are registered trademarks of IDEX Corporation and/or its subsidiaries
Q3 2016
– EPS estimate range: $0.90 – $0.92
– Organic revenue growth: Flat
– Operating margin: ~ 20.5%
– Tax rate: ~ 27%
– Fx impact: ~1.0% topline headwind, based on June 30, 2016 Fx rates
FY 2016
– EPS estimate range: $3.70 – $3.75
– Organic revenue growth: Flat
– Operating margin: 20.5% – 21.0%
– Fx impact: ~1.0% topline headwind, based on June 30, 2016 Fx rates
– Other modeling items
• Tax rate: ~ 27%
• Cap Ex: ~ $45M
• Free Cash Flow will be ~120% of net income
• Continued share repurchases: ~ net 1% reduction
• EPS estimate excludes all future acquisitions and associated costs
9
Outlook: 2016 Guidance Summary
