Attached files
| file | filename |
|---|---|
| EX-99.1 - EXHIBIT 99.1 - Ameris Bancorp | v444731_ex99-1.htm |
| 8-K - FORM 8-K - Ameris Bancorp | v444731_8k.htm |
Exhibit 99.2
Ameris Bancorp 2 nd Quarter 2016 Earnings Presentation Edwin W. Hortman, Jr. – President & CEO Dennis J. Zember, Jr. – COO & CFO

This presentation contains certain performance measures determined by methods other than in accordance with accounting principles generally accepted in the United States of America (“GAAP”) . Management of Ameris Bancorp (the “Company”) uses these non - GAAP measures in its analysis of the Company’s performance . These measures are useful when evaluating the underlying performance and efficiency of the Company’s operations and balance sheet . The Company’s management believes that these non - GAAP measures provide a greater understanding of ongoing operations, enhance comparability of results with prior periods and demonstrate the effects of significant gains and charges in the current period . The Company’s management believes that investors may use these non - GAAP financial measures to evaluate the Company’s financial performance without the impact of unusual items that may obscure trends in the Company’s underlying performance . These disclosures should not be viewed as a substitute for financial measures determined in accordance with GAAP, nor are they necessarily comparable to non - GAAP performance measures that may be presented by other companies . Tangible common equity and Tier 1 capital ratios are non - GAAP measures . The Company calculates the Tier 1 capital ratio using current call report instructions . The Company’s management uses these measures to assess the quality of capital and believes that investors may find them useful in their evaluation of the Company . These capital measures may, or may not be necessarily comparable to similar capital measures that may be presented by other companies . This presentation may contain statements that constitute “forward - looking statements” within the meaning of Section 27 A of the Securities Act of 1933 , as amended, and Section 21 E of the Securities Exchange Act of 1934 , as amended . The words “believe”, “estimate”, “expect”, “intend”, “anticipate” and similar expressions and variations thereof identify certain of such forward - looking statements, which speak only as of the dates which they were made . The Company undertakes no obligation to publicly update or revise any forward - looking statements, whether as a result of new information, future events or otherwise . Readers are cautioned that any such forward - looking statements are not guarantees of future performance and involve risks and uncertainties and that actual results may differ materially from those indicated in the forward - looking statements as a result of various factors . Readers are cautioned not to place undue reliance on these forward - looking statements and are referred to the Company’s periodic filings with the Securities and Exchange Commission for a summary of certain factors that may impact the Company’s results of operations and financial condition . Cautionary Statements
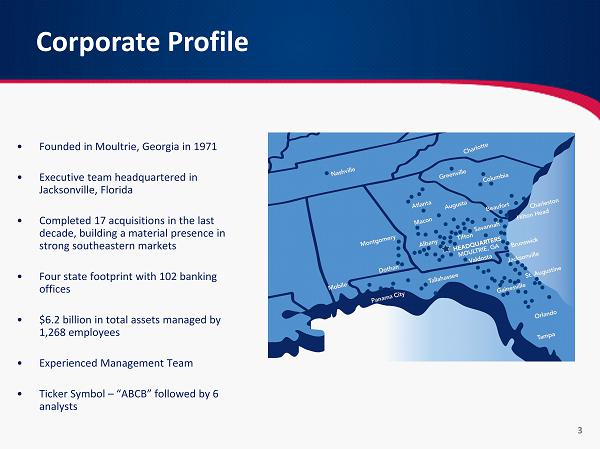
Corporate Profile • Founded in Moultrie, Georgia in 1971 • Executive team headquartered in Jacksonville, Florida • Completed 17 acquisitions in the last decade, building a material presence in strong southeastern markets • Four state footprint with 102 banking offices • $6.2 billion in total assets managed by 1,268 employees • Experienced Management Team • Ticker Symbol – “ABCB” followed by 6 analysts 3
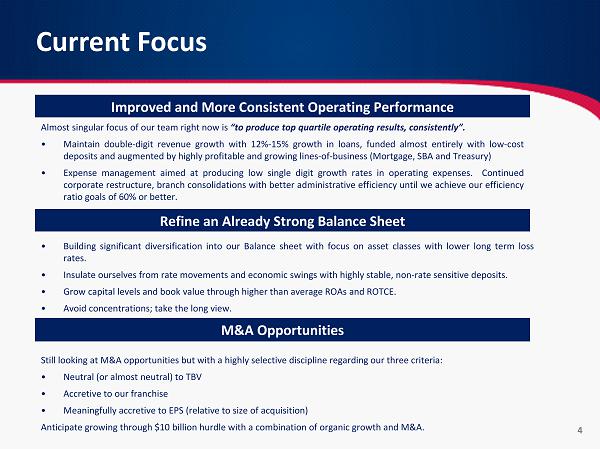
Almost singular focus of our team right now is “to produce top quartile operating results, consistently” . • Maintain double - digit revenue growth with 12 % - 15 % growth in loans, funded almost entirely with low - cost deposits and augmented by highly profitable and growing lines - of - business (Mortgage, SBA and Treasury) • Expense management aimed at producing low single digit growth rates in operating expenses . Continued corporate restructure, branch consolidations with better administrative efficiency until we achieve our efficiency ratio goals of 60 % or better . Current Focus Improved and More Consistent Operating Performance M&A Opportunities Still looking at M&A opportunities but with a highly selective discipline regarding our three criteria : • Neutral (or almost neutral) to TBV • Accretive to our franchise • Meaningfully accretive to EPS (relative to size of acquisition) Anticipate growing through $ 10 billion hurdle with a combination of organic growth and M&A . Refine an Already Strong Balance Sheet • Building significant diversification into our Balance sheet with focus on asset classes with lower long term loss rates . • Insulate ourselves from rate movements and economic swings with highly stable, non - rate sensitive deposits . • Grow capital levels and book value through higher than average ROAs and ROTCE . • Avoid concentrations ; take the long view . 4
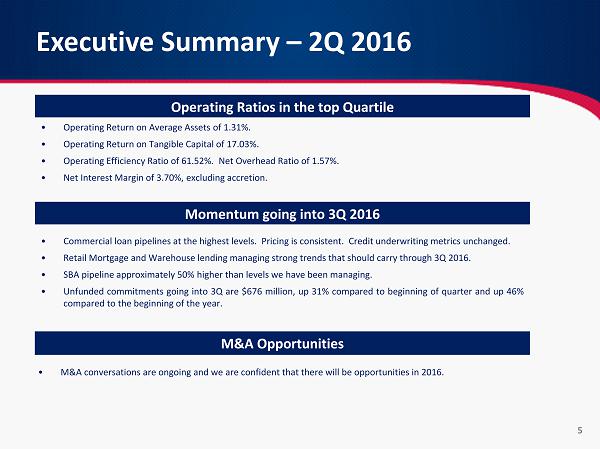
• Operating Return on Average Assets of 1 . 31 % . • Operating Return on Tangible Capital of 17 . 03 % . • Operating Efficiency Ratio of 61 . 52 % . Net Overhead Ratio of 1 . 57 % . • Net Interest Margin of 3 . 70 % , excluding accretion . Executive Summary – 2Q 2016 Operating Ratios in the top Quartile M&A Opportunities • M&A conversations are ongoing and we are confident that there will be opportunities in 2016 . Momentum going into 3Q 2016 • Commercial loan pipelines at the highest levels . Pricing is consistent . Credit underwriting metrics unchanged . • Retail Mortgage and Warehouse lending managing strong trends that should carry through 3 Q 2016 . • SBA pipeline approximately 50 % higher than levels we have been managing . • Unfunded commitments going into 3 Q are $ 676 million, up 31 % compared to beginning of quarter and up 46 % compared to the beginning of the year . 5
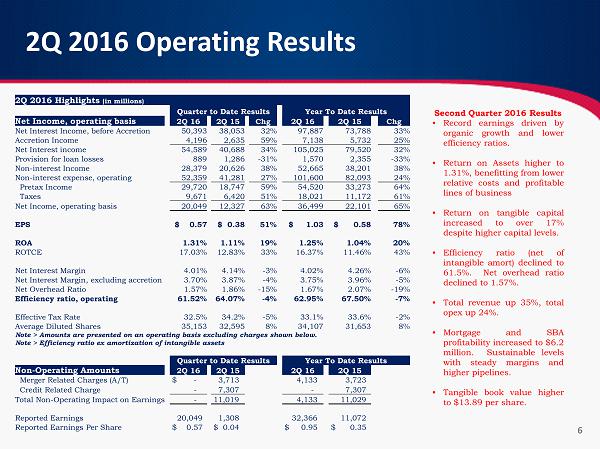
2Q 2016 Operating Results Second Quarter 2016 Results • Record earnings driven by organic growth and lower efficiency ratios . • Return on Assets higher to 1 . 31 % , benefitting from lower relative costs and profitable lines of business • Return on tangible capital increased to over 17 % despite higher capital levels . • Efficiency ratio (net of intangible amort ) declined to 61 . 5 % . Net overhead ratio declined to 1 . 57 % . • Total revenue up 35 % , total opex up 24 % . • Mortgage and SBA profitability increased to $ 6 . 2 million . Sustainable levels with steady margins and higher pipelines . • Tangible book value higher to $ 13 . 89 per share . 6 2Q 2016 Highlights (in millions) Quarter to Date Results Year To Date Results Net Income, operating basis 2Q 16 2Q 15 Chg 2Q 16 2Q 15 Chg Net Interest Income, before Accretion 50,393 38,053 32% 97,887 73,788 33% Accretion Income 4,196 2,635 59% 7,138 5,732 25% Net Interest income 54,589 40,688 34% 105,025 79,520 32% Provision for loan losses 889 1,286 - 31% 1,570 2,355 - 33% Non - interest Income 28,379 20,626 38% 52,665 38,201 38% Non - interest expense, operating 52,359 41,281 27% 101,600 82,093 24% Pretax Income 29,720 18,747 59% 54,520 33,273 64% Taxes 9,671 6,420 51% 18,021 11,172 61% Net Income, operating basis 20,049 12,327 63% 36,499 22,101 65% EPS $ 0.57 $ 0.38 51% $ 1.03 $ 0.58 78% ROA 1.31% 1.11% 19% 1.25% 1.04% 20% ROTCE 17.03% 12.83% 33% 16.37% 11.46% 43% Net Interest Margin 4.01% 4.14% - 3% 4.02% 4.26% - 6% Net Interest Margin , excluding accretion 3.70% 3.87% - 4% 3.75% 3.96% - 5% Net Overhead Ratio 1.57% 1.86% - 15% 1.67% 2.07% - 19% Efficiency ratio, operating 61.52% 64.07% - 4% 62.95% 67.50% - 7% Effective Tax Rate 32.5% 34.2% - 5% 33.1% 33.6% - 2% Average Diluted Shares 35,153 32,595 8% 34,107 31,653 8% Note > Amounts are presented on an operating basis excluding charges shown below. Note > Efficiency ratio ex amortization of intangible assets Quarter to Date Results Year To Date Results Non - Operating Amounts 2Q 16 2Q 15 2Q 16 2Q 15 Merger Related Charges (A/T) $ - 3,713 4,133 3,723 Credit Related Charge - 7,307 - 7,307 Total Non - Operating Impact on Earnings - 11,019 4,133 11,029 Reported Earnings 20,049 1,308 32,366 11,072 Reported Earnings Per Share $ 0.57 $ 0.04 $ 0.95 $ 0.35
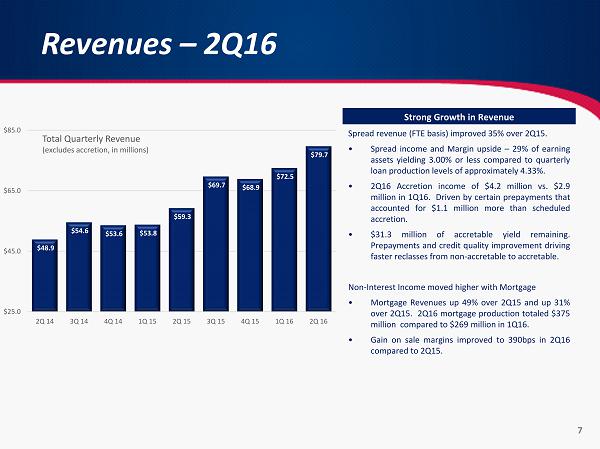
Revenues – 2Q16 Spread revenue (FTE basis) improved 35 % over 2 Q 15 . • Spread income and Margin upside – 29 % of earning assets yielding 3 . 00 % or less compared to quarterly loan production levels of approximately 4 . 33 % . • 2 Q 16 Accretion income of $ 4 . 2 million vs . $ 2 . 9 million in 1 Q 16 . Driven by certain prepayments that accounted for $ 1 . 1 million more than scheduled accretion . • $ 31 . 3 million of accretable yield remaining . Prepayments and credit quality improvement driving faster reclasses from non - accretable to accretable . Non - Interest Income moved higher with Mortgage • Mortgage Revenues up 49 % over 2 Q 15 and up 31 % over 2 Q 15 . 2 Q 16 mortgage production totaled $ 375 million compared to $ 269 million in 1 Q 16 . • Gain on sale margins improved to 390 bps in 2 Q 16 compared to 2 Q 15 . Strong Growth in Revenue 7 $48.9 $54.6 $53.6 $53.8 $59.3 $69.7 $68.9 $72.5 $79.7 $25.0 $45.0 $65.0 $85.0 2Q 14 3Q 14 4Q 14 1Q 15 2Q 15 3Q 15 4Q 15 1Q 16 2Q 16 Total Quarterly Revenue (excludes accretion, in millions)

Non - Interest Income – 2 Q16 • Deposit charges up 46 % in 2 Q 16 vs . 2 Q 15 . Results from 3 acquisitions as well as internal strategies and growth . • Mortgage revenue up 45 % , mortgage net income up 83 % over 2 Q 15 . Additional mortgage bankers recruited in 4 Q at expected production levels . • Mortgage profitability margins much higher than industry average . Focused on relationships with builders, brokers and R/E agents . • SBA revenues up flat against 1 Q 16 but pipeline grew considerably . Mortgage/SBA Net Income (millions) • Net income from non - interest income LOBs up 55 % over the same quarter in 2015 • BUT … contribution to total consolidated earnings steady at around 30 % . 8 $20.6 $25.9 $37.8 $46.5 $62.8 $85.6 $105.3 $0.0 $20.0 $40.0 $60.0 $80.0 $100.0 $120.0 2010 2011 2012 2013 2014 2015 2016 Annlzd Non - Interest Income (in millions) $2.3 $2.7 $2.3 $3.0 $4.0 $4.7 $3.5 $4.5 $6.2 $1.00 $3.00 $5.00 $7.00 2Q14 3Q14 4Q14 1Q15 2Q15 3Q15 4Q15 1Q16 2Q16
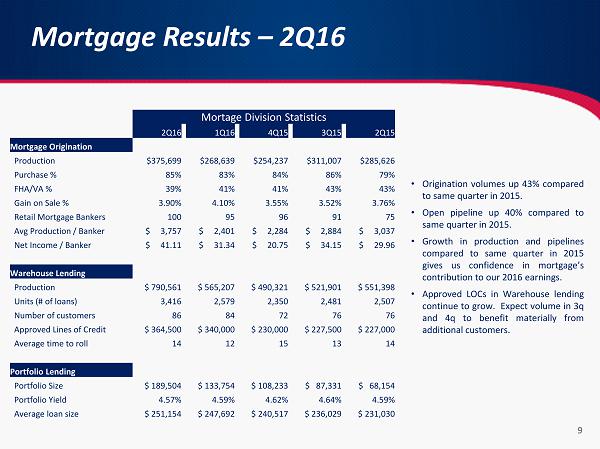
Mortgage Results – 2Q16 • Origination volumes up 43 % compared to same quarter in 2015 . • Open pipeline up 40 % compared to same quarter in 2015 . • Growth in production and pipelines compared to same quarter in 2015 gives us confidence in mortgage’s contribution to our 2016 earnings . • Approved LOCs in Warehouse lending continue to grow . Expect volume in 3 q and 4 q to benefit materially from additional customers . 9 Mortage Division Statistics 2Q16 1Q16 4Q15 3Q15 2Q15 Mortgage Origination Production $375,699 $268,639 $254,237 $311,007 $285,626 Purchase % 85% 83% 84% 86% 79% FHA/VA % 39% 41% 41% 43% 43% Gain on Sale % 3.90% 4.10% 3.55% 3.52% 3.76% Retail Mortgage Bankers 100 95 96 91 75 Avg Production / Banker $ 3,757 $ 2,401 $ 2,284 $ 2,884 $ 3,037 Net Income / Banker $ 41.11 $ 31.34 $ 20.75 $ 34.15 $ 29.96 Warehouse Lending Production $ 790,561 $ 565,207 $ 490,321 $ 521,901 $ 551,398 Units (# of loans) 3,416 2,579 2,350 2,481 2,507 Number of customers 86 84 72 76 76 Approved Lines of Credit $ 364,500 $ 340,000 $ 230,000 $ 227,500 $ 227,000 Average time to roll 14 12 15 13 14 Portfolio Lending Portfolio Size $ 189,504 $ 133,754 $ 108,233 $ 87,331 $ 68,154 Portfolio Yield 4.57% 4.59% 4.62% 4.64% 4.59% Average loan size $ 251,154 $ 247,692 $ 240,517 $ 236,029 $ 231,030
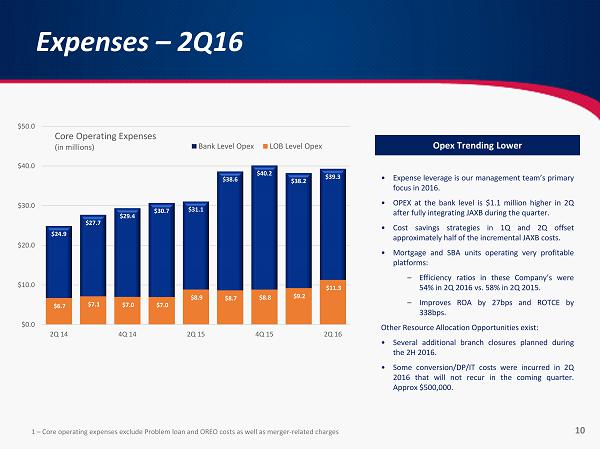
Expenses – 2Q16 • Expense leverage is our management team’s primary focus in 2016 . • OPEX at the bank level is $ 1 . 1 million higher in 2 Q after fully integrating JAXB during the quarter . • Cost savings strategies in 1 Q and 2 Q offset approximately half of the incremental JAXB costs . • Mortgage and SBA units operating very profitable platforms : – Efficiency ratios in these Company’s were 54 % in 2 Q 2016 vs . 58 % in 2 Q 2015 . – Improves ROA by 27 bps and ROTCE by 338 bps . Other Resource Allocation Opportunities exist : • Several additional branch closures planned during the 2 H 2016 . • Some conversion/DP/IT costs were incurred in 2 Q 2016 that will not recur in the coming quarter . Approx $ 500 , 000 . 1 – Core operating expenses exclude Problem loan and OREO costs as well as merger - related charges Opex Trending Lower 10 $24.9 $27.7 $29.4 $30.7 $31.1 $38.6 $40.2 $38.2 $39.3 $6.7 $7.1 $7.0 $7.0 $8.9 $8.7 $8.8 $9.2 $11.3 $0.0 $10.0 $20.0 $30.0 $40.0 $50.0 2Q 14 4Q 14 2Q 15 4Q 15 2Q 16 Core Operating Expenses (in millions) Bank Level Opex LOB Level Opex
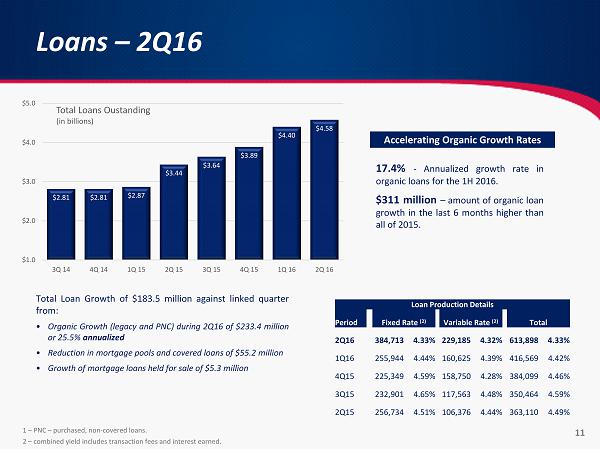
Loans – 2Q16 Total Loan Growth of $ 183 . 5 million against linked quarter from : • Organic Growth (legacy and PNC) during 2 Q 16 of $ 233 . 4 million or 25 . 5 % annualized • Reduction in mortgage pools and covered loans of $ 55 . 2 million • Growth of mortgage loans held for sale of $ 5 . 3 million 1 – PNC – purchased, non - covered loans. 2 – combined yield includes transaction fees and interest earned. 17 . 4 % - Annualized growth rate in organic loans for the 1 H 2016 . $ 311 million – amount of organic loan growth in the last 6 months higher than all of 2015 . 11 $2.81 $2.81 $2.87 $3.44 $3.64 $3.89 $4.40 $4.58 $1.0 $2.0 $3.0 $4.0 $5.0 3Q 14 4Q 14 1Q 15 2Q 15 3Q 15 4Q 15 1Q 16 2Q 16 Total Loans Oustanding (in billions) Loan Production Details Period Fixed Rate (2) Variable Rate (2) Total 2Q16 384,713 4.33% 229,185 4.32% 613,898 4.33% 1Q16 255,944 4.44% 160,625 4.39% 416,569 4.42% 4Q15 225,349 4.59% 158,750 4.28% 384,099 4.46% 3Q15 232,901 4.65% 117,563 4.48% 350,464 4.59% 2Q15 256,734 4.51% 106,376 4.44% 363,110 4.49% Accelerating Organic Growth Rates

Diversified Loan Portfolio Lower levels of CRE to total Loans 2 Q 2016 Loan Portfolio • Significantly better diversification with larger investments in Mortgage and Municipal credits. Only 18% of CRE is A&D oriented. • CRE assets concentrated in Atlanta, Jacksonville, Columbia, Savannah and Charleston. Construction assets are in high growth markets with large builders. • 62% of Mortgage assets are with secondary type assets (65%) with full doc underwriting. Approx 50% of the assets are highly - marketable ARMs. • Approval authority rests with 5 regional credit officers. Credit admin team includes 22 portfolio managers, as well as credit support teams specifically for construction, CRE, and municipal assets. 12 2 Q 2016 Commercial Real Estate Portfolio • Only 7.7% of total loans are in Construction or A&D. • Construction portfolio is split 45% residential and 55% commercial. Average commercial construction commitment is $973,600. • Average CRE loan is $379,600 • 61.2% of our CRE portfolio is in Atlanta, Charleston, Jacksonville, Savannah or Columbia. • CRE and C&D concentrations are only 206% and 58%, respectively. Comm'l Real Estate , 42.2% Mortgage , 35.4% Municipal & Ag , 11.6% Loss Share , 3.5% Other , 7.3% Owner Occupied , 36% Investor , 40% Construction , 11% Acquisition & Development , 7% Multi - Family , 6%
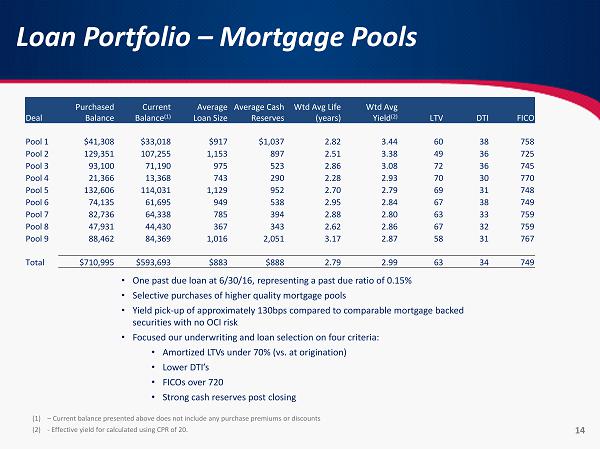
Loan Portfolio – Mortgage Pools • One past due loan at 6/30/16, representing a past due ratio of 0.15% • Selective purchases of higher quality mortgage pools • Yield pick - up of approximately 130bps compared to comparable mortgage backed securities with no OCI risk • Focused our underwriting and loan selection on four criteria: • Amortized LTVs under 70% (vs. at origination) • Lower DTI’s • FICOs over 720 • Strong cash reserves post closing (1) – Current balance presented above does not include any purchase premiums or discounts (2) - Effective yield for calculated using CPR of 20. 14 Deal Purchased Balance Current Balance (1) Average Loan Size Average Cash Reserves Wtd Avg Life (years) Wtd Avg Yield (2) LTV DTI FICO Pool 1 $41,308 $33,018 $917 $1,037 2.82 3.44 60 38 758 Pool 2 129,351 107,255 1,153 897 2.51 3.38 49 36 725 Pool 3 93,100 71,190 975 523 2.86 3.08 72 36 745 Pool 4 21,366 13,368 743 290 2.28 2.93 70 30 770 Pool 5 132,606 114,031 1,129 952 2.70 2.79 69 31 748 Pool 6 74,135 61,695 949 538 2.95 2.84 67 38 749 Pool 7 82,736 64,338 785 394 2.88 2.80 63 33 759 Pool 8 47,931 44,430 367 343 2.62 2.86 67 32 759 Pool 9 88,462 84,369 1,016 2,051 3.17 2.87 58 31 767 Total $710,995 $593,693 $883 $888 2.79 2.99 63 34 749
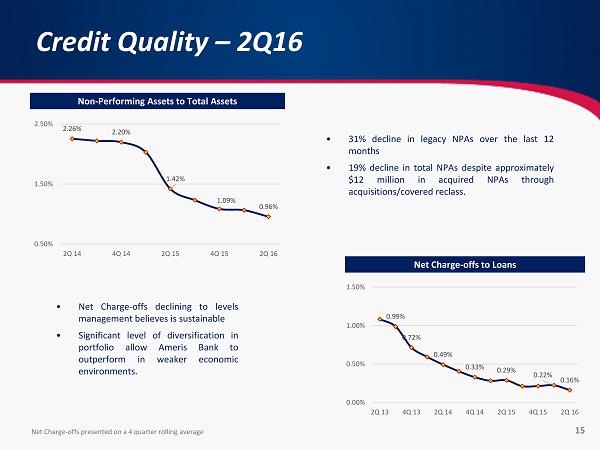
Credit Quality – 2Q16 • 31 % decline in legacy NPAs over the last 12 months • 19 % decline in total NPAs despite approximately $ 12 million in acquired NPAs through acquisitions/covered reclass . Net Charge - offs presented on a 4 quarter rolling average Non - Performing Assets to Total Assets Net Charge - offs to Loans • Net Charge - offs declining to levels management believes is sustainable • Significant level of diversification in portfolio allow Ameris Bank to outperform in weaker economic environments . 15 2.26% 2.20% 1.42% 1.09% 0.96% 0.50% 1.50% 2.50% 2Q 14 4Q 14 2Q 15 4Q 15 2Q 16 0.99% 0.72% 0.49% 0.33% 0.29% 0.22% 0.16% 0.00% 0.50% 1.00% 1.50% 2Q 13 4Q 13 2Q 14 4Q 14 2Q 15 4Q 15 2Q 16
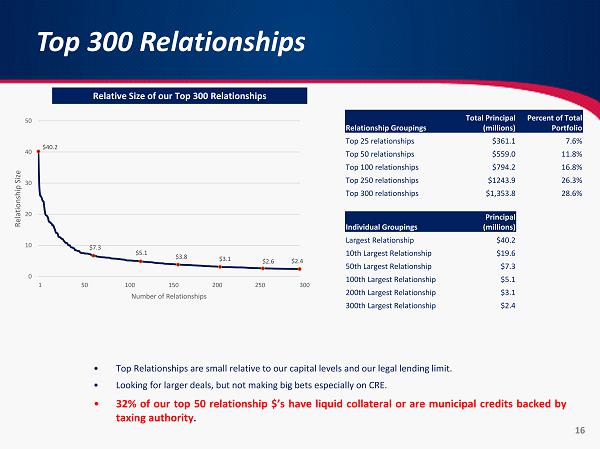
Top 300 Relationships Relative Size of our Top 300 Relationships • Top Relationships are small relative to our capital levels and our legal lending limit . • Looking for larger deals, but not making big bets especially on CRE . • 32 % of our top 50 relationship $ ’s have liquid collateral or are municipal credits backed by taxing authority . Relationship Groupings Total Principal (millions ) Percent of Total Portfolio Top 25 relationships $361.1 7.6% Top 50 relationships $559.0 11.8% Top 100 relationships $794.2 16.8% Top 250 relationships $1243.9 26.3% Top 300 relationships $ 1,353.8 28.6% Individual Groupings Principal (millions) Largest Relationship $40.2 10th Largest Relationship $ 19.6 50th Largest Relationship $7.3 100th Largest Relationship $5.1 200th Largest Relationship $3.1 300th Largest Relationship $2.4 16 $40.2 $7.3 $5.1 $3.8 $3.1 $2.6 $2.4 0 10 20 30 40 50 Relationship Size Number of Relationships
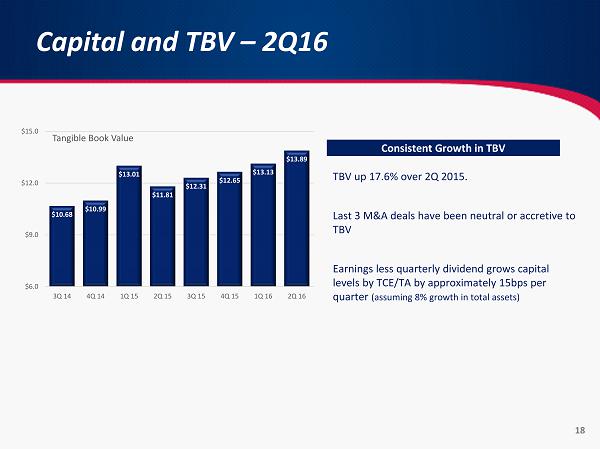
Capital and TBV – 2Q16 TBV up 17.6% over 2Q 2015. Last 3 M&A deals have been neutral or accretive to TBV Earnings less quarterly dividend grows capital levels by TCE/TA by approximately 15bps per quarter (assuming 8% growth in total assets) Consistent Growth in TBV 18 $10.68 $10.99 $13.01 $11.81 $12.31 $12.65 $13.13 $13.89 $6.0 $9.0 $12.0 $15.0 3Q 14 4Q 14 1Q 15 2Q 15 3Q 15 4Q 15 1Q 16 2Q 16 Tangible Book Value
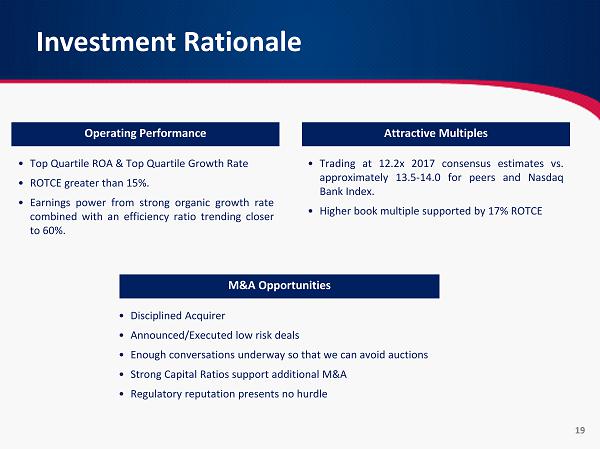
Investment Rationale Attractive Multiples • Top Quartile ROA & Top Quartile Growth Rate • ROTCE greater than 15 % . • Earnings power from strong organic growth rate combined with an efficiency ratio trending closer to 60 % . Operating Performance M&A Opportunities • Disciplined Acquirer • Announced/Executed low risk deals • Enough conversations underway so that we can avoid auctions • Strong Capital Ratios support additional M&A • Regulatory reputation presents no hurdle 19 • Trading at 12 . 2 x 2017 consensus estimates vs . approximately 13 . 5 - 14 . 0 for peers and Nasdaq Bank Index . • Higher book multiple supported by 17 % ROTCE
Ameris Bancorp Earnings Release & Financial Highlights 2 Q 2016