Attached files
| file | filename |
|---|---|
| EX-32.1 - EX-32.1 - IXYS, LLC | d199288dex321.htm |
| EX-31.2 - EX-31.2 - IXYS, LLC | d199288dex312.htm |
| EX-31.1 - EX-31.1 - IXYS, LLC | d199288dex311.htm |
| EX-23.1 - EX-23.1 - IXYS, LLC | d199288dex231.htm |
| EX-21.1 - EX-21.1 - IXYS, LLC | d199288dex211.htm |
Table of Contents
UNITED STATES SECURITIES AND EXCHANGE COMMISSION
Washington, D.C. 20549
FORM 10-K
(Mark One)
| þ | ANNUAL REPORT PURSUANT TO SECTION 13 OR 15(d) OF THE SECURITIES EXCHANGE ACT OF 1934 |
For the fiscal year ended March 31, 2016
or
| ¨ | TRANSITION REPORT PURSUANT TO SECTION 13 OR 15(d) OF THE SECURITIES EXCHANGE ACT OF 1934 |
For the transition period from to
Commission file number 000-26124
IXYS CORPORATION
(Exact name of registrant as specified in its charter)
| Delaware | 77-0140882 | |
| (State or other jurisdiction of incorporation or organization) |
(I.R.S. Employer Identification No.) |
1590 Buckeye Drive
Milpitas, California 95035-7418
(Address of principal executive offices and zip code)
(408) 457-9000
(Registrant’s telephone number, including area code)
Securities registered pursuant to Section 12(b) of the Act:
| Common stock, par value $0.01 per share | The NASDAQ Global Select Market | |
| (Title of each class) | (Name of each exchange on which registered) |
Securities registered pursuant to Section 12(g) of the Act: None
Indicate by check mark if the registrant is a well-known seasoned issuer, as defined in Rule 405 of the Securities Act. Yes ¨ No þ
Indicate by check mark if the registrant is not required to file reports pursuant to Section 13 or Section 15(d) of the Act. Yes ¨ No þ
Note — Checking the box above will not relieve any registrant required to file reports pursuant to Section 13 or 15(d) of the Exchange Act from their obligations under those Sections.
Indicate by check mark whether the registrant (1) has filed all reports required to be filed by Section 13 or 15(d) of the Securities Exchange Act of 1934 during the preceding 12 months (or for such shorter period that the registrant was required to file such reports), and (2) has been subject to such filing requirements for the past 90 days. Yes þ No ¨
Indicate by check mark whether the registrant has submitted electronically and posted on its corporate Web site, if any, every Interactive Data File required to be submitted and posted pursuant to Rule 405 of Regulation S-T (§ 232.405 of this chapter) during the preceding 12 months (or for such shorter period that the registrant was required to submit and post such files). Yes þ No ¨
Indicate by check mark if disclosure of delinquent filers pursuant to Item 405 of Regulation S-K (§229.405 of this chapter) is not contained herein, and will not be contained, to the best of registrant’s knowledge, in definitive proxy or information statements incorporated by reference in Part III of this Form 10-K or any amendment to this Form 10-K. þ
Indicate by check mark whether the registrant is a large accelerated filer, an accelerated filer, a non-accelerated filer, or a smaller reporting company. See the definitions of “large accelerated filer,” “accelerated filer” and “smaller reporting company” in Rule 12b-2 of the Exchange Act.
| Large Accelerated Filer ¨ | Accelerated Filer þ | Non-accelerated Filer ¨ | Smaller reporting company ¨ | |||
| (Do not check if a smaller reporting company) | ||||||
Indicate by check mark whether the registrant is a shell company (as defined in Rule 12b-2 of the Act). Yes ¨ No þ
The aggregate market value of the common stock held by non-affiliates of the registrant, computed by reference to the last sale price on the NASDAQ Global Select Market on September 30, 2015, was approximately $274,130,959. For purpose of this calculation, shares held or controlled by directors and executive officers have been excluded because they may be deemed to be “affiliates.” This determination is used for convenience and is not conclusive for any purpose. The number of shares of the registrant’s Common Stock outstanding as of May 23, 2016 was 31,383,024.
DOCUMENTS INCORPORATED BY REFERENCE
Portions of the registrant’s Proxy Statement relating to its Annual Meeting of Stockholders to follow its fiscal year ended March 31, 2016, to be filed subsequently — Part III of this Annual Report on Form 10-K.
Table of Contents
IXYS CORPORATION
ANNUAL REPORT ON FORM 10-K
FOR THE FISCAL YEAR ENDED MARCH 31, 2016
Table of Contents
FORWARD-LOOKING STATEMENTS
This Annual Report on Form 10-K contains forward-looking statements that include, but are not limited to, statements concerning projected revenues, expenses, gross profit and income and the need for additional capital. These forward-looking statements are based on our current expectations, estimates and projections about our industry, management’s beliefs and certain assumptions made by us. In some cases, these statements may be identified by terminology, such as “may,” “will,” “should,” “expects,” “plans,” “anticipates,” “believes,” “estimates,” “predicts,” “potential,” or “continue” or the negative of such terms and other comparable expressions. These statements involve known and unknown risks and uncertainties that may cause our results, levels of activity, performance or achievements or our industry to be materially different than those expressed or implied by the forward-looking statements. Factors that may cause or contribute to such differences include, but are not limited to, our ability to compete successfully in our industry, to continue to develop new products on a timely basis, cancellation of customer orders and other factors discussed below and under the caption “Risk Factors” in Item 1A. We disclaim any obligation to update any of the forward-looking statements contained in this report to reflect any future events or developments, except as may be required by law.
PART I
We are a multi-market integrated semiconductor company. We specialize in the development, manufacture and marketing of high performance power semiconductors, advanced mixed-signal integrated circuits, or ICs, application specific integrated circuits, or ASICs, microcontrollers, systems and radio frequency, or RF, power semiconductors.
Our power semiconductors improve system efficiency and reliability by converting electricity at relatively high voltage and current levels into the finely regulated power required by electronic products. We focus on the market for power semiconductors that are capable of processing greater than 200 watts of power.
Our power semiconductor products have historically been divided into two primary categories, power MOS, or metal-oxide-silicon, and power bipolar products. Our power semiconductors are sold as individual units and are also packaged in high power modules that frequently consist of multiple semiconductor die. In our fiscal year ended March 31, 2016, or fiscal 2016, power semiconductors constituted approximately 67.3% of our revenues, which included 30.9% of revenues from power MOS transistors and related products and 36.4% of revenues from bipolar products. References to revenues in this Annual Report on Form 10-K constitute references to net revenues, except where the context otherwise requires.
Our power semiconductor products are used primarily to control electricity in:
| • | power conversion systems, including uninterruptible power supplies, or UPS, and switch-mode power supplies, or SMPS, for applications, such as communications infrastructure, including wireless base stations, network servers and telecommunication switching stations; |
| • | motor drives for industrial applications, such as industrial transportation, robotics, automation and process control equipment; |
| • | medical electronics for sophisticated applications, such as defibrillators and MRI equipment; and |
| • | renewable energy sources, such as wind turbines and solar systems. |
We design and sell ICs that have applications in appliances, telecommunications, display, power management and security systems. In fiscal 2016, ICs constituted approximately 26.5% of our revenues.
Our microcontroller semiconductor products are designed for a variety of applications, including consumer electronics, home appliances and security systems. Our mixed-signal ICs are used in telecommunications products, central office switching equipment, customer premises equipment, set top boxes, remote meter reading equipment, security systems, advanced flat displays, medical electronics and defense aerospace systems.
Our systems include laser diode drivers, high voltage pulse generators and modulators, and high power subsystems, sometimes known as stacks, that are principally based on our high power semiconductor devices.
3
Table of Contents
We also design and sell RF power semiconductors that switch electricity at the high rates required by circuitry that generates radio frequencies. Our RF power devices are used in wireless infrastructure, industrial RF applications, medical systems and defense and space electronics. In fiscal 2016, system and RF semiconductors constituted approximately 6.2% of our revenues.
We design our power semiconductor, IC and systems and RF semiconductor products primarily for industrial and business applications, rather than for use in consumer electronics.
In fiscal 2016, our products were used by over 3,500 end customers worldwide. Our major end customers include ABB, Boston Scientific, Emerson, Medtronic, Schneider Electric, Siemens and Universal Electronics.
We were founded in 1983 and are incorporated in the state of Delaware.
Background
The worldwide demand for electrical energy is currently increasing due to:
| • | proliferation of technology-driven products that require electricity, including computers, telecommunications equipment and the infrastructure to support portable electronics; |
| • | increased use of electronic content in traditional products such as automobiles and home appliances; |
| • | increased use of automation and electrical processes in industry and mass transit systems; |
| • | growth of the Internet and mobile telecommunications demand; and |
| • | penetration of technology into developing countries. |
Not only is demand increasing, but the requirements for electricity are also changing. Electronic products in all markets are becoming increasingly sophisticated, offering more “intelligence” through the use of microprocessors and additional solid-state components. The increasing complexity of such products requires more precisely regulated power and greater power reliability. In addition, the increasing costs of electricity, coupled with governmental regulations and environmental concerns, have caused an increased demand for energy efficiency.
Power semiconductors are used to provide the precisely regulated power required by sophisticated electronic products and equipment and address the growing demand for energy efficiency. In most cases, power semiconductors:
| • | convert, or “rectify,” alternating current, or AC, power delivered by electrical utilities to the direct current, or DC, power that is required by most electronic equipment; |
| • | convert DC power at a certain voltage level to DC power at a different voltage level to meet the specific voltage requirement for an application; |
| • | invert DC power to high frequency AC power to permit the processing of power through the use of substantially smaller electronic components; or |
| • | rectify high frequency AC power from switch-mode power supplies to meet the specific DC voltage and frequency required by an application. |
Power semiconductors improve system efficiency and reliability by processing and converting electrical energy into more usable, higher quality power. Specifically, our power semiconductors are used primarily in controlling energy in power conversion systems, including switch-mode power supplies and uninterruptible power supplies, and in motor drive controls. Switch-mode power supplies efficiently convert power to meet the specific voltage requirements of an application, such as communications equipment. Uninterruptible power supplies provide a short-term backup of electricity in the event of power failure. Motor drive controls regulate the voltage, current and frequency of power to a motor.
Our microcontrollers are used to control electronic devices such as remote controllers, motors and user interfaces on appliances. With the growth in telecommunications, data communications and wireless communications, the demand for analog and mixed-signal ICs has grown. Our mixed-signal ICs address the interface between telecommunication and data communication components, both in the central office and in
4
Table of Contents
gateway applications, especially with the increased use of the Internet protocol, or IP. Our RF power semiconductors are used in wireless infrastructure and in other microwave communication applications. Technical advancement in the communication industries is expected, in part, to drive the demand for higher performance semiconductors.
Power Semiconductors
Our power semiconductor products have historically been divided into two primary categories: power MOS transistors and bipolar products. Our power semiconductors are sold separately and are also packaged in high power modules that frequently consist of multiple semiconductor dies. In fiscal 2016, power semiconductors constituted approximately 67.3% of our revenues, which included about 30.9% of revenues from power MOS transistors and related products, and about 36.4% of revenues from bipolar products. In fiscal year ended March 31, 2015, or fiscal 2015, power semiconductors constituted approximately 64.8% of our revenues, which included about 26.1% of revenues from power MOS transistors and about 37.0% of revenues from bipolar products. In fiscal year ended March 31, 2014, or fiscal 2014, power semiconductors constituted approximately 66.3% of our revenues, which included about 25.5% of revenues from power MOS transistors and about 39.1% of revenues from bipolar products.
Power MOS Transistors
Power MOS transistors operate at much greater switching speeds than bipolar transistors, allowing the design of smaller and less costly end products. Power MOS transistors are activated by voltage rather than current, so they require less external circuitry to operate, making them more compatible with IC controls. Power MOS transistors also offer more reliable long term performance and are more rugged than traditional bipolar transistors, permitting them to better withstand adverse operating conditions. Our power MOS transistors consist of power MOSFETs and IGBTs.
| • | Power MOSFETs. A power MOSFET, or metal-oxide-silicon field-effect transistor, is a switch controlled by voltage at the gate. Power MOSFETs are used in combination with passive components to vary the amperage and frequency of electricity by switching on and off at high frequency. Our power MOSFETs are used primarily in power conversion systems and are focused on higher voltage applications ranging from 40 to 4,500 volts. |
| • | IGBTs. IGBTs, or insulated-gate bipolar transistors, also are used as switches. IGBTs have achieved many of the advantages of power MOSFETs and of traditional bipolar technology by combining the voltage-controlled switching features of power MOSFETs with the superior conductivity and energy efficiency of bipolar transistors. For a given semiconductor die size, IGBTs can operate at higher currents and voltages, making them more cost-effective devices for high energy applications than power MOSFETs. Since our inception, we have developed IGBTs for high voltage applications. Our current products are focused on voltage applications ranging from 300 volts to 4,500 volts. Our IGBTs are used principally in AC motor drives, power systems and defibrillators. |
Bipolar Products
Bipolar products are also used to process electricity, but are activated by current rather than voltage. Bipolar products are capable of switching electricity at substantially higher power levels than power MOS transistors. However, switching speeds of bipolar products are slower than those of power MOS transistors and, as a result, bipolar products are preferred where very high power is required. Our bipolar products consist of rectifiers and thyristors.
| • | Rectifiers. Rectifiers convert AC power to DC power and are used primarily in input and output rectification and inverters. Our rectifiers are used in DC and AC motor drives, power supplies, lighting and heating controls and welding equipment. A subset of our rectifier product group is a very fast switching device known as a FRED, or fast recovery epitaxial diode. FREDs limit spikes in voltage across the power switch to reduce power dissipation and electromagnetic interference. Our FREDs are used principally in AC motor drives and power supplies. |
5
Table of Contents
| • | Thyristors. Thyristors are switches that can be turned on by a controlled signal and turned off only when the output current is reduced to zero, which occurs in the flow of AC power. Thyristors are preferred over power MOSFETs and IGBTs in high voltage, low frequency AC applications because their on-state resistance is lower than the on-state resistance of power MOSFETs and IGBTs. Our thyristors are used in motor drives, defibrillators, power supplies, lighting and heating controls. |
Integrated Circuits
Our integrated circuits address the demand for analog, mixed-signal and digital interface solutions in communication and other industries and include microcontrollers, mixed-signal application-specific ICs, as designed for specific customers and as standard products, and power management and control ICs. ICs accounted for 26.5% of our revenues in fiscal 2016, 28.2% of our revenues in fiscal 2015 and 27.1% of our revenues in fiscal 2014.
Microcontrollers
A microcontroller is a computer-on-a-chip that is optimized to control electronic devices, such as motors and user interfaces on appliances. A microcontroller typically includes a central processing unit, non-volatile program memory, random access memory for data storage and various peripheral capabilities. The microcontroller includes application-specific software provided by the customer and may include specialized peripheral device controllers and internal or external non-volatile memory components to enable the storage and access of additional program software. Our ZigBee® wireless microcontrollers offer system-on-a-chip, or SoC, solutions useful for home automation, smart energy and remote sensors. These ZigBee® wireless microcontrollers were acquired through the acquisition of RadioPulse, Inc., or RadioPulse, in May 2015.
Microcontroller devices have been incorporated into a wide variety of products in markets including consumer electronics, home appliances and security systems. Microcontrollers are generally segmented by word length, which is measured in bits ranging from 4-bit through 32-bit architectures. Our microcontroller product lines are focused on 8-bit microcontrollers. While traditional 16-bit and 32-bit architectures are typically higher performance, they can be too expensive for many high volume embedded control applications. Manufacturers will choose the appropriate microcontrollers based on cost, performance and functionality requirements.
Solid-State Relays
We manufacture solid-state relays, or SSRs, that isolate the low current communication signal from the higher power circuit, while also switching to control the flow of current. Our SSRs, which include high voltage analog components, optocouplers and integrated packages, are utilized principally in telecommunication and video and data communication applications, as well as instrumentation, industrial control and aerospace and automotive applications.
LCAS and DAA integrated products
A line card access switch, or LCAS, is a solid-state solution for a switching function historically performed by electromagnetic devices. Our LCAS products are used in central office switching applications to enable data and voice telephony. Data access arrangements, or DAAs, integrate a number of discrete components and are principally used in analog data communications that interface with telephone network applications. Our Litelink® products are DAAs for applications such as voice-over IP, wired communication lines and set top boxes.
Application-Specific Integrated Circuits
We design high voltage, analog and mixed-signal ASICs for a variety of applications. Applying our technological expertise in ASICs, we also design and sell application-specific standard products. In this regard, we have developed a line of source and gate drivers.
6
Table of Contents
Power Management and Control ICs
We also make and sell power management and control ICs, such as current regulators, motion controllers, digital power modulators and drivers for power MOSFETs and IGBTs. These ICs typically manage, control or regulate power semiconductors and the circuits and subassemblies that incorporate them.
RF Power Semiconductors
Our RF power devices switch electricity at the high rates necessary to enable the amplification or reception of radio frequencies. Our products include field-effect transistors, or FETs, pseudomorphic-high-electron-mobility transistors, or PHEMTs, Gunn diodes and monolithic microwave integrated circuits, or MMICs. These products are principally gallium arsenide devices, which remain efficient at the high heat and energy levels inherent in RF applications.
Systems and Other Products
We manufacture and sell laser diode drivers, high voltage pulse generators and modulators. We also manufacture and sell high power subsystems, sometimes known as modules or stacks, that are principally based on our high power semiconductor devices.
Products and Applications
Our power semiconductors are used primarily to control electricity in power conversion systems, motor drives and medical electronics. Our ICs are used to interface with telecommunication lines, control power semiconductors and drive medical equipment and displays, as well as offer our customers the ability to integrate peripheral functions such as network connectivity, timers, serial communication, analog-to-digital conversion and display drivers on our micrologic devices. Our RF power semiconductors enable the amplification and reception of radio frequencies in telecommunication, industrial, defense and space applications. The following table summarizes the primary categories of uses for our products, some products used within the categories and some of the applications served within the categories:
| Category |
Our Products |
End User Applications | ||
| Power Conversion Systems |
FRED | SMPS and UPS for: | ||
| IGBT | Wireless base stations | |||
| Module | Internet facilities | |||
| MOSFET | Storage area networks | |||
| Thyristor | RF generators | |||
| Rectifier | Renewable energy systems | |||
| IC Driver | Low-power controllers | |||
| Embedded flash microcontroller | Industrial controllers | |||
| 8-bit microcontroller | Battery chargers | |||
| Motor Drives |
FRED | Automation | ||
| IGBT | Robotics | |||
| Module | Process control equipment | |||
| MOSFET | Machine tools | |||
| Thyristor | Electric trains | |||
| IC driver | Fans | |||
| Solid state relay | ||||
| 8-bit microcontroller | ||||
| Medical Electronics |
IGBT | Defibrillators | ||
| MOSFET | Medical imaging devices | |||
| Thyristor | Laser power supplies | |||
| IC | Ultrasound | |||
| GaAs FET | ||||
| ZigBee® wireless microcontroller |
7
Table of Contents
| Category |
Our Products |
End User Applications | ||
| Telecommunications |
SSR | Point-of-sale terminals | ||
| MOSFET | Modems | |||
| LCAS | Set top boxes | |||
| GaAs FET | Wireless base stations | |||
| DAA | Central office | |||
| 8-bit microcontroller | Security systems | |||
| Serial communication controller | Telephone switches/PBX | |||
| Consumer Products |
Display driver IC | Remote Controllers | ||
| 8-bit microcontroller | Appliances | |||
| Embedded flash microcontroller | Displays | |||
| ZigBee® wireless microcontroller | Internet of Things |
We also sell our power semiconductor chips to other power semiconductor companies for use in their modules.
Sales and Marketing
We sell our products through a worldwide selling organization that includes direct sales personnel, independent representatives and distributors. As of March 31, 2016, we employed 82 people in sales, marketing and customer support and used 33 sales representative organizations and 14 distributors in the Americas and 142 sales representative organizations and distributors in the rest of the world. Sales to distributors accounted for approximately 56.7% of net revenues in fiscal 2016, 55.6% of net revenues in fiscal 2015 and 56.8% of net revenues in fiscal 2014. One distributor, Allied Group (Hong Kong), accounted for 12.2%, 10.2% and 10.8% of net revenues in fiscal 2016, 2015 and 2014, respectively. Another distributor, Future Electronics, accounted for 10.5% of net revenues in fiscal 2015.
In fiscal 2016, United States sales represented approximately 24.0%, and international sales represented approximately 76.0%, of our net revenues. Of our international sales in fiscal 2016, approximately 38.3% were derived from sales in Europe and the Middle East, approximately 58.2% were derived from sales in the Asia Pacific region and approximately 3.5% were derived from sales in India and the rest of the world. For financial information about geographic areas for each of our last three fiscal years, see Note 15, “Segment and Geographic Information” in the Notes to Consolidated Financial Statements in Item 8 of this Annual Report on Form 10-K, which information is incorporated by reference into this Item 1. For a discussion of the risks attendant to our foreign operations, see Item 1A, “Risk Factors-Our international operations expose us to material risks,” which information is incorporated by reference into this Item 1.
We market our products through advertisements, technical articles and press releases that appear regularly in a variety of trade publications, as well as through the dissemination of brochures, data sheets and technical manuals. We also have a presence on the Internet through a worldwide web page that enables engineers to access and download technical information and data sheets.
Research and Development
We believe that we successfully compete in our markets, in part because of our ability to design, develop and introduce new products offering technological improvements to the market on a timely basis. While the time from initiation of design to volume production of new semiconductors often takes 18 months or longer, our power semiconductors typically have a product life of several years. Our research and development expenses were approximately $30.0 million in fiscal 2016, $26.7 million in fiscal 2015 and $30.9 million in fiscal 2014. As of March 31, 2016, we employed 152 people in engineering and research and development activities.
We are engaged in ongoing research and development efforts focused on enhancements to existing products and the development of new products.
Currently, we are pursuing research and development projects with respect to:
| • | developing new power semiconductors and ICs for the Internet of Things, or IoTs, electric vehicles, or EVs, and medical applications; |
| • | increasing the operating range of our MOS and bipolar power semiconductor products; |
8
Table of Contents
| • | increasing the operating range of our power diodes and rectifier products; |
| • | developing new gallium arsenide and gallium nitride amplifiers and MMICs; |
| • | developing new high voltage LED drivers and drivers for power MOSFETs, IGBTs and Silicon Carbide FETs; |
| • | developing higher power IGBT, thyristor and rectifier modules; |
| • | developing hybrids and modules with silicon carbide devices; |
| • | developing telecommunication and power solid-state relays; |
| • | developing high voltage integrated circuits, or HVICs, and optically isolated drivers for power management; |
| • | developing high current MOSFETs and IGBTs for power supplies, generators, inverters, automotive, EV and portable equipment markets; |
| • | developing high power module products for automotive and EV; |
| • | developing high power module products for electric trains, solar inverters and wind power generators; |
| • | developing stacks and subsystems for renewable energy markets; |
| • | developing ICs for telecommunications, VOIP, security and flexible displays; |
| • | developing solar-powered battery charging devices, products and circuits; |
| • | developing 8-bit 16-bit and 32-bit embedded flash-based microcontrollers; |
| • | developing ICs for radio frequency identification, or RFID, tags and RFID tags evaluation boards; |
| • | developing SoCs with embedded microcontrollers, or MCUs, and ZigBee® wireless connectivity for Internet of Things applications; |
| • | developing software tools for our 8-bit, 16-bit and 32-bit MCUs; |
| • | developing pulse drivers for lasers, medical and laboratory systems; and |
| • | developing application-specific modules for defibrillators. |
Research and development activities are conducted in collaboration with manufacturing activities to help expedite new products from the development phase to manufacturing and to more quickly implement new process technologies. From time to time, our research and development efforts have included participation in technology collaborations with universities and research institutions.
Patents and Other Intellectual Property Rights
As of March 31, 2016, we held 471 issued patents, of which 293 were issued in the U.S. and 178 were issued in international jurisdictions. We rely on a combination of patent rights, copyrights and trade secrets to protect the proprietary elements of our products. Our policy is to file patent applications to protect technology, inventions and improvements that are important to our business. We also seek to protect our trade secrets and proprietary technology, in part through confidentiality agreements with employees, consultants and other parties. While we believe that our intellectual property rights are valuable, we also believe that other factors, such as innovative skills, technical expertise, the ability to adapt quickly to evolving customer requirements and new technologies, product support and customer relations, are of greater competitive significance.
Manufacturing and Facilities
The production of our products is a highly complex and precise process. We manufacture our products in our own manufacturing facilities, utilize external wafer foundries and subcontract assembly facilities. We divide our manufacturing operations into three key areas: wafer fabrication, assembly and test.
9
Table of Contents
Wafer Fabrication
The first step in our manufacturing process for our power semiconductors is the deposition of a layer of epitaxy on the substrates we purchase from third parties. This deposition occurs at external facilities and at our facility in Santa Clara, California. The substrates are then sent for fabrication.
We have four facilities which perform fabrication. We own an approximately 170,000 square-foot facility in Lampertheim, Germany, where we fabricate bipolar products, and an approximately 83,000 square-foot facility in Beverly, Massachusetts, capable of manufacturing HVICs. We also lease an approximately 30,000 square-foot facility in Fremont, California, where we manufacture gallium arsenide RF power semiconductors, and an approximately 100,000 square-foot facility in Chippenham, England, where we fabricate very high power bipolar devices. We believe that our internal fabrication capabilities enable us to more quickly bring products to the market, retain certain proprietary aspects of our process technology and develop new innovations.
In addition to maintaining our own fabrication facilities, we have established alliances with selected foundries for wafer fabrication. This approach allows us to reduce substantial capital spending and manufacturing overhead expenses, obtain competitive pricing and technologies and expand manufacturing capacity more rapidly than could be achieved with internal foundries alone. In some cases, we retain the flexibility to shift the production of our products to different or additional foundries for cost or performance reasons. Our product designs enable the production of our devices at multiple foundries using well-established and cost-effective processes.
Measured in dollars, we relied on external foundries for approximately 47.4% of our wafer fabrication requirements in fiscal 2016. We have arrangements with a number of external wafer foundries, both for power semiconductors and ICs. We provide our foundries forecasts for wafer fabrication six months in advance and make firm purchase commitments one to two months in advance of delivery.
Wafer fabrication of power semiconductors generally employs process technology and equipment already proven in IC manufacturing. Power semiconductors are manufactured using fabrication equipment that is one or more generations behind the equipment used to fabricate leading-edge ICs. Used fabrication equipment can be obtained at prices substantially less than the original cost of such equipment or the cost of current equipment applying the latest technology. Consequently, the fabrication of power semiconductors is less capital intensive than the fabrication of leading-edge ICs.
For a discussion of risks attendant to our use of external foundries, see “Risk Factors-We depend on external foundries to manufacture many of our products,” provided in Item 1A of this Annual Report on Form 10-K, which information is incorporated by reference into this Item 1. For a discussion of risks attendant to our acquisition of substrates prior to wafer fabrication, see “Risk Factors-We depend upon a limited number of suppliers for our substrates, most of whom we do not have long term agreements with,” provided in Item 1A of this Annual Report on Form 10-K, which information is incorporated by reference into this Item 1. For a discussion of environmental risks attendant to our business, see “Risk Factors-We may be affected by environmental laws and regulations,” provided in Item 1A of this Annual Report on Form 10-K, which information is incorporated by reference into this Item 1.
Assembly
Packaging, or assembly, refers to the sequence of production steps that divide the wafer into individual chips and enclose the chips in external structures, called packages, which make them useable in a circuit. Manufacturing typically involves the assembly and packaging of single semiconductor, or die, devices. Module manufacturing involves the assembly of multiple devices within a single package. SSR products involve multiple chip assembly on a specialized lead frame. The resulting packages vary in configuration, but all have leads that are used to mount the package through holes in the customer’s printed circuit boards.
Most of our wafers are sent to subcontract assembly facilities. We use assembly subcontractors located in Asia and Europe in order to take advantage of low assembly costs. Measured in dollars, approximately 66.6% of our products were, during fiscal 2016, assembled at external assembly facilities, and the rest were assembled in our Lampertheim, Chippenham and Fremont facilities.
10
Table of Contents
Test
Generally, each die on our wafers is electrically tested for performance after wafer fabrication. Following assembly, our products undergo testing and final inspection, either internally or externally, prior to shipment to customers. Our test operations are performed by subcontractors located throughout Asia and at our facilities in the United States and Europe.
Competition
The semiconductor industry is intensely competitive and is characterized by price competition, technological change, limited fabrication capacity, international competition and manufacturing yield problems. The competitive factors in the market for our products include:
| • | price; |
| • | product quality, reliability and performance; |
| • | product features; |
| • | timely delivery of products; |
| • | proper new product definition; |
| • | breadth of product line; |
| • | design and introduction of new products; |
| • | market acceptance of our products and those of our customers; |
| • | support tools; |
| • | familiarity with micrologic architecture; |
| • | existing customer investment in system software based on a particular architecture; and |
| • | technical support and service. |
Regarding these factors, we view our competitive advantage as an ability to respond quickly to customer requests for new product development. On the other hand, we rarely consider our company to be among the most aggressive in pricing. We believe that we are one of a limited group of companies focused on the development and marketing of high power, high performance semiconductors capable of performing all of the basic functions of power semiconductor design and manufacture. Our primary power semiconductor competitors include Fairchild Semiconductor, Fuji, Hitachi, Infineon, Microsemi, Mitsubishi, On Semiconductor, Powerex, Renesas Electronics, Semikron International, STMicroelectronics, Toshiba and Vishay Intertechnology. Our IC products compete principally with those of Atmel, Cypress Semiconductor, Freescale Semiconductor, Microchip, NEC, Renesas Electronics and Silicon Labs. Our RF power semiconductor competitors include Microsemi and Qorvo.
Backlog
Backlog is influenced by several factors including market demand, pricing and customer order patterns in reaction to product lead times. In the semiconductor industry, backlog quantities and shipment schedules under outstanding purchase orders are frequently revised to reflect changes in customer needs. Purchase orders or agreements calling for the sale of specific quantities are either contractually subject to quantity revisions or, as a matter of industry practice, often not enforced. Therefore, a significant portion of our order backlog may be cancelable. For these reasons, the amount of backlog as of any particular date may not be an accurate indicator of future results. At March 31, 2016, our backlog of orders was approximately $87.7 million as compared to $91.5 million at March 31, 2015. Backlog represents existing customer orders that, by their terms, are expected to be shipped within the 12 months following March 31, 2016.
Our trade sales are made primarily pursuant to standard purchase orders that are booked months in advance of delivery. Generally, prices and quantities are fixed at the time of booking.
11
Table of Contents
We sell products to key customers pursuant to contracts that allow us to schedule production capacity in advance and allow the customers to manage their inventory levels consistent with just-in-time principles while shortening the cycle times required to produce ordered product. However, these contracts are typically amended to reflect changes in customer demand and periodic price renegotiations.
Employees
At March 31, 2016, we employed 992 employees, of whom 152 were primarily engaged in engineering and research and development activities, 82 in marketing, sales and customer support, 673 in manufacturing and 85 in administration and finance. Of these employees, 218 hold engineering or science degrees, including 31 Ph.D.s. Certain employees at our Lampertheim and Chippenham facilities are subject to collective bargaining agreements. There have been no work stoppages at any of our facilities to date. We believe that our employee relations are good.
Seasonality
Over the years, we have experienced a pattern, although not consistently, in our September and December quarters of reduced revenues or reduced growth in revenues from quarter to sequential quarter because of summer vacation and year-end holiday schedules in our and our customers’ facilities, particularly in our European operations.
Available Information
We currently make available, through our website at http://www.ixys.com, free of charge, copies of our Annual Report on Form 10-K, our quarterly reports on Form 10-Q and our current reports on Form 8-K, and amendments to those reports, as soon as reasonably practicable after submitting the information to the Securities and Exchange Commission, or SEC. None of the information posted on or accessible through our website is incorporated by reference into this Annual Report on Form 10-K by virtue thereof. You can also request free copies of such documents by contacting us at 408-457-9000 or by sending an e-mail to investorrelations@ixys.net.
In addition to the other information in this Annual Report on Form 10-K, the following risk factors should be considered carefully in evaluating our business and us. Additional risks not presently known to us or that we currently believe are not serious may also impair our business and its financial condition.
Our operating results fluctuate significantly because of a number of factors, many of which are beyond our control.
Given the nature of the markets in which we participate, as well as macroeconomic uncertainties, we cannot reliably predict future revenues and profitability and unexpected changes may cause us to adjust our operations. Large portions of our costs are fixed, due in part to our significant sales, research and development and manufacturing costs. Thus, small declines in revenues could seriously negatively affect our operating results in any given quarter. Our operating results may fluctuate significantly from quarter-to-quarter and year-to-year. For example, from fiscal 2008 to fiscal 2009, net income in one year shifted to net loss in the next year. Some of the factors that may affect our quarterly and annual results are:
| • | changes in business and economic conditions, including a downturn in demand or decrease in the rate of growth in demand, whether in the global economy, a regional economy or the semiconductor industry; |
| • | changes in market conditions, potentially including changes in the credit markets, currency exchange rates, expectations for inflation or energy prices; |
| • | the reduction, rescheduling or cancellation of orders by customers; |
| • | fluctuations in timing and amount of customer requests for product shipments; |
| • | changes in the mix of products that our customers purchase; |
12
Table of Contents
| • | changes in the level of customers’ component inventories; |
| • | loss of key customers or employees; |
| • | the availability of production capacity, whether internally or from external suppliers; |
| • | the cyclical nature of the semiconductor industry; |
| • | competitive pressures on selling prices; |
| • | strategic actions taken by our competitors; |
| • | market acceptance of our products and the products of our customers; |
| • | fluctuations in our manufacturing yields and significant yield losses; |
| • | difficulties in forecasting demand for our products and the planning and managing of inventory levels; |
| • | the availability of raw materials, supplies and manufacturing services from third parties; |
| • | the amount and timing of investments in research and development; |
| • | damage awards or injunctions as the result of litigation; |
| • | changes in our product distribution channels and the timeliness of receipt of distributor resale information; |
| • | the impact of vacation schedules and holidays, largely during the second and third quarters of our fiscal year; and |
| • | the amount and timing of costs associated with product returns. |
As a result of these factors, many of which are difficult to control or predict, as well as the other risk factors discussed in this Annual Report on Form 10-K, we may experience materially adverse fluctuations in our future operating results on a quarterly or annual basis. Changes in demand for our products and in our customers’ product needs could have a variety of negative effects on our competitive position and our financial results, and, in certain cases, may reduce our revenues, increase our costs, lower our gross margin percentage or require us to recognize impairments of our assets. If product demand declines, our manufacturing or assembly and test capacity could be underutilized and we may be required to record an impairment on our long-lived assets, including facilities and equipment as well as intangible assets and goodwill, which would increase our expenses. Factory planning decisions may also shorten the useful lives of long-lived assets, including facilities and equipment, and cause us to accelerate depreciation. In addition, if product demand declines or we fail to forecast demand accurately, we could be required to write off inventory or record underutilization charges, which would have a negative impact on our gross margin.
We may not be successful in our acquisitions.
We have in the past made, and may in the future make, acquisitions of other technologies and companies. These acquisitions involve numerous risks, including:
| • | failure to retain key personnel of the acquired business; |
| • | diversion of management’s attention during the acquisition process; |
| • | disruption of our ongoing business; |
| • | the potential strain on our financial and managerial controls and reporting systems and procedures; |
| • | unanticipated expenses and potential delays related to integration of an acquired business; |
| • | the risk that we will be unable to develop or exploit acquired technologies; |
| • | the engineering risks inherent in transferring products from one wafer fabrication facility to another; |
| • | failure to successfully integrate the operations of an acquired business with our own; |
| • | the challenges in achieving strategic objectives, cost savings and other benefits from acquisitions; |
13
Table of Contents
| • | the risk that our markets do not evolve as anticipated and that the technologies acquired do not prove to be those needed to be successful in those markets; |
| • | the risks of entering new markets in which we have limited experience; |
| • | difficulties in expanding our information technology systems or integrating disparate information technology systems to accommodate the acquired businesses; |
| • | the challenges inherent in managing an increased number of employees and facilities and the need to implement appropriate policies, benefits and compliance programs; |
| • | customer dissatisfaction or performance problems with an acquired company’s products or personnel or with altered sales terms or a changed distribution channel; |
| • | adverse effects on our relationships with suppliers; |
| • | the reduction in financial stability associated with the incurrence of debt or the use of a substantial portion of our available cash; |
| • | the costs associated with acquisitions, including amortization expenses related to intangible assets, and the integration of acquired operations; |
| • | assumption of known or unknown liabilities or other unanticipated events or circumstances; and |
| • | failure or fraud in pre-acquisition due diligence. |
We cannot assure that we will be able to successfully acquire other businesses or product lines or integrate them into our operations without substantial expense, delay in implementation or other operational or financial problems.
As a result of an acquisition, our financial results may differ from the investment community’s expectations in a given quarter. Further, if one or more of the foregoing risks materialize or market conditions or other factors lead us to change our strategic direction, we may not realize the expected value from such transactions. If we do not realize the expected benefits or synergies of such transactions, our consolidated financial position, results of operations, cash flows or stock price could be negatively impacted.
Our backlog may not result in future revenues.
Customer orders typically can be cancelled or rescheduled by the customer without penalty to the customer. Cancellations or reschedulings are common in periods of decreasing demand. Further, in periods of increasing demand, particularly when production is allocated or delivery delayed, customers of semiconductor companies have on occasion placed orders without expectation of accepting delivery to increase their share of allocated product or in an effort to improve the timeliness of delivery. While we are attuned to the potential for such behavior and attempt to identify such orders, we could accept orders of this nature and subsequently experience order cancellation unexpectedly.
Our backlog at any particular date is not necessarily indicative of actual revenues for any succeeding period. A reduction of backlog during any particular period, or the failure of our backlog to result in future revenues, could harm our results of operations.
Fluctuations in the mix of products sold may adversely affect our financial results.
Changes in the mix and types of products sold may have a substantial impact on our revenues and gross profit margins. In addition, more recently introduced products tend to have higher associated costs because of initial overall development costs and higher start-up costs. Fluctuations in the mix and types of our products may also affect the extent to which we are able to recover our fixed costs and investments that are associated with a particular product or wafer foundry, and, as a result, can negatively impact our financial results.
Our international operations expose us to material risks.
For the fiscal year ended March 31, 2016, our net revenues by region were approximately 24.0% in the United States, approximately 29.1% in Europe and the Middle East, approximately 44.2% in the Asia Pacific
14
Table of Contents
region and approximately 2.7% in India and the rest of the world. We expect net revenues from foreign markets to continue to represent a majority of total net revenues. We maintain significant business operations in Germany, the United Kingdom, the Philippines and South Korea and work with subcontractors, suppliers and manufacturers in South Korea, Japan, the Philippines and elsewhere in Europe and the Asia Pacific region. Some of the risks inherent in doing business internationally are:
| • | foreign currency fluctuations, particularly in the Euro and the British pound; |
| • | longer payment cycles; |
| • | challenges in collecting accounts receivable; |
| • | changes in the laws, regulations or policies of the countries in which we manufacture or sell our products, including the impact of the vote on June 23, 2016 in the United Kingdom on leaving the European Union; |
| • | trade restrictions; |
| • | cultural and language differences; |
| • | employment regulations; |
| • | limited infrastructure in emerging markets; |
| • | transportation delays; |
| • | seasonal reduction in business activities; |
| • | work stoppages; |
| • | labor and union disputes; |
| • | electrical outages; |
| • | terrorist attack or war; and |
| • | economic or political instability. |
Our sales of products manufactured in our Lampertheim, Germany facility and our costs at that facility are primarily denominated in Euros, and sales of products manufactured in our Chippenham, U.K. facility and our costs at that facility are primarily denominated in British pounds. Fluctuations in the value of the Euro and the British pound against the U.S. dollar could have a significant adverse impact on our balance sheet and results of operations. We generally do not enter into foreign currency hedging transactions to control or minimize these risks. Reductions in the value of the Euro or British pound would reduce our revenues recognized in U.S. dollars, all other things being equal. Changes in the value of the Euro or the British pound could cause or increase losses associated with changes in exchange rates for foreign currency transactions. Fluctuations in currency exchange rates could cause our products to become more expensive to customers in a particular country, leading to a reduction in sales or profitability in that country. Alternatively, fluctuations in currency exchange rates in the face of competitive pricing pressures could lead to lower gross profit margins, as customer prices in one currency fall relative to costs of production experienced in a different currency. If we expand our international operations or change our pricing practices to denominate prices in other foreign currencies, we could be exposed to even greater risks of currency fluctuations.
Our financial performance is dependent on economic stability and credit availability in international markets. Actions by governments to address deficits or sovereign or bank debt issues, particularly in Europe, could adversely affect gross domestic product or currency exchange rates in countries where we operate, which in turn could adversely affect our financial results. If our customers or suppliers are unable to obtain the credit necessary to fund their operations, we could experience increased bad debts, reduced product orders and interruptions in supplier deliveries leading to delays or stoppages in our production. Alternatively, governmental actions in China or other emerging markets to address economic problems, such as inflation, asset or other “bubbles” or the transfer of capital out of the country, could also adversely affect gross domestic product or the growth thereof and result in reduced product orders or increased bad debt expense for us.
15
Table of Contents
In addition, the laws and courts of certain foreign countries may not protect our products or intellectual property rights to the same extent as do U.S. laws and courts. Therefore, the risk of piracy of our technology and products may be greater when we manufacture or sell our products in certain foreign countries.
The semiconductor industry is cyclical, and an industry downturn could adversely affect our operating results.
Business conditions in the semiconductor industry may rapidly change from periods of strong demand and insufficient production to periods of weakened demand and overcapacity. The industry in general is characterized by:
| • | changes in product mix in response to changes in demand; |
| • | alternating periods of overcapacity and production shortages, including shortages of raw materials supplies and manufacturing services; |
| • | cyclical demand for semiconductors; |
| • | significant price erosion; |
| • | variations in manufacturing costs and yields; |
| • | rapid technological change and the introduction of new products; and |
| • | significant expenditures for capital equipment and product development. |
These factors could harm our business and cause our operating results to suffer.
Our dependence on subcontractors to assemble and test our products subjects us to a number of risks, including an inadequate supply of products and higher materials costs.
We depend on subcontractors for the assembly and testing of our products. The substantial majority of our products are assembled by subcontractors located outside of the United States. Assembly subcontractors generally work on narrow margins and have limited capital. We have encountered assembly subcontractors who have ceased or reduced production because of financial problems. We engage assembly subcontractors who operate while in insolvency proceedings or whose financial stability is uncertain. The unexpected cessation of production or reduction in production by one or more of our assembly subcontractors could adversely affect our production, our customer relations, our revenues and our financial condition. Our reliance on these subcontractors also involves the following significant risks:
| • | reduced control over delivery schedules and quality; |
| • | the potential lack of adequate capacity during periods of excess demand; |
| • | difficulties selecting and integrating new subcontractors; |
| • | limited or no warranties by subcontractors or other vendors on products supplied to us; |
| • | potential increases in prices due to capacity shortages and other factors; |
| • | potential misappropriation of our intellectual property; and |
| • | economic or political instability in foreign countries. |
These risks may lead to delayed product delivery or increased costs, which would harm our profitability and customer relationships.
Further, we use only a limited number of subcontractors to assemble most of our products. If one or more of these key subcontractors experience financial, operational, production or quality assurance difficulties, we could experience a significant reduction or interruption in supply. Although we believe alternative subcontractors are available, our operating results could temporarily suffer until we engage one or more of those alternative subcontractors. Moreover, in engaging alternative subcontractors in exigent circumstances, our production costs could increase markedly.
16
Table of Contents
We depend on external foundries to manufacture many of our products.
Of our net revenues for our fiscal year ended March 31, 2016, 47.4% came from wafers manufactured for us by a number of external foundries. In particular, the wafers for all of our microcontrollers are fabricated at external foundries. Our dependence on external foundries may grow.
Our relationships with our external foundries do not guarantee prices, delivery or lead times or wafer or product quantities sufficient to satisfy current or expected demand. Generally, these foundries manufacture our products on a purchase order basis. We provide these foundries with rolling forecasts of our production requirements. However, the ability of each foundry to provide wafers to us is limited by the foundry’s available capacity. At any given time, these foundries could choose to prioritize capacity for their own use or other customers or reduce or eliminate deliveries to us. If growth in demand for our products occurs, our external foundries may be unable or unwilling to allocate additional capacity to our needs, thereby limiting our revenue growth. Accordingly, we cannot be certain that these foundries will allocate sufficient capacity to satisfy our requirements. In addition, we cannot be certain that we will continue to do business with these or other foundries on terms as favorable as our current terms. If we are not able to obtain foundry capacity as required, our relationships with our customers could be harmed, we could be unable to fulfill contractual requirements and our revenues could be reduced or our growth limited. Moreover, even if we are able to secure foundry capacity, we may be required, either contractually or as a practical business matter, to utilize all of that capacity or incur penalties or an adverse effect to the business relationship. The costs related to maintaining foundry capacity could be expensive and could harm our operating results. Other risks associated with our reliance on external foundries include:
| • | the lack of control over delivery schedules; |
| • | the unavailability of, or delays in obtaining access to, key process technologies; |
| • | limited control over quality assurance, manufacturing yields and production costs; and |
| • | potential misappropriation of our intellectual property. |
Our requirements typically represent a small portion of the total production of the external foundries that manufacture our wafers and products. One or more of these external foundries may not continue to produce wafers for us or continue to advance the process design technologies on which the manufacturing of our products is based. If we are required to transition production from one foundry to another, we may make large last-time buys of product at the foundry that we are exiting, which could eventually result in substantial inventory write-offs if semiconductors are not sold or utilized. These circumstances could harm our ability to deliver our products or increase our costs.
Our gross margin is dependent on a number of factors, including our level of capacity utilization.
Semiconductor manufacturing requires significant capital investment, leading to high fixed costs, including depreciation expense. We are limited in our ability to reduce fixed costs quickly in response to any shortfall in revenues. If we are unable to utilize our manufacturing, assembly and testing facilities at a high level, the fixed costs associated with these facilities will not be fully absorbed, resulting in lower gross margins. Increased competition and other factors may lead to price erosion, lower revenues and lower gross margins for us in the future.
Our success depends on our ability to manufacture our products efficiently.
We manufacture our products in facilities that are owned and operated by us, as well as in external wafer foundries and subcontract assembly facilities. The fabrication of semiconductors is a highly complex and precise process, and a substantial percentage of wafers could be rejected or numerous dies on each wafer could be nonfunctional as a result of, among other factors:
| • | contaminants in the manufacturing environment; |
| • | defects in the masks used to print circuits on a wafer; |
| • | manufacturing equipment failure; or |
| • | wafer breakage. |
17
Table of Contents
For these and other reasons, we could experience a decrease in manufacturing yields. Additionally, if we increase our manufacturing output, the additional demands placed on existing equipment and personnel or the addition of new equipment or personnel may lead to a decrease in manufacturing yields. As a result, we may not be able to cost-effectively expand our production capacity in a timely manner.
We order materials and commence production in advance of anticipated customer demand. Therefore, revenue shortfalls may also result in inventory write-downs.
We typically plan our production and inventory levels based on our own expectations for customer demand. Actual customer demand, however, can be highly unpredictable and can fluctuate significantly. In response to anticipated long lead times to obtain inventory and materials, we order materials and production in advance of customer demand. This advance ordering and production may result in excess inventory levels or unanticipated inventory write-downs if expected orders fail to materialize. For example, additional inventory write-downs occurred in the quarter ended March 31, 2009.
If our goodwill, acquired intangible assets or long-lived assets become impaired, we may be required to record a significant charge to earnings.
Under generally accepted accounting principles, goodwill is required to be tested for impairment at least annually and we review our acquired intangible assets and long-lived assets for impairment when events or changes in circumstances indicate the carrying value may not be recoverable. Factors that may be considered a change in circumstances indicating that the carrying value of our goodwill, acquired intangible assets or long-lived assets may not be recoverable include a decline in stock price and market capitalization, reduced future cash flows and slower growth rates in our industry. From time to time, we have recorded impairment charges and written down the value of goodwill.
Costs related to product defects and errata may harm our results of operations and business.
Costs associated with unexpected product defects and errata (deviations from published specifications) due to, for example, unanticipated problems in our manufacturing processes, include the costs of:
| • | writing off the value of inventory of defective products; |
| • | disposing of defective products; |
| • | recalling defective products that have been shipped to customers; |
| • | providing product replacements for, or modifications to, defective products; and/or |
| • | defending against litigation related to defective products. |
These costs could be substantial and may, therefore, increase our expenses and lower our gross margin. In addition, our reputation with our customers or users of our products could be damaged as a result of such product defects and errata, and the demand for our products could be reduced. These factors could harm our financial results and the prospects for our business.
Semiconductors for inclusion in consumer products have shorter product life cycles.
We believe that consumer products are subject to shorter product life cycles, because of technological change, consumer preferences, trendiness and other factors, than other types of products sold by our customers. Shorter product life cycles result in more frequent design competitions for the inclusion of semiconductors in next generation consumer products, which may not result in design wins for us. Shorter product life cycles may lead to more frequent circumstances where sales of existing products are reduced or ended.
Uncertain global macroeconomic conditions could adversely affect our results of operations and financial condition.
Uncertain global macroeconomic conditions that affect the economy and the economic outlook of the United States, Europe, China and other parts of the world could adversely affect our customers and vendors,
18
Table of Contents
which could adversely affect our results of operations and financial condition. These uncertainties, including, among other things, sovereign and foreign bank debt levels, the inability of national or international political institutions to effectively resolve economic or budgetary crises or issues, consumer confidence, unemployment levels, interest rates, availability of capital, fuel and energy costs, tax rates, and the threat or outbreak of terrorism or public unrest, could adversely impact our customers and vendors, which could adversely affect us. Recessionary conditions and depressed levels of consumer and commercial spending may cause customers to reduce, modify, delay or cancel plans to purchase our products and may cause vendors to reduce their output or change their terms of sales. We generally sell products to customers with credit payment terms. If customers’ cash flow or operating or financial performance deteriorates, or if they are unable to make scheduled payments or obtain credit, they may not be able to pay, or may delay payment to us. Likewise, for similar reasons vendors may restrict credit or impose different payment terms. Any inability of current or potential customers to pay us for our products or any demands by vendors for different payment terms may adversely affect our results of operations and financial condition.
Our debt agreements contain certain restrictions that may limit our ability to operate our business.
The agreements governing our debt contain, and any other future debt agreement we enter into may contain, restrictive covenants that limit our ability to operate our business, including, in each case subject to certain exceptions, restrictions on our ability to:
| • | incur additional indebtedness; |
| • | grant liens; |
| • | consolidate, merge or sell our assets, unless specified conditions are met; |
| • | acquire other business organizations; |
| • | make investments; |
| • | redeem or repurchase our stock; and |
| • | change the nature of our business. |
In addition, our debt agreements contain financial covenants and additional affirmative and negative covenants. Our ability to comply with these covenants is dependent on our future performance, which will be subject to many factors, some of which are beyond our control, including prevailing economic conditions. If we are not able to comply with all of these covenants for any reason, some or all of our outstanding debt could become immediately due and payable and the incurrence of additional debt under the credit facilities provided by the debt agreements would not be allowed. If our cash is utilized to repay any outstanding debt, depending on the amount of debt outstanding, we could experience an immediate and significant reduction in working capital available to operate our business. Related to these risks, our lenders waived a default under our existing Revolving Credit Agreement caused by the leverage ratio, which compared total funded indebtedness as of March 31, 2016 to EBITDA for the four fiscal quarters ended March 31, 2016. The leverage ratio minimally exceeded the contractually agreed ratio of 2:1.
As a result of these covenants, our ability to respond to changes in business and economic conditions and to obtain additional financing, if needed, may be significantly restricted, and we may be prevented from engaging in transactions that might otherwise be beneficial to us, such as strategic acquisitions or joint ventures.
If we default on our Revolving Credit Agreement, most of our assets may become subject to security interests, which could lead to our lenders taking possession, selling or otherwise disposing of such assets, or to bankruptcy to forestall such actions.
We estimate tax liabilities, the final determination of which is subject to review by domestic and international taxation authorities.
We are subject to income taxes and other taxes in both the United States and foreign jurisdictions in which we currently operate or have historically operated. We are also subject to review and audit by both domestic and foreign taxation authorities. The determination of our worldwide provision for income taxes and current and deferred tax assets and liabilities requires significant judgment and estimation. The provision for income taxes
19
Table of Contents
can be adversely affected by a variety of factors, including but not limited to changes in tax laws, regulations and accounting principles, including accounting for uncertain tax positions, or interpretation of those changes. Significant judgment is required to determine the recognition and measurement attributes prescribed in the authoritative guidance issued by Financial Accounting Standards Board, or FASB, in connection with accounting for income taxes. Although we believe our tax estimates are reasonable, the ultimate tax outcome may materially differ from the tax amounts recorded in our consolidated financial statements and may materially affect our income tax provision, net income, goodwill or cash flows in the period or periods for which such determination is made.
Our intellectual property revenues are uncertain and unpredictable in timing and amount.
We are unable to discern a pattern in or otherwise predict the amount of any payments for the sale or licensing of intellectual property that we may receive. Consequently, we are unable to plan on the timing of intellectual property revenues and our results of operations may be adversely affected by a reduction in the amount of intellectual property revenues.
Our markets are subject to technological change and our success depends on our ability to develop and introduce new products.
The markets for our products are characterized by:
| • | changing technologies; |
| • | changing customer needs; |
| • | frequent new product introductions and enhancements; |
| • | increased integration with other functions; and |
| • | product obsolescence. |
To develop new products for our target markets, we must develop, gain access to and use leading technologies in a cost-effective and timely manner and continue to expand our technical and design expertise. Failure to do so could cause us to lose our competitive position and seriously impact our future revenues.
Products or technologies developed by others may render our products or technologies obsolete or non-competitive. A fundamental shift in technologies in our product markets would have a material adverse effect on our competitive position within the industry.
Our revenues are dependent upon our products being designed into our customers’ products.
Many of our products are incorporated into customers’ products or systems at the design stage. The value of any design win largely depends upon the customer’s decision to manufacture the designed product in production quantities, the commercial success of the customer’s product and the extent to which the design of the customer’s electronic system also accommodates incorporation of components manufactured by our competitors. In addition, our customers could subsequently redesign their products or systems so that they no longer require our products. The development of the next generation of products by our customers generally results in new design competitions for semiconductors, which may not result in design wins for us, potentially leading to reduced revenues and profitability. We may not achieve design wins or our design wins may not result in future revenues.
We could be harmed by intellectual property litigation.
As a general matter, the semiconductor industry is characterized by substantial litigation regarding patent and other intellectual property rights. We have been sued for purported patent infringement and have been accused of infringing the intellectual property rights of third parties. We also have certain indemnification obligations to customers and suppliers with respect to the infringement of third party intellectual property rights by our products. We could incur substantial costs defending ourselves and our customers and suppliers from any such claim. Infringement claims or claims for indemnification, whether or not proven to be true, may divert the efforts and attention of our management and technical personnel from our core business operations and could
20
Table of Contents
otherwise harm our business. For example, in June 2000, we were sued for patent infringement by International Rectifier Corporation. The case was ultimately resolved in our favor, but not until October 2008. In the interim, the U.S. District Court entered multimillion dollar judgments against us on two different occasions, each of which was subsequently vacated.
In the event of an adverse outcome in any intellectual property litigation, we could be required to pay substantial damages, cease the development, manufacturing, use and sale of infringing products, discontinue the use of certain processes or obtain a license from the third party claiming infringement with royalty payment obligations upon us. An adverse outcome in an infringement action could materially and adversely affect our financial condition, results of operations and cash flows.
We may not be able to protect our intellectual property rights adequately.
Our ability to compete is affected by our ability to protect our intellectual property rights. We rely on a combination of patents, trademarks, copyrights, trade secrets, confidentiality procedures and non-disclosure and licensing arrangements to protect our intellectual property rights. Despite these efforts, we cannot be certain that the steps we take to protect our proprietary information will be adequate to prevent misappropriation of our technology, or that our competitors will not independently develop technology that is substantially similar or superior to our technology. More specifically, we cannot assure that our pending patent applications or any future applications will be approved, or that any issued patents will provide us with competitive advantages or will not be challenged by third parties. Nor can we assure that, if challenged, our patents will be found to be valid or enforceable, or that the patents of others will not have an adverse effect on our ability to do business. We may also become subject to or initiate patentability or interference proceedings in the U.S. Patent and Trademark Office, which can demand significant financial and management resources and could harm our financial results. Also, others may independently develop similar products or processes, duplicate our products or processes or design their products around any patents that may be issued to us.
Because our products typically have lengthy sales cycles, we may experience substantial delays between incurring expenses related to research and development and the generation of revenues.
The time from initiation of design to volume production of new semiconductors often takes 18 months or longer. We first work with customers to achieve a design win, which may take nine months or longer. Our customers then complete the design, testing and evaluation process and begin to ramp up production, a period that may last an additional nine months or longer. As a result, a significant period of time may elapse between our research and development efforts and our realization of revenues, if any, from volume purchasing of our products by our customers.
The markets in which we participate are intensely competitive.
Many of our target markets are intensely competitive. Our ability to compete successfully in our target markets depends on the following factors:
| • | proper new product definition; |
| • | product quality, reliability and performance; |
| • | product features; |
| • | price; |
| • | timely delivery of products; |
| • | technical support and service; |
| • | design and introduction of new products; |
| • | market acceptance of our products and those of our customers; and |
| • | breadth of product line. |
In addition, our competitors or customers may offer new products based on new technologies, industry standards or end-user or customer requirements, including products that have the potential to replace our
21
Table of Contents
products or provide lower cost or higher performance alternatives to our products. The introduction of new products by our competitors or customers could render our existing and future products obsolete or unmarketable.
Our primary power semiconductor competitors include Fairchild Semiconductor, Fuji, Hitachi, Infineon, Microsemi, Mitsubishi, On Semiconductor, Powerex, Renesas Electronics, Semikron International, STMicroelectronics, Toshiba and Vishay Intertechnology. Our IC products compete principally with those of Atmel, Cypress Semiconductor, Freescale Semiconductor, Microchip, NEC, Renesas Electronics and Silicon Labs. Our RF power semiconductor competitors include Microsemi and Qorvo. Many of our competitors have greater financial, technical, marketing and management resources than we have. Some of these competitors may be able to sell their products at prices at which it would be unprofitable for us to sell our products or benefit from established customer relationships that provide them with a competitive advantage. We cannot assure that we will be able to compete successfully in the future against existing or new competitors or that our operating results will not be adversely affected by increased price competition.
We rely on our distributors and sales representatives to sell many of our products.
Most of our products are sold to distributors or through sales representatives. Our distributors and sales representatives could reduce or discontinue sales of our products. They may not devote the resources necessary to sell our products in the volumes and within the time frames that we expect. In addition, we depend upon the continued viability and financial resources of these distributors and sales representatives, some of which are small organizations with limited working capital. These distributors and sales representatives, in turn, depend substantially on general economic conditions and conditions within the semiconductor industry. We believe that our success will continue to depend upon these distributors and sales representatives. Foreign distributors are typically granted longer payment terms, resulting in higher accounts receivable balances for a given level of sales than domestic distributors. Our risk of loss from the financial insolvency of distributors is, therefore, disproportionally weighted to foreign distributors. If any significant distributor or sales representative experiences financial difficulties, or otherwise becomes unable or unwilling to promote and sell our products, our business could be harmed. For example, All American Semiconductor, Inc., one of our former distributors, filed for bankruptcy in April 2007.
Our future success depends on the continued service of management and key engineering personnel and our ability to identify, hire and retain additional personnel.
Our success depends upon our ability to attract and retain highly skilled technical, managerial, marketing and finance personnel, and, to a significant extent, upon the efforts and abilities of Nathan Zommer, Ph.D., our Chief Executive Officer, and other members of senior management. The loss of the services of one or more of our senior management or other key employees could adversely affect our business. We do not maintain key person life insurance on any of our officers, employees or consultants. There is intense competition for qualified employees in the semiconductor industry, particularly for highly skilled design, application and test engineers. We may not be able to continue to attract and retain engineers or other qualified personnel necessary for the development of our business or to replace engineers or other qualified individuals who could leave us at any time in the future. If we grow, we expect increased demands on our resources, and growth would likely require the addition of new management and engineering staff as well as the development of additional expertise by existing management. If we lose the services of or fail to recruit key engineers or other technical and management personnel, our business could be harmed.
Acquisitions, expansion, technological and administrative changes and software conversions and updates place a significant strain on our information systems.
Presently, because of our acquisitions, we are operating a number of different information systems that are not integrated, some of which are no longer supported by software vendors. As a consequence, we use spreadsheets, which are prepared by individuals rather than automated systems, in our accounting. In our accounting, we perform many manual reconciliations and other manual steps, which result in a high risk of errors. Manual steps also increase the possibility of control deficiencies and material weaknesses.
22
Table of Contents
If we do not adequately manage and evolve our financial reporting and managerial systems and processes, our ability to manage or grow our business may be harmed. Our ability to successfully implement our goals and comply with regulations requires an effective planning and management system and process. We will need to continue to improve existing, and implement new, operational and financial systems, procedures and controls to manage our business effectively in the future.
In improving, consolidating, changing or updating our operational and financial systems, procedures and controls, we would expect to periodically implement new or different software and other systems that will affect our internal operations regionally or globally. The conversion process from one system to another is complex and could require, among other things, that data from the existing system be made compatible with the upgraded or different system.
In connection with any of the foregoing, we could experience errors, interruptions, delays, cessations of service and other inefficiencies, which could adversely affect our business. Any error, delay, disruption, interruption or cessation, including with respect to any new or different systems, software programs, procedures or controls, could harm our ability to forecast sales demand, manage our supply chain, achieve accuracy in the conversion of electronic data and record and report financial and management information on a timely and accurate basis. In addition, as we add or change functionality, transition or convert to different systems or programs or integrate additional data in connection with an acquisition, problems could arise that we have not foreseen. Such problems could adversely impact our ability to do the following in a timely manner: provide quotes; take customer orders; ship products; provide services and support to our customers; bill and track our customers; fulfill contractual obligations; and otherwise run our business. Failure to properly or adequately address these issues could result in the diversion of management’s attention and resources, adversely affect our ability to manage our business, increase expenses, or adversely affect our results of operations, cash flows, stock price or reputation.
System security risks, data protection breaches and cyber-attacks could disrupt our operations and any such disruption could reduce our expected revenues, increase our expenses, damage our reputation or adversely affect our stock price.
Computer programmers and hackers may be able to penetrate our security controls and misappropriate or compromise our confidential information or that of third parties, create system disruptions or cause shutdowns. Computer programmers and hackers also may be able to develop and deploy viruses, worms and other malicious software programs that attack our products or otherwise exploit any security vulnerabilities of our products. The costs to us to eliminate or alleviate cyber or other security problems, bugs, viruses, worms, malicious software programs and security vulnerabilities could be significant, and our efforts to address these problems may not be successful and could result in interruptions, delays, cessation of service and loss of existing or potential customers that may impede our sales, manufacturing, distribution or other critical functions.
We manage and store proprietary information and sensitive or confidential data relating to our business and the businesses of third parties. Breaches of our security measures or the accidental loss, inadvertent disclosure or unapproved dissemination of proprietary information or sensitive or confidential data about us or our partners or customers, including the potential loss or disclosure of such information or data as a result of fraud, trickery or other forms of deception, could expose us, our partners and customers to a risk of loss or misuse of this information; result in regulatory investigations, fines, litigation and potential liability for us; damage our brand and reputation; or otherwise harm our business. In addition, the cost and operational consequences of implementing further data protection measures could be significant. Delayed sales, lower margins or lost customers resulting from these disruptions could adversely affect our financial results, stock price and reputation.
Regulations related to conflict minerals create additional compliance risks and force us to incur additional expenses.
The Dodd-Frank Wall Street Reform and Consumer Protection Act contains provisions to improve transparency and accountability concerning the supply of minerals originating from the conflict zones of the Democratic Republic of Congo, or DRC, and adjoining countries. As a result, the SEC established annual disclosure and reporting requirements for those companies who use “conflict” minerals mined from the DRC and adjoining countries in their products. These requirements could affect the sourcing and availability of minerals
23
Table of Contents
used in the manufacture of our products. As a result, we cannot ensure that we will be able to obtain minerals at competitive prices. Moreover, there are additional costs associated with complying with the extensive due diligence and audit procedures required by the SEC. In addition, we may face reputational challenges with our customers and other stakeholders as we have in the past and may in the future be unable to sufficiently verify the origins of all minerals used in our products. Finally, these rules bring implementation challenges. We may not successfully implement effective procedures to timely or adequately comply with these rules.
We depend on a limited number of suppliers for our substrates, most of whom we do not have long term agreements with.
We purchase the bulk of our silicon substrates from a limited number of vendors, most of whom we do not have long term supply agreements with. Any of these suppliers could reduce or terminate our supply of silicon substrates at any time. Our reliance on a limited number of suppliers involves several risks, including potential inability to obtain an adequate supply of silicon substrates and reduced control over the price, timely delivery, reliability and quality of the silicon substrates. We cannot assure that problems will not occur in the future with suppliers.
Increasing raw material prices could impact our profitability.
Our products use large amounts of silicon, metals and other materials. From time to time, we have experienced price increases for many of these items. If we are unable to pass price increases for raw materials onto our customers, our gross margins and profitability could be adversely affected.
We may not be able to increase production capacity to meet the present and future demand for our products.
The semiconductor industry has been characterized by periodic limitations on production capacity. These limitations may result in longer lead times for product delivery than desired by many of our customers. If we are unable to increase our production capacity to meet future demand, some of our customers may seek other sources of supply, our future growth may be limited or our results of operations may be adversely affected.
We face the risk of financial exposure to product liability claims alleging that the use of products that incorporate our semiconductors resulted in adverse effects.
Approximately 9.7% of our net revenues for the fiscal year ended March 31, 2016 were derived from sales of products used in medical devices, such as defibrillators. Product liability risks may exist even for those medical devices that have received regulatory approval for commercial sale. We cannot be sure that the insurance that we maintain against product liability will be adequate to cover our losses. Any defects in our semiconductors used in these devices, or in any other product, could result in significant product liability costs to us.
Our results of operations could vary as a result of the methods, estimates, and judgments that we use in applying our accounting policies.
The methods, estimates, and judgments that we use in applying our accounting policies have a significant impact on our results of operations (see “Critical Accounting Policies and Significant Management Estimates” in Part II, Item 7 of this Form 10-K). Such methods, estimates and judgments are, by their nature, subject to substantial risks, uncertainties and assumptions, and factors may arise over time that lead us to change our methods, estimates and judgments. Changes in those methods, estimates and judgments could significantly affect our results of operations.
We are exposed to various risks related to the regulatory environment.
We are subject to various risks related to new, different, inconsistent or even conflicting laws, rules and regulations that may be enacted by legislative bodies and/or regulatory agencies in the countries in which we operate; disagreements or disputes between national or regional regulatory agencies; and the interpretation and application of laws, rules and regulations. If we are found by a court or regulatory agency not to be in compliance with applicable laws, rules or regulations, our business, financial condition and results of operations could be materially and adversely affected.
24
Table of Contents
In addition, approximately 9.7% of our net revenues for the fiscal year ended March 31, 2016 were derived from the sale of products included in medical devices that are subject to extensive regulation by numerous governmental authorities in the United States and internationally, including the U.S. Food and Drug Administration, or FDA. The FDA and certain foreign regulatory authorities impose numerous requirements for medical device manufacturers to meet, including adherence to Good Manufacturing Practices, or GMP, regulations and similar regulations in other countries, which include testing, control and documentation requirements. Ongoing compliance with GMP and other applicable regulatory requirements is monitored through periodic inspections by federal and state agencies, including the FDA, and by comparable agencies in other countries. Our failure to comply with applicable regulatory requirements could prevent our products from being included in approved medical devices or result in damages or other compensation payable to medical device manufacturers.
Our business could also be harmed by delays in receiving or the failure to receive required approvals or clearances, the loss of obtained approvals or clearances or the failure to comply with existing or future regulatory requirements.
We invest in companies for strategic reasons and may not realize a return on our investments.
We make investments in companies to further our strategic objectives and support our key business initiatives. Such investments include investments in equity securities of public companies and investments in non-marketable equity securities of private companies, which range from early-stage companies that are often still defining their strategic direction to more mature companies whose products or technologies may directly support a product or initiative. The success of these companies is dependent on product development, market acceptance, operational efficiency and other key business success factors. The private companies in which we invest may fail for operational reasons or because they may not be able to secure additional funding, obtain favorable investment terms for future financings or take advantage of liquidity events such as initial public offerings, mergers, and private sales. If any of these private companies fail, we could lose all or part of our investment in that company. If we determine that an other-than-temporary decline in the fair value exists for the equity securities of the public and private companies in which we invest, we write down the investment to its fair value and recognize the related write-down as an investment loss. Furthermore, when the strategic objectives of an investment have been achieved, or if the investment or business diverges from our strategic objectives, we may decide to dispose of the investment, even at a loss. Our investments in non-marketable equity securities of private companies are not liquid, and we may not be able to dispose of these investments on favorable terms or at all. The occurrence of any of these events could negatively affect our results of operations.
Our ability to access capital markets could be limited.
From time to time, we may need to access the capital markets to obtain long-term financing. Although we believe that we can continue to access the capital markets on acceptable terms and conditions, our flexibility with regard to long-term financing activity could be limited by our existing capital structure, our credit ratings and the health of the semiconductor industry. In addition, many of the factors that affect our ability to access the capital markets, such as the liquidity of the overall capital markets and the current state of the economy, are outside of our control. There can be no assurance that we will continue to have access to the capital markets on favorable terms.
Geopolitical instability, war, terrorist attacks and terrorist threats, and government responses thereto, may negatively affect all aspects of our operations, revenues, costs and stock price.
Any such event may disrupt our operations or those of our customers or suppliers. Our markets currently include South Korea, Taiwan, Russia and Israel, which are currently experiencing political instability. Additionally, we have accounting and administrative operations in the Philippines, an external foundry and some of our design and sales operations are located in South Korea and assembly subcontractors are located in Indonesia, the Philippines and South Korea.
25
Table of Contents
Business interruptions may damage our facilities or those of our suppliers.
Our operations and those of our suppliers are vulnerable to interruption by fire, earthquake, flood and other natural disasters, as well as power loss, telecommunications failure and other events beyond our control. We do not have a detailed disaster recovery plan and do not have backup generators. Our facilities in California are located near major earthquake faults and have experienced earthquakes in the past. For example, the March 2011 earthquake in Japan adversely affected the operations of some of our Japanese suppliers, which limited the availability of certain production inputs to us for a period of time. If a natural disaster occurs, our ability to conduct our operations could be seriously impaired, which could harm our business, financial condition and results of operations and cash flows. We cannot be sure that the insurance we maintain against general business interruptions will be adequate to cover all our losses.
We may be affected by environmental laws and regulations.
We are subject to a variety of laws, rules and regulations related to the use, storage, handling, discharge and disposal of certain chemicals and gases used in our manufacturing process. Any of those regulations could require us to acquire expensive equipment or to incur substantial other expenses to comply with them. If we incur substantial additional expenses, product costs could significantly increase. Failure to comply with present or future environmental laws, rules and regulations could result in fines, suspension of production or cessation of operations.
Nathan Zommer, Ph.D. owns a significant interest in our common stock.
Nathan Zommer, Ph.D., our Chief Executive Officer, beneficially owned, as of May 23, 2016, approximately 21.4% of the outstanding shares of our common stock. As a result, Dr. Zommer can exercise significant control over all matters requiring stockholder approval, including the election of the Board of Directors. His holdings could result in a delay of, or serve as a deterrent to, any change in control of our company, which may reduce the market price of our common stock.
Our stock price is volatile.
The market price of our common stock has fluctuated significantly to date. The future market price of our common stock may also fluctuate significantly in the event of:
| • | variations in our actual or expected quarterly operating results; |
| • | announcements or introductions of new products; |
| • | technological innovations by our competitors or development setbacks by us; |
| • | conditions in semiconductor markets; |
| • | the commencement or adverse outcome of litigation; |
| • | changes in analysts’ estimates of our performance or changes in analysts’ forecasts regarding our industry, competitors or customers; |
| • | announcements of merger or acquisition transactions or a failure to achieve the expected benefits of an acquisition as rapidly or to the extent anticipated by participants in the stock market; |
| • | terrorist attack or war; |
| • | sales of our common stock by one or more members of management, including Nathan Zommer, Ph.D., our Chief Executive Officer; or |
| • | general economic and market conditions. |
In addition, the stock market in recent years has experienced extreme price and volume fluctuations that have affected the market prices of many high technology companies, including semiconductor companies. These fluctuations have often been unrelated or disproportionate to the operating performance of companies in our industry, and could harm the market price of our common stock.
26
Table of Contents
The anti-takeover provisions of our certificate of incorporation and of the Delaware General Corporation Law may delay, defer or prevent a change of control.
Our Board of Directors has the authority to issue up to 5,000,000 shares of preferred stock and to determine the price, rights, preferences, privileges and restrictions, including voting rights, of those shares without any further vote or action by our stockholders. The rights of the holders of common stock will be subject to, and may be harmed by, the rights of the holders of any shares of preferred stock that may be issued in the future. The issuance of preferred stock may delay, defer or prevent a change in control because the terms of any issued preferred stock could potentially prohibit our consummation of any merger, reorganization, sale of substantially all of our assets, liquidation or other extraordinary corporate transaction, without the approval of the holders of the outstanding shares of preferred stock. In addition, the issuance of preferred stock could have a dilutive effect on our stockholders.
Our stockholders must give substantial advance notice prior to the relevant meeting to nominate a candidate for director or present a proposal to our stockholders at a meeting. These notice requirements could inhibit a takeover by delaying stockholder action. The Delaware anti-takeover law restricts business combinations with some stockholders once the stockholder acquires 15% or more of our common stock. The Delaware statute makes it more difficult for us to be acquired without the consent of our Board of Directors and management.
Item 1B. Unresolved Staff Comments
None.
Our principal facilities are described below:
| Principal Facilities |
Approximate Square Footage |
Lease Expiration | Use | |||||
| Beverly, Massachusetts |
83,000 | (1) | Research and development, manufacturing, sales and distribution | |||||
| Chippenham, England |
100,000 | December 2022 | Research and development, manufacturing, sales and distribution | |||||
| Lampertheim, Germany |
170,000 | (1) | Research and development, manufacturing, sales and distribution | |||||
| Manila, Philippines |
43,000 | August 2016 | Product testing and global support | |||||
| Milpitas, California |
51,000 | (1) | Corporate headquarters, research and development, sales and distribution | |||||
| (1) | Owned, not leased. |
We believe that our current facilities are suitable to our needs and will be adequate through at least fiscal year 2017 and that suitable additional or replacement space will be available in the future as needed on commercially reasonable terms. The Lampertheim property serves as collateral for a loan, and is subject to a security interest.
We currently are involved in a variety of legal matters that arise in the normal course of business. Based on information currently available, management does not believe that the ultimate resolution of these matters will have a material adverse effect on our financial condition, results of operations and cash flows. Were an unfavorable ruling to occur, there exists the possibility of a material adverse impact on the results of operations of the period in which the ruling occurs.
Item 4. Mine Safety Disclosures
Not Applicable.
27
Table of Contents
Executive Officers of the Registrant
The executive officers, their ages and positions at our company, as well as certain biographical information of these individuals, are set forth below. The ages of the individuals are provided as of March 31, 2016.
| Name |
Age | Positions | ||
| Nathan Zommer |
68 | Chairman of the Board and Chief Executive Officer | ||
| Uzi Sasson |
53 | President, Chief Financial Officer, Secretary and Director |
There are no family relationships among our directors and executive officers.
Nathan Zommer. Dr. Zommer, our founder, has served as a Director since our inception in 1983, and has served as Chairman of the Board and Chief Executive Officer since 1993. From 1993 to 2009, Dr. Zommer served as our President and, from 1984 to 1993, Dr. Zommer served as our Executive Vice President. Prior to founding our company, Dr. Zommer served in a variety of positions with Intersil, Hewlett-Packard and General Electric, including as a scientist in the Hewlett-Packard Laboratories and Director of the Power MOS Division for Intersil/General Electric. Dr. Zommer received his B.S. and M.S. degrees in Physical Chemistry from Tel Aviv University and a Ph.D. in Electrical Engineering from Carnegie Mellon University.
Uzi Sasson. Mr. Sasson has served as our President since December 2009 and our Chief Financial Officer and Secretary since November 2004. He has been a Director since June 2015 and he was also a director from August to November 2004. From November 2004 to December 2009, Mr. Sasson was our Vice President and, from June 2007 to August 2010, Mr. Sasson held the title of Chief Operating Officer. Although he no longer formally holds that title, he continues to function in that role. Prior to joining our company, Mr. Sasson worked in tax, accounting and finance for technology and accounting firms. Mr. Sasson has a Master of Science in Taxation and a Bachelor of Science in Accounting from Golden Gate University and is a Certified Public Accountant in California.
PART II
| Item 5. Market | for Registrant’s Common Equity, Related Stockholder Matters and Issuer Purchases of Equity Securities |
Our common stock is traded on the NASDAQ Global Select Market under the symbol “IXYS.” The following table presents, for the periods indicated, the intraday high and low sale prices per share of our common stock as reported by the NASDAQ Global Select Market:
| First Quarter | Second Quarter | Third Quarter | Fourth Quarter | |||||||||||||
| Fiscal Year Ended March 31, 2016 |
||||||||||||||||
| High |
$ | 16.76 | $ | 15.62 | $ | 14.00 | $ | 12.60 | ||||||||
| Low |
$ | 11.05 | $ | 10.00 | $ | 10.84 | $ | 10.03 | ||||||||
| Fiscal Year Ended March 31, 2015 |
||||||||||||||||
| High |
$ | 12.99 | $ | 13.37 | $ | 13.03 | $ | 12.74 | ||||||||
| Low |
$ | 10.18 | $ | 10.48 | $ | 9.22 | $ | 11.11 | ||||||||
The number of record holders of our common stock as of May 23, 2016 was 242. During fiscal 2016, we paid a quarterly cash dividend of $0.035 per share for the quarter ended June 30, 2015 and a quarterly cash dividend of $0.04 for the remaining quarters of the year. The quarterly dividend is at the discretion of the Board of Directors. During fiscal 2015, we paid a quarterly cash dividend of $0.03 per share for the quarter ended June 30, 2014 and a quarterly cash dividend of $0.035 for the remaining quarters of the year.
28
Table of Contents
Stock Performance Graph
The line graph below shows the total stockholder return of an investment of $100 in cash for the period from March 31, 2011 through March 31, 2016 for (i) our common stock, (ii) the NASDAQ Composite Index and (iii) the Standard & Poor’s Semiconductors Index. All values assume reinvestment of the full amount of all dividends and are calculated as of March 31 of each year. Historical stock price performance should not be relied upon as indicative of future stock price performance.
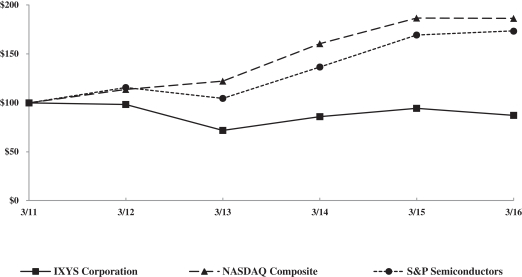
Issuer Purchases of Equity Securities
| Period |
(a) Total Number of Shares Purchased |
(b) Average Price Paid per Share |
(c) Total Number of Shares Purchased as Part of Publicly Announced Plans or Programs |
(d) Maximum Number (or Approximate Dollar Value) of Shares that May Yet Be Purchased Under the Plans or Programs(1) |
||||||||||||
| January 1, 2016 – January 31, 2016 |
— | — | — | 1,012,269 | ||||||||||||
| February 1, 2016 – February 28, 2016 |
179,691 | $ | 10.64 | 179,691 | 832,578 | |||||||||||
| March 1, 2016 – March 31, 2016 |
— | — | — | 832,578 | ||||||||||||
|
|
|
|
|
|
|
|||||||||||
| Total |
179,691 | $ | 10.64 | 179,691 | ||||||||||||
|
|
|
|
|
|
|
|||||||||||
| (1) | On August 24, 2012, our Board of Directors authorized a new program to repurchase up to 1,000,000 shares of our common stock. This program concluded during February 2016. On August 28, 2015, our Board of Directors authorized another program to repurchase up to 1,000,000 shares of our common stock. |
29
Table of Contents
Item 6. Selected Financial Data
The following selected consolidated financial information should be read in conjunction with our consolidated financial statements and related notes and Management’s Discussion and Analysis of Financial Condition and Results of Operations included elsewhere in this Annual Report on Form 10-K. The consolidated statements of operations data for the years ended March 31, 2016, 2015 and 2014, and the balance sheet data as of March 31, 2016 and 2015 are derived from our consolidated financial statements included elsewhere in this Annual Report on Form 10-K. The statements of operations data for the years ended March 31, 2013 and 2012 and the balance sheet data as of March 31, 2014, 2013 and 2012 are derived from our consolidated financial statements that are not included in this Annual Report on Form 10-K. Historical results are not necessarily indicative of results to be expected in any future period.
| Year Ended March 31, | ||||||||||||||||||||
| 2016 | 2015 | 2014(1) | 2013 | 2012 | ||||||||||||||||
| (In thousands, except per share amounts) | ||||||||||||||||||||
| Statement of Operations Data: |
||||||||||||||||||||
| Net revenues |
$ | 317,209 | $ | 338,767 | $ | 336,330 | $ | 280,014 | $ | 368,004 | ||||||||||
| Cost of goods sold |
217,451 | 236,802 | 236,120 | 195,134 | 248,760 | |||||||||||||||
|
|
|
|
|
|
|
|
|
|
|
|||||||||||
| Gross profit |
99,758 | 101,965 | 100,210 | 84,880 | 119,244 | |||||||||||||||
|
|
|
|
|
|
|
|
|
|
|
|||||||||||
| Operating expenses: |
||||||||||||||||||||
| Research, development and engineering |
29,986 | 26,667 | 30,884 | 28,022 | 28,847 | |||||||||||||||
| Selling, general and administrative |
38,384 | 41,810 | 41,983 | 39,287 | 42,063 | |||||||||||||||
| Amortization of acquisition-related intangible assets |
5,555 | 5,978 | 10,521 | 2,244 | 2,524 | |||||||||||||||
| Impairment charges |
— | — | — | — | 6,448 | |||||||||||||||
|
|
|
|
|
|
|
|
|
|
|
|||||||||||
| Total operating expenses |
73,925 | 74,455 | 83,388 | 69,553 | 79,882 | |||||||||||||||
|
|
|
|
|
|
|
|
|
|
|
|||||||||||
| Operating income |
25,833 | 27,510 | 16,822 | 15,327 | 39,362 | |||||||||||||||
| Other expense: |
||||||||||||||||||||
| Interest expense, net |
(1,429 | ) | (1,157 | ) | (1,422 | ) | (604 | ) | (762 | ) | ||||||||||
| Other income (expense) |
(915 | ) | 4,077 | (1,941 | ) | (41 | ) | 1,941 | ||||||||||||
|
|
|
|
|
|
|
|
|
|
|
|||||||||||
| Income before income tax provision |
23,489 | 30,430 | 13,459 | 14,682 | 40,541 | |||||||||||||||
| Provision for income tax |
(8,748 | ) | (6,690 | ) | (7,413 | ) | (7,034 | ) | (10,235 | ) | ||||||||||
|
|
|
|
|
|
|
|
|
|
|
|||||||||||
| Net income |
$ | 14,741 | $ | 23,740 | $ | 6,046 | $ | 7,648 | $ | 30,306 | ||||||||||
|
|
|
|
|
|
|
|
|
|
|
|||||||||||
| Net income per share — basic |
$ | 0.47 | $ | 0.75 | $ | 0.19 | $ | 0.25 | $ | 0.97 | ||||||||||
|
|
|
|
|
|
|
|
|
|
|
|||||||||||
| Net income per share — diluted |
$ | 0.46 | $ | 0.74 | $ | 0.19 | $ | 0.24 | $ | 0.93 | ||||||||||
|
|
|
|
|
|
|
|
|
|
|
|||||||||||
| Cash dividends per share |
$ | 0.155 | $ | 0.135 | $ | 0.12 | $ | 0.06 | $ | — | ||||||||||
|
|
|
|
|
|
|
|
|
|
|
|||||||||||
| Weighted average shares used in per share calculations |
||||||||||||||||||||
| Basic |
31,579 | 31,531 | 31,146 | 31,025 | 31,344 | |||||||||||||||
|
|
|
|
|
|
|
|
|
|
|
|||||||||||
| Diluted |
32,381 | 32,239 | 31,916 | 31,695 | 32,496 | |||||||||||||||
|
|
|
|
|
|
|
|
|
|
|
|||||||||||
| (1) | During fiscal 2014, we acquired a microcontroller product line from Samsung Electronics Co., Ltd. |
30
Table of Contents
| As of March 31, | ||||||||||||||||||||
| 2016 | 2015 | 2014(1) | 2013 | 2012 | ||||||||||||||||
| (In thousands) | ||||||||||||||||||||
| Selected operating data: |
||||||||||||||||||||
| Gross profit margin |
31.4 | % | 30.1 | % | 29.8 | % | 30.3 | % | 32.4 | % | ||||||||||
| Depreciation and amortization |
$ | 13,981 | $ | 17,311 | $ | 21,274 | $ | 12,492 | $ | 13,467 | ||||||||||
| Balance sheet data: |
||||||||||||||||||||
| Cash and cash equivalents |
$ | 155,806 | $ | 121,164 | $ | 98,438 | $ | 107,116 | $ | 98,604 | ||||||||||
| Working capital |
253,820 | 169,096 | 177,684 | 188,111 | 199,688 | |||||||||||||||
| Total assets |
422,701 | 373,855 | 383,182 | 333,476 | 343,910 | |||||||||||||||
| Total long-term obligations |
108,896 | 27,760 | 43,204 | 31,640 | 48,784 | |||||||||||||||
| Total stockholders’ equity |
279,295 | 267,301 | 270,632 | 253,608 | 254,107 | |||||||||||||||
| Cash flow data: |
||||||||||||||||||||
| Cash provided by operating activities |
$ | 29,593 | $ | 48,194 | $ | 19,329 | $ | 31,637 | $ | 44,446 | ||||||||||
| Cash used in investing activities |
(22,196 | ) | (15,077 | ) | (27,134 | ) | (11,082 | ) | (12,375 | ) | ||||||||||
| Cash provided by (used in) financing activities |
25,977 | (5,129 | ) | (3,344 | ) | (10,856 | ) | (7,707 | ) | |||||||||||
| (1) | During fiscal 2014, we acquired a microcontroller product line from Samsung Electronics Co., Ltd. |
| ITEM 7. Management’s | Discussion and Analysis of Financial Condition and Results of Operations |
This discussion contains forward-looking statements, which are subject to certain risks and uncertainties, including, without limitation, those described elsewhere in this Form 10-K and, in particular, in Item 1A of Part I hereof. Actual results may differ materially from the results discussed in the forward-looking statements. For a discussion of risks that could affect future results, see “Item 1A. Risk Factors.” All forward-looking statements included in this document are made as of the date hereof, based on the information available to us as of the date hereof, and we assume no obligation to update any forward-looking statement, except as may be required by law.
Overview
We are a multi-market integrated semiconductor company. Our three principal product groups are: power semiconductors; ICs; and systems and RF power semiconductors.
Our power semiconductors improve system efficiency and reliability by converting electricity at relatively high voltage and current levels into the finely regulated power required by electronic products. We focus on the market for power semiconductors that are capable of processing greater than 200 watts of power.
We also design, manufacture and sell integrated circuits for a variety of applications. Our microcontrollers provide application-specific, embedded system-on-chip, solutions for the industrial and consumer markets. Our analog and mixed-signal ICs are principally used in telecommunications applications. Our mixed-signal ASICs address the requirements of the medical imaging equipment and display markets. Our power management and control ICs are used in conjunction with our power semiconductors.
Our systems include laser diode drivers, high voltage pulse generators and modulators, and high power subsystems, sometimes known as stacks, that are principally based on our high power semiconductor devices. Our RF power semiconductors enable circuitry that amplifies or receives radio frequencies in wireless and other microwave communication applications, medical imaging applications and defense and space applications.
From fiscal 2015 to fiscal 2016, our revenues decreased. The reduction in revenues reflected reduced sales in all of our major geographic areas and in all major product lines. The gross profit margin increased during fiscal 2016. This was primarily due to a shift in product mix towards higher-margin products and improved utilization of our capacity. In addition, our selling expenses decreased in accordance with the reduction in commissionable revenues. Our general and administrative expenses decreased, mainly because of lower bad debt expenses and reduced legal fees. Our research, development and engineering expenses, or R&D expenses,
31
Table of Contents
increased largely due to added expenses related to the acquisition of RadioPulse in fiscal 2016. Over the next year, we expect our selling expenses to vary with changing revenues. Excluding certain items such as the settlement of bad debt expense, we expect our general and administrative expenses to remain relatively consistent. Similarly, we expect our R&D expenses to remain fairly consistent.
Critical Accounting Policies and Significant Management Estimates
The discussion and analysis of our financial condition and results of operations are based upon our unaudited condensed consolidated financial statements, which have been prepared in accordance with accounting principles generally accepted in the United States of America. The preparation of these financial statements requires management to make estimates and judgments that affect the reported amounts of assets, liabilities, revenues and expenses, and related disclosures of contingent assets and liabilities. On an ongoing basis, management evaluates the reasonableness of its estimates. Management bases its estimates on historical experience and on various assumptions that are believed to be reasonable under the circumstances, the results of which form the basis for making judgments about the carrying values of assets and liabilities that are not readily available from other sources. Actual results may differ materially from these estimates under different assumptions or conditions.
We believe the following critical accounting policies require that we make significant judgments and estimates in preparing our consolidated financial statements.
Revenue recognition. Revenue is recognized when there is persuasive evidence that an arrangement exists, when delivery has occurred, when the price to the buyer is fixed or determinable and when collectability of the receivable is reasonably assured. These elements are typically met when title to the products is passed to the buyer, which is generally when product is shipped to the customer with sale terms ex-works, or EXW, or when product is delivered to the customer with sales terms delivered duty paid, or DDP.
We sell to distributors and original equipment manufacturers, or OEMs. Approximately 56.7% of our revenues in fiscal 2016 were from distributors. We provide some of our distributors with the following programs: stock rotation and ship and debit.
Reserves for sales returns and allowances, including allowances for so called “ship and debit” transactions, are recorded at the time of shipment, and are based on historical levels of returns and current economic trends and changes in customer demand.
Accounts receivable from distributors are recognized and inventory is relieved when title to inventories transfer, typically upon shipment from us, at which point we have a legally enforceable right to collection under normal payment terms. Under certain circumstances, where we are not able to reasonably and reliably estimate the actual returns, revenues and costs relating to distributor sales are deferred until products are sold by the distributors to the distributors’ end customers. Deferred amounts would be presented and included under “Accrued expenses and other liabilities.”
We state our revenues net of any taxes collected from customers that are required to be remitted to various government agencies. The amount of taxes collected from customers and payable to governmental entities is included under “Accrued expenses and other liabilities.”
Allowance for sales returns. We maintain an allowance for sales returns based on estimated product returns by our customers. We estimate our allowance for sales returns based on our historical return experience, current economic trends, changes in customer demand, known returns we have not received and other assumptions. If we were to make different judgments or utilize different estimates, the amount and timing of our revenues could be materially different. Given that our revenues consist of a high volume of relatively similar products, to date our actual returns and allowances have not fluctuated significantly from period to period, and our returns provisions have historically been reasonably accurate. This allowance is included as part of the accounts receivable allowance on the balance sheet and as a reduction of revenues in the statement of operations.
Allowance for stock rotation. We also provide “stock rotation” to select distributors. The rotation allows distributors to return a percentage of the previous six months’ sales in exchange for orders of an equal or greater amount. In the fiscal years ended March 31, 2016, 2015 and 2014, approximately $1.5 million, $1.7 million and
32
Table of Contents
$1.5 million, respectively, of products were returned to us under the program. We establish the allowance for sales to distributors except in cases where the revenue recognition is deferred and recognized upon sale by the distributor of products to the end-customer. The allowance, which is management’s best estimate of future returns, is based upon the historical experience of returns and inventory levels at the distributors. This allowance is included as part of the accounts receivable allowance on the balance sheet and as a reduction of revenues in the statement of operations. Should distributors increase stock rotations beyond our estimates, these statements would be adversely affected.
Allowance for ship and debit. Ship and debit is a program designed to assist distributors in meeting competitive prices in the marketplace on sales to their end-customers. Ship and debit requires a request from the distributor for a pricing adjustment for a specific part for a customer sale to be shipped from the distributor’s stock. We have no obligation to accept this request. However, it is our historical practice to allow some companies to obtain pricing adjustments for inventory held. We receive periodic statements regarding our products held by our distributors. Ship and debit authorizations may cover current and future distributor activity for a specific part for sale to a distributor’s customer. At the time we record sales to distributors, we provide an allowance for the estimated future distributor activity related to such sales since it is probable that such sales to distributors will result in ship and debit activity. The sales allowance requirement is based on sales during the period, credits issued to distributors, distributor inventory levels, historical trends, market conditions, pricing trends we see in our direct sales activity with original equipment manufacturers and other customers, and input from sales, marketing and other key management. We believe that the analysis of these inputs enables us to make reliable estimates of future credits under the ship and debit program. This analysis requires the exercise of significant judgments. Our actual results to date have approximated our estimates. At the time the distributor ships the part from stock, the distributor debits us for the authorized pricing adjustment. This allowance is included as part of the accounts receivable allowance on the balance sheet and as a reduction of revenues in the statement of operations. If competitive pricing were to decrease sharply and unexpectedly, our estimates might be insufficient, which could adversely affect our operating results.
Additions to the ship and debit allowance are estimates of the amount of expected future ship and debit activity related to sales during the period. Additional allowances reduce revenues and gross profit in the period. The following table sets forth the beginning and ending balances of, additions to, and deductions from, our allowance for ship and debit during the three years ended March 31, 2016 (in thousands):
| Balance March 31, 2013 |
$ | 1,396 | ||
| Additions |
4,757 | |||
| Deductions |
(5,082 | ) | ||
|
|
|
|||
| Balance March 31, 2014 |
1,071 | |||
| Additions |
5,765 | |||
| Deductions |
(5,777 | ) | ||
|
|
|
|||
| Balance March 31, 2015 |
1,059 | |||
| Additions |
4,479 | |||
| Deductions |
(4,672 | ) | ||
|
|
|
|||
| Balance March 31, 2016 |
$ | 866 | ||
|
|
|
Allowance for doubtful accounts. We maintain an allowance for doubtful accounts for estimated losses from the inability of our customers to make required payments. We evaluate our allowance for doubtful accounts based on the aging of our accounts receivable, the financial condition of our customers and their payment history, our historical write-off experience and other assumptions. If we were to make different judgments of the financial condition of our customers or the financial condition of our customers were to deteriorate, resulting in an impairment of their ability to make payments, additional allowances may be required. This allowance is reported on the balance sheet as part of the accounts receivable allowance and is included on the statement of operations as part of selling, general and administrative expenses. This allowance is based on historical losses and management’s estimates of future losses.
33
Table of Contents
Inventories. Inventories are recorded at the lower of standard cost, which approximates actual cost on a first-in-first-out basis, or market value. Our accounting for inventory costing is based on the applicable expenditure incurred, directly or indirectly, in bringing the inventory to its existing condition. Such expenditures include acquisition costs, production costs and other costs incurred to bring the inventory to its use. As it is impractical to track inventory from the time of purchase to the time of sale for the purpose of specifically identifying inventory cost, our inventory is, therefore, valued based on a standard cost, given that many of the materials purchased are identical and interchangeable at various production processes. We review our standard costs on an as-needed basis but in any event at least once a year, and update them as appropriate to approximate actual costs. The authoritative guidance provided by FASB requires certain abnormal expenditures to be recognized as expenses in the current period instead of capitalized in inventory. It also requires that the amount of fixed production overhead allocated to inventory be based on the normal capacity of the production facilities.
We typically plan our production and inventory levels based on internal forecasts of customer demand, which are highly unpredictable and can fluctuate substantially. The value of our inventories is dependent on our estimate of future demand as it relates to historical sales. If our projected demand is overestimated, we may be required to reduce the valuation of our inventories below cost. We regularly review inventory quantities on hand and record an estimated provision for excess inventory based primarily on our historical sales and expectations for future use. We also recognize a reserve based on known technological obsolescence, when appropriate. Actual demand and market conditions may be different from those projected by our management. This could have a material effect on our operating results and financial position. If we were to make different judgments or utilize different estimates, the amount and timing of our write-down of inventories could be materially different. For example, during the fourth quarter of fiscal 2009, we examined our inventory and as a consequence of the dramatic retrenchment in some of our markets, certain of our inventory that normally would not be considered excess was considered as such. Therefore, we booked additional charges of about $14.9 million to recognize this exposure.
Excess inventory frequently remains saleable. When excess inventory is sold, it yields a gross profit margin of up to 100%. Sales of excess inventory have the effect of increasing the gross profit margin beyond that which would otherwise occur, because of previous write-downs. Once we have written down inventory below cost, we do not write it up when it is subsequently utilized, sold or scrapped. We do not physically segregate excess inventory nor do we assign unique tracking numbers to it in our accounting systems. Consequently, we cannot isolate the sales prices of excess inventory from the sales prices of non-excess inventory. Therefore, we are unable to report the amount of gross profit resulting from the sale of excess inventory or quantify the favorable impact of such gross profit on our gross profit margin.
34
Table of Contents
The following table provides information on our excess and obsolete inventory reserve charged against inventory at cost (in thousands):
| Balance at March 31, 2013 |
$ | 25,289 | ||
| Utilization or sale |
(1,579 | ) | ||
| Scrap |
(3,422 | ) | ||
| Additional provision |
3,503 | |||
| Foreign currency translation adjustments |
513 | |||
|
|
|
|||
| Balance at March 31, 2014 |
24,304 | |||
| Utilization or sale |
(1,637 | ) | ||
| Scrap |
(2,901 | ) | ||
| Additional provision |
4,487 | |||
| Foreign currency translation adjustments |
(1,500 | ) | ||
|
|
|
|||
| Balance at March 31, 2015 |
22,753 | |||
| Utilization or sale |
(2,455 | ) | ||
| Scrap |
(3,217 | ) | ||
| Additional provision |
4,125 | |||
| Foreign currency translation adjustments |
174 | |||
|
|
|
|||
| Balance at March 31, 2016 |
$ | 21,380 | ||
|
|
|
The practical efficiencies of wafer fabrication require the manufacture of semiconductor wafers in minimum lot sizes. Often, when manufactured, we do not know whether or when all the semiconductors resulting from a lot of wafers will sell. With more than 10,000 different part numbers for semiconductors, excess inventory resulting from the manufacture of some of those semiconductors will be continual and ordinary. Because the cost of storage is minimal when compared to potential value and because our products do not quickly become obsolete, we expect to hold excess inventory for potential future sale for years. Consequently, we have no set time line for the utilization, sale or scrapping of excess inventory.
In addition, our inventory is also being written down to the lower of cost or market or net realizable value. We review our inventory listing on a quarterly basis for an indication of losses being sustained for costs that exceed selling prices less direct costs to sell. When it is evident that our selling price is lower than current cost, inventory is marked down accordingly. At March 31, 2016 and 2015, our lower of cost or market reserves were $409,000 and $444,000, respectively.
Furthermore, we perform an annual inventory count and at certain locations periodic cycle counts for specific parts that have a high turnover. We also periodically identify any inventory that is no longer usable and write it off.
Valuation of Goodwill and Intangible Assets. Goodwill represents the excess of the purchase price over the estimated fair value of the net assets acquired. The costs of acquired intangible assets are recorded at fair value at acquisition. Intangible assets with finite lives are amortized using the straight-line method or accelerated method over their estimated useful lives and evaluated for impairment in accordance with the authoritative guidance provided by FASB.
Goodwill and intangible assets with indefinite lives are reviewed at least annually for impairment charges during the quarter ending March 31, or more frequently if events and circumstances indicate that the asset might be impaired, in accordance with the authoritative guidance provided by FASB. We first assess qualitative factors to determine whether it is necessary to perform the two-step fair value-based impairment test described below. If we believe that, as a result of its qualitative assessment, it is more likely than not that the fair value of a reporting unit is less than its carrying amount, the quantitative impairment test is required. Otherwise, no further testing is required.
Under the quantitative approach, there are two steps in the determination of the impairment of goodwill. The first step compares the carrying amount of the net assets to the fair value of the reporting unit. The second step, if
35
Table of Contents
necessary, recognizes an impairment loss to the extent the carrying value of the reporting unit’s net assets exceed the implied fair value of goodwill. An impairment loss would be recognized to the extent that the carrying amount exceeds the fair value of the reporting unit. We operate our business as one reporting unit.
We assess the recoverability of the finite-lived intangible assets by examining the occurrences of certain events or changes of circumstances that indicate that the carrying amounts may not be recoverable. After our initial assessment, if it is necessary, we perform the impairment test by determining whether the estimated undiscounted cash flows attributable to the assets in question are less than their carrying values. Impairment losses, if any, are measured as the amount by which the carrying values of the assets exceed their fair value and are recognized in operating results. If a useful life is determined to be shorter than originally estimated, we accelerate the rate of amortization and amortize the remaining carrying value over the new shorter useful life.
See Note 7, “Goodwill and Intangible Assets” in the Notes to Consolidated Financial Statements in Item 8 of this Annual Report on Form 10-K for a further discussion of the impairment analysis of goodwill and the related charges recorded.
Income tax. In preparing our consolidated financial statements, we are required to estimate our income taxes in each of the jurisdictions in which we operate. This process involves estimating our actual current tax exposure together with assessing temporary differences resulting from differing treatment of items for tax and accounting purposes. These differences result in deferred tax assets and liabilities, which are included within our unaudited condensed consolidated balance sheets. We then assess the likelihood that our deferred tax assets will be recovered from future taxable income and, to the extent we believe that recovery is not likely, we establish a valuation allowance. A valuation allowance reduces our deferred tax assets to the amount that management estimates is more likely than not to be realized. In determining the amount of the valuation allowance, we consider income over recent years, estimated future taxable income, feasible tax planning strategies and other factors in each taxing jurisdiction in which we operate. If we determine that it is more likely than not that we will not realize all or a portion of our remaining deferred tax assets, then we will increase our valuation allowance with a charge to income tax expense. Conversely, if we determine that it is likely that we will ultimately be able to utilize all or a portion of the deferred tax assets for which a valuation allowance has been provided, then the related portion of the valuation allowance will reduce income tax expense. Significant management judgment is required in determining our provision for income taxes and potential tax exposures, our deferred tax assets and liabilities and any valuation allowance recorded against our net deferred tax assets. In the event that actual results differ from these estimates or we adjust these estimates in future periods, we may need to establish a valuation allowance, which could materially impact our financial position and results of operations. Our ability to utilize our deferred tax assets and the need for a related valuation allowance are monitored on an ongoing basis.
Furthermore, computation of our tax liabilities involves examining uncertainties in the application of complex tax regulations. We recognize liabilities for uncertain tax positions based on the two-step process as prescribed by the authoritative guidance provided by FASB. The first step is to evaluate the tax position to determine whether there is sufficient available evidence to indicate if it is more likely than not that the position will be sustained on audit, including resolution of any related appeals or litigation processes. The second step requires us to measure and determine the approximate amount of the tax benefit at the largest amount that is more than 50% likely of being realized upon ultimate settlement with the tax authorities. It is inherently difficult and requires significant judgment to estimate such amounts, as this requires us to determine the probability of various possible outcomes. We reexamine these uncertain tax positions on a quarterly basis. This reassessment is based on various factors during the period including, but not limited to, changes in worldwide tax laws and treaties, changes in facts or circumstances, effectively settled issues under audit and any new audit activity. A change in recognition or measurement would result in the recognition of a tax benefit or an additional charge to the tax provision in the period.
Recent Accounting Pronouncements and Accounting Changes
For a description of accounting changes and recent accounting pronouncements, including the expected dates of adoption and estimated effects, if any, on our consolidated financial statements, see Note 2, “Summary of Significant Accounting Policies” in the Notes to Consolidated Financial Statements in Item 8 of this Annual Report on Form 10-K.
36
Table of Contents
Results of Operations
The following table sets forth selected consolidated statements of operations data for the fiscal years indicated and the percentage change in such data from year to year. These historical operating results may not be indicative of the results for any future period.
| Year Ended March 31, | ||||||||||||||||||||
| 2016 | % change | 2015 | % change | 2014 | ||||||||||||||||
| (000) | (000) | (000) | ||||||||||||||||||
| Net revenues |
$ | 317,209 | (6.4 | ) | $ | 338,767 | 0.7 | $ | 336,330 | |||||||||||
| Cost of goods sold |
217,451 | (8.2 | ) | 236,802 | 0.3 | 236,120 | ||||||||||||||
|
|
|
|
|
|
|
|
|
|
|
|||||||||||
| Gross profit |
$ | 99,758 | (2.2 | ) | $ | 101,965 | 1.8 | $ | 100,210 | |||||||||||
|
|
|
|
|
|
|
|
|
|
|
|||||||||||
| Operating expenses: |
||||||||||||||||||||
| Research, development and engineering |
$ | 29,986 | 12.4 | $ | 26,667 | (13.7 | ) | $ | 30,884 | |||||||||||
| Selling, general and administrative |
38,384 | (8.2 | ) | 41,810 | (0.4 | ) | 41,983 | |||||||||||||
| Amortization of acquisition-related intangible assets |
5,555 | (7.1 | ) | 5,978 | (43.2 | ) | 10,521 | |||||||||||||
|
|
|
|
|
|
|
|
|
|
|
|||||||||||
| Total operating expenses |
$ | 73,925 | (0.7 | ) | $ | 74,455 | (10.7 | ) | $ | 83,388 | ||||||||||
|
|
|
|
|
|
|
|
|
|
|
|||||||||||
The following table sets forth selected statements of operations data as a percentage of net revenues for the fiscal years indicated. These historical operating results may not be indicative of the results for any future period.
| Year Ending March 31, | ||||||||||||
| 2016 % of Net Revenues |
2015 % of Net Revenues |
2014 % of Net Revenues |
||||||||||
| Net revenues |
100.0 | 100.0 | 100.0 | |||||||||
| Cost of goods sold |
68.6 | 69.9 | 70.2 | |||||||||
|
|
|
|
|
|
|
|||||||
| Gross profit |
31.4 | 30.1 | 29.8 | |||||||||
|
|
|
|
|
|
|
|||||||
| Operating expenses: |
||||||||||||
| Research, development and engineering |
9.5 | 7.9 | 9.2 | |||||||||
| Selling, general and administrative |
12.1 | 12.3 | 12.5 | |||||||||
| Amortization of acquisition-related intangible assets |
1.7 | 1.8 | 3.1 | |||||||||
|
|
|
|
|
|
|
|||||||
| Total operating expenses |
23.3 | 22.0 | 24.8 | |||||||||
|
|
|
|
|
|
|
|||||||
| Operating income |
8.1 | 8.1 | 5.0 | |||||||||
| Other income (expense) |
(0.7 | ) | 0.9 | (1.0 | ) | |||||||
|
|
|
|
|
|
|
|||||||
| Income before income tax |
7.4 | 9.0 | 4.0 | |||||||||
| Provision for income tax |
(2.8 | ) | (2.0 | ) | (2.2 | ) | ||||||
|
|
|
|
|
|
|
|||||||
| Net income |
4.6 | 7.0 | 1.8 | |||||||||
|
|
|
|
|
|
|
|||||||
37
Table of Contents
The following table sets forth the revenues for each of our product groups for fiscal 2016, 2015 and 2014:
Net Revenues(1)
| Year Ended March 31, | ||||||||||||||||||||
| 2016 | % change | 2015 | % change | 2014 | ||||||||||||||||
| (000) | (000) | (000) | ||||||||||||||||||
| Power semiconductors |
$ | 213,347 | (2.8 | ) | $ | 219,445 | (1.5 | ) | $ | 222,813 | ||||||||||
| ICs |
84,078 | (12.0 | ) | 95,547 | 4.8 | 91,189 | ||||||||||||||
| Systems and RF power semiconductors |
19,784 | (16.8 | ) | 23,775 | 6.5 | 22,328 | ||||||||||||||
|
|
|
|
|
|
|
|
|
|
|
|||||||||||
| Total |
$ | 317,209 | (6.4 | ) | $ | 338,767 | 0.7 | $ | 336,330 | |||||||||||
|
|
|
|
|
|
|
|
|
|
|
|||||||||||
| (1) | Revenue information includes intellectual property revenues that are not included in average selling prices. |
The following tables set forth the average selling prices, or ASPs, and units for fiscal 2016, 2015 and 2014:
Average Selling Prices
| Year Ended March 31, | ||||||||||||||||||||
| 2016 | % change | 2015 | % change | 2014 | ||||||||||||||||
| Power semiconductors |
$ | 1.85 | (11.9 | ) | $ | 2.10 | 8.8 | $ | 1.93 | |||||||||||
| ICs |
$ | 0.45 | 2.3 | $ | 0.44 | (8.3 | ) | $ | 0.48 | |||||||||||
| Systems and RF power semiconductors |
$ | 49.83 | 45.9 | $ | 34.16 | 51.9 | $ | 22.49 | ||||||||||||
Units
| Year Ended March 31, | ||||||||||||||||||||
| 2016 | % change | 2015 | % change | 2014 | ||||||||||||||||
| (000) | (000) | (000) | ||||||||||||||||||
| Power semiconductors |
115,428 | 10.6 | 104,345 | (9.7 | ) | 115,596 | ||||||||||||||
| ICs |
184,443 | (14.8 | ) | 216,358 | 21.7 | 177,749 | ||||||||||||||
| Systems and RF power semiconductors |
397 | (43.0 | ) | 696 | (29.9 | ) | 993 | |||||||||||||
|
|
|
|
|
|
|
|
|
|
|
|||||||||||
| Total |
300,268 | (6.6 | ) | 321,399 | 9.2 | 294,338 | ||||||||||||||
|
|
|
|
|
|
|
|
|
|
|
|||||||||||
The following tables set forth the net revenues by geographic region for fiscal 2016, 2015 and 2014:
| Year Ended March 31, | ||||||||||||||||||||||||
| 2016 | 2015 | 2014 | ||||||||||||||||||||||
| Net Revenues |
% of Net Revenues |
Net Revenues |
% of Net Revenues |
Net Revenues |
% of Net Revenues |
|||||||||||||||||||
| (000) | (000) | (000) | ||||||||||||||||||||||
| Europe and Middle East |
$ | 92,323 | 29.1 | $ | 100,107 | 29.6 | $ | 99,049 | 29.4 | |||||||||||||||
| Asia Pacific |
140,342 | 44.2 | 143,066 | 42.2 | 135,641 | 40.3 | ||||||||||||||||||
| Rest of world |
8,550 | 2.7 | 10,280 | 3.0 | 11,906 | 3.6 | ||||||||||||||||||
|
|
|
|
|
|
|
|
|
|
|
|
|
|||||||||||||
| International revenues |
241,215 | 76.0 | 253,453 | 74.8 | 246,596 | 73.3 | ||||||||||||||||||
| USA |
75,994 | 24.0 | 85,314 | 25.2 | 89,734 | 26.7 | ||||||||||||||||||
|
|
|
|
|
|
|
|
|
|
|
|
|
|||||||||||||
| Total |
$ | 317,209 | 100.0 | $ | 338,767 | 100.0 | $ | 336,330 | 100.0 | |||||||||||||||
|
|
|
|
|
|
|
|
|
|
|
|
|
|||||||||||||
Comparison of Fiscal 2015 Revenues to Fiscal 2016 Revenues
From fiscal 2015 to fiscal 2016, net revenues declined by $21.6 million, or 6.4%. The decline was across all product groups and reflected a decrease of $6.1 million, or 2.8%, in the sale of power semiconductors, a decrease of $11.5 million, or 12.0%, in the sale of ICs and a decrease of $4.0 million, or 16.8%, in the sale of systems and RF power semiconductors.
38
Table of Contents
The decrease in power semiconductors was primarily due to a $10.0 million decrease in the sale of bipolar products, primarily to the industrial and commercial market, offset by a $4.5 million increase in the sale of power MOS transistors, principally to the industrial and commercial market. The decline in revenues from ICs was largely caused by reduced sales of microcontrollers. The revenues from the sale of systems and RF power semiconductors decreased primarily due to reduced sales of subassemblies to the industrial and commercial market and a decline in sales of RF power semiconductors.
From fiscal 2015 to fiscal 2016, the ASPs of ICs remained relatively unchanged while the changes in ASPs in power semiconductors and systems and RF power semiconductors were due to shifts in product mix. For the same periods, the changes in unit shipments of our power semiconductors and systems and RF power semiconductors were broad-based across product lines. The unit decline in ICs was primarily caused by reduced shipments of microcontrollers.
Intellectual property revenues, consisting of sales, licensing fees and royalties, were $933,000 for fiscal 2016 as compared to $1.2 million for fiscal 2015.
From fiscal 2015 to fiscal 2016, our sales to the medical market increased while sales to other major application markets declined. Geographically, we experienced reduced sales in all major geographic areas, including the U.S., Europe and the Middle East, and the Asia Pacific area.
In fiscal 2016 and 2015, a distributor accounted for 12.2% and 10.2% of our net revenues, respectively. In fiscal 2015, another distributor accounted for 10.5% of our net revenues.
Comparison of Fiscal 2014 Revenues to Fiscal 2015 Revenues
The $2.4 million increase in net revenues from fiscal 2014 to fiscal 2015 reflected a $4.4 million, or 4.8%, increase in the sale of ICs and a $1.4 million, or 6.5%, increase in the sale of systems and RF power semiconductors, offset by a $3.4 million, or 1.5%, decrease in the sale of power semiconductors.
The increase in revenues from the sale of ICs was primarily from the 8-bit microcontroller product line, or the Acquired MCU Business, that we acquired in fiscal 2014 and increased sales of solid state relays, offset by decreased sales of other microcontrollers and ASICs. The revenues from the sale of systems and RF power semiconductors increased primarily due to an increase in the sale of subassemblies to the industrial and commercial market. The decrease in power semiconductors was mainly due to a $6.2 million decrease in the sale of bipolar products, primarily to the industrial and commercial market, offset by a $2.7 million increase in the sale of MOS products, principally to the industrial and commercial market.
From fiscal 2014 to fiscal 2015, the increases in ASPs in power semiconductors and systems and RF power semiconductors were due to shifts in product mix toward higher-priced products. The reductions in the ASPs of ICs were mainly due to shifts in our product mix among microcontrollers and ASICs. For the same periods, the decreases in unit shipments of our power semiconductors and systems and RF power semiconductors were broad-based across product lines. Except for certain microcontroller product lines, we experienced growth in unit shipments across our IC product lines.
Intellectual property revenues, consisting of sales, licensing fees and royalties, were $1.2 million for fiscal 2015 as compared to $3.0 million for fiscal 2014.
From fiscal 2014 to fiscal 2015, our sales to the consumer products market increased while sales to other major application markets declined. Geographically, sales to Europe and the Middle East and the Asia Pacific region increased and sales to other geographic areas decreased.
In fiscal 2015 and 2014, one distributor accounted for 10.2% and 10.8% of our net revenues, respectively. In fiscal 2015, another distributor accounted for 10.5% of our net revenues.
Gross Profit
From fiscal 2015 to fiscal 2016, gross profit decreased by $2.2 million while the gross profit margin increased from 30.1% to 31.4%. The decrease in gross profit, measured in dollars, was largely because of lower net revenues. The higher gross profit margin was principally caused by favorable changes in product mix towards higher-margin products and improved utilization of our manufacturing facilities.
39
Table of Contents
From fiscal 2014 to fiscal 2015, gross profit increased by $1.8 million and the gross profit margin increased from 29.8% to 30.1%. The growth in gross profit, measured in dollars, was mainly because of increased net revenues. The higher gross profit margin was primarily due to favorable changes in product mix towards higher-margin products, offset by lower utilization of certain facilities and an increase in the provision for excess inventories.
In each of the last three years, our gross profit and gross profit margin were positively affected by the utilization and sale of excess inventory, which had previously been written down. See “Critical Accounting Policies and Significant Management Estimates — Inventories” elsewhere in the Management’s Discussion and Analysis of Financial Condition and Results of Operations.
Research, Development and Engineering
R&D expenses typically consist of internal engineering efforts for product design, process improvement and development. From fiscal 2015 to fiscal 2016, our R&D expenses increased by $3.3 million and increased from 7.9% to 9.5% as a percentage of net revenues. The increases were largely due to the $2.8 million acquisition of RadioPulse in fiscal 2016. From fiscal 2014 to fiscal 2015, R&D expenses decreased by $4.2 million and decreased from 9.2% to 7.9% as a percentage of net revenues. The decreases were mainly due to reduced personnel expenses and the completion of the development phase of a new manufacturing process.
Selling, General and Administrative
In fiscal 2016 as compared to fiscal 2015, selling, general and administrative expenses, or SG&A expenses decreased by approximately $3.4 million and decreased from 12.3% to 12.1% as a percentage of net revenues. The decreases were mainly due to lower bad debt expenses caused by a $2.7 million recovery in bankruptcy, lower selling expenses corresponding to the reduced revenues and lower legal expenses.
In fiscal 2015, as compared to fiscal 2014, SG&A expenses were largely unchanged but decreased from 12.5% to 12.3% as a percentage of net revenues. The decrease in the percentage was the result of higher net revenues.
Amortization of Acquired Intangible Assets
In May 2015, we acquired RadioPulse and recorded $2.9 million of identifiable intangible assets. During the quarter ended June 30, 2013, we completed the acquisition of the Acquired MCU Business and recorded $24.0 million of intangible assets. We also recorded certain intangible assets during fiscal 2010 in connection with the acquisition of Zilog. The intangible assets from these acquisitions are amortized based upon their estimated useful lives of up to 72 months. For fiscal 2016, 2015 and 2014, amortization expenses on acquisition-related intangible assets were $5.6 million, $6.0 million and $10.5 million, respectively. See Note 7, “Goodwill and Intangible Assets” in the Notes to Consolidated Financial Statements in Item 8 of this Annual Report on Form 10-K for further discussion regarding acquisition-related intangible assets.
Other Income (Expense)
In fiscal 2016, interest expense, net was $1.4 million as compared to $1.2 million in fiscal 2015 and $1.4 million in fiscal 2014. The increase in interest expense, net from fiscal 2015 to fiscal 2016 was primarily due to higher principal balances under the line of credit in fiscal 2016. The decrease in interest expense, net from fiscal 2014 to fiscal 2015 resulted from the repayments of the installment payments for the Acquired MCU Business and reduced capital leases, offset by increased interest expense on higher outstanding balance borrowed under the line of credit. See Note 8, “Borrowing and Installment Payment Arrangements” in the Notes to Consolidated Financial Statements in Item 8 of this Annual Report on Form 10-K for further information regarding the arrangement.
In fiscal 2016, other expense, net was $915,000 as compared to other income, net of $4.1 million in fiscal 2015 and other expense, net of $1.9 million in fiscal 2014, respectively. The other expense, net in fiscal 2016 consisted of primarily other than temporary write-down of our investments in marketable equity securities and losses associated with changes in exchange rates for foreign currency transactions. The other income, net in fiscal 2015 was primarily due to a $5.9 million gain associated with changes in exchange rates for foreign currency
40
Table of Contents
transactions, offset by a $1.9 million in other than temporary write-down of our investments in marketable equity securities. The other expense, net in fiscal 2014 mainly consisted of losses associated with changes in exchange rates for foreign currency transactions of $2.4 million, offset by income from investments.
Provision for Income Taxes
In fiscal 2016, the provision for income taxes reflected an effective tax rate of 37% as compared to 22% in fiscal 2015 and 55% in fiscal 2014. The fiscal 2016 tax rate increase was caused by an out-of-period adjustment of 6% and the recording of valuation allowances for net operating losses generated in foreign jurisdictions. The fiscal 2015 tax rate reflected higher income generated in certain foreign jurisdictions with lower tax rates. The fiscal 2014 tax rate was affected by a loss recognized in a lower tax rate jurisdiction and certain discrete items. The loss recognized in the lower tax jurisdiction was primarily due to amortization expenses resulting from the acquisition of the Acquired MCU Business. See Note 16, “Income Taxes” in the Notes to Consolidated Financial Statements in Item 8 of this Annual Report on Form 10-K for further discussion regarding provision for income taxes.
Liquidity and Capital Resources
At March 31, 2016, cash and cash equivalents were $155.8 million as compared to $121.2 million at March 31, 2015 and $98.4 million at March 31, 2014. Over the past three fiscal years, the cash generated by our operations, along with the borrowing under our revolving line of credit, has provided sufficient liquidity for our needs.
Our cash provided by operating activities in fiscal 2016 was $29.6 million as compared to $48.2 million in fiscal 2015 and $19.3 million in fiscal 2014. For fiscal 2016 as compared to fiscal 2015, the decrease in cash provided by operating activities of $18.6 million was primarily due to a decrease of $9.7 million in net changes in operating assets and liabilities and reduction of $8.9 million in net income and total adjustments to reconcile net income, which was primarily due to a $9.0 million decrease in net income.
Changes in assets and liabilities for fiscal 2016 compared to fiscal 2015 included a decrease in accounts receivable, mainly because of reduced revenues, and increases in prepaid expenses and inventory purchases that were, in large part, the result of an inventory build-up to meet expected customer demand in future periods.
For fiscal 2015 as compared to fiscal 2014, the increase in cash provided by operating activities of $28.9 million was primarily due to an increase of $15.1 million in net changes in operating assets and liabilities and an increase of $13.8 million in net income and total adjustments to reconcile net income, which was primarily due to a $17.7 million increase in net income, partially offset by a $5.8 million reduction caused by the foreign currency translation of intercompany transactions.
Changes in assets and liabilities for fiscal 2015 compared to fiscal 2014 included the following: Prepaid and other current assets decreased because of the timing of tax refunds, accounts receivables decreased due to the timing of revenues, accounts payable and inventories decreased due to a reduction in the purchase and manufacture of inventories and accrued expenses and other liabilities decreased in large part as a result of changes in income tax accruals.
We used $22.2 million in net cash for investing activities during fiscal 2016, as compared to $15.1 million in fiscal 2015 and $27.1 million in fiscal 2014. In fiscal 2016, 2015 and 2014, we spent $15.2 million, $8.2 million and $20.0 million, respectively, on the purchases of investments and business acquisitions and we spent $7.1 million, $7.0 million and $7.6 million on capital expenditures, respectively. Over the past three fiscal years, the capital expenditures were principally for equipment required to maintain or increase our production capacity.
For fiscal 2016, net cash provided by financing activities was $26.0 million, as compared to net cash used in financing activities of $5.1 million in fiscal 2015 and net cash used in financing activities of $3.3 million in fiscal 2014. In fiscal 2016, we received proceeds of $83.0 million from loans and $4.3 million from employee equity plans, offset by $48.1 million of principal repayments on capital lease and loan obligations, $8.4 million to purchase treasury stock and $4.9 million of cash dividends.
41
Table of Contents
In fiscal 2015, we drew an additional $30.0 million from our line of credit and we paid the two remaining installments due for the Acquired MCU Business. In addition, we used $4.3 million for payments of cash dividends to stockholders and $3.6 million for principal repayments on capital lease and loan obligations, offset by proceeds from employee equity plans of $2.6 million.
In fiscal 2014, we used $3.7 million for payments of cash dividends to stockholders, $2.6 million for principal repayments on capital lease obligations, $1.0 million for repayments of loans and $602,000 to purchase treasury stock, offset by proceeds from employee equity plans of $4.4 million.
At March 31, 2016, loans payable totaled $87.1 million. This represented 55.9% of our cash and cash equivalents and 31.2% of our stockholders’ equity. Over the past three fiscal years, satisfying our payment obligations for capital leases and loans payable did not materially affect our ability to fund our operating needs.
In June 2005, IXYS Semiconductor GmbH, our German subsidiary, borrowed €10.0 million, or about $12.2 million at the time, from IKB Deutsche Industriebank, or IKB. At March 31, 2015, the outstanding principal balance was €3.5 million, or about $3.8 million. In April 2015, we replaced the loan with a new loan from IKB. Under the new agreement, we borrowed €6.5 million, or about $7.2 million at the time. The loan has a term ending March 31, 2022 and bears a fixed annual interest rate of 1.75%. Each fiscal quarter a principal payment of €232,000, or about $263,000, and a payment of accrued interest are required. Financial covenants for a ratio of indebtedness to cash flow, a ratio of equity to total assets and a minimum stockholders’ equity for the German subsidiary must be satisfied for the loan to remain in good standing. The loan may be prepaid in whole or in part with a modest penalty. The loan is also collateralized by a security interest in the facility in Lampertheim, Germany. At March 31, 2016, we complied with all of these financial covenants. See Note 8, “Borrowing and Installment Payment Arrangements” in the Notes to Consolidated Financial Statements in Item 8 of this Annual Report on Form 10-K for further information regarding the new agreement.
On December 6, 2013, we entered into an Amended and Restated Credit Agreement with Bank of the West, or BOTW, for a revolving line of credit of $50.0 million. All amounts owed under the credit agreement were due and payable on November 30, 2015. On November 20, 2015, we entered into a Revolving Credit Agreement with a syndicate of banks for a revolving line of credit of $125.0 million. The agent for the banks is BOTW. The obligations are guaranteed by four of our subsidiaries. The loan is collateralized by a Contingent Collateral Agreement, under which the assets of the parent company and the four subsidiaries could be subject to security interests for the benefit of the banks in the event of a loan default. The Revolving Credit Agreement expires on November 20, 2017.
The new credit agreement provides different interest rate alternatives under which we may borrow funds. We may elect to borrow based on LIBOR plus a margin or an alternative base rate plus a margin. The margin can range from 0.75% to 2.5%, depending on interest rate alternatives and on our leverage of liabilities to effective tangible net worth. The applicable interest rate as of March 31, 2016 was 2.44%. An unused commitment fee is also payable. It ranges from 0.25% to 0.625% annually, depending on leverage.
The terms of the facility impose restrictions on the Company’s ability to undertake certain transactions, to create liens on assets and to incur subsidiary indebtedness. In addition, the credit agreement is subject to a set of financial covenants, including minimum effective tangible net worth, the ratio of cash, cash equivalents and accounts receivable to current liabilities, profitability, a leverage ratio and a minimum amount of U.S. domestic cash on hand. As of March 31, 2016 we complied with these financial covenants, except the leverage ratio. The banks waived a default under the Revolving Credit Agreement caused by the leverage ratio, which compared total funded indebtedness as of March 31, 2016 to EBITDA for the four fiscal quarters ended March 31, 2016. The leverage ratio minimally exceeded the contractually agreed ratio of 2:1.
At March 31, 2016, the outstanding principal balance under the revolving line of credit agreement was $80.0 million. $45.0 million of the balance was used to pay off the outstanding principal balance from the previous agreement. See Note 8, “Borrowing and Installment Payment Arrangements” in the Notes to Consolidated Financial Statements in Item 8 of this Annual Report on Form 10-K for further information regarding the new agreement. The credit agreement also includes a $10.0 million letter of credit subfacility. See Note 17, “Commitment and Contingencies” and Note 8, “Borrowing and Installment Payment Arrangements” in the Notes to Consolidated Financial Statements in Item 8 of this Annual Report on Form 10-K for further information regarding the terms of our credit arrangements.
42
Table of Contents
In fiscal 2016, 2015 and 2014, we paid $4.9 million, $4.3 million and $3.7 million in dividends, respectively, through a quarterly cash dividend of up to $0.04 per share. The quarterly dividend is at the discretion of the Board of Directors.
On May 1, 2015, we acquired RadioPulse. At closing, we paid a cash consideration of $14.7 million. The total consideration may also include earnout payments aggregating up to $6.0 million and payable over three years.
We assumed loans of approximately $2.4 million related to the acquisition of RadioPulse. These loans were primarily short-term facilities from financial institutions and carried a weighted average interest rate of 4.9%. The facilities have been partially secured by bank deposits that were classified as restricted cash on our consolidated balance sheets. The outstanding principal on these loans was $684,000 as of March 31, 2016 and was paid off in April 2016.
We assumed loans of approximately $723,000, related to an acquisition completed during the quarter ended June 30, 2014. The assumed borrowings were non-interest loans from government agencies to support the research and development activities with maturity dates varying from fiscal 2017 to fiscal 2021, other than a loan of $99,000 that we paid in full during the quarter ended September 30, 2014.
On June 27, 2013, we purchased the Acquired MCU Business. The aggregate purchase price for the transferred assets was $50.0 million. The closing payment was $20.0 million and we were obligated to pay $30.0 million in two installment payments of $15.0 million each. The first installment was paid on June 26, 2014 and the second installment was paid on December 23, 2014.
Additionally, we maintain three defined benefit pension plans: one in the United Kingdom, one in Germany and one in the Philippines. Benefits are based on years of service and the employees’ compensation. We either deposit funds for these plans with financial institutions, consistent with the requirements of local law, or accrue for the unfunded portion of the obligations. The United Kingdom and German plans have been curtailed. As such, the plans are closed to new entrants and no credit is provided for additional periods of service. The total pension liability accrued for the three plans at March 31, 2016 was $16.3 million. See Note 9, “Pension Plans” in the Notes to Consolidated Financial Statements in Item 8 of this Annual Report on Form 10-K for a discussion of the investment return assumptions, the underlying estimates and the expected future cash flows associated with the pension plans.
As of March 31, 2016, we had $155.8 million in cash and cash equivalents. We believe that our cash and cash equivalents, together with cash generated from operations, will be sufficient to meet our anticipated cash requirements for the next 12 months. Our liquidity could be negatively affected by a decline in demand for our products, increases in the cost of materials or labor, investments in new product development, the inability to renew or replace our revolving line of credit in whole or in part or one or more acquisitions. We occasionally use forward and option contracts in the normal course of business to manage our foreign currency exchange risks. We did not have any open foreign exchange forward and option contracts at March 31, 2016. There can be no assurance that additional debt or equity financing will be available when required or, if available, can be secured on terms satisfactory to us.
Off-Balance Sheet Arrangements
As of March 31, 2016 and 2015, we did not have any relationships with unconsolidated entities or financial partners, including entities often referred to as structured finance or special purpose entities, which would have been established for the purpose of facilitating off-balance sheet arrangements or other contractually narrow or limited purposes. As such, we are not materially exposed to any financing, liquidity, market or credit risk that could arise if we had engaged in such relationships.
43
Table of Contents
Disclosures about Contractual Obligations and Commercial Commitments
Details of our contractual obligations and commitments as of March 31, 2016 to make future payments under contracts are set forth below (in thousands):
| Contractual Obligations(1)(2) |
Payments Due by Period | |||||||||||||||||||
| Total | Less Than 1 Year |
1-3 Years | 3-5 Years | More than 5 Years |
||||||||||||||||
| Long term debt(3)(4) |
$ | 86,677 | $ | 1,120 | $ | 82,240 | $ | 2,267 | $ | 1,050 | ||||||||||
| Current debt(3) |
684 | 684 | — | — | — | |||||||||||||||
| Operating lease obligations |
5,384 | 1,385 | 2,136 | 1,344 | 519 | |||||||||||||||
| Other purchase obligations(5) |
25,334 | 24,489 | 845 | — | — | |||||||||||||||
|
|
|
|
|
|
|
|
|
|
|
|||||||||||
| Total |
$ | 118,079 | $ | 27,678 | $ | 85,221 | $ | 3,611 | $ | 1,569 | ||||||||||
|
|
|
|
|
|
|
|
|
|
|
|||||||||||
| (1) | Contractual obligations shown in the table above exclude benefit payments to participants of our defined benefit pension plans. We summarize the estimated benefit payments to be made by the plans over the next ten years in Note 9, “Pension Plans” in the Notes to Consolidated Financial Statements in Item 8 of this Annual Report on Form 10-K. The table also excludes contributions we made to defined benefit pension plans and our defined contribution plan. Our future contributions to these plans depend on many uncertain factors including future returns on the defined benefit plan assets and the amount and timing of employee and discretionary employer contributions to the defined contribution plan. We provide additional information about our defined benefit pension plans and our defined contribution plan, in Note 14, “Employee Savings and Retirement Plans” and Note 9, “Pension Plans” in the Notes to Consolidated Financial Statements in Item 8 of this Annual Report on Form 10-K. |
| (2) | We are unable to reliably determine the timing of future payments related to our uncertain tax positions. Therefore, $6.9 million of income taxes payable has been excluded from the table above. However, long term income taxes payable, included on our consolidated balance sheet, includes these uncertain tax payments. |
| (3) | Includes principal only since the interest rates are variable. See Note 8 “Borrowing and Installment Payment Arrangements” in the Notes to Consolidated Financial Statements in Item 8 of this Annual Report on Form 10-K for more details. |
| (4) | Includes approximately $304,000 of unamortized balance of debt issuance cost. See Note 8 “Borrowing and Installment Payment Arrangements” in the Notes to Consolidated Financial Statements in Item 8 of this Annual Report on Form 10-K for more details. |
| (5) | Represents commitments for purchase of inventory and property and equipment. These were not recorded as liabilities on our consolidated balance sheet as of March 31, 2016, as we had not yet received the related goods or taken title to the property. |
Item 7A. Quantitative and Qualitative Disclosures about Market Risk
We are exposed to various risks, including fluctuations in interest and foreign currency rates. In the normal course of business, we also face risks that are either non-financial or non-quantifiable. Such risks principally include country risks, credit risks and legal risks that are not discussed or quantified in the following analyses.
Other than some immaterial investments, we currently keep our funds in accounts and instruments that, for accounting purposes, are cash and cash equivalents and do not carry interest rate risk to the fair market value of principal. We may, in the future, choose to place our funds in investments in high quality debt securities, potentially consisting of debt instruments of the United States or state or local governments or investment grade corporate issuers. Investments in both fixed and floating rate securities have some degree of interest rate risk. Fixed rate securities may have their fair market value adversely impacted by increases in interest rates. Floating rate securities may produce less income than anticipated if interest rates fall. As a result, changes in interest rates could cause us to incur losses in principal if we are forced to sell securities that have declined in market value or may result in lower than anticipated investment income.
44
Table of Contents
We intend to manage our exposure to interest rate, market and credit risk in any investment portfolio with investment policies and procedures that limit such things as term, credit rating and the amount of credit exposure to any one issue, issuer and type of instrument. We have not used derivative financial instruments in any investment portfolio.
The impact on the fair market value of our cash equivalents and our earnings from a hypothetical 100 basis point adverse change in interest rates as of the end of fiscal 2016 would have had the effect of reducing our net income by an amount less than $1.0 million. Our cash and cash equivalents have historically been held in accounts and instruments where the principal was not subject to interest rate risk. The sensitivity analysis was accomplished by estimating the impact of a 100 basis point increase in interest rates on our variable rate borrowings while assuming no increase in interest income on our cash and cash equivalents.
We have interest rate risk from a $125.0 million revolving line of credit with BOTW. Borrowings may be repaid and re-borrowed during the term of the credit agreement. The obligations are guaranteed by four of our subsidiaries. All amounts owed under the credit agreement are due and payable on November 20, 2017. At March 31, 2016, the outstanding principal balance under the credit agreement was $80.0 million.
The credit agreement provides different interest rate alternatives under which we may borrow funds. We may elect to borrow based on LIBOR plus a margin or an alternative base rate plus a margin. The margin can range from 0.75% to 2.5%, depending on interest rate alternatives and on our leverage of liabilities to effective tangible net worth. The effective interest rate as of March 31, 2016 was 2.44%. An unused commitment fee is also payable. It ranges from 0.25% to 0.625% annually, depending on leverage.
Revenues from our foreign subsidiaries were approximately 50.4% of total revenues in fiscal 2016. To the extent not U.S. dollar denominated, these revenues are primarily denominated in Euros and British pounds. Our risk to foreign currencies is partially offset by the natural hedge of manufacturing and selling goods in the local currency. Most of our principal foreign subsidiaries use their respective local currencies as their functional currency.
Although from time to time we enter into a limited number of foreign exchange forward or option contracts to help manage foreign currency exchange risk associated with certain of our operations, we do not generally hedge foreign currency exchange rates. The foreign exchange forward or option contracts we have entered into generally have original maturities ranging from one to six months. We do not enter into these contracts for trading purposes and do not expect gains or losses on these contracts to have a material impact on our financial results.
A hypothetical 10% adverse fluctuation in the exchange rate between the Euro and the U.S. dollar and the exchange rate between the British pound and the U.S. dollar would have had the effect of reducing our net income as of the end of fiscal 2016 by less than $4.0 million. Because of the operation of our principal foreign units in their own functional currencies, this sensitivity analysis was undertaken by examining the net income or loss of the foreign units incorporated into our statement of operations and testing the impact of the hypothetical change in exchange rates on such income or loss. The hypothetically derived net income or loss of the foreign units was then calculated with our statement of operations data to derive the hypothetical impact on our net income. Additionally, the impact of the hypothetical change in exchange rates on the balance sheets of our principal foreign units was examined and the hypothetical transaction effects, using normal accounting practices, were incorporated into the analysis.
It is likely that our future financial results could be directly affected by changes in foreign currency exchange rates. We will continue to face foreign currency exchange risks in the future. Therefore, our financial results could be directly affected by weak economic conditions in foreign markets. In addition, a strengthening of the U.S. dollar, the Euro or the British pound could make our products less competitive in foreign markets.
45
Table of Contents
Item 8. Financial Statements and Supplementary Data
REPORT OF INDEPENDENT REGISTERED PUBLIC ACCOUNTING FIRM
Board of Directors and Stockholders
IXYS Corporation
Milpitas, California
We have audited the accompanying consolidated balance sheets of IXYS Corporation (the “Company”) as of March 31, 2016 and 2015 and the related consolidated statements of operations, comprehensive income (loss), stockholders’ equity, and cash flows for each of the three years in the period ended March 31, 2016. These financial statements are the responsibility of the Company’s management. Our responsibility is to express an opinion on these financial statements based on our audits.
We conducted our audits in accordance with the standards of the Public Company Accounting Oversight Board (United States). Those standards require that we plan and perform the audit to obtain reasonable assurance about whether the financial statements are free of material misstatement. An audit includes examining, on a test basis, evidence supporting the amounts and disclosures in the financial statements, assessing the accounting principles used and significant estimates made by management, as well as evaluating the overall financial statement presentation. We believe that our audits provide a reasonable basis for our opinion.
In our opinion, the consolidated financial statements referred to above present fairly, in all material respects, the financial position of IXYS Corporation at March 31, 2016 and 2015, and the results of its operations and its cash flows for each of the three years in the period ended March 31, 2016, in conformity with accounting principles generally accepted in the United States of America.
As discussed in Note 2 to the consolidated financial statements, the Company changed its method of presentation of deferred tax assets and liabilities in 2016 due to the adoption of Accounting Standards Update 2015-17, Income Taxes: Balance Sheet Classification of Deferred Taxes. This change was applied retrospectively to all periods presented.
We also have audited, in accordance with the standards of the Public Company Accounting Oversight Board (United States), IXYS Corporation’s internal control over financial reporting as of March 31, 2016, based on criteria established in Internal Control — Integrated Framework (2013) issued by the Committee of Sponsoring Organizations of the Treadway Commission (COSO) and our report dated June 8, 2016 expressed an unqualified opinion thereon
/s/ BDO USA, LLP
San Francisco, California
June 8, 2016
46
Table of Contents
IXYS CORPORATION
CONSOLIDATED BALANCE SHEETS
| March 31, | ||||||||
| 2016 | 2015 | |||||||
| (In thousands, except share data) |
||||||||
| ASSETS | ||||||||
| Current assets: |
||||||||
| Cash and cash equivalents |
$ | 155,806 | $ | 121,164 | ||||
| Restricted cash |
277 | 266 | ||||||
| Accounts receivable, net |
38,440 | 41,042 | ||||||
| Inventories |
89,604 | 82,005 | ||||||
| Prepaid expenses and other current assets |
4,203 | 3,413 | ||||||
|
|
|
|
|
|||||
| Total current assets |
288,330 | 247,890 | ||||||
| Property, plant and equipment, net |
42,623 | 42,545 | ||||||
| Intangible assets, net |
7,607 | 10,384 | ||||||
| Goodwill |
42,355 | 27,375 | ||||||
| Deferred income taxes |
28,024 | 31,957 | ||||||
| Other assets |
13,762 | 13,704 | ||||||
|
|
|
|
|
|||||
| Total assets |
$ | 422,701 | $ | 373,855 | ||||
|
|
|
|
|
|||||
| LIABILITIES AND STOCKHOLDERS’ EQUITY | ||||||||
| Current liabilities: |
||||||||
| Current portion of capitalized lease obligations |
$ | — | $ | 464 | ||||
| Current portion of loans payable |
1,804 | 45,790 | ||||||
| Accounts payable |
11,416 | 12,675 | ||||||
| Accrued expenses and other current liabilities |
21,290 | 19,865 | ||||||
|
|
|
|
|
|||||
| Total current liabilities |
34,510 | 78,794 | ||||||
| Long term loans, net of current portion |
85,253 | 3,433 | ||||||
| Pension liabilities |
16,307 | 17,232 | ||||||
| Other long term liabilities |
7,336 | 7,095 | ||||||
|
|
|
|
|
|||||
| Total liabilities |
143,406 | 106,554 | ||||||
|
|
|
|
|
|||||
| Commitments and contingencies (Note 17) |
||||||||
| Stockholders’ equity: |
||||||||
| Preferred stock, $0.01 par value: |
||||||||
| Authorized: 5,000,000 shares; none issued and outstanding |
— | — | ||||||
| Common stock, $0.01 par value: |
||||||||
| Authorized: 80,000,000 shares; 38,214,158 issued and 31,375,524 outstanding at March 31, 2016 and 38,116,884 issued and 31,674,782 outstanding at March 31, 2015 |
382 | 381 | ||||||
| Additional paid-in capital |
214,045 | 209,707 | ||||||
| Treasury stock, at cost: 6,838,634 common shares at March 31, 2016 and 6,442,102 common shares at March 31, 2015 |
(61,845 | ) | (56,833 | ) | ||||
| Retained earnings |
146,979 | 137,134 | ||||||
| Accumulated other comprehensive loss |
(20,266 | ) | (23,088 | ) | ||||
|
|
|
|
|
|||||
| Total stockholders’ equity |
279,295 | 267,301 | ||||||
|
|
|
|
|
|||||
| Total liabilities and stockholders’ equity |
$ | 422,701 | $ | 373,855 | ||||
|
|
|
|
|
|||||
The accompanying notes are an integral part of these consolidated financial statements.
47
Table of Contents
IXYS CORPORATION
CONSOLIDATED STATEMENTS OF OPERATIONS
| Year Ended March 31, | ||||||||||||
| 2016 | 2015 | 2014 | ||||||||||
| (In thousands, except per share data) | ||||||||||||
| Net revenues |
$ | 317,209 | $ | 338,767 | $ | 336,330 | ||||||
| Cost of goods sold |
217,451 | 236,802 | 236,120 | |||||||||
|
|
|
|
|
|
|
|||||||
| Gross profit |
99,758 | 101,965 | 100,210 | |||||||||
|
|
|
|
|
|
|
|||||||
| Operating expenses |
||||||||||||
| Research, development and engineering |
29,986 | 26,667 | 30,884 | |||||||||
| Selling, general and administrative |
38,384 | 41,810 | 41,983 | |||||||||
| Amortization of acquired intangible assets |
5,555 | 5,978 | 10,521 | |||||||||
|
|
|
|
|
|
|
|||||||
| Total operating expenses |
73,925 | 74,455 | 83,388 | |||||||||
|
|
|
|
|
|
|
|||||||
| Operating income |
25,833 | 27,510 | 16,822 | |||||||||
| Other income (expense) |
||||||||||||
| Interest income |
212 | 240 | 157 | |||||||||
| Interest expense |
(1,641 | ) | (1,397 | ) | (1,579 | ) | ||||||
| Other income (expense), net |
(915 | ) | 4,077 | (1,941 | ) | |||||||
|
|
|
|
|
|
|
|||||||
| Income before income tax provision |
23,489 | 30,430 | 13,459 | |||||||||
| Provision for income tax |
(8,748 | ) | (6,690 | ) | (7,413 | ) | ||||||
|
|
|
|
|
|
|
|||||||
| Net income |
$ | 14,741 | $ | 23,740 | $ | 6,046 | ||||||
|
|
|
|
|
|
|
|||||||
| Net income per share |
||||||||||||
| Basic |
$ | 0.47 | $ | 0.75 | $ | 0.19 | ||||||
|
|
|
|
|
|
|
|||||||
| Diluted |
$ | 0.46 | $ | 0.74 | $ | 0.19 | ||||||
|
|
|
|
|
|
|
|||||||
| Cash dividends per common share |
$ | 0.155 | $ | 0.135 | $ | 0.12 | ||||||
|
|
|
|
|
|
|
|||||||
| Weighted average shares used in per share calculation |
||||||||||||
| Basic |
31,579 | 31,531 | 31,146 | |||||||||
|
|
|
|
|
|
|
|||||||
| Diluted |
32,381 | 32,239 | 31,916 | |||||||||
|
|
|
|
|
|
|
|||||||
The accompanying notes are an integral part of these consolidated financial statements.
48
Table of Contents
IXYS CORPORATION
CONSOLIDATED STATEMENTS OF COMPREHENSIVE INCOME (LOSS)
| Year Ended March 31, | ||||||||||||
| 2016 | 2015 | 2014 | ||||||||||
| (in thousands) | ||||||||||||
| Net income |
$ | 14,741 | $ | 23,740 | $ | 6,046 | ||||||
| Foreign currency translation adjustments |
2,938 | (24,112 | ) | 7,553 | ||||||||
| Changes in market value of investments: |
||||||||||||
| Changes in unrealized gains (losses), net of tax expenses (benefits) of $(231) in 2016, $(825) in 2015 and $196 in 2014 |
(362 | ) | (1,536 | ) | 361 | |||||||
| Reclassification adjustment for net losses (gains) realized in net income, net of tax benefits (expenses) of $182 in 2016, $655 in 2015 and $(52) in 2014 |
273 | 1,218 | (96 | ) | ||||||||
|
|
|
|
|
|
|
|||||||
| Net changes in market value of investments |
(89 | ) | (318 | ) | 265 | |||||||
|
|
|
|
|
|
|
|||||||
| Changes in accumulated net actuarial income (loss): |
||||||||||||
| Changes in accumulated net actuarial income (loss), net of tax expenses (benefits) of $(634) in 2016, $(960) in 2015 and $8 in 2014 |
(71 | ) | (3,830 | ) | 89 | |||||||
| Reclassification adjustment for net losses realized in net income, net of tax benefits of $393 in 2016, $36 in 2015 and $21 in 2014 |
44 | 143 | 215 | |||||||||
|
|
|
|
|
|
|
|||||||
| Net changes in defined benefit plan accumulated net actuarial income (loss) |
(27 | ) | (3,687 | ) | 304 | |||||||
|
|
|
|
|
|
|
|||||||
| Other comprehensive income (loss) |
2,822 | (28,117 | ) | 8,122 | ||||||||
|
|
|
|
|
|
|
|||||||
| Total comprehensive income (loss) |
$ | 17,563 | $ | (4,377 | ) | $ | 14,168 | |||||
|
|
|
|
|
|
|
|||||||
The accompanying notes are an integral part of these consolidated financial statements.
49
Table of Contents
IXYS CORPORATION
CONSOLIDATED STATEMENTS OF STOCKHOLDERS’ EQUITY
(In thousands)
| Common Stock and Additional Paid-In Capital |
Treasury Shares | Treasury Amount | Retained Earnings | Accumulated Other Comprehensive Income (loss) |
Total Stockholders’ Equity |
|||||||||||||||||||||||
| Shares | Amount | |||||||||||||||||||||||||||
| Balances, March 31, 2013 |
37,921 | $ | 202,977 | 7,036 | $ | (61,994 | ) | $ | 115,718 | $ | (3,093 | ) | $ | 253,608 | ||||||||||||||
| Net income |
6,046 | 6,046 | ||||||||||||||||||||||||||
| Other comprehensive income |
8,122 | 8,122 | ||||||||||||||||||||||||||
| Stock-based compensation |
2,785 | 2,785 | ||||||||||||||||||||||||||
| Proceeds from sale of shares through employee equity incentive plans, related excess tax benefits and others |
96 | 908 | 908 | |||||||||||||||||||||||||
| Purchase of treasury stock |
60 | (602 | ) | (602 | ) | |||||||||||||||||||||||
| Re-issuance of treasury stock under stock compensation plans |
(433 | ) | 3,814 | (305 | ) | 3,509 | ||||||||||||||||||||||
| Dividend |
(3,744 | ) | (3,744 | ) | ||||||||||||||||||||||||
|
|
|
|
|
|
|
|
|
|
|
|
|
|
|
|||||||||||||||
| Balances, March 31, 2014 |
38,017 | 206,670 | 6,663 | (58,782 | ) | 117,715 | 5,029 | 270,632 | ||||||||||||||||||||
| Net income |
23,740 | 23,740 | ||||||||||||||||||||||||||
| Other comprehensive loss |
(28,117 | ) | (28,117 | ) | ||||||||||||||||||||||||
| Stock-based compensation |
2,867 | 2,867 | ||||||||||||||||||||||||||
| Proceeds from sale of shares through employee equity incentive plans, related excess tax benefits and others |
100 | 551 | 551 | |||||||||||||||||||||||||
| Re-issuance of treasury stock under stock compensation plans |
(221 | ) | 1,949 | (58 | ) | 1,891 | ||||||||||||||||||||||
| Dividend |
(4,263 | ) | (4,263 | ) | ||||||||||||||||||||||||
|
|
|
|
|
|
|
|
|
|
|
|
|
|
|
|||||||||||||||
| Balances, March 31, 2015 |
38,117 | 210,088 | 6,442 | (56,833 | ) | 137,134 | (23,088 | ) | 267,301 | |||||||||||||||||||
| Net income |
14,741 | 14,741 | ||||||||||||||||||||||||||
| Other comprehensive income |
2,822 | 2,822 | ||||||||||||||||||||||||||
| Stock-based compensation |
3,343 | 3,343 | ||||||||||||||||||||||||||
| Proceeds from sale of shares through employee equity incentive plans, related excess tax benefits and others |
97 | 996 | 996 | |||||||||||||||||||||||||
| Purchase of treasury stock |
772 | (8,352 | ) | (8,352 | ) | |||||||||||||||||||||||
| Re-issuance of treasury stock under stock compensation plans |
(375 | ) | 3,340 | 3,340 | ||||||||||||||||||||||||
| Dividend |
(4,896 | ) | (4,896 | ) | ||||||||||||||||||||||||
|
|
|
|
|
|
|
|
|
|
|
|
|
|
|
|||||||||||||||
| Balances, March 31, 2016 |
38,214 | $ | 214,427 | 6,839 | $ | (61,845 | ) | $ | 146,979 | $ | (20,266 | ) | $ | 279,295 | ||||||||||||||
|
|
|
|
|
|
|
|
|
|
|
|
|
|
|
|||||||||||||||
The accompanying notes are an integral part of these consolidated financial statements.
50
Table of Contents
IXYS CORPORATION
CONSOLIDATED STATEMENTS OF CASH FLOWS
| Year Ended March 31, | ||||||||||||
| 2016 | 2015 | 2014 | ||||||||||
| (In thousands) | ||||||||||||
| Cash flows from operating activities: |
||||||||||||
| Net income |
$ | 14,741 | $ | 23,740 | $ | 6,046 | ||||||
| Adjustments to reconcile net income to net cash provided by operating activities, net of assets acquired and liabilities assumed: |
||||||||||||
| Depreciation and amortization |
13,981 | 17,311 | 21,274 | |||||||||
| Provision for receivable allowances |
6,795 | 8,935 | 8,563 | |||||||||
| Write-down of marketable equity securities |
454 | 1,903 | 7 | |||||||||
| Net change in inventory provision |
1,576 | 2,852 | 1,724 | |||||||||
| Stock-based compensation |
3,343 | 2,867 | 2,785 | |||||||||
| Deferred income taxes |
3,768 | 1,340 | (551 | ) | ||||||||
| Tax impacts due to employee equity incentive plans |
— | (105 | ) | (152 | ) | |||||||
| Foreign currency adjustments on intercompany amounts and other non-cash items |
214 | (5,033 | ) | 312 | ||||||||
| Changes in operating assets and liabilities, net of business acquired: |
||||||||||||
| Accounts receivable |
(2,238 | ) | (7,342 | ) | (14,755 | ) | ||||||
| Inventories |
(7,702 | ) | (2,203 | ) | (6,296 | ) | ||||||
| Prepaid expenses and other current assets |
(1,219 | ) | 5,103 | (5,518 | ) | |||||||
| Other assets |
(101 | ) | 828 | (968 | ) | |||||||
| Accounts payable |
(2,173 | ) | (2,646 | ) | 2,067 | |||||||
| Accrued expenses and other liabilities |
(693 | ) | 2,058 | 5,698 | ||||||||
| Pension liabilities |
(1,153 | ) | (1,414 | ) | (907 | ) | ||||||
|
|
|
|
|
|
|
|||||||
| Net cash provided by operating activities |
29,593 | 48,194 | 19,329 | |||||||||
|
|
|
|
|
|
|
|||||||
| Cash flows from investing activities: |
||||||||||||
| Change in restricted cash |
88 | 71 | (23 | ) | ||||||||
| Purchase of businesses, net of cash and cash equivalents acquired and installment payments |
(14,571 | ) | (2,297 | ) | (20,000 | ) | ||||||
| Purchases of investments |
(629 | ) | (5,887 | ) | — | |||||||
| Purchases of plant and equipment |
(7,110 | ) | (7,018 | ) | (7,623 | ) | ||||||
| Proceeds from sale of investments |
26 | 54 | 512 | |||||||||
|
|
|
|
|
|
|
|||||||
| Net cash used in investing activities |
(22,196 | ) | (15,077 | ) | (27,134 | ) | ||||||
|
|
|
|
|
|
|
|||||||
| Cash flows from financing activities: |
||||||||||||
| Principal payments on capital lease obligations |
(472 | ) | (2,414 | ) | (2,570 | ) | ||||||
| Repayments of loans and notes payable |
(47,606 | ) | (1,144 | ) | (1,000 | ) | ||||||
| Installment payments for business acquisition |
— | (30,000 | ) | — | ||||||||
| Proceeds from loans |
82,967 | 30,000 | — | |||||||||
| Tax impacts due to employee equity incentive plans |
— | 105 | 152 | |||||||||
| Purchases of treasury stock |
(8,352 | ) | — | (602 | ) | |||||||
| Payments of cash dividends to stockholders |
(4,896 | ) | (4,263 | ) | (3,744 | ) | ||||||
| Proceeds from employee equity plans |
4,336 | 2,587 | 4,420 | |||||||||
|
|
|
|
|
|
|
|||||||
| Net cash provided by (used in) financing activities |
25,977 | (5,129 | ) | (3,344 | ) | |||||||
|
|
|
|
|
|
|
|||||||
| Effect of exchange rate fluctuations on cash and cash equivalents |
1,268 | (5,262 | ) | 2,471 | ||||||||
|
|
|
|
|
|
|
|||||||
| Net increase (decrease) in cash and cash equivalents |
34,642 | 22,726 | (8,678 | ) | ||||||||
| Cash and cash equivalents at beginning of the year |
121,164 | 98,438 | 107,116 | |||||||||
|
|
|
|
|
|
|
|||||||
| Cash and cash equivalents at end of the year |
$ | 155,806 | $ | 121,164 | $ | 98,438 | ||||||
|
|
|
|
|
|
|
|||||||
| Supplemental disclosure of cash flow information |
||||||||||||
| Cash paid during the period for interest |
$ | 1,992 | $ | 2,172 | $ | 801 | ||||||
| Cash paid during the period for income taxes |
$ | 5,669 | $ | 1,416 | $ | 4,760 | ||||||
The accompanying notes are an integral part of these consolidated financial statements.
51
Table of Contents
NOTES TO CONSOLIDATED FINANCIAL STATEMENTS
1. Description of Business
We design, develop, manufacture and market power semiconductors, digital and analog integrated circuits, or ICs, and systems and radio frequency, or RF, power semiconductors.
Power semiconductors are used primarily in controlling energy in motor drives, power conversion including uninterruptible power supplies, or UPS, and switch mode power supplies, or SMPS, and medical electronics. Our power semiconductors convert electricity at relatively high voltage and current levels to create efficient power as required by a specific application. Our target market includes segments of the power semiconductor market that require medium to high power semiconductors, with a particular emphasis on high power semiconductors. Our power semiconductors include power metal-oxide-silicon field-effect transistors, or MOSFETs, insulated-gate bipolar transistors, or IGBTs, thyristors and rectifiers, including fast-recovery epitaxial diodes, or FREDs. Our ICs include solid state relays, or SSRs, for telecommunications applications and power management and control ICs, such as current regulators, motion controllers, digital power modulators and drivers, and microcontrollers such as embedded flash microcontrollers and 8-bit microcontrollers. Our systems include laser diode drivers, high voltage pulse generators and modulators, and high power subsystems, sometimes known as stacks, that are principally based on our high power semiconductor devices.
We sell products in North America, Europe and Asia through an organization that includes direct sales personnel, independent representatives and distributors. We are headquartered in Northern California with principal operations in California, Massachusetts, Germany, the Philippines and the United Kingdom. Each site has manufacturing, research and development and sales and distribution activities. We also make use of subcontract manufacturers for fabrication of wafers and for assembly and test operations. Our fiscal years end March 31. References to any numerically identified year preceded by the word “fiscal” are references to the year ending on March 31 of such numerically identified year.
2. Summary of Significant Accounting Policies
Principles of Consolidation
The consolidated financial statements include the accounts of IXYS and our wholly-owned subsidiaries after elimination of all intercompany balances and transactions.
Foreign Currency Translation and Transaction
The local currency is considered to be the functional currency of some of our wholly-owned international subsidiaries. Among them, IXYS Semiconductor GmbH, or IXYS GmbH, utilizes the Euro as its functional currency, while IXYS UK Westcode Limited, or IXYS UK, utilizes the British pound sterling as its functional currency. For such subsidiaries, the assets and liabilities are translated at the exchange rate in effect at year-end and the revenues and expenses are translated at average rates during the year. Adjustments resulting from the translation of these accounts of these subsidiaries into U.S. dollars are included in accumulated other comprehensive income (loss), a separate component of stockholders’ equity. Foreign currency transaction gains and losses are included as a component of other income or expense. The functional currency is U.S. dollars for our other significant subsidiaries.
Use of Estimates
The preparation of consolidated financial statements in conformity with generally accepted accounting principles requires management to make estimates and assumptions that affect the reported amounts of assets and liabilities and disclosure of contingent assets and liabilities at the date of the financial statements and the reported amounts of revenues and expenses during the reporting period. Actual results could materially differ from our estimates. Areas where management uses subjective judgments include, but are not limited to, revenue reserves, inventory valuation, deferred income taxes and related valuation allowances, allocation of purchase price in business combinations, valuation of goodwill and identifiable intangible assets and asset impairment analysis.
52
Table of Contents
Revenue Recognition
Revenue is recognized when there is persuasive evidence that an arrangement exists, when delivery has occurred, when the price to the buyer is fixed or determinable and when collectability of the receivable is reasonably assured. These elements are typically met when title to the products is passed to the buyer, which is generally when product is shipped to the customer with sale terms ex-works, or EXW, or when product is delivered to the customer with sales terms delivered duty paid, or DDP.
We sell to distributors and original equipment manufacturers, or OEMs. Approximately 56.7% of our revenues in fiscal year ended March 31, 2016, or fiscal 2016, were from distributors. We provide some of our distributors with the following programs: stock rotation and ship and debit. Reserves for sales returns and allowances, including allowances for so called “ship and debit” transactions, are recorded at the time of shipment, and are based on historical levels of returns and current economic trends and changes in customer demand.
Accounts receivable from distributors are recognized and inventory is relieved when title to inventories transfers, typically upon shipment from us, at which point we have a legally enforceable right to collection under normal payment terms. Under certain circumstances where we are not able to reasonably and reliably estimate the actual returns, revenues and costs relating to distributor sales are deferred until products are sold by the distributors to the distributor’s end customers. Deferred amounts would be presented and included under “Accrued expenses and other liabilities.”
We state our revenues net of any taxes collected from customers that are required to be remitted to various government agencies. The amount of taxes collected from customers and payable to governmental entities is included under “Accrued expenses and other liabilities.” Shipping and handling costs are included in cost of sales.
Allowance for sales returns. We maintain an allowance for sales returns based on estimated product returns by our customers. We estimate our allowance for sales returns based on our historical return experience, current economic trends, changes in customer demand, known returns we have not received and other assumptions. If we were to make different judgments or utilize different estimates, the amount and timing of our revenues could be materially different. Given that our revenues consist of a high volume of relatively similar products, to date our actual returns and allowances have not fluctuated significantly from period to period and our returns provisions have historically been reasonably accurate. This allowance is included as part of the accounts receivable allowance on the balance sheet and as a reduction of revenues in the statement of operations.
Allowance for stock rotation. We also provide “stock rotation” to select distributors. The rotation allows distributors to return a percentage of the previous six months’ sales in exchange for orders of an equal or greater amount. In the fiscal years ended March 31, 2016, 2015 and 2014, approximately $1.5 million, $1.7 million and $1.5 million, respectively, of products were returned to us under the program. We establish the allowance for sales to distributors except in cases where the revenue recognition is deferred and recognized upon sale by the distributor of products to the end-customer. The allowance, which is management’s best estimate of future returns, is based upon the historical experience of returns and inventory levels at the distributors. This allowance is included as part of the accounts receivable allowance on the balance sheet and as a reduction of revenues in the statement of operations. Should distributors increase stock rotations beyond our estimates, these statements would be adversely affected.
Allowance for ship and debit. Ship and debit is a program designed to assist distributors in meeting competitive prices in the marketplace on sales to their end-customers. Ship and debit requires a request from the distributor for a pricing adjustment for a specific part for a customer sale to be shipped from the distributor’s stock. We have no obligation to accept this request. However, it is our historical practice to allow some companies to obtain pricing adjustments for inventory held. We receive periodic statements regarding our products held by our distributors. Ship and debit authorizations may cover current and future distributor activity for a specific part for sale to distributor’s customer. At the time we record sales to distributors, we provide an allowance for the estimated future distributor activity related to such sales since it is probable that such sales to distributors will result in ship and debit activity. The sales allowance requirement is based on sales during the period, credits issued to distributors, distributor inventory levels, historical trends, market conditions, pricing
53
Table of Contents
trends we see in our direct sales activity with original equipment manufacturers and other customers, and input from sales, marketing and other key management. We believe that the analysis of these inputs enables us to make reliable estimates of future credits under the ship and debit program. This analysis requires the exercise of significant judgments. Our actual results to date have approximated our estimates. At the time the distributor ships the part from stock, the distributor debits us for the authorized pricing adjustment. This allowance is included as part of the accounts receivable allowance on the balance sheet and as a reduction of revenues in the statement of operations. If competitive pricing were to decrease sharply and unexpectedly, our estimates might be insufficient, which could adversely affect our operating results.
Additions to the ship and debit allowance are estimates of the amount of expected future ship and debit activity related to sales during the period. Additional allowances reduce revenues and gross profit in the period. The following table sets forth the beginning and ending balances of, additions to, and deductions from, our allowance for ship and debit during the three years ended March 31, 2016 (in thousands):
| Balance March 31, 2013 |
$ | 1,396 | ||
| Additions |
4,757 | |||
| Deductions |
(5,082 | ) | ||
|
|
|
|||
| Balance March 31, 2014 |
1,071 | |||
| Additions |
5,765 | |||
| Deductions |
(5,777 | ) | ||
|
|
|
|||
| Balance March 31, 2015 |
1,059 | |||
| Additions |
4,479 | |||
| Deductions |
(4,672 | ) | ||
|
|
|
|||
| Balance March 31, 2016 |
$ | 866 | ||
|
|
|
Trade accounts receivable and allowance for doubtful accounts. Trade accounts receivable are recorded at the invoiced amount and do not bear interest. The allowance for doubtful accounts is our best estimate of the amount of probable credit losses in the existing accounts receivable. We determine the allowance based on the aging of our accounts receivable, the financial condition of our customers and their payment history, our historical write-off experience and other assumptions. The allowance for doubtful accounts is reviewed quarterly. Past due balances and other specified accounts as necessary are reviewed individually. Account balances are charged off against the allowance after all means of collection have been exhausted and the potential for recovery is considered remote. Actual write-offs may be in excess of the recorded allowance. This allowance is included as part of the accounts receivable allowance on the balance sheet and as a “selling, general and administrative expense” in the statement of operations.
Cash and Cash Equivalents
We consider all highly liquid investments with original maturities of three months or less at the time of purchase to be cash equivalents. Cash equivalents include investments in commercial paper and money market accounts at banks.
Restricted Cash
Restricted cash balances at March 31, 2016 and March 31, 2015 were $277,000 and $266,000, respectively. The restricted cash balances constitute funds segregated for pension payments in Germany.
Inventories
Inventories are recorded at the lower of standard cost, which approximates actual cost on a first-in-first-out basis, or market value. Our accounting for inventory costing is based on the applicable expenditure incurred, directly or indirectly, in bringing the inventory to its existing condition. Such expenditures include acquisition costs, production costs and other costs incurred to bring the inventory to its use. As it is impractical to track
54
Table of Contents
inventory from the time of purchase to the time of sale for the purpose of specifically identifying inventory cost, our inventory is, therefore, valued based on a standard cost, given that many of the materials purchased are identical and interchangeable at various production processes. We review our standard costs on an as-needed basis but in any event at least once a year, and update them as appropriate to approximate actual costs. The authoritative guidance provided by the Financial Accounting Standards Board, or FASB, requires certain abnormal expenditures to be recognized as expenses in the current period instead of capitalized in inventory. It also requires that the amount of fixed production overhead allocated to inventory be based on the normal capacity of the production facilities.
We typically plan our production and inventory levels based on internal forecasts of customer demand, which are highly unpredictable and can fluctuate substantially. The value of our inventories is dependent on our estimate of future demand as it relates to historical sales. If our projected demand is overestimated, we may be required to reduce the valuation of our inventories below cost. We regularly review inventory quantities on hand and record an estimated provision for excess inventory based primarily on our historical sales and expectations for future use. We also recognize a reserve based on known technological obsolescence, when appropriate. Actual demand and market conditions may be different from those projected by our management. This could have a material effect on our operating results and financial position. If we were to make different judgments or utilize different estimates, the amount and timing of our write-down of inventories could be materially different.
Excess inventory frequently remains saleable. When excess inventory is sold, it yields a gross profit margin of up to 100%. Sales of excess inventory have the effect of increasing the gross profit margin beyond that which would otherwise occur, because of previous write-downs. Once we have written down inventory below cost, we do not write it up when it is subsequently utilized, sold or scrapped. We do not physically segregate excess inventory nor do we assign unique tracking numbers to it in our accounting systems. Consequently, we cannot isolate the sales prices of excess inventory from the sales prices of non-excess inventory. Therefore, we are unable to report the amount of gross profit resulting from the sale of excess inventory or quantify the favorable impact of such gross profit on our gross profit margin.
The following table provides information on our excess and obsolete inventory reserve charged against inventory at cost (in thousands):
| Balance at March 31, 2013 |
$ | 25,289 | ||
| Utilization or sale |
(1,579 | ) | ||
| Scrap |
(3,422 | ) | ||
| Additional provision |
3,503 | |||
| Foreign currency translation adjustments |
513 | |||
|
|
|
|||
| Balance at March 31, 2014 |
24,304 | |||
| Utilization or sale |
(1,637 | ) | ||
| Scrap |
(2,901 | ) | ||
| Additional provision |
4,487 | |||
| Foreign currency translation adjustments |
(1,500 | ) | ||
|
|
|
|||
| Balance at March 31, 2015 |
22,753 | |||
| Utilization or sale |
(2,455 | ) | ||
| Scrap |
(3,217 | ) | ||
| Additional provision |
4,125 | |||
| Foreign currency translation adjustments |
174 | |||
|
|
|
|||
| Balance at March 31, 2016 |
$ | 21,380 | ||
|
|
|
The practical efficiencies of wafer fabrication require the manufacture of semiconductor wafers in minimum lot sizes. Often, when manufactured, we do not know whether or when all the semiconductors resulting from a lot of wafers will sell. With more than 10,000 different part numbers for semiconductors, excess inventory resulting from the manufacture of some of those semiconductors will be continual and ordinary. Because the cost of
55
Table of Contents
storage is minimal when compared to potential value and because our products do not quickly become obsolete, we expect to hold excess inventory for potential future sale for years. Consequently, we have no set time line for the utilization, sale or scrapping of excess inventory.
In addition, our inventory is also being written down to the lower of cost or market or net realizable value. We review our inventory listing on a quarterly basis for an indication of losses being sustained for costs that exceed selling prices less direct costs to sell. When it is evident that our selling price is lower than current cost, inventory is marked down accordingly. At March 31, 2016 and 2015, our lower of cost or market reserves were $409,000 and $444,000, respectively.
Furthermore, we perform an annual inventory count and at certain locations periodic cycle counts for specific parts that have a high turnover. We also periodically identify any inventory that is no longer usable and write it off.
Property, Plant and Equipment
Property, plant and equipment, including equipment under capital leases, are stated at cost less accumulated depreciation. Equipment under capital lease is stated at the lower of the present value of the minimum lease payments at the beginning of the lease term or the fair value of the leased assets at the inception of the lease. Depreciation is computed using the straight-line method over estimated useful lives of 1 to 14 years for equipment and 24 years to 50 years for property and plant. Upon disposal, the assets and related accumulated depreciation are removed from our accounts and the resulting gains or losses are reflected in the statements of operations. Repairs and maintenance costs are charged to expense. Depreciation of leasehold improvements is provided on the straight-line method over the shorter of the estimated useful life or the term of the lease.
The authoritative guidance provided by FASB requires evaluating the recoverability of the carrying amount of our property, plant and equipment whenever events or changes in circumstances indicate that the carrying amount of an asset may not be fully recoverable. Impairment is assessed when the forecasted undiscounted cash flows derived for the operation to which the assets relate are less than the carrying amount including associated intangible assets of the operation. If the operation is determined to be unable to recover the carrying amount of its assets, then impairment loss is recognized by reducing the carrying amount of the long-lived asset group on a pro-rata basis using the relative carrying amounts of those assets. Fair value is determined based on discounted cash flows or appraised values, depending on the nature of the assets. Judgment is used when applying these impairment rules to determine the timing of the impairment test, the undiscounted expected cash flows used to assess impairments and the fair value of an impaired asset. The dynamic economic environment in which we operate and the resulting assumptions used to estimate future cash flows affect the outcome of these impairment tests.
On June 10, 2005, IXYS GmbH, our German subsidiary, borrowed €10.0 million, or about $12.2 million at the time, from IKB Deutsche Industriebank AG, or IKB. This loan was collateralized by a security interest in our facility in Lampertheim, Germany. In April 2015, we replaced the loan with a new borrowing of €6.5 million, or about $7.2 million. The loan is expected to be paid in full by March 31, 2022 and is also collateralized by a security interest in our facility in Lampertheim, Germany. See Note 8, “Borrowing and Installment Payment Arrangements” for more details.
Treasury Stock
We account for treasury stock using the cost method. Cost includes fees charged in connection with acquiring treasury stock.
Other Assets
Other assets include marketable equity securities classified as available-for-sale and long term equity investments accounted under the equity method. Investments designated as available-for-sale are reported at fair value with the unrealized gains and losses, net of tax, recorded in other comprehensive income (loss). Realized gains and losses (calculated as proceeds less specifically identified costs) and declines in value of these investments judged by management to be other than temporary, if any, are included in other income (expense).
56
Table of Contents
We have a 45% equity interest in Powersem GmbH, or Powersem, a semiconductor manufacturer based in Germany and a 20% equity interest in EB Tech Ltd., or EB Tech, a radiation services provider based in South Korea. In fiscal year ended March 31, 2015, or fiscal 2015, we acquired 24.3% equity interest in Automated Technology, Inc., or ATEC, an assembly and test services provider in the Philippines. These investments are accounted for using the equity method. In fiscal 2016 and 2015, we recognized losses of $120,000 and $7,000 on these investments, respectively. In fiscal year ended March 31, 2014, or fiscal 2014, we recognized $303,000 income on these investments.
Refer to Note 5, “Other Assets” and Note 13, “Related Party Transactions” for further information regarding the investment balances and the related transactions of those long term equity investments.
Goodwill and Intangible Assets
Goodwill represents the excess of the purchase price over the estimated fair value of the net assets acquired. The costs of acquired intangible assets are recorded at fair value at acquisition. Intangible assets with finite lives are amortized using the straight-line method or accelerated method over their estimated useful lives and evaluated for impairment in accordance with the authoritative guidance provided by FASB.
Goodwill and intangible assets with indefinite lives are reviewed at least annually for impairment charges during the quarter ending March 31, or more frequently if events and circumstances indicate that the asset might be impaired, in accordance with the authoritative guidance provided by FASB. We first assess qualitative factors to determine whether it is necessary to perform the two-step fair value-based impairment test described below. If we believe that, as a result of its qualitative assessment, it is more likely than not that the fair value of a reporting unit is less than its carrying amount, the quantitative impairment test is required. Otherwise, no further testing is required.
Under the quantitative approach, there are two steps in the determination of the impairment of goodwill. The first step compares the carrying amount of the net assets to the fair value of the reporting unit. The second step, if necessary, recognizes an impairment loss to the extent the carrying value of the reporting unit’s net assets exceed the implied fair value of goodwill. An impairment loss would be recognized to the extent that the carrying amount exceeds the fair value of the reporting unit. We operate our business as one reporting unit.
We assess the recoverability of the finite-lived intangible assets by examining the occurrences of certain events or changes of circumstances that indicate that the carrying amounts may not be recoverable. After our initial assessment, if it is necessary, we perform the impairment test by determining whether the estimated undiscounted cash flows attributable to the assets in question are less than their carrying values. Impairment losses, if any, are measured as the amount by which the carrying values of the assets exceed their fair value and are recognized in operating results. If a useful life is determined to be shorter than originally estimated, we accelerate the rate of amortization and amortize the remaining carrying value over the new shorter useful life.
See Note 7, “Goodwill and Intangible Assets” for further discussion of impairment analysis of goodwill and related charges recorded.
Derivative Financial Instruments
Although the majority of our transactions are in U.S. dollars, we enter into foreign exchange forward and option contracts to manage foreign currency exchange risk associated with our operations. From time to time, we purchase short-term, foreign exchange forward and option contracts to hedge the impact of foreign currency fluctuations on certain underlying assets, liabilities and commitments for operating expenses denominated in foreign currencies. The purpose of entering into these hedge transactions is to minimize the impact of foreign currency fluctuations on the results of operations. The contracts generally have maturity dates that do not exceed six months. We did not have any open foreign exchange forward and option contracts at March 31, 2016. In order to manage our variable interest rate exposure on our former loan from IKB, we entered into an interest rate swap, which ended in June 2015.
We do not purchase derivative contracts for trading purposes. We elected not to designate these contracts as accounting hedges and any changes in fair value are marked to market and included in other income (expense), net. See Note 4, “Fair Value” and Note 8, “Borrowing and Installment Payment Arrangements” for further information on the borrowing from IKB.
57
Table of Contents
Defined Benefit Plans
We maintain pension plans covering certain of our employees. For financial reporting purposes, net periodic pension costs are calculated based upon a number of actuarial assumptions, including a discount rate for plan obligations, assumed rate of return on pension plan assets and assumed rate of compensation increases for plan employees. All of these assumptions are based upon management’s judgment, considering all known trends and uncertainties. Actual results that differ from these assumptions would impact the future expense recognition and cash funding requirements of our pension plans. The authoritative guidance provided by FASB requires us to recognize the funded status of our defined benefit pension and post-retirement benefit plans in our consolidated balance sheets, with a corresponding adjustment to accumulated other comprehensive income, net of tax. See Note 9, “Pension Plans” for further information.
Fair Value of Financial Instruments
The assessment of fair value for our financial instruments is based on the authoritative guidance provided by FASB in connection with fair value measurements. It defines fair value, establishes a framework for measuring fair value and expands disclosure of fair value measurements.
Carrying amounts of some of our financial instruments, including cash and cash equivalents, accounts receivable and accounts payable, approximate fair value due to their short maturities. Based on borrowing rates currently available to us for loans with similar terms, the carrying value of notes payable to banks and loans payable approximate fair value and represent level 2 valuations.
Advertising Expense
We expense advertising as the costs are incurred. Advertising expense for the years ended March 31, 2016, 2015 and 2014 was $433,000, $437,000 and $631,000, respectively. Advertising expense is included in “Selling, general and administrative expenses” on our consolidated statements of operations.
Research and Development Expense
Research and development costs are charged to operations as incurred.
Income Taxes
Our provision for income taxes is comprised of our current tax liability and the change in deferred tax assets and liabilities. Deferred tax assets and liabilities are determined based on differences between financial reporting and tax bases of assets and liabilities and are measured using the enacted tax rates and laws that will be in effect when the differences are expected to reverse. A valuation allowance is required to reduce the deferred tax assets to the amount that management estimates is more likely than not to be realized. In determining the amount of the valuation allowance, we consider income over recent years, estimated future taxable income, feasible tax planning strategies, and other factors, in each taxing jurisdiction in which we operate. If we determine that it is more likely than not that we will not realize all or a portion of our remaining deferred tax assets, we will increase our valuation allowance with a charge to income tax expense. Conversely, if we determine that it is more likely than not that we will ultimately be able to utilize all or a portion of the deferred tax assets for which a valuation allowance has been provided, the related portion of the valuation allowance will be released, which will have the effect of reducing income tax expense. Significant management judgment is required in determining the provision for income taxes, the deferred tax assets and liabilities and any valuation allowance recorded against net deferred tax assets. In the event that actual results differ from these estimates or we adjust these estimates in future periods, we may need to establish or increase an additional valuation allowance that could materially impact our financial position and results of operations. Our ability to utilize our deferred tax assets and the continuing need for related valuation allowances are monitored on an ongoing basis. See Note 16, “Income Taxes” for further discussion regarding income taxes.
Other Income and Expense
Other income and expense primarily consists of gains and losses on foreign currency transactions and interest income and expense, together with our share of income or loss from investments accounted for on the equity method and other than temporary impairment charges on available-for-sale securities.
58
Table of Contents
Indemnification
Product guarantees and warranties have not historically proved to be material. On occasion, we provide limited indemnification to customers against intellectual property infringement claims related to our products. To date, we have not experienced significant activity or claims related to such indemnifications. We also provide in the normal course of business indemnification to our officers, directors and selected parties. We are unable to estimate any potential future liability, if any. Therefore, no liability for these indemnification agreements has been recorded as of March 31, 2016 and 2015.
Legal Contingencies
We are subject to various legal proceedings and claims, the outcomes of which are subject to significant uncertainty. The authoritative guidance provided by FASB requires that an estimated loss from a loss contingency should be accrued by a charge to income if it is probable that an asset has been impaired or a liability has been incurred and the amount of the loss can be reasonably estimated. Disclosure of a contingency is required if there is at least a reasonable possibility that a material loss has been incurred. We evaluate, among other factors, the degree of probability of an unfavorable outcome and the ability to make a reasonable estimate of the amount of loss. Changes in these factors could materially impact our financial position, results of operations or cash flows.
Net Income (Loss) per Share
Basic net income (loss) available per common share is computed using net income (loss) and the weighted average number of common shares outstanding during the period. Diluted net income (loss) per common share is computed using net income (loss) and the weighted average number of common shares outstanding, assuming dilution, which includes potentially dilutive common shares outstanding during the period. Potentially dilutive common shares include the assumed exercise of stock options and assumed vesting of restricted stock units using the treasury stock method. See Note 12, “Computation of Earnings per Share.”
Accumulated Other Comprehensive Income
Accumulated other comprehensive income or loss represents foreign currency translation adjustments, unrealized gain or loss on equity investments classified as “available-for-sale” and minimum pension liability, net of tax. See Note 11, “Accumulated Other Comprehensive Income (Loss).”
Concentration and Business Risks
Dependence on Third Parties for Wafer Fabrication and Assembly
Measured in dollars, in fiscal 2016 we manufactured approximately 52.6% of our wafers, an integral component of our products, in our facilities in Germany, the UK, Massachusetts and California. We relied on third party suppliers to provide the remaining 47.4%. There can be no assurance that material disruptions in supply will not occur in the future. In such event, we may have to identify and secure additional foundry capacity and may be unable to identify or secure sufficient foundry capacity to meet demand. Even if such capacity is available from another manufacturer, the qualification process could take six months or longer. If we were unable to qualify alternative manufacturing sources for existing or new products in a timely manner or if such sources were unable to produce semiconductor devices with acceptable manufacturing yields and at acceptable prices, our business, financial condition and results of operations would be materially and adversely affected.
Dependence on Suppliers
We purchase silicon substrates from a limited number of vendors, most of whom we do not have long term supply agreements with. Any of these suppliers could terminate their relationship with us at any time. Our reliance on a limited number of suppliers involves several risks, including potential inability to obtain an adequate supply of silicon substrates and reduced control over the price, timely delivery, reliability and quality of the silicon substrates. There can be no assurance that problems will not occur in the future with suppliers.
59
Table of Contents
Employees Covered by Collective Bargaining Arrangements
Approximately 54.6% and 94.6% of our employees in the United Kingdom and Germany, respectively, are covered by collective bargaining arrangements.
Concentration of Credit Risk
Financial instruments that potentially subject us to credit risk comprise principally cash and cash equivalents and trade accounts receivable. We invest our excess cash in accordance with our investment policy that has been approved by the Board of Directors and is reviewed periodically by management to minimize credit risk. Regarding cash and cash equivalents, the policy authorizes the investment of excess cash in deposit accounts, certificates of deposit, bankers’ acceptances, commercial paper rated AA or better and other money market accounts and instruments of similar liquidity and credit quality.
We invest our excess cash primarily in foreign and domestic banks in short term time deposit and money market accounts. Maturities are generally three months or less. Our non-interest bearing domestic cash balances exceed federally insured limits. Additionally, we may invest in commercial paper with financial institutions that management believes to be creditworthy. These securities mature within ninety days or less and bear minimal credit risk. We have not experienced any losses on such investments.
We sell our products primarily to distributors and original equipment manufacturers. We perform ongoing credit evaluations of our customers and generally do not require collateral. An allowance for potential credit losses is maintained by us. See Note 15, “Segment and Geographic Information” for a discussion of revenues by geography.
In fiscal 2016, 2015 and 2014, a distributor accounted for 12.2%, 10.2% and 10.8% of our net revenues, respectively. In fiscal 2015, another distributor accounted for 10.5% of our net revenues.
We continually monitor the credit risk in our portfolio and mitigate our credit risk exposures in accordance with the policies approved by our Board of Directors.
Stock-Based Compensation Plans
We have employee equity incentive plans and an employee stock purchase plan, which are described more fully in Note 10, “Employee Equity Incentive Plans.” The authoritative guidance provided by FASB requires employee stock options and rights to purchase shares under stock participation plans to be accounted for under the fair value method and requires the use of an option pricing model for estimating fair value. Accordingly, share-based compensation is measured at grant date, based on the fair value of the award and shares expected to vest. We use the straight-line attribution method to recognize share-based compensation costs over the service period of the award.
Recent Accounting Pronouncements
In May 2014, FASB issued a new standard on the recognition of revenue from contracts with customers, which includes a single set of rules and criteria for revenue recognition to be used across all industries. The revenue standard’s core principle is built on the contract between a vendor and a customer for the provision of goods and services. It attempts to depict the exchange of rights and obligations between the parties in the pattern of revenue recognition based on the consideration to which the vendor is entitled. To accomplish this objective, the standard requires five basic steps: identify the contract with the customer, identify the performance obligations in the contract, determine the transaction price, allocate the transaction price to the performance obligations in the contract, and recognize revenue when or as the entity satisfies a performance obligation. This standard is effective for annual reporting periods beginning after December 15, 2017, including interim periods during the annual period. Early adoption is prohibited for annual periods commencing before December 15, 2016. Different transition methods are available — full retrospective method, retrospective with certain practical expedients and a modified retrospective (cumulative effect) approach. We are currently evaluating the impact of the adoption of the standard on our consolidated financial statements, including selection of the transition method.
In March 2016, FASB issued an amended guidance on the topic of revenue from contracts with customers relating to revenue recognition to clarify the implementation guidance on principal versus agent considerations
60
Table of Contents
and to address how an entity should assess whether it is the principal or the agent in contracts that include three or more parties. The effective date and transition requirements for these amendments are the same as the effective date and transition requirements of the new revenue recognition standard. We are currently evaluating the impact of these amendments on our financial statements.
In April 2016, FASB issued an amended guidance to clarify the following two aspects relating revenue recognition: identifying performance obligations and the licensing implementation guidance, while retaining the related principles for those areas. Before an entity can identify its performance obligation in a contract with a customer, the entity first identifies the promised goods or services in the contract. The amendments are expected to reduce the cost and complexity of applying the guidance on identifying promised goods or services. The amendments include implementation guidance on determining whether an entity’s promise to grant a license provides a customer with either a right to use the entity’s intellectual property or a right to access the entity’s intellectual property. The amendments are intended to improve the operability and understandability of the licensing implementation guidance. The effective date and transition requirements for the amendments are the same as the effective date and transition requirements relating to the new revenue recognition standard. We are currently evaluating the impact of these amendments and the transition alternatives on its consolidated financial statements.
In April 2015, FASB issued the authoritative guidance that requires debt issuance costs related to a recognized debt liability to be presented in the balance sheet as a direct deduction from the debt liability rather than as an asset. The guidance will be effective for fiscal years beginning after December 15, 2015, and interim periods during the annual period, with early adoption permitted for financial statements that have not been previously issued. The new standard is required to be applied retrospectively to all prior periods presented in the financial statements. An entity is also required in the year of adoption (and in interim periods within that year) to provide certain disclosures about the change in accounting principle, including the nature of and reason for the change, the transition method, a description of the prior period information that has been retrospectively adjusted and the effect of the change on the financial statements line items (that is, debt issuance cost asset and the debt liability). In August 2015, FASB issued the authoritative guidance that added Securities and Exchange Commission, or SEC, content. The guidance issued in April 2015 did not directly address the manner in which debt issuance costs relating to a line of credit arrangement are treated. The SEC staff clarified that they would not object to the balance sheet presentation of such costs as an asset (i.e., a deferred charge) to be subsequently amortized ratably over the term of the line of credit arrangement, regardless of whether there are any borrowings outstanding on the underlying line of credit arrangement. We have adopted the guidance effective the quarter ended December 31, 2015 and applied the new rules to our new Revolving Credit Agreement effective as of November 20, 2015. Based on the guidance, the debt issuance costs are presented in the balance sheet as a direct deduction from the debt liability rather than as an asset in our financial statements. There is no other significant impact from the adoption of this guidance. See Note 8, “Borrowing Arrangements” for further information regarding our credit arrangements.
In July 2015, FASB issued an amendment to modify the inventory measurement guidance in Topic 330, Inventory, for inventory that is measured using the methods other than last-in, first-out, or LIFO, and the retail inventory method. It requires that an entity measure inventory within the scope of this update at the lower of cost and net realizable value. It eliminated the guidance in Topic 330 that required a reporting entity measuring inventory at the lower of cost or market to consider the replacement cost of inventory and the net realizable value of inventory less an approximately normal profit margin along with net realizable value in determining the market value. The guidance will be effective for annual reporting periods beginning after December 15, 2016, and interim periods during the annual period. The new standard is required to be applied prospectively with earlier application permitted as of the beginning of an interim or annual reporting period. We do not expect this change to have a significant impact on our consolidated financial statements.
In September 2015, FASB issued an amendment to modify the guidance related to measurement-period adjustments in Topic 805, Business Combinations. The amendment requires that an acquirer recognize adjustments to provisional amounts that are identified during the measurement period in the reporting period in which the adjustment amounts are determined. It also requires that the acquirer record, in the same period’s financial statements, the effect on earnings of changes in depreciation, amortization or other income effects, if any, as a result of the change to the provisional amounts, calculated as if the accounting had been completed at
61
Table of Contents
the acquisition date. It eliminates the requirement to retrospectively account for those adjustments. The guidance will be effective for public companies for financial statements issued for fiscal years beginning after December 15, 2015, and interim periods during the annual period. The new standard is required to be applied prospectively to adjustments to provisional amounts that occur after the aforementioned effective date with earlier application permitted for financial statements that have not yet been issued. We do not expect this guidance to have a significant impact on our consolidated financial statements. The impact on earnings due to measurement period adjustments will be disclosed in the relevant notes to the financial statements.
In October 2015, FASB issued an Accounting Standards Update, or ASU, which requires presentation of deferred tax assets and liabilities as noncurrent in a classified balance sheet. This standard is effective for annual reporting periods beginning after December 15, 2016, including interim periods during the annual period. Early application is permitted as of the beginning of any interim or annual reporting period. We adopted this accounting standard update, on a retrospective basis, during the quarter ended December 31, 2015. All deferred tax assets and liabilities as of March 31, 2016 and March 31, 2015 were classified as noncurrent in the accompanying consolidated balance sheets and the notes thereto. Our prior period ended March 31, 2015 reflected a decrease of $7.1 million in the current deferred tax assets and a corresponding increase in the noncurrent deferred tax assets.
In January 2016, the FASB issued authoritative guidance that modifies how entities measure equity investments and present changes in the fair value of financial liabilities. Under the new guidance, entities will have to measure equity investments that do not result in consolidation and are not accounted under the equity method at fair value and recognize any changes in fair value in net income unless the investments qualify for the new practicality exception. A practicality exception will apply to those equity investments that do not have a readily determinable fair value and do not qualify for the practical expedient to estimate fair value under Accounting Standard Codification, or ASC 820, Fair Value Measurements, and as such these investments may be measured at cost. This guidance is effective for financial statements issued for fiscal years beginning after December 15, 2017, and interim periods within those fiscal years. We are currently evaluating the impact of this standard on our consolidated financial statements.
In February 2016, FASB issued amended guidance for lease arrangements, which requires lessees to recognize the followings for all leases with terms longer than 12 months: a lease liability, which is a lessee’s obligation to make lease payments arising from a lease, measured on a discounted basis and a right-of-use asset, which is an asset that represents the lessee’s right to use, or control the use of, a specified asset for the lease term. The amendment is effective for financial statements issued for fiscal years beginning after December 15, 2018, and interim periods within those fiscal years. Early adoption is permitted. We are currently evaluating the impact of this amended guidance on our consolidated financial statements.
In March 2016, FASB issued amended guidance to simplify the transition to the equity method of accounting. This standard eliminates the requirement that when an existing cost method investment qualifies for use of the equity method, an investor must restate its historical financial statements, as if the equity method had been used during all previous periods. Additionally, any unrealized gain or loss in accumulated other comprehensive income (loss) will be recognized through earnings at the point an investment qualifies for the equity method. The amended guidance is effective for financial statements issued for fiscal years, and interim periods within those fiscal years, beginning after December 15, 2016. It should be applied prospectively. Early adoption is permitted. We are currently evaluating the impact of this amended guidance on our consolidated financial statements.
In March, 2016, FASB issued amended guidance which simplifies several aspects of the accounting for employee share-based payment awards, including forfeitures, employer tax withholding on share-based compensation and excess tax benefits or deficiencies. The amended guidance also clarifies the statement of cash flows presentation for share-based awards. The guidance is effective for financial statements issued for fiscal years beginning after December 15, 2016, and interim periods within those fiscal years. Early adoption is permitted in any interim or annual period for which financial statements have not yet been issued or have not been made available for issuance. We are currently evaluating the impact of this amended guidance on our consolidated financial statements.
62
Table of Contents
3. Business Combinations
RadioPulse, Inc.
On May 1, 2015, we acquired RadioPulse, Inc., or RadioPulse, for a total consideration of $15.7 million. Based in South Korea, RadioPulse is a fabless semiconductor company that develops, manufactures and sells wireless network technology solutions based on the ZigBee® protocol, which combines microcontrollers and radio frequency devices. RadioPulse’s solutions are designed to enable a broad range of power-sensitive applications in the industrial, medical, consumer, smart grid and Internet of Things, or IoT, markets. RadioPulse offers a complementary product portfolio to our product lines. The consideration includes cash consideration paid at closing of $14.7 million and $1.0 million related to an adjustment to eliminate debt owed to us for funds advanced prior to closing. The acquisition also includes potential earnout payments aggregating up to $6.0 million payable over three years. The earnout payments are subject to certain financial thresholds related to net revenues, gross profit and net income in calendar years 2015, 2016 and 2017. Based on our valuation, the fair value of the liability for the earnout payment is estimated to be nil. In connection with the acquisition, we incurred and expensed $248,000 in legal and consulting costs and $249,000 in acquisition-related compensation costs.
The following table summarizes the values of the assets acquired and liabilities assumed at the acquisition date (in thousands):
| Purchase Consideration Allocation |
||||
| Cash, restricted cash and cash equivalents |
$ | 196 | ||
| Accounts receivable |
1,497 | |||
| Inventories |
534 | |||
| Property, plant and equipment |
24 | |||
| Prepaid expenses and other current assets |
547 | |||
| Identifiable intangible assets |
2,867 | |||
| Short-term borrowings |
(2,354 | ) | ||
| Accounts payable |
(614 | ) | ||
| Accruals and other liabilities |
(1,926 | ) | ||
|
|
|
|||
| Total identifiable net liabilities |
771 | |||
| Goodwill |
14,887 | |||
|
|
|
|||
| Total purchase consideration |
$ | 15,658 | ||
|
|
|
|||
During the quarter ended March 31, 2016, we recorded a reduction in the value of accruals and other liabilities of $1.0 million along with a corresponding increase in the purchase consideration of $1.0 million related to an adjustment to eliminate the debt owed to us for funds advanced prior to closing. We also recorded adjustments that reduced the value of goodwill by $275,000 due to an increase in the fair value of identifiable intangible assets of $344,000 and a decrease in the value of prepaid expenses and other current assets of $69,000. The change in the value of the intangible assets did not have a significant impact on the amortization recorded in the financial statements for the quarter ended March 31, 2016.
Identifiable intangible assets consisted of developed intellectual property, in-process research and development expenses, customer relationships and contract backlog. The valuation of the acquired intangibles was classified as a level 3 measurement under the fair value measurement guidance because the valuation was based on significant unobservable inputs and involved management judgment and assumptions about market participants and pricing. We did not recognize any liability with respect to the contingent consideration based upon our analysis.
63
Table of Contents
Identified intangible assets resulting from the RadioPulse acquisition consisted of the following (in thousands):
| Fair Value | Amortization Method |
Estimated Useful Life |
||||||||
| (In thousands) | (In months) | |||||||||
| Developed intellectual property |
$ | 1,005 | Accelerated | 60 | ||||||
| In-process research and development expenses(1) |
1,188 | Straight-line | 60 | |||||||
| Customer relationships |
500 | Accelerated | 36 | |||||||
| Contract backlog |
174 | Straight-line | 6 | |||||||
|
|
|
|||||||||
| Total |
$ | 2,867 | ||||||||
|
|
|
|||||||||
| (1) | Amortization will start after the completion of the research and development activities of the related projects. |
In determining the fair value of the acquired intangible assets, we determined the appropriate unit of measure, the exit market and the highest and best use for the assets. The income approach was used to estimate the fair value. The income approach indicates the fair value of an asset based on the value of the cash flows that the asset can be expected to generate in the future through a discounted cash flow method. The income approach was used to determine the fair values of developed intellectual property, in-process research and development expenses, contract backlog and customer relationships. The goodwill arising from the acquisition was largely attributable to the synergies expected to be realized after our acquisition and integration of RadioPulse and to the workforce acquired in the transaction. The goodwill is not deductible for tax purposes.
RadioPulse contributed net revenues of $4.1 million, from the date of purchase, May 1, 2015 to our consolidated statements of operations for the fiscal year ended March 31, 2016. The net loss of RadioPulse included in our operating results for the year ended March 31, 2016 was $3.6 million, based on the purchase consideration valuation. The results of operations and financial position of RadioPulse were immaterial compared to our financial statements and therefore pro-forma financial statements have not been separately presented.
Acquired MCU Business
On June 27, 2013, we completed the acquisition of an 8-bit microcontroller product line, or the Acquired MCU Business, from the System LSI Division of Samsung Electronics Co., Ltd. The acquired product line includes microcontrollers potentially useful in a number of applications, which have to date been principally used in consumer product applications. The acquisition was intended to bolster our product portfolio and empower customers to utilize products from across our multiple product lines.
The aggregate purchase price for the acquired assets was $50.0 million. The closing payment was $20.0 million and we were obligated to pay $30.0 million in two installment payments of $15.0 million each. The first installment and interest were paid on June 26, 2014 and the second installment and interest were paid on December 23, 2014. The installment payments and interest were included in “Accrued expenses and other current liabilities” on our audited consolidated balance sheet.
We incurred $403,000 in legal and consulting costs related to the acquisition in fiscal 2014. The costs incurred were fully expensed and included in “Selling, general and administrative” expenses, or SG&A expenses, on our audited consolidated statements of operations.
64
Table of Contents
The following table summarizes the values of the assets acquired at the acquisition date (in thousands):
| Purchase Price Allocation |
||||
| Inventories |
$ | 800 | ||
| Property, plant and equipment |
36 | |||
| Identifiable intangible assets |
24,000 | |||
|
|
|
|||
| Total identifiable net assets |
24,836 | |||
| Goodwill |
25,164 | |||
|
|
|
|||
| Total purchase price |
$ | 50,000 | ||
|
|
|
|||
Identifiable intangible assets consisted of developed intellectual property, customer relationships, contract backlog and a non-competition agreement. The valuation of the acquired intangibles was classified as a Level 3 measurement under the fair value measurement guidance, because the valuation was based on significant unobservable inputs and involved management judgment and assumptions about market participants and pricing. In determining fair value of the acquired intangible assets, we determined the appropriate unit of measure, the exit market and the highest and best use for the assets. The income approach and cost approach were used to estimate the fair value. The income approach indicates the fair value of an asset based on the value of the cash flows that the asset can be expected to generate in the future through a discounted cash flow method. The income approach was used to determine the fair values of developed intellectual property, the non-competition agreement, contract backlog and customer relationships. The goodwill arising from the acquisition was largely attributable to the synergies expected to be realized after our acquisition and integration of the Acquired MCU Business. The goodwill is not deductible for tax purposes. See Note 7, “Goodwill and Intangible Assets” for the valuation of identified intangible assets resulting from the acquisition.
The Acquired MCU Business contributed revenues of $36.1 million in our audited consolidated statements of operations for fiscal 2014. As the Acquired MCU Business is fully integrated within our existing operations we are not able to calculate and report the net income contribution specific to the Acquired MCU Business.
65
Table of Contents
Supplemental Pro Forma Financial Information
The following pro forma summary gives effect to the acquisition of the Acquired MCU Business as if it had occurred at the beginning of fiscal 2013. The pro forma financial information reflects the business combination accounting effects resulting from this acquisition including our amortization charges from acquired intangible assets, the acquisition related expenses and the interest expenses on installment payments of the acquisition. The summary is provided for illustrative purposes only and is not necessarily indicative of the consolidated results of operations for future periods.
The Acquired MCU Business’s fiscal year ended on December 31, while our fiscal year ends on March 31. As such, the financial information of the Acquired MCU Business is included in the following unaudited pro forma table so as to align with the reporting periods of our fiscal quarters. In the following unaudited pro forma table, the financial information for fiscal 2014 includes the historical financial results of IXYS Corporation for the twelve months ended March 31, 2014 and the historical financial results of the Acquired MCU Business for the three months ended March 31, 2013 (in thousands, except per share data):
| Years Ended March 31, 2014 |
||||
| (unaudited) | ||||
| Pro forma net revenues |
$ | 360,228 | ||
|
|
|
|||
| Pro forma net income |
$ | 15,364 | ||
|
|
|
|||
| Pro forma net income per share (basic) |
$ | 0.49 | ||
|
|
|
|||
| Pro forma net income per share (diluted) |
$ | 0.48 | ||
|
|
|
|||
Other Acquisition
In the quarter ended June 30, 2014 we completed a business acquisition for a cash consideration of $2.3 million, net of cash acquired of approximately $204,000. The acquisition resulted in a goodwill of $2.8 million and we assumed debt of $723,000. At March 31, 2016, this goodwill balance reflected a cumulative reduction of $477,000 caused by changes in the foreign exchange translation rate. This acquisition was not significant to our consolidated financial statements.
4. Fair Value
We account for certain assets and liabilities at fair value. In determining fair value, we consider its principal or most advantageous market and the assumptions that market participants would use when pricing, such as inherent risk, restrictions on sale and risk of non-performance. The fair value hierarchy is based upon the observability of inputs used in valuation techniques. Observable inputs (highest level) reflect market data obtained from independent sources, while unobservable inputs (lowest level) reflect internally developed market assumptions. The fair value measurements are classified under the following hierarchy:
| Level 1 — | Quoted prices for identical instruments in active markets. |
| Level 2 — | Quoted prices for similar instruments in active markets; quoted prices for identical or similar instruments in markets that are not active; and model-derived valuations in which all significant inputs or significant value-drivers are observable in active markets. |
| Level 3 — | Model-derived valuations in which one or more significant inputs or significant value-drivers are unobservable. |
66
Table of Contents
Fair Value Measurements on a Recurring Basis
Assets and liabilities measured at fair value on a recurring basis, excluding accrued interest components, consisted of the following types of instruments as of March 31, 2016 and 2015 (in thousands):
| March 31, 2016(1) | March 31, 2015(1) | |||||||||||||||||||||||
| Total | Fair Value Measured at Reporting Date Using |
Total | Fair Value Measured at Reporting Date Using |
|||||||||||||||||||||
| Description |
Level 1 | Level 2 | Level 1 | Level 2 | ||||||||||||||||||||
| Assets |
||||||||||||||||||||||||
| Money market funds(2) |
$ | 115,974 | $ | 115,974 | $ | — | $ | 76,317 | $ | 76,317 | $ | — | ||||||||||||
| Marketable equity securities(3) |
1,749 | 1,749 | — | 1,737 | 1,737 | — | ||||||||||||||||||
| Auction rate preferred securities(3) |
350 | — | 350 | 350 | — | 350 | ||||||||||||||||||
|
|
|
|
|
|
|
|
|
|
|
|
|
|||||||||||||
| Total Assets Measured at Fair Value |
$ | 118,073 | $ | 117,723 | $ | 350 | $ | 78,404 | $ | 78,054 | $ | 350 | ||||||||||||
|
|
|
|
|
|
|
|
|
|
|
|
|
|||||||||||||
| Liabilities |
||||||||||||||||||||||||
| Derivative liabilities(4) |
— | — | — | 19 | — | 19 | ||||||||||||||||||
|
|
|
|
|
|
|
|
|
|
|
|
|
|||||||||||||
| Total Liabilities Measured at Fair Value |
$ | — | $ | — | $ | — | $ | 19 | $ | — | $ | 19 | ||||||||||||
|
|
|
|
|
|
|
|
|
|
|
|
|
|||||||||||||
| (1) | We did not have any recurring fair value measurements of assets or liabilities whose fair value was measured using significant unobservable inputs. |
| (2) | Included in “Cash and cash equivalents” on our audited consolidated balance sheets. |
| (3) | Included in “Other assets” on our audited consolidated balance sheets. |
| (4) | Included in “Accrued expenses and other current liabilities” on our audited consolidated balance sheets. |
We measure our marketable securities and derivative contracts at fair value. Marketable securities are valued using the quoted market prices and are therefore classified as Level 1 estimates. All of the marketable equity securities are subject to a periodic impairment review. We review any impairment to determine whether it is other than temporarily impaired. This review is based on factors such as length of time of impairment, extent to which the fair value is below the cost basis, financial conditions of the issuer of the security, our expectations of future recoveries and our ability and intent to hold or sell the securities. Based on our review, we recognized other than temporary impairment losses of $454,000 and $1.9 million in marketable equity securities during fiscal 2016 and 2015, respectively.
From time to time, we use derivative instruments to manage exposure to changes in interest rates and currency exchange rates, and the fair values of these instruments are recorded on the balance sheets. We have elected not to designate these instruments as accounting hedges. The changes in the fair value of these instruments are recorded in the current period’s statement of operations and are included in other income (expense), net. All of our derivative instruments are traded on over-the-counter markets where quoted market prices are not readily available. For those derivatives, we measure fair value using prices obtained from the counterparties with whom we have traded. The counterparties price the derivatives based on models that use primarily market observable inputs, such as yield curves and option volatilities. Accordingly, we classify these derivatives as Level 2. See Note 8, “Borrowing and Installment Payment Arrangements” for further information regarding the terms of the derivative contract.
Auction rate preferred securities, or ARPS, are stated at par value based upon observable inputs including historical redemptions received from the ARPS issuers. All of our ARPS have credit ratings of at least AA, are 100% collateralized and continue to pay interest in accordance with their contractual terms. Additionally, the collateralized asset value ranges exceed the value of our ARPS by approximately 200 percent. Accordingly, the remaining ARPS balance was categorized as Level 2 for fair value measurement in accordance with the authoritative guidance provided by FASB and was recorded at full par value on the audited consolidated balance sheets as of March 31, 2016 and 2015. We currently believe that the ARPS values are not impaired and as such, no impairment has been recognized against the investment. If future auctions fail to materialize and the credit rating of the issuers deteriorates, we may be required to record an impairment charge against the value of our ARPS.
67
Table of Contents
Cash and cash equivalents are recognized and measured at fair value in our consolidated financial statements. Accounts receivable and prepaid expenses and other current assets are financial assets with carrying values that approximate fair value. Accounts payable and accrued expenses and other current liabilities are financial liabilities with carrying values that approximate fair value.
Our pension liabilities, net of plan assets approximate fair value. See Note 9, “Pension Plans” for a discussion of pension liabilities. Our indebtedness for borrowed money and our installment payment obligations approximated fair value, as the interest rates either adjusted according to the market rates or the interest rates approximated the market rates. The estimated fair value of these items was approximately $87.1 million and $49.2 million at March 31, 2016 and March 31, 2015, respectively.
5. Other Assets
Other assets consist of the following (in thousands):
| March 31, | ||||||||
| 2016 | 2015 | |||||||
| Marketable equity securities |
$ | 1,749 | $ | 1,737 | ||||
| Auction rate preferred securities |
350 | 350 | ||||||
| Long-term equity method investments |
10,977 | 11,041 | ||||||
| Other items |
686 | 576 | ||||||
|
|
|
|
|
|||||
| Total |
$ | 13,762 | $ | 13,704 | ||||
|
|
|
|
|
|||||
In fiscal 2016 and 2015, based on evaluation of available evidence we concluded that certain marketable equity securities had impairment other than temporary. As a result, we realized an impairment loss totaling $454,000 and $1.9 million in each fiscal year, respectively. Available-for-sale investment securities have been stated at their fair value as of March 31, 2016 and include an unrealized loss, net of tax benefits, of $82,000 at March 31, 2016, and an unrealized gain, net of taxes, of $7,000 at March 31, 2015.
On December 12, 2014, we acquired 24.3% of the outstanding common shares of ATEC for a purchase price of $5.9 million. ATEC is a supplier located in the Philippines that provides assembly and test services and the acquisition is part of a vertical integration strategy. The investment is accounted for by the equity method and is included in “Other assets” on our audited consolidated balance sheet.
The investment was initially recorded at cost. Subsequent periodic adjustments to cost are made to record our share in the operating results of ATEC subsequent cash contributions and distributions and our share of the differences between the fair value and carrying cost of assets acquired and liabilities assumed. In fiscal 2016 and 2015, we recognized losses of $9,000 and $140,000, respectively, on our investment in ATEC.
We incurred approximately $14,000 in legal and consulting expense for the transaction. The costs incurred were expensed and included in SG&A expenses on our audited consolidated statements of operations.
Available-for-sale investments as of March 31, 2016 and 2015 were as follows (in thousands):
| Fiscal Year 2016 | Fiscal Year 2015 | |||||||||||||||||||||||||||||||
| Cost | Gross Unrealized Gains |
Gross Unrealized (Losses) |
Fair Value |
Cost | Gross Unrealized Gains |
Gross Unrealized (Losses) |
Fair Value |
|||||||||||||||||||||||||
| Marketable equity securities | $ | 1,875 | $ | 46 | $ | (172 | ) | $ | 1,749 | $ | 1,726 | $ | 53 | $ | (42 | ) | $ | 1,737 | ||||||||||||||
| Auction rate preferred securities |
$ | 350 | $ | — | $ | — | $ | 350 | $ | 350 | $ | — | $ | — | $ | 350 | ||||||||||||||||
68
Table of Contents
The available-for-sale investments that were in a continuous unrealized loss position as of March 31, 2016 and March 31, 2015, aggregated by length of time that individual securities have been in a continuous loss position, were as follows (in thousands):
| Less than 12 Months | 12 Months or Greater | Total | ||||||||||||||||||||||
| Period |
Gross Unrealized Losses |
Fair Value |
Gross Unrealized Losses |
Fair Value |
Gross Unrealized Losses |
Fair Value |
||||||||||||||||||
| March 31, 2016 |
$ | 29 | $ | 581 | $ | 143 | $ | 932 | $ | 172 | $ | 1,513 | ||||||||||||
| March 31, 2015 |
$ | 27 | $ | 243 | $ | 15 | $ | 43 | $ | 42 | $ | 286 | ||||||||||||
Gross unrealized losses on our available-for-sale portfolio were immaterial to the consolidated balance sheets at March 31, 2016 and March 31, 2015.
During fiscal 2016, we recognized approximately a loss of $1,000 on the sale of available-for-sale investment securities. In respect of those securities, there was no unrealized amount included in accumulated other comprehensive income as of March 31, 2015.
Our equity method investments constitute investments accounted for under the equity method of accounting. See Note 2, “Summary of Significant Accounting Policies” and Note 13, “Related Party Transactions” for further information on these investments.
6. Balance Sheet Details
Accounts Receivable
Accounts receivable consist of the following (in thousands):
| March 31, | ||||||||
| 2016 | 2015 | |||||||
| Accounts receivable, gross |
$ | 41,219 | $ | 43,810 | ||||
| Allowance for doubtful accounts |
(2,779 | ) | (2,768 | ) | ||||
|
|
|
|
|
|||||
| Accounts receivable, net |
$ | 38,440 | $ | 41,042 | ||||
|
|
|
|
|
|||||
Allowances Movement (in thousands):
| Balance at Beginning of Year |
Additions | Utilization | Translation Adjustments |
Balance at End of Year |
||||||||||||||||
| Allowances for accounts receivable and for doubtful accounts |
||||||||||||||||||||
| Year ended March 31, 2016 |
$ | 2,768 | $ | 6,795 | $ | (6,799 | ) | $ | 15 | $ | 2,779 | |||||||||
| Year ended March 31, 2015 |
$ | 3,013 | $ | 8,935 | $ | (9,004 | ) | $ | (176 | ) | $ | 2,768 | ||||||||
| Year ended March 31, 2014 |
$ | 2,656 | $ | 8,563 | $ | (8,255 | ) | $ | 49 | $ | 3,013 | |||||||||
Inventories
Inventories consist of the following (in thousands):
| March 31, | ||||||||
| 2016 | 2015 | |||||||
| Raw materials |
$ | 18,269 | $ | 17,169 | ||||
| Work in process |
41,549 | 37,491 | ||||||
| Finished goods |
29,786 | 27,345 | ||||||
|
|
|
|
|
|||||
| Total |
$ | 89,604 | $ | 82,005 | ||||
|
|
|
|
|
|||||
69
Table of Contents
| Property, Plant and Equipment |
Property, plant and equipment consist of the following (in thousands):
| March 31, | ||||||||
| 2016 | 2015 | |||||||
| Property and plant (useful life of 24 years to 50 years) |
$ | 35,290 | $ | 33,328 | ||||
| Equipment owned (useful life of 1 to 14 years) |
104,711 | 98,408 | ||||||
| Equipment capital leases (useful life of 4 years) |
34,607 | 33,222 | ||||||
| Leasehold improvements (useful life of up to 8 years) |
1,304 | 1,304 | ||||||
|
|
|
|
|
|||||
| 175,912 | 166,262 | |||||||
| Accumulated depreciation |
(133,289 | ) | (123,717 | ) | ||||
|
|
|
|
|
|||||
| Net property, plant and equipment |
$ | 42,623 | $ | 42,545 | ||||
|
|
|
|
|
|||||
Depreciation expense for fiscal years ended March 31, 2016, 2015 and 2014 amounted to $8.4 million, $11.3 million and $10.7 million, respectively.
Accrued Expenses and Other Liabilities
Accrued expenses and other liabilities consist of the following (in thousands):
| March 31, | ||||||||
| 2016 | 2015 | |||||||
| Uninvoiced goods and services |
$ | 8,824 | $ | 8,473 | ||||
| Compensation and benefits |
7,540 | 6,230 | ||||||
| Income tax payable |
2,066 | 2,459 | ||||||
| Commission, royalties and other |
2,860 | 2,703 | ||||||
|
|
|
|
|
|||||
| Total |
$ | 21,290 | $ | 19,865 | ||||
|
|
|
|
|
|||||
7. Goodwill and Intangible Assets
Goodwill
Goodwill represents the excess of the purchase price over the estimated fair value of the net assets acquired in connection with our acquisitions. We recorded goodwill of $2.8 million related to an acquisition completed in April 2014. In May 2015, we acquired RadioPulse and recorded $14.9 million in goodwill. The goodwill balance as of March 31, 2016 and 2015 reflected changes in the foreign exchange translation rate.
The changes in the carrying amount of goodwill for the years ended March 31, 2016 and 2015 are as follows (in thousands):
| March 31, | ||||||||
| 2016 | 2015 | |||||||
| Goodwill |
$ | 41,137 | $ | 38,356 | ||||
| Accumulated impairment losses |
(13,192 | ) | (13,192 | ) | ||||
| Accumulated currency translation adjustment |
(570 | ) | — | |||||
|
|
|
|
|
|||||
| Net goodwill at beginning of year |
27,375 | 25,164 | ||||||
| Goodwill acquired in acquisition |
14,887 | 2,781 | ||||||
| Currency translation adjustment |
93 | (570 | ) | |||||
|
|
|
|
|
|||||
| Net goodwill at end of year |
$ | 42,355 | $ | 27,375 | ||||
|
|
|
|
|
|||||
The accumulated impairment losses as of March 31, 2016 and March 31, 2015 were $13.2 million.
70
Table of Contents
Identifiable Intangible Assets
Identified intangible assets consisted of the following as of March 31, 2016 (in thousands):
| Gross Intangible Assets |
Accumulated Amortization |
Net Intangible Assets |
||||||||||
| Developed intellectual property |
$ | 17,309 | $ | 11,639 | $ | 5,670 | ||||||
| Customer relationships |
13,520 | 12,961 | 559 | |||||||||
| In-process intellectual property |
1,188 | — | 1,188 | |||||||||
| Contract backlog |
7,329 | 7,329 | — | |||||||||
| Other intangible assets |
1,599 | 1,409 | 190 | |||||||||
|
|
|
|
|
|
|
|||||||
| Total identifiable intangible assets |
$ | 40,945 | $ | 33,338 | $ | 7,607 | ||||||
|
|
|
|
|
|
|
|||||||
Identified intangible assets consisted of the following as of March 31, 2015 (in thousands):
| Gross Intangible Assets |
Accumulated Amortization |
Net Intangible Assets |
||||||||||
| Developed intellectual property |
$ | 16,304 | $ | 8,084 | $ | 8,220 | ||||||
| Customer relationships |
13,020 | 11,290 | 1,730 | |||||||||
| Contract backlog |
7,155 | 7,155 | — | |||||||||
| Other intangible assets |
1,608 | 1,174 | 434 | |||||||||
|
|
|
|
|
|
|
|||||||
| Total identifiable intangible assets |
$ | 38,087 | $ | 27,703 | $ | 10,384 | ||||||
|
|
|
|
|
|
|
|||||||
The following table summarizes the components of the acquired identifiable intangible assets associated with the acquisitions of RadioPulse, the Acquired MCU Business, and Zilog, Inc. The fair value of the amortizable intangible assets was determined using the income approach, royalty savings approach and cost approach.
| Acquisition Date Fair Value |
Amortization Method |
Estimated Useful Life |
||||||||||
| (In thousands) | (In months) | |||||||||||
| RadioPulse |
||||||||||||
| Developed intellectual property |
$ | 1,005 | Accelerated | 60 | ||||||||
| In process intellectual property |
1,188 | Straight-line | 60 | |||||||||
| Customer relationships |
500 | Accelerated | 36 | |||||||||
| Contract backlog |
174 | Straight-line | 6 | |||||||||
|
|
|
|||||||||||
| Total for RadioPulse |
$ | 2,867 | ||||||||||
|
|
|
|||||||||||
| Acquired MCU Business |
||||||||||||
| Developed intellectual property |
$ | 11,504 | Straight-line | 60 | ||||||||
| Customer relationships |
6,920 | Accelerated | 36 | |||||||||
| Contract backlog |
5,155 | Straight-line | 9 | |||||||||
| Trade name |
421 | Straight-line | 60 | |||||||||
|
|
|
|||||||||||
| Total for Acquired MCU Business |
$ | 24,000 | ||||||||||
|
|
|
|||||||||||
| Zilog |
||||||||||||
| Developed intellectual property |
$ | 4,800 | Straight-line | 72 | ||||||||
| Customer relationships |
6,100 | Accelerated | 37 | |||||||||
| Contract backlog |
2,000 | Straight-line | 12 | |||||||||
| Trade name |
1,100 | Straight-line | 72 | |||||||||
|
|
|
|||||||||||
| Total for Zilog |
$ | 14,000 | ||||||||||
|
|
|
|||||||||||
71
Table of Contents
The amortization of intangible assets is expected to be approximately $3.2 million, $2.9 million, $904,000, $268,000 and $240,000 in fiscal 2017, 2018, 2019, 2020 and 2021, respectively.
8. Borrowing and Installment Payment Arrangements
Bank of the West
On December 6, 2013, we entered into an Amended and Restated Credit Agreement with BOTW for a revolving line of credit of $50.0 million. All amounts owed under the credit agreement were due and payable on November 30, 2015.
On November 20, 2015, we entered into a Revolving Credit Agreement with a syndicate of banks for a revolving line of credit of $125.0 million. The agent for the banks is BOTW. The obligations are guaranteed by four of our subsidiaries. The loan is collateralized by a Contingent Collateral Agreement, under which the assets of the parent company and the four subsidiaries could be subject to security interests for the benefit of the banks in the event of a loan default. The Revolving Credit Agreement expires on November 20, 2017.
The credit agreement provides different interest rate alternatives under which we may borrow funds. We may elect to borrow based on LIBOR plus a margin or an alternative base rate plus a margin. The margin can range from 0.75% to 2.5%, depending on interest rate alternatives and on our leverage of liabilities to effective tangible net worth. The applicable interest rate as of March 31, 2016 was 2.44%. An unused commitment fee is also payable. It ranges from 0.25% to 0.625%, depending on leverage.
The terms of the facility impose restrictions on the Company’s ability to undertake certain transactions, to create liens on assets and to incur subsidiary indebtedness. In addition, the credit agreement is subject to a set of financial covenants, including minimum effective tangible net worth, the ratio of cash, cash equivalents and accounts receivable to current liabilities, profitability, a leverage ratio and a minimum amount of U.S. domestic cash on hand. As of March 31, 2016 we complied with these financial covenants, except the leverage ratio. The banks waived a default under the Revolving Credit Agreement caused by the leverage ratio, which compared total funded indebtedness as of March 31, 2016 to EBITDA for the four fiscal quarters ended March 31, 2016. The leverage ratio minimally exceeded the contractually agreed ratio of 2:1. The waiver by the banks is a one-time waiver and is not deemed to be an amendment, waiver, consent, release or modification of any other term or condition of the Revolving Credit Agreement.
As of March 31, 2016, we borrowed $80.0 million under this credit facility and repaid the outstanding principal balance from the previous agreement of $45.0 million.
In relation to the execution of the credit agreement, we incurred loan costs of $371,000. Those costs were deferred as debt issuance costs and amortized over the two-year life of the credit agreement. As of March 31, 2016, $68,000 was recognized as interest expense and the unamortized balance of the debt issuance costs was $304,000. The debt issuance costs are presented in the balance sheet as a direct deduction from the debt liability rather than as an asset in our financial statements.
The credit agreement also includes a $10.0 million letter of credit subfacility. See Note 17, “Commitments and Contingencies” for further information regarding the terms of the subfacility.
IKB Deutsche Industriebank
On June 10, 2005, IXYS GmbH, our German subsidiary, borrowed €10.0 million, or about $12.2 million at the time, from IKB. This loan was collateralized by a security interest in our facility in Lampertheim, Germany and was to be paid in full by June 30, 2020.
In April 2015, we replaced the loan with a new loan from IKB. Under the new agreement, we borrowed €6.5 million, or about $7.2 million at the time. The loan has a term ending March 31, 2022 and bears a fixed annual interest rate of 1.75%. Each fiscal quarter a principal payment of €232,000, or $263,000, and a payment of accrued interest are required. Financial covenants for a ratio of indebtedness to cash flow, a ratio of equity to total assets and a minimum stockholders’ equity for the German subsidiary must be satisfied for the loan to remain in good standing. We were in compliance with all financial covenants as of March 31, 2016. The loan may be prepaid in whole or in part with a modest penalty. The loan is also collateralized by a security interest in the facility in Lampertheim, Germany. At March 31, 2016, the outstanding principal balance was €5.6 million, or $6.3 million.
72
Table of Contents
Loans Assumed from Business Acquisition
We assumed loans of approximately $2.4 million related to the acquisition of RadioPulse. These loans are primarily short-term facilities from financial institutions and carry a weighted average interest rate of 4.9%. The facilities have been partially secured by bank deposits, which were classified as restricted cash on our consolidated balance sheets. The outstanding principal on these loans was $684,000 as of March 31, 2016 and were paid off in April 2016.
We assumed loans of approximately $723,000 related to an acquisition completed during the quarter ended June 30, 2014. The assumed borrowings were non-interest loans from government agencies to support the research and development activities with maturity dates varying from fiscal 2017 to fiscal 2021, other than a loan of $99,000 that we paid off during the quarter ended September 30, 2014.
Aggregate Debt Maturities
Aggregate debt maturities at March 31, 2016 were as follows (in thousands):
| Fiscal Year Payable |
Amount | |||
| 2017 |
$ | 1,804 | ||
| 2018 |
81,120 | |||
| 2019 |
1,120 | |||
| 2020 |
1,133 | |||
| 2021 |
1,134 | |||
| Thereafter |
1,050 | |||
|
|
|
|||
| Total |
87,361 | |||
| Less: current portion |
1,804 | |||
|
|
|
|||
| Long-term portion(1) |
$ | 85,557 | ||
|
|
|
|||
| (1) | Includes approximately $304,000 of unamortized debt issuance cost. |
9. Pension Plans
We maintain three defined benefit pension plans: one for United Kingdom employees, one for German employees, and one for Philippine employees. We deposit funds for the United Kingdom and Philippine plans with financial institutions and make payments to former German employees directly. We accrue for the unfunded portion of obligations. As of March 31, 2016, the German defined benefit plan was completely unfunded and we accrued for its obligations. The measurement date for the projected benefit obligations and the plan assets is March 31. The United Kingdom and German plans have been curtailed. As such, the plans are closed to new entrants and no credit is provided for additional periods of service.
Net Period Pension Cost
The net periodic pension expense includes the following components (in thousands):
| Year Ended March 31, | ||||||||||||
| 2016 | 2015 | 2014 | ||||||||||
| Service cost |
$ | 101 | $ | 104 | $ | 108 | ||||||
| Interest cost on projected benefit obligation |
1,450 | 1,803 | 1,886 | |||||||||
| Expected return on plan assets |
(1,721 | ) | (1,910 | ) | (1,685 | ) | ||||||
| Recognized actuarial loss |
438 | 179 | 236 | |||||||||
|
|
|
|
|
|
|
|||||||
| Net periodic pension expense |
$ | 268 | $ | 176 | $ | 545 | ||||||
|
|
|
|
|
|
|
|||||||
73
Table of Contents
Net Amount Recognized (in thousands)
| Year Ended March 31, | ||||||||
| 2016 | 2015 | |||||||
| Change in projected benefit obligation |
||||||||
| Projected benefit obligation at the beginning of the year |
$ | 47,346 | $ | 44,558 | ||||
| Service cost |
101 | 104 | ||||||
| Interest cost |
1,450 | 1,803 | ||||||
| Actuarial (gain) loss |
(1,549 | ) | 9,036 | |||||
| Benefits paid |
(1,830 | ) | (1,467 | ) | ||||
| Foreign currency adjustment |
(497 | ) | (6,688 | ) | ||||
|
|
|
|
|
|||||
| Projected benefit obligation at year end |
$ | 45,021 | $ | 47,346 | ||||
|
|
|
|
|
|||||
| Change in plan assets |
||||||||
| Fair value of plan assets at the beginning of the year |
$ | 30,114 | $ | 29,013 | ||||
| Actual return (loss) on plan assets |
(156 | ) | 4,306 | |||||
| Employer contribution |
1,009 | 1,089 | ||||||
| Benefits paid from assets |
(1,388 | ) | (970 | ) | ||||
| Foreign currency adjustment |
(865 | ) | (3,324 | ) | ||||
|
|
|
|
|
|||||
| Plan assets at fair value at year end |
$ | 28,714 | $ | 30,114 | ||||
|
|
|
|
|
|||||
| Unfunded status of the plan at year end |
$ | 16,307 | $ | 17,232 | ||||
|
|
|
|
|
|||||
| Pension liability recognized on the balance sheet due after one year |
$ | 16,307 | $ | 17,232 | ||||
| Plans with projected benefit obligation and accumulated benefit obligation in excess of plan assets: |
||||||||
| Projected benefit obligation at year end |
$ | 45,021 | $ | 47,346 | ||||
| Accumulated benefit obligation at year end |
$ | 44,509 | $ | 46,695 | ||||
| Plan assets at fair value at year end |
$ | 28,714 | $ | 30,114 | ||||
| Amounts recognized in accumulated other comprehensive income (loss): |
| |||||||
| Unrecognized actuarial loss, before tax |
$ | (12,140 | ) | $ | (12,354 | ) | ||
|
|
|
|
|
|||||
| Amount recognized as component of stockholders’ equity — pretax |
$ | (12,140 | ) | $ | (12,354 | ) | ||
|
|
|
|
|
|||||
| Accumulated benefit obligation at year end |
$ | 44,509 | $ | 46,695 | ||||
|
|
|
|
|
|||||
Weighted average actuarial assumptions used to determine benefit obligations for the plans were as follows:
| Year End March 31, | ||||||||
| 2016 | 2015 | |||||||
| Discount rate |
1.9-4.6 | % | 1.8-4.8 | % | ||||
| Expected long term rate of return on assets |
4.4-7.0 | % | 5.6-7.0 | % | ||||
| Salary scale |
5.0 | % | 6.0 | % | ||||
74
Table of Contents
Information on Plan Assets
We report and measure the plan assets of our defined benefit pension plans at fair value. The table below sets forth the fair value of our plan assets as of March 31, 2016 and 2015, using the same three-level hierarchy of fair-value inputs described in Note 4, “Fair Value” (in thousands):
| March 31, 2016 | March 31, 2015 | |||||||||||||||||||||||||||||||
| Description |
Level 1 | Level 2 | Level 3 | Total | Level 1 | Level 2 | Level 3 | Total | ||||||||||||||||||||||||
| Cash and cash funds |
$ | 121 | $ | — | $ | — | $ | 121 | $ | 2,588 | $ | — | $ | — | $ | 2,588 | ||||||||||||||||
| Currency contracts |
— | — | — | — | — | (30 | ) | — | (30 | ) | ||||||||||||||||||||||
| Equity |
351 | — | — | 351 | 19,997 | 652 | 7 | 20,656 | ||||||||||||||||||||||||
| Fixed interest |
1,225 | 96 | — | 1,321 | 861 | 5,887 | 1 | 6,749 | ||||||||||||||||||||||||
| Mutual Funds |
13,527 | 13,394 | — | 26,921 | — | — | — | — | ||||||||||||||||||||||||
| Mortgage backed securities |
— | — | — | — | — | 16 | — | 16 | ||||||||||||||||||||||||
| Swaps and other |
— | — | — | — | 2 | 133 | — | 135 | ||||||||||||||||||||||||
|
|
|
|
|
|
|
|
|
|
|
|
|
|
|
|
|
|||||||||||||||||
| Total |
$ | 15,224 | $ | 13,490 | $ | — | $ | 28,714 | $ | 23,448 | $ | 6,658 | $ | 8 | $ | 30,114 | ||||||||||||||||
|
|
|
|
|
|
|
|
|
|
|
|
|
|
|
|
|
|||||||||||||||||
During the quarter ended March 31, 2016, approximately $5.1 million of Level 2 fixed interest assets were transferred to level 1 as the prices used for those highly liquid government debt securities were sufficiently close to a binding quote price. We recognized the transfer at March 31, 2016.
The expected long term rate of return on assets is a weighted average of the returns expected for the underlying broad asset classes. The expected returns for each asset class are estimated in light of the market conditions on the accounting date and the past performance of the asset classes generally.
The amount of accumulated other comprehensive income expected to be recognized in net periodic pension cost in fiscal 2017 includes amortization of actuarial loss of $397,000. Approximately 72% of the accrued pension liability relates to the German plan and 26% to the United Kingdom plan. The accrued pension liability related to the Philippine plan is immaterial.
The investment policies and strategies for the United Kingdom plan assets are determined by the respective plan’s trustees in consultation with independent investment consultants and the employer. Our practice is to fund these plans in amounts at least sufficient to meet the minimum requirements of local laws and regulations. The trustees are aware that the nature of the liabilities of the plans will evolve as the age profile and life expectancy of the membership changes. These changing liability profiles lead to consultations about the appropriate balance of investment assets to be used by the plans (equity, debt, other), as well as timescales, within which required adjustments should be implemented. The plan assets in the United Kingdom are held in pooled investment funds operated by Fidelity Worldwide Investments. Our plan assets do not include direct holdings of our securities. The investment managers have discretion to vary the balance of investments of the scheme according to prevailing investment conditions and the trustees regularly monitor all investment decisions affecting the scheme and the overall investment performance. At March 31, 2016, approximately 50% of the assets of the United Kingdom fund were invested in diversified growth fund, which may invest in securities, collective investment schemes, money market instruments, cash and deposits, while 50% were in debt securities. The investments in debt securities are made in government instruments and investment grade corporate bonds. The target allocation of the United Kingdom plan assets that we control is 75% equity securities and 25% fixed income instruments. This objective has not been achieved due to the relative investment return of the two asset classes.
The German plan was held by a separate legal entity. As of March 31, 2016, the German defined benefit plan was completely unfunded.
For our Philippine plan, the local law requires us to appoint a trustee for the fund. We have appointed Bank of the Philippine Islands, or BPI, as the trustee of the plan. The plan assets are fully invested with BPI. The main role of the trustee is to manage the fund according to the mandate given by the retirement committee of our Philippine entity and to pay the covered/eligible employees in accordance with the plan. BPI Asset Management and Trust Group, an independent unit of BPI, provides investment management services to the trustee. At
75
Table of Contents
March 31, 2016, approximately 74% of the assets of the fund were invested in fixed income securities, 20% in equity securities and 6% in cash. The target allocation for the Philippine fund was 75% to fixed income securities, 20% to equities and 5% to cash and cash equivalents.
We expect to make contributions to the plans of approximately $1.1 million in the fiscal year ending March 31, 2017. This contribution is primary contractual.
We expect to pay benefits in each of the next five fiscal years and in the aggregate for the five fiscal years thereafter of approximately the following (in thousands):
| Fiscal Year Ended: |
Benefit Payment |
|||
| March 31, 2017 |
$ | 1,597 | ||
| March 31, 2018 |
1,625 | |||
| March 31, 2019 |
1,774 | |||
| March 31, 2020 |
1,815 | |||
| March 31, 2021 |
1,842 | |||
| Five fiscal years ended March 31, 2026 |
10,069 | |||
|
|
|
|||
| Total benefit payments for the ten fiscal years ended March 31, 2026 |
$ | 18,722 | ||
|
|
|
|||
10. Employee Equity Incentive Plans
Stock Purchase and Stock Option Plans
The 2009 Equity Incentive Plan, the 2011 Equity Incentive Plan and the 2013 Equity Incentive Plan
On September 10, 2009, our stockholders approved the 2009 Equity Incentive Plan, or the 2009 Plan, under which 900,000 shares of our common stock are reserved for the grant of stock options and other equity incentives. On September 16, 2011, our stockholders approved the 2011 Equity Incentive Plan, or the 2011 Plan, under which 600,000 shares of our common stock are reserved for the grant of stock options and other equity incentives. On August 30, 2013, our stockholders approved the 2013 Equity Incentive Plan, or the 2013 Plan, under which 2,000,000 shares of our common stock are reserved for the grant of stock options and other equity incentives. The 2009 Plan, the 2011 Plan and the 2013 Plan are referred to as the Plans.
Stock Options
Under the Plans, nonqualified and incentive stock options may be granted to employees, consultants and non-employee directors. Generally, the per share exercise price shall not be less than 100% of the fair market value of a share on the grant date. The Board of Directors has the full power to determine the provisions of each option issued under the Plans. While we may grant options that become exercisable at different times or within different periods, we have primarily granted options that vest over four years. The options, once granted, expire ten years from the date of grant.
Stock Awards
Stock awards, denominated restricted stock under the 2009 Plan and the 2011 Plan, may be granted to any employee, director or consultant under the Plans. Pursuant to a stock award, we will issue shares of common stock. Shares that are subject to the restriction will be released from restriction if certain requirements, including continued performance of services, are met.
Stock Appreciation Rights
Awards of stock appreciation rights, or SARs, may be granted to employees, consultants and non-employee directors pursuant to the Plans. A SAR is payable on the difference between the market price at the time of exercise and the exercise price at the date of grant. In any event, the exercise price of a SAR shall not be less than 100% of the fair market value of a share on the grant date and shall expire no later than ten years from the grant date. Upon exercise, the holder of a SAR shall be entitled to receive payment either in cash or a number of shares by dividing such cash amount by the fair market value of a share on the exercise date.
76
Table of Contents
Restricted Stock Units
Restricted stock units, denominated performance units in the 2009 Plan, may be granted to employees, consultants and non-employee directors under the Plan. Each restricted stock unit shall have a value equal to the fair market value of one share. After the applicable performance period has ended, the holder will be entitled to receive a payment, either in cash or in the form of shares, based on the number of restricted stock units earned over the performance period, to be determined as a function of the extent to which the corresponding performance goals or other vesting provisions have been achieved.
The 1999 Equity Incentive Plan
Prior to May 2009, stock options were granted under the 1999 Equity Incentive Plan, or the 1999 Plan, for not less than 85% of fair market value at the time of grant. Once granted, the options expire ten years from the date of grant. Options granted to employees under the 1999 Equity Incentive Plan typically vested over four years. The 1999 Plan expired in May 2009 and no additional grants may be made thereunder.
Zilog 2004 Omnibus Stock Incentive Plan
The Zilog 2004 Omnibus Stock Incentive Plan, or the Zilog 2004 Plan, was approved by the stockholders of Zilog in 2004, and was amended and approved by the stockholders of Zilog in 2007. In connection with the acquisition of Zilog, our Board of Directors approved assumption of the Zilog 2004 Plan. Employees of Zilog and persons first employed by our company after the closing of the acquisition of Zilog were eligible to receive grants under the Zilog 2004 Plan. Under the 2004 Plan, non-statutory stock options were granted. At the time of the assumption of the Zilog 2004 Plan by our company, up to 652,963 shares of our common stock were available for grant under the plan.
In general, the options and shares granted pursuant to the Zilog 2004 Plan are exercisable at such time or times, and subject to such terms and conditions (including the vesting schedule, period of exercisability and expiration date) as the plan administrator, generally the Compensation Committee of our Board of Directors, determined in the applicable option agreement. The exercise price per share, payable upon the exercise of an option, was established by such administrator at the time of the grant and is not less than the par value per share of common stock on the date of the grant and, in the case of an incentive stock option, generally is not less than 100% of the fair market value per share on the date of grant. The Zilog 2004 Plan expired in February 2014 and no additional grants may be made thereunder.
Zilog 2002 Omnibus Stock Incentive Plan
The Zilog 2002 Omnibus Stock Incentive Plan, or the Zilog 2002 Plan, was adopted in 2002. In connection with the acquisition of Zilog, our Board of Directors approved the assumption of the Zilog 2002 Plan with respect to the shares available for grant as stock options. Employees of Zilog and persons first employed by our company after the closing of the acquisition of Zilog were eligible to receive grants under the Zilog 2002 Plan. At the time of the assumption of the Zilog 2002 Plan by our company, up to 366,589 shares of our common stock were available for grant under the plan.
Stock options granted under the Zilog 2002 Plan were permitted to be: (i) incentive stock options or nonqualified stock options or (ii) EBITDA-linked options and/or non-EBITDA linked options. We did not grant any EBITDA-linked options and none are outstanding. In general, non-EBITDA-linked options granted pursuant to the Zilog 2002 Plan was exercisable at such time or times and subject to such terms and conditions (including the vesting schedule, period of exercisability and expiration date) as determined by the plan administrator in the applicable award agreements or thereafter. The exercise price per share payable upon the exercise of an option was established by such administrator at the time of grant. The term of each non-EBITDA-linked option was determined at the time of grant and does not exceed ten years. The Zilog 2002 Plan expired in May 2012 and no additional grants may be made thereunder.
Employee Stock Purchase Plan
The Board of Directors has approved the Amended and Restated 1999 Employee Stock Purchase Plan, or the Purchase Plan, and reserved a total of 1,550,000 shares of common stock for issuance under the Purchase Plan. Under the Purchase Plan, all eligible employees may purchase our common stock at a price equal to 85% of
77
Table of Contents
the lower of the fair market value at the beginning of the offer period or the semi-annual purchase date. Stock purchases are limited to 15% of an employee’s eligible compensation. During the year ended March 31, 2016, there were 97,274 shares purchased under the Purchase Plan, leaving approximately 240,241 shares available for purchase under the Purchase Plan in the future.
Fair Value of Stock Compensation
The authoritative guidance provided by FASB requires employee stock options and rights to purchase shares under stock participation plans to be accounted for under the fair value method and requires the use of an option pricing model for estimating fair value. Accordingly, share-based compensation is measured at grant date, based on the fair value of the award.
Compensation cost for equity incentive awards is based on the grant-date fair value estimated in accordance with the authoritative guidance provided by FASB. We use the straight-line attribution method to recognize share-based compensation costs over the service period of the award.
The fair value of issuances under our Purchase Plan is estimated on the issuance date and using the Black-Scholes options pricing model, consistent with the requirements of the authoritative guidance provided by FASB.
The following table summarizes the effects of share-based compensation expenses recognized on our consolidated statement of operations resulting from options granted under our equity incentive plans and rights to acquire stock granted under our Purchase Plan (in thousands):
| Year Ended March 31, | ||||||||||||
| Statement of Operations Classifications |
2016 | 2015 | 2014 | |||||||||
| Cost of goods sold |
$ | 488 | $ | 433 | $ | 457 | ||||||
| Research, development and engineering(1) |
1,272 | 814 | 978 | |||||||||
| Selling, general and administrative |
1,832 | 1,620 | 1,350 | |||||||||
|
|
|
|
|
|
|
|||||||
| Stock-based compensation effect on income before taxes |
3,592 | 2,867 | 2,785 | |||||||||
| Benefit from income taxes |
660 | 1,009 | 1,071 | |||||||||
|
|
|
|
|
|
|
|||||||
| Net stock-based compensation effects on net income |
$ | 2,932 | $ | 1,858 | $ | 1,714 | ||||||
|
|
|
|
|
|
|
|||||||
| (1) | Includes acquisition-related compensation expenses of $249,000 during fiscal 2016. |
As of March 31, 2016, there were $6.6 million of total unrecognized compensation costs related to stock options granted. The unrecognized compensation cost is expected to be recognized over a weighted average period of 2.8 years.
The weighted average estimated values of employee stock option grants and rights granted under the Purchase Plan, as well as the weighted average assumptions that were used in calculating such values during fiscal 2016, 2015 and 2014, were based on estimates at the date of grant as follows:
| Stock Options | Purchase Plan | |||||||||||||||||||||||
| Year Ended March 31, | Year Ended March 31, | |||||||||||||||||||||||
| 2016 | 2015 | 2014 | 2016 | 2015 | 2014 | |||||||||||||||||||
| Weighted average estimated per share fair value of grant |
$ | 4.83 | $ | 5.54 | $ | 5.31 | $ | 3.33 | $ | 2.90 | $ | 2.75 | ||||||||||||
| Risk-free interest rate |
1.8 | % | 1.8 | % | 1.8 | % | 0.1 | % | 0.1 | % | 0.1 | % | ||||||||||||
| Expected term in years |
6.45 | 6.25 | 6.05 | 0.50 | 0.50 | 0.50 | ||||||||||||||||||
| Volatility |
44.9 | % | 52.2 | % | 54.9 | % | 39.8 | % | 36.9 | % | 37.0 | % | ||||||||||||
| Dividend yield(1) |
1.2 | % | 1.0 | % | 1.0 | % | 1.1 | % | 1.1 | % | 0 | % | ||||||||||||
(1) Prior to October 1, 2013, the fair value of our equity awards was based on 0% dividend yield.
We estimate the expected term of options granted based on the historical average period over which the options are exercised by employees. We estimate the volatility of our common stock based on historical volatility measures. We base the risk-free interest rate that is used in the option valuation model on U.S. Treasury zero-coupon issues with remaining terms similar to the expected term of the options.
78
Table of Contents
After establishing a history of quarterly dividend payments, we started using a dividend yield during the quarter ended December 31, 2013. We estimate the dividend yield based on the historical trend and our expectation of future dividends. Dividend yield is calculated based on the annualized cash dividends per share declared during the quarter and the closing stock price on the date of grant. In the case of the Purchase Plan, the dividend yield calculation was first effective for the grant date of June 1, 2014. We are required to estimate forfeitures at the time of grants and revise those estimates in subsequent periods if actual forfeitures differ from those estimates. We use historical data to estimate pre-vesting option forfeitures and record stock-based compensation expense only for those awards that are expected to vest. All stock-based payment awards are amortized on a straight-line basis over the requisite service periods of the awards, which are generally the vesting periods.
We recognize the estimated compensation cost of restricted stock over the vesting term. The estimated compensation cost is based on the fair value of our common stock on the date of grant.
We recognize the compensation cost relating to stock bonuses on the date of grant based on the fair value of our common stock on the date of grant, as such stock bonuses are vested immediately. We did not grant any bonus shares during fiscal 2016.
Stock compensation activity under our equity incentive plans for fiscal 2016, 2015 and 2014 is summarized below:
| Shares Available for Grant |
Options Outstanding | Weighted Average Exercise Price per Share |
||||||||||||||
| Number of Shares(1) |
Intrinsic Value(2) |
|||||||||||||||
| (000) | ||||||||||||||||
| Balances, March 31, 2013 |
451,713 | 5,327,473 | $ | 4,273 | $ | 10.04 | ||||||||||
| New shares authorized(3) |
2,000,000 | — | ||||||||||||||
| Plan authorization expired |
(47,963 | ) | — | |||||||||||||
| Options granted |
(515,000 | ) | 515,000 | $ | 10.63 | |||||||||||
| Options exercised |
— | (572,338 | ) | $ | 1,695 | $ | 8.72 | |||||||||
| Options cancelled |
24,000 | (34,000 | ) | $ | 11.42 | |||||||||||
| Options expired |
17,500 | (34,500 | ) | $ | 12.62 | |||||||||||
|
|
|
|
|
|||||||||||||
| Balances, March 31, 2014 |
1,930,250 | 5,201,635 | $ | 8,658 | $ | 10.22 | ||||||||||
| Options granted |
(249,000 | ) | 249,000 | $ | 11.83 | |||||||||||
| Options exercised |
— | (339,374 | ) | $ | 1,310 | $ | 8.62 | |||||||||
| Options cancelled |
39,750 | (94,250 | ) | $ | 11.46 | |||||||||||
| Options expired |
26,000 | (74,500 | ) | $ | 11.17 | |||||||||||
|
|
|
|
|
|||||||||||||
| Balances, March 31, 2015 |
1,747,000 | 4,942,511 | $ | 10,831 | $ | 10.37 | ||||||||||
| Options granted |
(1,124,000 | ) | 1,124,000 | $ | 11.72 | |||||||||||
| Options exercised |
— | (382,826 | ) | $ | 1,551 | $ | 9.02 | |||||||||
| Options cancelled |
14,500 | (14,500 | ) | $ | 11.31 | |||||||||||
| Options expired |
— | (434,788 | ) | $ | 14.68 | |||||||||||
|
|
|
|
|
|||||||||||||
| Balances, March 31, 2016 |
637,500 | 5,234,397 | $ | 6,456 | $ | 10.40 | ||||||||||
|
|
|
|
|
|||||||||||||
| (1) | The number of stock options exercised includes shares that were withheld on behalf of employees to satisfy the statutory tax withholding requirements. |
| (2) | Except for options exercised, these amounts represent the difference between the exercise price and $11.22 per share, the closing price of our stock on March 31, 2016 as reported on the NASDAQ Global Select Market, for all in-the-money, outstanding and exercisable options. |
| (3) | On August 30, 2013, our stockholders approved the 2013 Plan, under which 2,000,000 shares of our common stock are reserved for the grant of stock options. |
79
Table of Contents
The following table summarizes information about stock options outstanding at March 31, 2016:
| Options Outstanding |
Options Exercisable | |||||||||||||||||||
| Exercise Price per Share |
Number
of Shares Outstanding |
Weighted Average Contractual Life |
Weighted Average Exercise Price per Share |
Number of Shares Exercisable |
Weighted Average Exercise Price per Share |
|||||||||||||||
| $ 5.01 - $ 7.75 |
819,897 | 2.6 | $ | 6.63 | 819,897 | $ | 6.63 | |||||||||||||
| $ 7.76 - $10.00 |
1,223,500 | 4.8 | $ | 9.33 | 1,017,750 | $ | 9.29 | |||||||||||||
| $10.01 - $12.50 |
2,448,000 | 6.6 | $ | 11.42 | 1,331,916 | $ | 11.52 | |||||||||||||
| $12.51 - $13.37 |
743,000 | 6.1 | $ | 12.96 | 450,000 | $ | 12.69 | |||||||||||||
|
|
|
|
|
|||||||||||||||||
| $ 5.01 - $13.37 |
5,234,397 | 5.5 | $ | 10.40 | 3,619,563 | $ | 9.93 | |||||||||||||
|
|
|
|
|
|||||||||||||||||
Of the 5,234,397 options outstanding, 3,619,563 were exercisable on March 31, 2016 at a weighted average exercise price of $9.93 per share, with an intrinsic value of $6.0 million. The weighted average remaining contractual life of options outstanding and options exercisable at March 31, 2016 was 5.5 years and 4 years, respectively. The fair value of options that vested during the year ended March 31, 2016 was $2.8 million.
11. Accumulated Other Comprehensive Income (Loss)
The components and the changes in accumulated other comprehensive income (loss), net of tax, were as follows (in thousands):
| Foreign Currency |
Unrealized Gains (Losses) on Securities |
Defined Benefit Pension Plans |
Accumulated Other Comprehensive Income (Loss) |
|||||||||||||
| Balance as of March 31, 2013 |
$ | 2,982 | $ | 60 | $ | (6,135 | ) | $ | (3,093 | ) | ||||||
| Other comprehensive income before reclassifications |
7,553 | 361 | 89 | 8,003 | ||||||||||||
| Net losses (gains) reclassified from accumulated other comprehensive income (loss) |
— | (96 | ) | 215 | 119 | |||||||||||
|
|
|
|
|
|
|
|
|
|||||||||
| Net current period other comprehensive income |
7,553 | 265 | 304 | 8,122 | ||||||||||||
|
|
|
|
|
|
|
|
|
|||||||||
| Balance as of March 31, 2014 |
10,535 | 325 | (5,831 | ) | 5,029 | |||||||||||
| Other comprehensive loss before reclassifications |
(24,112 | ) | (1,536 | ) | (3,830 | ) | (29,478 | ) | ||||||||
| Net losses reclassified from accumulated other comprehensive income (loss) |
— | 1,218 | 143 | 1,361 | ||||||||||||
|
|
|
|
|
|
|
|
|
|||||||||
| Net current period other comprehensive loss |
(24,112 | ) | (318 | ) | (3,687 | ) | (28,117 | ) | ||||||||
|
|
|
|
|
|
|
|
|
|||||||||
| Balance as of March 31, 2015 |
(13,577 | ) | 7 | (9,518 | ) | (23,088 | ) | |||||||||
| Other comprehensive income (loss) before reclassifications |
2,938 | (362 | ) | (71 | ) | 2,505 | ||||||||||
| Net losses reclassified from accumulated other comprehensive income (loss) |
— | 273 | 44 | 317 | ||||||||||||
|
|
|
|
|
|
|
|
|
|||||||||
| Net current period other comprehensive income (loss) |
2,938 | (89 | ) | (27 | ) | 2,822 | ||||||||||
|
|
|
|
|
|
|
|
|
|||||||||
| Balance as of March 31, 2016 |
$ | (10,639 | ) | $ | (82 | ) | $ | (9,545 | ) | $ | (20,266 | ) | ||||
|
|
|
|
|
|
|
|
|
|||||||||
80
Table of Contents
The amounts reclassified out of accumulated other comprehensive income (loss) for the fiscal year 2016, 2015 and 2014 are as follows (in thousands):
| Year Ended March 31, | ||||||||||||||
| 2016 | 2015 | 2014 | ||||||||||||
| Accumulated Other Comprehensive Income |
Amount Reclassified from Accumulated Other Comprehensive Income (Loss) |
Impacted Line Item on Consolidated | ||||||||||||
| Net gain (loss) on sales of investments |
$(1 | ) | $30 | $155 | Other income (expense), net | |||||||||
| Impairment of marketable securities |
(454 | ) | (1,903 | ) | (7 | ) | Other income (expense), net | |||||||
| Recognized actuarial loss |
(437 | ) | (179 | ) | (236 | ) | Cost of goods sold | |||||||
|
|
|
|
|
|
|
|||||||||
| Subtotal |
(892 | ) | (2,052 | ) | (88 | ) | Income before income tax provision | |||||||
|
|
|
|
|
|
|
|||||||||
| Tax impact |
575 | 691 | (31 | ) | Provision for income tax | |||||||||
|
|
|
|
|
|
|
|||||||||
| Total reclassifications for the year |
$(317 | ) | $(1,361 | ) | $(119 | ) | Net income | |||||||
|
|
|
|
|
|
|
|||||||||
12. Computation of Earnings per Share
Basic and diluted earnings per share are calculated as follows (in thousands, except per share amounts):
| Year Ended March 31, | ||||||||||||
| 2016 | 2015 | 2014 | ||||||||||
| Net income |
$ | 14,741 | $ | 23,740 | $ | 6,046 | ||||||
|
|
|
|
|
|
|
|||||||
| Weighted average shares — basic |
31,579 | 31,531 | 31,146 | |||||||||
|
|
|
|
|
|
|
|||||||
| Weighted average shares — diluted |
32,381 | 32,239 | 31,916 | |||||||||
|
|
|
|
|
|
|
|||||||
| Net income per share — basic |
$ | 0.47 | $ | 0.75 | $ | 0.19 | ||||||
|
|
|
|
|
|
|
|||||||
| Net income per share — diluted |
$ | 0.46 | $ | 0.74 | $ | 0.19 | ||||||
|
|
|
|
|
|
|
|||||||
Diluted weighted average shares include approximately 802,000, 708,000 and 770,000 common equivalent shares from stock options for fiscal 2016, 2015 and 2014, respectively.
Basic net income available per common share is computed using net income and the weighted average number of common shares outstanding during the period. Diluted net income per common share is computed using net income and the weighted average number of common shares outstanding, assuming dilution, which includes potentially dilutive common shares outstanding during the period. Potentially dilutive common shares include the assumed exercise of stock options using the treasury stock method. In fiscal 2016, 2015 and 2014, there were outstanding options to purchase 1,943,420, 2,357,772 and 2,483,106 shares, respectively, at weighted average exercise prices of $12.02, $12.24 and $11.93 per share, respectively, that were not included in the computation of dilutive net income per share since the exercise prices of the options exceeded the market price of the common stock and thus their inclusion would be anti-dilutive. These options could dilute earnings per share in future periods if the market price of the common stock increases.
13. Related Party Transactions
We own 45% of the outstanding equity of Powersem, a module manufacturer based in Germany. The investment is accounted for using the equity method. In fiscal 2016, 2015 and 2014, we recorded revenues of $1.5 million, $1.8 million and $2.1 million, respectively, from sales of products to Powersem for use as components in their products. In fiscal 2016, 2015 and 2014, we purchased $3.4 million, $4.0 million and $5.2 million, respectively, of products from Powersem. At March 31, 2016 and 2015, the accounts receivable balances from our sales to Powersem were $99,000 and $82,000, respectively. The accounts payable balances to Powersem, as of March 31, 2016 and 2015, were $63,000 and $115,000, respectively. The carrying values at March 31, 2016 and March 31, 2015 were $2.5 million and $2.6 million, respectively.
81
Table of Contents
We own 20% of the outstanding equity of EB Tech Ltd., a company with expertise in radiation technology based in South Korea. The investment is accounted for using the equity method. In fiscal 2016, 2015 and 2014, EB Tech rendered processing services totaling approximately $378,000, $278,000 and $211,000, respectively, to our company. As of March 31, 2016 and 2015, our accounts payable balances to EB Tech were $26,000 and $23,000, respectively. There was no accounts payable balance due to EB Tech as of March 31, 2014. The carrying values at March 31, 2016 and at March 31, 2015 were $2.7 million.
On December 12, 2014, we acquired 24.3% of the outstanding common shares of ATEC, a supplier located in the Philippines that provides assembly and test services. The investment is accounted for by the equity method. In fiscal 2016 and 2015, ATEC rendered assembly and test services totaling approximately $8.0 million and $2.0 million to our company, respectively. As of March 31, 2016 and 2015, the accounts payable balances to ATEC were $737,000 and $632,000, respectively. The carrying values at March 31, 2016 and at March 31, 2015 were $5.7 million.
We had no other material related party transactions with companies in which we invested and which were accounted for by the equity method during fiscal 2016.
14. Employee Savings and Retirement Plans
We have a 401(k) plan, known as the “IXYS Corporation and Subsidiary Employee Savings and Retirement Plan.” Eligibility to participate in the plan is subject to certain minimum service requirements. Employees may voluntarily contribute up to the limit prescribed by law and we may make matching contributions in our discretion. Employees are 100% vested immediately in any contributions by us. For the years ended March 31, 2016, 2015 and 2014, we contributed $616,000, $615,000 and $620,000, respectively.
IXYS UK also has a defined contribution plan, known as “Westcode Semiconductor Group Personal Pension.” The plan is subject to minimum service requirements. Employees contribute up to 4.5% of the pensionable salary. IXYS UK contributes up to 7% depending upon the contribution by the employee. Additionally, IXYS UK pays the annual management charges for the plan. Employees are 100% vested immediately in any contributions by IXYS UK. For the years ended March 31, 2016, 2015 and 2014, IXYS UK contributed $278,000, $287,000 and $313,000, respectively.
15. Segment and Geographic Information
We have a single operating segment and reportable segment. We design develop, manufacture and market high performance semiconductor products. Our Chief Executive Officer and our President, together, have been identified as the chief operating decision makers. Our chief operating decision makers review financial information presented on one operating segment basis for the purpose of making decisions, allocating resources and assessing financial performance.
82
Table of Contents
Our net revenues by major geographic areas (based on destination) were as follows (in thousands):
| Year Ended March 31, | ||||||||||||
| 2016 | 2015 | 2014 | ||||||||||
| United States |
$ | 75,994 | $ | 85,314 | $ | 89,734 | ||||||
| Europe and the Middle East |
||||||||||||
| France |
9,076 | 7,917 | 5,554 | |||||||||
| Germany |
33,215 | 32,866 | 34,423 | |||||||||
| Hungary |
2,082 | 2,571 | 3,620 | |||||||||
| Italy |
4,328 | 4,645 | 4,506 | |||||||||
| Netherlands |
3,608 | 2,315 | 2,080 | |||||||||
| Russia |
4,755 | 5,051 | 2,821 | |||||||||
| Sweden |
2,155 | 4,460 | 4,938 | |||||||||
| Switzerland |
2,789 | 2,569 | 3,714 | |||||||||
| Turkey |
2,376 | 2,658 | 2,323 | |||||||||
| United Kingdom |
13,502 | 19,832 | 19,524 | |||||||||
| Other |
14,437 | 15,223 | 15,546 | |||||||||
| Asia Pacific |
||||||||||||
| China |
79,575 | 83,597 | 83,849 | |||||||||
| Indonesia |
2,128 | 3,224 | 1,914 | |||||||||
| Japan |
9,271 | 8,469 | 6,740 | |||||||||
| Korea |
23,215 | 22,371 | 19,466 | |||||||||
| Malaysia |
4,662 | 5,580 | 3,766 | |||||||||
| Singapore |
12,353 | 11,694 | 11,838 | |||||||||
| Taiwan |
3,151 | 2,688 | 2,962 | |||||||||
| Thailand |
3,904 | 4,300 | 3,031 | |||||||||
| Other |
2,083 | 1,143 | 2,075 | |||||||||
| Rest of the World |
||||||||||||
| India |
4,293 | 5,163 | 5,245 | |||||||||
| Other |
4,257 | 5,117 | 6,661 | |||||||||
|
|
|
|
|
|
|
|||||||
| Total |
$ | 317,209 | $ | 338,767 | $ | 336,330 | ||||||
|
|
|
|
|
|
|
|||||||
The following table sets forth net revenues for each of our product groups fiscal 2016, 2015 and 2014 (in thousands):
| Year Ended March 31, | ||||||||||||
| 2016 | 2015 | 2014 | ||||||||||
| Power semiconductors |
$ | 213,347 | $ | 219,445 | $ | 222,813 | ||||||
| Integrated circuits |
84,078 | 95,547 | 91,189 | |||||||||
| Systems and RF power semiconductors |
19,784 | 23,775 | 22,328 | |||||||||
|
|
|
|
|
|
|
|||||||
| Total |
$ | 317,209 | $ | 338,767 | $ | 336,330 | ||||||
|
|
|
|
|
|
|
|||||||
In fiscal 2016, 2015 and 2014, one distributor accounted for 12.2%, 10.2% and 10.8% of our net revenues, respectively. In fiscal 2015, another distributor accounted for 10.5% of our net revenues.
83
Table of Contents
Our principal foreign operations consist of our subsidiaries, IXYS GmbH in Germany, IXYS UK in the United Kingdom and IXYS Semiconductor BV in The Netherlands. The following table summarizes the net revenues, net income and long-lived assets of our domestic and foreign operations (in thousands):
| Year Ended March 31, | ||||||||||||
| 2016 | 2015 | 2014 | ||||||||||
| Net revenues: |
||||||||||||
| Foreign |
$ | 159,984 | $ | 188,964 | $ | 167,428 | ||||||
| Domestic |
157,225 | 149,803 | 168,902 | |||||||||
|
|
|
|
|
|
|
|||||||
| $ | 317,209 | $ | 338,767 | $ | 336,330 | |||||||
|
|
|
|
|
|
|
|||||||
| Net income: |
||||||||||||
| Foreign |
$ | 11,039 | $ | 21,379 | $ | 4,087 | ||||||
| Domestic |
3,702 | 2,361 | 1,959 | |||||||||
|
|
|
|
|
|
|
|||||||
| $ | 14,741 | $ | 23,740 | $ | 6,046 | |||||||
|
|
|
|
|
|
|
|||||||
| Year Ended March 31, | ||||||||||||
| 2016 | 2015 | 2014 | ||||||||||
| Property, plant and equipment, net: |
||||||||||||
| United States |
$ | 26,792 | $ | 27,740 | $ | 27,287 | ||||||
| Germany |
14,506 | 13,228 | 21,697 | |||||||||
| Other countries |
1,325 | 1,577 | 1,585 | |||||||||
|
|
|
|
|
|
|
|||||||
| Total property, plant and equipment |
$ | 42,623 | $ | 42,545 | $ | 50,569 | ||||||
|
|
|
|
|
|
|
|||||||
16. Income Taxes
During the fiscal year ended March 31, 2016, we recorded out-of-period adjustments that increased the income tax provision by a net amount of $1.4 million. We recorded a reversal of a deferred tax asset that was overstated in the amount of $2.3 million in the financial statements for the fiscal year ended March 31, 2012, as well as the balance sheets for the fiscal years thereafter and the interim periods within those years and through September 30, 2015. This adjustment was partially offset by a reduction of $893,000 of tax expense relating to an overstatement in income tax reserves for the financial statements for the fiscal year ended March 31, 2015 and in the balance sheets of the interim periods in the current year through September 30, 2015. The out-of-period adjustments did not have any impact on our cash flow statements in any of the reporting periods. We believe that these out-of-period adjustments are not material to our financial statements for the relevant years, including our current fiscal year.
Income before income tax consists of the following (in thousands):
| Year Ended March 31, | ||||||||||||
| 2016 | 2015 | 2014 | ||||||||||
| Domestic |
$ | 9,030 | $ | 3,390 | $ | 7,104 | ||||||
| International |
14,459 | 27,040 | 6,355 | |||||||||
|
|
|
|
|
|
|
|||||||
| $ | 23,489 | $ | 30,430 | $ | 13,459 | |||||||
|
|
|
|
|
|
|
|||||||
84
Table of Contents
Our provision for income taxes consists of the following (in thousands):
| Year Ended March 31, | ||||||||||||
| 2016 | 2015 | 2014 | ||||||||||
| Current: |
||||||||||||
| Federal |
$ | 1,418 | $ | 201 | $ | 4,804 | ||||||
| State |
126 | 83 | 73 | |||||||||
| Foreign |
3,436 | 5,066 | 3,087 | |||||||||
|
|
|
|
|
|
|
|||||||
| 4,980 | 5,350 | 7,964 | ||||||||||
|
|
|
|
|
|
|
|||||||
| Deferred: |
||||||||||||
| Federal |
3,554 | 945 | 183 | |||||||||
| State |
189 | 20 | 86 | |||||||||
| Foreign |
25 | 375 | (820 | ) | ||||||||
|
|
|
|
|
|
|
|||||||
| 3,768 | 1,340 | (551 | ) | |||||||||
|
|
|
|
|
|
|
|||||||
| Total income tax provision |
$ | 8,748 | $ | 6,690 | $ | 7,413 | ||||||
|
|
|
|
|
|
|
|||||||
The reconciliation of our effective tax rate to the U.S. statutory federal income tax rate is as follows:
| Year Ended March 31, | ||||||||||||
| 2016 | 2015 | 2014 | ||||||||||
| (%) | (%) | (%) | ||||||||||
| Statutory federal income tax rate |
35 | 35 | 35 | |||||||||
| State taxes, net of federal tax benefit |
1 | 1 | 1 | |||||||||
| Expense (benefit) of lower-tax foreign jurisdictions |
(10 | ) | (15 | ) | — | |||||||
| Research and development tax credits |
(3 | ) | (1 | ) | (1 | ) | ||||||
| Valuation allowance |
3 | — | 2 | |||||||||
| Permanent items |
(5 | ) | — | 3 | ||||||||
| Tax reserves |
— | — | 2 | |||||||||
| Tax asset write-off |
10 | — | — | |||||||||
| Tax assessment |
— | — | 1 | |||||||||
| Foreign income |
6 | 2 | 12 | |||||||||
|
|
|
|
|
|
|
|||||||
| Effective tax provision rate |
37 | 22 | 55 | |||||||||
|
|
|
|
|
|
|
|||||||
The significant components of net deferred income tax assets are as follows (in thousands):
| March 31, | ||||||||
| 2016 | 2015 | |||||||
| Deferred tax assets: |
||||||||
| Reserves and allowances |
$ | 6,018 | $ | 5,612 | ||||
| Other liabilities and accruals |
6,176 | 5,929 | ||||||
| Depreciable assets |
83 | 2,951 | ||||||
| Net operating loss carryforward |
11,675 | 13,993 | ||||||
| Share-based compensation |
5,098 | 4,971 | ||||||
| Credits carryforward |
2,440 | 2,403 | ||||||
|
|
|
|
|
|||||
| Total deferred tax assets |
31,490 | 35,859 | ||||||
|
|
|
|
|
|||||
| Less: Valuation allowance and other reserves |
(3,466 | ) | (3,902 | ) | ||||
|
|
|
|
|
|||||
| Net deferred tax asset |
$ | 28,024 | $ | 31,957 | ||||
|
|
|
|
|
|||||
85
Table of Contents
The authoritative guidance provided by FASB requires deferred tax assets and liabilities to be recognized for temporary differences between the tax basis and financial reporting basis of assets and liabilities, computed at the expected tax rates for the periods in which the assets or liabilities will be realized, as well as for the expected tax benefit of net operating loss and tax credit carryforwards. Significant management judgment is required in determining our provision for income taxes, our deferred tax assets and liabilities and any valuation allowance recorded against net deferred tax assets. Our management evaluates the recoverability of these net deferred tax assets in accordance with the authoritative guidance provided by FASB. Our ability to utilize the deferred tax assets and the continuing need for a related valuation allowance are being monitored on an ongoing basis. During fiscal 2016, we recorded certain adjustments on valuation allowances, tax contingency reserves and other temporary items. The impact of these adjustments is discussed further in this note.
Under the Tax Reform Act of 1986, the amounts of and benefits from net operating loss carryforwards and tax credit carryforwards may be impaired or limited in certain circumstances. Events that may restrict utilization of net operating loss and credit carryforwards include, but are not limited to, certain ownership change limitations and continuity of business requirements, as defined in Internal Revenue Code Section 382 and similar state provisions. Current utilization of carryforwards is restricted by an annual limitation, which results in the expiration of net operating loss carryforwards and credit carryforwards before they can be utilized.
In aggregate, the valuation allowance in fiscal 2016 decreased by $436,000 as compared to fiscal 2015, while it increased by $32,000 in fiscal 2015 when compared to fiscal 2014. The decrease in fiscal 2016 was primarily related to net operating losses that expired.
At March 31, 2016, we had U.S. net operating loss carryforwards of approximately $27.8 million, all of which are subject to the limitations under Section 382 of the U.S. tax code resulting from a change in ownership. These carryforwards will expire, if not utilized, from fiscal 2017 to 2023 for U.S. tax purposes. None of the U.S. net operating loss carryforwards include stock option deductions arising from our equity incentive plans. As of March 31, 2016 we had net operating loss carryforwards for foreign income tax purposes of approximately $17.1 million with a corresponding valuation allowance of $13.2 million.
At the end of fiscal 2016, we had $6.9 million of gross unrecognized tax benefits, all of which would affect our effective tax rate if recognized. The $6.9 million has been classified under “Other long term liabilities” on our consolidated balance sheet. Our liability for unrecognized tax benefits decreased by $6,000 from the prior year, principally due to release of $772,000 in reserves due to the lapse of statutes of limitation. This was partially offset by an increase in current year adjustments of $766,000. We do not anticipate any unrecognized tax benefits in the next 12 months that would result in a material change to our financial position.
We include interest and penalties in the financial statements as a component of income tax expense. We had $1.5 million of accrued interest and penalties at March 31, 2016, which included $488,000 of interest and penalties accrued for the year ended March 31, 2016.
The aggregate changes in the balance of gross unrecognized tax benefits were as follows (in thousands):
| Balance as of March 31, 2013 |
$ | 6,736 | ||
| Lapse of statute of limitations |
(941 | ) | ||
| Increases in balances related to tax positions taken during prior periods |
499 | |||
| Increases in balances related to tax positions taken during the current period |
684 | |||
|
|
|
|||
| Balance as of March 31, 2014 |
6,978 | |||
| Lapse of statute of limitations |
(3,070 | ) | ||
| Increases in balances related to tax positions taken during prior periods |
213 | |||
| Increases in balances related to tax positions taken during the current period |
2,831 | |||
|
|
|
|||
| Balance as of March 31, 2015 |
6,952 | |||
| Lapse of statute of limitations |
(772 | ) | ||
| Increases in balances related to tax positions taken during prior periods |
129 | |||
| Increases in balances related to tax positions taken during the current period |
637 | |||
|
|
|
|||
| Balance as of March 31, 2016 |
$ | 6,946 | ||
|
|
|
86
Table of Contents
In addition to the above uncertain tax positions, we also had uncertain tax positions related to the realizability of net operating losses at certain foreign jurisdictions aggregating to $4.1 million at March 31, 2016 and at March 31, 2015.
As of March 31, 2016, U.S. income taxes were not provided for on a cumulative total of approximately $124.9 million of undistributed earnings for certain foreign subsidiaries. We intend to reinvest these earnings indefinitely in operations outside of the U.S. If these earnings were distributed to the U.S. in the form of dividends or otherwise, or if the shares of the relevant foreign subsidiaries were sold or otherwise transferred, we would be subject to additional U.S. income taxes (subject to an adjustment for foreign tax credits) and foreign withholding taxes. Determination of the amount of unrecognized deferred income tax liability related to these earnings is not practicable.
We conduct business globally and, as a result, we file income tax returns in various jurisdictions throughout the world including the U.S. federal and various U.S. state jurisdictions as well as with various foreign jurisdictions. In the normal course of business we are subject to examination by taxing authorities throughout the world. We remain subject to U.S. federal examination for years from 2005 and forward by virtue of the tax attributes carrying forward from those years. We also remain subject to examination in most jurisdictions for all years since 2010.
The Protecting Americans from Tax Hikes Act of 2015, or the Act, was signed into law on December 18, 2015. The Act contains a number of provisions including, most notably, a permanent extension of the U.S. federal research tax credit. The Company’s tax provision for fiscal 2016 reflects the benefit of the U.S. federal research credit.
17. Commitments and Contingencies
Commitments
We rent certain of our facilities under operating leases expiring through fiscal 2023. Future operating leases and commitments for the purchase of inventory and property and equipment are as follows (in thousands):
| Fiscal Year Ended March 31, |
Operating Leases |
Other Purchase Obligations |
||||||
| 2017 |
$ | 1,385 | $ | 24,489 | ||||
| 2018 |
1,156 | 845 | ||||||
| 2019 |
980 | — | ||||||
| 2020 |
779 | — | ||||||
| 2021 |
565 | — | ||||||
| Thereafter |
519 | — | ||||||
|
|
|
|
|
|||||
| Total minimum payments |
$ | 5,384 | $ | 25,334 | ||||
|
|
|
|
|
|||||
Rent expense for fiscal years ended March 31, 2016, 2015 and 2014 amounted to $1.6 million, $1.4 million and $1.4 million, respectively.
As of March 31, 2016 and 2015, we had cash deposits with financial institutions of $277,000 and $266,000, respectively, which were restricted as to use and represent funds segregated for pension payments in Germany. These balances are included in restricted cash on our balance sheets.
Bank of the West
On November 20, 2015, we entered into an Amended and Restated Credit Agreement with a syndicate of banks, whose agent is BOTW for a revolving line of credit of $125.0 million. All amounts owed under the credit agreement are due and payable on November 20, 2017. Borrowings may be repaid and re-borrowed at any time during the term of the credit agreement. The obligations are guaranteed by four of our subsidiaries. The loan is collateralized by a Contingent Collateral Agreement, under which the assets of the parent company and the four subsidiaries could be subject to security interests for the benefit of the banks in the event of a loan default. The credit agreement includes a letter of credit subfacility, under which the lenders agree to issue letters of credit of up to $10.0 million.
87
Table of Contents
However, borrowing under this subfacility is limited to the extent of availability under the $125.0 million revolving line of credit. At March 31, 2016, the outstanding principal under the credit agreement was $80.0 million. See Note 8, “Borrowing and Installment Payment Arrangements” for further information regarding the terms of the credit agreement.
Selected Quarterly Financial Data (unaudited, in thousands, except per share amounts)
The following table sets forth a summary of our unaudited quarterly operating results for each of the last eight quarters in the period ended March 31, 2016. We have derived this data from our unaudited consolidated interim financial statements that, in our opinion, have been prepared on substantially the same basis as the audited financial statements contained elsewhere in this report and include all normal recurring adjustments necessary for a fair presentation of the financial information for the periods presented. These unaudited quarterly results should be read in conjunction with our financial statements and notes thereto included elsewhere in this report. The operating results in any quarter are not necessarily indicative of the results that may be expected for any future period.
Fiscal Year Ended March 31, 2016
| Three Months Ended | ||||||||||||||||
| March 31, 2016 |
December 31, 2015 |
September 30, 2015 |
June 30, 2015 |
|||||||||||||
| Net revenues |
$ | 79,772 | $ | 75,133 | $ | 80,257 | $ | 82,047 | ||||||||
| Gross profit |
24,115 | 24,029 | 26,012 | 25,602 | ||||||||||||
| Operating income |
6,834 | 6,262 | 7,033 | 5,704 | ||||||||||||
| Net income(1) |
$ | 6,197 | $ | 2,286 | $ | 3,273 | $ | 2,985 | ||||||||
| Net income per share — basic(2) |
$ | 0.20 | $ | 0.07 | $ | 0.10 | $ | 0.09 | ||||||||
| Net income per share — diluted(2) |
$ | 0.19 | $ | 0.07 | $ | 0.10 | $ | 0.09 | ||||||||
| Weighted average shares used in per share calculation |
||||||||||||||||
| Basic |
31,441 | 31,487 | 31,651 | 31,746 | ||||||||||||
| Diluted |
32,076 | 32,343 | 32,380 | 32,733 | ||||||||||||
Fiscal Year Ended March 31, 2015
| Three Months Ended | ||||||||||||||||
| March 31, 2015 |
December 31, 2014 |
September 30, 2014 |
June 30, 2014 |
|||||||||||||
| Net revenues |
$ | 82,926 | $ | 81,326 | $ | 86,435 | $ | 88,080 | ||||||||
| Gross profit |
25,280 | 25,515 | 26,170 | 25,000 | ||||||||||||
| Operating income |
7,525 | 7,616 | 7,090 | 5,279 | ||||||||||||
| Net income |
$ | 7,796 | $ | 6,622 | $ | 5,747 | $ | 3,575 | ||||||||
| Net income per share — basic(2) |
$ | 0.25 | $ | 0.21 | $ | 0.18 | $ | 0.11 | ||||||||
| Net income per share — diluted(2) |
$ | 0.24 | $ | 0.21 | $ | 0.18 | $ | 0.11 | ||||||||
| Weighted average shares used in per share calculation |
||||||||||||||||
| Basic |
31,663 | 31,585 | 31,499 | 31,379 | ||||||||||||
| Diluted |
32,413 | 32,231 | 32,235 | 32,075 | ||||||||||||
| (1) | During the fiscal year ended March 31, 2016, we recorded out-of-period adjustments that increased the income tax provision by a net amount of $1.4 million. See Note 16, “Income Taxes” in the Notes to Consolidated Financial Statements in Item 8 of this Annual Report on Form 10-K for further discussion of an out-of-period adjustment during the quarter ended December 31, 2015. |
| (2) | The sum of the four quarterly calculations of net income per share are not equal to the annual net income per share due to the use of quarterly weighted average shares used to determine the quarterly net income per share as compared to the annual weighted average shares used to determine the annual net income per share. |
88
Table of Contents
Item 9. Changes in and Disagreements with Accountants on Accounting and Financial Disclosure
Not applicable.
Item 9A. Controls and Procedures
Disclosure Controls and Procedures
An evaluation was carried out under the supervision and with the participation of our Chief Executive Officer and our Chief Financial Officer of the effectiveness of our disclosure controls and procedures (as defined in Rule 13a-15(e) under the Securities Exchange Act of 1934, as amended, or Exchange Act) as of March 31, 2016. This evaluation included various processes that were carried out in an effort to ensure that information required to be disclosed in our Securities and Exchange Commission, or SEC, reports is recorded, processed, summarized and reported within the time periods specified by the SEC. In this evaluation, the Chief Executive Officer and the Chief Financial Officer considered whether our disclosure controls and procedures were also effective to ensure that information required to be disclosed in the reports that we file or submit under the Exchange Act is accumulated and communicated to our management, including our Chief Executive Officer and Chief Financial Officer, to allow timely decisions regarding required disclosure. This evaluation also included consideration of certain aspects of our internal controls and procedures for the preparation of our financial statements. Our Chief Executive Officer and Chief Financial Officer concluded that, as of March 31, 2016, our disclosure controls and procedures were effective.
Management’s Report on Internal Control over Financial Reporting
Our management is responsible for establishing and maintaining adequate internal control over financial reporting, as such term is defined in Exchange Act Rules 13a-15(f) and 15d-15(f). Under the supervision and with the participation of our management, including our Chief Executive Officer and Chief Financial Officer, we conducted an evaluation of the effectiveness of our internal control over financial reporting as of March 31, 2016. In making this assessment, our management used the criteria set forth in Internal Control-Integrated Framework (2013), which was issued by the Committee of Sponsoring Organizations of the Treadway Commission. Our management has concluded that, as of March 31, 2016, our internal control over financial reporting was effective.
BDO USA, LLP, the independent registered public accounting firm that audited the financial statements included in this Annual Report on Form 10-K, has issued an attestation report on our internal control over financial reporting, which is included elsewhere herein.
Changes in Internal Control over Financial Reporting
There were no changes to our internal control over financial reporting (as defined in Rules 13a-15(f) and 15d-15(f) under the Exchange Act) that occurred during the fourth quarter of fiscal 2016 that have materially affected, or are reasonably likely to materially affect, our internal control over financial reporting.
Inherent Limitations on Effectiveness of Controls
Our management, including our Chief Executive Officer and Chief Financial Officer, does not expect that our procedures or our internal controls will prevent or detect all errors and all fraud. An internal control system, no matter how well conceived and operated, can provide only reasonable, not absolute, assurance that the objectives of the control system are met. Because of the inherent limitations in all control systems, no evaluation of our controls can provide absolute assurance that all control issues, errors and instances of fraud, if any, have been detected.
89
Table of Contents
Report of Independent Registered Public Accounting Firm
Board of Directors and Stockholders
IXYS Corporation
Milpitas, California
We have audited IXYS Corporation’s internal control over financial reporting as of March 31, 2016, based on criteria established in Internal Control — Integrated Framework (2013) issued by the Committee of Sponsoring Organizations of the Treadway Commission (the COSO criteria). IXYS Corporation’s management is responsible for maintaining effective internal control over financial reporting and for its assessment of the effectiveness of internal control over financial reporting, included in the accompanying “Item 9A, Management’s Report on Internal Control Over Financial Reporting.” Our responsibility is to express an opinion on the company’s internal control over financial reporting based on our audit.
We conducted our audit in accordance with the standards of the Public Company Accounting Oversight Board (United States). Those standards require that we plan and perform the audit to obtain reasonable assurance about whether effective internal control over financial reporting was maintained in all material respects. Our audit included obtaining an understanding of internal control over financial reporting, assessing the risk that a material weakness exists, and testing and evaluating the design and operating effectiveness of internal control based on the assessed risk. Our audit also included performing such other procedures as we considered necessary in the circumstances. We believe that our audit provides a reasonable basis for our opinion.
A company’s internal control over financial reporting is a process designed to provide reasonable assurance regarding the reliability of financial reporting and the preparation of financial statements for external purposes in accordance with generally accepted accounting principles. A company’s internal control over financial reporting includes those policies and procedures that (1) pertain to the maintenance of records that, in reasonable detail, accurately and fairly reflect the transactions and dispositions of the assets of the company; (2) provide reasonable assurance that transactions are recorded as necessary to permit preparation of financial statements in accordance with generally accepted accounting principles, and that receipts and expenditures of the company are being made only in accordance with authorizations of management and directors of the company; and (3) provide reasonable assurance regarding prevention or timely detection of unauthorized acquisition, use, or disposition of the company’s assets that could have a material effect on the financial statements.
Because of its inherent limitations, internal control over financial reporting may not prevent or detect misstatements. Also, projections of any evaluation of effectiveness to future periods are subject to the risk that controls may become inadequate because of changes in conditions, or that the degree of compliance with the policies or procedures may deteriorate.
In our opinion, IXYS Corporation maintained, in all material respects, effective internal control over financial reporting as of March 31, 2016, based on the COSO criteria.
We also have audited, in accordance with the standards of the Public Company Accounting Oversight Board (United States), the consolidated balance sheets of IXYS Corporation as of March 31, 2016 and 2015, and the related consolidated statements of operations, comprehensive income (loss), stockholders’ equity, and cash flows for each of the three years in the period ended March 31, 2016 and our report dated June 8, 2016 expressed an unqualified opinion thereon.
/s/ BDO USA, LLP
San Francisco, California
June 8, 2016
90
Table of Contents
Not applicable.
PART III
Item 10. Directors, Executive Officers and Corporate Governance
The information required by this item, other than with respect to our executive officers and Code of Ethics, is incorporated herein by reference to our Proxy Statement for our 2016 Annual Meeting of Stockholders to be filed with the SEC within 120 days after the end of the fiscal year ended March 31, 2016, or our 2016 Proxy Statement, under the captions “Election of Directors,” “Information Regarding the Board and Corporate Governance” and “Section 16(A) Beneficial Ownership Reporting Compliance.”
Executive Officers
The information regarding our executive officers is set forth in Part I of this Annual Report on Form 10-K under the caption “Executive Officers of the Registrant” and is incorporated herein by reference.
Code of Ethics
We have adopted a Code of Ethics that applies to all of our directors, officers and employees, including our principal executive officer, principal financial officer and principal accounting officer. The Code of Ethics is posted on our website at http://www.ixys.com/Documents/InvestorRelations/codeofethics.pdf.
We intend to satisfy the disclosure requirement under Item 5.05 of Form 8-K regarding an amendment to, or waiver from, a provision of this Code of Ethics by posting such information on our website, at www.ixys.com, and, to the extent required by the listing standards of the NASDAQ Stock Market, by filing a Current Report on Form 8-K with the SEC disclosing such information.
Item 11. Executive Compensation
The information required by this item is incorporated by reference to our 2016 Proxy Statement under the captions “Executive Compensation” and “Information Regarding the Board and Corporate Governance.”
Item 12. Security Ownership of Certain Beneficial Owners and Management and Related Stockholder Matters
The information required by this item is incorporated by reference to our 2016 Proxy Statement under the captions “Equity Compensation Plan Information” and “Security Ownership of Certain Beneficial Owners and Management.”
Item 13. Certain Relationships and Related Transactions, and Director Independence
The information required by this item is incorporated by reference to our 2016 Proxy Statement under the captions “Transactions with Related Persons” and “Information Regarding the Board and Corporate Governance.”
Item 14. Principal Accounting Fees and Services
The information required by this item is incorporated by reference to our 2016 Proxy Statement under the caption “Ratification of Selection of Independent Registered Public Accounting Firm.”
91
Table of Contents
PART IV
Item 15. Exhibits, Financial Statement Schedules
| (a) | The following documents are filed as part of this report: |
| (1) | Financial Statements. |
Report of Independent Registered Public Accounting Firm
Consolidated Balance Sheets as of March 31, 2016 and 2015
Consolidated Statements of Operations for the years ended March 31, 2016, 2015 and 2014
Consolidated Statements of Comprehensive Income (Loss) for the years ended March 31, 2016, 2015 and 2014
Consolidated Statements of Cash Flows for the years ended March 31, 2016, 2015 and 2014
Consolidated Statements of Stockholders’ Equity for the years ended March 31, 2016, 2015 and 2014
Notes to Consolidated Financial Statements
(2) Financial statements schedules. All schedules are omitted because they are not applicable or the required information is shown in the financial statements or the notes thereto.
(3) Exhibits.
| Exhibit |
Title | |
| 2.1 | Share Purchase Agreement dated as of February 2, 2015 by and between IXYS Corporation, IXYS Intl Limited, RadioPulse, Inc., Taek-Shin Kwon and Sellers (filed on June 11, 2015 as Exhibit 2.1 to the Annual Report on Form 10-K (No. 000-26124) and incorporated herein by reference). | |
| 3.1 | Amended and Restated Certificate of Incorporation of IXYS Corporation, as filed with the Secretary of State for the State of Delaware on March 23, 2001 (filed on June 28, 2001 as Exhibit 3.1 to the Annual Report on Form 10-K (No. 000-26124) and incorporated herein by reference). | |
| 3.2 | Amended and Restated Bylaws of IXYS Corporation (filed on March 17, 2015 as Exhibit 3.2 to the Current Report on Form 8-K (No. 000-26124) and incorporated herein by reference). | |
| 10.1* | Form of Indemnity Agreement for directors and officers (filed on June 12, 2008 as Exhibit 10.3 to the Annual Report on Form 10-K (No. 000-26124) and incorporated herein by reference). | |
| 10.2* | List of signatories to Indemnity Agreement (filed on June 8, 2012 on Exhibit 10.4 to the Annual Report on Form 10-K (No. 000-26124) and incorporated herein by reference). | |
| 10.3* | IXYS Corporation 1999 Equity Incentive Plan (filed on May 18, 2006 as Exhibit 10.1 to the Current Report on Form 8-K (No. 000-26124) and incorporated herein by reference). | |
| 10.4* | IXYS Corporation Amended and Restated 1999 Employee Stock Purchase Plan (filed on August 8, 2014 as Exhibit 10.1 to the Quarterly Report on Form 10-Q (No. 000-26124) and incorporated herein by reference). | |
| 10.5* | Form of Stock Option Agreement for the IXYS Corporation 1999 Equity Incentive Plan (filed on November 9, 2004 as Exhibit 10.3 to the Quarterly Report on Form 10-Q (No. 000-26124) and incorporated herein by reference). | |
| 10.6* | Form of Stock Option Agreement for the IXYS Corporation 1999 Equity Incentive Plan with net exercise provision (filed on June 22, 2006 as Exhibit 10.23 to the Annual Report on Form 10-K (No. 000-26124) and incorporated herein by reference). | |
| 10.7* | Form of Stock Option Agreement for the IXYS Corporation 1999 Equity Incentive Plan for non-employee directors, (filed on June 22, 2006 as Exhibit 10.24 to the Annual Report on Form 10-K (No. 000-26124) and incorporated herein by reference). |
92
Table of Contents
| Exhibit |
Title | |
| 10.8* | Sixth Amended Executive Employment Agreement by and between IXYS Corporation and Nathan Zommer, effective as of August 1, 2015 (filed on November 4, 2015 as Exhibit 10.1 to the Quarterly Report on Form 10-Q (No. 000-26124) and incorporated herein by reference). | |
| 10.9* | Third Amendment Executive Employment Agreement by and between IXYS Corporation and Uzi Sasson, effective as of August 1, 2015 (filed on November 4, 2015 as Exhibit 10.2 to the Quarterly Report on Form 10-Q (No. 000-26124) and incorporated herein by reference). | |
| 10.10* | IXYS Corporation 2009 Equity Incentive Plan (filed on August 10, 2009 as Exhibit 10.3 to the Quarterly Report on Form 10-Q (No. 000-26124) and incorporated herein by reference). | |
| 10.11* | Notice of Stock Option Grant and Agreement for the IXYS Corporation 2009 Equity Incentive Plan (filed on August 10, 2009 as Exhibit 10.4 to the Quarterly Report on Form 10-Q (No. 000-26124) and incorporated herein by reference). | |
| 10.12* | Zilog, Inc. 2002 Omnibus Stock Incentive Plan. (filed on June 11, 2010 as Exhibit 10.25 to the Annual Report on Form 10-K (No. 000-26124) and incorporated herein by reference). | |
| 10.13* | Form of Nonqualified Stock Option Agreement for Stock Options pursuant to the Zilog, Inc. 2002 Omnibus Stock Incentive Plan. (filed on June 11, 2010 as Exhibit 10.26 to the Annual Report on Form 10-K (No. 000-26124) and incorporated herein by reference). | |
| 10.14* | Zilog, Inc. 2004 Omnibus Stock Incentive Plan. (filed on June 11, 2010 as Exhibit 10.27 to the Annual Report on Form 10-K (No. 000-26124) and incorporated herein by reference). | |
| 10.15* | Form of Nonqualified Stock Option Agreement for the Zilog, Inc. 2004 Omnibus Stock Incentive Plan. (filed on June 11, 2010 as Exhibit 10.28 to the Annual Report on Form 10-K (No. 000-26124) and incorporated herein by reference). | |
| 10.16* | IXYS Corporation 2011 Equity Incentive Plan (filed on August 5, 2011 as Exhibit 10.1 to the Quarterly Report on Form 10-Q (No. 000-26124) and incorporated herein by reference). | |
| 10.17* | Notice of Stock Option Grant and Agreement for the IXYS Corporation 2011 Equity Incentive Plan (filed on August 5, 2011 as Exhibit 10.2 to the Quarterly Report on Form 10-Q (No. 000-26124) and incorporated herein by reference). | |
| 10.18* | IXYS Corporation 2013 Equity Incentive Plan (filed on August 9, 2013 as Exhibit 10.5 to the Quarterly Report on Form 10-Q (No. 000-26124) and incorporated herein by reference). | |
| 10.19* | Notice of Stock Option Grant and Agreement for IXYS Corporation 2013 Equity Incentive Plan (filed on August 9, 2013 as Exhibit 10.6 to the Quarterly Report on Form 10-Q (No. 000-26124) and incorporated herein by reference). | |
| 10.20 | Foundry Services Agreement dated as of June 27, 2013 by and between Samsung Electronics Co., Ltd. and IXYS Intl Limited (filed on December 10, 2013 as Exhibit 10.2 to the Quarterly Report on Form 10-Q/A (No. 000-26124) and incorporated herein by reference). | |
| 10.21 | Product License Agreement dated as of June 27, 2013 by and between Samsung Electronics Co., Ltd. and IXYS Intl Limited (filed on December 10, 2013 as Exhibit 10.4 to the Quarterly Report on Form 10-Q/A (No. 000-26124) and incorporated herein by reference). | |
| 10.22 | Loan Agreement dated April 1, 2015 by and between IXYS Semiconductor GmbH and IKB Deutsche Industriebank AG. (filed on June 11, 2015 as Exhibit 10.30 to the Annual Report on Form 10-K (No. 000-26124) and incorporated herein by reference). | |
| 10.23 | Collateral Agreement dated April 21, 2015 by and among IXYS Corporation, IXYS Semiconductor GmbH and IKB Deutsche Industriebank AG. (filed on June 11, 2015 as Exhibit 10.31 to the Annual Report on Form 10-K (No. 000-26124) and incorporated herein by reference). | |
| 10.24 | Revolving Credit Agreement dated as of November 20, 2015 among IXYS Corporation, Bank of the West (as a Lender and as Administrative Agent), KeyBank National Association (as a Lender and as Syndication Agent), MUFG Union Bank, N.A. and Comerica Bank (filed on November 24, 2015 as Exhibit 10.1 to the Current Report on Form 8-K (No. 000-26124) and incorporated herein by reference). |
93
Table of Contents
| Exhibit |
Title | |
| 10.25 | Contingent Collateral Agreement dated as of November 20, 2015 among IXYS Corporation, IXYS USA, Inc., IXYS Integrated Circuits Division Inc., IXYS Long Beach, Inc., Zilog, Inc. and Bank of the West, as Administrative Agent for the Lenders (filed on November 24, 2015 as Exhibit 10.2 to the Current Report on Form 8-K (No. 000-26124) and incorporated herein by reference). | |
| 21.1 | List of Subsidiaries | |
| 23.1 | Consent of BDO USA, LLP. | |
| 24.1 | Power of Attorney (included on the signature page). | |
| 31.1 | Certification of Chief Executive Officer pursuant to Rule 13a-14(a) of the Securities and Exchange Commission. | |
| 31.2 | Certification of Chief Financial Officer pursuant to the Rule 13a-14(a) of the Securities and Exchange Commission. | |
| 32.1 | Certification required by Rule 13a-14(b) of the Securities and Exchange Commission and Section 1350 of Chapter 63 of Title 18 of the United States Code (18 U.S.C. 1350). | |
| 101.INS | XBRL Instance Document. | |
| 101.SCH | XBRL Taxonomy Extension Schema Document. | |
| 101.CAL | XBRL Taxonomy Extension Calculation Linkbase Document. | |
| 101.DEF | XBRL Taxonomy Extension Definition Linkbase Document. | |
| 101.LAB | XBRL Taxonomy Extension Label Linkbase Document. | |
| 101.PRE | XBRL Taxonomy Extension Presentation Linkbase Document. |
| * | Management contract or compensatory plan or arrangement. |
| (b) | Exhibits. See Item 15(a)(3) above. |
| (c) | Financial Statement Schedules. See Item 15(a)(2) above. |
94
Table of Contents
SIGNATURES
Pursuant to the requirements of Section 13 or 15(d) of the Securities Exchange Act of 1934, the Registrant has duly caused this report to be signed on its behalf by the undersigned, thereunto duly authorized.
| IXYS CORPORATION | ||
| By: |
/s/ Nathan Zommer | |
| Nathan Zommer | ||
| Chairman of the Board and Chief Executive Officer | ||
| (Principal Executive Officer) | ||
Dated: June 8, 2016
POWER OF ATTORNEY
KNOW ALL PERSONS BY THESE PRESENTS, that each person whose signature appears below constitutes and appoints Nathan Zommer and Uzi Sasson, and each or any one of them, his true and lawful attorney-in-fact and agent, with full power of substitution and resubstitution, for him and in his name, place and stead, in any and all capacities, to sign any and all amendments (including post-effective amendments) to this Report, and to file the same, with all exhibits thereto, and other documents in connection therewith, with the Securities and Exchange Commission, granting unto said attorneys-in-fact and agents, and each of them, full power and authority to do and perform each and every act and thing requisite and necessary to be done in connection therewith, as fully to all intents and purposes as he might or could do in person, hereby ratifying and confirming all that said attorneys-in-fact and agents, or any of them, or their or his substitutes or substitute, may lawfully do or cause to be done by virtue hereof.
Pursuant to the requirements of the Securities Exchange Act of 1934, this report has been signed below by the following persons on behalf of the Registrant and in the capacities and on the dates indicated.
| Signature |
Title |
Date | ||
| /s/ Nathan Zommer Nathan Zommer |
Chairman of the Board (Director) and Chief Executive Officer (Principal Executive Officer) |
June 8, 2016 | ||
| /s/ Uzi Sasson Uzi Sasson |
President, Chief Financial Officer and Director (Principal Financial Officer and Principal Accounting Officer) |
June 8, 2016 | ||
| /s/ Donald L. Feucht Donald L. Feucht |
Director |
June 8, 2016 | ||
| /s/ Samuel Kory Samuel Kory |
Director |
June 8, 2016 | ||
| /s/ S. Joon Lee S. Joon Lee |
Director |
June 8, 2016 | ||
| /s/ Timothy A. Richardson Timothy A. Richardson |
Director |
June 8, 2016 | ||
| /s/ James M. Thorburn James M. Thorburn |
Director |
June 8, 2016 | ||
| /s/ Kenneth D. Wong Kenneth D. Wong |
Director |
June 8, 2016 | ||
95
Table of Contents
Exhibit Index
| Exhibit |
Title | |
| 2.1 | Share Purchase Agreement dated as of February 2, 2015 by and between IXYS Corporation, IXYS Intl Limited, RadioPulse, Inc., Taek-Shin Kwon and Sellers (filed on June 11, 2015 as Exhibit 2.1 to the Annual Report on Form 10-K (No. 000-26124) and incorporated herein by reference). | |
| 3.1 | Amended and Restated Certificate of Incorporation of IXYS Corporation, as filed with the Secretary of State for the State of Delaware on March 23, 2001 (filed on June 28, 2001 as Exhibit 3.1 to the Annual Report on Form 10-K (No. 000-26124) and incorporated herein by reference). | |
| 3.2 | Amended and Restated Bylaws of IXYS Corporation (filed on March 17, 2015 as Exhibit 3.2 to the Current Report on Form 8-K (No. 000-26124) and incorporated herein by reference). | |
| 10.1* | Form of Indemnity Agreement for directors and officers (filed on June 12, 2008 as Exhibit 10.3 to the Annual Report on Form 10-K (No. 000-26124) and incorporated herein by reference). | |
| 10.2* | List of signatories to Indemnity Agreement (filed on June 8, 2012 on Exhibit 10.4 to the Annual Report on Form 10-K (No. 000-26124) and incorporated herein by reference). | |
| 10.3* | IXYS Corporation 1999 Equity Incentive Plan (filed on May 18, 2006 as Exhibit 10.1 to the Current Report on Form 8-K (No. 000-26124) and incorporated herein by reference). | |
| 10.4* | IXYS Corporation Amended and Restated 1999 Employee Stock Purchase Plan (filed on August 8, 2014 as Exhibit 10.1 to the Quarterly Report on Form 10-Q (No. 000-26124) and incorporated herein by reference). | |
| 10.5* | Form of Stock Option Agreement for the IXYS Corporation 1999 Equity Incentive Plan (filed on November 9, 2004 as Exhibit 10.3 to the Quarterly Report on Form 10-Q (No. 000-26124) and incorporated herein by reference). | |
| 10.6* | Form of Stock Option Agreement for the IXYS Corporation 1999 Equity Incentive Plan with net exercise provision (filed on June 22, 2006 as Exhibit 10.23 to the Annual Report on Form 10-K (No. 000-26124) and incorporated herein by reference). | |
| 10.7* | Form of Stock Option Agreement for the IXYS Corporation 1999 Equity Incentive Plan for non-employee directors, (filed on June 22, 2006 as Exhibit 10.24 to the Annual Report on Form 10-K (No. 000-26124) and incorporated herein by reference). | |
| 10.8* | Sixth Amended Executive Employment Agreement by and between IXYS Corporation and Nathan Zommer, effective as of August 1, 2015 (filed on November 4, 2015 as Exhibit 10.1 to the Quarterly Report on Form 10-Q (No. 000-26124) and incorporated herein by reference). | |
| 10.9* | Third Amendment Executive Employment Agreement by and between IXYS Corporation and Uzi Sasson, effective as of August 1, 2015 (filed on November 4, 2015 as Exhibit 10.2 to the Quarterly Report on Form 10-Q (No. 000-26124) and incorporated herein by reference). | |
| 10.10* | IXYS Corporation 2009 Equity Incentive Plan (filed on August 10, 2009 as Exhibit 10.3 to the Quarterly Report on Form 10-Q (No. 000-26124) and incorporated herein by reference). | |
| 10.11* | Notice of Stock Option Grant and Agreement for the IXYS Corporation 2009 Equity Incentive Plan (filed on August 10, 2009 as Exhibit 10.4 to the Quarterly Report on Form 10-Q (No. 000-26124) and incorporated herein by reference). | |
| 10.12* | Zilog, Inc. 2002 Omnibus Stock Incentive Plan. (filed on June 11, 2010 as Exhibit 10.25 to the Annual Report on Form 10-K (No. 000-26124) and incorporated herein by reference). | |
| 10.13* | Form of Nonqualified Stock Option Agreement for Stock Options pursuant to the Zilog, Inc. 2002 Omnibus Stock Incentive Plan. (filed on June 11, 2010 as Exhibit 10.26 to the Annual Report on Form 10-K (No. 000-26124) and incorporated herein by reference). | |
| 10.14* | Zilog, Inc. 2004 Omnibus Stock Incentive Plan. (filed on June 11, 2010 as Exhibit 10.27 to the Annual Report on Form 10-K (No. 000-26124) and incorporated herein by reference). | |
| 10.15* | Form of Nonqualified Stock Option Agreement for the Zilog, Inc. 2004 Omnibus Stock Incentive Plan. (filed on June 11, 2010 as Exhibit 10.28 to the Annual Report on Form 10-K (No. 000-26124) and incorporated herein by reference). |
96
Table of Contents
| Exhibit |
Title | |
| 10.16* | IXYS Corporation 2011 Equity Incentive Plan (filed on August 5, 2011 as Exhibit 10.1 to the Quarterly Report on Form 10-Q (No. 000-26124) and incorporated herein by reference). | |
| 10.17* | Notice of Stock Option Grant and Agreement for the IXYS Corporation 2011 Equity Incentive Plan (filed on August 5, 2011 as Exhibit 10.2 to the Quarterly Report on Form 10-Q (No. 000-26124) and incorporated herein by reference). | |
| 10.18* | IXYS Corporation 2013 Equity Incentive Plan (filed on August 9, 2013 as Exhibit 10.5 to the Quarterly Report on Form 10-Q (No. 000-26124) and incorporated herein by reference). | |
| 10.19* | Notice of Stock Option Grant and Agreement for IXYS Corporation 2013 Equity Incentive Plan (filed on August 9, 2013 as Exhibit 10.6 to the Quarterly Report on Form 10-Q (No. 000-26124) and incorporated herein by reference). | |
| 10.20 | Foundry Services Agreement dated as of June 27, 2013 by and between Samsung Electronics Co., Ltd. and IXYS Intl Limited (filed on December 10, 2013 as Exhibit 10.2 to the Quarterly Report on Form 10-Q/A (No. 000-26124) and incorporated herein by reference). | |
| 10.21 | Product License Agreement dated as of June 27, 2013 by and between Samsung Electronics Co., Ltd. and IXYS Intl Limited (filed on December 10, 2013 as Exhibit 10.4 to the Quarterly Report on Form 10-Q/A (No. 000-26124) and incorporated herein by reference). | |
| 10.22 | Loan Agreement dated April 1, 2015 by and between IXYS Semiconductor GmbH and IKB Deutsche Industriebank AG. (filed on June 11, 2015 as Exhibit 10.30 to the Annual Report on Form 10-K (No. 000-26124) and incorporated herein by reference). | |
| 10.23 | Collateral Agreement dated April 21, 2015 by and among IXYS Corporation, IXYS Semiconductor GmbH and IKB Deutsche Industriebank AG. (filed on June 11, 2015 as Exhibit 10.31 to the Annual Report on Form 10-K (No. 000-26124) and incorporated herin by reference). | |
| 10.24 | Revolving Credit Agreement dated as of November 20, 2015 among IXYS Corporation, Bank of the West (as a Lender and as Administrative Agent), KeyBank National Association (as a Lender and as Syndication Agent), MUFG Union Bank, N.A. and Comerica Bank (filed on November 24, 2015 as Exhibit 10.1 to the Current Report on Form 8-K (No. 000-26124) and incorporated herein by reference). | |
| 10.25 | Contingent Collateral Agreement dated as of November 20, 2015 among IXYS Corporation, IXYS USA, Inc., IXYS Integrated Circuits Division Inc., IXYS Long Beach, Inc., Zilog, Inc. and Bank of the West, as Administrative Agent for the Lenders (filed on November 24, 2015 as Exhibit 10.2 to the Current Report on Form 8-K (No. 000-26124) and incorporated herein by reference). | |
| 21.1 | List of Subsidiaries. | |
| 23.1 | Consent of BDO USA, LLP. | |
| 24.1 | Power of Attorney (included on the signature page). | |
| 31.1 | Certification of Chief Executive Officer pursuant to Rule 13a-14(a) of the Securities and Exchange Commission. | |
| 31.2 | Certification of Chief Financial Officer pursuant to the Rule 13a-14(a) of the Securities and Exchange Commission. | |
| 32.1 | Certification required by Rule 13a-14(b) of the Securities and Exchange Commission and Section 1350 of Chapter 63 of Title 18 of the United States Code (18 U.S.C. 1350). | |
| 101.INS | XBRL Instance Document. | |
| 101.SCH | XBRL Taxonomy Extension Schema Document. | |
| 101.CAL | XBRL Taxonomy Extension Calculation Linkbase Document. | |
| 101.DEF | XBRL Taxonomy Extension Definition Linkbase Document. | |
| 101.LAB | XBRL Taxonomy Extension Label Linkbase Document. | |
| 101.PRE | XBRL Taxonomy Extension Presentation Linkbase Document. |
| * | Management contract or compensatory plan or arrangement. |
97