Attached files
| file | filename |
|---|---|
| EX-12.1 - EX-12.1 - EAGLE MATERIALS INC | exp-ex121_11.htm |
| EX-95 - EX-95 - EAGLE MATERIALS INC | exp-ex95_133.htm |
| EX-32.2 - EX-32.2 - EAGLE MATERIALS INC | exp-ex322_13.htm |
| EX-32.1 - EX-32.1 - EAGLE MATERIALS INC | exp-ex321_7.htm |
| EX-31.2 - EX-31.2 - EAGLE MATERIALS INC | exp-ex312_6.htm |
| EX-31.1 - EX-31.1 - EAGLE MATERIALS INC | exp-ex311_12.htm |
| EX-23.1 - EX-23.1 - EAGLE MATERIALS INC | exp-ex231_9.htm |
| EX-21 - EX-21 - EAGLE MATERIALS INC | exp-ex21_8.htm |
UNITED STATES
SECURITIES AND EXCHANGE COMMISSION
Washington, D.C. 20549
FORM 10-K
ANNUAL REPORT
Pursuant to Section 13 or 15(d) of the Securities Exchange Act of 1934
For the Fiscal Year Ended
March 31, 2016
Commission File No. 1-12984
EAGLE MATERIALS INC.
(Exact name of registrant as specified in its charter)
Delaware
(State of Incorporation)
75-2520779
(I.R.S. Employer Identification No.)
3811 Turtle Creek Blvd, Suite 1100, Dallas, Texas 75219
(Address of principal executive offices)
(214) 432-2000
(Registrant’s telephone number)
Securities registered pursuant to Section 12(b) of the Act:
|
Title of each class |
|
Name of each exchange on which registered |
|
Common Stock (par value $.01 per share) |
|
New York Stock Exchange |
Securities registered pursuant to Section 12(g) of the Act: None
Indicate by check mark if the registrant is a well-known seasoned issuer, as defined in Rule 405 of the Securities Act. YES x NO o
Indicate by check mark if the registrant is not required to file reports pursuant to Section 13 or Section 15(d) of the Act. YES o NO x
Indicate by check mark whether the registrant (1) has filed all reports required to be filed by Section 13 or 15(d) of the Securities Exchange Act of 1934 during the preceding 12 months (or for such shorter period that the registrant was required to file such reports), and (2) has been subject to such filing requirements for the past 90 days. YES x NO o
Indicate by check mark whether the registrant has submitted electronically and posted on its corporate Web site, if any, every Interactive Data File required to be submitted and posted pursuant to Rule 405 of Regulation S-T during the preceding 12 months (or for such shorter period that the registrant was required to submit and post such files). YES x NO o
Indicate by check mark if disclosure of delinquent filers pursuant to Item 405 of Regulation S-K is not contained herein, and will not be contained, to the best of registrant’s knowledge, in definitive proxy or information statements incorporated by reference in Part III of this Form 10-K or any amendment to this Form 10-K. o
Indicate by check mark whether the registrant is a large accelerated filer, an accelerated filer, a non-accelerated filer or a smaller reporting company. See definition of “large accelerated filer,” “accelerated filer,” and “smaller reporting company” in Rule 12b-2 of the Exchange Act. (Check one):
|
Large accelerated filer |
x |
|
|
|
Accelerated filer |
¨ |
|
|
|
|
|
|
|
|
|
Non-accelerated filer |
¨ |
|
(Do not check if a smaller reporting company) |
|
Smaller reporting company |
¨ |
Indicate by check mark whether the registrant is a shell company (as defined in Rule 12b-2 of the Act). YES o NO x
The aggregate market value of the voting stock held by nonaffiliates of the Company at September 30, 2015 (the last business day of the registrants’ most recently completed second fiscal quarter) was approximately $3.3 billion.
As of May 19, 2016, the number of outstanding shares of common stock was:
|
Class |
|
Outstanding Shares |
|
Common Stock, $.01 Par Value |
|
48,282,065 |
DOCUMENTS INCORPORATED BY REFERENCE
Portions of the Proxy Statement for the Annual Meeting of Stockholders of Eagle Materials Inc. to be held on August 4, 2016 are incorporated by reference in Part III of this Report.
1
|
|
|
|
|
Page |
|
|
|
|
||
|
|
|
|||
|
|
|
|
||
|
Item 1. |
|
|
1 |
|
|
|
|
|
1 |
|
|
|
|
|
2 |
|
|
|
|
|
19 |
|
|
|
|
|
19 |
|
|
Item 1A. |
|
|
20 |
|
|
Item 1B. |
|
|
28 |
|
|
Item 2. |
|
|
29 |
|
|
Item 3. |
|
|
29 |
|
|
Item 4. |
|
|
30 |
|
|
|
|
|
||
|
|
|
|||
|
|
|
|
||
|
Item 5. |
|
|
31 |
|
|
Item 6. |
|
|
33 |
|
|
Item 7. |
|
Management’s Discussion and Analysis of Financial Condition and Results of Operations |
|
34 |
|
Item 7A. |
|
|
53 |
|
|
Item 8. |
|
|
54 |
|
|
Item 9. |
|
Changes in and Disagreements with Accountants on Accounting and Financial Disclosure |
|
102 |
|
Item 9A. |
|
|
102 |
|
|
Item 9B. |
|
|
103 |
|
|
|
|
|
||
|
|
|
|||
|
|
|
|
||
|
Item 10. |
|
|
104 |
|
|
Item 11. |
|
|
104 |
|
|
Item 12. |
|
Security Ownership of Certain Beneficial Owners and Management and Related Stockholder Matters |
|
104 |
|
Item 13. |
|
Certain Relationships and Related Transactions, and Director Independence |
|
105 |
|
Item 14. |
|
|
105 |
|
|
|
|
|
||
|
|
|
|||
|
|
|
|
||
|
Item 15. |
|
|
105 |
|
|
|
|
|
|
|
|
|
106 |
|||
|
|
|
|
||
|
|
108 |
|||
Eagle Materials Inc. (the “Company” or “EXP” which may be referred to as “we”, “our” or “us”) is a leading supplier of construction products, building materials, and materials used for oil and natural gas extraction. Our construction products are used in residential, industrial, commercial and infrastructure construction and include cement, slag, concrete and aggregates. Our building materials are sold into similar markets and include gypsum wallboard. Our basic materials used for oil and natural gas extraction include frac sand and oil well cement.
The Company was founded in 1963 as a building materials subsidiary of Centex Corporation (“Centex”), and we operated as a public company under the name Centex Construction Products, Inc. from April 1994 to January 30, 2004, at which time Centex completed a tax-free distribution of its shares in EXP to its shareholders.
We sell cement in six regional markets, including northern Nevada and California, the greater Chicago area, the Rocky Mountain region, the Central Plains region and Texas, and we sell slag in the greater Chicago, Illinois area and the greater Midwest area. We have three concrete and aggregates businesses, serve the areas immediately surrounding Austin, Texas, the greater Kansas City area and north of Sacramento, California. Gypsum wallboard is distributed throughout the U.S. with particular emphasis in the geographic markets nearest to our production facilities. We also operate a recycled paperboard business which sells internally to our wallboard business as well as to external customers. Oil well cement and frac sand are sold into shale deposit zones across the United States.
Our products are commodities that are essential in commercial and residential construction, public construction projects, projects to build, expand and repair roads and highways and in natural gas and oil extraction. Demand for these products is generally cyclical and seasonal, depending on economic and geographic conditions. Our operations are geographically diverse, providing us with regional economic diversification. The markets for our cement and slag products are more regional due to the low value-to-weight ratio of cement and slag, which generally limit shipments by truck to a 150 mile radius of the plants and up to 300 miles by rail. Our cement companies focus on the U.S. heartland in Texas, Oklahoma, Missouri, Nebraska, Kansas, Colorado, Wyoming and Nevada, as well as the Chicago, Illinois metropolitan area. Slag is ground in the greater Chicago, Illinois area and sold primarily in Illinois, Pennsylvania, Iowa, Ohio, Minnesota and Kansas. Our concrete and aggregates are more local as our operations serve the areas immediately surrounding Austin, Texas, the greater Kansas City area and north of Sacramento, California. Demand for cement, concrete and aggregates may fluctuate more widely because local and regional markets and economies can be more sensitive to changes than the national market, as well as being more susceptible to seasonal impact due to adverse weather.
Our gypsum wallboard and paperboard operations are more national in scope and shipments of wallboard and paper are made throughout the continental U.S., except for the northeast, and therefore are more impacted by national trends. Frac sand is currently sold into shale deposit zones across the United States. Demand for oil and gas proppants is impacted primarily by rig counts and well completion activity.
Our goal, through continuous improvement, is to be the lowest cost producer in each of the markets in which we compete. As such, we will continue to focus on reducing costs and improving our operations, recognizing that being a low cost producer is a key to our success.
Demand continues to increase for our construction products and building materials businesses, as underlying economic fundamentals in the U.S. continued to improve during calendar 2015. Cement consumption in the United States, as estimated by the Portland Cement Association, increased approximately 4% to 99.0 million short tons in calendar 2015, compared to 95.4 million short tons in calendar 2014, with imported cement consumption increasing to approximately 13% of total sales in calendar 2015, compared to 9% in calendar 2014. Although cement consumption increased in calendar 2015, our cement volumes for fiscal 2016 remained consistent with 2015, primarily due to poor weather in certain of our markets in the spring and fall of 2015.
1
Demand for gypsum wallboard continues to improve as well, as industry shipments of gypsum wallboard increased to 22.0 billion square feet in calendar 2015, compared to 21.5 billion square feet in calendar 2014, primarily due to the approximately 10% and 12% increase in single family and multi-family housing starts during calendar 2015 compared to calendar 2014.
Drilling and completion activity for oil and gas declined during calendar 2015, primarily due to the decrease in oil and gas prices during the year. The decline in oil prices adversely impacted drilling activity, which reduced demand for our frac sand products and oil well cement. This demand has also had a downward impact on the price of frac sand, which has declined since the peak in 2014. We do not expect any meaningful increase in oil and gas drilling activity during calendar 2016.
At March 31, 2016, we operated six cement plants (one of which belongs to our joint venture company), one slag grinding facility, sixteen cement distribution terminals, five gypsum wallboard plants, one recycled paperboard plant, seventeen concrete batching plants, four aggregates facilities, three frac sand wet processing facilities, three frac sand drying facilities and six frac sand trans-load locations. Our gypsum wallboard plant in Bernalillo, New Mexico has been idled since 2009. During the fourth quarter of fiscal 2016, we idled our Corpus Christi, Texas frac sand processing plant and our Kenedy, Texas and Fowlerton, Texas trans-load facilities, along with our Utica, Illinois frac sand mine. We intend to re-open the idled facilities when market conditions improve.
We continue to focus on growth through acquisitions or expansion of existing facilities that we believe provide an opportunity to realize an appropriate return on investment and create value for our shareholders.
On July 10, 2015, we completed the acquisition of a 0.6 million ton per year Granulated Ground Blast Furnace Slag (“Slag”) plant in South Chicago (the “Skyway Plant”) with Holcim (US) Inc. (the “Skyway Acquisition”). Among other applications, Slag is used in conjunction with Portland cement to make a lower permeability concrete. The Skyway Plant purchases its primary raw material, slag, pursuant to a long term supply agreement with a third party.
The purchase price (the “Skyway Purchase Price”) for the Skyway Acquisition was approximately $29.9 million, net of $2.5 million which will be refunded by the seller. We received $1.5 million of the expected refund in January 2016, and we expect to receive the remaining $1.0 million in January 2017. We funded the payment of the Skyway Purchase Price and expenses incurred in connection with the Skyway Acquisition with operating cash flow. We also assumed certain liabilities, including contractual obligations, related to the Skyway Plant.
On November 14, 2014, we acquired all of the outstanding equity interests of CRS Holdco LLC, CRS Proppants LLC, Great Northern Sand LLC, and related entities (collectively, “CRS Proppants”) (such acquisition, the “CRS Acquisition”). CRS Proppants is a supplier of frac sand to the energy industry, and its business currently consists of a frac sand mine in New Auburn, Wisconsin, and a trans-load network into Texas and southwest Oklahoma. The purchase price (the “CRS Purchase Price”) paid by the Company for the CRS Acquisition was approximately $236.1 million in cash, including approximately $8.9 million for in-process capital expenditures paid through the closing date, estimated working capital and other estimated closing amounts. This expansion was completed during the first quarter of fiscal 2016, at a cost of approximately $8.0 million.
We currently have five different business segments, which are Cement, Concrete and Aggregates, Gypsum Wallboard, Recycled Paperboard and Oil and Gas Proppants. A description of these business segments can be found on pages 3-19.
We conduct one of our six cement plant operations through a joint venture, Texas Lehigh Cement Company LP, which is located in Buda, Texas. We own a 50% interest in the joint venture and account for our interest using the equity method of accounting. However, for segment reporting purposes, we proportionately consolidate our 50% share of the cement joint venture’s revenues and operating earnings, which is consistent with the way
2
management organizes the segments within the Company for making operating decisions and assessing performance. Revenues from external customers, operating earnings, identifiable assets, depreciation, depletion and amortization, and capital expenditures by segment are presented in Footnote (G) of the Notes to Consolidated Financial Statements on pages 72-75.
Cement, SlaG, CONCRETE AND AGGREGATES Operations
Company Operations
Cement and Slag. Our cement production facilities are located in or near Buda, Texas; LaSalle, Illinois; Laramie, Wyoming; Sugar Creek, Missouri; Tulsa, Oklahoma and Fernley, Nevada, and our slag grinding facility is located in Chicago, Illinois. Our slag facility and all of our cement subsidiaries are wholly-owned except the Buda, Texas plant, which is owned by Texas Lehigh Cement Company LP, a limited partnership joint venture owned 50% by us and 50% by Lehigh Cement Company LLC, a subsidiary of Heidelberg Cement AG. Our LaSalle, Illinois plant operates under the name Illinois Cement Company; the Laramie, Wyoming plant operates under the name Mountain Cement Company; the Fernley, Nevada plant operates under the name Nevada Cement Company and our Sugar Creek, Missouri and Tulsa, Oklahoma plants operate under the name Central Plains Cement Company. Our slag facility operates under the name Skyway Cement Company.
Cement is the basic binding agent for concrete, a primary construction material. All of our cement plants utilize dry process technology and, at present, approximately 75% of our clinker capacity is from preheater or preheater/pre-calciner kilns. Slag granules are obtained from a steel company and ground in our grinding facility. Slag is used in concrete mix designs to improve the durability of concrete which should reduce future maintenance costs.
The following table sets forth certain information regarding our cement plants:
3
|
Plant Location |
|
Owned or Leased Reserves |
|
Rated Annual Clinker Capacity (M short tons)(1) |
|
|
Manufacturing Process |
|
Number of Kilns |
|
Kiln Dedication Date |
|
Estimated Minimum Limestone Reserves (M short tons) (2) |
|
Estimated Minimum Limestone Reserves (Years) |
|
Fiscal 2016 Tons Mined (Thousand tons) |
|||||||||||||||||
|
Buda, TX
|
|
Owned |
|
|
1,300 (3) |
|
|
Dry – 4 Stage Preheater/ Pre-calciner |
|
1 |
|
1983 |
|
224,500 |
|
|
50+ |
|
|
1,830
|
||||||||||||||
|
|
|
|
|
|
|
|
|
|
|
|
|
|
|
|
|
|
|
|
|
|
||||||||||||||
|
LaSalle, IL |
|
Owned |
|
|
1,000 |
|
|
Dry – 5 Stage Preheater/ Pre-calciner |
|
1 |
|
2006 |
|
35,530 |
|
|
30 |
|
|
1,215 |
||||||||||||||
|
|
|
|
|
|
|
|
|
|
|
|
|
|
|
|
|
|
|
|
|
|
||||||||||||||
|
Sugar Creek, MO |
|
Owned Leased |
|
|
1,000 |
|
|
Dry – 5 Stage Preheater/ Pre-calciner |
|
1 |
|
2002 |
|
137,000 15,000 |
|
|
50+ |
|
|
1,090 |
||||||||||||||
|
|
|
|
|
|
|
|
|
|
|
|
|
|
|
|
|
|
|
|
|
|
||||||||||||||
|
Laramie, WY |
|
Owned Leased |
|
|
650 |
|
|
Dry – 2 Stage Preheater Dry – Long Dry Kiln |
|
1
1 |
|
1988
1996 |
|
125,000 7,000 |
|
|
50+ |
|
|
860 |
||||||||||||||
|
|
|
|
|
|
|
|
|
|
|
|
|
|
|
|
|
|
|
|
|
|
||||||||||||||
|
Tulsa, OK |
|
Owned |
|
|
650 |
|
|
Dry – Long Dry Kiln |
|
2 |
|
1961 1964 |
|
41,260 |
|
|
44 |
|
|
785 |
||||||||||||||
|
|
|
|
|
|
|
|
|
|
|
|
|
|
|
|
|
|
|
|
|
|
||||||||||||||
|
Fernley, NV |
|
Owned Leased |
|
|
500 |
|
|
Dry – Long Dry Kiln Dry – 1 Stage Preheater |
|
1
1 |
|
1964
1969 |
|
14,400 70,600 |
|
|
50+ |
|
|
680 |
||||||||||||||
|
Total-Gross (4) |
|
|
|
|
5,100 |
|
|
|
|
|
|
|
|
|
|
|
|
|
|
|
||||||||||||||
|
Total-Net (4)(5) |
|
|
|
|
4,450 |
|
|
|
|
|
|
|
|
|
|
|
|
|
|
|
||||||||||||||
|
(1) |
One short ton equals 2,000 pounds. |
|
(2) |
All limestone reserves are deemed to be probable under the definition provided by Industry Guide 7. |
|
(3) |
The amount shown represents 100% of plant capacity and production. This plant is owned by a separate limited partnership in which the Company has a 50% interest. |
|
(4) |
Generally, a plant’s cement grinding production capacity is greater than its clinker production capacity. |
|
(5) |
Net of partner’s 50% interest in the Buda, Texas plant. |
Our cement production, including our 50% share of the cement Joint Venture production, totaled 4.2 million short tons in both fiscal 2016 and fiscal 2015. Total net cement sales, including our 50% share of cement sales from the Joint Venture, were 4.8 million short tons in in fiscal 2016 and fiscal 2015. The Joint Venture also owns a minority interest in an import terminal in Houston, Texas and can purchase up to 495,000 short tons annually from this cement terminal.
Our slag facility can process up to 0.6 million tons per year, and is located in Chicago, Illinois. Our net slag production and slag sales both totaled 0.3 million tons from the date of purchase in July 2015 through the end of fiscal 2016.
Concrete and Aggregates. Readymix concrete is a versatile, low-cost building material used in almost all construction. The production of readymix concrete involves the mixing of cement, sand, gravel, or crushed stone and water to form concrete, which is then sold and distributed to numerous construction contractors. Concrete is produced in batch plants and transported to the customer’s job site in mixer trucks.
4
The construction aggregates business consists of the mining, extraction, production and sale of crushed stone, sand, gravel and lightweight aggregates such as expanded clays and shales. Construction aggregates of suitable characteristics are employed in virtually all types of construction, including the production of readymix concrete and asphaltic mixes used in highway construction and maintenance.
We produce and distribute readymix concrete from company-owned sites north of Sacramento, California; Austin, Texas and the greater Kansas City area. The following table sets forth certain information regarding these operations:
|
Location |
|
Number of Plants |
|
|
Number of Trucks |
|
||
|
Northern California |
|
|
3 |
|
|
|
26 |
|
|
Austin, Texas |
|
|
6 |
|
|
|
78 |
|
|
Kansas City Area |
|
|
8 |
|
|
|
110 |
|
|
Total |
|
|
17 |
|
|
|
214 |
|
We conduct aggregate operations near our concrete facilities in northern California; Austin, Texas and the greater Kansas City area. Aggregates are obtained principally by mining and extracting from quarries owned or leased by the Company. The following table sets forth certain information regarding these operations:
|
Location |
|
|
Owned or Leased |
|
Types of Aggregates |
|
Estimated Annual Production Capacity (Thousand tons) |
|
|
Estimated Minimum Reserves ( Thousand Tons) (1) |
|
Estimated Minimum Reserves (Years) |
|
Fiscal 2016 Tons Mined (Thousand Tons) |
||
|
Northern California |
|
|
Owned |
|
Sand and Gravel |
|
|
4,000 |
|
|
915,000 |
|
|
100+ |
|
815 |
|
Austin, Texas |
|
|
Owned Leased |
|
Limestone |
|
|
3,000 |
|
|
4,300 69,000 |
|
|
44 |
|
1,900
|
|
Kansas City Area |
|
|
Owned |
|
Limestone |
|
|
700 |
|
|
51,000(2) |
|
|
50+ |
|
600 |
|
(1) |
All reserves are deemed to be probable under the definition of Industry Guide 7. |
|
(2) |
Includes reserves located in our underground mine that we believe can be economically used for aggregate supply. |
Our total net aggregate sales were 3.0 million tons in both fiscal 2016 and fiscal 2015. Total aggregates production was 3.4 million tons and 3.6 million tons for fiscal 2016 and fiscal 2015, respectively. A portion of our total aggregates production is used internally by our readymix concrete operations in Texas, the greater Kansas City area and California.
Raw Materials and Fuel Supplies
Cement and Slag. The principal raw material used in the production of Portland cement is calcium carbonate in the form of limestone. Limestone is obtained principally through mining and extraction operations conducted at quarries that we own or lease and are located in close proximity to our plants. We believe that the estimated recoverable limestone reserves owned or leased by us will permit each of our plants to operate at our present production capacity for at least 30 years. Other raw materials used in substantially smaller quantities than limestone are sand, clay, iron ore and gypsum. These materials are readily available and can either be obtained from Company-owned or leased reserves or purchased from outside suppliers.
Coal and petroleum coke are the primary fuels used in our cement plants, but the plants are equipped to burn natural gas, if necessary. The cost of fuel declined in fiscal 2016 as compared to fiscal 2015, primarily due to the increased use of petroleum coke and alternative fuels as a percentage of total fuel. The Tulsa plant currently burns fuel quality wastes, as well as coal and petroleum coke, and the Sugar Creek plant currently burns alternative fuels and petroleum coke. When we acquired Sugar Creek and Tulsa in late 2012, both plants had existing alternative fuels programs managed by a company that supplies alternative fuels and materials to the cement plants. In keeping with Eagle’s commitment to sustainability and to cost management, we continued these programs to manage our alternative fuels and materials at those plants.
5
We have a long term supply agreement with a steel manufacturer to supply granules necessary for the grinding of slag. This agreement allows for the purchases of 550,000 tons per year.
Electric power is also a major cost component in the manufacturing process for both cement and slag, and we have sought to diminish overall power costs by adopting interruptible power supply agreements at certain locations. These agreements may expose us to some production interruptions during periods of power curtailment.
Concrete and Aggregates. We supply from our cement plants approximately 100% of the cement requirements for both our greater Kansas City and northern California concrete operations. We internally supply approximately 35%, 10% and 80%, respectively, of our aggregates requirements for our Austin, greater Kansas City and northern California concrete operations. We obtain the balance of our cement and aggregates requirements from multiple outside sources in each of these areas.
We mine and extract limestone, sand and gravel, the principal raw materials used in the production of aggregates, from quarries owned or leased by us and located near our plants. The quarry serving our northern California business is estimated to contain over nine hundred million tons of sand and gravel reserves. The quarry serving our Austin, Texas market is covered by a lease which expires in 2060. Based on its current production capacity, we estimate our northern California and Austin, Texas quarries contain over 100 years and approximately 25 years of reserves, respectively. Our quarries in the Kansas City market currently have approximately 50 years of reserves, and we are actively seeking additional more economical reserves to extend the life of the quarry.
Sales and Distribution
Cement and Slag. The principal sources of demand for cement and slag are infrastructure, commercial construction and residential construction, with public works infrastructure comprising over 50% of total demand. Cement consumption increased approximately 4% during calendar 2015 from calendar 2014, and the Portland Cement Association forecasts cement consumption will increase another 3.4% in calendar 2016. Demand for cement is seasonal, particularly in northern states where inclement winter weather often affects construction activity. Cement sales are generally greater from spring through the middle of autumn than during the remainder of the year. The impact to our business of regional construction cycles may be mitigated to some degree by our geographic diversification. Demand for slag has increased as the availability of fly ash has decreased due to the conversion of power plants to natural gas from coal.
6
The following table sets forth certain information regarding the geographic areas served by each of our cement and slag plants and the location of our distribution terminals in each area. We have a total of 16 cement storage and distribution terminals that are strategically located to extend the sales areas of our plants.
|
Plant Location |
|
Type of Plant |
|
Principal Geographic Areas |
|
Distribution Terminals |
|
|
|
|
|
|
|
|
|
Buda, Texas
|
|
Cement |
|
Texas and western Louisiana |
|
Corpus Christi, Texas Houston, Texas Roanoke (Ft. Worth), Texas Waco, Texas Houston Cement Company (Joint Venture), Houston, Texas |
|
|
|
|
|
|
||
|
LaSalle, Illinois |
|
Cement |
|
Illinois and southern Wisconsin |
|
Hartland, Wisconsin |
|
|
|
|
|
|
||
|
Sugar Creek, Missouri |
|
Cement |
|
Western Missouri, eastern Kansas and northern Nebraska |
|
Sugar Creek, Missouri Iola, Kansas Wichita, Kansas Omaha, Nebraska |
|
|
|
|
|
|
||
|
Laramie, Wyoming |
|
Cement |
|
Wyoming, Utah, Colorado and western Nebraska |
|
Salt Lake City, Utah Denver, Colorado North Platte, Nebraska |
|
|
|
|
|
|
||
|
Tulsa, Oklahoma |
|
Cement |
|
Oklahoma, western Arkansas and southern Missouri |
|
Oklahoma City, Oklahoma Springfield, Missouri |
|
|
|
|
|
|
||
|
Fernley, Nevada |
|
Cement |
|
Northern Nevada and northern California |
|
Sacramento, California |
|
|
|
|
|
|
|
|
|
Chicago, Illinois |
|
Slag |
|
Greater Chicago area, Illinois, Pennsylvania, Iowa, Ohio, Minnesota, Missouri and Kansas |
|
Kansas City, Missouri Cincinnati, Ohio(1) Des Moines, Iowa(1) St. Paul, Minnesota(1) Tarentum, Pennsylvania(1) |
|
|
(1) |
These facilities are currently being leased. |
Cement and slag is distributed directly to our customers mostly through customer pickups, as well as by common carriers from our plants or distribution terminals. We transport cement and slag by barge and rail to our storage and distribution terminals. No single customer accounted for 10% or more of our cement segment sales during fiscal 2016. Sales are made on the basis of competitive prices in each market and, as is customary in the industry, we do not typically enter into long-term sales contracts.
Four of our slag terminals are currently being leased from the former owner. The initial term of the lease is one year from the date of purchase, and includes the option to extend the term for two one year periods, the first of which has been exercised for all locations.
The cement industry is extremely competitive as a result of multiple domestic suppliers and the importation of foreign cement through various terminal operations. Approximately 75% of the U.S. cement industry is owned by foreign international companies. Competition among producers and suppliers of cement is based primarily on price, with consistency of quality and service to customers being important but of lesser significance. Price competition among individual producers and suppliers of cement within a geographic area is intense because of the fungible nature of the product. Because of cement’s low value-to-weight ratio, the relative cost of transporting cement on land is high and limits the geographic area in which each company can market its products profitably; therefore, the U.S. cement industry is fragmented into regional geographic areas rather than a single national
7
selling area. No single cement company has a distribution of plants extensive enough to serve all geographic areas, so profitability is sensitive to shifts in the balance between regional supply and demand.
Cement imports into the U.S. occur primarily to supplement domestic cement production or to supply a particular region. Cement is typically imported into deep water ports or transported on the Mississippi River system near major population centers to take advantage of lower waterborne freight costs versus higher truck and rail transportation costs that U.S. based manufacturers incur to deliver into the same areas.
The Portland Cement Association estimates that imports represented approximately 13% of cement used in the U.S. during calendar year 2015, and approximately 9% in both calendar year 2014 and 2013. Based on the normal distribution of cement into the market, we believe that no less than approximately 5% to 10% of the total consumption will consistently be served by imported cement.
Concrete and Aggregates. Demand for readymix concrete and aggregates largely depend on local levels of construction activity. Construction activity is also subject to weather conditions, the availability of financing at reasonable rates and overall fluctuations in local economies, and therefore tends to be cyclical. We sell readymix concrete to numerous contractors and other customers in each plant’s marketing area. Our batch plants in Austin, the greater Kansas City area and northern California are strategically located to serve each marketing area. Concrete is delivered from the batch plants primarily by company-owned trucks.
We sell aggregates to building contractors and other customers engaged in a wide variety of construction activities. Aggregates are delivered from our aggregate plants by common carriers and customer pick-up. None of our customers accounted for 10% or more of our segment revenues during fiscal 2016. We are continuing our efforts to secure a rail link from our principal aggregates deposit north of Sacramento, California to supply extended markets in northern California.
Both the concrete and aggregates industries are highly fragmented, with numerous participants operating in each local area. Because the cost of transporting concrete and aggregates is very high relative to product values, producers of concrete and aggregates typically can profitably sell their products only in areas within 50 miles of their production facilities. Barriers to entry in each industry are low, except with respect to environmental permitting requirements for new aggregates production facilities and zoning of land to permit mining and extraction of aggregates.
Environmental Matters
Cement. Our cement operations are subject to numerous federal, state and local laws and regulations pertaining to health, safety and the environment. Some of these laws, such as the federal Clean Air Act and the federal Clean Water Act (and analogous state laws) impose environmental permitting requirements and govern the nature and amount of emissions that may be generated when conducting particular operations. Some laws, such as the federal Comprehensive Environmental Response, Compensation and Liability Act (“CERCLA”) (and analogous state laws) impose obligations to clean up or remediate spills of hazardous materials into the environment. Other laws require us to reclaim certain land upon completion of extraction and mining operations in our quarries. We believe that we have obtained all the material environmental permits that are necessary to conduct our operations. We further believe that we are conducting our operations in substantial compliance with these permits. In addition, none of our manufacturing sites is listed as a CERCLA “Superfund” site.
Eight environmental issues involving the cement manufacturing industry deserve special mention.
The first environmental issue involves cement kiln dust or CKD. The U.S. Environmental Protection Agency (“EPA”) has been evaluating the regulatory status of CKD under the Resource Conservation and Recovery Act (“RCRA”) for a number of years. In 1999, the EPA proposed a rule that would allow states to regulate properly-managed CKD as a non-hazardous waste under state laws and regulations governing solid waste. In contrast, CKD that was not properly managed would be treated as a hazardous waste under RCRA. In 2002, the EPA confirmed its intention to continue to exempt properly-managed CKD from the hazardous waste
8
requirements of RCRA. The agency announced that it would collect additional data over the next three to five years to determine if the states’ regulation of CKD is effective. Although the EPA had previously indicated that it continues to consider an approach whereby it would finalize its 1999 proposal to exempt properly-managed CKD wastes and establish protective CKD management standards, as of May 1, 2016, the EPA still has not finalized the 1999 proposal. Based on currently available information, it is uncertain whether or when this proposal will be finalized. Nevertheless, in the interim many state environmental agencies have been using the EPA’s 1999 proposed CKD management standards as general industry guidelines.
Currently, substantially all CKD produced in connection with our ongoing operations is recycled, and therefore such CKD is not viewed as a waste under RCRA. However, CKD was historically collected and stored on-site at our Illinois, Nevada, Missouri, Oklahoma and Wyoming cement plants and at a former plant site in Corpus Christi, Texas, which is no longer producing cement. If either the EPA or the states decide to reclassify or impose new management standards on this CKD at some point in the future, we could incur additional costs to comply with those requirements with respect to our historically collected CKD. CKD that comes in contact with water might produce a leachate with an alkalinity high enough to be classified as hazardous and might also leach certain hazardous trace metals therein.
The second environmental issue involves the historical disposal of refractory brick containing chromium. Such refractory brick was formerly used widely in the cement industry to line cement kilns. We currently do not use refractory brick containing chromium, and we crush spent refractory brick which is then used as raw feed in the kiln.
The third environmental issue involves the potential regulation of our emission of greenhouse gasses (“GHGs”), including carbon dioxide, under the Clean Air Act (“CAA”). The consequences of GHG emission reduction regulations for our cement operations will likely be significant because (1) the cement manufacturing process requires the combustion of large amounts of fuel to generate very high kiln temperatures, and (2) the production of carbon dioxide is a byproduct of the calcination process, whereby carbon dioxide is removed from calcium carbonate to produce calcium oxide.
In response to the Supreme Court’s ruling in Massachusetts v. EPA, 127 S. Ct. 1438 (2007), that GHGs are “air pollutants” and, thus, potentially subject to regulation under the CAA, the EPA has taken steps to regulate GHG emissions from mobile and stationary sources. On September 22, 2009, the EPA issued a “Mandatory Reporting of Greenhouse Gases” final rule, which took effect December 29, 2009. This rule established a comprehensive scheme requiring operators of stationary sources in the United States emitting more than established annual thresholds of GHGs to inventory and report their GHG emissions annually on a facility-by-facility basis. On December 15, 2009, the EPA published a final rule finding that current and projected concentrations of six key GHGs in the atmosphere threaten public health and welfare. Based on this finding, on May 7, 2010, the EPA promulgated a final rule establishing GHG emission standards for new motor vehicles under Title II of the CAA. According to the EPA, the motor vehicle rule triggered construction and operating permit requirements for large stationary sources of GHGs, including cement plants, under Title I of the CAA. On May 13, 2010, the EPA promulgated a final rule, known as the “Tailoring Rule,” addressing the thresholds at which stationary sources of GHGs trigger prevention of significant deterioration (“PSD”) and Title V permitting requirements. PSD review requires an analysis of possible GHG controls and, potentially, the installation of GHG controls or emissions limitations.
On June 23, 2014 the U.S. Supreme Court issued an opinion with respect to the Tailoring Rule holding that the EPA can require PSD controls for GHG emissions only for sources subject to PSD review based on another pollutant. Util. Air Regulatory Grp. v. E.P.A, 134 S. Ct. 2427 (2014). Following the Supreme Court decision, the EPA issued a memorandum clarifying that the EPA intends to continue to apply PSD requirements to GHG emissions if a source emits or has the potential to emit 75,000 tons per year (‘tpy”) or more of GHGs until the EPA establishes a de minimis threshold for GHG emissions below which a source would not be subject to GHG PSD permitting requirements. The EPA intends to propose a rule addressing the de minimis threshold for GHG PSD permitting in the summer of 2016. Until the EPA issues a final rule addressing the de minimis threshold for GHG emissions, any major modification of our existing plants or construction of a new plant that triggers PSD
9
review for non-GHG emissions also would trigger PSD review for GHG emissions if the proposed major modification or construction would result in a GHG emission increase of at least 75,000 tpy.
In October 2015, the EPA published a rule establishing guidelines for states to regulate carbon dioxide emissions from existing fossil fuel power plants (the “Clean Power Plan”). The Clean Power Plan established national performance rates for steam generating units and stationary combustion turbines as well as state emission reduction goals based on the application of the performance rates to a state’s unique generation mix. Numerous states and industry petitioners are challenging the Clean Power Plan on multiple grounds. On February 9, 2016, the U.S. Supreme Court stayed implementation of the Clean Power Plan while the litigation is pending. The U.S. Court of Appeals for the District of Columbia Circuit (“D.C. Circuit”) will hold oral argument on the challenges to the Clean Power Plan on June 2, 2016. In the future, the EPA is expected to propose performance standards for GHG emissions for other sectors, including cement manufacturing, and the ultimate outcome of the Clean Power Plan could affect the timing and form of standards for cement plants.
Several states have individually implemented measures to reduce emissions of GHGs, primarily through the planned development of GHG inventories or registries or regional GHG “cap and trade” programs. California’s AB 32 program is the most advanced of such state initiatives, with regulations affecting all major sources of GHGs. States also have joined together to form regional initiatives to reduce GHG emissions.
It is not possible at this time to predict how any future legislation that may be enacted or final EPA regulations that may be adopted to address GHG emissions would impact our business. However, any imposition of raw materials or production limitations, fuel-use or carbon taxes, or emission limitations or reductions could have a significant impact on the cement manufacturing industry and a material adverse effect on us and our results of operations.
The fourth environmental issue is the EPA’s promulgation on September 9, 2010 of final regulations establishing national emissions standards for hazardous air pollutants for portland cement plants (“PC NESHAP”) pursuant to Section 112 of the CAA. For specific hazardous air pollutants (“HAPs”), the final rule requires cement plants to meet certain emission and operating standards. The rule sets limits on mercury emissions from existing Portland cement kilns and increases the stringency of emission limits for new kilns. The rule sets emission limits for total hydrocarbons, and also sets emission limits for particulate matter as a surrogate for non-volatile metal HAPS, from cement kilns of all sizes, and reduces hydrochloric acid emissions from kilns that are large emitters. As a result of industry challenges to the regulations, the EPA issued a revised rule on February 12, 2013. The revised rule made two notable changes to the 2010 HAP regulations. First, the rule established less stringent emission standards for total hydrocarbons and particulate matter. Second, the rule extended the deadline for existing sources to comply with the HAP regulations to September 9, 2015. Two of our cement plants are currently operating with one-year extensions of compliance for one and two of the PC NESHAP emission standards, respectively. We do not believe we are placed at a competitive disadvantage by the revised rule.
A fifth environmental issue involves excess emissions that may occur during periods of startup, shutdown or malfunction. In June 2015, the EPA issued a rule requiring revisions to 36 state implementation plans (“SIPs”) that allowed exemptions or contained affirmative defenses to excess emissions during periods of startup, shutdown or malfunction (“SSM rule”). The SIP revisions are due to the EPA in November 2016. The states required to revise their SIPs include states where the company has operations, such as Illinois, Oklahoma, Missouri and Texas. Under the revised SIPs, companies would be required to comply with their emissions limits at all times, including during startup, shutdown and malfunctions. States and members of industry have challenged the SSM rule in the U.S. Court of Appeals for the D.C. Circuit, with briefing scheduled to conclude in September 2016. The court likely will not issue a decision on the SSM rule until sometime in 2017. If the SSM rule is upheld, some of the company’s sources may need to revise their permits or take other actions to ensure compliance with emissions limits during startup, shutdown or malfunctions.
The sixth environmental issue is the EPA’s promulgation pursuant to Section 129 of the CAA of revised regulations for Commercial and Industrial Solid Waste Incineration (“CISWI”) units. Clean Air Act Section 129 requires the EPA to set standards for solid waste incineration units. Affected sources must comply with the
10
revised CISWI regulations the earlier of 3 years after State CISWI plan approval, or 5 years from the date of the final rule on reconsideration. On January 1, 2015, the EPA published a proposal to reconsider four provisions of the February 2013 final CISWI rule, and eliminate the affirmative defense to penalties for non-compliance during well documented malfunction events. Compared to the PC NESHAP, the CISWI regulations contain requirements for more pollutants and the requirements for particulate matter and dioxin/furans for existing and new sources are more stringent.
Whether a facility is a CISWI unit regulated under Section 129 of the Clean Air Act or a cement plant regulated under Section 112 of the Clean Air Act hinges on whether it combusts “solid waste” as that term is defined under Subtitle D of the Resource Conservation and Recovery Act. On March 21, 2011 (and also revised on February 7, 2013), the EPA finalized the Identification of Non-Hazardous Secondary Materials that Are Solid Waste (“NHSM”) rule. The NHSM rule’s primary purpose is to provide the definition of solid waste that is used to determine if a cement kiln is regulated under CISWI regulations or the PC NESHAP regulations. The rule lays out processing and legitimacy criteria that are used to determine if a non-traditional fuel is a solid waste. Combustion of a solid waste triggers applicability of the CISWI requirements.
At some of our operations, kilns are or will be using non-hazardous secondary materials as a replacement for traditional fuels used in the manufacturing process. These kiln systems are capable of beneficially utilizing a wide array of NHSM and may be subject to the CISWI requirements, depending on whether these materials are identified as “solid wastes” under the NHSM rule. The EPA issued a rule clarifying the definition of “solid waste” and establishing a uniform recycling standard for all hazardous secondary materials recycling on January 13, 2015, which became effective on July 13, 2015. Solid waste-burning kilns must meet the CISWI emission and operating standards. Non-waste burning kilns must prove any alternative fuels used are not solid wastes. We are in the process of analyzing the implications of using NHSM and compliance with the CISWI standards. In addition, industry and environmental organizations have filed lawsuits challenging the CISWI regulations. It is not possible at this time to predict whether the CISWI regulations will be changed as an outcome of the litigation. We do not believe we would be placed at a competitive disadvantage by either the NHSM or the CISWI rule.
The seventh environmental issue is a revision to the Hazardous Waste Combustor National Emission Standards for Hazardous Waste Standards (“HWC NESHAP”). The Tulsa, Oklahoma cement facility utilizes hazardous waste as fuel and is required to meet the emission and operating standards of the HWC NESHAP. This facility has demonstrated and remains in compliance with all of the requirements of the current HWC NESHAP regulation. On October 12, 2005, as a result of ongoing litigation, the EPA promulgated final HWC regulations, with compliance required for all facilities by 2008. On October 28, 2008, the EPA promulgated a final rule addressing eight issues for which the EPA granted reconsideration. The final rule on reconsideration did not change the compliance date for existing sources established by the 2005 rule. Environmental and industry organizations filed lawsuits in the U.S. Court of Appeals for the D.C. Circuit challenging the 2005 and 2008 regulations. The EPA subsequently agreed to revise the HWC NESHAP standards in accordance with an agreement with litigants, and the court remanded, without vacatur, the 2005 and 2008 regulations to the EPA for further consideration. The EPA has not indicated when it will issue a proposed rule amending the regulations. It is not possible to predict at this time the stringency or impact of revised HWC NESHAP regulations or timing required for compliance.
We believe that our current procedures and practices in our operations, including those for handling and managing hazardous materials, are consistent with industry standards and are in substantial compliance with applicable environmental laws and regulations. Nevertheless, because of the complexity of our operations and the environmental laws to which we are subject, there can be no assurance that past or future operations will not result in violations, remediation costs or other liabilities or claims. Moreover, we cannot predict what environmental laws will be enacted or adopted in the future or how such future environmental laws or regulations will be administered or interpreted. Compliance with more stringent environmental laws, or stricter interpretation of existing environmental laws, could necessitate significant capital outlays.
The eighth environmental issue is the EPA’s ongoing review and implementation of the national ambient air quality standards (“NAAQS”) for ozone. In October 2015, the EPA strengthened the ozone NAAQS by lowering
11
the primary and secondary standards from 75 parts per billion (ppb) to 70 ppb. As a result of this change, the EPA is required to make attainment/nonattainment designations for the revised standards by October 2017. We are currently reviewing this final rule and cannot at this time predict the impact it may have on our operations. Nonattainment designations in or surrounding our areas of operations could have a material impact on our consolidated financial results.
Concrete and Aggregates. The concrete and aggregates industry is subject to environmental regulations similar to those governing our cement operations.
Capital Expenditures
Cement and Slag. We had capital expenditures related to compliance with environmental regulations applicable to our cement operations of $1.4 million during fiscal 2016 and anticipate spending an additional $1.7 million during fiscal 2017 at this time.
Concrete and Aggregates. We had capital expenditures related to compliance with environmental regulations applicable to our concrete and aggregates operations of $0.1 million during fiscal 2016. We anticipate spending approximately $0.8 million in fiscal 2017 at this time.
Gypsum Wallboard and RECYCLED PAPERBOARD Operations
Company Operations
Gypsum Wallboard. We currently own five gypsum wallboard manufacturing facilities; however, we idled our gypsum manufacturing facility in Bernalillo, New Mexico in December 2009, due to cyclical low wallboard demand. We anticipate re-opening this facility when additional capacity is needed to meet marketplace demand. There are four primary steps in the gypsum wallboard manufacturing process: (1) gypsum is mined and extracted from the ground (or, in the case of synthetic gypsum, received from a power generation company); (2) the gypsum is then calcined and converted into plaster; (3) the plaster is mixed with various other materials and water to produce a mixture known as slurry, which is extruded between two continuous sheets of recycled paperboard on a high-speed production line and allowed to harden; and (4) the sheets of gypsum wallboard are then cut to appropriate lengths, dried and bundled for sale. Gypsum wallboard is used to finish the interior walls and ceilings in residential, commercial and industrial structures.
The following table sets forth certain information regarding our plants:
|
Location |
|
Owned or Leased Reserves (7) |
|
Approximate Annual Gypsum Wallboard Capacity (MMSF)(1) |
|
Estimated Minimum Gypsum Reserves ( Thousand Tons) (3) |
|
Estimated Minimum Gypsum Reserves (years)(2) |
|
Fiscal 2016 Tons Mined (Thousand Tons) |
||
|
Albuquerque, New Mexico |
|
Owned Leased |
|
|
425 |
|
10,500(4) 55,900(4) |
|
|
50+(4) |
|
380 |
|
|
|
|
|
|
|
|
|
|
|
|
|
|
|
Bernalillo, New Mexico(6) |
|
|
|
|
550 |
|
(4) |
|
|
50+(4) |
|
— |
|
|
|
|
|
|
|
|
|
|
|
|
|
|
|
Gypsum, Colorado |
|
Owned |
|
|
700 |
|
10,000 |
|
|
16 |
|
470 |
|
|
|
|
|
|
|
|
|
|
|
|
|
|
|
Duke, Oklahoma |
|
Owned Leased |
|
|
1,300 |
|
24,700 2,300 |
|
|
23 |
|
680 |
|
|
|
|
|
|
|
|
|
|
|
|
|
|
|
Georgetown, South Carolina (5) |
|
|
|
|
900 |
|
|
|
|
52(5) |
|
— |
|
Total |
|
|
|
|
3,875 |
|
|
|
|
|
|
|
|
(1) |
Million Square Feet (“MMSF”), based on anticipated product mix. |
|
(2) |
At 100% capacity utilization. |
|
(3) |
All gypsum tons are deemed probable under the definition provided by Industry Guide 7. |
|
(4) |
The same reserves serve both New Mexico plants. |
|
(5) |
We have a sixty year supply agreement with Santee Cooper for synthetic gypsum that expires in 2068. |
|
(6) |
This plant was idled in December 2009. |
|
(7) |
Owned reserves include mining claims. |
12
Our gypsum wallboard production totaled 2,406 MMSF in fiscal 2016 and 2,244 MMSF in fiscal 2015. Total gypsum wallboard sales were 2,394 MMSF in fiscal 2016 and 2,210 MMSF in fiscal 2015.
Recycled Paperboard. Our recycled paperboard manufacturing operation, which we refer to as Republic Paperboard Company (“Republic”), is located in Lawton, Oklahoma, and has a technologically advanced paper machine designed primarily for gypsum liner production. The paper’s uniform cross-directional strength and finish characteristics facilitate the efficiencies of new high-speed wallboard manufacturing lines and improve the efficiencies of the slower wallboard manufacturing lines. Although the machine was designed primarily to manufacture gypsum liner products, we are also able to manufacture several alternative products, including containerboard grades and lightweight packaging grades. To maximize manufacturing efficiencies, namely machine width, recycled industrial paperboard grades are produced.
Our paper machine allows the paperboard operation to manufacture high-strength gypsum liner that is approximately 10-15% lighter in basis weight than generally available in the U.S. The low-basis weight product utilizes less recycled fiber to produce paper that, in turn, requires less energy (natural gas) to evaporate moisture from the board during the gypsum wallboard manufacturing process. The low-basis weight paper also reduces the overall finished board weight, providing wallboard operations with more competitive transportation costs for both the inbound and outbound segments.
Raw Materials and Fuel Supplies
Gypsum Wallboard. We mine and extract natural gypsum rock, the principal raw material used in the manufacture of gypsum wallboard, from mines and quarries owned, leased or subject to mining claims owned by the Company and located near our plants. Certain of our New Mexico reserves are under lease with the Pueblo of Zia. Gypsum ore reserves at the Gypsum, Colorado plant are contained within a total of 115 placer claims encompassing 2,300 acres. Included in this are 94 unpatented mining claims where mineral rights can be developed upon completion of permitting requirements. We currently own land containing gypsum in the area of Duke, Oklahoma, with additional reserves controlled through a lease agreement. Other gypsum deposits are located near the plant in Duke, which we believe may be obtained at reasonable cost when needed. We are currently in the eighth year of a sixty year supply agreement (original twenty year term with two twenty year extension options) with a public utility in South Carolina for synthetic gypsum, which we use at our Georgetown, South Carolina plant. If the utility is unable to generate the agreed-upon amount of gypsum, it is responsible for providing gypsum from a third party to fulfill its obligations.
Through our modern low cost paperboard mill we manufacture sufficient quantities of paper necessary for our gypsum wallboard production. Paper is a significant cost component in the manufacture of gypsum wallboard, currently representing approximately one-third of our cost of production.
Our gypsum wallboard manufacturing operations use natural gas and electrical power. A significant portion of the Company’s natural gas requirements for our gypsum wallboard plants are currently provided by three gas producers under gas supply agreements expiring in May 2017 for New Mexico; March 2017 for Colorado; and October 2016 for South Carolina and Oklahoma. If the agreements are not renewed, we anticipate being able to obtain our gas supplies from other suppliers at competitive prices. Electrical power is supplied to our New Mexico plants at standard industrial rates by a local utility. Our Albuquerque plant utilizes an interruptible power supply agreement, which may expose it to some production interruptions during periods of power curtailment. Power for our Gypsum, Colorado facility is generated at the facility by a cogeneration power plant that we own. Currently, the cogeneration power facility supplies power and waste hot gases for drying to the gypsum wallboard plant. We do not sell any power to third parties. Gas costs represented approximately 7% of our production costs in fiscal 2016.
Recycled Paperboard. The principal raw materials are recycled paper fiber (recovered waste paper), water and specialty paper chemicals. The largest waste paper source used by the operation is old cardboard containers (known as OCC). A blend of high grades (white papers consisting of ink-free papers such as news blank and unprinted papers) is used in the gypsum liner facing paper, white top linerboard and white bag liner grades.
13
We believe that an adequate supply of OCC recycled fiber will continue to be available from sources located within a reasonable proximity of the paper mill. Although we have the capability to receive rail shipments, the vast majority of the recycled fiber purchased is delivered via truck. Prices are subject to market fluctuations based on generation of material (supply), demand and the presence of the export market. The current outlook for fiscal 2017 is for waste paper prices, namely OCC, to remain relatively consistent with fiscal 2016. Current gypsum liner customer contracts include price escalators that partially offset/compensate for changes in raw material fiber prices. The chemicals used in the paper making operation, including size, retention aids, biocides and bacteria controls, are readily available from several manufacturers at competitive prices.
The manufacture of recycled paperboard involves the use of large volumes of water in the production process. We have an agreement with the City of Lawton municipal services for supply of water to Republic. Electricity, natural gas and other utilities are available to us at either contracted rates or standard industrial rates in adequate supplies. These utilities are subject to standard industrial curtailment provisions.
Paperboard operations are generally large consumers of energy, primarily natural gas and electricity. During fiscal 2016, natural gas and electricity costs were lower compared to fiscal 2015. The reduced costs were the result of both lower energy prices and lower usage rates. During fiscal 2016, electricity costs were lower compared to fiscal 2015 due to a reduction in pricing. Electricity is supplied to the paper mill by Public Service of Oklahoma (PSO). This power company is working to switch its fuel source dependency to natural gas, which could impact our electricity rates in future years. Oklahoma is a regulated state for electricity services and all rate change requests must be presented to the Oklahoma Corporation Commission for review and approval before implementation.
Sales and Distribution
Gypsum Wallboard. The principal sources of demand for gypsum wallboard are (i) residential construction, (ii) repair and remodeling, (iii) non-residential construction, and (iv) other markets such as exports and manufactured housing, which we estimate accounted for approximately 44%, 45%, 10% and 1%, respectively, of calendar 2016 industry sales. Demand for gypsum wallboard remains highly cyclical; and closely follows construction industry cycles, particularly housing construction. Demand for wallboard can be seasonal and is generally greater from spring through the middle of autumn.
We sell gypsum wallboard to numerous building materials dealers, gypsum wallboard specialty distributors, lumber yards, home center chains and other customers located throughout the United States, with the exception of the northeast. Gypsum wallboard is sold on a delivered basis, mostly by truck. We generally utilize third-party common carriers for deliveries. Two customers accounted for approximately 25% of our gypsum wallboard segment sales during fiscal 2016.
Although gypsum wallboard is distributed principally in local areas, certain industry producers (including the Company) have the ability to ship gypsum wallboard by rail outside their usual regional distribution areas to regions where demand is strong. We own approximately 100 railcars for transporting gypsum wallboard. In addition, in order to facilitate distribution in certain strategic areas, we maintain a distribution center in New Mexico. Our rail distribution capabilities permit us to service customers in markets on both the east and west coasts, except for the northeast.
There are seven manufacturers of gypsum wallboard in the U.S. operating a total of approximately 60 plants. We estimate that the three largest producers - USG Corporation, National Gypsum Company and Koch Industries - account for approximately 60% of gypsum wallboard sales in the U.S. Due to the commodity nature of the product, competition is based principally on price, which is highly sensitive to changes in supply and demand. Product quality and customer service are also important to the customer.
Total wallboard rated production capacity in the United States is currently estimated at approximately 33.0 billion square feet per year; however, certain lines have been curtailed and plants closed or idled. It is possible that previously closed plants or lines could be brought back into service. The Gypsum Association, an industry
14
trade group, estimates that total calendar 2015 gypsum wallboard shipments by U.S. manufacturers were approximately 22.0 billion square feet.
Recycled Paperboard. Our manufactured recycled paperboard products are sold to gypsum wallboard manufacturers and other industrial users. During fiscal 2016, just below 40% of the recycled paperboard sold by our paper mill was consumed by the Company’s gypsum wallboard manufacturing operations. We also have contracts with two other gypsum wallboard manufacturers that represent approximately 40% of our total segment revenue with the remaining volume shipped to other gypsum liner manufacturers and bag producers. The current contracts with other gypsum wallboard manufacturers expire in the next one to seven years. The loss of either of these contracts or a termination or reduction of their current production of gypsum wallboard, unless replaced by a commercially similar arrangement, could have a material adverse effect on the Company.
Environmental Matters
Gypsum Wallboard. The gypsum wallboard industry is subject to numerous federal, state and local laws and regulations pertaining to health, safety and the environment. Some of these laws, such as the federal Clean Air Act and the federal Clean Water Act (and analogous state laws), impose environmental permitting requirements and govern the nature and amount of emissions that may be generated when conducting particular operations. Some laws, such as CERCLA (and analogous state laws), impose obligations to clean up or remediate spills of hazardous materials into the environment. Other laws require us to reclaim certain land upon completion of extraction and mining operations in our quarries. None of our gypsum wallboard operations is the subject of any local, state or federal environmental proceedings or inquiries. We do not, and have not, used asbestos in any of our gypsum wallboard products.
On April 17, 2015, the EPA published its final rule addressing the storage, reuse and disposal of coal combustion products, which include fly ash and flue gas desulfurization gypsum (“synthetic gypsum”). We use synthetic gypsum in wallboard manufactured at our Georgetown, South Carolina plant. The rule, which applies only to electric utilities and independent power producers, establishes standards for the management of coal combustion residuals (“CCRs”) under Subtitle D of the Resource Conservation and Recovery Act, or RCRA, which is the Subtitle that regulates non-hazardous wastes. The rule imposes requirements addressing CCR surface impoundments and landfills, including location restrictions, design and operating specifications, groundwater monitoring requirements, corrective action requirements, recordkeeping and reporting obligations, and closure requirements. Beneficial encapsulated uses of CCRs, including synthetic gypsum, are exempt from regulation. The rule becomes effective on October 14, 2015, with many of the requirements phased in months or years after the effective date. Given the EPA’s decision to continue to allow CCR to be used in synthetic gypsum and to regulate CCR under the non-hazardous waste sections of RCRA, we do not expect the rule to materially affect our business, financial condition and results of operations.
In October 2015, the EPA strengthened the national ambient air quality standards (“NAAQS”) for ozone by lowering the primary and secondary standards from 75 parts per billion (ppb) to 70 ppb. As a result of this change, the EPA is required to make attainment/nonattainment designations for the revised standards by October 2017. We are currently reviewing this final rule and cannot at this time predict the impact it may have on our operations. Nonattainment designations in or surrounding our areas of operations could have a material impact on our consolidated financial results.
Our gypsum wallboard manufacturing process combusts natural gas. It is possible that GHG emissions from our manufacturing could become subject to regulation under the CAA. For a more detailed discussion of this issue, see the “Environmental Matters” section of our cement business description on pages 8-12.
Although our gypsum wallboard operations could be adversely affected by federal, regional or state climate change initiatives, at this time, it is not possible to accurately estimate how future laws or regulations addressing GHG emissions would impact our business. However, any imposition of raw materials or production limitations, fuel-use or carbon taxes or emission limitations or reductions could have a significant impact on the gypsum wallboard manufacturing industry and a material adverse effect on the financial results of our operations.
15
Gypsum Wallboard and Recycled Paperboard. There were no capital expenditures related to compliance with environmental regulations applicable to our gypsum wallboard and recycled paperboard operations during fiscal 2016, and we do not anticipate any capital expenditures during fiscal 2017.
OIL AND GAS PROPPANTS OPERATIONS
Company Operations
We currently own two frac sand mines, three frac sand wet processing plants and three frac sand drying facilities. Our frac sand mines and wet plants are in New Auburn, Wisconsin and Utica, Illinois. Our frac sand drying facilities are in New Auburn, Wisconsin and Corpus Christi, Texas, as outlined in the table below. We ship wet sand from our Utica, Illinois mine site to Corpus Christi, Texas, where the sand is processed into various mesh sizes and marketed primarily to oil service companies. In addition to Corpus Christi, we have the following trans-load locations where sand processed at our New Auburn, Wisconsin facility is sold. These locations are El Reno, Oklahoma; Cotulla, Texas; Odessa, Texas; San Antonio, Texas; Kenedy, Texas; and Fowlerton, Texas. The Kenedy, Texas and Fowlerton, Texas trans-loads are supplied from our Corpus Christi, Texas site.
The following table provides information regarding our frac sand production facilities at March 31, 2016:
|
Wet Plant Location |
|
Owned or Leased Reserves |
|
Estimated Annual Wet Production Capacity (Thousand tons)(3) |
|
|
Estimated Minimum Reserves (Thousand Tons)(1) |
|
Estimated Minimum Reserves (Years) |
|
Fiscal 2016 Tons Mined (Thousand Tons)(2) |
|
||
|
New Auburn, Wisconsin |
|
Owned |
|
2,800 |
|
|
15,200 |
|
9(2) |
|
785 |
|
||
|
|
|
Leased |
|
|
|
|
8,000 |
|
|
|
|
|
||
|
|
|
|
|
|
|
|
|
|
|
|
|
|
|
|
|
Utica, Illinois |
|
Owned |
|
2,200 |
|
|
139,900 |
|
50+ |
|
13 |
|
||
|
Dry Plant Location |
|
Dry Plant Capacity (Thousand Tons) |
|
|
|
|
||
|
New Auburn, Wisconsin (two lines) |
|
|
1,900 |
|
|
|
|
|
|
Corpus Christi, Texas |
|
|
1,500 |
|
|
|
|
|
|
(1) |
All sand tons are deemed to be probable under the definition provided by Industry Guide 7. |
|
(2) |
We have an option to purchase property that, if purchased, will increase our estimated minimum reserves to approximately 20 years. |
|
(3) |
Represents throughput capacity. |
As a result of the decline in oil and gas drilling, and the corresponding reduction in demand for proppants, we elected to temporarily idle our Utica, Illinois and Corpus Christi, Texas facilities during the fourth quarter of fiscal 2016. Additionally, we idled the Fowlerton, Texas and Kenedy, Texas trans-load operations. Our facilities are relatively new, and are in very good physical condition. We plan on resuming business at these facilities in the future when demand for proppants increases, and additional capacity is needed. The cost of maintaining these idled facilities is not considered to be significant. Due to the decline in demand for proppants, and the idling of the two operating facilities and two trans-load locations, we performed a test for impairment on the long-lived assets of the oil and gas proppants segment. Based on the results of this test, no impairment was recorded. See Critical Accounting Policies, Impairment of Long-Lived Assets on page 45 for more information about the test for impairment.
Raw Materials and Fuel Supplies
We mine our frac sand from open pit mines, and process the sand in our wet plants. The excavation process includes stripping the overburden overlaying the planned mining area, and removing the sand through blasting or mechanically with the use of mobile equipment. Processing includes washing the sand with water, and screening to remove non-salable material after which the sand is dried and further screened to its final mesh sizes, which range from 20 mesh to 140 mesh. During the winter months, the cold weather adversely impacts our ability to
16
operate our wet processing plants, resulting in these plants being shut-down for much of the winter. Generally our New Auburn, Wisconsin facility is impacted more by the weather than our Utica, Illinois facility.
Natural gas is the major fuel used in our wet and dry plants. The cost of natural gas declined throughout fiscal 2016, and is not expected to fluctuate materially in fiscal 2017. Electricity and water are also major cost component in our manufacturing process. We do not anticipate significant changes in the cost of these utilities in fiscal 2017.
Sales and Distribution
A portion of the frac sand we produce is sold under long-term contracts that require our customers to pay a specified price per mesh size for a specified volume of sand each month, or quarter depending on the contract. The terms of our customer contracts, including pricing, delivery and mesh distribution, vary by customer. Our long-term customer contracts contain liquidated damages for non-performance by our customers, and certain of our contracts contain provisions allowing the customer to terminate the contract at various times during the term of the contract by paying a termination fee. The recent decline in U.S. rig count and completion activity has adversely impacted oil and gas activity leading to reduced demand and pricing for proppants. As a result, we have renegotiated certain provisions of our long-term contracts with certain customers. The renegotiated contracts reflect the reduced demand for frac sand in the current environment by restructuring the contracts to provide reduced contracted sales volumes and prices in the near term, with the contracted minimums being increased in the later years. In addition to the long-term sales contracts, we sell frac sand through our distribution network under short-term pricing and other agreements. The terms of our short-term pricing agreements vary by customer.
We currently have contracts to provide frac sand to six customers. For the year ended March 31, 2016, five customers exceeded 10% of our segment revenues, and collectively this group of customers accounted for approximately 70% of our segment revenues. Approximately 75% of our revenues for the fiscal year 2016 were generated from contract sales.
We utilize in basin trans-load facilities as a part of our distribution network. The San Antonio, Cotulla and Odessa trans-load locations are supplied by rail, and operated by third-party contractors. The El Reno, Oklahoma trans-load location is also supplied by rail, and is operated by company personnel. Frac sand is delivered to the sites in rail cars specifically designed for loading and unloading sand. At March 31, 2016 we had approximately 700 rail cars under lease, with an average term of approximately five years. Our Corpus Christi location is served by barge, and the Kenedy and Fowlerton, Texas trans-load sites are served by truck from Corpus Christi.
Environmental Matters
We and the commercial silica industry are subject to extensive governmental regulation pertaining to matters such as permitting and licensing requirements, plant and wildlife protection, hazardous materials, air and water emissions, and environmental contamination and reclamation. A variety of federal, state and local agencies have established, implement and enforce these regulations.
Federal Regulation. At the federal level, we may be required to obtain permits under Section 404 of the Clean Water Act from the U.S. Army Corps of Engineers for the discharge of dredged or fill material into waters of the United States, including wetlands and streams, in connection with our operations. We also may be required to obtain permits under Section 402 of the Clean Water Act from the EPA or the state environmental agencies, to which the EPA has delegated local implementation of the permit program, for discharges of pollutants into waters of the United States, including discharges of wastewater or storm-water runoff associated with construction activities. Failure to obtain these required permits or to comply with their terms could subject us to administrative, civil and criminal penalties as well as injunctive relief.
The U.S. Clean Air Act and comparable state laws regulate emissions of various air pollutants through air emissions permitting programs and the imposition of other requirements. These regulatory programs may require us to install expensive emissions abatement equipment, modify operational practices, and obtain permits for
17
existing or new operations. Before commencing construction on a new or modified source of air emissions, such laws may require us to reduce emissions at existing facilities. As a result, we may be required to incur increased capital and operating costs to comply with these regulations. We could be subject to administrative, civil and criminal penalties as well as injunctive relief for noncompliance with air permits or other requirements of the U.S. Clean Air Act and comparable state laws and regulations.
As part of our operations, we utilize or store petroleum products and other substances such as diesel fuel, lubricating oils and hydraulic fluid. We are subject to regulatory programs pertaining to the storage, use, transportation and disposal of these substances. Spills or releases may occur in the course of our operations, and we could incur substantial costs and liabilities as a result of such spills or releases, including claims for damage or injury to property and persons. CERCLA and comparable state laws may impose joint and several liability, without regard to fault or legality of conduct, on classes of persons who are considered to be responsible for the release of hazardous substances into the environment. These persons include the owner or operator of the site where the release occurred and anyone who disposed of or arranged for disposal, including offsite disposal, of a hazardous substance generated or released at the site. Under CERCLA, such persons may be subject to liability for the costs of cleaning up the hazardous substances, for damages to natural resources, and for the costs of certain health studies. In addition, it is not uncommon for neighboring landowners and other third parties to file claims for personal injury and property damage allegedly caused by the hazardous substances released into the environment.
In addition, RCRA and comparable state statutes regulate the generation, transportation, treatment, storage, disposal and cleanup of hazardous and non-hazardous wastes. The EPA and state environmental agencies, to which the EPA has delegated portions of the RCRA program for local implementation, administer the RCRA program.
Our operations may also be subject to broad environmental review under the National Environmental Policy Act (“NEPA”). NEPA requires federal agencies to evaluate the environmental impact of all “major federal actions” significantly affecting the quality of the human environment. The granting of a federal permit for a major development project, such as a mining operation, may be considered a “major federal action” that requires review under NEPA. Therefore, our projects may require review and evaluation under NEPA. As part of this evaluation, the federal agency considers a broad array of environmental impacts, including, among other things, impacts on air quality, water quality, wildlife (including threatened and endangered species), historic and archaeological resources, geology, socioeconomics and aesthetics. NEPA also requires the consideration of alternatives to the project. The NEPA review process, especially the preparation of a full environmental impact statement, can be time consuming and expensive. The purpose of the NEPA review process is to inform federal agencies’ decision-making on whether federal approval should be granted for a project and to provide the public with an opportunity to comment on the environmental impacts of a proposed project. Though NEPA requires only that an environmental evaluation be conducted and does not mandate a particular result, a federal agency could decide to deny a permit or impose certain conditions on its approval, based on its environmental review under NEPA, or a third party could challenge the adequacy of a NEPA review and thereby delay the issuance of a federal permit or approval.
Federal agencies granting permits for our operations also must consider impacts to endangered and threatened species and their habitat under the Endangered Species Act. We also must comply with and are subject to liability under the Endangered Species Act, which prohibits and imposes stringent penalties for the harming of endangered or threatened species and their habitat. Federal agencies also must consider a project’s impacts on historic or archaeological resources under the National Historic Preservation Act, and we may be required to conduct archaeological surveys of project sites and to avoid or preserve historical areas or artifacts.
State and Local Regulation. We are also subject to a variety of state and local environmental review and permitting requirements. Some states, including Wisconsin where one of our operations is located, have state laws similar to NEPA; thus our development of a new site or the expansion of an existing site may be subject to comprehensive state environmental reviews even if it is not subject to NEPA. In some cases, the state environmental review may be more stringent than the federal review. Our operations may require state-law based
18
permits in addition to federal permits, requiring state agencies to consider a range of issues, many the same as federal agencies, including, among other things, a project’s impact on wildlife and their habitats, historic and archaeological sites, aesthetics, agricultural operations, and scenic areas. Wisconsin and some other states also have specific permitting and review processes for commercial silica mining operations, and state agencies may impose different or additional monitoring or mitigation requirements than federal agencies. The development of new sites and our existing operations also are subject to a variety of local environmental and regulatory requirements, including land use, zoning, building, and transportation requirements.
Some local communities have expressed concern regarding silica sand mining operations. These concerns have generally included exposure to ambient silica sand dust, truck traffic, water usage, and blasting. In response, certain state and local communities have developed or are in the process of developing regulations or zoning restrictions intended to minimize the potential for dust to become airborne, control the flow of truck traffic, significantly curtail the area available for mining activities, require compensation to local residents for potential impacts of mining activities and, in some cases, ban issuance of new permits for mining activities. We are not aware of any proposals for significant increased scrutiny on the part of state or local regulators in the jurisdictions in which we operate or community concerns with respect to our operations that would reasonably be expected to have a material adverse effect on our business, financial condition, or results of operations going forward.
Planned expansion of our mining and production capacity in new communities could be more significantly impacted by increased regulatory activity. Difficulty or delays in obtaining or inability to obtain new mining permits or increased costs of compliance with future state and local regulatory requirements could have a material negative impact on our ability to grow our business. In an effort to minimize these risks, we continue to be engaged with local communities in order to grow and maintain strong relationships with residents and regulators.
Capital Expenditures
We had $4.8 million of capital expenditures related to compliance with environmental regulations applicable to our oil and gas proppants operations during fiscal 2016, and we anticipate spending approximately $1.0 million during fiscal 2017.
As of March 31, 2016, we had approximately 2,000 employees, of which approximately 700 were employed under collective bargaining agreements and various supplemental agreements with local unions.
Where You Can Find More Information
We make our annual reports on Form 10-K, quarterly reports on Form 10-Q, the proxy statement, current reports on Form 8-K, and all amendments to these reports available free of charge through the investor relations page of our website, located at www.eaglematerials.com as soon as reasonably practicable after they are filed with or furnished to the SEC. This reference to our website is merely intended to suggest where additional information may be obtained by investors, and the materials and other information presented on our website are not incorporated in and should not otherwise be considered part of this Report. Alternatively, you may contact our investor relations department directly at (214) 432-2000 or by writing to Eagle Materials Inc., Investor Relations, 3811 Turtle Creek Blvd., Suite 1100, Dallas, Texas 75219.
19
The foregoing discussion of our business and operations should be read together with the risk factors set forth below. They describe various risks and uncertainties to which we are or may become subject, many of which are outside of our control. These risks and uncertainties, together with other factors described elsewhere in this Report, have affected, or may in the future affect, our business, operations, financial condition and results of operations in a material and adverse manner.
We are affected by the level of demand in the construction industry.
Demand for our construction products and building materials is directly related to the level of activity in the construction industry, which includes residential, commercial and infrastructure construction. While the most recent downturn in residential and commercial construction, which began in calendar 2007, materially impacted our business, certain economic fundamentals began improving in calendar 2012, and have continued to improve through calendar 2015; however, the rate and sustainability of such improvement remains uncertain. Infrastructure spending continues to be adversely impacted by a number of factors, including the budget constraints currently being experienced by federal, state and local governments. Any decrease in the amount of government funds available for such projects or any decrease in construction activity in general (including any weakness in residential construction or commercial construction) could have a material adverse effect on our business, financial condition and results of operations.
Our business is seasonal in nature, and this causes our quarterly results to vary significantly.
A majority of our business is seasonal with peak revenues and profits occurring primarily in the months of April through November when the weather in our markets is more suitable for construction activity. Quarterly results have varied significantly in the past and are likely to vary significantly in the future. Such variations could have a negative impact on the price of our common stock.
We are subject to the risk of unfavorable weather conditions, particularly during peak construction periods, as well as other unexpected operational difficulties.
Unfavorable weather conditions, such as snow, cold weather, hurricanes, tropical storms and heavy or sustained rainfall, can reduce construction activity and adversely affect demand for construction products. Such weather conditions can also increase our costs, reduce our production or impede our ability to transport our products in an efficient and cost-effective manner. Similarly, operational difficulties, such as business interruption due to required maintenance, capital improvement projects or loss of power, can increase our costs and reduce our production. In particular, the occurrence of unfavorable weather conditions and other unexpected operational difficulties during peak construction periods could adversely affect operating income and cash flow and could have a disproportionate impact on our results of operations for the full year.
We and our customers participate in cyclical industries and regional markets, which are subject to industry downturns.
A majority of our revenues are from customers who are in industries and businesses that are cyclical in nature and subject to changes in general economic conditions. For example, many of our customers operate in the construction industry, which is affected by a variety of factors, such as general economic conditions, changes in interest rates, demographic and population shifts, levels of infrastructure spending and other factors beyond our control. In addition, since our operations are in a variety of geographic markets, our businesses are subject to differing economic conditions in each such geographic market. Economic downturns in the industries to which we sell our products or localized downturns in the regions where we have operations generally have an adverse effect on demand for our products and adversely affect the collectability of our receivables. In general, any downturns in these industries or regions could have a material adverse effect on our business, financial condition and results of operations.
20
Our products are commodities, which are subject to significant changes in supply and demand and price fluctuations.
The products sold by us are commodities and competition among manufacturers is based largely on price. Prices are often subject to material changes in response to relatively minor fluctuations in supply and demand, general economic conditions and other market conditions beyond our control. Increases in the production capacity of industry participants for products such as gypsum wallboard or cement or increases in cement imports tend to create an oversupply of such products leading to an imbalance between supply and demand, which can have a negative impact on product prices. Currently, there continues to be significant excess capacity in the gypsum wallboard industry in the United States. There can be no assurance that prices for products sold by us will not decline in the future or that such declines will not have a material adverse effect on our business, financial condition and results of operations.
Our Oil and Gas Proppants business and financial performance depends on the level of activity in the oil and natural gas industries.
Our operations that produce frac sand are materially dependent on the levels of activity in natural gas and oil exploration, development and production. More specifically, the demand for the frac sand we produce is closely related to the number of natural gas and oil wells completed in geological formations where sand-based proppants are used in fracture treatments. These activity levels are affected by both short- and long-term trends in natural gas and oil prices. In recent years, natural gas and oil prices and, therefore, the level of exploration, development and production activity, have experienced significant fluctuations. Worldwide economic, political and military events, including war, terrorist activity, events in the Middle East and initiatives by the Organization of the Petroleum Exporting Countries (“OPEC”), have contributed, and are likely to continue to contribute, to price volatility. Additionally, warmer than normal winters in North America and other weather patterns may adversely impact the short-term demand for natural gas and, therefore, demand for our products. Reduction in demand for natural gas to generate electricity could also adversely impact the demand for frac sand. A prolonged reduction in natural gas and oil prices would generally depress the level of natural gas and oil exploration, development, production and well completion activity and result in a corresponding decline in the demand for the frac sand we produce. In addition, any future decreases in the rate at which oil and natural gas reserves are discovered or developed, whether due to increased governmental regulation, limitations on exploration and drilling activity or other factors, could have material adverse effect on our oil and gas proppants business, even in a stronger natural gas and oil price environment.
Any material nonpayment or nonperformance by any of our key customers could have a material adverse effect on our business and results of operations.
Any material nonpayment or nonperformance by any of our key customers could have a material adverse effect on our revenue and cash flows, in particular with respect to our Oil and Gas Proppants business. Our contracts with our customers provide for different potential remedies to us in the event a customer fails to purchase the minimum contracted amount of product in a given period. If we were to pursue legal remedies in the event a customer failed to purchase the minimum contracted amount of product under a fixed-volume contract or failed to satisfy the take-or-pay commitment under a take-or-pay contract, we may receive significantly less in a judgment or settlement of any claimed breach than we would have received had the customer fully performed under the contract. In the event of any customer’s breach, we may also choose to renegotiate any disputed contract on less favorable terms (including with respect to price and volumes) to us to preserve the relationship with that customer. Accordingly, any material nonpayment or performance by our customers could have a material adverse effect on our revenue and cash flows.
Volatility and disruption of financial markets could affect access to credit.
Difficult economic conditions can cause a contraction in the availability, and increase the cost, of credit in the marketplace. A number of our customers or suppliers have been and may continue to be adversely affected by unsettled conditions in capital and credit markets, which in some cases have made it more difficult or costly for them to finance their business operations. These unsettled conditions have the potential to reduce the sources of liquidity for the Company and our customers.
21
Our and our customers’ operations are subject to extensive governmental regulation, including environmental laws, which can be costly and burdensome.
Our operations and those of our customers are subject to and affected by federal, state and local laws and regulations with respect to such matters as land usage, street and highway usage, noise level and health and safety and environmental matters. In many instances, various certificates, permits or licenses are required in order for us or our customers to conduct business or carry out construction and related operations. Although we believe that we are in compliance in all material respects with applicable regulatory requirements, there can be no assurance that we will not incur material costs or liabilities in connection with regulatory requirements or that demand for our products will not be adversely affected by regulatory issues affecting our customers. In addition, future developments, such as the discovery of new facts or conditions, the enactment or adoption of new or stricter laws or regulations or stricter interpretations of existing laws or regulations, may impose new liabilities on us, require additional investment by us or prevent us from opening, expanding or modifying plants or facilities, any of which could have a material adverse effect on our financial condition or results of operations.
For example, GHGs currently are regulated as pollutants under the CAA and subject to reporting and permitting requirements. Future consequences of GHG permitting requirements and potential emission reduction measures for our operations may be significant because (1) the cement manufacturing process requires the combustion of large amounts of fuel, (2) in our cement manufacturing process, the production of carbon dioxide is a byproduct of the calcination process, whereby carbon dioxide is removed from calcium carbonate to produce calcium oxide, and (3) our gypsum wallboard manufacturing process combusts a significant amount of fossil fuel, especially natural gas. In addition, the EPA has proposed to regulate GHG emissions from existing fossil fuel-fired power plants as a result of the EPA’s promulgation of new source performance standards for the same sources. In the future, the EPA is expected to propose new source performance standards for cement manufacturing, which similarly will trigger a requirement for the EPA to promulgate regulations relating to existing cement manufacturing facilities. The timing of such regulation is uncertain.
On September 9, 2010, the EPA finalized National Emissions Standards for Hazardous Air Pollutants, or NESHAP, for Portland cement plants (“PC NESHAP”). The PC NESHAP will require a significant reduction in emissions of certain hazardous air pollutants from Portland cement kilns. The PC NESHAP sets limits on mercury emissions from existing Portland cement kilns and increases the stringency of emission limits for new kilns. The PC NESHAP also sets emission limits for total hydrocarbons, particulate matter (as a surrogate for metal pollutants) and acid gases from cement kilns of all sizes. The PC NESHAP was scheduled to take full effect in September 2013; however, as a result of a decision by the U.S. Court of Appeals for the District of Columbia Circuit in Portland Cement Ass’n. v. EPA, 655 F.3d 177 (D.C. Cir.) arising from industry challenges to the PC NESHAP, the EPA proposed a settlement agreement with industry petitioners in May 2012. In February 2013, the EPA published the final revised rule to the PC NESHAP which extended the compliance date until September 9, 2015 for existing cement kilns and made certain changes to the rules governing particulate matter monitoring methods and emissions limits, among other revisions. The 2013 revised rule was challenged in the U.S. Court of Appeals for the D.C. Circuit and on April 18, 2014, the court vacated the affirmative defense provision. The court upheld the EPA’s particulate matter emission standards and extended compliance date. On November 19, 2014, the EPA proposed a rule removing the affirmative defense provision and making minor technical corrections to the regulations. The PC NESHAP will materially increase capital costs and costs of production for the Company and the industry as a whole.
On March 21, 2011 the EPA proposed revised Standards of Performance for New Sources and Emissions Guidelines for Existing Sources for Commercial/Industrial Solid Waste Incinerators (the “CISWI Rule”) per Section 129 of the Clean Air Act, which created emission standards for 4 subcategories of industrial facilities, one of which is “Waste Burning Kilns.” The EPA simultaneously stayed the CISWI Rule for further reconsideration. On February 12, 2013, the EPA finalized revisions to the CISWI Rule. For those cement kilns that utilize non-hazardous secondary materials (“NHSM”) as defined in a rule first finalized on March 21, 2011 (and slightly revised on February 12, 2013), the CISWI Rule will require significant reductions in emissions of certain pollutants from applicable cement kilns. The CISWI Rule sets forth emission standards for mercury, carbon monoxide, acid gases, nitrogen oxides, sulfur dioxide, certain metals (lead and cadmium) and more stringent
22
standards than PC NESHAP for particulate matter and dioxin/furans. The CISWI Rule as currently promulgated may materially increase capital costs and costs for production but only for those facilities that will be using applicable solid wastes as fuel. The compliance date for this rule is expected to be March 1, 2018 (either 3 years after State CISWI plan approval, or 5 years from the date of the final CISWI Rule, whichever is sooner). It is anticipated that the CISWI Rule may materially increase capital costs and costs of production for the Company and the industry as a whole.
On April 17, 2015, the EPA published its final rule addressing the storage, reuse and disposal of coal combustion products, which include fly ash and flue gas desulfurization gypsum (“synthetic gypsum”). We use synthetic gypsum in wallboard manufactured at our Georgetown, South Carolina plant. The rule, which applies only to electric utilities and independent power producers, establishes standards for the management of coal combustion residuals (CCRs) under Subtitle D of the Resource Conservation and Recovery Act, or RCRA, which is the Subtitle that regulates non-hazardous wastes. The rule imposes requirements addressing CCR surface impoundments and landfills, including location restrictions, design and operating specifications, groundwater monitoring requirements, corrective action requirements, recordkeeping and reporting obligations, and closure requirements. Beneficial encapsulated uses of CCRs, including synthetic gypsum, are exempt from regulation. The rule became effective on October 14, 2015, with many of the requirements phased in months or years after the effective date. Given the EPA’s decision to continue to allow CCR to be used in synthetic gypsum and to regulate CCR under the non-hazardous waste sections of RCRA, we do not expect the rule to materially affect our business, financial condition and results of operations.
On October 1, 2015, the EPA lowered the primary and secondary ozone standards from the current 8-hour standard of 75 parts per billion (“ppb”) to 70 ppb. The EPA also strengthened the secondary ozone standard to improve protection for trees, plants and ecosystems. Like the primary standard, an area will meet the secondary standard if the fourth-highest maximum daily 8-hour ozone concentration per year, averaged over three years, is equal to or less than 70 ppb. The EPA based the secondary standard on the “W126 metric,” an index designed to show the cumulative impact of ozone on plants and trees seasonally. The EPA has issued an implementation memo describing how it will determine whether the ozone levels in areas across the country, typically on a county level, are above the new standards. Areas above the new standards will be designated as “nonattainment;” areas at or below the new standards will be designated “attainment.” In states with major emitting sources located in or near designated nonattainment areas, States will impose new and costly regulatory requirements. For areas that are determined to be in non-attainment, states will be required to develop plans to bring the areas into attainment by as early as 2020. At this time, it is not possible to whether any area in which we operate will be designated nonattainment. However, if that occurs, we may be required to meet new control requirements requiring significant capital expenditures for compliance.
The cement plants located in Kansas City, Missouri and Tulsa, Oklahoma are subject to certain obligations under a consent decree with the United States requiring the establishment of facility-specific emissions limitations for certain air pollutants. Limitations that significantly restrict emissions levels beyond current operating levels may require additional investments by us or place limitations on operations, any of which could have a material adverse effect on our financial condition or results of operations.
The cement plant in Tulsa, Oklahoma is subject to NESHAP for hazardous waste combustors (the “HWC MACT”), which imposes emission limitations and operating limits on cement kilns that are fueled by hazardous wastes. Compliance with the HWC MACT could impose additional liabilities on us or require additional investment by us, which could have a material adverse effect on our financial condition or results of operations. In addition, new developments, such as new laws or regulations, may impose new liabilities on us, require additional investment by us or prevent us from operating or expanding plants or facilities, any of which could have a material adverse effect on our financial condition or results of operations. For example, while the HWC MACT has not been updated since 2008, 73 Fed. Reg. 64068 (Oct. 28, 2008), future revisions to the HWC MACT regulations would apply to both of the cement kilns used at the cement plant in Tulsa, Oklahoma. Such revision could require new control requirements and significant capital expenditure for compliance. In 2013, the EPA adopted the final CISWI Rule (as discussed above) that likely will apply to the cement kiln used by the cement plant in Sugar Creek, Missouri and the two cement kilns at Nevada Cement Company, and may impose new
23
control requirements requiring significant capital expenditures for compliance. Existing CISWI units will need to comply with the CISWI Rule when it becomes effective, which is expected to occur in early 2018.
We may incur significant costs in connection with pending and future litigation.
We are, or may become, party to various lawsuits, claims, investigations and proceedings, including but not limited to personal injury, environmental, antitrust, tax, asbestos, property entitlements and land use, intellectual property, commercial, contract, product liability, health and safety, and employment matters. The outcome of pending or future lawsuits, claims, investigations or proceedings is often difficult to predict, but could be adverse and material in amount. In addition, the defense of these lawsuits, claims, investigations and proceedings may divert our management’s attention and we may incur significant costs in defending these matters. See Part I Item 3. Legal Proceedings of this report.
Our results of operations are subject to significant changes in the cost and availability of fuel, energy and other raw materials.
Major cost components in each of our businesses are the costs of fuel, energy and raw materials. Significant increases in the costs of fuel, energy or raw materials or substantial decreases in their availability could materially and adversely affect our sales and operating profits. Prices for fuel, energy or raw materials used in connection with our businesses could change significantly in a short period of time for reasons outside our control. Prices for fuel and electrical power, which are significant components of the costs associated with our gypsum wallboard and cement businesses, have fluctuated significantly in recent years and may increase in the future. In the event of large or rapid increases in prices, we may not be able to pass the increases through to our customers in full, which would reduce our operating margin.
We may become subject to significant clean-up, remediation and other liabilities under applicable environmental laws.
Our operations are subject to state, federal and local environmental laws and regulations, which impose liability for cleanup or remediation of environmental pollution and hazardous waste arising from past acts. These laws and regulations also require pollution control and prevention, site restoration and operating permits and/or approvals to conduct certain of our operations or expand or modify our facilities. Certain of our operations may from time-to-time involve the use of substances that are classified as toxic or hazardous substances within the meaning of these laws and regulations. Additionally, any future laws or regulations addressing GHG emissions would likely have a negative impact on our business or results of operations, whether through the imposition of raw material or production limitations, fuel-use or carbon taxes emission limitations or reductions or otherwise. We are unable to estimate accurately the impact on our business or results of operations of any such law or regulation at this time. Risk of environmental liability (including the incurrence of fines, penalties or other sanctions or litigation liability) is inherent in the operation of our businesses. As a result, it is possible that environmental liabilities and compliance with environmental regulations could have a material adverse effect on our operations in the future.
Significant changes in the cost and availability of transportation could adversely affect our business, financial condition and results of operations.
Some of the raw materials used in our manufacturing processes, such as coal or coke, are transported to our facilities by truck or rail. In addition, transportation logistics play an important part in allowing us to supply products to our customers, whether by truck, rail or barge. For example, we deliver gypsum wallboard to many areas of the United States and the transportation costs associated with the delivery of our wallboard products represent a significant portion of the variable cost of our gypsum wallboard segment. Significant increases in the cost of fuel or energy can result in material increases in the cost of transportation, which could materially and adversely affect our operating profits. In addition, reductions in the availability of certain modes of transportation such as rail or trucking could limit our ability to deliver product and therefore materially and adversely affect our operating profits.
24
Our debt agreements contain restrictive covenants and require us to meet certain financial ratios and tests, which limit our flexibility and could give rise to a default if we are unable to remain in compliance.
Our Credit Facility and the Note Purchase Agreements governing our Senior Notes contain, among other things, covenants that limit our ability to finance future operations or capital needs or to engage in other business activities, including but not limited to our ability to:
|
|
· |
Incur additional indebtedness; |
|
|
· |
Sell assets or make other fundamental changes; |
|
|
· |
Engage in mergers and acquisitions; |
|
|
· |
Pay dividends and make other restricted payments; |
|
|
· |
Make investments, loans, advances or guarantees; |
|
|
· |
Encumber our assets or those of our restricted subsidiaries; |
|
|
· |
Enter into transactions with our affiliates. |
In addition, these agreements require us to meet and maintain certain financial ratios and tests, which may require that we take action to reduce our debt or to act in a manner contrary to our business objectives. Events beyond our control, including the changes in general business and economic conditions, may impair our ability to comply with these covenants or meet those financial ratios and tests. A breach of any of these covenants or failure to maintain the required ratios and meet the required tests may result in an event of default under these agreements. This may allow the lenders under these agreements to declare all amounts outstanding to be immediately due and payable, terminate any commitments to extend further credit to us and pursue other remedies available to them under the applicable agreements. If this occurs, our indebtedness may be accelerated and we may not be able to refinance the accelerated indebtedness on favorable terms, or at all, or repay the accelerated indebtedness. In general, the occurrence of any event of default under these agreements could have a material adverse effect on our financial condition or results of operations.
We have incurred substantial indebtedness, which could adversely affect our business, limit our ability to plan for or respond to changes in our business and reduce our profitability.
Our future ability to satisfy our debt obligations is subject, to some extent, to financial, market, competitive, legislative, regulatory and other factors that are beyond our control. Our substantial debt obligations could have negative consequences to our business, and in particular could impede, restrict or delay the implementation of our business strategy or prevent us from entering into transactions that would otherwise benefit our business. For example:
|
|
· |
we may be required to dedicate a substantial portion of our cash flows from operations to payments on our indebtedness, thereby reducing the availability of our cash flow for other purposes, including business development efforts, capital expenditures or strategic acquisitions; |
|
|
· |
we may not be able to generate sufficient cash flow to meet our substantial debt service obligations or to fund our other liquidity needs. If this occurs, we may have to take actions such as selling assets, selling equity or reducing or delaying capital expenditures, strategic acquisitions, investments and joint ventures or restructuring our debt; |
|
|
· |
as a result of the amount of our outstanding indebtedness and the restrictive covenants to which we are subject, if we determine that we require additional financing to fund future working capital, capital investments or other business activities, we may not be able to obtain such financing on commercially reasonable terms, or at all; and |
|
|
· |
our flexibility in planning for, or reacting to, changes in our business and industry may be limited, thereby placing us at a competitive disadvantage compared to our competitors that have less indebtedness. |
As of March 31, 2016, the aggregate principal amount of our debt instruments with exposure to interest rate risk was approximately $382.0 million. As of the same date, each change in interest rates of 100 basis points would result in an approximate $3.8 million change in our annual cash interest expense before any principal payment on our financial instruments with exposure to interest rate risk. As a result, increases in interest rates will
25
increase the cost of servicing our financial instruments with exposure to interest rate risk and could materially reduce our profitability and cash flows.
Our production facilities may experience unexpected equipment failures, catastrophic events and scheduled maintenance.
Interruptions in our production capabilities may cause our productivity and results of operations to decline significantly during the affected period. Our manufacturing processes are dependent upon critical pieces of equipment. Such equipment may, on occasion, be out of service as a result of unanticipated events such as fires, explosions, violent weather conditions or unexpected operational difficulties. We also have periodic scheduled shut-downs to perform maintenance on our facilities. Any significant interruption in production capability may require us to make significant capital expenditures to remedy problems or damage as well as cause us to lose revenue and profits due to lost production time, which could have a material adverse effect on our results of operations and financial condition.
Increases in interest rates and inflation could adversely affect our business and demand for our products, which would have an adverse effect on our results of operations.
Our business is significantly affected by the movement of interest rates. Interest rates have a direct impact on the level of residential, commercial and infrastructure construction activity by impacting the cost of borrowed funds to builders. Higher interest rates could result in decreased demand for our products, which would have a material adverse effect on our business and results of operations. In addition, increases in interest rates could result in higher interest expense related to borrowings under our Credit Facility. Inflation can result in higher interest rates. With inflation, the costs of capital increase, and the purchasing power of our cash resources can decline. Current or future efforts by the government to stimulate the economy may increase the risk of significant inflation, which could have a direct and indirect adverse impact on our business and results of operations.
Any new business opportunities we may elect to pursue will be subject to the risks typically associated with the early stages of business development or product line expansion.
We are continuing to pursue opportunities which are natural extensions of our existing core businesses and which allow us to leverage our core competencies, existing infrastructure and customer relationships. See “Management’s Discussion and Analysis of Financial Conditions and Results of Operations – Executive Summary.” Our likelihood of success in pursuing and realizing these opportunities must be considered in light of the expenses, difficulties and delays frequently encountered in connection with the early phases of business development or product line expansion, including the difficulties involved in obtaining permits; planning and constructing new facilities; transporting and storing products; establishing, maintaining or expanding customer relationships; as well navigating the regulatory environment in which we operate. There can be no assurance that we will be successful in the pursuit and realization of these opportunities.
We may be adversely affected by decreased demand for frac sand or the development of either effective alternative proppants or new processes to replace hydraulic fracturing.
Frac sand is a proppant used in the completion and re-completion of natural gas and oil wells through hydraulic fracturing. Frac sand is the most commonly used proppant and is less expensive than ceramic proppant, which is also used in hydraulic fracturing to stimulate and maintain oil and natural gas production. A significant shift in demand from frac sand to other proppants, such as ceramic proppants, could have a material adverse effect on our oil and gas proppants business. The development and use of other effective alternative proppants or the development of new processes to replace hydraulic fracturing altogether, could also cause a decline in demand for the frac sand we produce and could have a material adverse effect on our oil and gas proppants business.
Our operations are dependent on our rights and ability to mine our properties and on our having renewed or received the required permits and approvals from governmental authorities and other third parties.
We hold numerous governmental, environmental, mining and other permits, water rights and approvals authorizing operations at many of our facilities. A decision by a governmental agency or other third party to deny
26
or delay issuing a new or renewed permit or approval, or to revoke or substantially modify an existing permit or approval, could have a material adverse effect on our ability to continue operations at the affected facility. Expansion of our existing operations is also predicated on securing the necessary environmental or other permits, water rights or approvals, which we may not receive in a timely manner or at all.
Title to, and the area of, mineral properties and water rights may also be disputed. Mineral properties sometimes contain claims or transfer histories that examiners cannot verify. A successful claim that we do not have title to one or more of our properties or lack appropriate water rights could cause us to lose any rights to explore, develop and extract any minerals on that property, without compensation for our prior expenditures relating to such property. Our business may suffer a material adverse effect in the event one or more of our properties are determined to have title deficiencies.
In some instances, we have received access rights or easements from third parties, which allow for a more efficient operation than would exist without the access or easement. A third party could take action to suspend the access or easement, and any such action could be materially adverse to or results of operations or financial conditions.
A cyber-attack or data security breach affecting our information technology systems may negatively affect our businesses, financial condition and operating results.
We use information technology systems to collect, store and transmit the data needed to operate our businesses, including our confidential and proprietary information. Although we have implemented industry-standard security safeguards and policies to prevent unauthorized access or disclosure of such information, we cannot prevent all cyber-attacks or data security breaches. If such an attack or breach occurs, our businesses could be negatively affected, and we could incur additional costs in remediating the attack or breach and suffer reputational harm due to the theft or disclosure of our confidential information.
We may pursue acquisitions, joint ventures and other transactions that are intended to complement or expand our businesses. We may not be able to complete proposed transactions, and even if completed, the transactions may involve a number of risks that may result in a material adverse effect on our business, financial condition, operating results and cash flows.
As business conditions warrant and our financial resources permit, we may pursue opportunities to acquire businesses or technologies and to form joint ventures that we believe could complement, enhance or expand our current businesses or product lines or that might otherwise offer us growth opportunities. We may have difficulty identifying appropriate opportunities, or if we do identify opportunities, we may not be successful in completing transactions for a number of reasons. Any transactions that we are able to identify and complete may involve one or more of a number of risks, including:
|
|
· |
the diversion of management’s attention from our existing businesses to integrate the operations and personnel of the acquired business or joint venture; |
|
|
· |
possible adverse effects on our operating results during the integration process; |
|
|
· |
failure of the acquired business or joint venture to achieve expected operational, profitability and investment return objectives; |
|
|
· |
the incurrence of significant charges, such as impairment of goodwill or intangible assets, asset devaluation or restructuring charges; |
|
|
· |
the assumption of unanticipated liabilities and costs for which indemnification is unavailable or inadequate; |
|
|
· |
unforeseen difficulties encountered in operating in new geographic areas; and |
|
|
· |
the inability to achieve other intended objectives of the transaction. |
27
In addition, we may not be able to successfully or profitably integrate, operate, maintain and manage our newly acquired operations or their employees. We may not be able to maintain uniform standards, controls, procedures and policies, which may lead to operational inefficiencies. In addition, future acquisitions may result in dilutive issuances of equity securities or the incurrence of additional indebtedness.
Our bylaws include a forum selection clause, which could limit our stockholders’ ability to obtain a favorable judicial forum for disputes with us.
Our bylaws provide that, unless we consent in writing to the selection of an alternative forum, the sole and exclusive forum for (i) any internal corporate claims within the meaning of the Delaware General Corporation Law (“DGCL”), (ii) any derivative action or proceeding brought on our behalf, (iii) any action asserting a claim of breach of a fiduciary duty owed by any of our directors, officers, or employees to us or to our stockholders, or (iv) any action asserting a claim arising pursuant to any provision of the DGCL, will be a state or federal court located within the State of Delaware in all cases subject to the court’s having personal jurisdiction over the indispensable parties named as defendants. Any person or entity purchasing or otherwise acquiring any interest in shares of our capital stock is deemed to have notice of and consented to the foregoing provisions. This forum selection provision in our bylaws may limit our stockholders’ ability to obtain a favorable judicial forum for disputes with us. It is also possible that, notwithstanding the forum selection clause included in our bylaws, a court could rule that such a provision is inapplicable or unenforceable.
This report includes various forward-looking statements, which are not facts or guarantees of future performance and which are subject to significant risks and uncertainties.
This report and other materials we have filed or will file with the SEC, as well as information included in oral statements or other written statements made or to be made by us, contain or may contain forward-looking statements within the meaning of Section 27A of the Securities Act of 1933, Section 21E of the Exchange Act of 1934 and the Private Securities Litigation Reform Act of 1995. You can identify these statements by the fact that they do not relate to matters of a strictly factual or historical nature and generally discuss or relate to forecasts, estimates or other expectations regarding future events. Generally, the words “believe,” “expect,” “intend,” “estimate,” “anticipate,” “project,” “may,” “can,” “could,” “might,” “will” and similar expressions identify forward-looking statements, including statements related to expected operating and performing results, planned transactions, plans and objectives of management, future developments or conditions in the industries in which we participate, including future prices for our products, audits and legal proceedings to which we are a party and other trends, developments and uncertainties that may affect our business in the future.
Forward-looking statements are not historical facts or guarantees of future performance but instead represent only our beliefs at the time the statements were made regarding future events, which are subject to significant risks, uncertainties, and other factors, many of which are outside of our control. Any or all of the forward-looking statements made by us may turn out to be materially inaccurate. This can occur as a result of incorrect assumptions, changes in facts and circumstances or the effects of known risks and uncertainties. Many of the risks and uncertainties mentioned in this report or other reports filed by us with the SEC, including those discussed in the risk factor section of this report, will be important in determining whether these forward-looking statements prove to be accurate. Consequently, neither our stockholders nor any other person should place undue reliance on our forward-looking statements and should recognize that actual results may differ materially from those that may be anticipated by us.
All forward-looking statements made in this report are made as of the date hereof, and the risk that actual results will differ materially from expectations expressed in this report will increase with the passage of time. We undertake no obligation, and disclaim any duty, to publicly update or revise any forward-looking statements, whether as a result of new information, future events, changes in our expectations or otherwise.
There are no unresolved Staff comments.
28
We operate cement plants, quarries and related facilities at Buda, Texas; LaSalle, Illinois; Sugar Creek, Missouri; Tulsa, Oklahoma; Fernley, Nevada and Laramie, Wyoming. The Buda plant is owned by a partnership in which we have a 50% interest. Our principal aggregate plants and quarries are located near Austin, Texas; Sugar Creek, Missouri and Marysville, California. Our cement plant in Sugar Creek, Missouri, is leased pursuant to a long-term agreement with the city of Sugar Creek. The lease contains a purchase option that can be exercised by payment of a nominal fee. In addition, we operate gypsum wallboard plants in Albuquerque, New Mexico; Gypsum, Colorado; Duke, Oklahoma; and in Georgetown, South Carolina. We produce recycled paperboard at Lawton, Oklahoma. We operate frac sand mines in New Auburn, Wisconsin and Utica, Illinois, and we have frac sand processing plants in New Auburn, Wisconsin, Utica, Illinois and Corpus Christi, Texas. Other than our leased cement plant located in Sugar Creek, Missouri, none of our facilities is pledged as security for any debts. Our frac sand processing plants in Utica, Illinois and Corpus Christi, Texas are currently idled. We also have a gypsum wallboard plant in Bernalillo, New Mexico that we idled in December 2009. See “Item 1. Business” on pages 1-19 of this Report for additional information relating to the Company’s properties.
EPA Notice of Violation
On October 5, 2010, Region IX of the EPA issued a Notice of Violation and Finding of Violation (“NOV”) alleging violations by our subsidiary, Nevada Cement Company (“NCC”), of the Clean Air Act (“CAA”). The NOV alleges that NCC made certain physical changes to its facility in the 1990s without first obtaining permits required by the Prevention of Significant Deterioration requirements and Title V permit requirements of the CAA. The EPA also alleges that NCC has failed to submit to the EPA since 2002 certain reports required by the National Emissions Standard for Hazardous Air Pollutants General Provisions and the Portland Cement Manufacturing Industry Standards. On March 12, 2014, the EPA Region IX issued a second NOV to NCC. The second NOV is materially similar to the 2010 NOV except that it alleges violations of the new source performance standards (“NSPS”) for Portland cement plants. The NOVs state that the EPA may seek penalties although it does not propose or assess any specific level of penalties or specify what relief the EPA will seek for the alleged violations. NCC believes it has meritorious defenses to the allegations in the NOVs. NCC met with the EPA in December 2010, September 2012 and May 2014 to present its defenses and to discuss a resolution of the alleged violations. The EPA and NCC remain in discussions regarding the alleged violations. If a negotiated settlement cannot be reached, NCC intends to vigorously defend these matters in any enforcement action that may be pursued by the EPA. As a part of a settlement, or should NCC fail in its defense in any enforcement action, NCC could be required to make substantial capital expenditures to modify its facility and incur increased operating costs. NCC could also be required to pay significant civil penalties. Additionally, an enforcement action could take many years to resolve the underlying issues alleged in the NOV. We are currently unable to determine the final outcome of this matter or the impact of an unfavorable determination upon our financial position or results of operations.
Domestic Wallboard Antitrust Litigation
Since late December 2012, several purported class action lawsuits were filed in various United States District Courts, including the Eastern District of Pennsylvania, Western District of North Carolina and the Northern District of Illinois, against the Company’s subsidiary, American Gypsum Company LLC (“American Gypsum”), alleging that American Gypsum conspired with other wallboard manufacturers to fix the price for drywall sold in the United States in violation of federal antitrust laws and, in some cases related provisions of state law. The complaints allege that the defendant wallboard manufacturers conspired to increase prices through the announcement and implementation of coordinated price increases, output restrictions, and other restraints of trade, including the elimination of individual “job quote” pricing. In addition to American Gypsum, the defendants in these lawsuits include CertainTeed Corp., USG Corporation and United States Gypsum (together “USG”), New NGC, Inc., Lafarge North America, Temple Inland Inc. (“TIN”) and PABCO Building Products
29
LLC. On April 8, 2013, the Judicial Panel on Multidistrict Litigation (“JTML”) transferred and consolidated all related cases to the Eastern District of Pennsylvania for coordinated pretrial proceedings.
On June 24, 2013, the direct and indirect purchaser plaintiffs filed consolidated amended class action complaints. The direct purchasers’ complaint added the Company as a defendant. The plaintiffs in the consolidated class action lawsuits bring claims on behalf of purported classes of direct or indirect purchasers of wallboard from January 1, 2012 to the present for unspecified monetary damages (including treble damages) and in some cases injunctive relief. On July 29, 2013, the Company and American Gypsum answered the complaints, denying all allegations that they conspired to increase the price of drywall and asserting affirmative defenses to the plaintiffs’ claims.
In 2014, USG and TIN entered into agreements with counsel representing the direct and indirect purchaser classes pursuant to which they agreed to settle all claims against them. On March 16, 2014, the court entered orders preliminarily approving USG and TIN’s settlements with the direct and indirect purchaser plaintiffs. Initial discovery in this litigation is complete. Following completion of the initial discovery, the Company and remaining co-defendants moved for summary judgement. On February 18, 2016, the court denied the Company’s motion for summary judgement. The Company’s motion for permission to appeal the summary judgement decision to the U.S. Court of Appeals for the Third Circuit is pending. Discovery related to this class certification is ongoing. At this stage we are unable to estimate the amount of any reasonably possible loss or range of reasonably possible losses. American Gypsum denies the allegations in these lawsuits and will vigorously defend itself against these claims.
On March 17, 2015, a group of homebuilders filed a complaint against the defendants, including American Gypsum, based upon the same conduct alleged in the consolidated class action complaints. On March 24, 2015, the JPML transferred this action to the multidistrict litigation already pending in the Eastern District of Pennsylvania. Following the transfer, the homebuilder plaintiffs filed two amended complaints, on December 14, 2015 and March 25, 2016. Discovery in this lawsuit is ongoing.
In June 2015, American Gypsum and an employee received grand jury subpoenas from the United States District Court for the Western District of North Carolina seeking information regarding an investigation of the gypsum drywall industry by the Antitrust Division of the Department of Justice. We believe the investigation, although a separate proceeding, is related to the same subject matter at issue in the litigation described above and we intend to fully cooperate with government officials. Given its preliminary nature, we are currently unable to determine the ultimate outcome of such investigation.
Information concerning mine safety violations or other regulatory matters required by Section 1503(a) of the Dodd-Frank Wall Street Reform and Consumer Protection Act and Item 104 of Regulation S-K is included in Exhibit 95 to this Annual Report on Form 10-K.
30
|
MARKET FOR REGISTRANT’S COMMON EQUITY, RELATED STOCKHOLDER MATTERS AND ISSUER PURCHASES OF EQUITY SECURITIES |
Stock Prices and Dividends
As of May 16, 2016, there were approximately 1,500 holders of record of our Common Stock which trades on the New York Stock Exchange under the symbol EXP.
The following table sets forth the high and low closing prices for our Common Stock as reported on the New York Stock Exchange for the periods indicated, as well as dividends declared during these periods:
|
|
|
Fiscal Year Ended March 31, 2016 |
|
|
Fiscal Year Ended March 31, 2015 |
|
||||||||||||||||||
|
Quarter ended: |
|
High |
|
|
Low |
|
|
Dividends |
|
|
High |
|
|
Low |
|
|
Dividends |
|
||||||
|
June 30 |
|
$ |
87.68 |
|
|
$ |
75.72 |
|
|
$ |
0.10 |
|
|
$ |
96.03 |
|
|
$ |
79.88 |
|
|
$ |
0.10 |
|
|
September 30 |
|
$ |
84.42 |
|
|
$ |
67.42 |
|
|
$ |
0.10 |
|
|
$ |
104.73 |
|
|
$ |
90.10 |
|
|
$ |
0.10 |
|
|
December 31 |
|
$ |
75.74 |
|
|
$ |
58.88 |
|
|
$ |
0.10 |
|
|
$ |
98.90 |
|
|
$ |
70.80 |
|
|
$ |
0.10 |
|
|
March 31 |
|
$ |
70.49 |
|
|
$ |
47.53 |
|
|
$ |
0.10 |
|
|
$ |
84.15 |
|
|
$ |
69.80 |
|
|
$ |
0.10 |
|
The “Dividends” section of Item 7, “Management’s Discussion and Analysis of Financial Condition and Results of Operations” is hereby incorporated by reference into this Part II, Item 5.
SHARE REPURCHASES
On August 10, 2015, the Board of Directors authorized us to repurchase an additional 6,782,700 shares, for a total authorization, as of that date, of 7,500,000 shares. Including the authorization on August 10, 2015, our Board of Directors has approved the repurchase in the open market of a cumulative total of 38,393,305 shares of our Common Stock since we became publicly held in April 1994.
Share repurchases may be made from time-to-time in the open market or in privately negotiated transactions. The timing and amount of any repurchases of shares will be determined by the Company’s management, based on its evaluation of market and economic conditions and other factors. In some cases, repurchases may be made pursuant to plans, programs or directions established from time to time by the Company’s management, including plans to comply with the safe-harbor provided by Rule 10b5-1.
Purchases of the Company’s common stock during the quarter ended March 31, 2016 were as follows:
|
Period |
|
Total Number of Shares Purchased |
|
|
Average Price Paid Per Share |
|
|
Total Number of Shares Publicly Announced Plans or Programs |
|
|
Maximum Number of Shares that May Yet be Purchased Under the Plans or Programs |
|
||||
|
January 1 through January 31, 2016 |
|
|
— |
|
|
$ |
— |
|
|
|
— |
|
|
|
|
|
|
February 1 through February 29, 2016 |
|
|
250,000 |
|
|
|
55.93 |
|
|
|
250,000 |
|
|
|
|
|
|
March 1 through March 31, 2016 |
|
|
555,236 |
|
|
|
64.43 |
|
|
|
520,000 |
|
|
|
|
|
|
Quarter 4 Totals |
|
|
805,236 |
|
|
$ |
61.79 |
|
|
$ |
770,000 |
|
|
|
5,606,000 |
|
Subsequent to March 31, 2016, the Company purchased an additional 230,000 shares at an average price of $69.80. After considering these purchases, the Company has 5,376,000 shares available for purchase.
Included in the March totals are 35,236 shares, at an average cost of $69.75 per share, acquired from employees upon the vesting of restricted shares that were granted under our incentive plan. These shares were withheld by the employees to satisfy the employee’s minimum statutory tax withholding, which is required upon the vesting of restricted shares.
The equity compensation plan information set forth in Part III, Item 12 of this Form 10-K is hereby incorporated by reference into this Part II, Item 5.
31
The following performance graph and related information shall not be deemed “soliciting material” or to be “filed” with the Securities and Exchange Commission, nor shall such information be incorporated by reference into any future filing under the Securities Act of 1933 or the Securities Exchange Act of 1934, each as amended, except to the extent that the Company specifically incorporates it by reference into such filing.
The graph below compares the cumulative 5-year total return to holders of common stock with the cumulative total returns of the Russell 1000 index and the Dow Jones US Building Materials & Fixtures index. The graph assumes that the value of the investment in the Company’s common stock and in each of the indexes (including the reinvestment of dividends) was $100 on March 31, 2011 and tracks it through March 31, 2016.
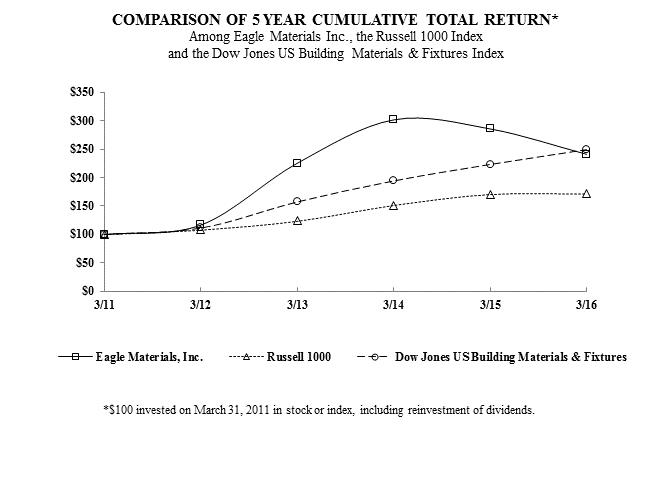
|
|
|
2011 |
|
|
2012 |
|
|
2013 |
|
|
2014 |
|
|
2015 |
|
|
2016 |
|
||||||
|
Eagle Materials, Inc. |
|
|
100.00 |
|
|
|
116.45 |
|
|
|
225.49 |
|
|
|
301.76 |
|
|
|
285.68 |
|
|
|
241.04 |
|
|
Russell 1000 |
|
|
100.00 |
|
|
|
107.86 |
|
|
|
123.42 |
|
|
|
151.09 |
|
|
|
170.33 |
|
|
|
171.18 |
|
|
Dow Jones US Building Materials & Fixtures |
|
|
100.00 |
|
|
|
111.50 |
|
|
|
157.32 |
|
|
|
194.08 |
|
|
|
222.91 |
|
|
|
248.89 |
|
The stock price performance included in this graph is not necessarily indicative of future stock price performance.
32
Summary of Selected Financial Data (1)
(amounts in thousands, except per share data)
|
|
|
|
For the Fiscal Years Ended March 31, |
|
|||||||||||||||||
|
|
|
2016 |
|
|
2015 |
|
|
2014 |
|
|
2013 |
|
|
2012 |
|
||||||
|
Revenues |
|
$ |
1,143,492 |
(4) |
|
$ |
1,066,368 |
(3) |
|
$ |
898,396 |
|
|
$ |
642,562 |
(2) |
|
$ |
495,023 |
|
|
|
Earnings Before Income Taxes |
|
|
219,252 |
(4) |
|
|
252,927 |
(3) |
|
|
181,804 |
|
|
|
84,096 |
(2) |
|
|
21,912 |
|
|
|
Net Earnings |
|
|
152,592 |
(4) |
|
|
186,853 |
(3) |
|
|
124,243 |
|
|
|
57,744 |
(2) |
|
|
18,732 |
|
|
|
Diluted Earnings Per Share |
|
|
3.05 |
(4) |
|
|
3.71 |
(3) |
|
|
2.49 |
|
|
|
1.22 |
(2) |
|
|
0.42 |
|
|
|
Cash Dividends Per Share |
|
|
0.40 |
|
|
|
0.40 |
|
|
|
0.40 |
|
|
|
0.40 |
|
|
|
0.40 |
|
|
|
Total Assets (5) |
|
|
1,883,635 |
|
|
|
1,880,326 |
|
|
|
1,510,968 |
|
|
|
1,476,044 |
|
|
|
984,959 |
|
|
|
Total Debt |
|
|
507,714 |
|
|
|
512,759 |
|
|
|
381,259 |
|
|
|
489,259 |
|
|
|
266,936 |
|
|
|
Stockholders’ Equity |
|
|
1,040,531 |
|
|
|
1,010,593 |
|
|
|
831,499 |
|
|
|
696,170 |
|
|
|
472,511 |
|
|
|
Book Value Per Share At Year End |
|
$ |
21.44 |
|
|
$ |
20.11 |
|
|
$ |
16.61 |
|
|
$ |
14.06 |
|
|
$ |
10.44 |
|
|
|
Average Dilutive Shares Outstanding |
|
|
50,071 |
|
|
|
50,372 |
|
|
|
49,939 |
|
|
|
47,340 |
|
|
|
44,516 |
|
|
|
|
(1) |
The Summary of Selected Financial Data should be read in conjunction with the Consolidated Financial Statements and the Notes to Consolidated Financial Statements for matters that affect the comparability of the information presented above. |
|
|
(2) |
Includes operations related to the assets acquired from Lafarge N.A. from December 1, 2012 through March 31, 2013. |
|
|
(3) |
Includes operations related to the CRS Acquisition from November 14, 2014 through March 31, 2015. |
|
|
(4) |
Includes operations related to Skyway Cement from July 14, 2015 through March 31, 2016. |
|
|
(5) |
We adopted Accounting Standards Update 2015-17, “Balance Sheet Classification of Deferred Taxes on March 31, 2016. Based on the application of this new standard, total assets shown above were reduced by $2,265, $561, $189 and $186 for the fiscal years ended March 31, 2015, 2014, 2013 and 2012, respectively. See Footnote (A) to the Consolidated Financial Statements for more information regarding the adoption of this accounting standard. |
33
executive summary
Eagle Materials Inc. is a diversified producer of basic building products used in residential, industrial, commercial and infrastructure construction. Information presented for the fiscal years ended March 31, 2016, 2015 and 2014, respectively, reflects the Company’s business segments, consisting of Cement, Gypsum Wallboard, Recycled Paperboard, Oil and Gas Proppants and Concrete and Aggregates. These operations are conducted in the U.S. and include the mining of limestone and the manufacture, production, distribution and sale of Portland cement (a basic construction material which is the essential binding ingredient in concrete) and specialty oil well cement; the grinding of slag, the mining of gypsum and the manufacture and sale of gypsum wallboard; the manufacture and sale of recycled paperboard to the gypsum wallboard industry and other paperboard converters; the sale of readymix concrete, the mining and sale of aggregates (crushed stone, sand and gravel) and the mining and sale of sand used in hydraulic fracturing (“frac sand”). The products that we manufacture, distribute and sell are basic materials with broad application as construction products, building materials and basic materials used for oil and natural gas extraction. Our construction products are used in residential, industrial, commercial and infrastructure construction and include cement, concrete and aggregates. Our building materials are sold into similar markets and include gypsum wallboard. Our basic materials used for oil and gas extraction include frac sand and oil well cement. Certain information for each of Concrete and Aggregates is broken out separately in the segment discussions.
On July 10, 2015, we completed the acquisition of a 600,000 ton per year Granulated Ground Blast Furnace Slag (“Slag”) plant in South Chicago (the “Skyway Plant”) from Holcim (US) Inc. (the “Skyway Acquisition”). Among other applications, slag is used in conjunction with Portland cement to make a lower permeability concrete. The Skyway Plant purchases its primary raw material, slag, pursuant to a long term supply agreement with a third party.
The purchase price (the “Skyway Purchase Price”) for the Skyway Acquisition was approximately $29.9 million, net of $2.5 million which will be refunded by the seller. We received $1.5 million of the expected refund in January 2016, and we expect to receive the remaining $1.0 million in January 2017. We funded the payment of the Skyway Purchase Price and expenses incurred in connection with the Skyway Acquisition through operating cash flow. We also assumed certain liabilities, including contractual obligations, related to the Skyway Plant.
On November 14, 2014, we acquired all of the outstanding equity interests of CRS Holdco LLC, CRS Proppants LLC, Great Northern Sand LLC, and related entities (collectively, “CRS Proppants”) (such acquisition, the “CRS Acquisition”). CRS Proppants is a supplier of frac sand to the energy industry, and its business currently consists of a frac sand mine in New Auburn, Wisconsin, and a trans-load network into Texas and southwest Oklahoma. The purchase price (the “CRS Purchase Price”) paid by the Company for the CRS Acquisition was approximately $236.1 million in cash, including approximately $8.9 million for in-process capital expenditures paid through the closing date, and estimated working capital and other estimated closing amounts. The CRS Purchase Price was funded through borrowings under the Company’s Credit Facility. CRS Proppants was in the process of expanding its frac sand mine in New Auburn, Wisconsin at the time of purchase. This expansion was completed during the first quarter of fiscal 2016, at a cost of approximately $8.0 million.
The decline in oil prices throughout fiscal 2016 adversely impacted U.S. oil and gas drilling activity leading to further reductions in demand and pricing for proppants. As a result, we recorded impairments to several intangible assets originally booked in connection with our acquisition of CRS Proppants and revalued downward certain raw sand inventory values associated with the downward revaluation of raw sand inventory that CRS Proppants purchased from a third party pursuant to a purchase contract entered into in connection with the plant expansion. We have fulfilled our obligations under this purchase contract. The impairments and inventory revaluation charges totaled approximately $44.4 million (pre-tax) and were recorded within our Oil and Gas Proppants segment during fiscal 2016. One of the customer contracts contained a liability related to prepaid sand, which was to be credited to the customer based on future sand purchases required by the contract. This customer has not made the required purchases in accordance with the terms of the contract, and therefore has forfeited
34
approximately $10.7 million of the prepaid balances, which partially offsets the write-off of the intangible assets in fiscal 2016.
We operate in cyclical commodity businesses that are affected by changes in market conditions and the overall construction environment. Our operations, depending on each business segment, range from local in nature to national businesses. We have operations in a variety of geographic markets, which subject us to the economic conditions in those geographic markets as well as economic conditions in the national market. General economic downturns or localized downturns in the regions where we have operations may have a material adverse effect on our business, financial condition and results of operations. Our Cement companies focus on the U.S. heartland in Texas, Oklahoma, Missouri, Colorado, Wyoming and Nevada, as well as the Chicago, Illinois metropolitan area. Due to the low value-to-weight ratio of cement, it is usually shipped within a 150 mile radius of the plants by truck and up to 300 miles by rail. Slag is sold primarily in Illinois, Pennsylvania, Iowa, Ohio, Minnesota and Kansas. Concrete and Aggregates are even more regional as our operations serve the areas immediately surrounding Austin, Texas, north of Sacramento, California and the greater Kansas City, Missouri area, while frac sand is currently sold into shale deposit zones across the United States. Cement, concrete and aggregates and frac sand demand may fluctuate more widely because local and regional markets and economies may be more sensitive to changes than the national markets. Our Wallboard and Paperboard operations are more national in scope and shipments are made throughout most of the continental United States, except for the northeast.
We conduct one of our cement operations through a joint venture, Texas Lehigh Cement Company LP, which is located in Buda, Texas (the “Joint Venture”). We own a 50% interest in the Joint Venture and account for our interest under the equity method of accounting. We proportionately consolidate our 50% share of the Joint Venture’s revenues and operating earnings in the presentation of our cement segment, which is the way management organizes the segments within the Company for making operating decisions and assessing performance.
Results of Operations
Fiscal Year 2016 Compared to Fiscal Year 2015
|
|
|
For the Years Ended March 31, |
|
|
|
|
||||||
|
|
|
2016 |
|
|
2015 |
|
|
Change |
|
|||
|
|
|
(in thousands, except per share) |
|
|
|
|
|
|||||
|
Revenues |
|
$ |
1,143,492 |
|
|
$ |
1,066,368 |
|
|
|
7% |
|
|
Cost of Goods Sold |
|
|
(911,875 |
) |
|
|
(812,235 |
) |
|
|
12% |
|
|
Gross Profit |
|
|
231,617 |
|
|
|
254,133 |
|
|
|
(9%) |
|
|
Equity in Earnings of Unconsolidated Joint Venture |
|
|
39,083 |
|
|
|
44,967 |
|
|
|
(13%) |
|
|
Corporate General and Administrative |
|
|
(37,193 |
) |
|
|
(30,751 |
) |
|
|
21% |
|
|
Other Income |
|
|
2,328 |
|
|
|
3,201 |
|
|
|
(27%) |
|
|
Acquisition and Litigation Expense |
|
|
— |
|
|
|
(6,880 |
) |
|
|
(100%) |
|
|
Interest Expense, net |
|
|
(16,583 |
) |
|
|
(11,743 |
) |
|
|
41% |
|
|
Earnings Before Income Taxes |
|
|
219,252 |
|
|
|
252,927 |
|
|
|
(13%) |
|
|
Income Tax Expense |
|
|
(66,660 |
) |
|
|
(66,074 |
) |
|
|
1% |
|
|
Net Earnings |
|
$ |
152,592 |
|
|
$ |
186,853 |
|
|
|
(18%) |
|
|
Diluted Earnings per Share |
|
$ |
3.05 |
|
|
$ |
3.71 |
|
|
|
(18%) |
|
Revenues. Revenues increased $77.0 million to $1,143.4 million in fiscal 2016, compared to $1,066.4 million in fiscal 2015. Revenues from the CRS and Skyway Acquisitions positively impacted revenues by approximately $18.7 million and $21.3 million, respectively. Revenues increased in all of our segments except our legacy oil and gas proppants segment. The increase in revenues was due primarily to increased average net sales prices in our cement and concrete and aggregates segments and increased sales volumes in our gypsum wallboard, recycled paperboard and concrete segments, partially offset by decreased sales volumes in aggregates segment. The reduction in revenues from our legacy oil and gas proppants business was due primarily to reduced sales volumes. Excluding revenues from the CRS and Skyway Acquisitions, increased average net sales prices
35
and sales volumes positively impacted revenue from our historical businesses for fiscal 2016, compared to fiscal 2015, by approximately $13.1 million and $23.9 million, respectively.
Cost of Goods Sold. Cost of goods sold increased $99.7 million to $911.9 million in fiscal 2016, compared to $812.2 million in fiscal 2015. Excluding cost of goods sold of $81.3 million from our CRS and Skyway Acquisitions, cost of goods sold increased approximately $18.4 million during fiscal 2016, compared to fiscal 2015. The increase in cost of goods sold during fiscal 2016, compared to fiscal 2015, was due to increased sales volumes and increased operating costs, which increased cost of goods sold by approximately $10.4 million and $8.0 million, respectively. The increase in cost of goods sold related to sales volumes in fiscal 2016, compared to fiscal 2015, was due primarily to increases in our cement, wallboard, paperboard and concrete and aggregates segments of approximately $11.9 million, $24.3 million, $2.0 million and $11.5 million, respectively, partially offset by reduced sales volumes of approximately $39.3 million in our oil and gas proppants segment. Operating costs in fiscal 2016, compared to fiscal 2015, increased approximately $1.3 million, $5.5 million and $15.6 million for our paperboard, concrete and aggregates and oil and gas proppants segments, partially offset by decreased operating costs of approximately $0.6 million and $13.8 million for our cement and wallboard segments. Cost of goods sold includes an impairment charge of approximately $35.0 million of intangible assets (customer contracts) generated from the CRS Acquisition and a write-down of approximately $11.5 million in raw sand inventory values associated primarily with downward revaluation of raw sand inventory that CRS Proppants purchased from a third party pursuant to a purchase contract entered into in connection with the plant expansion. We have fulfilled our obligations under this purchase contract. These write-downs were partially offset by a customers’ forfeiture of approximately $10.7 million of prepaid sand during fiscal 2016. We have a $2.0 million liability related to the remaining customer prepayment of sand. If the customer does not place orders for approximately 112,000 tons of sand by June 30, 2016, the remaining $2.0 million will be forfeited.
Gross Profit. Gross profit was $231.6 million in fiscal 2016 and $254.1 million in fiscal 2015. The 9% decrease in gross profit was primarily due to decreased operating earnings in our oil and gas proppants segment, which was primarily due to reduced sales volumes and the increased operating costs. The increase in operating costs in our oil and gas proppants segment is primarily due to lower sales volumes and the write-off of certain customer contract intangible assets in fiscal 2016. This is discussed in more detail in the Oil and Gas Proppants section on page 39.
Equity in Earnings of Unconsolidated Joint Venture. Equity in earnings of our unconsolidated joint venture decreased $5.9 million, or 13%, for fiscal 2016, compared to fiscal 2015. The decrease is primarily due to a decrease in sales volumes, partially offset by an increase in average net sales prices. The impact of the decrease in sales volume on equity in earnings of our unconsolidated joint venture during fiscal 2016 was approximately $21.6 million, partially offset by increased average net sales prices and decreased cost of goods sold of approximately $2.8 million and $12.9 million, respectively. The decrease in sales volumes was primarily due to the decrease in demand for oil well cement during the year, due to the decline in drilling activity during fiscal 2016. The decrease in oil well cement was partially offset by the increase in demand for construction grade cement. The decrease in cost of goods sold was primarily due to reduced sales volumes, which reduced cost of goods sold by approximately $13.9 million, partially offset by increased operating costs, which increased cost of sales by approximately $1.0 million. The increase in operating costs in fiscal 2016, compared to fiscal 2015, was due primarily to an approximately $1.8 million increase in maintenance, partially offset by a decrease in energy costs of $0.9 million.
Corporate General and Administrative. Corporate general and administrative expenses increased 21% to $37.2 million in fiscal 2016, compared to $30.8 million in fiscal 2015. The approximately $6.4 million increase in corporate general and administrative expenses for fiscal 2016, compared to fiscal 2015, is due primarily to increased incentive compensation and legal expenses. Incentive compensation and legal expenses increased approximately $5.0 million and $0.5 million, respectively, during fiscal 2016, compared to fiscal 2015. The increase in incentive compensation was primarily due to increased operating earnings in each of our segments except oil and gas proppants.
36
Acquisition and Litigation Expense. Acquisition and litigation expense consists of litigation expenses related to our lawsuit against the IRS, the CRS and Skyway Acquisitions, and due diligence efforts at growing our construction products business. Legal fees related to our lawsuit against the IRS were approximately $4.3 million, while our expenses related to the CRS and Skyway Acquisitions were approximately $2.6 million in fiscal 2015. The remaining expense was related to our due diligence efforts during fiscal 2015. As discussed in Footnote (H) of the Notes to Consolidated Financial Statements, the U.S. Department of Justice approved the proposed settlement of our lawsuit against the IRS in January 2015, and the case was dismissed.
Other Income (Expense). Other income was $2.3 million in fiscal 2016, compared to other income of $3.2 million in fiscal 2015, and consists of a variety of items that are non-segment operating in nature, including non-inventoried aggregates income, gypsum wallboard distribution center income, asset sales and other miscellaneous income and cost items.
Interest Expense, Net. Interest expense, net, increased approximately $4.9 million during fiscal 2016 to $16.6 million, compared to $11.7 million in fiscal 2015. The 41% increase in interest expense, net, during fiscal 2016, compared to fiscal 2015, is due primarily to the $4.4 million refund of interest received from the IRS upon settlement of our lawsuit in fiscal 2015. See the discussion below in “Income Taxes” for more information about the settlement. The remaining increase in interest expense in fiscal 2016, compared to 2015, was the result of greater average borrowings under our Credit Facility, due to our repurchase and retirement of common shares during fiscal 2016.
Earnings Before Income Taxes. Earnings before income taxes decreased to $219.3 million during fiscal 2016, compared to $252.9 million in fiscal 2015, primarily due to decreased gross profit, equity in earnings of our unconsolidated joint venture and increased corporate general and administrative and interest expenses.
Income Taxes. The effective tax rate for fiscal 2016 was approximately 30% compared to approximately 26% in fiscal 2015. The increase in the effective tax rate during fiscal 2016 is primarily due to the settlement of our lawsuit with the IRS in fiscal 2015. Under the terms of the settlement, we dismissed our lawsuit seeking to recover taxes, interest and penalties paid, in exchange for the IRS conceding 40% of the penalties, plus related interest, to date. In accordance with the settlement, we recorded an income tax benefit of approximately $16.6 million during the fourth quarter of fiscal 2015. Excluding the impact of the IRS settlement, our effective tax rate would have been 33% in fiscal 2015, which is greater than the 30% effective tax rate in fiscal 2016. The decrease in the fiscal 2016 tax rate is due primarily to an increase in our percentage depletion deduction. See Footnote (H) of the Notes to Consolidated Financial Statements for more information.
Net Earnings and Diluted Earnings per Share. Net earnings in fiscal 2016 of $152.6 million decreased 18% from fiscal 2015 net earnings of $186.9 million. Diluted earnings per share in fiscal 2016 were $3.05, compared to $3.71 for fiscal 2015.
37
The following table highlights certain operating information related to our business segments:
|
|
|
For the Years Ended March 31, |
|
|
|
|
||||||
|
|
|
2016 |
|
|
2015 |
|
|
Percentage |
|
|||
|
|
|
(in thousands, except net sales prices) |
|
|
Change |
|
||||||
|
Revenues (1) |
|
|
|
|
|
|
|
|
|
|
|
|
|
Cement (2) |
|
$ |
528,499 |
|
|
$ |
488,644 |
|
|
|
8% |
|
|
Gypsum Wallboard |
|
|
461,457 |
|
|
|
437,514 |
|
|
|
5% |
|
|
Recycled Paperboard |
|
|
149,192 |
|
|
|
142,690 |
|
|
|
5% |
|
|
Oil and Gas Proppants |
|
|
57,591 |
|
|
|
81,381 |
|
|
|
(29%) |
|
|
Concrete and Aggregates |
|
|
128,073 |
|
|
|
107,892 |
|
|
|
19% |
|
|
Gross Revenues |
|
|
1,324,812 |
|
|
|
1,258,121 |
|
|
|
5% |
|
|
Less: Inter-Segment Revenues |
|
|
(73,862 |
) |
|
|
(65,533 |
) |
|
|
13% |
|
|
Less: Joint Venture Revenues |
|
|
(107,458 |
) |
|
|
(126,220 |
) |
|
|
(15%) |
|
|
Net Revenues |
|
$ |
1,143,492 |
|
|
$ |
1,066,368 |
|
|
|
7% |
|
|
Sales Volume |
|
|
|
|
|
|
|
|
|
|
|
|
|
Cement (M Tons) (2) |
|
|
4,778 |
|
|
|
4,799 |
|
|
|
— |
|
|
Gypsum Wallboard (MMSF) |
|
|
2,394 |
|
|
|
2,210 |
|
|
|
8% |
|
|
Recycled Paperboard (M Tons) |
|
|
288 |
|
|
|
276 |
|
|
|
4% |
|
|
Concrete (M Yards) |
|
|
1,101 |
|
|
|
958 |
|
|
|
15% |
|
|
Aggregates (M Tons) |
|
|
3,009 |
|
|
|
3,026 |
|
|
|
(1%) |
|
|
Average Net Sales Prices (3) |
|
|
|
|
|
|
|
|
|
|
|
|
|
Cement (2) |
|
$ |
98.07 |
|
|
$ |
92.91 |
|
|
|
6% |
|
|
Gypsum Wallboard |
|
|
157.91 |
|
|
|
162.06 |
|
|
|
(3%) |
|
|
Recycled Paperboard |
|
|
505.35 |
|
|
|
507.47 |
|
|
|
— |
|
|
Concrete |
|
|
92.70 |
|
|
|
87.93 |
|
|
|
5% |
|
|
Aggregates |
|
|
8.28 |
|
|
|
7.50 |
|
|
|
10% |
|
|
Operating Earnings |
|
|
|
|
|
|
|
|
|
|
|
|
|
Cement (2) |
|
$ |
137,854 |
|
|
$ |
117,527 |
|
|
|
17% |
|
|
Gypsum Wallboard |
|
|
159,352 |
|
|
|
145,871 |
|
|
|
9% |
|
|
Recycled Paperboard |
|
|
32,153 |
|
|
|
31,512 |
|
|
|
2% |
|
|
Oil and Gas Proppants |
|
|
(68,466 |
) |
|
|
(2,546 |
) |
|
|
(2589%) |
|
|
Concrete and Aggregates |
|
|
9,807 |
|
|
|
6,736 |
|
|
|
46% |
|
|
Other Operating Income, net |
|
|
2,328 |
|
|
|
3,201 |
|
|
|
(27%) |
|
|
Net Operating Earnings |
|
$ |
273,028 |
|
|
$ |
302,301 |
|
|
|
(10%) |
|
|
|
(1) |
Gross revenue, before freight and delivery costs. |
|
|
(2) |
Includes proportionate share of our Joint Venture. |
|
|
(3) |
Net of freight and delivery costs. |
Cement Operations. Cement revenues were $528.5 million for fiscal 2016, which is an 8% increase over revenues of $488.6 million for fiscal 2015. Approximately $21.3 million of the increase in revenues for fiscal 2016, compared to fiscal 2015, was related to the Skyway Acquisition. The remaining increase in revenue during fiscal 2016 compared to fiscal 2015 is primarily due to a 6% increase in average net sales prices, partially offset by a slight decrease in sales volumes. The increase in average net sales prices during fiscal 2016, compared to fiscal 2015, positively impacted cement revenues by approximately $20.7 million, while the decrease in sales volumes negatively impacted cement revenues by approximately $2.1 million. The decrease in sales volumes during fiscal 2016, compared to fiscal 2015, was primarily related to above average rainfall during April and May 2015 in our Texas, Oklahoma and Colorado markets, as well as wet weather in our Texas and Oklahoma markets during October and November. In Texas, demand for construction grade cement continues to offset much of the impact from lower oil well cement demand.
Cement operating earnings increased 17% to $137.9 million from $117.5 million for fiscal 2016 and 2015, respectively. Approximately $4.5 million of the increase in operating earnings fiscal 2016, compared to fiscal 2015, was related to the Skyway Acquisition. The remaining increase in operating earnings was due primarily to increased average net sales prices, which positively impacted operating earnings by approximately $20.7 million, partially offset by decreased sales volumes and increased operating costs of approximately $4.4 million and $0.4
38
million. The increase in operating costs in fiscal 2016, compared to fiscal 2015, is primarily related to increased maintenance, which adversely impacted operating earnings by approximately $8.4 million, partially offset by decreased energy costs of approximately $4.4 million. Additionally, the percentage of purchased cement sold during fiscal 2016, declined approximately 3% compared to the percentage of purchased cement sold for fiscal 2015, which positively impacted our operating costs by approximately $3.4 million. The increase in maintenance costs was due primarily to a shift in the timing of some of our annual maintenance outages, which adversely impacted operating earnings by approximately $3.0 million during the first quarter of fiscal 2016, compared to the first quarter of fiscal 2015 and increased maintenance activity at certain plants in fiscal 2016. The operating margin increased to 26% in fiscal 2016, compared to 24% in fiscal 2015, primarily due to increased sales prices and a reduction in the percentage of sales of lower margin purchased cement.
Gypsum Wallboard Operations. Sales revenues increased 5% to $461.5 million for fiscal 2016, from $437.5 million for fiscal 2015, primarily due to an 8% increase in sales volumes, partially offset by a 3% decrease in average net sales prices. The increase in sales volumes positively impacted revenues by approximately $36.5 million, partially offset by a $12.5 million decrease in sales revenues due to lower average net sales prices. The increased sales volumes are primarily due to increased construction activity in fiscal 2016, compared to fiscal 2015. Our market share was essentially unchanged during fiscal 2016, compared to fiscal 2015.
Operating earnings increased to $159.4 million for fiscal 2016, from $145.9 million for fiscal 2015, primarily due to the increase in sales volumes and the reduction in operating costs, which positively impacted operating earnings by approximately $12.2 million and $13.8 million, partially offset by decreased average net sales prices of approximately $12.5 million. The decrease in operating costs was primarily related to natural gas, raw materials and customer freight, which decreased approximately $5.6 million, $4.6 million and $2.5 million, respectively. During fiscal 2016, our gross margin improved to 35% from 33% in fiscal 2015, primarily due to the reduction in operating expenses, partially offset by decreased average net sales prices. Fixed costs are not a significant part of the overall cost of wallboard; therefore, changes in volume have a relatively minor impact on our operating cost per unit.
Recycled Paperboard Operations. Revenues increased 5% to $149.2 million for fiscal 2016, from $142.7 million for fiscal 2015. The increase in net revenue during fiscal 2016, compared to fiscal 2015, is primarily due to increased sales volumes, which contributed approximately $6.7 million to revenues; partially offset by a decrease in average net sales prices that adversely impacted revenue by approximately $0.2 million. The decrease in average net sales price is due to the pricing provisions in our long-term sales agreement.
Operating earnings increased to $32.2 million for fiscal 2016, compared to $31.5 million for fiscal 2015, while gross margin remained consistent at 22% for both fiscal 2016 and fiscal 2015. The increase in operating earnings is primarily due to increased sales volumes, which increased operating earnings by approximately $2.0 million, partially offset by increased operating costs of approximately $1.3 million. The increase in operating costs was due primarily to recycled fiber costs, customer freight and chemicals, which adversely impacted operating earnings by approximately $1.3 million, $1.1 million and $0.5 million, respectively, partially offset by decreased natural gas and electricity costs of approximately $1.8 million and $0.5 million, respectively.
Oil and Gas Proppants. Revenues from our oil and gas proppants segment decreased approximately $23.8 million to $57.6 million for fiscal 2016, compared to $81.4 million for fiscal 2015. Excluding revenues from the CRS Acquisition of approximately $46.7 million and $28.0 million for fiscal 2016 and 2015, respectively, revenues decreased $42.5 million in fiscal 2016, compared to fiscal 2015. The decrease in revenues in fiscal 2016, compared to 2015, was due to a decline in sales volumes and average net sales prices at our legacy facility in Corpus Christi which adversely impacted revenues by approximately $41.3 million and $1.2 million, respectively.
The operating loss for fiscal 2016 was approximately $68.5 million, which grew from an operating loss of approximately $2.5 million during fiscal 2015. The increased operating loss was primarily due to increased operating costs and reduced average net sales prices that increased the operating loss by $50.0 million and $15.9 million, respectively. The operating loss for fiscal 2016 includes an impairment charge of approximately $35.0 million of intangible assets (customer contracts) generated from the CRS Acquisition, $2.0 million of bad debt
39
reserves and a write-down of $11.5 million in raw sand inventory values associated primarily with downward revaluation of raw sand inventory that CRS Proppants purchased from a third party pursuant to a purchase contract entered into in connection with the plant expansion, that has since expired. This loss was partially offset by a customer forfeiture of approximately $10.7 million of prepaid sand during fiscal 2016.
Concrete and Aggregates Operations. Concrete and aggregates revenues increased 19% to $128.1 million for fiscal 2016, compared to $107.9 million for fiscal 2015. The primary reason for the increase in revenue for fiscal 2016, compared to fiscal 2015, was the 5% and 10% increase in average net sales prices for concrete and aggregates, respectively, which positively impacted revenues by approximately $7.7 million. In addition to the increase in average net sales prices, sales volume increased 15% for concrete during fiscal 2016, compared to fiscal 2015, which positively impacted revenues by $12.6 million. This increase was partially offset by a 1% decrease in sales volumes for our aggregates business, which adversely impacted revenues by approximately $0.1 million. Sales volumes in our concrete business increased in all of our markets during fiscal 2016, but the largest increase was in the greater Kansas City market.
Operating income for fiscal 2016 was approximately $9.8 million, compared to operating income of approximately $6.7 million for fiscal 2015. The operating income was positively impacted by increased average net sales prices and sales volumes, which increased operating income by approximately $7.7 million and $0.9 million, respectively. The increase in operating profit was partially offset by increased operating costs of approximately $5.5 million. The increased operating expenses were primarily related to increased cost of materials and depreciation in our concrete business of approximately $5.1 million and $0.7 million, partially offset by reduced delivery cost of approximately $0.9 million. The increase in depreciation expense is related to the addition of concrete trucks during fiscal 2015.
GENERAL OUTLOOK
The drivers of construction products demand continue to improve incrementally, supporting the notion that a cyclic recovery is underway. The recovery continues to hinge on the pace of growth in the U.S. economy. In December 2015, the Fixing America’s Surface Transportation Act, or “FAST Act” was signed into law. This is the first significant transportation act enacted in ten years. The FAST Act is legislation to improve the nation’s surface transportation infrastructure, including roads, bridges, transit systems and rail transportation network over a five year period. Increased infrastructure spending in the future should positively impact both our cement and concrete and aggregates businesses.
Our cement sales network stretches across the central U.S., both east to west and north to south. While we anticipate construction grade cement consumption to continue to increase during calendar 2016, each region will increase at a different pace. Cement markets are affected by infrastructure spending, industrial construction and residential building activity. We expect volume and pricing improvements to vary in each of our cement markets.
We do not anticipate significant increases in concrete and aggregate sales volumes in northern California. We are experiencing a recovery in both volume and price in our Austin, Texas markets, and expect prices and volumes to continue to improve throughout calendar 2016. Demand in the greater Kansas City area is expected to improve during calendar 2016, compared to calendar 2015.
Wallboard demand is heavily influenced by new residential housing construction as well as repair and remodeling. Most forecasts point to a continued pick-up in demand in both of these areas throughout calendar 2016. Industry shipments of gypsum wallboard were approximately 22.0 billion square feet in calendar 2015, and we anticipate demand continuing to improve in calendar 2016.
We anticipate increased demand for gypsum wallboard to positively impact our recycled paperboard business as sales of higher priced gypsum paper are expected to continue to increase during calendar 2016 both in gross tons and as a percentage of total sales volumes.
40
The decline in oil and gas rig count and well completion activity has adversely impacted oil and gas activity, leading to reduced demand and pricing for proppants. In connection with the reduction in demand and pricing, during fiscal 2016, we impaired several of our customer contracts, resulting in a write-down of $35.0 million, and reduced the value of our sand inventories by approximately $11.5 million. We anticipate these conditions to persist throughout calendar 2016; however, we remain focused on strengthening our low-cost position and continuing to improve our low delivered cost position to targeted shale plays.
We will continue to consider the impact reduced oil prices and rig counts have on the operating performance of our oil and gas proppants business and, if necessary, determine whether these trends indicate additional impairment in the value of the tangible and intangible assets of this business. If market conditions continue to deteriorate, both in terms of oil pricing and reduced rig counts, we will perform impairment tests to determine if any actual impairment has occurred.
Results of Operations
Fiscal Year 2015 Compared to Fiscal Year 2014
|
|
|
For the Years Ended March 31, |
|
|
|
|
||||||
|
|
|
2015 |
|
|
2014 |
|
|
Change |
|
|||
|
|
|
(in thousands, except per share) |
|
|
|
|
|
|||||
|
Revenues |
|
$ |
1,066,368 |
|
|
$ |
898,396 |
|
|
|
19% |
|
|
Cost of Goods Sold |
|
|
(812,235 |
) |
|
|
(712,937 |
) |
|
|
14% |
|
|
Gross Profit |
|
|
254,133 |
|
|
|
185,459 |
|
|
|
37% |
|
|
Equity in Earnings of Unconsolidated Joint Venture |
|
|
44,967 |
|
|
|
37,811 |
|
|
|
19% |
|
|
Corporate General and Administrative |
|
|
(30,751 |
) |
|
|
(24,552 |
) |
|
|
25% |
|
|
Other Income |
|
|
3,201 |
|
|
|
1,368 |
|
|
|
134% |
|
|
Acquisition and Litigation Expense |
|
|
(6,880 |
) |
|
|
— |
|
|
|
— |
|
|
Interest Expense, net |
|
|
(11,743 |
) |
|
|
(18,282 |
) |
|
|
(36%) |
|
|
Earnings Before Income Taxes |
|
|
252,927 |
|
|
|
181,804 |
|
|
|
39% |
|
|
Income Tax Expense |
|
|
(66,074 |
) |
|
|
(57,561 |
) |
|
|
15% |
|
|
Net Earnings |
|
$ |
186,853 |
|
|
$ |
124,243 |
|
|
|
50% |
|
|
Diluted Earnings per Share |
|
$ |
3.71 |
|
|
$ |
2.49 |
|
|
|
49% |
|
Revenues. Revenues increased $168.0 million to $1,066.4 million in fiscal 2015, compared to $898.4 million in fiscal 2014. Revenues from the CRS Acquisition positively impacted revenues by approximately $28.0 million. The remaining increase in revenues from our historical businesses was due primarily to increased average net selling prices for all of our segments and increased sales volumes for all of our segments except aggregates. The impact of the increased net sales prices and sales volumes on revenue from our historical businesses for fiscal 2015, as compared to fiscal 2014, was approximately $62.6 million and $77.4 million, respectively.
Cost of Goods Sold. Cost of goods sold increased $99.3 million to $812.2 million in fiscal 2015, compared to $712.9 million in fiscal 2014. The 14% increase in cost of goods sold for fiscal 2015, compared to fiscal 2014, was primarily due to increased sales volumes and operating costs, which increased cost of goods sold by approximately $93.5 million and $5.8 million, respectively. Approximately $33.0 million of the increase in cost of goods sold that related to volumes is due to the CRS Acquisition. The increase in operating costs in fiscal 2015, compared to fiscal 2014, is primarily related to our cement and gypsum wallboard segments, which increased approximately $6.5 million and $6.7 million, respectively, partially offset by decreased operating costs of approximately $3.6 million in our recycled paperboard segment.
Gross Profit. Gross profit was $254.1 million in fiscal 2015 and $185.5 million in fiscal 2014. The 37% increase in gross profit was primarily due to increased average sales prices, sales volumes and lower operating costs, as noted above.
Equity in Earnings of Unconsolidated Joint Venture. Equity in earnings of our unconsolidated joint venture increased $7.2 million, or 19%, for fiscal 2015, compared to fiscal 2014. The increase is primarily due to
41
increases in the average net sales price and sales volume. The impact of the increases in sales volume and average net sales price on equity in earnings of our unconsolidated joint venture during fiscal 2015 was approximately $10.2 million and $4.6 million, respectively, partially offset by increased cost of sales of approximately $7.6 million. The increase in cost of sales was primarily due to operating costs, which increased cost of goods sold by approximately $4.6 million, and increased sales volume, which increased cost of sales by approximately $3.0 million. The increased operating costs in fiscal 2015, compared to fiscal 2014, were due primarily to a $3.0 million and $0.6 million increase in purchased cement and power, respectively.
Corporate General and Administrative. Corporate general and administrative expenses increased 25% to $30.8 million in fiscal 2015, as compared to $24.6 million in fiscal 2014. The approximately $6.2 million increase in corporate general and administrative expenses for fiscal 2015, compared to fiscal 2014, is due primarily to increased incentive compensation and relocation expenses. Incentive compensation and relocation expenses increased approximately $4.2 million and $0.6 million, respectively, during fiscal 2015, as compared to fiscal 2014. The increase in incentive compensation was primarily due to increased operating earnings.
Acquisition and Litigation Expense. Acquisition and litigation expense consists of litigation expenses related to our lawsuit against the IRS, the CRS and Skyway Acquisitions, and due diligence efforts at growing our construction products business. Legal fees related to our lawsuit against the IRS were approximately $4.3 million, while our expenses related to the CRS and Skyway Acquisitions were approximately $2.6 million in fiscal 2015. The remaining expense was related to our due diligence efforts during fiscal 2015. As discussed in Footnote (H) of the Notes to Consolidated Financial Statements, the U.S. Department of Justice approved the proposed settlement of our lawsuit against the IRS in January 2015, and the case was dismissed.
Other Income (Expense). Other income was $3.2 million in fiscal 2015, compared to other income of $1.4 million in fiscal 2014, and consists of a variety of items that are non-segment operating in nature, including non-inventoried aggregates income, gypsum wallboard distribution center income, asset sales and other miscellaneous income and cost items.
Interest Expense, Net. Interest expense, net, decreased approximately $6.5 million during fiscal 2015 to $11.7 million, as compared to $18.3 million in fiscal 2014. The 36% decrease in interest expense, net, during fiscal 2015, compared to fiscal 2014, is due primarily to the $4.4 million refund of interest received from the IRS upon settlement of our lawsuit. See the discussion below in “Income Taxes” for more information about the settlement. The remaining reduction in interest expense in fiscal 2015, compared to 2014, was the result of lower average borrowings under our Credit Facility, due to the repayment of outstanding amounts during fiscal 2014 and the first half of fiscal 2015, prior to the CRS Acquisition.
Earnings Before Income Taxes. Earnings before income taxes increased to $252.9 million during fiscal 2015, compared to $181.8 million in fiscal 2014, primarily due to increased gross profit and increased equity in earnings of our unconsolidated joint venture, partially offset by increased corporate general and administrative and interest expenses.
Income Taxes. The effective tax rate for fiscal 2015 was approximately 26% compared to approximately 32% in fiscal 2014. The decrease in the effective tax rate during fiscal 2015 is primarily due to the settlement of our lawsuit with the IRS. Under the terms of the settlement, we dismissed our lawsuit seeking to recover taxes, interest and penalties paid, in exchange for the IRS conceding 40% of the penalties, plus related interest, to date. In accordance with the settlement, we recorded an income tax benefit of approximately $16.6 million during the fourth quarter of fiscal 2015. Excluding the impact of the IRS settlement, our effective tax rate would have been 33% in fiscal 2015. See Footnote (H) of the Notes to Consolidated Financial Statements for more information.
Net Earnings and Diluted Earnings per Share. Net earnings in fiscal 2015 of $186.9 million increased 50% from fiscal 2014 net earnings of $124.2 million. Diluted earnings per share in fiscal 2015 were $3.71, compared to $2.49 for fiscal 2014.
42
The following table highlights certain operating information related to our business segments:
|
|
|
For the Years Ended March 31, |
|
|
|
|
||||||
|
|
|
2015 |
|
|
2014 |
|
|
Percentage |
|
|||
|
|
|
(in thousands, except net sales prices) |
|
|
Change |
|
||||||
|
Revenues (1) |
|
|
|
|
|
|
|
|
|
|
|
|
|
Cement (2) |
|
$ |
488,644 |
|
|
$ |
438,224 |
|
|
|
12% |
|
|
Gypsum Wallboard |
|
|
437,514 |
|
|
|
387,016 |
|
|
|
13% |
|
|
Recycled Paperboard |
|
|
142,690 |
|
|
|
130,178 |
|
|
|
10% |
|
|
Oil and Gas Proppants |
|
|
81,381 |
|
|
|
19,557 |
|
|
|
316% |
|
|
Concrete and Aggregates |
|
|
107,892 |
|
|
|
96,908 |
|
|
|
11% |
|
|
Gross Revenues |
|
|
1,258,121 |
|
|
|
1,071,883 |
|
|
|
17% |
|
|
Less: Inter-Segment Revenues |
|
|
(65,533 |
) |
|
|
(62,094 |
) |
|
|
6% |
|
|
Less: Joint Venture Revenues |
|
|
(126,220 |
) |
|
|
(111,393 |
) |
|
|
13% |
|
|
Net Revenues |
|
$ |
1,066,368 |
|
|
$ |
898,396 |
|
|
|
19% |
|
|
Sales Volume |
|
|
|
|
|
|
|
|
|
|
|
|
|
Cement (M Tons) (2) |
|
|
4,799 |
|
|
|
4,593 |
|
|
|
4% |
|
|
Gypsum Wallboard (MMSF) |
|
|
2,210 |
|
|
|
2,112 |
|
|
|
5% |
|
|
Recycled Paperboard (M Tons) |
|
|
276 |
|
|
|
256 |
|
|
|
8% |
|
|
Concrete (M Yards) |
|
|
958 |
|
|
|
899 |
|
|
|
7% |
|
|
Aggregates (M Tons) |
|
|
3,026 |
|
|
|
3,228 |
|
|
|
(6%) |
|
|
Average Net Sales Prices (3) |
|
|
|
|
|
|
|
|
|
|
|
|
|
Cement (2) |
|
$ |
92.91 |
|
|
$ |
87.31 |
|
|
|
6% |
|
|
Gypsum Wallboard |
|
|
162.06 |
|
|
|
148.33 |
|
|
|
9% |
|
|
Recycled Paperboard |
|
|
507.47 |
|
|
|
504.41 |
|
|
|
1% |
|
|
Concrete |
|
|
87.93 |
|
|
|
82.55 |
|
|
|
7% |
|
|
Aggregates |
|
|
7.50 |
|
|
|
6.76 |
|
|
|
11% |
|
|
Operating Earnings |
|
|
|
|
|
|
|
|
|
|
|
|
|
Cement (2) |
|
$ |
117,527 |
|
|
$ |
89,486 |
|
|
|
31% |
|
|
Gypsum Wallboard |
|
|
145,871 |
|
|
|
114,852 |
|
|
|
27% |
|
|
Recycled Paperboard |
|
|
31,512 |
|
|
|
23,610 |
|
|
|
33% |
|
|
Oil and Gas Proppants |
|
|
(2,546 |
) |
|
|
(4,890 |
) |
|
|
48% |
|
|
Concrete and Aggregates |
|
|
6,736 |
|
|
|
212 |
|
|
|
3077% |
|
|
Other Operating Income, net |
|
|
3,201 |
|
|
|
1,368 |
|
|
|
134% |
|
|
Net Operating Earnings |
|
$ |
302,301 |
|
|
$ |
224,638 |
|
|
|
35% |
|
|
(1) |
Gross revenue, before freight and delivery costs. |
|
(2) |
Includes proportionate share of our Joint Venture. |
|
(3) |
Net of freight and delivery costs. |
Cement Operations. Cement revenues were $488.6 million for fiscal 2015, which is a 12% increase over revenues of $438.2 million for fiscal 2014. The increase in revenues during fiscal 2015, compared to fiscal 2014, is primarily due to a 6% increase in the average net sales price, as well as a 4% increase in sales volumes. The increase in the average net sales price and sales volumes positively impacted revenues by approximately $30.6 million and $19.8 million, respectively, in fiscal 2015, compared to fiscal 2014. Average net sales price increased in virtually all of our markets.
The increase in average net sales price during fiscal 2015, compared to fiscal 2014, enabled us to increase our operating margin from 20% in fiscal 2014 to 24% in fiscal 2015. Cement operating earnings increased 31% to $117.5 million in fiscal 2015, from $89.5 million in fiscal 2014. The increase in operating earnings was due primarily to increased average net sales prices and sales volumes, which contributed approximately $30.6 million and $3.9 million to operating earnings, partially offset by increased operating expenses, which adversely impacted operating earnings by approximately $6.5 million. The increase in operating costs related primarily to purchased cement, maintenance and power, which adversely impacted earnings by approximately $4.8 million, $1.7 million and $1.0 million, respectively, partially offset by decreased fuel costs of approximately $3.3 million.
43
Gypsum Wallboard Operations. Sales revenues increased 13% to $437.5 million for fiscal 2015, from $387.0 million for fiscal 2014, primarily due to a 5% increase in the average net sales price and a 9% increase in sales volumes. The increase in the average net sales price and sales volumes positively impacted revenues by approximately $32.5 million and $18.0 million, respectively. The increase in average net sales price was due to the implementation of price increases in January 2015 and 2014. The increased sales volumes are primarily due to increased construction activity in fiscal 2015, compared to fiscal 2014. Our market share was essentially unchanged during fiscal 2015, compared to fiscal 2014.
Operating earnings increased to $145.9 million for fiscal 2015, from $114.9 million for fiscal 2014, primarily due to the increase in average net sales price and sales volumes, which positively impacted operating earnings by approximately $32.5 million and $5.2 million, partially offset by increased operating expenses of approximately $6.7 million. The increase in operating costs was primarily related to natural gas, raw materials, maintenance and paper, which increased approximately $0.7 million, $1.1 million, $0.5 million and $0.4 million, respectively. Additionally, operating costs were adversely impacted by approximately $3.2 million in legal expense. During fiscal 2015 our gross margin improved to 33% from 30% in fiscal 2014, primarily due to the increase in average net sales price, partially offset by increased operating costs. Fixed costs are not a significant part of the overall cost of wallboard; therefore, changes in volume have a relatively minor impact on our operating cost per unit.
Recycled Paperboard Operations. Revenues increased 10% to $142.7 million in fiscal 2015, from $130.2 million in fiscal 2014. The increase in net revenue during fiscal 2015, compared to fiscal 2014, is due to both increased sales volumes and average net sales prices, which contributed approximately $10.1 million and $2.4 million, respectively, to revenues. The increase in average net sales price is due to the pricing provisions in our long-term sales agreement, as well as an increase in the percentage of higher priced gypsum paper sold in fiscal 2015, as compared to fiscal 2014.
Operating earnings increased to $31.5 million for fiscal 2015, compared to $23.6 million for fiscal 2014, while gross margin increased to 22% for fiscal 2015, compared to 18% for fiscal 2014. The increase in operating earnings and gross margin are primarily due to increased average net sales prices and sales volumes, which increased operating earnings by approximately $2.4 million and $1.9 million, respectively. Operating earnings were also positively impacted by decreased operating costs of approximately $3.6 million, namely recycled fiber costs and chemicals, which positively impacted operating earnings by approximately $3.4 million and $0.9 million, respectively, partially offset by increased repair and maintenance costs of approximately $0.6 million. Operating earnings and margin were also positively impacted by a change in the product sales mix as sales of higher margin gypsum liner increased to 90% for fiscal 2015, from 78% for fiscal 2014, which positively impacted operating earnings by approximately $1.4 million.
Oil and Gas Proppants. Revenues for our oil and gas proppants segment increased approximately $61.8 million to $81.4 million during fiscal 2015, compared to $19.6 million during fiscal 2014. Approximately $28.0 million of the increase in fiscal 2015, compared to fiscal 2014, related to the CRS Acquisition and approximately $33.8 of the increase reflects sales volume growth at our Corpus Christi, Texas location. Fiscal 2015 represents the first full year of operations in Corpus Christi, Texas.
The operating loss for fiscal 2015 was approximately $2.5 million, which improved from an operating loss of approximately $4.9 million during fiscal 2014. Approximately $7.4 million of the decrease in operating loss was related to improved earnings at our Corpus Christi location, partially offset by an operating loss of $5.0 million related to the CRS Acquisition. Operating income related to the CRS Acquisition was adversely impacted by approximately $1.5 million related to the “step-up” of inventory acquired on November 14, 2014 and sold prior to March 31, 2015, as well as amortization expense of approximately $5.1 million related to CRS sales contracts in existence at November 14, 2014 and $1.3 million depreciation on the assets valued at the acquisition date. Fiscal 2015 represented the first full year of operations at Corpus Christi, Texas, and we began selling internally produced sand during the fourth quarter of fiscal 2015.
44
Concrete and Aggregates Operations. Concrete and aggregates revenues increased 11% to $107.9 million for fiscal 2015, compared to $96.9 million for fiscal 2014. The primary reason for the increase in revenue for fiscal 2015, compared to fiscal 2014, was the 7% and 11% increase in average net sales prices for concrete and aggregates, respectively, which positively impacted revenues by approximately $7.7 million. In addition to the increase in average net sales prices, sales volume increased 7% for concrete during fiscal 2015, compared to fiscal 2014, which positively impacted revenues by $4.8 million. This increase was partially offset by a 6% decrease in sales volumes for our aggregates business, which adversely impacted revenues by approximately $1.5 million. The increase in sales volumes in our concrete business was due to primarily to increased construction activity in our Austin, Texas market, while the reduction in sales volumes in our aggregates business was primarily related to the greater Kansas City market.
Operating income for fiscal 2015 was approximately $6.7 million, as compared to operating income of approximately $0.2 million for fiscal 2014. The operating income was positively impacted by increased average net sales prices, which increased operating income by approximately $7.7 million. The increase in operating profit was partially offset by decreased sales volumes and increased operating expenses of approximately $0.3 million and $0.7 million, respectively. The increased operating expenses were primarily related to increased cost of materials in our concrete business of approximately $2.5 million, partially offset by fuel and maintenance expenses of approximately $0.6 million and $0.4 million in our aggregates business.
CRITical Accounting Policies
Certain of our critical accounting policies require the use of judgment in their application or require estimates of inherently uncertain matters. Although our accounting policies are in compliance with generally accepted accounting principles, a change in the facts and circumstances of the underlying transactions could significantly change the application of the accounting policies and the resulting financial statement impact. Listed below are those policies that we believe are critical and require the use of complex judgment in their application.
Impairment of Long-Lived Assets. We assess our long-lived assets, including mining and related assets, for impairment whenever events or changes in circumstances indicate that the carrying amount of an asset may not be recoverable. Recoverability of assets is measured by comparing the carrying amount of an asset to future undiscounted net cash flows expected to be generated by the asset. These evaluations for impairment are significantly impacted by estimates of revenues, costs and expenses, and in the case of our mining assets, changes in the costs and availability of extraction of our mineral assets and other factors. If these assets are considered to be impaired, the impairment to be recognized is measured by the amount by which the carrying amount of the assets exceeds the fair value of the assets.
During calendar 2015, the continued decline in prices adversely impacted oil and gas drilling activity, leading to further reductions in demand and pricing for proppants. This reduction in overall proppant demand resulted in a decline in sales volumes and average net sales prices for our oil and gas proppants segment. In response to the decline in demand, we elected to temporarily idle our Utica, Illinois and Corpus Christi, Texas facilities during the fourth quarter of fiscal 2016. Additionally, we idled the Fowlerton, Texas and Kenedy, Texas; trans-load operations. In connection with the closure of these facilities and trans-load locations, we determined that our long lived assets related to the oil and gas proppants segment should be tested for impairment. In connection with this test, we determined that the entire network of plants and trans-load locations should be considered an individual operating unit for the purposes of testing for potential impairment. In performing this test, we compared the weighted average undiscounted cash flows to the carrying value of the asset group, noting that the undiscounted cash flows significantly exceeded the carrying value of the asset group; therefore, no impairment was noted. We will continue to monitor market conditions and our performance in the market. We will also continue to review relevant factors and circumstances related to the overall market condition and our performance and, if necessary, perform an additional test for impairment at such time we believe it is necessary.
This reduction in demand and pricing for proppants also adversely impacted performance under our customer contracts, resulting in the amendment of certain of these contracts. Based on the reduced demand and reduced pricing for proppants, we concluded that long-lived asset impairment indicators were present during the
45
quarters ended September 30, 2015 and March 31, 2016 for our customer contract intangible assets. We performed recovery tests to determine if any of the customer contract intangible assets related to our oil and gas proppants business unit were impaired at September 30, 2015 and March 31, 2016. Based on our analysis of the undiscounted cash flows for each of our customer contract intangibles related to our oil and gas proppants business, we concluded that the carrying value of certain customer contract intangible assets exceeded the undiscounted cash flows for the related assets at both September 30, 2015 and March 31, 2016. For those contracts whose carrying value exceeded the undiscounted cash flows, we calculated an estimated fair value of each contract using the weighted-average probable cash flows related to each contract (level 3 inputs), discounted using a weighted-average cost of capital (“WACC”). The WACC was determined from relevant market comparisons, and adjusted for specific risks. This analysis resulted in an impairment loss of approximately $28.4 million and $6.6 million for the quarters ended September 30, 2015 and March 31, 2016, respectively, which is included in cost of goods sold in the Consolidated Statement of Earnings for fiscal year 2016.
Goodwill. Goodwill is subject to an annual assessment at least annually for impairment by applying a fair-value-based test. We have elected to test for goodwill impairment in the fourth quarter of each fiscal year. The goodwill impairment test is a two-step process, which requires management to make judgments in determining what assumptions to use in the calculation. The first step of the process consists of estimating the fair value of each reporting unit based on a discounted cash flow model using revenues and profit forecasts and comparing those estimated fair values with the carrying value; a second step is performed, if necessary, to compute the amount of the impairment by determining an “implied fair value” of goodwill. Similar to the review for impairment of other long-lived assets, evaluations for impairment are significantly impacted by estimates of future prices for our products, capital needs, economic trends and other factors.
The segment breakdown of goodwill at March 31, 2016 and 2015 is as follows:
|
|
|
For the Years Ended March 31, |
|
|||||
|
|
|
2016 |
|
|
2015 |
|
||
|
|
|
|
(dollars in thousands) |
|
||||
|
Cement |
|
$ |
9,729 |
|
|
$ |
8,359 |
|
|
Gypsum Wallboard |
|
|
116,618 |
|
|
|
116,618 |
|
|
Paperboard |
|
|
7,538 |
|
|
|
7,538 |
|
|
|
|
$ |
133,885 |
|
|
$ |
132,515 |
|
Impairment testing for the cement business is done at the plant level because the relatively low value-to-weight ratio limits the geographic area in which a company can market its products profitably; therefore, the U.S. cement industry is fragmented into regional geographic areas rather than a national selling area. Impairment testing for the gypsum wallboard and paperboard segments is done at the segment level because of the national nature of the businesses and customer base. See Note (A) of the Notes to Consolidated Financial Statements for more information. The results of the first step of the annual impairment tests performed in the fiscal fourth quarter of 2016 and 2015 indicated that the fair values of the reporting units with goodwill substantially exceeded their carrying values. Determining the fair value of our reporting units involves the use of significant estimates and assumptions and considerable management judgment. We base our fair value estimates on assumptions we believe to be reasonable at the time, but such assumptions are subject to inherent uncertainty. The most important assumption underlying our estimates is a cyclical recovery in U.S. construction activity from the current low levels. Actual results may differ materially from those estimates. Changes in key assumptions or management judgment with respect to a reporting unit or its prospects, which may result from a change in market conditions, market trends, interest rates or other factors outside of our control, or significant underperformance relative to historical or projected future operating results, could result in a significantly different estimate of the fair value of our reporting units, which could result in an impairment charge in the future.
Environmental Liabilities. Our operations are subject to state, federal and local environmental laws and regulations, which impose liability for clean up or remediation of environmental pollution and hazardous waste arising from past acts and require pollution control and prevention, site restoration and operating permits and/or approvals to conduct certain of its operations. We record environmental accruals when it is probable that a reasonably estimable liability has been incurred. Environmental remediation accruals are based on internal studies
46
and estimates, including shared financial liability with third parties. Environmental expenditures that extend the life, increase the capacity, improve the safety or efficiency of assets or mitigate or prevent future environmental contamination may be capitalized. Other environmental costs are expensed when incurred.
Estimation of Reserves and Valuation Allowances. We evaluate the collectability of accounts receivable based on a combination of factors. In circumstances when we are aware of a specific customer’s inability to meet its financial obligation to the Company, the balance in the reserve for doubtful accounts is evaluated, and if it is determined to be deficient, a specific amount will be added to the reserve. For all other customers, the reserve for doubtful accounts is determined by the length of time the receivables are past due or the customer’s financial condition.
Income Taxes. In determining net income for financial statement purposes, we must make certain estimates and judgments in the calculation of tax provisions and the resultant tax liabilities, and in the recoverability of deferred tax assets that arise from temporary differences between the tax and financial statement recognition of revenue and expense.
In the ordinary course of business, there may be many transactions and calculations where the ultimate tax outcome is uncertain. The calculation of tax liabilities involves dealing with uncertainties in the application of complex tax laws. We recognize potential liabilities for anticipated tax audit issues in both the U.S. and state tax jurisdictions based on an estimate of the ultimate resolution of whether, and the extent to which, additional taxes will be due. Although we believe the estimates are reasonable, no assurance can be given that the final outcome of these matters will not be different than what is reflected in the historical income tax provisions and accruals.
As part of our process for preparing financial statements, we must assess the likelihood that our deferred tax assets can be recovered. If recovery is not likely, the provision for taxes must be increased by recording a reserve in the form of a valuation allowance for the deferred tax assets that are estimated not to be ultimately recoverable. In this process, certain relevant criteria are evaluated including the existence of deferred tax liabilities that can be used to absorb deferred tax assets, the taxable income in prior years that can be used to absorb net operating losses and credit carrybacks, and taxable income in future years. Our judgment regarding future taxable income may change due to market conditions, changes in U.S. tax laws and other factors. These changes, if any, may require material adjustments to the deferred tax assets and an accompanying reduction or increase in net income in the period when such determinations are made.
Business combinations. The acquisition method of accounting requires that we recognize the assets acquired and liabilities assumed at their acquisition date fair values. Goodwill is measured as the excess of consideration transferred over the acquisition date net fair values of the assets acquired and the liabilities assumed.
The measurement of the fair values of assets acquired and liabilities assumed requires considerable judgment. Although independent appraisals may be used to assist in the determination of the fair values of certain assets and liabilities, the appraised values are usually based on significant estimates provided by management, such as forecasted revenue or profit. In determining the fair value of intangible assets, an income approach is generally used and may incorporate the use of a discounted cash flow method. In applying the discounted cash flow method, the estimated future cash flows and residual values for each intangible asset are discounted to a present value using a discount rate based on an estimated weighted average cost of capital for the building materials industry. These cash flow projections are based on management’s estimates of economic and market conditions including revenue growth rates, operating margins, capital expenditures and working capital requirements.
While we use our best estimates and assumptions as part of the process to value assets acquired and liabilities assumed at the acquisition date, our estimates are inherently uncertain and subject to refinement. During the measurement period, which occurs before finalization of the purchase price allocation, changes in assumptions and estimates that result in adjustments to the fair values of assets acquired and liabilities assumed are recorded on a retroactive basis as of the acquisition date, with the corresponding offset to goodwill. Any adjustments
47
subsequent to the conclusion of the measurement period will be recorded to our consolidated statements of earnings.
LIQUIDITY AND CAPITAL RESOURCES
Cash Flow.
The following table provides a summary of our cash flows:
|
|
|
For the Fiscal Years Ended March 31, |
|
|||||
|
|
|
2016 |
|
|
2015 |
|
||
|
|
|
(dollars in thousands) |
|
|||||
|
Net Cash Provided by Operating Activities: |
|
$ |
265,767 |
|
|
$ |
234,121 |
|
|
Investing Activities: |
|
|
|
|
|
|
|
|
|
Additions to Property, Plant and Equipment |
|
|
(89,563 |
) |
|
|
(111,573 |
) |
|
Acquisitions |
|
|
(32,427 |
) |
|
|
(237,171 |
) |
|
Net Cash Used in Investing Activities |
|
|
(121,990 |
) |
|
|
(348,744 |
) |
|
Financing Activities: |
|
|
|
|
|
|
|
|
|
Increase in Credit Facility |
|
|
52,000 |
|
|
|
141,000 |
|
|
Repayment of Senior Notes |
|
|
(57,045 |
) |
|
|
(9,500 |
) |
|
Dividends Paid to Stockholders |
|
|
(20,020 |
) |
|
|
(20,072 |
) |
|
Purchase and Retirement of Common Stock |
|
|
(123,530 |
) |
|
|
— |
|
|
Proceeds from Stock Option Exercises |
|
|
2,866 |
|
|
|
4,311 |
|
|
Shares Redeemed to Settle Employee Taxes on Stock Compensation |
|
|
(4,273 |
) |
|
|
(4,166 |
) |
|
Payment of Debt Acquisition Costs |
|
|
— |
|
|
|
(1,661 |
) |
|
Excess Tax Benefits from Share Based Payment Arrangements |
|
|
4,102 |
|
|
|
5,743 |
|
|
Net Cash Provided by (Used in) Financing Activities |
|
|
(145,900 |
) |
|
|
115,655 |
|
|
Net Increase (Decrease) in Cash |
|
$ |
(2,123 |
) |
|
$ |
1,032 |
|
Cash flows from operating activities increased $31.7 million to $265.8 million for fiscal 2016 from $234.1 million for fiscal 2015. This increase was largely attributable to increased net earnings adjusted for depreciation and amortization, impairment and reduction of prepaid sand liability of approximately $10.8 million, and an increase in cash flow from the change in operating assets and liabilities, partially offset by a decrease in distributions from our unconsolidated joint venture. The decrease in distributions from our unconsolidated joint venture is primarily due to decreased earnings in fiscal 2016, compared to fiscal 2015. Cash flows from operating activities were negatively impacted during fiscal 2016 by increased inventories and accounts receivable of approximately $5.7 million and $4.6 million, respectively, and decreased income taxes payable and accounts payable and accrued liabilities of approximately $4.5 million and $7.1 million, respectively, partially offset by reduced other assets of approximately $4.5 million. Excluding the impact of the working capital purchased in the CRS Acquisition in fiscal 2015, cash flows from operating activities were negatively impacted in fiscal 2015 by increased inventories of approximately $38.7 million and a decrease in accounts payable and accrued liabilities of $11.5 million, partially offset by reduced accounts and notes receivable, other assets and increased income taxes payable of approximately $4.2 million, $0.5 million and $8.0 million, respectively.
Working capital increased to $259.4 million at March 31, 2016, compared to $179.8 million at March 31, 2015, primarily due to increased accounts and notes receivable, net, inventories and income tax receivables, of approximately $6.6 million, $8.1 million and $8.6 million, respectively, and decreased accounts payable and current portion of long-term debt, of approximately $11.1 million and $49.0 million, respectively, partially offset by decreased cash and prepaid and other assets of approximately $2.1 million and $2.6 million, respectively. The current portion of long-term debt declined due to payments made during fiscal 2016. These payments were made with borrowings under our Credit Facility, which is classified as long-term on our balance sheet. Working capital related to the Skyway Acquisition decreased working capital at March 31, 2016 by approximately $1.8 million,
48
and primarily consisted of accounts payable and accrued liabilities, partially offset by accounts receivable and inventories.
The increase in accounts and notes receivable at March 31, 2016, compared to March 31, 2015, is primarily due to increased revenues during the fourth quarter of fiscal 2016, compared to the fourth quarter of fiscal 2015. The increase in accounts receivable at March 31, 2016, compared to March 31, 2015, was consistent with the increase in revenues during the periods then ended. As a percentage of quarterly sales generated in the fiscal fourth quarter, accounts receivable were 48% at March 31, 2016 and 51% at March 31, 2015. Management measures the change in accounts receivable by monitoring the days sales outstanding on a monthly basis to determine if any deterioration has occurred in the collectability of the accounts receivable. No significant deterioration in the collectability of our accounts receivable was identified at March 31, 2016. Notes receivable are monitored on an individual basis, and no significant deterioration in the collectability of notes receivable was identified at March 31, 2016 however, during fiscal 2016 we increased our allowance for doubtful accounts approximately $3.1 million in recognition of the downturn in our oil and gas proppants business, and potential financial impact of this downturn on our customers.
Our inventory balance at March 31, 2016 increased approximately $8.1 million, or 3%, from the inventory balance at March 31, 2015. Excluding the $1.7 million of inventory acquired in the Skyway Acquisition, the increase in inventory related primarily to raw materials and materials in process and repair parts, which increased approximately $2.1 million and $6.1 million, respectively at March 31, 2016, compared to March 31, 2015. Most of the increase in raw materials and materials in process is due to increased clinker inventories of approximately $13.7 million, partially offset by a $4.5 million decline in frac sand inventories. The increase in clinker inventory is primarily due to the timing of the outages at certain of our plants. Additionally, most of our cement plants had extended outages in April, and the increase in clinker is necessary to ensure they will have enough supply during the outage. The decrease in frac sand inventory was due primarily to the write-down of $9.4 million in raw sand inventory values at September 30, 2015 associated primarily with downward revaluation of raw sand inventory that CRS Proppants purchased from a third party pursuant to a purchase contract entered into in connection with the plant expansion, partially offset by increased raw sand tonnage at March 31, 2016, compared to March 31, 2015. Repair parts, which are a significant part of our inventory, are necessary given the size and complexity of our manufacturing plants, as well as the age of certain of our plants, which creates the need to stock a greater level of repair parts inventory. We believe all of these repair parts are necessary and we perform an annual analysis to identify obsolete parts. We have less than one year’s sales of all product inventories with the exception of raw frac sand inventory, and our inventories have a low risk of obsolescence due to our products being basic construction materials or sand used in hydraulic fracturing. We believe no additional revision is necessary at March 31, 2016.
Net cash used in investing activities during fiscal 2016 was approximately $122.0 million, compared to net cash used in investing activities of $348.7 million during fiscal 2015, a decrease of approximately $226.7 million. A substantial majority of the decrease related to the CRS Acquisition in fiscal 2015 that increased net cash used in investing activities by $237.2 million, compared to the Skyway acquisition that increased net cash used in investing activities by $32.4 million. Excluding both the CRS and Skyway Acquisitions, capital expenditures decreased by approximately $22.0 million in fiscal 2016, compared to fiscal 2015. This decrease is related primarily to the completion of several projects related our oil and gas proppants business that began in fiscal 2015 and were completed in early fiscal 2016. We anticipate spending between $20 million and $25 million on sustaining capital expenditures during fiscal year 2017, which is consistent with historic levels.
Net cash used in financing activities was $145.9 million during fiscal 2016, compared to net cash provided by financing activities of approximately $115.7 million during fiscal 2015. This $261.6 million increase in net cash used in financing activities is primarily due to the repayment of approximately $5.0 million in debt during fiscal 2016, compared to borrowings of $131.5 million in fiscal 2015. The borrowings in fiscal 2015 related to the CRS Acquisition in November 2014. Additionally, during fiscal 2016, we repurchased and retired approximately $123.5 million of our outstanding common stock. Our debt-to-capitalization ratio and net-debt-to-capitalization ratio was 32.8% and 32.6%, respectively, at March 31, 2016, as compared to 33.7% and 33.4%, respectively, at March 31, 2015.
49
We have a $500.0 million revolving credit facility (the “Credit Facility”), including a swingline loan sublimit of $25.0 million, which is scheduled to expire on October 30, 2019. Borrowings under the Credit Facility are guaranteed by substantially all of the Company’s subsidiaries. At the option of the Company, outstanding principal amounts on the Credit Facility bear interest at a variable rate equal to (i) LIBOR, plus an agreed margin (ranging from 100 basis points to 225 basis points), which is to be established quarterly based upon the Company’s ratio of consolidated EBITDA, defined as earnings before interest, taxes, depreciation and amortization, to the Company’s consolidated indebtedness (the “Leverage Ratio”), or (ii) an alternative base rate which is the higher of (a) the prime rate or (b) the federal funds rate plus ½% per annum, plus an agreed margin (ranging from 0 to 125 basis points). Interest payments are payable, in the case of loans bearing interest at a rate based on the federal funds rate, quarterly, or in the case of loans bearing interest at a rate based on LIBOR, at the end of the LIBOR advance periods, which can be a period of up to nine months at the option of the Company. The Company is also required to pay a commitment fee on unused available borrowings under the Credit Facility ranging from 10 to 35 basis points depending on the Leverage Ratio. The Credit Facility contains customary covenants that restrict our ability to incur additional debt, encumber our assets, sell assets, make or enter into certain investments, loans or guaranties and enter in to sale and leaseback arrangements. The Credit Facility also requires us to maintain a consolidated indebtedness ratio (calculated as consolidated indebtedness to consolidated earnings before interest, taxes, depreciation, amortization, certain transaction-related deductions or other non-cash deductions) of 3.5:1.0 or less and an interest coverage ratio (consolidated earnings before interest, taxes, depreciation, amortization, certain transaction-related deductions or other non-cash deductions to consolidated interest expense) of at least 2.5:1.0. We had $382.0 million of borrowings outstanding at March 31, 2016. Based on our Leverage Ratio, we had $109.0 million of available borrowings, net of outstanding letters of credit, at March 31, 2016.
We entered into a Note Purchase Agreement on November 15, 2005 (the “2005 Note Purchase Agreement”) related to our sale of $200 million of senior, unsecured notes, designated as Series 2005A Senior Notes (the “Series 2005A Senior Notes”) in a private placement transaction. The Series 2005A Senior Notes, which are guaranteed by substantially all of our subsidiaries, were sold at par and issued in three tranches on November 15, 2005. At March 31, 2016, the amount outstanding for the remaining tranche is as follows:
|
|
|
Principal |
|
|
Maturity Date |
|
|
Interest Rate |
|
|||
|
Tranche C |
|
$ |
57.2 million |
|
|
|
November 15, 2017 |
|
|
|
5.48 |
% |
Interest for the tranche of Notes is payable semi-annually on May 15 and November 15 of each year until all principal is paid for the remaining tranche.
We also entered into an additional Note Purchase Agreement on October 2, 2007 (the “2007 Note Purchase Agreement”) related to our sale of $200 million of senior, unsecured notes, designated as Series 2007A Senior Notes (the “Series 2007A Senior Notes”) in a private placement transaction. The Series 2007A Senior Notes, which are guaranteed by substantially all of our subsidiaries, were sold at par and issued in four tranches on October 2, 2007. At March 31, 2016, the amounts outstanding for each of the remaining tranches are as follows:
|
|
|
Principal |
|
|
Maturity Date |
|
|
Interest Rate |
|
|||
|
Tranche B |
|
$ |
8.0 million |
|
|
|
October 2, 2016 |
|
|
|
6.27 |
% |
|
Tranche C |
|
$ |
24.0 million |
|
|
|
October 2, 2017 |
|
|
|
6.36 |
% |
|
Tranche D |
|
$ |
36.5 million |
|
|
|
October 2, 2019 |
|
|
|
6.48 |
% |
Interest for each tranche of Notes is payable semi-annually on April 2 and October 2 of each year until all principal is paid for the respective tranche.
Our obligations under the 2005 Note Purchase Agreement and the 2007 Note Purchase Agreement (collectively referred to as the “Note Purchase Agreements”) and the Series 2005A Senior Notes and the Series 2007A Senior Notes are equal in right of payment with all other senior, unsecured indebtedness of the Company, including our debt under the Credit Facility. The Note Purchase Agreements contain customary restrictive
50
covenants, including covenants that place limits on our ability to encumber our assets, to incur additional debt, to sell assets, or to merge or consolidate with third parties, as well as certain cross covenants with the Credit Facility, namely the maintenance of certain financial ratios.
Pursuant to a Subsidiary Guaranty Agreement, substantially all of our subsidiaries have guaranteed the punctual payment of all principal, interest, and Make-Whole Amounts (as defined in the Note Purchase Agreements) on the Senior Notes and the other payment and performance obligations of the Company contained in the Senior Notes and in the Note Purchase Agreements. We are permitted, at our option and without penalty, to prepay from time to time at least 10% of the original aggregate principal amount of the Senior Notes at 100% of the principal amount to be prepaid, together with interest accrued on such amount to be prepaid to the date of payment, plus a Make-Whole Amount. The Make-Whole Amount is computed by discounting the remaining scheduled payments of interest and principal of the Senior Notes being prepaid at a discount rate equal to the sum of 50 basis points and the yield to maturity of U.S. treasury securities having a maturity equal to the remaining average life of the Senior Notes being prepaid.
We are leasing one of our cement plants from the city of Sugar Creek, Missouri. The city of Sugar Creek issued industrial revenue bonds to partly finance improvements to the cement plant. The lease payments due to the city of Sugar Creek under the cement plant lease, which was entered into upon the sale of the industrial revenue bonds, are equal in amount to the payments required to be made by the city of Sugar Creek to the holders of the industrial revenue bonds. Because we are the holder of all of the outstanding industrial revenue bonds, no debt is reflected on our financial statements in connection with our lease of the cement plant. At the conclusion of the lease in fiscal 2021, we have the option to purchase the cement plant for a nominal amount.
Other than the Credit Facility, we have no other source of committed external financing in place. In the event the Credit Facility was terminated, no assurance can be given as to our ability to secure a new source of financing. Consequently, if a balance was outstanding on the Credit Facility at the time of termination, and an alternative source of financing cannot be secured, it would have a material adverse impact on us. None of our debt is rated by the rating agencies.
We do not have any off balance sheet debt except for operating leases. Also, we have no outstanding debt guarantees. We have available under the Credit Facility a $50.0 million Letter of Credit Facility. At March 31, 2016, we had $9.0 million of letters of credit outstanding that renew annually. We are contingently liable for performance under $14.6 million in performance bonds relating primarily to our mining operations.
We believe that our cash flow from operations and available borrowings under our Credit Facility should be sufficient to meet our currently anticipated operating needs, capital expenditures and dividend and debt service requirements for at least the next twelve months. However, our future liquidity and capital requirements may vary depending on a number of factors, including market conditions in the construction industry, our ability to maintain compliance with covenants in our Credit Facility, the level of competition and general and economic factors beyond our control. We cannot predict what effect these factors will have on our future liquidity. For additional information on factors impacting our liquidity and capital resources, please refer to Part I, Item 1A, “Risk Factors” above.
Cash Used for Share Repurchases and Stock Repurchase Program.
See table under Item 5. “Market for Registrant’s Common Equity, Related Stockholder Matters and Issuer Purchases of Equity Securities” for additional information.
On August 10, 2015, the Board of Directors authorized the Company to repurchase up to an additional 6,782,700 shares, for a total outstanding authorization of 7,500,000 shares. During fiscal 2016, we have repurchased 1,894,000 shares, at an average price of $65.24. Subsequent to March 31, 2016, we have purchased an additional 230,000 shares at an average price of $69.80. Including the shares purchased subsequent to year end, we have authorization to purchase an additional 5,376,000 shares. We did not repurchase any shares in the open market during the fiscal years ended March 31, 2015 and 2014.
51
Share repurchases may be made from time-to-time in the open market or in privately negotiated transactions. The timing and amount of any repurchases of shares will be determined by the Company’s management, based on its evaluation of market and economic conditions and other factors. In some cases, repurchases may be made pursuant to plans, programs or directions established from time to time by the Company’s management, including plans to comply with the safe-harbor provided by Rule 10b5-1.
Capital Expenditures.
The following table compares capital expenditures:
|
|
|
|
|
|
For the Fiscal Years Ended March 31, |
|
||||||
|
|
|
Skyway Acquisition |
|
|
2016 |
|
|
2015 |
|
|||
|
|
|
|
|
|
(dollars in thousands) |
|
||||||
|
Land and Quarries |
|
$ |
2,290 |
|
|
$ |
20,124 |
|
|
$ |
1,030 |
|
|
Plants |
|
|
18,331 |
|
|
|
39,683 |
|
|
|
71,042 |
|
|
Buildings, Machinery and Equipment |
|
|
3,955 |
|
|
|
29,756 |
|
|
|
39,501 |
|
|
Total Capital Expenditures |
|
$ |
24,576 |
|
|
$ |
89,563 |
|
|
$ |
111,573 |
|
Historically, annual maintenance capital expenditures have been approximately $20.0 to $25.0 million, which we anticipate will be similar for fiscal 2017. Historically, we have financed such expenditures with cash from operations and borrowings under our revolving credit facility.
Contractual and Other Obligations.
We have certain contractual obligations arising from indebtedness, operating leases and purchase obligations. Future payments due, aggregated by type of contractual obligation are set forth as follows:
|
|
|
Payments Due by Period |
|
|||||||||||||||||
|
|
|
Total |
|
|
Less than 1 year |
|
|
1-3 years |
|
|
3-5 years |
|
|
More than 5 years |
|
|||||
|
|
|
(dollars in thousands) |
|
|||||||||||||||||
|
Contractual Obligations: |
|
|
|
|
|
|
|
|
|
|
|
|
|
|
|
|
|
|
|
|
|
Credit Facility (1) |
|
$ |
382,000 |
|
|
$ |
— |
|
|
$ |
— |
|
|
$ |
382,000 |
|
|
$ |
— |
|
|
Senior Notes |
|
|
125,714 |
|
|
|
8,000 |
|
|
|
81,214 |
|
|
|
36,500 |
|
|
|
— |
|
|
Interest on Senior Notes |
|
|
15,913 |
|
|
|
7,277 |
|
|
|
7,453 |
|
|
|
1,183 |
|
|
|
— |
|
|
Interest on Credit Facility (2) |
|
|
17,050 |
|
|
|
6,198 |
|
|
|
9,052 |
|
|
|
1,800 |
|
|
|
— |
|
|
Operating Leases |
|
|
38,593 |
|
|
|
9,262 |
|
|
|
13,665 |
|
|
|
6,731 |
|
|
|
8,935 |
|
|
Purchase Obligations (3) |
|
|
66,273 |
|
|
|
17,264 |
|
|
|
11,089 |
|
|
|
9,320 |
|
|
|
28,600 |
|
|
Total |
|
$ |
645,543 |
|
|
$ |
48,001 |
|
|
$ |
122,473 |
|
|
$ |
437,534 |
|
|
$ |
37,535 |
|
|
(1) |
The Credit Facility expires in October 2019. |
|
(2) |
At March 31, 2016, we had $382.0 million outstanding under the Credit Facility. Interest on the outstanding amounts is based on LIBOR plus a margin based on our leverage ratio. We also pay a commitment fee, which is calculated based on the available amount of borrowings at .35% per annum through the expiration of the facility in October 2019. We estimated the future cash flows for interest by assuming a level repayment of the Credit Facility over the remainder of the agreement. Actual amounts paid, as well as the payment time periods, will likely differ from this estimate. |
|
(3) |
Purchase obligations are non-cancelable agreements to purchase coal, natural gas and synthetic gypsum, to pay royalty amounts and capital expenditure commitments. |
Based on our current actuarial estimates, we anticipate making contributions of approximately $0.5 million to $1.0 million to our defined benefit plans for fiscal year 2017.
Dividends.
Dividends paid in fiscal years 2016 and 2015 were $20.0 million and $20.1 million, respectively. Each quarterly dividend payment is subject to review and approval by our Board of Directors.
52
Inflation and Changing Prices.
The Consumer Price Index rose approximately 0.7% in calendar 2015, 0.8% in 2014, and 1.6% in 2013. Prices of materials and services, with the exception of power, natural gas, coal, petroleum coke, and transportation freight, have remained relatively stable over the three year period. During calendar 2015, the Consumer Price Index for energy decreased approximately 4.3%, while the Consumer Price Index for transportation increased approximately 2.6%, respectively. These increases, with the exception of energy, are relatively minor, and had minimal impact on our business due to improving efficiencies. The decrease in energy prices was favorable to our manufacturing businesses, but adversely impacted our oil and gas proppants segment as demand for oil declined, reducing the demand for frac sand. Additional inflationary increases could have an adverse impact on all of our businesses, with the exception of increased oil prices, which would favor our oil and gas proppants business. The ability to increase sales prices to cover future increases varies with the level of activity in the construction industry, the number, size, and strength of competitors and the availability of products to supply a local market.
General Outlook
See “General Outlook” within Item 7. Management’s Discussion and Analysis of Financial Condition and Results of Operations on page 40.
Recent Accounting Pronouncements
Refer to Footnote (A) of the Notes to Consolidated Financial Statements for information regarding recently issued accounting pronouncements that may affect our financial statements.
Forward-Looking Statements
Certain information included in this report or in other materials we have filed or will file with the SEC, as well as information included in oral statements or other written statements made or to be made by us, contains or may contain forward-looking statements within the meaning of Section 27A of the Securities Act of 1933, Section 21E of the Securities Exchange Act of 1934 and the Private Litigation Reform Act of 1995. Forward-looking statements may be identified by the context of the statement and generally arise when we are discussing our beliefs, estimates or expectations. From time to time, forward-looking statements also are included in our other periodic reports on Forms 10-K, 10-Q and 8-K, press releases and presentations, on our web site and in other material released to the public. We specifically disclaim any duty to update any of the information set forth in this report, including any forward-looking statements. Forward-looking statements are made based on management’s current expectations and beliefs concerning future events and, therefore, involve a number of risks and uncertainties. Management cautions that forward-looking statements are not guarantees, and our actual results could differ materially from those expressed or implied in the forward looking statements. See Item 1A – Risk Factors for a more detailed discussion of specific risks and uncertainties.
We are exposed to market risks related to fluctuations in interest rates on our Credit Facility. We have occasionally utilized derivative instruments, including interest rate swaps, in conjunction with our overall strategy to manage the debt outstanding that is subject to changes in interest rates. We have a $500.0 million Credit Facility available at March 31, 2016 under which borrowings bear interest at a variable rate. A hypothetical 100 basis point increase in interest rates on the $382.0 million of borrowings at March 31, 2016 would increase our interest expense by $3.8 million on an annual basis. We do not presently utilize derivative financial instruments.
We are subject to commodity risk with respect to price changes principally in coal, coke, natural gas and power. We attempt to limit our exposure to changes in commodity prices by entering into contracts or increasing use of alternative fuels.
53
Financial Information
54
Eagle Materials Inc. and Subsidiaries
Consolidated Statements of Earnings
(dollars in thousands, except share and per share data)
|
|
|
For the Years Ended March 31, |
|
|||||||||
|
|
|
2016 |
|
|
2015 |
|
|
2014 |
|
|||
|
Revenues |
|
$ |
1,143,492 |
|
|
$ |
1,066,368 |
|
|
$ |
898,396 |
|
|
Cost of Goods Sold |
|
|
911,875 |
|
|
|
812,235 |
|
|
|
712,937 |
|
|
Gross Profit |
|
|
231,617 |
|
|
|
254,133 |
|
|
|
185,459 |
|
|
Equity in Earnings of Unconsolidated Joint Venture |
|
|
39,083 |
|
|
|
44,967 |
|
|
|
37,811 |
|
|
Corporate General and Administrative Expense |
|
|
(37,193 |
) |
|
|
(30,751 |
) |
|
|
(24,552 |
) |
|
Other Operating Income (Loss) |
|
|
2,328 |
|
|
|
3,201 |
|
|
|
1,368 |
|
|
Acquisition and Litigation Expense |
|
|
— |
|
|
|
(6,880 |
) |
|
|
— |
|
|
Interest Expense, Net |
|
|
(16,583 |
) |
|
|
(11,743 |
) |
|
|
(18,282 |
) |
|
Earnings before Income Taxes |
|
|
219,252 |
|
|
|
252,927 |
|
|
|
181,804 |
|
|
Income Taxes |
|
|
(66,660 |
) |
|
|
(66,074 |
) |
|
|
(57,561 |
) |
|
Net Earnings |
|
|
152,592 |
|
|
|
186,853 |
|
|
$ |
124,243 |
|
|
EARNINGS PER SHARE |
|
|
|
|
|
|
|
|
|
|
|
|
|
Basic |
|
$ |
3.08 |
|
|
$ |
3.77 |
|
|
$ |
2.53 |
|
|
Diluted |
|
$ |
3.05 |
|
|
$ |
3.71 |
|
|
$ |
2.49 |
|
|
AVERAGE SHARES OUTSTANDING |
|
|
|
|
|
|
|
|
|
|
|
|
|
Basic |
|
|
49,471,157 |
|
|
|
49,604,249 |
|
|
|
49,090,750 |
|
|
Diluted |
|
|
50,070,829 |
|
|
|
50,372,243 |
|
|
|
49,939,165 |
|
|
CASH DIVIDENDS PER SHARE |
|
$ |
0.40 |
|
|
$ |
0.40 |
|
|
$ |
0.40 |
|
See notes to consolidated financial statements.
55
Eagle Materials Inc. and Subsidiaries
Consolidated Statements of Comprehensive Earnings
(dollars in thousands)
|
|
|
For the Years Ended March 31, |
|
|||||||||
|
|
|
2016 |
|
|
2015 |
|
|
2014 |
|
|||
|
Net Earnings |
|
$ |
152,592 |
|
|
$ |
186,853 |
|
|
$ |
124,243 |
|
|
Net Actuarial Change in Defined Benefit Plans: |
|
|
|
|
|
|
|
|
|
|
|
|
|
Unrealized (gain) loss during the period, net of tax expense (benefit) of ($488), ($3,746) and $1,173 |
|
|
613 |
|
|
|
6,173 |
|
|
|
(2,399 |
) |
|
Amortization of Net Actuarial Loss, net of tax benefit of $760, $242 and $333 |
|
|
1,271 |
|
|
|
411 |
|
|
|
840 |
|
|
Comprehensive Earnings |
|
$ |
153,250 |
|
|
$ |
193,437 |
|
|
$ |
122,684 |
|
See notes to consolidated financial statements.
56
Eagle Materials Inc. and Subsidiaries
(dollars in thousands)
|
|
|
March 31, |
|
|||||
|
|
|
2016 |
|
|
2015 |
|
||
|
ASSETS |
|
|
|
|
|
|
||
|
Current Assets - |
|
|
|
|
|
|
|
|
|
Cash and Cash Equivalents |
|
$ |
5,391 |
|
|
$ |
7,514 |
|
|
Accounts and Notes Receivable, net |
|
|
120,221 |
|
|
|
113,577 |
|
|
Inventories |
|
|
243,595 |
|
|
|
235,464 |
|
|
Income Tax Receivable |
|
|
5,623 |
|
|
|
— |
|
|
Prepaid and Other Assets |
|
|
5,173 |
|
|
|
7,815 |
|
|
Total Current Assets |
|
|
380,003 |
|
|
|
364,370 |
|
|
Property, Plant and Equipment - |
|
|
2,072,776 |
|
|
|
1,962,215 |
|
|
Less: Accumulated Depreciation |
|
|
(817,465 |
) |
|
|
(740,396 |
) |
|
Property, Plant and Equipment, net |
|
|
1,255,311 |
|
|
|
1,221,819 |
|
|
Notes Receivable |
|
|
2,672 |
|
|
|
2,847 |
|
|
Investment in Joint Venture |
|
|
49,465 |
|
|
|
47,614 |
|
|
Goodwill and Intangible Assets, net |
|
|
165,827 |
|
|
|
211,167 |
|
|
Other Assets |
|
|
30,357 |
|
|
|
32,509 |
|
|
|
|
$ |
1,883,635 |
|
|
$ |
1,880,326 |
|
|
LIABILITIES AND STOCKHOLDERS’ EQUITY |
|
|
|
|
|
|
|
|
|
Current Liabilities - |
|
|
|
|
|
|
|
|
|
Accounts Payable |
|
$ |
66,614 |
|
|
$ |
77,749 |
|
|
Accrued Liabilities |
|
|
45,975 |
|
|
|
46,830 |
|
|
Income Tax Payable |
|
|
— |
|
|
|
2,952 |
|
|
Current Portion of Long-term Debt |
|
|
8,000 |
|
|
|
57,045 |
|
|
Total Current Liabilities |
|
|
120,589 |
|
|
|
184,576 |
|
|
Long-term Debt |
|
|
499,714 |
|
|
|
455,714 |
|
|
Other Long-term Liabilities |
|
|
61,122 |
|
|
|
69,055 |
|
|
Deferred Income Taxes |
|
|
161,679 |
|
|
|
160,388 |
|
|
Total Liabilities |
|
|
843,104 |
|
|
|
869,733 |
|
|
Stockholders’ Equity – |
|
|
|
|
|
|
|
|
|
Preferred Stock, Par Value $0.01; Authorized 5,000,000 Shares; None Issued |
|
|
— |
|
|
|
— |
|
|
Common Stock, Par Value $0.01; Authorized 100,000,000 Shares; Issued and Outstanding 48,526,843 and 50,245,364 Shares, respectively. |
|
|
485 |
|
|
|
502 |
|
|
Capital in Excess of Par Value |
|
|
168,969 |
|
|
|
272,441 |
|
|
Accumulated Other Comprehensive Losses |
|
|
(11,409 |
) |
|
|
(12,067 |
) |
|
Retained Earnings |
|
|
882,486 |
|
|
|
749,717 |
|
|
Total Stockholders’ Equity |
|
|
1,040,531 |
|
|
|
1,010,593 |
|
|
|
|
$ |
1,883,635 |
|
|
$ |
1,880,326 |
|
See notes to consolidated financial statements.
57
Eagle Materials Inc. and Subsidiaries
Consolidated Statements of Cash Flows
(dollars in thousands)
|
|
|
For the Years Ended March 31, |
|
|||||||||
|
|
|
2016 |
|
|
2015 |
|
|
2014 |
|
|||
|
CASH FLOWS FROM OPERATING ACTIVITIES |
|
|
|
|
|
|
|
|
|
|
||
|
Net Earnings |
|
$ |
152,592 |
|
|
$ |
186,853 |
|
|
$ |
124,243 |
|
|
Adjustments to Reconcile Net Earnings to Net Cash Provided by Operating Activities, Net of Effect of Non-Cash Activity - |
|
|
|
|
|
|
|
|
|
|
|
|
|
Depreciation, Depletion and Amortization |
|
|
97,105 |
|
|
|
76,299 |
|
|
|
70,021 |
|
|
Impairment of Intangible Assets |
|
|
34,999 |
|
|
|
— |
|
|
|
— |
|
|
Reduction of Prepaid Sand Liability |
|
|
(10,658 |
) |
|
|
— |
|
|
|
— |
|
|
Deferred Income Tax Provision |
|
|
(2,323 |
) |
|
|
5,805 |
|
|
|
5,746 |
|
|
Stock Compensation Expense |
|
|
17,346 |
|
|
|
13,030 |
|
|
|
10,136 |
|
|
Excess Tax Benefits from Share Based Payment Arrangements |
|
|
(4,102 |
) |
|
|
(5,743 |
) |
|
|
(8,067 |
) |
|
Equity in Earnings of Unconsolidated Joint Venture |
|
|
(39,083 |
) |
|
|
(44,967 |
) |
|
|
(37,811 |
) |
|
Distributions from Joint Venture |
|
|
37,250 |
|
|
|
40,375 |
|
|
|
37,750 |
|
|
Changes in Operating Assets and Liabilities: |
|
|
|
|
|
|
|
|
|
|
|
|
|
Accounts and Notes Receivable |
|
|
(4,553 |
) |
|
|
4,196 |
|
|
|
(12,876 |
) |
|
Inventories |
|
|
(5,740 |
) |
|
|
(38,741 |
) |
|
|
(32,714 |
) |
|
Accounts Payable and Accrued Liabilities |
|
|
(7,061 |
) |
|
|
(11,499 |
) |
|
|
6,504 |
|
|
Other Assets |
|
|
4,468 |
|
|
|
520 |
|
|
|
(3,511 |
) |
|
Income Taxes Payable |
|
|
(4,473 |
) |
|
|
7,993 |
|
|
|
11,212 |
|
|
Net Cash Provided by Operating Activities |
|
|
265,767 |
|
|
|
234,121 |
|
|
|
170,633 |
|
|
CASH FLOWS FROM INVESTING ACTIVITIES |
|
|
|
|
|
|
|
|
|
|
|
|
|
Additions to Property, Plant and Equipment |
|
|
(89,563 |
) |
|
|
(111,573 |
) |
|
|
(59,490 |
) |
|
Acquisition Spending |
|
|
(32,427 |
) |
|
|
(237,171 |
) |
|
|
— |
|
|
Net Cash Used in Investing Activities |
|
|
(121,990 |
) |
|
|
(348,744 |
) |
|
|
(59,490 |
) |
|
CASH FLOWS FROM FINANCING ACTIVITIES |
|
|
|
|
|
|
|
|
|
|
|
|
|
Increase (Decrease) in Credit Facility |
|
|
52,000 |
|
|
|
141,000 |
|
|
|
(108,000 |
) |
|
Repayment of Senior Notes |
|
|
(57,045 |
) |
|
|
(9,500 |
) |
|
|
— |
|
|
Dividends Paid to Stockholders |
|
|
(20,020 |
) |
|
|
(20,072 |
) |
|
|
(19,899 |
) |
|
Purchase and Retirement of Common Stock |
|
|
(123,530 |
) |
|
|
— |
|
|
|
— |
|
|
Proceeds from Stock Option Exercises |
|
|
2,866 |
|
|
|
4,311 |
|
|
|
14,187 |
|
|
Shares Redeemed to Settle Employee Taxes on Stock Compensation |
|
|
(4,273 |
) |
|
|
(4,166 |
) |
|
|
(2,913 |
) |
|
Payment of Debt Issuance Costs |
|
|
— |
|
|
|
(1,661 |
) |
|
|
— |
|
|
Excess Tax Benefits from Share Based Payment Arrangements |
|
|
4,102 |
|
|
|
5,743 |
|
|
|
8,067 |
|
|
Net Cash Provided by (Used in) Financing Activities |
|
|
(145,900 |
) |
|
|
115,655 |
|
|
|
(108,558 |
) |
|
NET INCREASE (DECREASE) IN CASH AND CASH EQUIVALENTS |
|
|
(2,123) |
|
|
|
1,032 |
|
|
|
2,585 |
|
|
CASH AND CASH EQUIVALENTS AT BEGINNING OF PERIOD |
|
|
7,514 |
|
|
|
6,482 |
|
|
|
3,897 |
|
|
CASH AND CASH EQUIVALENTS AT END OF PERIOD |
|
$ |
5,391 |
|
|
$ |
7,514 |
|
|
$ |
6,482 |
|
See notes to consolidated financial statements.
58
Eagle Materials Inc. and Subsidiaries
Consolidated Statements of Stockholders’ Equity
(dollars in thousands)
|
|
|
Common Stock |
|
|
Capital in Excess of Par Value |
|
|
Retained Earnings |
|
|
Accumulated Other Comprehensive Losses |
|
|
Total |
|
|||||
|
Balance at March 31, 2013 |
|
$ |
495 |
|
|
$ |
224,053 |
|
|
$ |
478,664 |
|
|
$ |
(7,042 |
) |
|
$ |
696,170 |
|
|
Net Earnings |
|
|
— |
|
|
|
— |
|
|
|
124,243 |
|
|
|
— |
|
|
|
124,243 |
|
|
Stock Option Exercises and Restricted Share Vesting |
|
|
5 |
|
|
|
14,182 |
|
|
|
— |
|
|
|
— |
|
|
|
14,187 |
|
|
Tax Benefit-Stock Option Exercise |
|
|
— |
|
|
|
8,067 |
|
|
|
— |
|
|
|
— |
|
|
|
8,067 |
|
|
Dividends to Stockholders |
|
|
— |
|
|
|
— |
|
|
|
(19,950 |
) |
|
|
— |
|
|
|
(19,950 |
) |
|
Stock Compensation Expense |
|
|
1 |
|
|
|
10,135 |
|
|
|
— |
|
|
|
— |
|
|
|
10,136 |
|
|
Shares Redeemed to Settle Employee Taxes |
|
|
— |
|
|
|
(2,913 |
) |
|
|
— |
|
|
|
— |
|
|
|
(2,913 |
) |
|
Unfunded Pension Liability, net of tax |
|
|
— |
|
|
|
— |
|
|
|
— |
|
|
|
1,559 |
|
|
|
1,559 |
|
|
Balance at March 31, 2014 |
|
$ |
501 |
|
|
$ |
253,524 |
|
|
$ |
582,957 |
|
|
$ |
(5,483 |
) |
|
$ |
831,499 |
|
|
Net Earnings |
|
|
— |
|
|
|
— |
|
|
|
186,853 |
|
|
|
— |
|
|
|
186,853 |
|
|
Stock Option Exercises and Restricted Share Vesting |
|
|
1 |
|
|
|
4,310 |
|
|
|
— |
|
|
|
— |
|
|
|
4,311 |
|
|
Tax Benefit-Stock Option Exercise |
|
|
— |
|
|
|
5,743 |
|
|
|
— |
|
|
|
— |
|
|
|
5,743 |
|
|
Dividends to Stockholders |
|
|
— |
|
|
|
— |
|
|
|
(20,093 |
) |
|
|
— |
|
|
|
(20,093 |
) |
|
Stock Compensation Expense |
|
|
— |
|
|
|
13,030 |
|
|
|
— |
|
|
|
— |
|
|
|
13,030 |
|
|
Shares Redeemed to Settle Employee Taxes |
|
|
— |
|
|
|
(4,166 |
) |
|
|
— |
|
|
|
— |
|
|
|
(4,166 |
) |
|
Unfunded Pension Liability, net of tax |
|
|
— |
|
|
|
— |
|
|
|
— |
|
|
|
(6,584 |
) |
|
|
(6,584 |
) |
|
Balance at March 31, 2015 |
|
$ |
502 |
|
|
$ |
272,441 |
|
|
$ |
749,717 |
|
|
$ |
(12,067 |
) |
|
$ |
1,010,593 |
|
|
Net Earnings |
|
|
— |
|
|
|
— |
|
|
|
152,592 |
|
|
|
— |
|
|
|
152,592 |
|
|
Stock Option Exercises and Restricted Share Vesting |
|
|
2 |
|
|
|
2,864 |
|
|
|
— |
|
|
|
— |
|
|
|
2,866 |
|
|
Tax Benefit-Stock Option Exercise |
|
|
— |
|
|
|
4,102 |
|
|
|
— |
|
|
|
— |
|
|
|
4,102 |
|
|
Purchase and Retirement of Common Stock |
|
|
(19 |
) |
|
|
(123,511 |
) |
|
|
— |
|
|
|
— |
|
|
|
(123,530 |
) |
|
Dividends to Stockholders |
|
|
— |
|
|
|
— |
|
|
|
(19,823 |
) |
|
|
— |
|
|
|
(19,823 |
) |
|
Stock Compensation Expense |
|
|
— |
|
|
|
17,346 |
|
|
|
— |
|
|
|
— |
|
|
|
17,346 |
|
|
Shares Redeemed to Settle Employee Taxes |
|
|
— |
|
|
|
(4,273) |
|
|
|
— |
|
|
|
— |
|
|
|
(4,273 |
) |
|
Unfunded Pension Liability, net of tax |
|
|
— |
|
|
|
— |
|
|
|
— |
|
|
|
658 |
|
|
|
658 |
|
|
Balance at March 31, 2016 |
|
$ |
485 |
|
|
$ |
168,969 |
|
|
$ |
882,486 |
|
|
$ |
(11,409 |
) |
|
$ |
1,040,531 |
|
See notes to consolidated financial statements.
59
Eagle Materials Inc. and Subsidiaries
Notes to Consolidated Financial Statements
(dollars in thousands, except per share data)
(A) Significant Accounting Policies
Basis of Presentation –
The consolidated financial statements include the accounts of Eagle Materials Inc. and its majority-owned subsidiaries (“EXP” or the “Company”), which may be referred to as “our”, “we”, or “us”. All intercompany balances and transactions have been eliminated. EXP is a holding company whose assets consist of its investments in its subsidiaries, joint venture, intercompany balances and holdings of cash and cash equivalents. The businesses of the consolidated group are conducted through EXP’s subsidiaries. The Company conducts one of its cement plant operations through a joint venture, Texas Lehigh Cement Company L.P., which is located in Buda, Texas (the “Joint Venture”). Investments in the Joint Venture and affiliated companies owned 50% or less are accounted for using the equity method of accounting. The equity in earnings of unconsolidated joint venture has been included for the same period as our March 31 year end.
The preparation of financial statements in conformity with accounting principles generally accepted in the U.S. requires management to make estimates and assumptions that affect the reported amounts of assets and liabilities and disclosures of contingent assets and liabilities at the date of the financial statements and the reported amounts of revenues and expenses during the reporting period. Actual results could differ from those estimates.
Reclassifications – Certain reclassifications have been made to the prior year to conform to the current year presentation.
Cash and Cash Equivalents –
Cash equivalents include short-term, highly liquid investments with original maturities of three months or less and are recorded at cost, which approximates market value.
Accounts and Notes Receivable –
Accounts and notes receivable have been shown net of the allowance for doubtful accounts of $10.2 million and $7.1 million at March 31, 2016 and 2015, respectively. We perform ongoing credit evaluations of our customers’ financial condition and generally require no collateral from our customers. The allowance for non-collection of receivables is based upon analysis of economic trends in the construction and oil and gas industries, detailed analysis of the expected collectability of accounts receivable that are past due and the expected collectability of overall receivables. We have no significant credit risk concentration among our diversified customer base.
We had notes receivable totaling approximately $2.9 million at March 31, 2016, of which approximately $0.2 million has been classified as current and presented with accounts receivable on the balance sheet. We lend funds to certain companies in the ordinary course of business, and the notes bear interest, on average, at LIBOR plus 3.5%, which was approximately 3.9% on March 31, 2016. Remaining unpaid amounts, plus accrued interest, mature in March 2017. The notes are collateralized by certain assets of the borrowers, namely property and equipment. We monitor the credit risk of each borrower by focusing on the timeliness of payments, review of credit history and credit metrics and interaction with the borrowers. At March 31, 2016 and 2015, approximately $0.3 million of our allowance for doubtful accounts is related to our notes receivable.
60
Inventories are stated at the lower of average cost (including applicable material, labor, depreciation, and plant overhead) or market. Inventories consist of the following:
|
|
|
March 31, |
|
|||||
|
|
|
2016 |
|
|
2015 |
|
||
|
|
|
(dollars in thousands) |
|
|||||
|
Raw Materials and Materials-in-Progress |
|
$ |
119,060 |
|
|
$ |
115,345 |
|
|
Finished Cement |
|
|
21,834 |
|
|
|
20,508 |
|
|
Gypsum Wallboard |
|
|
5,839 |
|
|
|
7,741 |
|
|
Paperboard |
|
|
7,575 |
|
|
|
8,493 |
|
|
Frac Sand |
|
|
5,501 |
|
|
|
4,928 |
|
|
Aggregates |
|
|
10,660 |
|
|
|
11,131 |
|
|
Repair Parts and Supplies |
|
|
68,155 |
|
|
|
62,121 |
|
|
Fuel and Coal |
|
|
4,971 |
|
|
|
5,197 |
|
|
|
|
$ |
243,595 |
|
|
$ |
235,464 |
|
Property, Plant and Equipment –
Property, plant and equipment are stated at cost. Major renewals and improvements are capitalized and depreciated. Annual maintenance is expensed as incurred. Depreciation is provided on a straight-line basis over the estimated useful lives of depreciable assets and totaled $84.2 million, $69.7 million and $67.3 million for the years ended March 31, 2016, 2015 and 2014, respectively. Raw material deposits are depleted as such deposits are extracted for production utilizing the units-of-production method. Costs and accumulated depreciation applicable to assets retired or sold are eliminated from the accounts and any resulting gains or losses are recognized at such time. The estimated lives of the related assets are as follows:
|
Plants |
|
|
20 to 30 years |
|
|
Buildings |
|
|
20 to 40 years |
|
|
Machinery and Equipment |
|
|
3 to 25 years |
|
We periodically evaluate whether current events or circumstances indicate that the carrying value of our depreciable assets may not be recoverable. At March 31, 2016 and 2015, management believes no events or circumstances indicate that the carrying value may not be recoverable.
Impairment or Disposal of Long-Lived and Intangible Assets –
We evaluate the recoverability of our long-lived assets and certain identifiable intangibles, such as permits and customer contracts, for impairment whenever events or changes in circumstances indicate that the carrying amount of an asset may not be recoverable. Recoverability of assets, such as plants, buildings and machinery and equipment, including mining assets, is measured by comparing the carrying amount of an asset to future undiscounted net cash flows expected to be generated by the asset. Such evaluations for impairment are significantly impacted by estimates of future prices for our products, capital needs, economic trends in the construction sector and other factors. If such assets are considered to be impaired, the impairment to be recognized is measured by the amount by which the carrying amount of the assets exceeds their estimated fair value. Assets to be disposed of by sale are reflected at the lower of their carrying amount or fair value less cost to sell.
During calendar 2015, the continued decline in oil prices adversely impacted oil and gas drilling activity, leading to further reductions in demand and pricing for proppants. This reduction in demand adversely impacted performance under our customer contracts for our frac sand business, resulting in the amendment of certain of these contracts. Based on the reduced demand for proppants and the executed and pending amendments to our customer contracts, we concluded that long-lived asset impairment indicators were present during the quarters ended September 30, 2015 and March 31, 2016 for our customer contract intangible assets. We performed
61
recovery tests to determine if any of the customer contract intangible assets related to our oil and gas proppants business unit were impaired at September 30, 2015 and March 31, 2016. Based on our analysis of the undiscounted cash flows for each of our customer contract intangibles related to our oil and gas proppants business, we concluded that the carrying value of certain customer contract intangible assets exceeded the undiscounted cash flows for the related assets at both September 30, 2015 and March 31, 2016. For those contracts whose carrying value exceeded the undiscounted cash flows, we calculated an estimated fair value of each contract using the weighted-average probable cash flows related to each contract (level 3 inputs), discounted using a weighted-average cost of capital (“WACC”). The WACC was determined from relevant market comparisons, and adjusted for specific risks. This analysis resulted in impairment losses of approximately $28.4 million and $6.6 million for the quarters ended September 30, 2015 and March 31, 2016, respectively, which is included in cost of goods sold in the Consolidated Statement of Earnings for fiscal year 2016.
Goodwill and Intangible Assets –
Goodwill: Goodwill is subject to at least an annual assessment for impairment by applying a fair-value-based test. We have elected to test for goodwill impairment in the fourth quarter of each fiscal year. The goodwill impairment test is a two-step process, which requires us to make judgments in determining what assumptions to use in the calculation. The first step of the process consists of estimating the fair value of each reporting unit based on a discounted cash flow model using revenues and profit forecasts and comparing those estimated fair values with the carrying value; a second step is performed, if necessary, to compute the amount of the impairment by determining an “implied fair value” of goodwill. Similar to the review for impairment of other long-lived assets, evaluations for impairment are significantly impacted by estimates of future prices for our products, capital needs, economic trends and other factors.
Intangible Assets: Intangible assets, including the impact of the impairment charges discussed above, at March 31, 2016 and 2015 consist of the following:
|
|
|
March 31, 2016 |
|
||||||||||||||||||||
|
|
|
Amortization Period |
|
|
Cost |
|
|
Amortization Expense |
|
|
Impairment |
|
|
Accumulated Amortization |
|
|
Net |
|
|||||
|
|
|
|
|
|
|
(dollars in thousands) |
|
||||||||||||||||
|
Goodwill and Intangible Assets: |
|
|
|
|
|
|
|
|
|
|
|
|
|
|
|
|
|
|
|
|
|
|
|
|
Customer Contracts and Relationships |
|
15 years |
|
|
$ |
63,260 |
|
|
$ |
11,634 |
|
|
$ |
34,999 |
|
|
$ |
(52,627 |
) |
|
$ |
10,633 |
|
|
Sales Contracts |
|
4 years |
|
|
|
2,500 |
|
|
|
625 |
|
|
|
— |
|
|
|
(2,083 |
) |
|
$ |
417 |
|
|
Permits |
|
40 years |
|
|
|
27,440 |
|
|
|
652 |
|
|
|
— |
|
|
|
(6,548 |
) |
|
$ |
20,892 |
|
|
Goodwill |
|
|
|
|
|
133,885 |
|
|
|
— |
|
|
|
— |
|
|
|
— |
|
|
$ |
133,885 |
|
|
Total Goodwill and Intangible Assets |
|
|
|
|
$ |
227,085 |
|
|
$ |
12,911 |
|
|
$ |
34,999 |
|
|
$ |
(61,258 |
) |
|
$ |
165,827 |
|
At March 31, 2016, approximately $5.6 million of customer contracts and relationships is related to our oil and gas proppants segment. Under the terms of one of the contracts, the customer prepaid $15.0 million for sand, of which $12.7 million was available at March 31, 2015. This prepayment would be credited to the customer based on future sand purchases required by the contract. This customer has not made the required purchases in accordance with the terms of the contract, and therefore has forfeited approximately $10.7 million of the prepaid balance. The reversal of the $10.7 million was recorded as a reduction to cost of goods sold in our oil and gas proppants segment during fiscal 2016. We have a $2.0 million liability related to the remaining customer prepayment of sand, which is included in Other Long-Term Liabilities on the consolidated Balance Sheet. The contract terminates June 30, 2016, at which time the remaining $2.0 million will be forfeited if the customer has not placed orders for the contracted amount of sand.
62
|
|
|
March 31, 2015 |
|
|||||||||||||
|
|
|
Amortization Period |
|
|
Cost |
|
|
Accumulated Amortization |
|
|
Net |
|
||||
|
|
|
(dollars in thousands) |
|
|||||||||||||
|
Intangible Assets and Goodwill: |
|
|
|
|
|
|
|
|
|
|
|
|
|
|
|
|
|
Customer contracts and relationships |
|
|
15 years |
|
|
$ |
62,060 |
|
|
$ |
(5,994 |
) |
|
$ |
56,066 |
|
|
Sales contracts |
|
|
4 years |
|
|
|
2,500 |
|
|
|
(1,458 |
) |
|
|
1,042 |
|
|
Permits |
|
|
40 years |
|
|
|
27,440 |
|
|
|
(5,896 |
) |
|
|
21,544 |
|
|
Goodwill |
|
|
|
|
|
|
132,515 |
|
|
|
— |
|
|
|
132,515 |
|
|
Total intangible assets and goodwill |
|
|
|
|
|
$ |
224,515 |
|
|
$ |
(13,348 |
) |
|
$ |
211,167 |
|
During July 2015, goodwill increased approximately $1.4 million and customer contracts and relationships increased $1.2 million in connection with the acquisition of Skyway Cement Company. See Footnote (B) of the Notes to Consolidated Financial Statements for more information.
Amortization expense of intangibles was $12.9 million, $5.7 million and $1.7 million for the years ended March 31, 2016, 2015 and 2014, respectively, excluding the impairment expense in fiscal 2016, as discussed above. Amortization expense is expected to be approximately $3.4 million for fiscal year 2017, $3.0 million per year for fiscal years 2018 and 2019, $2.0 million for fiscal year 2020, and $1.2 million for fiscal year 2021.
Other Assets –
Other assets are primarily composed of loan fees and financing costs, deferred expenses, and deposits.
Income Taxes –
Income taxes are accounted for using the asset and liability method. Deferred taxes are recognized for the tax consequences of temporary differences by applying enacted statutory tax rates applicable to future years to differences between the financial statement carrying amounts and the tax bases of existing assets and liabilities. The effect on deferred taxes of a change in tax rates is recognized in earnings in the period that includes the enactment date. In addition, we recognize future tax benefits to the extent that such benefits are more likely than not to be realized.
Stock Repurchases –
On August 10, 2015, the Board of Directors authorized the Company to repurchase up to an additional 6,782,700 shares, for a total outstanding authorization of 7,500,000 shares. During fiscal 2016, we have repurchased 1,894,000 shares, at an average price of $65.24. Subsequent to March 31, 2016, we have purchased an additional 230,000 shares at an average price of $69.80. Including the shares purchased subsequent to year end, we have authorization to purchase an additional 5,376,000 shares. We did not repurchase any shares in the open market during the fiscal years ended March 31, 2015 and 2014.
Revenue Recognition –
Revenue from the sale of cement, gypsum wallboard, paperboard, frac sand, concrete and aggregates is recognized when title and ownership are transferred upon shipment to the customer. Fees for shipping and handling are recorded as revenue, while costs incurred for shipping and handling are recorded as expenses.
We classify amounts billed to customers for freight as revenues and freight costs as cost of goods sold, respectively, in the Consolidated Statements of Earnings. Approximately $139.5 million, $124.0 million and $113.1 million were classified as cost of goods sold in the years ended March 31, 2016, 2015 and 2014, respectively.
63
Other income (loss) includes lease and rental income, asset sale income, non-inventoried aggregates sales income, distribution center income and trucking income as well as other miscellaneous revenue items and costs which have not been allocated to a business segment.
Comprehensive Income/Losses –
As of March 31, 2016, we have an accumulated other comprehensive loss of $11.4 million, which is net of income taxes of $6.8 million, in connection with recognizing the difference between the fair value of the pension assets and the projected benefit obligation.
Consolidated Cash Flows – Supplemental Disclosures –
Interest payments made during the years ended March 31, 2016, 2015 and 2014 were $16.9 million, $15.1 million and $17.0 million, respectively.
We made net payments of $63.9 million, $78.3 million and $41.7 million for federal and state income taxes in the years ended March 31, 2016, 2015 and 2014, respectively.
Statements of Consolidated Earnings – Supplemental Disclosures –
Maintenance and repair expenses are included in each segment’s costs and expenses. We incurred $95.1 million, $86.7 million and $77.4 million in the years ended March 31, 2016, 2015 and 2014, respectively, which is included in Cost of Goods Sold on the Consolidated Statement of Earnings.
Selling, general and administrative expenses of the operating units are included in Cost of Goods Sold on the Consolidated Statements of Earnings. Corporate general and administrative (“G&A”) expenses include administration, financial, legal, employee benefits and other corporate activities and are shown separately in the consolidated statements of earnings. Corporate G&A also includes stock compensation expense. See Note (J), Stock Option Plans, for more information.
Total selling, general and administrative expenses for each of the periods are summarized as follows:
|
|
|
For the Years Ended March 31, |
|
|||||||||
|
|
|
2016 |
|
|
2015 |
|
|
2014 |
|
|||
|
|
|
(dollars in thousands) |
|
|||||||||
|
Operating Units Selling, G&A |
|
$ |
56,110 |
|
|
$ |
49,326 |
|
|
$ |
50,175 |
|
|
Corporate G&A |
|
|
37,193 |
|
|
|
30,751 |
|
|
|
24,552 |
|
|
|
|
$ |
93,303 |
|
|
$ |
80,077 |
|
|
$ |
74,727 |
|
Earnings Per Share –
|
|
|
For the Years Ended March 31, |
|
|||||||||
|
|
|
2016 |
|
|
2015 |
|
|
2014 |
|
|||
|
Weighted-Average Shares of Common Stock Outstanding |
|
|
49,471,157 |
|
|
|
49,604,249 |
|
|
|
49,090,750 |
|
|
Effect of Dilutive Shares: |
|
|
|
|
|
|
|
|
|
|
|
|
|
Assumed Exercise of Outstanding Dilutive Options |
|
|
1,146,807 |
|
|
|
1,350,556 |
|
|
|
1,574,491 |
|
|
Less Shares Repurchased from Proceeds of Assumed Exercised Options |
|
|
(768,886 |
) |
|
|
(868,636 |
) |
|
|
(1,032,359 |
) |
|
Restricted Stock Units |
|
|
221,751 |
|
|
|
286,074 |
|
|
|
306,283 |
|
|
Weighted-Average Common Stock and Dilutive Securities Outstanding |
|
|
50,070,829 |
|
|
|
50,372,243 |
|
|
|
49,939,165 |
|
The “Less Shares Repurchased from Proceeds of Assumed Exercised Options” line includes unearned compensation related to outstanding stock options.
64
There were 688,420, 285,267 and 146,696 stock options at an average exercise price of $80.51 per share, $82.72 per share and $65.12 per share that were excluded from the computation of diluted earnings per share for the years ended March 31, 2016, 2015 and 2014, respectively, because such inclusion would have been anti-dilutive.
Fair Value Measures –
Certain assets and liabilities are required to be recorded or disclosed at fair value. The estimated fair values of those assets and liabilities have been determined using market information and valuation methodologies. Changes in assumptions or estimation methods could affect the fair value estimates; however, we do not believe any such changes would have a material impact on our financial condition, results of operations or cash flows. There are three levels of inputs that may be used to measure fair value:
Level 1 – Quoted prices for identical assets and liabilities in active markets;
Level 2 – Quoted prices for similar assets and liabilities in active markets; quoted prices for identical or similar assets and liabilities in markets that are not active; or other inputs that are observable or can be corroborated by observable market data; and
Level 3 – Unobservable inputs that are supported by little or no market activity and that are significant to the fair value of the assets and liabilities. This includes certain pricing models, discounted cash flow methodologies and similar techniques that use significant unobservable inputs.
New Accounting Standards –
In May 2014, the Financial Accounting Standards Board (“FASB”) issued Accounting Standards Update (“ASU”) 2014-09, “Revenue from Contracts with Customers.” ASU 2014-09 supersedes the revenue recognition requirements in “Revenue Recognition (Topic 605),” and requires entities to recognize revenue in a way that depicts the transfer of promised goods or services to customers in an amount that reflects the consideration to which the entity expects to be entitled to in exchange for those goods or services. The standard will be effective for us in the first quarter of fiscal 2019, with early adoption not permitted. We will adopt the new standard using the modified retrospective approach, which requires the standard be applied only to the most current period presented, with the cumulative effect of initially applying the standard recognized at the date of initial application. We are currently evaluating the impact of this ASU.
In April 2015, the Financial Accounting Standards Board issued ASU 2015-03, “Interest-Imputation of Interest (Subtopic 830-30). This standard requires that discounts, premiums or debt issue costs related to borrowings be reported in the balance sheet as a direct reduction of the associated borrowing. The standard will be effective for us in the first quarter of fiscal 2017, and earlier application is permitted for financial statements that have not been previously issued. The impact of adopting this ASU is not expected to be material.
In November 2015, the FASB issued ASU 2015-17, "Balance Sheet Classification of Deferred Taxes", which requires entities to present all deferred tax assets and liabilities, as well as any related valuation allowances, as one net noncurrent asset or liability per tax jurisdiction. We early adopted the standard as of March 31, 2016 and have reclassified our current deferred tax assets to long-term. For the year ended March 31, 2015, our consolidated balance sheet has been retrospectively adjusted to conform with the new presentation, which resulted in a reclassification of approximately $2.3 million from current assets to long-term liabilities.
In July 2015, the Financial Accounting Standards Board issued ASU 2015-11, “Simplifying the Measurement of Inventory”. This standard requires inventory to be measured at the lower of cost or net realizable value, which is the estimated selling price in the ordinary course of business, less reasonably predictable costs of completion, disposal and transportation. The standard will be effective for us in the first quarter of fiscal 2017, with early adoption permitted at the beginning of an annual or interim reporting period. Prospective application is required. This impact of adopting this ASU is not expected to be material.
In September 2015, the Financial Accounting Standards Board issued ASU 2015-16, “Simplifying the Accounting for Measurement-Period Adjustments”. This standard eliminates the requirement to restate prior
65
period financial statements for measurement period adjustments. The cumulative impact of measurement period adjustments, including those in prior periods, will now be recognized in the reporting period in which the adjustment is made. The cumulative adjustment should be reflected in the financial statements within the respective line items impacted. Additionally, companies must present separately on the face of the income statement or disclose in the notes to the financial statements the portion of the adjustment recorded in the current period earnings by line item that would have been recorded in previous periods if the adjustment to the provisional amounts had been recognized on the acquisition date. This standard is effective for annual periods beginning after December 15, 2016 and interim periods beginning after December 31, 2017. Early adoption is permitted for all entities. We adopted this standard on October 1, 2015, with no material impact to our results of operations or financial position.
In March 2016, the Financial Accounting Standards Board, or FASB, issued Accounting Standards Update, or ASU, 2016-09, “Improvements to Employee Share-Based Payment Accounting,” which provides for simplification of certain aspects of employee share-based payment accounting, including income taxes, classification of awards as either equity or liabilities, and classification on the statement of cash flows. The standard will be effective for us in the first quarter of fiscal 2018 and will be applied either prospectively, retrospectively or using a modified retrospective transition approach depending on the area covered in this update. We are currently in the process of assessing the impact of the ASU on our consolidated financial statements and disclosures.
In February 2016, the FASB issued ASU 2016-02, “Leases”, which supersedes existing lease guidance to require lessees to recognize assets and liabilities on the balance sheet for the rights and obligations created by long-term leases and to disclose additional quantitative and qualitative information about leasing arrangements. The standard will be effective for us in the first quarter of fiscal 2020, and we will adopt using the modified retrospective approach. We are currently in the process of assessing the impact of the ASU on our consolidated financial statements and disclosures, as well as our internal lease accounting processes.
Acquisition and Litigation Expense
Acquisition and litigation expense consists primarily of expenses incurred during the CRS acquisition, as discussed in Footnote (B) to the Consolidated Financial Statements, and significant legal expenses incurred during litigation primarily involving the lawsuit against the Internal Revenue Service (“IRS”). See Note (H), Income Taxes, for more information about the outstanding lawsuit with the IRS.
(B) ACQUISITIONS
Skyway Acquisition
On July 10, 2015, we completed the acquisition of a 600,000 ton per year Granulated Ground Blast Furnace Slag (“Slag”) plant in South Chicago (the “Skyway Plant”) from Holcim (US) Inc. (the “Skyway Acquisition”). Among other applications, slag is used in conjunction with Portland cement to make a lower permeability concrete. The Skyway Plant purchases its primary raw material, slag, pursuant to a long term supply agreement with a third party.
The purchase price (the “Skyway Purchase Price”) for the Skyway Acquisition was approximately $29.9 million, net of $2.5 million to be refunded by the seller. We received $1.5 million of the refund in January 2016 and expect to receive the remaining $1.0 million on January 2017. We funded the payment of the Skyway Purchase Price and expenses incurred in connection with the Skyway Acquisition through operating cash flow and borrowings under our bank credit facility. We also assumed certain liabilities, including contractual obligations, related to the Skyway Plant. The purchase price was allocated as follows: $1.9 million to accounts and notes receivable; $2.3 million to inventories; $24.6 million to property, plant and equipment; $1.2 million to intangible assets; $1.4 million to goodwill; and $1.0 million to other assets.
66
CRS Acquisition
On November 14, 2014, Northern White Sand LLC (“NWS”), a wholly owned subsidiary of the Company, completed the acquisition (the “CRS Acquisition”) of the outstanding equity interest in CRS Holdco LLC, CRS Proppants LLC and Great Northern Sand LLC and related entities (collectively “CRS Proppants”). CRS Proppants is a supplier of frac sand to the energy industry, and its business currently consists of a frac sand mine in New Auburn, Wisconsin, and a trans-load network into Texas and southwest Oklahoma.
Purchase Price: The purchase price (the “CRS Purchase Price”) of the CRS Acquisition was approximately $236.1 million, including approximately $8.9 million of in-process capital expenditures paid as of the closing date. We funded the payment of the CRS Purchase Price at closing and expenses incurred in connection with the CRS Acquisition through borrowings under our bank credit facility, which was amended and restated on October 30, 2014. See Footnote (E) of the Notes to Consolidated Financial Statements for more information about the bank credit facility.
Recording of assets acquired and liabilities assumed: The transaction has been accounted for using the acquisition method of accounting which requires, among other things, that assets acquired and liabilities assumed be recognized at their fair values as of the acquisition date. The Company engaged a third-party to perform appraisal valuation to support the Company’s preliminary estimate of the fair value of certain assets acquired in the CRS Acquisition. Included in the assets acquired, and liabilities assumed, are two long-term sales agreements that included prepayments for future sales under the agreement, with such prepayments classified as liabilities. Additionally, one of the agreements is with a customer that is currently in bankruptcy, and is not expected to fulfill its obligation under the contract. We have been indemnified by the former owner against any loss related to this contract, and such indemnity has been valued at fair value and recorded as an asset at the date of the acquisition.
During the quarter ended December 31, 2015, we received the information related to the tax structure of the acquired entities, enabling us to finalize the percentage of carryover ownership in CRS Proppants. The application of the final carryover ownership percentage resulted in an increase in deferred tax liabilities and taxes payable of approximately $3.0 million and $1.5 million, respectively, and an increase in property and equipment of approximately $4.5 million.
The preparation of the valuation of the assets acquired and liabilities assumed in the CRS Acquisition requires the use of significant assumptions and estimates. Critical estimates include, but are not limited to, future expected cash flows, including projected revenues and expenses, and applicable discount rates. These estimates are based on assumptions that we believe to be reasonable. However, actual results may differ from these estimates.
67
The following table summarizes the allocation of the CRS Purchase Price to assets acquired and liabilities assumed as of the acquisition date:
|
Purchase price allocation at acquisition date (in thousands) |
|
As of November 14, 2014 |
|
|
|
Cash and cash equivalents |
|
$ |
219 |
|
|
Accounts Receivable |
|
|
14,640 |
|
|
Inventories |
|
|
9,627 |
|
|
Prepaid and Other Assets |
|
|
753 |
|
|
Property and Equipment |
|
|
197,238 |
|
|
Intangible Assets |
|
|
56,200 |
|
|
Indemnity under Sales Agreement |
|
|
14,810 |
|
|
Accounts Payable |
|
|
(8,428 |
) |
|
Obligations under Long-term Sales Agreements |
|
|
(28,131 |
) |
|
Asset Retirement Obligation |
|
|
(4,112 |
) |
|
Deferred Taxes |
|
|
(16,765 |
) |
|
Total Net Assets |
|
|
236,051 |
|
|
Goodwill |
|
|
— |
|
|
Total Estimated Purchase Price |
|
$ |
236,051 |
|
Intangible Assets: The following table is a summary of the fair value estimates of the identifiable intangible assets (in thousands) and their weighted-average useful lives:
|
|
|
Weighted Average Life |
|
|
Estimated Fair Value |
|
||
|
Customer Relationships |
|
|
4 |
|
|
|
56,000 |
|
|
Permits |
|
|
40 |
|
|
|
200 |
|
|
Total Intangible Assets |
|
|
|
|
|
$ |
56,200 |
|
Actual and pro forma impact of the CRS Acquisition: The following table presents the net sales and operating loss of CRS Proppants that has been included in our consolidated statement of earnings from November 14, 2014 through the end of the fiscal year:
|
|
|
For the Fiscal Year Ended March 31, |
|
|||||||
|
|
|
2016 |
|
|
2015 |
|
||||
|
|
|
(dollars in thousands) |
|
|||||||
|
Revenues |
|
$ |
44,365 |
|
|
$ |
28,035 |
|
||
|
Operating Loss |
|
$ |
41,137 |
|
|
$ |
5,002 |
|
||
|
|
|
|
|
|
||||||
Operating loss shown above for fiscal 2016 has been impacted by approximately $20.7 million, $35.0 million, $11.5 million and $0.5 million related to depreciation and amortization, impairments, write-down of raw sand inventory and the recording of acquired inventory at fair value, respectively. This amount was partially offset by a customer forfeiture of amounts prepaid for sand purchases totaling $10.7 million during the fourth quarter of fiscal 2016. During fiscal 2015, the operating loss shown above has been impacted by approximately $6.4 million of depreciation and amortization and approximately $1.5 million related to the impact of recording acquired inventory at fair value.
The unaudited pro forma results presented below include the effects of the CRS Acquisition as if it had been consummated as of April 1, 2013. The pro forma results include the amortization associated with an estimate for acquired intangible assets and interest expense associated with debt used to fund the CRS Acquisition and depreciation from the fair value adjustments for property and equipment. To better reflect the combined operating results, material nonrecurring charges directly related to the CRS Acquisition of $1.1 million have been excluded from pro forma net income for fiscal 2015.
68
|
|
|
For the Fiscal Year Ended March 31, |
|
|||||
|
|
|
2015 |
|
|
2014 |
|
||
|
|
|
(dollars in thousands) |
|
|||||
|
Revenues |
|
$ |
1,124,755 |
|
|
$ |
961,006 |
|
|
Net Income |
|
$ |
188,715 |
|
|
$ |
107,764 |
|
|
Earnings per share – basis |
|
$ |
3.80 |
|
|
$ |
2.20 |
|
|
Earnings per share - diluted |
|
$ |
3.75 |
|
|
$ |
2.16 |
|
The pro forma results do not include any anticipated synergies or other expected benefits of the CRS Acquisition. Accordingly, the unaudited pro forma results are not necessarily indicative of either future results of operations or results that might have been achieved had the CRS Acquisition been consummated as of April 1, 2013.
(C) Property, Plant and Equipment
Cost by major category and accumulated depreciation are summarized as follows:
|
|
|
March 31, |
|
|||||
|
|
|
2016 |
|
|
2015 |
|
||
|
|
|
(dollars in thousands) |
|
|||||
|
Land and Quarries |
|
$ |
384,688 |
|
|
$ |
345,991 |
|
|
Plants |
|
|
1,498,387 |
|
|
|
1,378,497 |
|
|
Buildings, Machinery and Equipment |
|
|
165,086 |
|
|
|
151,627 |
|
|
Construction in Progress |
|
|
24,615 |
|
|
|
86,100 |
|
|
|
|
|
2,072,776 |
|
|
|
1,962,215 |
|
|
Accumulated Depreciation |
|
|
(817,465 |
) |
|
|
(740,396 |
) |
|
|
|
$ |
1,255,311 |
|
|
$ |
1,221,819 |
|
(D) Accrued Expenses
Accrued expenses at March 31, 2016 and 2015 consist of the following:
|
|
|
March 31, |
|
|||||
|
|
|
2016 |
|
|
2015 |
|
||
|
|
|
(dollars in thousands) |
|
|||||
|
Payroll and Incentive Compensation |
|
$ |
19,956 |
|
|
$ |
19,082 |
|
|
Benefits |
|
|
10,663 |
|
|
|
9,951 |
|
|
Interest |
|
|
3,373 |
|
|
|
4,524 |
|
|
Property Taxes |
|
|
4,186 |
|
|
|
3,189 |
|
|
Power and Fuel |
|
|
1,390 |
|
|
|
1,619 |
|
|
Legal |
|
|
1,486 |
|
|
|
1,673 |
|
|
Sales and Use Tax |
|
|
549 |
|
|
|
523 |
|
|
Acquisition Related Expenses |
|
|
— |
|
|
|
1,355 |
|
|
Other |
|
|
4,372 |
|
|
|
4,914 |
|
|
|
|
$ |
45,975 |
|
|
$ |
46,830 |
|
69
Long-term debt consists of the following:
|
|
|
As of |
|
|||||
|
|
|
March 31, 2016 |
|
|
March 31, 2015 |
|
||
|
|
|
(dollars in thousands) |
|
|||||
|
Bank Credit Facility |
|
$ |
382,000 |
|
|
$ |
330,000 |
|
|
Senior Notes |
|
|
125,714 |
|
|
|
182,759 |
|
|
Total Debt |
|
|
507,714 |
|
|
|
512,759 |
|
|
Less: Current Portion of Long-term Debt |
|
|
(8,000 |
) |
|
|
(57,045 |
) |
|
Long-term Debt |
|
$ |
499,714 |
|
|
$ |
455,714 |
|
The weighted-average interest rate of Senior Notes was 5.9%, 5.8% and 5.8% during fiscal 2016, 2015 and 2014, respectively. The average interest rate of the Senior Notes was 5.99% and 5.80% at March 31, 2016 and 2015, respectively.
The weighted-average interest rate of bank debt borrowings during fiscal 2016, 2015 and 2014 was 1.6%, 1.5% and 1.9%, respectively. The interest rate on the bank debt was 1.8% and 1.6% at March 31, 2016 and 2015, respectively.
Our maturities of long-term debt during the next five fiscal years and thereafter are as follows:
|
Fiscal Year |
|
Amount |
|
|
|
2017 |
|
$ |
8,000 |
|
|
2018 |
|
|
81,214 |
|
|
2019 |
|
|
— |
|
|
2020 |
|
|
418,500 |
|
|
2021 |
|
|
— |
|
|
Thereafter |
|
|
— |
|
|
Total |
|
$ |
507,714 |
|
Senior Notes -
We entered into a Note Purchase Agreement on November 15, 2005 (the “2005 Note Purchase Agreement”) related to our sale of $200.0 million of senior, unsecured notes, designated as Series 2005A Senior Notes (the “Series 2005A Senior Notes”) in a private placement transaction. The Series 2005A Senior Notes, which are guaranteed by substantially all of our subsidiaries, were sold at par and issued in three tranches on November 15, 2005. At March 31, 2016, the amount outstanding for the remaining tranche is as follows:
|
|
|
Principal |
|
|
Maturity Date |
|
|
Interest Rate |
|
|||
|
Tranche C |
|
$ |
57.2 million |
|
|
|
November 15, 2017 |
|
|
|
5.48 |
% |
Interest for the remaining Notes is payable semi-annually on May 15 and November 15 of each year until all principal is paid for the above tranche.
We also entered into an additional Note Purchase Agreement on October 2, 2007 (the “2007 Note Purchase Agreement”) related to our sale of $200.0 million of senior, unsecured notes, designated as Series 2007A Senior Notes (the “Series 2007A Senior Notes”) in a private placement transaction. The Series 2007A Senior Notes, which are guaranteed by substantially all of our subsidiaries, were sold at par and issued in four tranches on October 2, 2007. At March 31, 2016, the amounts outstanding for each of the remaining tranches are as follows:
70
|
|
|
Principal |
|
|
Maturity Date |
|
|
Interest Rate |
|
|||
|
Tranche B |
|
$ |
8.0 million |
|
|
|
October 2, 2016 |
|
|
|
6.27 |
% |
|
Tranche C |
|
$ |
24.0 million |
|
|
|
October 2, 2017 |
|
|
|
6.36 |
% |
|
Tranche D |
|
$ |
36.5 million |
|
|
|
October 2, 2019 |
|
|
|
6.48 |
% |
Interest for each remaining tranche of Notes is payable semi-annually on April 2 and October 2 of each year until all principal is paid for the respective tranche.
Our obligations under the 2005 Note Purchase Agreement and the 2007 Note Purchase Agreement (collectively referred to as the “Note Purchase Agreements”) and the Series 2005A Senior Notes and the Series 2007A Senior Notes (collectively referred to as “the Senior Notes”) are equal in right of payment with all other senior, unsecured debt of the Company, including our debt under the Credit Facility. The Note Purchase Agreements contain customary restrictive covenants, including covenants that place limits on our ability to encumber our assets, to incur additional debt, to sell assets, or to merge or consolidate with third parties, as well as certain cross covenants with the Credit Facility. We were in compliance with all financial ratios and tests at March 31, 2016 and throughout the fiscal year.
Pursuant to a Subsidiary Guaranty Agreement, substantially all of our subsidiaries have guaranteed the punctual payment of all principal, interest, and Make-Whole Amounts (as defined in the Note Purchase Agreements) on the Senior Notes and the other payment and performance obligations of the Company contained in the Senior Notes and in the Note Purchase Agreements. We are permitted, at our option and without penalty, to prepay from time to time at least 10% of the original aggregate principal amount of the Senior Notes at 100% of the principal amount to be prepaid, together with interest accrued on such amount to be prepaid to the date of payment, plus a Make-Whole Amount. The Make-Whole Amount is computed by discounting the remaining scheduled payments of interest and principal of the Senior Notes being prepaid at a discount rate equal to the sum of 50 basis points and the yield to maturity of U.S. treasury securities having a maturity equal to the remaining average life of the Senior Notes being prepaid.
Bank Debt -
We have a $500.0 million revolving credit facility (the “Credit Facility”), including a swingline loan sublimit, which is scheduled to retire on October 30, 2019. Borrowings under the Credit Facility are guaranteed by substantially all of the Company’s subsidiaries. At the option of the Company, outstanding principal amounts on the Credit Facility bear interest at a variable rate equal to (i) LIBOR, plus an agreed margin (ranging from 100 to 225 basis points), which is to be established quarterly based upon the Company’s ratio of consolidated EBITDA, defined as earnings before interest, taxes, depreciation and amortization, to the Company’s consolidated indebtedness (the “Leverage Ratio”), or (ii) an alternative base rate which is the higher of (a) the prime rate or (b) the federal funds rate plus 1/2% per annum plus an agreed margin (ranging from 0 to 125 basis points). Interest payments are payable, in the case of loans bearing interest at a rate based on the federal funds rate, quarterly, or in the case of loans bearing interest at a rate based on LIBOR, at the end of the LIBOR advance periods, which can be a period of up to nine months at the option of the Company. The Company is also required to pay a commitment fee on unused available borrowings under the Credit Facility ranging from 10 to 35 basis points depending upon the Leverage Ratio. The Credit Facility contains customary covenants that restrict our ability to incur additional debt, encumber our assets, sell assets, make or enter into certain investments, loans or guaranties and enter into sale and leaseback arrangements. The Credit Facility also requires us to maintain a consolidated indebtedness ratio (calculated as consolidated indebtedness to consolidated earnings before interest, taxes, depreciation, amortization, certain transaction-related deductions and other non-cash deductions) of 3.5:1.0 or less and an interest coverage ratio (consolidated earnings before interest, taxes, depreciation, amortization, certain transaction-related deductions and other non-cash deductions to consolidated interest expense) of at least 2.5:1.0. We had $382.0 million of borrowings outstanding at March 31, 2016. Based on our Leverage Ratio, we had $109.0 million of available borrowings, net of the outstanding letters of credit, at March 31, 2016.
71
The Credit Facility has a $50.0 million letter of credit facility. Under the letter of credit facility, the Company pays a fee at a per annum rate equal to the applicable margin for Eurodollar loans in effect from time to time plus a one-time letter of credit fee in an amount equal to 0.125% of the initial stated amount. At March 31, 2016, we had $9.0 million of letters of credit outstanding.
We are leasing one of our cement plants from the city of Sugar Creek, Missouri. The city of Sugar Creek issued industrial revenue bonds to partly finance improvements to the cement plant. The lease payments due to the city of Sugar Creek under the cement plant lease, which was entered into upon the sale of the industrial revenue bonds, are equal in amount to the payments required to be made by the city of Sugar Creek to the holders of the industrial revenue bonds. Because we are the holder of all of the outstanding industrial revenue bonds, no debt is reflected on our financial statements in connection with our lease of the cement plant. At the conclusion of the lease in fiscal 2021, we have the option to purchase the cement plant for a nominal amount.
(F) Fair Value of Financial Instruments
The fair value of our senior notes has been estimated based upon our current incremental borrowing rates for similar types of borrowing arrangements. The fair value of our Senior Notes at March 31, 2016 is as follows:
|
|
|
Fair Value |
|
|
|
|
|
(dollars in thousands) |
|
|
|
Series 2005A Tranche C |
|
|
$ 60,271 |
|
|
Series 2007A Tranche B |
|
|
8,367 |
|
|
Series 2007A Tranche C |
|
|
25,742 |
|
|
Series 2007A Tranche D |
|
|
40,555 |
|
The estimated fair value of our long-term debt was based on quoted prices of similar debt instruments with similar terms that are publicly traded (level 2 input). The carrying values of cash and cash equivalents, accounts and notes receivable, accounts payable and accrued liabilities approximate their fair values at March 31, 2016 due to the short-term maturities of these assets and liabilities. The fair value of our Credit Facility also approximates its carrying value at March 31, 2016.
(G) Business Segments
Operating segments are defined as components of an enterprise that engage in business activities that earn revenues, incur expenses and prepare separate financial information that is evaluated regularly by our chief operating decision maker in order to allocate resources and assess performance. Operations related to the Skyway Acquisition will be included in the cement segment, as this plant has an identical customer base and is managed by the cement divison.
We operate in five business segments: Cement, Gypsum Wallboard, Recycled Paperboard, Oil and Gas Proppants and Concrete and Aggregates. These operations are conducted in the U.S. and include the mining of limestone and the manufacture, production, distribution and sale of portland cement and slag (a basic construction material which are the essential binding ingredients in concrete), the grinding of slag, the mining of gypsum and the manufacture and sale of gypsum wallboard, the manufacture and sale of recycled paperboard to the gypsum wallboard industry and other paperboard converters, the sale of readymix concrete and the mining and sale of aggregates (crushed stone, sand and gravel) and sand used in hydraulic fracturing (“frac sand”). The products that we manufacture, distribute and sell are basic materials with broad application as construction products, building materials, and basic materials used for oil and natural gas extraction. Our construction productions are used in residential, industrial, commercial and infrastructure construction and include cement, concrete and aggregates. Our building materials are sold into similar markets and include gypsum wallboard. Our basic materials used for oil and natural gas extraction include frac sand and oil well cement.
We operate six cement plants, one slag grinding facility, sixteen cement distribution terminals, five gypsum wallboard plants, including the plant idled in Bernalillo, N.M., a gypsum wallboard distribution center, a recycled
72
paperboard mill, seventeen readymix concrete batch plant locations, four aggregates processing plant locations, two frac sand processing facilities, three frac sand drying facilities and six frac sand trans-load locations. The principal markets for our cement products are Texas, northern Illinois (including Chicago), the central plains, the Rocky Mountains, northern Nevada, and northern California. Gypsum wallboard and recycled paperboard are distributed throughout the continental U.S, with the exception of the northeast. Concrete and aggregates are sold to local readymix producers and paving contractors in the Austin, Texas area, north of Sacramento, California and the greater Kansas City, Missouri area, while frac sand is currently sold into shale deposits across the United States.
We conduct one of our six cement plant operations, Texas Lehigh Cement Company LP in Buda, Texas, through a Joint Venture. For segment reporting purposes only, we proportionately consolidate our 50% share of the Joint Venture’s revenues and operating earnings, which is consistent with the way management reports the segments within the Company for making operating decisions and assessing performance.
We account for intersegment sales at market prices. The following table sets forth certain financial information relating to our operations by segment:
|
|
|
For the Years Ended March 31, |
|
|||||||||
|
|
|
2016 |
|
|
2015 |
|
|
2014 |
|
|||
|
|
|
(dollars in thousands) |
|
|||||||||
|
Revenues - |
|
|
|
|
|
|
|
|
|
|
|
|
|
Cement |
|
$ |
528,499 |
|
|
$ |
488,644 |
|
|
$ |
438,224 |
|
|
Gypsum Wallboard |
|
|
461,457 |
|
|
|
437,514 |
|
|
|
387,016 |
|
|
Paperboard |
|
|
149,192 |
|
|
|
142,690 |
|
|
|
130,178 |
|
|
Oil and Gas Proppants |
|
|
57,591 |
|
|
|
81,381 |
|
|
|
19,557 |
|
|
Concrete and Aggregates |
|
|
128,073 |
|
|
|
107,892 |
|
|
|
96,908 |
|
|
|
|
|
1,324,812 |
|
|
|
1,258,121 |
|
|
|
1,071,883 |
|
|
Less: Intersegment Revenues |
|
|
(73,862 |
) |
|
|
(65,533 |
) |
|
|
(62,094 |
) |
|
Less: Joint Venture Revenues |
|
|
(107,458 |
) |
|
|
(126,220 |
) |
|
|
(111,393 |
) |
|
|
|
$ |
1,143,492 |
|
|
$ |
1,066,368 |
|
|
$ |
898,396 |
|
|
|
|
For the Years Ended March 31, |
|
|||||||||
|
|
|
2016 |
|
|
2015 |
|
|
2014 |
|
|||
|
|
|
(dollars in thousands) |
|
|||||||||
|
Intersegment Revenues - |
|
|
|
|
|
|
|
|
|
|||
|
Cement |
|
$ |
13,939 |
|
|
$ |
9,598 |
|
|
$ |
8,952 |
|
|
Paperboard |
|
|
59,001 |
|
|
|
55,060 |
|
|
|
52,119 |
|
|
Concrete and Aggregates |
|
|
922 |
|
|
|
875 |
|
|
|
1,023 |
|
|
|
|
$ |
73,862 |
|
|
$ |
65,533 |
|
|
$ |
62,094 |
|
|
Cement Sales Volumes (M tons) - |
|
|
|
|
|
|
|
|
|
|
|
|
|
Wholly-Owned |
|
|
3,903 |
|
|
|
3,744 |
|
|
|
3,580 |
|
|
Joint Venture |
|
|
875 |
|
|
|
1,055 |
|
|
|
1,013 |
|
|
|
|
|
4,778 |
|
|
|
4,799 |
|
|
|
4,593 |
|
73
|
|
|
For the Years Ended March 31, |
|
|||||||||
|
|
|
2016 |
|
|
2015 |
|
|
2014 |
|
|||
|
|
|
(dollars in thousands) |
|
|||||||||
|
Operating Earnings - |
|
|
|
|
|
|
|
|
|
|
|
|
|
Cement |
$ |
|
137,854 |
|
|
$ |
117,527 |
|
|
$ |
89,486 |
|
|
Gypsum Wallboard |
|
|
159,352 |
|
|
|
145,871 |
|
|
|
114,852 |
|
|
Paperboard |
|
|
32,153 |
|
|
|
31,512 |
|
|
|
23,610 |
|
|
Oil and Gas Proppants |
|
|
(68,466 |
) |
|
|
(2,546 |
) |
|
|
(4,890 |
) |
|
Concrete and Aggregates |
|
|
9,807 |
|
|
|
6,736 |
|
|
|
212 |
|
|
Other, net |
|
|
2,328 |
|
|
|
3,201 |
|
|
|
1,368 |
|
|
Sub-Total |
|
|
273,028 |
|
|
|
302,301 |
|
|
|
224,638 |
|
|
Corporate General and Administrative |
|
|
(37,193 |
) |
|
|
(30,751 |
) |
|
|
(24,552 |
) |
|
Acquisition, Litigation and Other Expense |
|
|
— |
|
|
|
(6,880 |
) |
|
|
— |
|
|
Earnings Before Interest and Income Taxes |
|
|
235,835 |
|
|
|
264,670 |
|
|
|
200,086 |
|
|
Interest Expense, net |
|
|
(16,583 |
) |
|
|
(11,743 |
) |
|
|
(18,282 |
) |
|
Earnings Before Income Taxes |
|
$ |
219,252 |
|
|
$ |
252,927 |
|
|
$ |
181,804 |
|
|
Cement Operating Earnings - |
|
|
|
|
|
|
|
|
|
|
|
|
|
Wholly-Owned |
|
$ |
98,771 |
|
|
$ |
72,560 |
|
|
$ |
51,675 |
|
|
Joint Ventures |
|
|
39,083 |
|
|
|
44,967 |
|
|
|
37,811 |
|
|
|
|
$ |
137,854 |
|
|
$ |
117,527 |
|
|
$ |
89,486 |
|
|
Capital Expenditures - |
|
|
|
|
|
|
|
|
|
|
|
|
|
Cement |
|
$ |
20,262 |
|
|
$ |
27,086 |
|
|
$ |
12,226 |
|
|
Gypsum Wallboard |
|
|
4,832 |
|
|
|
7,129 |
|
|
|
4,825 |
|
|
Paperboard |
|
|
5,542 |
|
|
|
1,888 |
|
|
|
3,354 |
|
|
Oil and Gas Proppants |
|
|
40,144 |
|
|
|
61,484 |
|
|
|
34,264 |
|
|
Concrete and Aggregates |
|
|
18,783 |
|
|
|
13,851 |
|
|
|
4,572 |
|
|
Other, net |
|
|
— |
|
|
|
135 |
|
|
|
249 |
|
|
|
|
$ |
89,563 |
|
|
$ |
111,573 |
|
|
$ |
59,490 |
|
|
Depreciation , Depletion and Amortization - |
|
|
|
|
|
|
|
|
|
|
|
|
|
Cement |
|
$ |
33,400 |
|
|
$ |
31,839 |
|
|
$ |
31,829 |
|
|
Gypsum Wallboard |
|
|
19,988 |
|
|
|
20,092 |
|
|
|
20,981 |
|
|
Paperboard |
|
|
8,312 |
|
|
|
8,251 |
|
|
|
8,716 |
|
|
Oil and Gas Proppants |
|
|
27,227 |
|
|
|
8,839 |
|
|
|
1,707 |
|
|
Concrete and Aggregates |
|
|
6,260 |
|
|
|
5,533 |
|
|
|
5,205 |
|
|
Corporate and Other |
|
|
1,918 |
|
|
|
1,745 |
|
|
|
1,583 |
|
|
|
|
$ |
97,105 |
|
|
$ |
76,299 |
|
|
$ |
70,021 |
|
|
|
|
As of March 31, |
|
|||||||||
|
|
|
2016 |
|
|
2015 |
|
|
2014 |
|
|||
|
|
|
(dollars in thousands) |
|
|||||||||
|
Identifiable Assets |
|
|
|
|
|
|
|
|
|
|
|
|
|
Cement |
|
$ |
819,994 |
|
|
$ |
777,956 |
|
|
$ |
762,578 |
|
|
Gypsum Wallboard |
|
|
392,523 |
|
|
|
403,279 |
|
|
|
412,566 |
|
|
Paperboard |
|
|
127,371 |
|
|
|
123,519 |
|
|
|
125,045 |
|
|
Oil and Gas Proppants |
|
|
409,497 |
|
|
|
455,572 |
|
|
|
92,199 |
|
|
Concrete and Aggregates |
|
|
106,634 |
|
|
|
96,610 |
|
|
|
87,364 |
|
|
Other, net |
|
|
27,616 |
|
|
|
23,390 |
|
|
|
31,777 |
|
|
|
|
$ |
1,883,635 |
|
|
$ |
1,880,326 |
|
|
$ |
1,511,529 |
|
Segment operating earnings, including the proportionately consolidated 50% interest in the revenues and expenses of the Joint Venture, represent revenues less direct operating expenses, segment depreciation, and segment selling, general and administrative expenses. We account for intersegment sales at market prices. Corporate assets consist primarily of cash and cash equivalents, general office assets and miscellaneous other assets.
74
The basis used to disclose Identifiable Assets, Capital Expenditures and Depreciation, Depletion conforms with the equity method, and is similar to how we disclose these accounts in our Consolidated Balance Sheets and Consolidated Statements of Earnings.
The segment breakdown of goodwill at March 31, 2016 and 2015 is as follows:
|
|
|
For the Years Ended March 31, |
|
|||||
|
|
|
2016 |
|
|
2015 |
|
||
|
|
|
(dollars in thousands) |
|
|||||
|
Cement |
|
$ |
9,729 |
|
|
$ |
8,359 |
|
|
Gypsum Wallboard |
|
|
116,618 |
|
|
|
116,618 |
|
|
Paperboard |
|
|
7,538 |
|
|
|
7,538 |
|
|
|
|
$ |
133,885 |
|
|
$ |
132,515 |
|
(H) Income Taxes
The provision for income taxes includes the following components:
|
|
|
For the Years Ended March 31, |
|
|||||||||
|
|
|
2016 |
|
|
2015 |
|
|
2014 |
|
|||
|
|
|
(dollars in thousands) |
|
|||||||||
|
Current Provision (Benefit) - |
|
|
|
|
|
|
|
|
|
|
|
|
|
Federal |
|
$ |
64,256 |
|
|
$ |
62,424 |
|
|
$ |
49,604 |
|
|
State |
|
|
4,727 |
|
|
|
(2,155 |
) |
|
|
2,211 |
|
|
|
|
|
68,983 |
|
|
|
60,269 |
|
|
|
51,815 |
|
|
Deferred Provision (Benefit) - |
|
|
|
|
|
|
|
|
|
|
|
|
|
Federal |
|
|
(546 |
) |
|
|
(962 |
) |
|
|
7,691 |
|
|
State |
|
|
(1,777 |
) |
|
|
6,767 |
|
|
|
(1,945 |
) |
|
|
|
|
(2,323 |
) |
|
|
5,805 |
|
|
|
5,746 |
|
|
Provision for Income Taxes |
|
$ |
66,660 |
|
|
$ |
66,074 |
|
|
$ |
57,561 |
|
The effective tax rates vary from the federal statutory rates due to the following items:
|
|
|
For the Years Ended March 31, |
|
|||||||||
|
|
|
2016 |
|
|
2015 |
|
|
2014 |
|
|||
|
|
|
(dollars in thousands) |
|
|||||||||
|
Earnings Before Income Taxes |
|
$ |
219,252 |
|
|
$ |
252,927 |
|
|
$ |
181,804 |
|
|
Income Taxes at Statutory Rate |
|
$ |
76,738 |
|
|
$ |
88,524 |
|
|
$ |
63,631 |
|
|
Increases (Decreases) in Tax Resulting from - |
|
|
|
|
|
|
|
|
|
|
|
|
|
State Income Taxes, net |
|
|
1,166 |
|
|
|
4,582 |
|
|
|
173 |
|
|
Statutory Depletion in Excess of Cost |
|
|
(5,672 |
) |
|
|
(4,367 |
) |
|
|
(3,512 |
) |
|
Domestic Production Activities Deduction |
|
|
(6,302 |
) |
|
|
(6,853 |
) |
|
|
(3,453 |
) |
|
Meals and Entertainment Disallowance |
|
|
629 |
|
|
|
647 |
|
|
|
503 |
|
|
Penalties on Uncertain Tax Positions |
|
|
— |
|
|
|
— |
|
|
|
213 |
|
|
IRS Settlement |
|
|
— |
|
|
|
(16,559 |
) |
|
|
— |
|
|
Other |
|
|
101 |
|
|
|
100 |
|
|
|
6 |
|
|
Provision for Income Taxes |
|
$ |
66,660 |
|
|
$ |
66,074 |
|
|
$ |
57,561 |
|
|
Effective Tax Rate |
|
|
30% |
|
|
|
26% |
|
|
|
32 |
% |
75
The deferred income tax provision results from the following temporary differences in the recognition of revenues and expenses for tax and financial reporting purposes:
|
|
|
For the Years Ended March 31, |
|
|||||||||
|
|
|
2016 |
|
|
2015 |
|
|
2014 |
|
|||
|
|
|
(dollars in thousands) |
|
|||||||||
|
Excess Tax Depreciation and Amortization |
|
$ |
3,284 |
|
|
$ |
2,259 |
|
|
$ |
6,875 |
|
|
Bad Debts |
|
|
(1,340 |
) |
|
|
(142 |
) |
|
|
(224 |
) |
|
Uniform Capitalization |
|
|
(1,339 |
) |
|
|
1,296 |
|
|
|
(1,127 |
) |
|
Accrual Changes |
|
|
(1,298 |
) |
|
|
(611 |
) |
|
|
(1,075 |
) |
|
Uncertain Tax Position Accruals |
|
|
— |
|
|
|
— |
|
|
|
213 |
|
|
Prepaid Insurance |
|
|
(1,149 |
) |
|
|
(331 |
) |
|
|
424 |
|
|
State Income Taxes, net |
|
|
(1,155 |
) |
|
|
6,060 |
|
|
|
(1,319 |
) |
|
Reversal of Prepaid Sand Liability |
|
|
3,682 |
|
|
|
— |
|
|
|
— |
|
|
Long-term Incentive Compensation Plans |
|
|
(3,140 |
) |
|
|
(1,792 |
) |
|
|
(373 |
) |
|
Other |
|
|
132 |
|
|
|
(934 |
) |
|
|
1,033 |
|
|
|
|
$ |
(2,323 |
) |
|
$ |
5,805 |
|
|
$ |
5,746 |
|
Components of deferred income taxes are as follows:
|
|
|
March 31, |
|
|||||
|
|
|
2016 |
|
|
2015 |
|
||
|
|
|
(dollars in thousands) |
|
|||||
|
Items Giving Rise to Deferred Tax Liabilities - |
|
|
|
|
|
|
|
|
|
Excess Tax Depreciation and Amortization |
|
$ |
(157,260 |
) |
|
$ |
(153,045 |
) |
|
Depletion |
|
|
(21,911 |
) |
|
|
(18,374 |
) |
|
Repair Parts |
|
|
(2,446 |
) |
|
|
(3,376 |
) |
|
State Income Taxes, net |
|
|
(12,552 |
) |
|
|
(13,708 |
) |
|
Other |
|
|
(4,147 |
) |
|
|
(5,359 |
) |
|
Total Deferred Tax Liabilities |
|
$ |
(198,316 |
) |
|
$ |
(193,862 |
) |
|
Items Giving Rise to Deferred Tax Assets - |
|
|
|
|
|
|
|
|
|
Accrual Changes |
|
$ |
11,855 |
|
|
$ |
10,557 |
|
|
Bad Debts |
|
|
3,604 |
|
|
|
2,264 |
|
|
Uniform Capitalization |
|
|
2,174 |
|
|
|
835 |
|
|
Deferred Revenue |
|
|
700 |
|
|
|
4,382 |
|
|
Long-term Incentive Compensation Plan |
|
|
11,458 |
|
|
|
8,318 |
|
|
Other |
|
|
6,846 |
|
|
|
7,118 |
|
|
Total Deferred Tax Assets |
|
$ |
36,637 |
|
|
$ |
33,474 |
|
Deferred income taxes are classified in the consolidated balance sheet as follows:
|
|
|
March 31, |
|
|||||
|
|
|
2016 |
|
|
2015 |
|
||
|
|
|
(dollars in thousands) |
|
|||||
|
Deferred Income Taxes |
|
$ |
(161,679 |
) |
|
$ |
(160,388 |
) |
Uncertain tax position –
We are subject to audit examinations at federal, state and local levels by tax authorities in those jurisdictions who may challenge the treatment or reporting of any return item. The tax matters challenged by the tax authorities are typically complex; therefore, the ultimate outcome of these challenges is subject to uncertainty.
76
Reconciliation of the consolidated liability for gross unrecognized tax benefits, excluding interest, from April 1, 2013 to March 31, 2016, is as follows:
|
|
|
For the Years Ended March 31, |
|
|||||||||
|
|
|
2016 |
|
|
2015 |
|
|
2014 |
|
|||
|
|
|
(dollars in thousands) |
|
|||||||||
|
Balance at Beginning of Year |
|
$ |
— |
|
|
$ |
24,802 |
|
|
$ |
24,589 |
|
|
Increase related to prior tax positions |
|
|
— |
|
|
|
— |
|
|
|
213 |
|
|
Decrease related to prior tax positions |
|
|
— |
|
|
|
(24,802 |
) |
|
|
— |
|
|
Payments |
|
|
— |
|
|
|
— |
|
|
|
— |
|
|
|
|
$ |
— |
|
|
$ |
— |
|
|
$ |
24,802 |
|
We recognize penalties associated with uncertain tax positions as part of the tax provision, while interest associated with uncertain tax positions is included in interest expense. The following is a summary of the amounts of interest and penalties recognized in relation to our uncertain tax position:
|
|
|
For the Years Ended March 31, |
|
|||||||||
|
|
|
2016 |
|
|
2015 |
|
|
2014 |
|
|||
|
|
|
(dollars in thousands) |
|
|||||||||
|
Accrued interest recognized |
|
$ |
— |
|
|
$ |
(3,847 |
) |
|
$ |
641 |
|
|
Accrued penalties recognized |
|
$ |
— |
|
|
$ |
(6,475 |
) |
|
$ |
213 |
|
There was no accrued interest or penalties related to our uncertain tax position during the fiscal years ended March 31, 2016 and 2015. Accrued interest and penalties related to our uncertain tax positions totaled $4.4 million and $3.2 million, respectively, at March 31, 2014.
In May 2011, we filed a lawsuit against the Internal Revenue Service (“IRS”) in Federal District Court to recover all of the amounts paid to the IRS with respect to our uncertain tax position for 2001 to 2006. We reached an agreement with the IRS to settle this case, which was approved by the U.S. Department of Justice in January 2015. Under the terms of the settlement agreement, we dismissed our lawsuit seeking to recover taxes, interest and penalties paid, in exchange for the IRS conceding 40% of the penalties, plus related interest, to date. The impact from the settlement agreement was approximately $17 million, including state benefits, which was recorded as a reduction of income tax expense during the fourth quarter of fiscal 2015. The related interest refund of approximately $4.4 million was also recorded during the fourth quarter of fiscal 2015.
(I) Commitments and Contingencies
Our operations and properties are subject to extensive and changing federal, state and local laws, regulations and ordinances governing the protection of the environment, as well as laws relating to worker health and workplace safety. We carefully consider the requirements mandated by such laws and regulations and have procedures in place at all of our operating units to monitor compliance. Any matters which are identified as potential exposures under these laws and regulations are carefully reviewed by management to determine our potential liability. Although management is not aware of any exposures which require an accrual under generally accepted accounting principles, there can be no assurance that prior or future operations will not ultimately result in violations, claims or other liabilities associated with these regulations.
We have certain deductible limits under our workers’ compensation and liability insurance policies for which reserves are established based on the undiscounted estimated costs of known and anticipated claims. We have entered into standby letter of credit agreements relating to workers’ compensation and auto and general liability self-insurance. At March 31, 2016, we had contingent liabilities under these outstanding letters of credit of approximately $9.0 million.
We are currently contingently liable for performance under $14.6 million in performance bonds required by certain states and municipalities, and their related agencies. The bonds are principally for certain reclamation obligations and mining permits. We have indemnified the underwriting insurance company against any exposure
77
under the performance bonds. In our past experience, no material claims have been made against these financial instruments.
EPA Notice of Violation
On October 5, 2010, Region IX of the EPA issued a Notice of Violation and Finding of Violation (“NOV”) alleging violations by our subsidiary, Nevada Cement Company (“NCC”), of the Clean Air Act (“CAA”). The NOV alleges that NCC made certain physical changes to its facility in the 1990s without first obtaining permits required by the Prevention of Significant Deterioration requirements and Title V permit requirements of the CAA. The EPA also alleges that NCC has failed to submit to the EPA since 2002 certain reports required by the National Emissions Standard for Hazardous Air Pollutants General Provisions and the Portland Cement Manufacturing Industry Standards. On March 12, 2014, the EPA Region IX issued a second NOV to NCC. The second NOV is materially similar to the 2010 NOV except that it alleges violations of the new source performance standards (“NSPS”) for Portland cement plants. The NOVs state that the EPA may seek penalties although it does not propose or assess any specific level of penalties or specify what relief the EPA will seek for the alleged violations. NCC believes it has meritorious defenses to the allegations in the NOVs. NCC met with the EPA in December 2010, September 2012 and May 2014 to present its defenses and to discuss a resolution of the alleged violations. The EPA and NCC remain in discussions regarding the alleged violations. If a negotiated settlement cannot be reached, NCC intends to vigorously defend these matters in any enforcement action that may be pursued by the EPA. As a part of a settlement, or should NCC fail in its defense in any enforcement action, NCC could be required to make substantial capital expenditures to modify its facility and incur increased operating costs. NCC could also be required to pay significant civil penalties. Additionally, an enforcement action could take many years to resolve the underlying issues alleged in the NOV. We are currently unable to determine the final outcome of this matter or the impact of an unfavorable determination upon our financial position or results of operations.
Domestic Wallboard Antitrust Litigation
Since late December 2012, several purported class action lawsuits were filed in various United States District Courts, including the Eastern District of Pennsylvania, Western District of North Carolina and the Northern District of Illinois, against the Company’s subsidiary, American Gypsum Company LLC (“American Gypsum”), alleging that American Gypsum conspired with other wallboard manufacturers to fix the price for drywall sold in the United States in violation of federal antitrust laws and, in some cases related provisions of state law. The complaints allege that the defendant wallboard manufacturers conspired to increase prices through the announcement and implementation of coordinated price increases, output restrictions, and other restraints of trade, including the elimination of individual “job quote” pricing. In addition to American Gypsum, the defendants in these lawsuits include CertainTeed Corp., USG Corporation and United States Gypsum (together “USG”), New NGC, Inc., Lafarge North America, Temple Inland Inc. (“TIN”) and PABCO Building Products LLC. On April 8, 2013, the Judicial Panel on Multidistrict Litigation (“JPML”) transferred and consolidated all related cases to the Eastern District of Pennsylvania for coordinated pretrial proceedings.
On June 24, 2013, the direct and indirect purchaser plaintiffs filed consolidated amended class action complaints. The direct purchasers’ complaint added the Company as a defendant. The plaintiffs in the consolidated class action lawsuits bring claims on behalf of purported classes of direct or indirect purchasers of wallboard from January 1, 2012 to the present for unspecified monetary damages (including treble damages) and in some cases injunctive relief. On July 29, 2013, the Company and American Gypsum answered the complaints, denying all allegations that they conspired to increase the price of drywall and asserting affirmative defenses to the plaintiffs’ claims.
78
In 2014, USG and TIN entered into agreements with counsel representing the direct and indirect purchaser classes pursuant to which they agreed to settle all claims against them. On March 16, 2014, the court entered orders preliminarily approving USG and TIN’s settlements with the direct and indirect purchaser plaintiffs. Initial discovery in this litigation is complete. Following completion of the initial discovery, the Company and remaining co-defendants moved for summary judgement. On February 18, 2016, the court denied the Company’s motion for summary judgement. The Company’s motion for permission to appeal the summary judgement decision to the U.S. Court of Appeals for the Third Circuit is pending. Discovery related to this class certification is ongoing. At this stage we are unable to estimate the amount of any reasonably possible loss or range of reasonably possible losses. American Gypsum denies the allegations in these lawsuits and will vigorously defend itself against these claims.
On March 17, 2015, a group of homebuilders filed a complaint against the defendants, including American Gypsum, based upon the same conduct alleged in the consolidated class action complaints. On March 24, 2015, the JPML transferred this action to the multidistrict litigation already pending in the Eastern District of Pennsylvania. Following the transfer, the homebuilder plaintiffs filed two amended complaints, on December 14, 2015 and March 25, 2016. Discovery in this lawsuit is ongoing.
In June 2015, American Gypsum and an employee received grand jury subpoenas from the United States District Court for the Western District of North Carolina seeking information regarding an investigation of the gypsum drywall industry by the Antitrust Division of the Department of Justice. We believe the investigation, although a separate proceeding, is related to the same subject matter at issue in the litigation described above and we intend to fully cooperate with government officials. Given its preliminary nature, we are currently unable to determine the ultimate outcome of such investigation.
Other
In the ordinary course of business, we execute contracts involving indemnifications that are standard in the industry and indemnifications specific to a transaction such as the sale of a business. These indemnifications might include claims relating to any of the following: environmental and tax matters; intellectual property rights; governmental regulations and employment-related matters; customer, supplier, construction contractor and other commercial contractual relationships; and financial matters. While the maximum amount to which we may be exposed under such agreements cannot be estimated, it is the opinion of management that these indemnifications are not expected to have a material adverse effect on the Company’s consolidated financial position, results of operations or cash flows. We currently have no outstanding guarantees of third party debt.
We have certain forward purchase contracts, primarily for natural gas, that expire during calendar 2016. The contracts are for approximately 25% of our anticipated natural gas usage.
We have certain operating leases covering manufacturing, transportation and certain other facilities and equipment. Rental expense for fiscal years 2016, 2015 and 2014 totaled $10.3 million, $5.9 million and $3.2 million, respectively. Minimum annual rental commitments as of March 31, 2016, under noncancellable leases are set forth as follows (dollars in thousands):
|
Fiscal Year |
|
Amount |
|
|
|
2017 |
|
$ |
9,262 |
|
|
2018 |
|
$ |
7,321 |
|
|
2019 |
|
$ |
6,344 |
|
|
2020 |
|
$ |
4,083 |
|
|
2021 |
|
$ |
2,648 |
|
|
Thereafter |
|
$ |
8,935 |
|
79
On August 7, 2013 our stockholders approved the Eagle Materials Inc. Amended and Restated Incentive Plan (the “Plan”), which increased the shares we are authorized to issue as awards by 3,000,000 (1,500,000 of which may be stock awards). Under the terms of the Plan, we can issue equity awards, including stock options, restricted stock units (“RSUs”), restricted stock and stock appreciation rights to employees of the Company and members of the Board of Directors. Awards that were already outstanding prior to the approval of the Plan on August 7, 2013 remain outstanding. The Compensation Committee of our Board of Directors specifies the terms for grants of equity awards under the Plan.
Long-Term Compensation Plans –
Options. In June 2015, the Compensation Committee of the Board of Directors approved an equity award of an aggregate of 268,571 stock options pursuant to the Plan to certain officers and key employees that vest ratably over a three year period (the “Fiscal 2015 Employee Stock Option Grant”). The stock options have a term of ten years from the date of grant. In August 2015, we granted 17,051 stock options to members of the Board of Directors (the “Fiscal 2016 Board of Directors Grant”). Stock options granted under the Fiscal 2016 Board of Directors Grant vest immediately and can be exercised from the date of grant until their expiration on the tenth anniversary of the date of grant. The Fiscal 2016 Employee Stock Option Grant and Fiscal 2016 Board of Directors Grant were valued at the grant date using the Black-Scholes option pricing model.
All stock options issued during fiscal 2016 and 2015 were valued at the grant date using the Black-Scholes option pricing model. The weighted-average assumptions used in the Black-Scholes model to value the option awards in fiscal 2016 and 2015 are as follows:
|
|
|
2016 |
|
|
2015 |
|
||
|
Dividend Yield |
|
|
2.0 |
% |
|
|
2.0 |
% |
|
Expected Volatility |
|
|
36.5 |
% |
|
|
44.8 |
% |
|
Risk Free Interest Rate |
|
|
1.85 |
% |
|
|
1.86 |
% |
|
Expected Life |
|
|
6.0 years |
|
|
|
6.0 years |
|
Stock option expense for all outstanding stock option awards was approximately $7.5 million, $6.2 million and $5.3 million, for the years ended March 31, 2016, 2015 and 2014, respectively. At March 31, 2016, there was approximately $8.1 million of unrecognized compensation cost related to outstanding stock options which is expected to be recognized over a weighted-average period of 2.3 years.
The following table represents stock option activity for the years presented:
|
|
|
For the Years Ended March 31, |
|
|||||||||||||||||||||
|
|
|
2016 |
|
|
2015 |
|
|
2014 |
|
|||||||||||||||
|
|
|
Number of Shares |
|
|
Weighted Average Exercise Price |
|
|
Number of Shares |
|
|
Weighted Average Exercise Price |
|
|
Number of Shares |
|
|
Weighted Average Exercise Price |
|
||||||
|
Outstanding Options at Beginning of Year |
|
|
1,665,565 |
|
|
$ |
46.37 |
|
|
|
2,788,999 |
|
|
$ |
41.83 |
|
|
|
3,022,592 |
|
|
$ |
37.83 |
|
|
Granted |
|
|
318,572 |
|
|
$ |
79.83 |
|
|
|
297,151 |
|
|
$ |
86.41 |
|
|
|
256,989 |
|
|
$ |
68.00 |
|
|
Exercised |
|
|
(137,874 |
) |
|
$ |
27.58 |
|
|
|
(151,085 |
) |
|
$ |
32.38 |
|
|
|
(485,582 |
) |
|
$ |
29.72 |
|
|
Cancelled |
|
|
(28,500 |
) |
|
$ |
86.35 |
|
|
|
(1,269,500 |
) |
|
$ |
47.43 |
|
|
|
(5,000 |
) |
|
$ |
53.22 |
|
|
Outstanding Options at End of Year |
|
|
1,817,763 |
|
|
$ |
53.03 |
|
|
|
1,665,565 |
|
|
$ |
46.37 |
|
|
|
2,788,999 |
|
|
$ |
41.83 |
|
|
Options Exercisable at End of Year |
|
|
1,285,412 |
|
|
|
|
|
|
|
1,035,166 |
|
|
|
|
|
|
|
818,215 |
|
|
|
|
|
|
Weighted Average Fair Value of Options Granted during the Year |
|
|
|
|
|
$ |
24.27 |
|
|
|
|
|
|
$ |
32.31 |
|
|
|
|
|
|
$ |
26.35 |
|
80
The following table summarizes information about stock options outstanding at March 31, 2016:
|
|
|
Options Outstanding |
|
|
Options Exercisable |
|
||||||||||||||
|
Range of Exercise Prices |
|
Number of Shares Outstanding |
|
|
Weighted Average Remaining Contractual Life |
|
|
Weighted Average Exercise Price |
|
|
Number of Shares Outstanding |
|
|
Weighted Average Exercise Price |
|
|||||
|
$23.17 - $30.74 |
|
|
476,671 |
|
|
|
4.04 |
|
|
$ |
26.59 |
|
|
|
474,671 |
|
|
$ |
26.58 |
|
|
$33.08 - $37.95 |
|
|
465,933 |
|
|
|
5.98 |
|
|
$ |
33.91 |
|
|
|
445,933 |
|
|
$ |
33.87 |
|
|
$53.22 - $74.10 |
|
|
307,936 |
|
|
|
7.06 |
|
|
$ |
66.10 |
|
|
|
194,825 |
|
|
$ |
66.64 |
|
|
$79.73 - $93.56 |
|
|
567,223 |
|
|
|
8.75 |
|
|
$ |
83.87 |
|
|
|
169,983 |
|
|
$ |
86.67 |
|
|
|
|
|
1,817,763 |
|
|
|
6.52 |
|
|
$ |
53.03 |
|
|
|
1,285,412 |
|
|
$ |
43.12 |
|
At March 31, 2016, the aggregate intrinsic value for outstanding and exercisable options was approximately $31.0 million and $34.7 million, respectively. The total intrinsic value of options exercised during the fiscal year ended March 31, 2016 was approximately $6.7 million.
Restricted Stock. In June 2015, the Compensation Committee approved the granting of an aggregate of 93,782 shares of restricted stock to certain officers and key employees that will be earned if certain performance conditions are satisfied (the “Fiscal 2016 Employee Restricted Stock Award”). The performance criterion for the Fiscal 2016 Employee Restricted Stock Award is based upon the achievement of certain levels of return on equity, ranging from 12.5% to 17.5%, for the fiscal year ended March 31, 2016. All restricted shares will be earned if the return on equity is 17.5% or greater, and the percentage of shares earned will be reduced proportionately to approximately 75% if the return on equity is 12.5%. If the Company does not achieve a return on equity of at least 12.5%, all awards will be forfeited. If the criteria are met, the award may be reduced by the Compensation Committee based on individual performance goals. During fiscal 2016, the return on equity was approximately 82%; therefore, 79,326 shares under this reward were earned, with the remaining shares forfeited. Restriction on the shares will lapse ratably over five years. The first fifth lapsed on May 8, 2016, and the remaining restrictions lapsing on March 31, 2017 through 2020. The value of the Fiscal 2016 Employee Restricted Stock Award, net of estimated forfeitures, is being expensed over a five year period. In August 2015, we granted 15,139 shares of restricted stock to members of the Board of Directors (the “Board of Directors Fiscal 2016 Restricted Stock Award”). Awards issued under the Board of Directors Fiscal 2016 Restricted Stock Award do not fully vest until the retirement of each director, in accordance with the Company’s director retirement policy.
Expense related to restricted shares was $9.8 million, $6.7 million and $4.8 million in fiscal years ended March 31, 2016, 2015 and 2014, respectively. At March 31, 2016, there were approximately 400,000 shares with remaining restrictions for which $14.0 million of unearned compensation, net of estimated forfeitures, will be recognized over a weighted-average period of 1.8 years.
The number of shares available for future grants of stock options, restricted stock units, stock appreciation rights and restricted stock under the Plan was 4,565,892 at March 31, 2016. Of the available shares, up to 1,439,758 can be used for future restricted stock and restricted stock unit grants.
81
The following components are included in interest expense, net:
|
|
|
For the Years Ended March 31, |
|
|||||||||
|
|
|
2016 |
|
|
2015 |
|
|
2014 |
|
|||
|
|
|
(dollars in thousands) |
|
|||||||||
|
Interest Income |
|
$ |
(6 |
) |
|
$ |
(6 |
) |
|
$ |
(5 |
) |
|
Interest Expense |
|
|
15,891 |
|
|
|
14,768 |
|
|
|
16,751 |
|
|
Interest Expense (Income) – IRS |
|
|
— |
|
|
|
(3,847 |
) |
|
|
641 |
|
|
Other Expenses |
|
|
698 |
|
|
|
828 |
|
|
|
895 |
|
|
Interest Expense, net |
|
$ |
16,583 |
|
|
$ |
11,743 |
|
|
$ |
18,282 |
|
Interest income includes interest on investments of excess cash. Components of interest expense include interest associated with the Senior Notes, Credit Facility and commitment fees based on the unused portion of the Credit Facility. Other expenses include amortization of debt issuance costs, and bank credit facility costs.
Interest expense (income) – IRS relates to interest accrued on our unrecognized tax benefits, primarily related to the Republic Asset Acquisition. As noted in Footnote (H) of the Notes to Consolidated Financial Statements, our settlement with the IRS was finalized in January 2015. As a result of the settlement, we received approximately $4.4 million of interest related to penalties paid to the IRS related to the Republic Asset Acquisition during fiscal 2015.
(L) Pension and Profit Sharing Plans
We have several defined benefit and defined contribution retirement plans which together cover substantially all of our employees. Benefits paid under the defined benefit plans covering certain hourly employees are based on years of service and the employee’s qualifying compensation over the last few years of employment. Our funding policy is to generally contribute amounts that are deductible for income tax purposes. The annual measurement date is March 31 for the benefit obligations, fair value of plan assets and the funded status of the defined benefit plans.
82
The following table provides a reconciliation of the obligations and fair values of plan assets for all of our defined benefit plans over the two year period ended March 31, 2016 and a statement of the funded status as of March 31, 2016 and 2015:
|
|
|
For the Years Ended March 31, |
|
|||||
|
|
|
2016 |
|
|
2015 |
|
||
|
|
|
(dollars in thousands) |
|
|||||
|
Reconciliation of Benefit Obligations - |
|
|
|
|
|
|
|
|
|
Benefit Obligation at April 1, |
$ |
|
41,791 |
|
|
$ |
29,892 |
|
|
Service Cost - Benefits Earned During the Period |
|
|
1,039 |
|
|
|
874 |
|
|
Interest Cost on Projected Benefit Obligation |
|
|
1,525 |
|
|
|
1,278 |
|
|
Amendments |
|
|
— |
|
|
|
805 |
|
|
Actuarial (Gain) Loss |
|
|
(1,146 |
) |
|
|
9,823 |
|
|
Benefits Paid |
|
|
(928 |
) |
|
|
(881 |
) |
|
Benefit Obligation at March 31, |
|
$ |
42,281 |
|
|
$ |
41,791 |
|
|
Reconciliation of Fair Value of Plan Assets - |
|
|
|
|
|
|
|
|
|
Fair Value of Plan Assets at April 1, |
|
$ |
22,055 |
|
|
$ |
21,189 |
|
|
Actual Return on Plan Assets |
|
|
(537 |
) |
|
|
937 |
|
|
Employer Contributions |
|
|
834 |
|
|
|
810 |
|
|
Benefits Paid |
|
|
(928 |
) |
|
|
(881 |
) |
|
Fair Value of Plans at March 31, |
|
|
21,424 |
|
|
|
22,055 |
|
|
Funded Status - |
|
|
|
|
|
|
|
|
|
Unfunded Status at March 31, |
|
$ |
(20,857 |
) |
|
$ |
(19,736 |
) |
|
Amounts Recognized in the Balance Sheet Consist of - |
|
|
|
|
|
|
|
|
|
Accrued Benefit Liability |
|
$ |
(20,857 |
) |
|
$ |
(19,736 |
) |
|
Accumulated Other Comprehensive Losses: |
|
|
|
|
|
|
|
|
|
Net Actuarial Loss |
|
|
17,746 |
|
|
|
18,376 |
|
|
Prior Service Cost |
|
|
509 |
|
|
|
809 |
|
|
Accumulated Other Comprehensive Losses |
|
$ |
18,255 |
|
|
$ |
19,185 |
|
|
Tax impact |
|
|
(6,846 |
) |
|
|
(7,118 |
) |
|
Accumulated Other Comprehensive Losses, net of tax |
|
$ |
11,409 |
|
|
$ |
12,067 |
|
Information for pension plans with an accumulated benefit obligation in excess of plan assets:
|
|
|
March 31, |
|
|||||
|
|
|
2016 |
|
|
2015 |
|
||
|
|
|
(dollars in thousands) |
|
|||||
|
Projected Benefit Obligation |
|
$ |
42,281 |
|
|
$ |
41,791 |
|
|
Accumulated Benefit Obligation |
|
$ |
42,236 |
|
|
$ |
41,790 |
|
|
Fair Value of Plan Assets |
|
$ |
21,424 |
|
|
$ |
22,055 |
|
Net periodic pension cost for the fiscal years ended March 31, 2016, 2015 and 2014, included the following components:
|
|
|
For the Years Ended March 31, |
|
|||||||||
|
|
|
2016 |
|
|
2015 |
|
|
2014 |
|
|||
|
|
|
(dollars in thousands) |
|
|||||||||
|
Service Cost - Benefits Earned During the Period |
|
$ |
1,039 |
|
|
$ |
874 |
|
|
$ |
1,129 |
|
|
Interest Cost of Projected Benefit Obligation |
|
|
1,525 |
|
|
|
1,278 |
|
|
|
1,222 |
|
|
Expected Return on Plan Assets |
|
|
(1,751 |
) |
|
|
(1,680 |
) |
|
|
(1,506 |
) |
|
Recognized Net Actuarial Loss |
|
|
300 |
|
|
|
609 |
|
|
|
921 |
|
|
Amortization of Prior-Service Cost |
|
|
1,773 |
|
|
|
11 |
|
|
|
11 |
|
|
Net Periodic Pension Cost |
|
$ |
2,886 |
|
|
$ |
1,092 |
|
|
$ |
1,777 |
|
83
We amended one of our pension plans during March 2015, which increased our prior service cost by approximately $0.8 million. This amount is included in other comprehensive income and will be recognized in our statement of earnings as pension expense over the next three fiscal years.
Expected benefit payments over the next five years, and the following five years under the pension plans are expected to be as follows (in thousands):
|
Fiscal Years |
|
Total |
|
|
|
2017 |
|
$ |
1,320 |
|
|
2018 |
|
$ |
1,396 |
|
|
2019 |
|
$ |
1,488 |
|
|
2020 |
|
$ |
1,611 |
|
|
2021 |
|
$ |
1,737 |
|
|
2022-2026 |
|
$ |
10,524 |
|
The following table sets forth the assumptions used in the actuarial calculations of the present value of net periodic benefit cost and benefit obligations:
|
|
|
March 31, |
|
||||||||||||||
|
|
|
2016 |
|
|
2015 |
|
|
2014 |
|
||||||||
|
Net Periodic Benefit Costs - |
|
|
|
|
|
|
|
|
|
|
|
|
|||||
|
Discount Rate |
|
|
3.70 |
|
% |
|
4.41 |
% |
|
|
4.20 |
% |
|||||
|
Expected Return on Plan Assets |
|
|
8.00 |
|
% |
|
8.00 |
% |
|
|
8.00 |
% |
|||||
|
Rate of Compensation Increase |
|
|
3.50 |
|
% |
|
3.50 |
% |
|
|
3.50 |
% |
|||||
|
|
|
March 31, |
|
|||||
|
|
|
2016 |
|
|
2015 |
|
||
|
Benefit Obligations - |
|
|
|
|
|
|
|
|
|
Discount Rate |
|
|
3.83% |
|
|
|
3.70 |
% |
|
Rate of Compensation Increase |
|
|
3.50% |
|
|
|
3.50 |
% |
The expected long-term rate of return on plan assets is an assumption reflecting the anticipated weighted-average rate of earnings on the portfolio over the long-term. To arrive at this rate, we developed estimates of the key components underlying capital asset returns including: market-based estimates of inflation, real risk-free rates of return, yield curve structure, credit risk premiums and equity risk premiums. As appropriate, these components were used to develop benchmark estimates of the expected long-term management approach employed by us, and a return premium was added to the weighted-average benchmark portfolio return.
The pension plans’ approximate weighted-average asset allocation at March 31, 2016 and 2015 and the range of target allocation are as follows:
|
|
|
Range of Target Allocation |
|
|
Percentage of Plan Assets at March 31, |
|
||||||
|
|
|
|
|
|
||||||||
|
|
|
|
|
2016 |
|
|
2015 |
|
||||
|
Asset Category - |
|
|
|
|
|
|
|
|
|
|
|
|
|
Equity Securities |
|
|
40 – 60 |
% |
|
|
66% |
|
|
|
61% |
|
|
Debt Securities |
|
|
35 – 60 |
% |
|
|
33% |
|
|
|
36% |
|
|
Other |
|
|
0 – 5 |
% |
|
|
1% |
|
|
|
3% |
|
|
Total |
|
|
|
|
|
|
100% |
|
|
|
100% |
|
Our pension investment strategies have been developed as part of a comprehensive asset/liability management process that considers the interaction between both the assets and liabilities of the plan. These strategies consider not only the expected risk and returns on plan assets, but also the detailed actuarial projections of liabilities as well as plan-level objectives such as projected contributions, expense and funded status.
The principal pension investment strategies include asset allocation and active asset management. The range of target asset allocations have been determined after giving consideration to the expected returns of each asset
84
class, the expected variability or volatility of the asset class returns over time, and the complementary nature or correlation of the asset classes within the portfolio. We also employ an active management approach for the portfolio. Each asset class is managed by one or more external money managers with the objective of generating returns, net of management fees that exceed market-based benchmarks. None of the plans hold any EXP stock.
Based on our current actuarial estimates, we anticipate making contributions ranging from approximately $0.5 million to $1.0 million to our defined benefit plans for fiscal year 2017.
The fair values of our defined benefit plans’ consolidated assets by category as of March 31, 2016 and 2015 were as follows:
|
|
|
March 31, |
|
|||||
|
|
|
2016 |
|
|
2015 |
|
||
|
|
|
(dollars in thousands) |
|
|||||
|
Equity Securities |
|
$ |
14,083 |
|
|
$ |
13,510 |
|
|
Fixed Income Securities |
|
|
7,047 |
|
|
|
7,985 |
|
|
Real Estate Funds |
|
|
129 |
|
|
|
133 |
|
|
Commodity Linked Funds |
|
|
50 |
|
|
|
124 |
|
|
Cash Equivalents |
|
|
115 |
|
|
|
303 |
|
|
Total |
|
$ |
21,424 |
|
|
$ |
22,055 |
|
The fair values of our defined benefit plans’ consolidated assets were determined using the fair value hierarchy of inputs described in Note (A).
The fair values by category of inputs as of March 31, 2016 were as follows:
|
Asset Categories |
|
Quoted Prices in Active Markets for Identical Assets (Level 1) |
|
|
Significant Other Observable Inputs (Level 2) |
|
|
Significant Unobservable Inputs (Level 3) |
|
|
Total |
|
||||
|
|
|
(dollars in thousands) |
|
|||||||||||||
|
Equity Securities |
|
$ |
— |
|
|
$ |
14,083 |
|
|
$ |
— |
|
|
$ |
14,083 |
|
|
Fixed Income Securities |
|
|
— |
|
|
|
7,047 |
|
|
|
— |
|
|
|
7,047 |
|
|
Real Estate Funds |
|
|
— |
|
|
|
129 |
|
|
|
— |
|
|
|
129 |
|
|
Commodity Linked Funds |
|
|
— |
|
|
|
50 |
|
|
|
— |
|
|
|
50 |
|
|
Cash Equivalents |
|
|
115 |
|
|
|
— |
|
|
|
— |
|
|
|
115 |
|
|
|
|
$ |
115 |
|
|
$ |
21,309 |
|
|
$ |
— |
|
|
$ |
21,424 |
|
The fair values by category of inputs as of March 31, 2015 were as follows:
|
Asset Categories |
|
Quoted Prices in Active Markets for Identical Assets (Level 1) |
|
|
Significant Other Observable Inputs (Level 2) |
|
|
Significant Unobservable Inputs (Level 3) |
|
|
|
Total |
|
|||
|
|
|
(dollars in thousands) |
|
|||||||||||||
|
Equity Securities |
|
$ |
— |
|
|
$ |
13,510 |
|
|
$ |
— |
|
|
$ |
13,510 |
|
|
Fixed Income Securities |
|
|
— |
|
|
|
7,985 |
|
|
|
— |
|
|
|
7,985 |
|
|
Real Estate Funds |
|
|
— |
|
|
|
133 |
|
|
|
— |
|
|
|
133 |
|
|
Commodity Linked Funds |
|
|
— |
|
|
|
124 |
|
|
|
— |
|
|
|
124 |
|
|
Cash Equivalents |
|
|
303 |
|
|
|
— |
|
|
|
— |
|
|
|
303 |
|
|
|
|
$ |
303 |
|
|
$ |
21,752 |
|
|
$ |
— |
|
|
$ |
22,055 |
|
Equity securities consist of funds that are not actively traded. These funds are maintained by an investment manager and are primarily invested in indexes. The remaining funds, excluding cash, primarily consist of investments in institutional funds.
85
We also provide profit sharing plans, which cover substantially all salaried and certain hourly employees. The profit sharing plan is a defined contribution plan funded by employer discretionary contributions and also allows employees to contribute a certain percentage of their base annual salary. Employees are fully vested to the extent of their contributions and become fully vested in any Company contributions over a six year period for salaried employees and a three year period for hourly employees. Costs relating to the employer discretionary contributions for our contribution plan totaled $6.2 million, $5.3 million and $4.5 million in fiscal years 2016, 2015 and 2014, respectively.
Employees who became employed by us as a result of a previous transaction are provided benefits substantially comparable to those provided under the seller’s benefit plans. These plans included the seller’s 401(k) plan which included employer matching percentages for hourly employees. As a result, we made matching contributions to the hourly profit sharing plan totaling $0.3 million, $0.2 million and $0.2 million for these employees during fiscal years 2016, 2015 and 2014, respectively.
Approximately sixty of our employees belong to five different multi-employer plans. The collective bargaining agreements for the employees who participate in the multi-employer plans expire in March 2017. Our expense related to these plans was approximately $1.3 million, $1.0 million and $0.2 million during fiscal years 2016, 2015 and 2014, respectively. We anticipate the total expense in fiscal 2017 related to these plans will be approximately $1.3 million.
(M) Quarterly Results (unaudited)
|
|
|
For the Years Ended March 31, |
|
|||||
|
|
|
2016 |
|
|
2015 |
|
||
|
|
|
(dollars in thousands, except per share data) |
|
|||||
|
First Quarter - |
|
|
|
|
|
|
|
|
|
Revenues |
|
$ |
284,963 |
|
|
$ |
266,251 |
|
|
Gross Profit |
|
|
61,097 |
|
|
|
56,401 |
|
|
Earnings Before Income Taxes |
|
|
55,885 |
|
|
|
55,786 |
|
|
Net Earnings |
|
|
37,762 |
|
|
|
37,710 |
|
|
Diluted Earnings Per Share |
|
$ |
0.75 |
|
|
$ |
0.75 |
|
|
Second Quarter - |
|
|
|
|
|
|
|
|
|
Revenues |
|
$ |
328,988 |
|
|
$ |
284,808 |
|
|
Gross Profit |
|
|
44,294 |
|
|
|
75,061 |
|
|
Earnings Before Income Taxes |
|
|
42,840 |
|
|
|
74,577 |
|
|
Net Earnings |
|
|
29,819 |
|
|
|
50,319 |
|
|
Diluted Earnings Per Share |
|
$ |
0.59 |
|
|
$ |
1.00 |
|
|
Third Quarter - |
|
|
|
|
|
|
|
|
|
Revenues |
|
$ |
277,409 |
|
|
$ |
291,529 |
|
|
Gross Profit |
|
|
68,865 |
|
|
|
79,149 |
|
|
Earnings Before Income Taxes |
|
|
68,205 |
|
|
|
77,866 |
|
|
Net Earnings |
|
|
45,848 |
|
|
|
52,030 |
|
|
Diluted Earnings Per Share |
|
$ |
0.92 |
|
|
$ |
1.03 |
|
|
Fourth Quarter - |
|
|
|
|
|
|
|
|
|
Revenues |
|
$ |
252,132 |
|
|
$ |
223,780 |
|
|
Gross Profit |
|
|
57,361 |
|
|
|
43,522 |
|
|
Earnings Before Income Taxes |
|
|
52,322 |
|
|
|
44,698 |
|
|
Net Earnings |
|
|
39,163 |
|
|
|
46,794 |
|
|
Diluted Earnings Per Share |
|
$ |
0.80 |
|
|
$ |
0.93 |
|
86
The fourth quarter of fiscal 2016 was adversely impacted approximately $6.6 million, $4.1 million and $1.0 million related to impairment of customer contract intangibles, write-down of raw sand inventory and an increase in the bad debt reserve, respectively. This amount was partially offset by a customer forfeiture of amounts prepaid for sand purchases totaling $10.7 million during the fourth quarter of fiscal 2016. See the Intangible Assets discussion in Footnote (B) of the Notes to Consolidated Financial Statements for more information about the impairment and customer forfeiture of prepaid sand.
The fourth quarter of fiscal 2015 was favorably impacted by the settlement agreement with the IRS. As a result of the settlement agreement, we recorded an income tax benefit of approximately $17 million, including state benefits. The related interest of approximately $4.4 million was also recorded during the fourth quarter of fiscal 2015. The fourth quarter of fiscal 2015 was adversely impacted by certain acquisition related expenses aimed at growing our construction products business and administrative costs related to the settlement of our lawsuit against the IRS. The total impact of these expenses was approximately $4.1 million.
87
Report of Independent Registered Public Accounting Firm
The Board of Directors and Stockholders of
Eagle Materials Inc.
We have audited the accompanying consolidated balance sheets of Eagle Materials Inc. and Subsidiaries as of March 31, 2016 and 2015, and the related consolidated statements of earnings, comprehensive earnings, cash flows and stockholders’ equity for each of the three years in the period ended March 31, 2016. These financial statements are the responsibility of the Company’s management. Our responsibility is to express an opinion on these financial statements based on our audits.
We conducted our audits in accordance with the standards of the Public Company Accounting Oversight Board (United States). Those standards require that we plan and perform the audit to obtain reasonable assurance about whether the financial statements are free of material misstatement. An audit includes examining, on a test basis, evidence supporting the amounts and disclosures in the financial statements. An audit also includes assessing the accounting principles used and significant estimates made by management, as well as evaluating the overall financial statement presentation. We believe that our audits provide a reasonable basis for our opinion.
In our opinion, the financial statements referred to above present fairly, in all material respects, the consolidated financial position of Eagle Materials Inc. and Subsidiaries at March 31, 2016 and 2015, and the consolidated results of their operations and their cash flows for each of the three years in the period ended March 31, 2016, in conformity with U.S. generally accepted accounting principles.
We also have audited, in accordance with the standards of the Public Company Accounting Oversight Board (United States), Eagle Materials Inc. and Subsidiaries internal control over financial reporting as of March 31, 2016, based on criteria established in Internal Control - Integrated Framework issued by the Committee of Sponsoring Organizations of the Treadway Commission (2013 framework) and our report dated May 25, 2016 expressed an unqualified opinion thereon.
/s/ ERNST & YOUNG LLP
Dallas, Texas
May 25, 2016
88
Texas Lehigh Cement Company LP
(dollars in thousands)
|
|
|
Year ended December 31, |
|
|||||||||
|
|
|
2015 |
|
|
2014 |
|
|
2013 |
|
|||
|
Net sales |
|
$ |
215,624 |
|
|
$ |
253,375 |
|
|
$ |
207,784 |
|
|
Cost of goods sold |
|
|
128,036 |
|
|
|
158,878 |
|
|
|
131,668 |
|
|
Gross margin |
|
|
87,588 |
|
|
|
94,497 |
|
|
|
76,116 |
|
|
Selling, general, and administrative expenses |
|
|
4,809 |
|
|
|
4,369 |
|
|
|
4,210 |
|
|
Operating income |
|
|
82,779 |
|
|
|
90,128 |
|
|
|
71,906 |
|
|
Interest and other (expense) income |
|
|
(665 |
) |
|
|
(98 |
) |
|
|
639 |
|
|
Equity in earnings of joint venture |
|
|
1 |
|
|
|
1 |
|
|
|
1 |
|
|
Texas margin tax |
|
|
(743 |
) |
|
|
(823 |
) |
|
|
(710 |
) |
|
Net income |
|
$ |
81,372 |
|
|
$ |
89,208 |
|
|
$ |
71,836 |
|
See notes to financial statements.
89
Texas Lehigh Cement Company LP
Statements of Comprehensive Earnings
(dollars in thousands)
|
|
|
Year ended December 31, |
|
|||||||||
|
|
|
2015 |
|
|
2014 |
|
|
2013 |
|
|||
|
Net Income |
|
$ |
81,372 |
|
|
$ |
89,208 |
|
|
$ |
71,836 |
|
|
Net actuarial gains (losses) of defined benefit plans: |
|
|
|
|
|
|
|
|
|
|
|
|
|
Unrealized gain (loss) during the period |
|
|
583 |
|
|
|
(1,820 |
) |
|
|
1,420 |
|
|
Amortization of net actuarial loss |
|
|
277 |
|
|
|
150 |
|
|
|
348 |
|
|
Comprehensive income |
|
$ |
82,232 |
|
|
$ |
87,538 |
|
|
$ |
73,604 |
|
See notes to financial statements.
90
Texas Lehigh Cement Company LP
(dollars in thousands)
|
|
|
December 31, |
|
|||||
|
|
|
2015 |
|
|
2014 |
|
||
|
ASSETS |
|
|
|
|
|
|
|
|
|
Current assets: |
|
|
|
|
|
|
|
|
|
Cash and cash equivalents |
|
$ |
420 |
|
|
$ |
698 |
|
|
Receivables: |
|
|
|
|
|
|
|
|
|
Accounts and notes receivable, net of allowance for doubtful accounts and discounts of $1,438 and $1,492 |
|
|
31,046 |
|
|
|
38,986 |
|
|
Inventories: |
|
|
|
|
|
|
|
|
|
Cement |
|
|
3,645 |
|
|
|
3,544 |
|
|
Raw materials and materials-in-process |
|
|
15,769 |
|
|
|
8,126 |
|
|
Repair parts and supplies |
|
|
20,937 |
|
|
|
15,730 |
|
|
Total inventories |
|
|
40,351 |
|
|
|
27,400 |
|
|
Prepaid assets |
|
|
1,223 |
|
|
|
1,128 |
|
|
Total current assets |
|
|
73,040 |
|
|
|
68,212 |
|
|
Property, plant and equipment: |
|
|
|
|
|
|
|
|
|
Land, including quarry |
|
|
3,752 |
|
|
|
3,752 |
|
|
Cement plant |
|
|
125,715 |
|
|
|
122,566 |
|
|
Mobile equipment and other |
|
|
5,708 |
|
|
|
5,743 |
|
|
Furniture and fixtures |
|
|
718 |
|
|
|
709 |
|
|
Construction-in-progress |
|
|
77 |
|
|
|
2,515 |
|
|
Total property, plant and equipment |
|
|
135,970 |
|
|
|
135,285 |
|
|
Less accumulated depreciation and depletion |
|
|
(113,074 |
) |
|
|
(110,850 |
) |
|
Property, plant and equipment, net |
|
|
22,896 |
|
|
|
24,435 |
|
|
Investment in joint venture |
|
|
18,796 |
|
|
|
18,795 |
|
|
Total assets |
|
$ |
114,732 |
|
|
$ |
111,442 |
|
|
LIABILITIES AND PARTNERS’ CAPITAL |
|
|
|
|
|
|
|
|
|
Current liabilities: |
|
|
|
|
|
|
|
|
|
Accounts payable |
|
$ |
6,875 |
|
|
$ |
10,699 |
|
|
Accrued liabilities |
|
|
5,415 |
|
|
|
5,358 |
|
|
Due to affiliates |
|
|
205 |
|
|
|
208 |
|
|
Current liabilities |
|
|
12,495 |
|
|
|
16,265 |
|
|
Pension and other long term liabilities |
|
|
4,525 |
|
|
|
4,697 |
|
|
Commitments and contingencies |
|
|
— |
|
|
|
— |
|
|
Partners’ capital: |
|
|
|
|
|
|
|
|
|
General Partners’ Capital: |
|
|
|
|
|
|
|
|
|
TLCC GP LLC |
|
|
97 |
|
|
|
90 |
|
|
Lehigh Portland Holdings, LLC |
|
|
97 |
|
|
|
90 |
|
|
Limited Partners’ Capital: |
|
|
|
|
|
|
|
|
|
TLCC LP LLC |
|
|
48,759 |
|
|
|
45,150 |
|
|
Lehigh Portland Investments, LLC |
|
|
48,759 |
|
|
|
45,150 |
|
|
Total partners’ capital |
|
|
97,712 |
|
|
|
90,480 |
|
|
Total liabilities and partners’ capital |
|
$ |
114,732 |
|
|
$ |
111,442 |
|
See notes to financial statements.
91
Texas Lehigh Cement Company LP
Statements of Changes in Partners’ Capital
(dollars in thousands)
|
|
|
General Partners’ Capital |
|
|
Limited Partners’ Capital |
|
||||||||||||||
|
|
|
TLCC GP LLC |
|
|
Lehigh Portland Holdings, LLC |
|
|
TLCC LP LLC |
|
|
Lehigh Portland Investments, LLC |
|
|
Total |
|
|||||
|
Balance at December 31, 2012 |
|
$ |
79 |
|
|
$ |
79 |
|
|
$ |
39,715 |
|
|
$ |
39,715 |
|
|
$ |
79,588 |
|
|
Net income for the year |
|
|
72 |
|
|
|
72 |
|
|
|
35,846 |
|
|
|
35,846 |
|
|
|
71,836 |
|
|
Other comprehensive gain |
|
|
2 |
|
|
|
2 |
|
|
|
882 |
|
|
|
882 |
|
|
|
1,768 |
|
|
Distribution of earnings |
|
|
(73 |
) |
|
|
(73 |
) |
|
|
(36,427 |
) |
|
|
(36,427 |
) |
|
|
(73,000 |
) |
|
Balance at December 31, 2013 |
|
$ |
80 |
|
|
$ |
80 |
|
|
$ |
40,016 |
|
|
$ |
40,016 |
|
|
$ |
80,192 |
|
|
Net income for the year |
|
|
89 |
|
|
|
89 |
|
|
|
44,515 |
|
|
|
44,515 |
|
|
|
89,208 |
|
|
Other comprehensive loss |
|
|
(2 |
) |
|
|
(2 |
) |
|
|
(833 |
) |
|
|
(833 |
) |
|
|
(1,670 |
) |
|
Distribution of earnings |
|
|
(77 |
) |
|
|
(77 |
) |
|
|
(38,548 |
) |
|
|
(38,548 |
) |
|
|
(77,250 |
) |
|
Balance at December 31, 2014 |
|
$ |
90 |
|
|
$ |
90 |
|
|
$ |
45,150 |
|
|
$ |
45,150 |
|
|
$ |
90,480 |
|
|
Net income for the year |
|
|
81 |
|
|
|
81 |
|
|
|
40,605 |
|
|
|
40,605 |
|
|
|
81,372 |
|
|
Other comprehensive gain |
|
|
1 |
|
|
|
1 |
|
|
|
429 |
|
|
|
429 |
|
|
|
860 |
|
|
Distribution of earnings |
|
|
(75 |
) |
|
|
(75 |
) |
|
|
(37,425 |
) |
|
|
(37,425 |
) |
|
|
(75,000 |
) |
|
Balance at December 31, 2015 |
|
$ |
97 |
|
|
$ |
97 |
|
|
$ |
48,759 |
|
|
$ |
48,759 |
|
|
$ |
97,712 |
|
See notes to financial statements.
92
Texas Lehigh Cement Company LP
(dollars in thousands)
|
|
|
Year ended December 31, |
|
|||||||||
|
|
|
2015 |
|
|
2014 |
|
|
2013 |
|
|||
|
CASH FLOWS FROM OPERATING ACTIVITIES |
|
|
|
|
|
|
|
|
|
|
|
|
|
Net income |
|
$ |
81,372 |
|
|
$ |
89,208 |
|
|
$ |
71,836 |
|
|
Adjustments to reconcile net income to net cash provided by operating activities: |
|
|
|
|
|
|
|
|
|
|
|
|
|
Depreciation and depletion |
|
|
2,421 |
|
|
|
2,458 |
|
|
|
3,306 |
|
|
Gain on sales of equipment |
|
|
(16 |
) |
|
|
(15 |
) |
|
|
(5 |
) |
|
Equity in earnings of unconsolidated joint venture |
|
|
(1 |
) |
|
|
(1 |
) |
|
|
(1 |
) |
|
Changes in assets and liabilities: |
|
|
|
|
|
|
|
|
|
|
|
|
|
Trade accounts receivable |
|
|
7,940 |
|
|
|
(8,772 |
) |
|
|
(5,014 |
) |
|
Notes receivable |
|
|
— |
|
|
|
— |
|
|
|
661 |
|
|
Inventories |
|
|
(12,951 |
) |
|
|
(2,036 |
) |
|
|
(538 |
) |
|
Prepaid assets |
|
|
(95 |
) |
|
|
30 |
|
|
|
(56 |
) |
|
Accounts payable |
|
|
(3,824 |
) |
|
|
(478 |
) |
|
|
2,753 |
|
|
Accrued liabilities and due to affiliates |
|
|
742 |
|
|
|
153 |
|
|
|
1,041 |
|
|
Net cash provided by operating activities |
|
|
75,588 |
|
|
|
80,547 |
|
|
|
73,983 |
|
|
CASH FLOWS FROM INVESTING ACTIVITIES |
|
|
|
|
|
|
|
|
|
|
|
|
|
Additions to property, plant, and equipment |
|
|
(882 |
) |
|
|
(2,910 |
) |
|
|
(2,500 |
) |
|
Proceeds from sale of equipment |
|
|
16 |
|
|
|
15 |
|
|
|
5 |
|
|
Net cash used in investing activities |
|
|
(866 |
) |
|
|
(2,895 |
) |
|
|
(2,495 |
) |
|
CASH FLOWS FROM FINANCING ACTIVITIES |
|
|
|
|
|
|
|
|
|
|
|
|
|
Distributions of earnings |
|
|
(75,000 |
) |
|
|
(77,250 |
) |
|
|
(73,000 |
) |
|
Net cash used in financing activities |
|
|
(75,000 |
) |
|
|
(77,250 |
) |
|
|
(73,000 |
) |
|
Net increase (decrease) in cash and cash equivalents |
|
|
(278 |
) |
|
|
402 |
|
|
|
(1,512 |
) |
|
Cash and cash equivalents at beginning of year |
|
|
698 |
|
|
|
296 |
|
|
|
1,808 |
|
|
Cash and cash equivalents at end of year |
|
$ |
420 |
|
|
$ |
698 |
|
|
$ |
296 |
|
See notes to financial statements.
93
Texas Lehigh Cement Company LP
(dollars in thousands)
(A) Organization
Texas Lehigh Cement Company (“Texas Lehigh”), a Texas general partnership, was formed June 27, 1986 to operate a cement plant near Austin, Texas. Texas Lehigh was a fifty-fifty joint venture between Texas Cement Company (TCC), a wholly owned subsidiary of Eagle Materials, Inc. (EXP, formerly known as Centex Construction Products, Inc.), and Lehigh Portland Cement Company (Lehigh). On October 1, 2000, the existing Texas general partnership was converted to a Texas limited partnership. Subsequent to the limited partnership formation, TCC and Lehigh each contributed a 0.1% interest to a general partner, TLCC GP LLC and Lehigh Portland Holdings, LLC, and a 49.9% interest to a limited partner, TLCC LP LLC and Lehigh Portland Investments, LLC. The conversion and subsequent contributions were done to afford the former partners additional liability protection. Texas Lehigh Cement Company LP continues to do business as “Texas Lehigh Cement Company.”
TCC’s initial capital contribution consisted of a cement plant and related real property located in Buda, Texas; four distribution terminals; various operating agreements, licenses, and excavation rights; and net working capital as specified in the joint venture agreement. Lehigh’s initial capital contribution consisted of a distribution terminal and related operating agreements, licenses, inventory, and cash.
In September 2006, Texas Lehigh paid $24.5 million for a 15% interest in Houston Cement Company (“HCC”), a joint venture. HCC operates two terminals in Houston, Texas. Under the terms of the joint venture agreement, Texas Lehigh is entitled to sell up to 495 thousand short tons from the terminals each year.
Due to a number of factors, namely the shared risks and rights under the joint venture agreement, Texas Lehigh accounts for its investment in HCC using the equity method.
We evaluated all events or transactions that occurred after December 31, 2015 up through May 25, 2016, the date we issued these financial statements. During this period, we did not have any material recognizable subsequent events.
(B) Significant Accounting Policies
Cash and Cash Equivalents-
Cash and cash equivalents include investments with original maturities of three months or less. The carrying amount approximates fair value due to the short maturity of those investments.
Inventories-
Inventories are valued at the lower of average cost or market. Cement and materials-in-process include materials, labor, and manufacturing overhead.
Concentration of Risk -
One customer accounted for 8.7%, 16.3% and 15.9% of cement sales for 2015, 2014 and 2013, respectively, and 12.6% and 16.7% of accounts receivable at December 31, 2015 and 2014, respectively.
Property, Plant, and Equipment -
Property, plant, and equipment are stated at cost. Texas Lehigh’s policy is to capitalize renewals and betterments and to expense repairs and maintenance when incurred. The cost and related accumulated depreciation of assets sold or retired are removed from the financial statements, and any gain or loss is recorded in
94
interest and other income on the statement of earnings. Texas Lehigh periodically evaluates whether current events or circumstances indicate that the carrying value of its depreciable assets may not be recoverable. At December 31, 2015 and 2014, management believes no events or circumstances indicate that the carrying value may not be recoverable.
Depreciation and Depletion-
Depreciation is computed on a straight-line basis over the estimated useful lives of the related assets, which are as follows:
|
Cement plant |
|
5 to 30 years |
|
Mobile equipment and other |
|
2 to 10 years |
Raw material deposits are depleted as such deposits are extracted for production utilizing the units-of-production method.
Revenue Recognition -
Revenue from the sale of cement is recognized when title and ownership are transferred upon shipment to the customer.
Federal Income Taxes -
No federal income taxes are payable by Texas Lehigh, and none have been provided for in the accompanying financial statements. The partners include their respective share of Company income or loss in their tax returns. Texas Lehigh is subject to Texas margin tax on its gross margin earned in Texas.
Texas Lehigh’s tax return and the amount of allocable Company income or losses are subject to examination by federal and state taxing authorities. If such examinations result in changes to Company income or losses, the tax liability of the partners could be changed accordingly. No such examinations are presently in process.
Shipping and Handling Fees and Costs -
Texas Lehigh classifies its freight revenue as sales and freight cost as cost of goods sold. Freight costs of $11.4 million, $21.7 million and $17.4 million were included in cost of goods sold in 2015, 2014 and 2013, respectively.
Use of Estimates-
The preparation of financial statements in conformity with accounting principles generally accepted in the United States requires management to make estimates and assumptions that affect the reported amounts of assets and liabilities and disclosures of contingent assets and liabilities at the date of the financial statements and reported amounts of revenues and expenses during the reporting period. Actual results could differ from these estimates.
Comprehensive Earnings -
As of December 31, 2015, Texas Lehigh has an accumulated comprehensive loss of $3.0 million in connection with recognizing the difference between the fair value of the pension assets and the projected benefit obligation. This amount is excluded from earnings and reported as a component of partners’ capital.
95
Certain assets and liabilities are required to be recorded at fair value. The estimated fair values of those assets and liabilities have been determined using market information and valuation methodologies. Changes in assumptions or estimation methods could affect the fair value estimates. However, we do not believe any such changes would have a material impact on our financial condition, results of operations or cash flows. There are three levels of inputs that may be used to measure fair value:
Level 1 – Quoted prices for identical assets and liabilities in active markets;
Level 2 – Quoted prices for similar assets and liabilities in active markets; quoted prices for identical or similar assets and liabilities in markets that are not active; or other inputs that are observable or can be corroborated by observable market data; and
Level 3 – Unobservable inputs that are supported by little or no market activity and that are significant to the fair value of the assets and liabilities. This includes certain pricing models, discounted cash flow methodologies and similar techniques that use significant unobservable inputs.
(C) Purchased Cement
Texas Lehigh purchases cement for resale primarily in the Houston, Texas market. Sales of purchased cement were $70.3 million, $81.5 million and $54.0 million, and cost of sales was $52.6 million, $67.2 million and $44.6 million for 2015, 2014 and 2013, respectively.
(D) Accrued Liabilities
Accrued liabilities at December 31, 2015 and 2014 consist of the following:
|
|
|
Year ended December 31, |
|
|||||
|
|
|
2015 |
|
|
2014 |
|
||
|
Payroll and incentive compensation |
|
$ |
1,792 |
|
|
$ |
1,759 |
|
|
Benefits and insurance |
|
|
497 |
|
|
|
544 |
|
|
Property taxes |
|
|
2,225 |
|
|
|
2,055 |
|
|
Other |
|
|
901 |
|
|
|
1,000 |
|
|
|
|
$ |
5,414 |
|
|
$ |
5,358 |
|
(E) Commitments and Contingencies
Texas Lehigh is involved in certain legal actions arising in the ordinary course of its business. Management does not believe any of these actions, either individually or in the aggregate, requires accrual or disclosure at December 31, 2015.
Texas Lehigh has certain operating leases covering manufacturing, transportation and certain other facilities and equipment. Rental expense for the years ended December 31, 2015 and 2014 totaled $2.0 million and $1.9 million, respectively. Minimum annual rental commitments as of December 31, 2015, under noncancellable leases are set forth as follows (dollars in thousands):
|
Fiscal Year |
|
Amount |
|
|
|
2015 |
|
$ |
1,493 |
|
|
2016 |
|
$ |
1,720 |
|
|
2017 |
|
$ |
1,616 |
|
|
2018 |
|
$ |
1,426 |
|
|
2019 |
|
$ |
1,106 |
|
|
Thereafter |
|
$ |
— |
|
96
(F) Pension and Profit Sharing Plans
Texas Lehigh provides a profit sharing plan, a defined contribution plan (“401(k) plan”) and a noncontributory defined benefit pension plan, which together covers substantially all employees and provides specified benefits to qualified employees. Texas Lehigh is not a party to any multi-employer pension plan. Benefits paid under the defined benefit plan cover hourly employees and are based on years of service and the employee’s qualifying compensation over the last few years of employment. Texas Lehigh’s funding policy is to contribute the legally required minimum amounts with the discretion to contribute additional amounts from time to time.
The annual measurement date is December 31 for the benefit obligations, fair value of plan assets and the funded status of the defined benefit plan.
The following table provides a reconciliation of the defined benefit pension plan obligation and fair value of plan assets over the two-year period ended December 31, 2015 and a statement of the funded status as of December 31, 2015 and 2014:
|
|
|
Year ended December 31, |
|
|||||
|
|
|
2015 |
|
|
2014 |
|
||
|
Reconciliation of Benefit Obligations: |
|
|
|
|
|
|
|
|
|
Benefit obligation at January 1 |
|
$ |
9,826 |
|
|
$ |
7,725 |
|
|
Service cost |
|
|
251 |
|
|
|
213 |
|
|
Interest cost on projected benefit obligation |
|
|
362 |
|
|
|
359 |
|
|
Actuarial (gain) loss |
|
|
(1,153 |
) |
|
|
1,645 |
) |
|
Benefits paid |
|
|
(133 |
) |
|
|
(116 |
) |
|
Benefit obligation at December 31 |
|
|
9,153 |
|
|
|
9,826 |
|
|
Reconciliation of Fair Value of Plan Assets: |
|
|
|
|
|
|
|
|
|
Fair value of plan assets at January 1 |
|
|
6,508 |
|
|
|
5,980 |
|
|
Actual return on plan assets |
|
|
(120 |
) |
|
|
267 |
|
|
Employer contributions |
|
|
— |
|
|
|
377 |
|
|
Benefits paid |
|
|
(133 |
) |
|
|
(116 |
) |
|
Fair value of plan assets at December 31 |
|
$ |
6,255 |
|
|
$ |
6,508 |
|
|
Unfunded status at December 31 |
|
$ |
(2,898 |
) |
|
$ |
(3,318 |
) |
|
|
|
|
|
|
|
|
|
|
|
|
|
December 31, |
|
|||||
|
|
|
2015 |
|
|
2014 |
|
||
|
Amounts Recognized in the Balance Sheet Consist of |
|
|
|
|
|
|
|
|
|
Accrued Benefit Liability |
|
$ |
(2,898 |
) |
|
$ |
(3,318 |
) |
|
Accumulated Other Comprehensive Income: |
|
|
|
|
|
|
|
|
|
Net Actuarial Loss |
|
$ |
3,023 |
|
|
$ |
3,853 |
|
|
Prior Service Cost |
|
|
— |
|
|
|
— |
|
|
Net Accumulated Other Comprehensive Income |
|
$ |
3,023 |
|
|
$ |
3,853 |
|
Information for pension plans with an accumulated benefit obligation in excess of plan assets:
|
|
|
Year ended December 31, |
|
|||||
|
|
|
2015 |
|
|
2014 |
|
||
|
Projected Benefit Obligation |
|
$ |
9,153 |
|
|
$ |
9,826 |
|
|
Accumulated Benefit Obligation |
|
$ |
9,151 |
|
|
$ |
9,822 |
|
|
Fair Value of Plan Assets |
|
$ |
6,255 |
|
|
$ |
6,508 |
|
97
Net periodic pension cost for the fiscal years ended December 31, 2015, 2014 and 2013 included the following components:
|
|
|
Year ended December 31, |
|
|||||||||
|
|
|
2015 |
|
|
2014 |
|
|
2013 |
|
|||
|
Service cost – benefits earned during the period |
|
$ |
251 |
|
|
$ |
213 |
|
|
$ |
267 |
|
|
Interest cost of projected benefit obligation |
|
|
362 |
|
|
|
359 |
|
|
|
328 |
|
|
Expected return on plan assets |
|
|
(480 |
) |
|
|
(462 |
) |
|
|
(391 |
) |
|
Recognized net actuarial loss |
|
|
277 |
|
|
|
150 |
|
|
|
342 |
|
|
Amortization of prior-service cost |
|
|
— |
|
|
|
— |
|
|
|
4 |
|
|
Net periodic pension cost |
|
$ |
410 |
|
|
$ |
260 |
|
|
$ |
550 |
|
Expected benefit payments over the next five years, and the following five years under the pension plan are expected to be as follows:
|
2016 |
|
$ |
206 |
|
|
2017 |
|
|
218 |
|
|
2018 |
|
|
224 |
|
|
2019 |
|
|
229 |
|
|
2020 |
|
|
258 |
|
|
2021 – 2025 |
|
$ |
2,064 |
|
The following table sets forth the rates used in the actuarial calculations of the present value of benefit obligations and the rate of return on plan assets:
|
|
|
Year ended December 31, |
|
|||||||||
|
|
|
2015 |
|
|
2014 |
|
|
2013 |
|
|||
|
Assumptions used to determine benefit obligations at the annual measurement date were: |
|
|
|
|
|
|
|
|
|
|
|
|
|
Obligation discount rate |
|
|
4.31 |
% |
|
|
3.93 |
% |
|
|
4.75 |
% |
|
Compensation increase rate |
|
|
4.00 |
% |
|
|
4.00 |
% |
|
|
4.00 |
% |
|
Assumptions used to determine net periodic benefit costs were: |
|
|
|
|
|
|
|
|
|
|
|
|
|
Obligation discount rate |
|
|
3.93 |
% |
|
|
4.75 |
% |
|
|
4.00 |
% |
|
Long-term rate of return on plan assets |
|
|
7.50 |
% |
|
|
7.50 |
% |
|
|
7.50 |
% |
|
Compensation increase rate |
|
|
4.00 |
% |
|
|
4.00 |
% |
|
|
4.00 |
% |
The expected long-term rate of return on plan assets is an assumption reflecting the anticipated weighted average rate of earnings on the portfolio over the long-term. To arrive at this rate, Texas Lehigh developed estimates of the key components underlying capital asset returns including: market-based estimates of inflation, real risk-free rates of return, yield curve structure, credit risk premiums and equity risk premiums. As appropriate, these components were used to develop benchmark estimates of expected long-term rates of return for each asset class, which were portfolio weighted.
The pension plan weighted-average asset allocation at year-end 2015 and 2014 and the range of target follows:
|
|
|
Range of Target |
|
|
Percentage of Plan Assets at Year-End |
|
||||||
|
|
|
Allocation |
|
|
2015 |
|
|
2014 |
|
|||
|
Asset category: |
|
|
|
|
|
|
|
|
|
|
|
|
|
Equity securities |
|
|
40-60% |
|
|
|
55 |
% |
|
|
54 |
% |
|
Debt securities |
|
|
35-60% |
|
|
|
45 |
% |
|
|
43 |
% |
|
Other |
|
|
0-5% |
|
|
|
— |
% |
|
|
3 |
% |
|
Total |
|
|
|
|
|
|
100 |
% |
|
|
100 |
% |
98
Texas Lehigh’s pension investment strategies have been developed as part of a comprehensive asset/liability management process that considers the interaction between both the assets and liabilities of the plan. These strategies consider not only the expected risks and returns on plan assets, but also the detailed actuarial projections of liabilities as well as plan-level objectives such as projected contributions, expense and funded status.
The principal pension investment strategies include asset allocation and active asset management. The range of target asset allocations have been determined after giving consideration to the expected returns of each asset class, the expected variability or volatility of the asset class returns over time, and the complementary nature or correlation of the asset classes within the portfolio. Texas Lehigh also employs an active management approach for the portfolio. Each asset class is managed by one or more external money managers with the objective of generating returns, net of management fees that exceed market-based benchmarks.
Based on current actuarial estimates, Texas Lehigh does not anticipate making a contribution to the pension plan during 2016.
The fair values of our defined benefit plans consolidated assets by category as of December 31, 2015 and 2014 were as follows:
|
|
|
December 31, |
|
|||||
|
|
|
2015 |
|
|
2014 |
|
||
|
Equity Securities |
|
$ |
3,441 |
|
|
$ |
3,540 |
|
|
Fixed Income Securities |
|
|
2,801 |
|
|
|
2,808 |
|
|
Cash Equivalents |
|
|
13 |
|
|
|
162 |
|
|
Total |
|
$ |
6,255 |
|
|
$ |
6,510 |
|
The fair values of our defined benefit plans consolidated assets were determined using the fair value hierarchy of inputs described in Note A. The fair values by category of inputs were as follows:
|
December 31, 2015 |
|
|||||||||||||||
|
Asset Categories |
|
Quoted Prices in Active Markets for Identical Assets (Level 1) |
|
|
Significant Other Observable Inputs (Level 2) |
|
|
Significant Unobservable Inputs (Level 3) |
|
|
Total |
|
||||
|
Equity Securities (a) |
|
$ |
— |
|
|
$ |
3,441 |
|
|
$ |
— |
|
|
$ |
3,441 |
|
|
Fixed Income Securities (a) |
|
|
— |
|
|
|
2,801 |
|
|
|
— |
|
|
|
2,801 |
|
|
Cash Equivalents (a) |
|
|
— |
|
|
|
13 |
|
|
|
— |
|
|
|
13 |
|
|
|
|
$ |
— |
|
|
$ |
6,255 |
|
|
$ |
— |
|
|
$ |
6,255 |
|
|
|
|
|||||||||||||||
|
December 31, 2014 |
|
|||||||||||||||
|
Asset Categories |
|
Quoted Prices in Active Markets for Identical Assets (Level 1) |
|
|
Significant Other Observable Inputs (Level 2) |
|
|
Significant Unobservable Inputs (Level 3) |
|
|
Total |
|
||||
|
Equity Securities (a) |
|
$ |
— |
|
|
$ |
3,540 |
|
|
$ |
— |
|
|
$ |
3,540 |
|
|
Fixed Income Securities (a) |
|
|
— |
|
|
|
2,808 |
|
|
|
— |
|
|
|
2,808 |
|
|
Cash Equivalents (a) |
|
|
— |
|
|
|
160 |
|
|
|
— |
|
|
|
160 |
|
|
|
|
$ |
— |
|
|
$ |
6,508 |
|
|
$ |
— |
|
|
$ |
6,508 |
|
|
(a) |
These funds are maintained by an investment manager and consist of collective funds that are not actively traded. |
99
Texas Lehigh also provides a profit sharing plan, which covers substantially all salaried employees, and a 401(k) plan, which covers substantially all employees. Texas Lehigh matches employees’ 401(k) contributions up to 4% of employees’ salaries. Texas Lehigh’s contributions to the profit sharing and 401(k) plans were $0.6 million, $0.7 million, and $0.6 million in 2015, 2014 and 2013, respectively.
(G) Related-Party Transactions
Texas Lehigh had sales to affiliates of $28.2 million, $34.4 million and $29.7 million in 2015, 2014 and 2013, respectively, of which $5.8 million and $6.5 million is included in trade accounts receivable at December 31, 2015 and 2014. Texas Lehigh purchased $1.4 million, $1.4 million and $1.0 million of cement from Lehigh in 2015, 2014 and 2013, respectively, and $28.9 million, $33.1 million and $24.1 million of cement from HCC in 2015, 2014 and 2013, respectively. Texas Lehigh accrued $2.4 million and $2.8 million for purchased cement received from these affiliates but not paid for at December 31, 2015 and 2014, respectively.
Texas Lehigh reimburses EXP for certain expenses paid by EXP on Texas Lehigh’s behalf. Total payments made to EXP for reimbursement of expenses were $3.0 million, $2.6 million and $2.4 million during 2015, 2014 and 2013. At both December 31, 2015 and 2014, Texas Lehigh had accrued liabilities of $0.3 million for the reimbursement of expenses paid by EXP.
100
Report of Independent AUDITORS
The Management Committee
Texas Lehigh Cement Company LP
We have audited the accompanying financial statements of Texas Lehigh Cement Company LP, which comprise the balance sheets as of December 31, 2015 and 2014, and the related statements of earnings, comprehensive earnings, changes in partners’ capital, and cash flows for each of the three years in the period ended December 31, 2015, and the related notes to the financial statements.
Management’s Responsibility for the Financial Statements
Management is responsible for the preparation and fair presentation of these financial statements in conformity with U.S. generally accepted accounting principles; this includes the design, implementation, and maintenance of internal control relevant to the preparation and fair presentation of financial statements that are free of material misstatement, whether due to fraud or error.
Auditor’s Responsibility
Our responsibility is to express an opinion on these financial statements based on our audits. We conducted our audits in accordance with auditing standards generally accepted in the United States. Those standards require that we plan and perform the audit to obtain reasonable assurance about whether the financial statements are free of material misstatement.
An audit involves performing procedures to obtain audit evidence about the amounts and disclosures in the financial statements. The procedures selected depend on the auditor’s judgment, including the assessment of the risks of material misstatement of the financial statements, whether due to fraud or error. In making those risk assessments, the auditor considers internal control relevant to the entity’s preparation and fair presentation of the financial statements in order to design audit procedures that are appropriate in the circumstances, but not for the purpose of expressing an opinion on the effectiveness of the entity’s internal control. Accordingly, we express no such opinion. An audit also includes evaluating the appropriateness of accounting policies used and the reasonableness of significant accounting estimates made by management, as well as evaluating the overall presentation of the financial statements.
We believe that the audit evidence we have obtained is sufficient and appropriate to provide a basis for our audit opinion.
Opinion
In our opinion, the financial statements referred to above present fairly, in all material respects, the financial position of Texas Lehigh Cement Company LP at December 31, 2015 and 2014, and the results of its operations and its cash flows for each of the three years in the period ended December 31, 2015, in conformity with U.S. generally accepted accounting principles.
/s/ ERNST & YOUNG LLP
Dallas, Texas
May 25, 2016
101
None.
EVALUATION OF DISCLOSURE CONTROLS AND PROCEDURES
We have established a system of disclosure controls and other procedures that are designed to ensure that information required to be disclosed by us in the reports that we file or submit under the Securities Exchange Act of 1934 (“Exchange Act”), is recorded, processed, summarized and reported within the time periods specified by the SEC’s rules and forms, and that such information is accumulated and communicated to management, including our Chief Executive Officer and Chief Financial Officer, as appropriate to allow timely decisions regarding required disclosure. An evaluation of the effectiveness of the design and operation of our disclosure controls and procedures (as defined in Rule 13a-15(e) under the Exchange Act) was performed as of the end of the period covered by this annual report. This evaluation was performed under the supervision and with the participation of management, including our CEO and CFO. Based upon that evaluation, our CEO and CFO have concluded that these disclosure controls and procedures were effective.
There were no changes in our internal control over financial reporting that occurred during our last fiscal quarter that have materially affected, or are reasonably likely to materially affect, our internal control over financial reporting.
Management report on internal control over financial reporting
Our management is responsible for establishing and maintaining adequate internal control over financial reporting, as such term is defined in Exchange Act Rule 13a-15(f). Under the supervision and with the participation of our management, including our CEO and CFO, we conducted an evaluation of the effectiveness of our internal control over financial reporting based on the framework in “Internal Control – Integrated Framework” issued by the Committee of Sponsoring Organizations of the Treadway Commission (2013 framework). Based on our evaluation under the framework in “Internal Control – Integrated Framework,” our management concluded that our internal control over financial reporting was effective as of March 31, 2016. The effectiveness of our internal control over financial reporting as of March 31, 2016, has been audited by Ernst & Young LLP, an independent registered public accounting firm, as stated in their report which is included herein.
102
REPORT OF INDEPENDENT REGISTERED PUBLIC ACCOUNTING FIRM
The Board of Directors and Stockholders of
Eagle Materials Inc.
We have audited Eagle Materials Inc. and Subsidiaries’ internal control over financial reporting as of March 31, 2016, based on criteria established in Internal Control -- Integrated Framework issued by the Committee of Sponsoring Organizations of the Treadway Commission (2013 framework) (the COSO criteria). Eagle Materials Inc. and Subsidiaries’ management is responsible for maintaining effective internal control over financial reporting, and for its assessment of the effectiveness of internal control over financial reporting included in the accompanying Management Report on Internal Control over Financial Reporting. Our responsibility is to express an opinion on the company’s internal control over financial reporting based on our audit.
We conducted our audit in accordance with the standards of the Public Company Accounting Oversight Board (United States). Those standards require that we plan and perform the audit to obtain reasonable assurance about whether effective internal control over financial reporting was maintained in all material respects. Our audit included obtaining an understanding of internal control over financial reporting, assessing the risk that a material weakness exists, testing and evaluating the design and operating effectiveness of internal control based on the assessed risk, and performing such other procedures as we considered necessary in the circumstances. We believe that our audit provides a reasonable basis for our opinion.
A company’s internal control over financial reporting is a process designed to provide reasonable assurance regarding the reliability of financial reporting and the preparation of financial statements for external purposes in accordance with generally accepted accounting principles. A company’s internal control over financial reporting includes those policies and procedures that (1) pertain to the maintenance of records that, in reasonable detail, accurately and fairly reflect the transactions and dispositions of the assets of the company; (2) provide reasonable assurance that transactions are recorded as necessary to permit preparation of financial statements in accordance with generally accepted accounting principles, and that receipts and expenditures of the company are being made only in accordance with authorizations of management and directors of the company; and (3) provide reasonable assurance regarding prevention or timely detection of unauthorized acquisition, use, or disposition of the company’s assets that could have a material effect on the financial statements.
Because of its inherent limitations, internal control over financial reporting may not prevent or detect misstatements. Also, projections of any evaluation of effectiveness to future periods are subject to the risk that controls may become inadequate because of changes in conditions, or that the degree of compliance with the policies or procedures may deteriorate.
In our opinion, Eagle Materials Inc. and Subsidiaries maintained, in all material respects, effective internal control over financial reporting as of March 31, 2016, based on the COSO criteria.
We also have audited, in accordance with the standards of the Public Company Accounting Oversight Board (United States), the consolidated balance sheets of Eagle Materials Inc. and Subsidiaries as of March 31, 2016 and 2015, and the related consolidated statements of earnings, comprehensive earnings, cash flows, and stockholders’ equity for each of the three years in the period ended March 31, 2016 and our report dated May 25, 2016 expressed an unqualified opinion thereon.
/s/ ERNST & YOUNG LLP
Dallas, Texas
May 25, 2016
None
103
Except for the information below regarding our code of ethics, the information called for by Items 10, 11, 12, 13 and 14 is incorporated herein by reference to the information included and referenced under the following captions in the Company’s Proxy Statement for the Company’s August 4, 2016 Annual Meeting of Stockholders (the “2016 EXP Proxy Statement”):
|
Items |
|
Caption in the 2016 EXP Proxy Statement |
|
10 |
|
Executive Officers who are not Directors |
|
10 |
|
Election of Directors and Related Matters |
|
10 |
|
Stock Ownership-Section 16(a) Beneficial Ownership Reporting Compliance |
|
10 |
|
Stock Ownership – Code of Conduct |
|
11 |
|
Executive Compensation |
|
11 |
|
Compensation Discussion and Analysis |
|
11 |
|
Potential Payments Upon Termination or Change in Control |
|
12 |
|
Stock Ownership |
|
13 |
|
Stock Ownership – Related Party Transactions |
|
13 |
|
Election of Directors and Related Matters |
|
14 |
|
Relationship with Independent Public Accountants |
Code of Ethics. The policies comprising the Company’s code of ethics (“Eagle Ethics - A Guide to Decision - Making on Business Conduct Issues”) will represent both the code of ethics for the principal executive officer, principal financial officer, and principal accounting officer under SEC rules, and the code of business conduct and ethics for directors, officers, and employees under NYSE listing standards. The code of ethics is published on the corporate governance section of the Company’s website at www.eaglematerials.com.
Although the Company does not envision that any waivers of the code of ethics will be granted, should a waiver occur for the principal executive officer, principal financial officer, the principal accounting officer or controller, it will be promptly disclosed on our internet site. Also, any amendments of the code will be promptly posted on our internet site.
See Item 10 above.
See Item 10 above.
104
The following table shows the number of outstanding options and shares available for future issuance of options under the Company’s equity compensation plans as of March 31, 2016. Our equity compensation plans have been approved by the Company’s stockholders.
|
Plan Category |
|
Incentive Plan |
|
|
Number of securities to be issued upon exercise of outstanding options, warrants and rights (a) |
|
|
Weighted average exercise price of outstanding options, warrants and rights (b) |
|
|
Number of securities remaining for future issuance under equity compensation plans excluding securities reflected in column (a) (c) |
|
||||
|
Equity compensation plans approved by stockholders |
|
|
2013 |
|
|
|
1,817,763 |
|
|
$ |
52.71 |
|
|
|
4,565,892 |
|
|
Equity compensation plans not approved by stockholders |
|
|
|
|
|
|
— |
|
|
|
— |
|
|
|
— |
|
|
|
|
|
|
|
|
|
1,817,763 |
|
|
$ |
52.71 |
|
|
|
4,565,892 |
|
See Item 10 above.
See Item 10 above.
a) The following documents are filed as part of this Report:
|
|
(1) |
Financial Statements |
Reference is made to the Index to Financial Statements under Item 8 in Part II hereof, where these documents are listed.
(2)Schedules
Schedules are omitted because they are not applicable or not required or the information required to be set forth therein is included in the consolidated financial statements referenced above in section (a) (1) of this Item 15.
(3)Exhibits
The information on exhibits required by this Item 15 is set forth in the Eagle Materials Inc. Index to Exhibits appearing on pages 109-113 of this Report.
105
Pursuant to the requirements of Section 13 or 15(d) of the Securities Exchange Act of 1934, the registrant has duly caused this Form 10-K to be signed on its behalf by the undersigned, thereunto duly authorized.
|
|
|
EAGLE MATERIALS INC. |
|
|
|
Registrant |
|
|
|
|
|
May 25, 2016 |
|
/s/ David B. Powers |
|
|
|
David B. Powers, Chief Executive Officer |
Pursuant to the requirements of the Securities Exchange Act of 1934, this report has been signed below by the following persons on behalf of the registrant in the capacities and on the dates indicated.
|
May 25, 2016 |
|
/s/ David B. Powers |
|
|
|
David B. Powers President and Chief Executive Officer (principal executive officer) |
|
|
|
|
|
May 25, 2016 |
|
/s/ D. Craig Kesler |
|
|
|
D. Craig Kesler Executive Vice President – Finance and Administration and Chief Financial Officer (principal financial officer) |
|
|
|
|
|
May 25, 2016 |
|
/s/ William R. Devlin |
|
|
|
William R. Devlin Senior Vice President – Controller and Chief Accounting Officer (principal accounting officer) |
|
|
|
|
|
May 25, 2016 |
|
/s/ F. William Barnett |
|
|
|
F. William Barnett, Director |
|
|
|
|
|
May 25, 2016 |
|
/s/ Richard Beckwitt |
|
|
|
Richard Beckwitt, Director |
|
|
|
|
|
May 25, 2016 |
|
/s/ Ed H. Bowman, Jr. |
|
|
|
Ed H. Bowman, Jr., Director |
106
|
May 25, 2016 |
|
/s/ Robert L. Clarke |
|
|
|
Robert L. Clarke, Director |
|
|
|
|
|
May 25, 2016 |
|
/s/ Martin M. Ellen |
|
|
|
Martin M. Ellen, Director |
|
|
|
|
|
May 25, 2016 |
|
/s/ Laurence E. Hirsch |
|
|
|
Laurence E. Hirsch, Director |
|
|
|
|
|
May 25, 2016 |
|
/s/ Michael R. Nicolais |
|
|
|
Michael R. Nicolais, Director |
|
|
|
|
|
May 25, 2016 |
|
/s/ David W. Quinn |
|
|
|
David W. Quinn, Director |
|
|
|
|
|
May 25, 2016 |
|
/s/ Richard R. Stewart |
|
|
|
Richard R. Stewart, Director |
107
EAGLE MATERIALS INC.
AND SUBSIDIARIES
|
Exhibit Number |
|
Description of Exhibits |
|
|
|
|
|
2.1 |
|
Amended and Restated Agreement and Plan of Merger, dated as of November 4, 2003, among Centex Corporation, Centex Construction Products, Inc. (now known as Eagle Materials Inc.) and ARG Merger Corporation filed as Exhibit 2.1 to the Company’s Current Report on Form 8-K/A filed with the Securities and Exchange Commission (the “Commission”) on November 12, 2003 and incorporated herein by reference. |
|
|
|
|
|
2.2 |
|
Amended and Restated Distribution Agreement dated as of November 4, 2003 between Centex Corporation and Centex Construction Products, Inc. (now known as Eagle Materials Inc.) filed as Exhibit 2.2 to the Company’s Current Report on Form 8-K/A filed with the Commission on November 12, 2003 and incorporated herein by reference. |
|
|
|
|
|
2.3 |
|
Asset Purchase Agreement dated September 26, 2012, among Eagle Materials Inc., Audubon Materials LLC, Lafarge North America, Inc. and other sellers named therein, filed as Exhibit 2.1 to the Current Report on Form 8-K/A filed with the Commission on September 27, 2012 and incorporated herein by reference. |
|
|
|
|
|
3.1 |
|
Restated Certificate of Incorporation filed as Exhibit 3.1 to the Company’s Current Report on Form 8-K filed with the Commission on April 11, 2006 and incorporated herein by reference. |
|
|
|
|
|
3.2 |
|
Restated Certificate of Designation, Preferences and Rights of Series A Preferred Stock filed as Exhibit 3.2 to the Company’s Current Report on Form 8-K filed with the Commission on April 11, 2006 and incorporated herein by reference. |
|
|
|
|
|
3.3 |
|
Amended and Restated Bylaws filed as Exhibit 3.3 to the Company’s Annual Report on Form 10-K for the fiscal year ended March 31, 2007, filed with the Commission on May 29, 2007 and incorporated herein by reference. |
|
|
|
|
|
3.4 |
|
Amendment to Amended and Restated Bylaws filed as Exhibit 3.1 to the Company’s Current Report on Form 8-K filed with the Commission on November 24, 2008 and incorporated herein by reference. |
|
|
|
|
|
3.5 |
|
Amendment to Amended and Restated Bylaws filed as Exhibit 3.1 to the Company’s Current Report on Form 8-K filed with the Commission on February 3, 2012 and incorporated herein by reference. |
|
|
|
|
|
3.6 |
|
Amendment to Amended and Restated Bylaws filed as Exhibit 3.1 to the Company’s Current Report on Form 8-K filed with the Commission on August 7, 2015 and incorporated herein by reference. |
|
|
|
|
|
4.1 |
|
Third Amended and Restated Credit Agreement dated as of October 30, 2014 among Eagle Materials Inc., the lenders party thereto, JPMorgan Chase Bank, N.A. as Administrative Agent, and the other Lenders party thereto, filed as Exhibit 10.7 to the Company’s Quarterly Report on Form 10-Q for the quarter ended September 30, 2014, filed with the Commission on November 5, 2014 and incorporated herein by reference. |
|
|
|
|
|
4.2 |
|
Amendment No. 1 to Third Amended and Restated Credit Agreement by and among the Company, JPMorgan Chase Bank, N.A., as Administrative Agent, and the other Lenders party thereto dated August 10, 2015, filed as Exhibit 10.4 to the Company’s Quarterly Report on Form 10-Q for the quarter ended September 30, 2015, filed with the Commission on October 27, 2015 and incorporated herein by reference. |
|
|
|
|
|
4.3 |
|
Note Purchase Agreement dated as of November 15, 2005, among the Company and the purchasers named therein filed as Exhibit 10.1 to the Company’s Current Report on Form 8-K filed with the Commission on November 18, 2005 and incorporated herein by reference. |
|
|
|
|
|
4.3 (a) |
|
First Amendment to Note Purchase Agreement (Series 2005A) dated September 26, 2012 filed as Exhibit 10.2 to the Current Report on Form 8-K/A filed with the Commission on September 27, 2012 and incorporated herein by reference. |
|
|
|
|
|
4.4 |
|
Note Purchase Agreement, dated as of October 2, 2007, among the Company and the purchasers named therein filed as Exhibit 10.1 to the Company’s Current Report on Form 8-K filed with the Commission on October 3, 2007 and incorporated herein by reference. |
108
|
|
|
|
|
4.4 (a) |
|
First Amendment to Note Purchase Agreement (Series 2007A) dated September 26, 2012 filed as Exhibit 10.3 to the Current Report on Form 8-K/A filed with the Commission on September 27, 2012 and incorporated herein by reference. |
|
|
|
|
|
10.1 |
|
Limited Partnership Agreement of Texas Lehigh Cement Company LP by and between Texas Cement Company and Lehigh Portland Cement Company effective as of October 1, 2000 filed as Exhibit 10.2 to the Company’s Annual Report on Form 10-K for the fiscal year ended March 31, 2001, filed with the Commission on June 27, 2001 and incorporated herein by reference. |
|
|
|
|
|
10.2 |
|
Amendment No. 1 to Agreement of Limited Partnership by and among Texas Cement Company, TLCC LP LLC, TLCC GP LLC, Lehigh Portland Cement Company, Lehigh Portland Investments, LLC and Lehigh Portland Holdings, LLC effective as of October 2, 2000 filed as Exhibit 10.2(a) to the 2001 Form 10-K and incorporated herein by reference. |
|
|
|
|
|
10.3 |
|
The Eagle Materials Inc. Amended and Restated Incentive Plan, filed as Exhibit A to the Company’s Schedule 14A filed with the Commission on June 21, 2013 and incorporated herein by reference. (1) |
|
|
|
|
|
10.3 (a) |
|
Form of Restricted Stock Unit Agreement for Non-Employee Directors filed as Exhibit 10.1 to the Company’s Current Report on Form 8-K filed with the Commission on August 1, 2006 and incorporated by reference herein.(1) |
|
|
|
|
|
10.3 (b) |
|
Form of Non-Qualified Stock Option Agreement for Non-Employee Directors filed as Exhibit 10.2 to the Company’s Current Report on Form 8-K filed with the Commission on August 1, 2006 and incorporated by reference herein. (1) |
|
|
|
|
|
10.3 (c) |
|
Form of Restricted Stock Agreement, filed as Exhibit 10.6 to the Company’s Quarterly Report on Form 10-Q for the quarter ended June 30, 2008, filed with the Commission on August 8, 2008 and incorporated herein by reference. (1) |
|
|
|
|
|
10.3 (d) |
|
Form of Non-Qualified Stock Option Agreement filed as Exhibit 10.6 to the Company’s Quarterly Report on Form 10-Q for the quarter ended June 30, 2010, filed with the Commission on August 6, 2010 and incorporated herein by reference. (1) |
|
|
|
|
|
10.3 (e) |
|
Form of Restricted Stock Agreement filed as Exhibit 10.8 to the Company’s Quarterly Report on Form 10-Q for the quarter ended June 30, 2010, filed with the Commission on August 6, 2010 and incorporated herein by reference. (1) |
|
|
|
|
|
10.3 (f) |
|
Form of Director Non-Qualified Stock Option Agreement filed as Exhibit 10.2 to the Company’s Quarterly Report on Form 10-Q for the quarter ended September 30, 2010, filed with the Commission on November 5, 2010 and incorporated herein by reference. (1) |
|
|
|
|
|
10.3 (g) |
|
Form of Non-Qualified Stock Option Agreement for Senior Executives filed as Exhibit 10.2 to the Company’s Quarterly Report on Form 10-Q for the quarter ended September 30, 2011, filed with the Commission on November 4, 2011 and incorporated herein by reference. (1) |
|
|
|
|
|
10.3 (h) |
|
Form of Non-Qualified Stock Option Agreement for Non-Employee directors filed as Exhibit 10.4 to the Company’s Quarterly Report on Form 10-Q for the quarter ended September 30, 2011, filed with the Commission on November 4, 2011 and incorporated herein by reference. (1) |
|
|
|
|
|
10.3 (i) |
|
Form of Non-Qualified Stock Option Agreement for Senior Executives filed as Exhibit 10.5 to the Company’s Quarterly Report on Form 10-Q for the quarter ended September 30, 2012, filed with the Commission on November 8, 2012 and incorporated herein by reference. (1) |
|
|
|
|
|
10.3 (j) |
|
Form of Restricted Stock Agreement for Senior Executives filed as Exhibit 10.6 to the Company’s Quarterly Report on Form 10-Q for the quarter ended September 30, 2012, filed with the Commission on November 8, 2012 and incorporated herein by reference. (1) |
|
|
|
|
|
10.3 (k) |
|
Form of Non-Qualified Stock Option Agreement for Non-Employee directors filed as Exhibit 10.7 to the Company’s Quarterly Report on Form 10-Q for the quarter ended September 30, 2012, filed with the Commission on November 8, 2012 and incorporated herein by reference. (1) |
109
|
|
|
|
|
10.3 (l) |
|
Form of Restricted Stock Agreement for Non-Employee directors filed as Exhibit 10.8 to the Company’s Quarterly Report on Form 10-Q for the quarter ended September 30, 2012, filed with the Commission on November 8, 2012 and incorporated herein by reference. (1) |
|
|
|
|
|
10.3 (m) |
|
Form of Non-Qualified Stock Option Agreement for Senior Executives filed as Exhibit 10.2 to the Company’s Quarterly Report on Form 10-Q for the quarter ended September 30, 2013, filed with the Commission on November 7, 2013 and incorporated herein by reference. (1) |
|
|
|
|
|
10.3 (n) |
|
Form of Restricted Stock Agreement for Senior Executives filed as Exhibit 10.3 to the Company’s Quarterly Report on Form 10-Q for the quarter ended September 30, 2013, filed with the Commission on November 7, 2013 and incorporated herein by reference. (1) |
|
|
|
|
|
10.3 (o) |
|
Form of Non-Qualified Stock Option Agreement for Non-Employee directors filed as Exhibit 10.4 to the Company’s Quarterly Report on Form 10-Q for the quarter ended September 30, 2013, filed with the Commission on November 7, 2013 and incorporated herein by reference. (1) |
|
|
|
|
|
10.3 (p) |
|
Form of Restricted Stock Agreement for Non-Employee directors filed as Exhibit 10.5 to the Company’s Quarterly Report on Form 10-Q for the quarter ended September 30, 2013, filed with the Commission on November 7, 2013 and incorporated herein by reference. (1) |
|
|
|
|
|
10.3 (q) |
|
Form of Non-Qualified Stock Option Agreement for Senior Executives filed as Exhibit 10.2 to the Company’s Quarterly Report on Form 10-Q for the quarter ended September 30, 2014, filed with the Commission on November 5, 2014 and incorporated herein by reference. (1) |
|
|
|
|
|
10.3 (r) |
|
Form of Restricted Stock Agreement for Senior Executives filed as Exhibit 10.3 to the Company’s Quarterly Report on Form 10-Q for the quarter ended September 30, 2014, filed with the Commission on November 5, 2014 and incorporated herein by reference. (1) |
|
|
|
|
|
10.3 (s) |
|
Form of Non-Qualified Stock Option Agreement for Non-Employee directors filed as Exhibit 10.4 to the Company’s Quarterly Report on Form 10-Q for the quarter ended September 30, 2014, filed with the Commission on November 5, 2014 and incorporated herein by reference. (1) |
|
|
|
|
|
10.3 (t) |
|
Form of Restricted Stock Agreement for Non-Employee directors filed as Exhibit 10.5 to the Company’s Quarterly Report on Form 10-Q for the quarter ended September 30, 2014, filed with the Commission on November 5, 2014 and incorporated herein by reference. (1) |
|
|
|
|
|
10.3 (u) |
|
Form of Non-Qualified Stock Option Agreement for Senior Executives filed as Exhibit 10.6 to the Company’s Quarterly Report on Form 10-Q for the quarter ended June 30, 2015, filed with the Commission on August 4, 2015 and incorporated herein by reference. (1) |
|
|
|
|
|
10.3 (v) |
|
Form of Restricted Stock Agreement for Senior Executives filed as Exhibit 10.7 to the Company’s Quarterly Report on Form 10-Q for the quarter ended June 30, 2015, filed with the Commission on August 4, 2015 and incorporated herein by reference. (1) |
|
|
|
|
|
10.3 (w) |
|
Form of Non-Qualified Stock Option Agreement for Non-Employee directors filed as Exhibit 10.2 to the Company’s Quarterly Report on Form 10-Q for the quarter ended September 30, 2015, filed with the Commission on October 27, 2015 and incorporated herein by reference. (1) |
|
|
|
|
|
10.3 (x) |
|
Form of Restricted Stock Agreement for Non-Employee directors filed as Exhibit 10.3 to the Company’s Quarterly Report on Form 10-Q for the quarter ended September 30, 2015, filed with the Commission on October 27, 2015 and incorporated herein by reference. (1) |
|
|
|
|
|
10.3 (y) |
|
Eagle Materials Inc. Salaried Incentive Compensation Program for Fiscal Year 2016 filed as Exhibit 10.1 to the Current Report on Form 8-K filed with the Commission on May 20, 2015, and incorporated herein by reference.(1) |
|
|
|
|
|
10.3 (z) |
|
Eagle Materials Inc. Cement Companies Salaried Incentive Compensation Program for Fiscal Year 2016 filed as Exhibit 10.2 to the Current Report on Form 8-K filed with the Commission on May 20, 2015 and incorporated herein by reference. (1) |
|
|
|
|
|
10.3 (aa) |
|
Eagle Materials Inc. Concrete and Aggregates Companies Salaried Incentive Compensation Program for Fiscal Year 2016 filed as Exhibit 10.3 to the Current Report on Form 8-K filed with the Commission on May 20, 2015 and incorporated herein by reference. (1) |
|
|
|
|
110
|
|
Eagle Materials Inc. American Gypsum Company Salaried Incentive Compensation Program for Fiscal Year 2016 filed as Exhibit 10.4 to the Current Report on Form 8-K filed with the Commission on May 20, 2015 and incorporated herein by reference. (1) |
|
|
|
|
|
|
10.3 (cc) |
|
Eagle Materials Inc. Special Situation Program for Fiscal Year 2016 filed as Exhibit 10.5 to the Current Report on Form 8-K filed with the Commission on May 20, 2015 and incorporated herein by reference. (1) |
|
|
|
|
|
10.4 |
|
The Eagle Materials Inc. Amended and Restated Supplemental Executive Retirement Plan filed as Exhibit 10.4 to the Company’s Annual Report on Form 10-K for the fiscal year ended March 31, 2000, filed with the Commission on June 21, 2000 and incorporated herein by reference. (1) |
|
|
|
|
|
10.4 (a) |
|
First Amendment to the Eagle Materials Inc. Amended and Restated Supplemental Executive Retirement Plan, dated as of May 11, 2004, filed as Exhibit 10.4(a) to the Company’s Annual Report on Form 10-K for the fiscal year ended March 31, 2006, filed with the Commission on June 2, 2006 and incorporated herein by reference. (1) |
|
|
|
|
|
10.5 |
|
Trademark License and Name Domain Agreement dated January 30, 2004 between the Company and Centex Corporation filed as Exhibit 10.5 to the Company’s Annual Report on Form 10-K for the fiscal year ended March 31, 2004, filed with the Commission on June 14, 2004 and incorporated herein by reference. |
|
|
|
|
|
10.6 |
|
Tax Separation Agreement dated as of April 1, 1994, among Centex, the Company and its subsidiaries filed as Exhibit 10.6 to the Company’s Annual Report on Form 10-K for the fiscal year ended March 31, 2005, filed with the Commission on June 10, 2005 and incorporated herein by reference. |
|
|
|
|
|
10.7 |
|
Paperboard Supply Agreement, dated May 14, 1998, by and among Republic Paperboard Company (n/k/a Republic Paperboard Company LLC), Republic Group, Inc., and James Hardie Gypsum, Inc. filed as Exhibit 10.11 to the Company’s Annual Report on Form 10-K for the fiscal year ended March 31, 2001, filed with the Commission on June 27, 2001 and incorporated herein by reference. Portions of this Exhibit were omitted pursuant to a request for confidential treatment filed with the Office of the Secretary of the Securities and Exchange Commission. |
|
|
|
|
|
10.7 |
|
Form of Indemnification Agreement between the Company and each of its directors filed as Exhibit 10.9 to the Company’s Annual Report on Form 10-K for the fiscal year ended March 31, 2004, filed with the Commission on June 14, 2004 and incorporated herein by reference. |
|
|
|
|
|
10.7 |
|
Eagle Materials Inc. Director Compensation Summary filed as Exhibit 10.1 to the Company’s Quarterly Report on Form 10-Q for the quarter ended September 30, 2015, filed with the Commission on October 27, 2015 and incorporated herein by reference. (1). |
|
|
|
|
|
10.7 |
|
Securities Purchase Agreement between Northern White Sand LLC and the sellers named therein, dated October 16, 2014, filed as Exhibit 2.1 to the Company’s Form 10-Q for the quarter ended September 30, 2014, filed with the Commission on November 5, 2014 and incorporated herein by reference. |
|
|
|
|
|
10.7 |
|
Retirement and Consulting Agreement, dated January 25, 2016, between the Company and Steven R. Rowley, filed as Exhibit 10.1 to the Company’s Current Report on Form 8-K filed with the Commission on January 26, 2016 and incorporated herein by reference. (1) |
|
|
|
|
|
12.1* |
|
Computation of Ratio of Earnings to Fixed Charges. |
|
|
|
|
|
21* |
|
Subsidiaries of the Company. |
|
|
|
|
|
23.1* |
|
Consent of Registered Independent Public Accounting Firm – Ernst & Young LLP. |
|
|
|
|
|
31.1* |
|
Certification of the Chief Executive Officer of Eagle Materials Inc. pursuant to Rules 13a-14 and 15d-14 promulgated under the Securities Exchange Act of 1934, as amended. |
|
|
|
|
|
31.2* |
|
Certification of the Chief Financial Officer of Eagle Materials Inc. pursuant to Rules 13a-14 and 15d-14 promulgated under the Securities Exchange Act of 1934, as amended. |
|
|
|
|
|
32.1* |
|
Certification of the Chief Executive Officer of Eagle Materials Inc. pursuant to 18 U.S.C. Section 1350, as adopted pursuant to Section 906 of the Sarbanes-Oxley Act of 2002. |
|
|
|
|
|
32.2* |
|
Certification of the Chief Financial Officer of Eagle Materials Inc. pursuant to 18 U.S.C. Section 1350, as adopted pursuant to Section 906 of the Sarbanes-Oxley Act of 2002. |
|
|
|
|
|
95* |
|
Mine Safety Disclosure |
111
|
|
|
|
|
101.INS* |
|
XBRL Instance Document. |
|
|
|
|
|
101.SCH* |
|
XBRL Taxonomy Extension Schema Document. |
|
|
|
|
|
101.CAL* |
|
XBRL Taxonomy Extension Calculation Linkbase Document. |
|
|
|
|
|
101.DEF* |
|
XBRL Taxonomy Extension Definition Linkbase Document. |
|
|
|
|
|
101.LAB* |
|
XBRL Taxonomy Extension Label Linkbase Document. |
|
|
|
|
|
101.PRE* |
|
XBRL Taxonomy Extension Presentation Linkbase Document. |
|
|
|
* |
Filed herewith. |
|
(1) |
Required to be identified as a management contract or a compensatory plan or arrangement pursuant to Item 15(a) (3) of Form 10-K. |
112