Attached files
| file | filename |
|---|---|
| 8-K - 8-K - Ameris Bancorp | v440915_8k.htm |
Exhibit 99.1

Ameris Bancorp 1 st Quarter 2016 Earnings Presentation Edwin W. Hortman, Jr. – President & CEO Dennis J. Zember, Jr. – EVP & CFO

This presentation contains certain performance measures determined by methods other than in accordance with accounting principles generally accepted in the United States of America (“GAAP”) . Management of Ameris Bancorp (the “Company”) uses these non - GAAP measures in its analysis of the Company’s performance . These measures are useful when evaluating the underlying performance and efficiency of the Company’s operations and balance sheet . The Company’s management believes that these non - GAAP measures provide a greater understanding of ongoing operations, enhance comparability of results with prior periods and demonstrate the effects of significant gains and charges in the current period . The Company’s management believes that investors may use these non - GAAP financial measures to evaluate the Company’s financial performance without the impact of unusual items that may obscure trends in the Company’s underlying performance . These disclosures should not be viewed as a substitute for financial measures determined in accordance with GAAP, nor are they necessarily comparable to non - GAAP performance measures that may be presented by other companies . Tangible common equity and Tier 1 capital ratios are non - GAAP measures . The Company calculates the Tier 1 capital using current call report instructions . The Company’s management uses these measures to assess the quality of capital and believes that investors may find them useful in their evaluation of the Company . These capital measures may, or may not be necessarily comparable to similar capital measures that may be presented by other companies . This presentation may contain statements that constitute “forward - looking statements” within the meaning of Section 27 A of the Securities Act of 1933 , as amended, and Section 21 E of the Securities Exchange Act of 1934 , as amended . The words “believe”, “estimate”, “expect”, “intend”, “anticipate” and similar expressions and variations thereof identify certain of such forward - looking statements, which speak only as of the dates which they were made . The Company undertakes no obligation to publicly update or revise any forward - looking statements, whether as a result of new information, future events or otherwise . Readers are cautioned that any such forward - looking statements are not guarantees of future performance and involve risks and uncertainties and that actual results may differ materially from those indicated in the forward - looking statements as a result of various factors . Readers are cautioned not to place undue reliance on these forward - looking statements and are referred to the Company’s periodic filings with the Securities and Exchange Commission for a summary of certain factors that may impact the Company’s results of operations and financial condition . Cautionary Statements
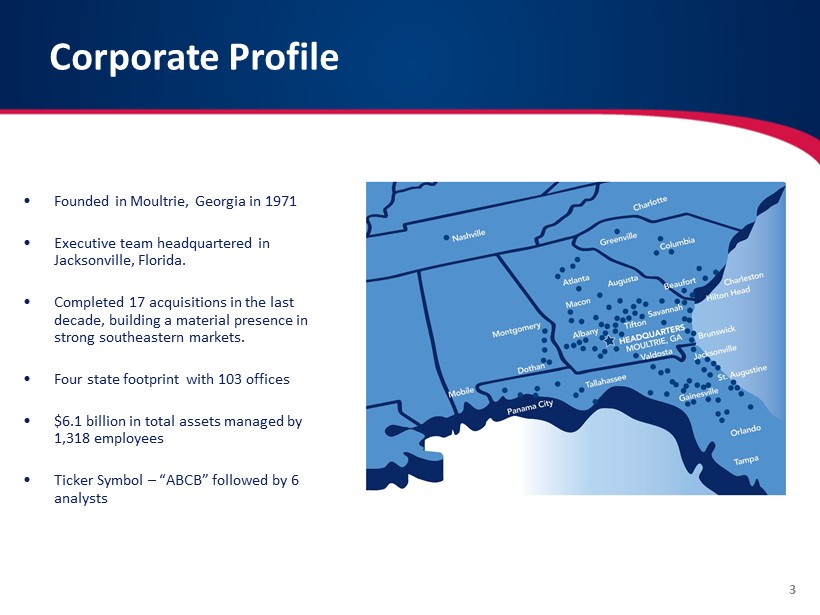
Corporate Profile • Founded in Moultrie, Georgia in 1971 • Executive team headquartered in Jacksonville, Florida. • Completed 17 acquisitions in the last decade, building a material presence in strong southeastern markets. • Four state footprint with 103 offices • $6.1 billion in total assets managed by 1,318 employees • Ticker Symbol – “ABCB” followed by 6 analysts 3

Almost singular focus of our team right now is “to produce top quartile operating results, consistently . ” • Maintain double digit revenue growth with 12 % - 15 % growth in loans, funded almost entirely with low cost deposits augmented by highly profitable and growing lines of business (Mortgage, SBA and Treasury) • Expense management aimed at producing low single digit growth rates in operating expenses . Continued corporate restructure, branch consolidations with better administrative efficiency until we achieve our efficiency ratio goals . Current Focus Improved and More Consistent Operating Performance M&A Opportunities Still looking at M&A opportunities but being highly selective discipline regarding our three criteria : • Neutral (or almost neutral) to TBV • Accretive to our franchise • Meaningfully accretive to EPS (relative to size of acquisition) Anticipate growing through $ 10 billion hurdle with a combination of organic growth and M&A . Refine an Already Strong Balance Sheet • Building significant diversification into our Balance sheet with focus on asset classes with lower long term loss rates . • Insulate ourselves from rate movements and economic swings with highly stable, non - rate sensitive deposits . • Grow capital levels and book value through higher than average ROAs and ROTCE . 4

• Operating Return on Average Assets of 1 . 18 % • Operating Return on Tangible Capital of 16 . 59 % . • Net Interest Margin of 3 . 80 % excluding accretion . Accretion income only 3 . 9 % of total revenue . • Making Headway on Operating Efficiency : – Net Overhead Ratio down to 1 . 78 % , from 2 . 12 % a year ago . Incremental net overhead over the last 12 months totaled only $ 1 . 7 million despite 38 % growth in average assets (or $ 1 . 54 billion of growth) . – Operating efficiency of 65 . 9 % in the first quarter of 2016 compared to 72 . 4 % in the first quarter of 2015 . Executive Summary – 1Q 2016 Operating Ratios in the top Quartile M&A Opportunities • M&A conversations are ongoing and we are confident that there will be opportunities in 2016 . Momentum going into 2Q 2016 • Commercial loan pipelines at the highest levels . Pricing is consistent . Credit underwriting metrics unchanged . • Retail Mortgage and Warehouse lending built strong trends during last month of 1 Q . • Treasury and Retail produced $ 72 . 5 million of growth in NIB . Funded 63 % of our all loan growth, including mortgage pools . 5

1 st Quarter Operating Results First Quarter 2016 Results • 33 % growth in spread income results from successful deployment of liquidity from 2015 M&A and organic growth . • Steady levels of accretion income despite increasingly small percentage of revenue and EPS . • Total credit costs inside our forecast for 3 consecutive quarters . • Non - interest income stronger on mortgage and SBA revenues . • OPEX down $ 2 . 0 million versus linked quarter . Up 21 % compared to 1 Q 15 compared to 32 % growth in total revenue . • Effective tax rate increased to 33 . 7 % compared to 32 . 7 % in the same quarter 2015 . Net Income, operating basis 1Q 16 4Q 15 1Q 15 Linked Q 1Q 15 Net Interest Income, before Accretion 47,494 45,706 35,735 3.9% 32.9% Accretion Income 2,942 2,912 3,097 1.0% -5.0% Net Interest income 50,436 48,618 38,832 3.7% 29.9% Provision for loan losses 681 553 1,069 23.1% -36.3% Non-interest Income 24,286 22,407 17,575 8.4% 38.2% Non-interest expense, operating 49,241 51,221 40,812 -3.9% 20.7% Pretax Income 24,800 19,251 14,526 28.8% 70.7% Taxes 8,350 3,928 4,752 112.5% 75.7% Net Income, operating basis 16,450 15,323 9,774 7.4% 68.3% EPS 0.50$ 0.47$ 0.32$ ROA 1.18% 1.13% 0.96% ROTCE 15.42% 15.10% 10.26% Net Interest Margin 4.03% 3.98% 4.39% Net Interest Margin, ex accretion 3.80% 3.74% 4.05% Net Overhead Ratio 1.78% 2.12% 2.28% Efficiency ratio, operating 65.90% 72.12% 72.35% Effective Tax Rate 33.7% 20.4% 32.7% Average Diluted Shares 33,054 32,595 30,796 Note > Amounts above and all ratios are presented on an operating basis excluding charges shown below. Non-Operating Amounts 1Q 16 4Q 15 1Q 15 Merger/Conversion Related Charges 6,359 1,807 15 Credit Related Charge - - Tax Effect (2,226) (632) (5) Total Non-Operating Impact on Earnings 4,133 1,175 10 EPS, Reported 0.37$ 0.43$ 0.32$ 1Q 2016 Highlights Change versus: 6

Revenues – 1Q16 Spread revenue improved 30 % over 1 Q 15 . • Spread income and Margin upside – 32 % of earning assets yielding 3 . 00 % or less compared to quarterly loan production levels of approximately 4 . 42 % . • 3 . 29 % - Incremental margin (growth in spread compared to growth in earning assets) for last 12 months represents a concentration in mortgage pools as a short - term strategy . Very low incremental overhead associated with the earning asset growth over last 12 months . • 1 Q 16 Accretion income of $ 2 . 9 million vs . $ 3 . 0 million in 1 Q 15 and $ 2 . 9 million in 4 Q 15 . Non - Interest Income moved higher with Mortgage • Mortgage Revenues up 19 % over 4 Q 15 and up 26 % over 1 Q 15 . 1 Q 16 mortgage production totaled $ 268 million compared to $ 254 million in 4 Q 15 and $ 188 million in 1 Q 15 . • Gain on sale margins improved to 410 bps in 1 Q 16 . • Implementing new service charge routines that should impact deposit charges in 2 H 16 . Strong Growth in Revenue $47.6 $48.9 $54.6 $53.6 $53.8 $59.3 $69.7 $68.9 $72.5 $20.0 $40.0 $60.0 $80.0 1Q 14 2Q 14 3Q 14 4Q 14 1Q 15 2Q 15 3Q 15 4Q 15 1Q 16 Total Quarterly Revenue (in millions) 7

Non - Interest Income – 1Q16 • Deposit charges up 54 % in 1 Q 16 vs . 1 Q 15 , resulting from BoA and M&S acquisitions . • Mortgage revenue up 36 . 4 % , mortgage net income up 47 . 2 % over 1 Q 15 . Additional mortgage bankers recruited in 4 Q at expected production levels . • Mortgage profitability margins much higher than industry average . Focused on relationships with builders, brokers and R/E agents . • SBA revenues up 44 % in 1 Q 16 compared to 1 Q 15 . SBA net income contribution up 56 % in 2015 . $20.6 $25.9 $37.8 $46.5 $62.8 $85.6 $97.1 $0.0 $20.0 $40.0 $60.0 $80.0 $100.0 $120.0 2010 2011 2012 2013 2014 2015 2016 Annlzd Non - Interest Income (in millions) $1.13 $2.69 $4.03 $4.67 $3.45 $4.54 27.6% 0.00% 10.00% 20.00% 30.00% 40.00% 50.00% $0.00 $1.00 $2.00 $3.00 $4.00 $5.00 1Q14 2Q14 3Q14 4Q14 1Q15 2Q15 3Q15 4Q15 1Q16 Mortgage/SBA Net Income (millions) and Percentage of Consolidated Net Income • Net income from non - interest income LOBs up 49 % over the same quarter in 2015 • BUT … contribution to total consolidated earnings down from 31 . 2 % to 27 . 6 % in the most recent quarter . 8

Mortgage Results – 1Q16 Mortgage Division Statistics ($’ in 000’s) 1Q16 4Q15 3Q15 2Q15 1Q15 Mortgage Origination Production $268,639 $254,237 $311,007 $285,626 $188,297 Open Pipeline (locked loans) $135,600 $94,478 $105,290 $115,888 $110,856 Purchase % 83% 84% 86% 79% 75% FHA/VA % 41% 41% 43% 43% 43% Gain on Sale % 4.10% 3.55% 3.52% 3.76% 4.57% Retail Mortgage Bankers 95 96 91 75 64 Avg Production / Banker $ 2,401 $ 2,284 $ 2,884 $ 3,037 $ 2,432 Net Income / Banker $ 31.34 $ 20.75 $ 34.15 $ 29.96 $ 30.08 Warehouse Lending Production $ 565,207 $ 490,321 $ 521,901 $ 551,398 $ 404,702 Units (# of loans) 2,579 2,350 2,481 2,507 1,868 Number of customers 84 72 76 76 74 Approved Lines of Credit $ 340,000 $ 230,000 $ 227,500 $ 227,000 $ 196,000 Average days to roll 12 15 13 14 13 Portfolio Lending Portfolio Size $ 133,754 $ 108,233 $ 87,331 $ 68,154 $ 54,929 Portfolio Yield 4.59% 4.62% 4.64% 4.59% 4.57% Average loan size $ 247,692 $ 240,517 $ 236,029 $ 231,030 $ 230,793 • Origination volumes up 42 % compared to same quarter in 2015 . • Open pipeline up 22 % compared to same quarter in 2015 . • Growth in production and pipelines compared to same quarter in 2015 gives us confidence in mortgage’s contribution to our 2016 earnings . • Approved LOCs in Warehouse lending increased substantially in 1 Q . Expect volume in 2 q and 3 q to benefit materially from additional customers . 9
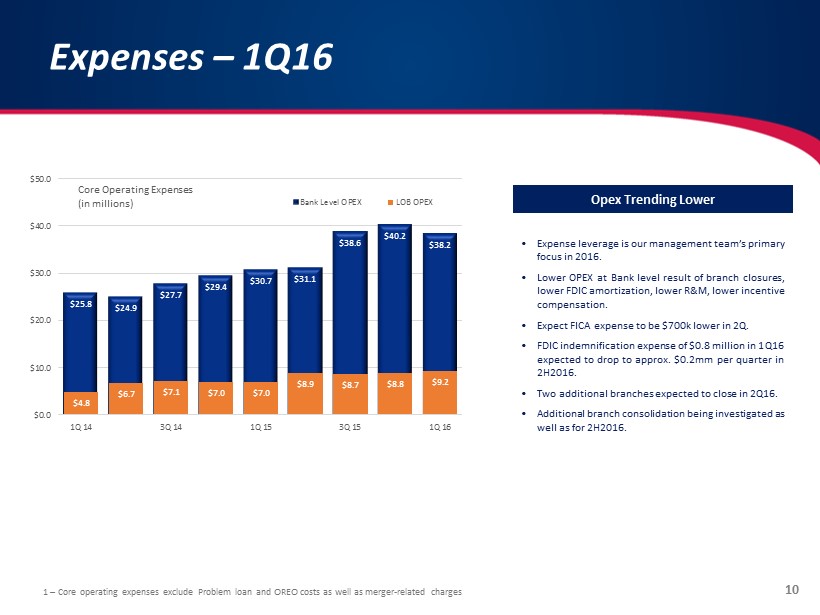
Expenses – 1Q16 • Expense leverage is our management team’s primary focus in 2016 . • Lower OPEX at Bank level result of branch closures, lower FDIC amortization, lower R&M, lower incentive compensation . • Expect FICA expense to be $ 700 k lower in 2 Q . • FDIC indemnification expense of $ 0 . 8 million in 1 Q 16 expected to drop to approx . $ 0 . 2 mm per quarter in 2 H 2016 . • Two additional branches expected to close in 2 Q 16 . • Additional branch consolidation being investigated as well as for 2 H 2016 . 1 – Core operating expenses exclude Problem loan and OREO costs as well as merger - related charges Opex Trending Lower $25.8 $24.9 $27.7 $29.4 $30.7 $31.1 $38.6 $40.2 $38.2 $4.8 $6.7 $7.1 $7.0 $7.0 $8.9 $8.7 $8.8 $9.2 $0.0 $10.0 $20.0 $30.0 $40.0 $50.0 1Q 14 3Q 14 1Q 15 3Q 15 1Q 16 Core Operating Expenses (in millions) Bank Level OPEX LOB OPEX 10
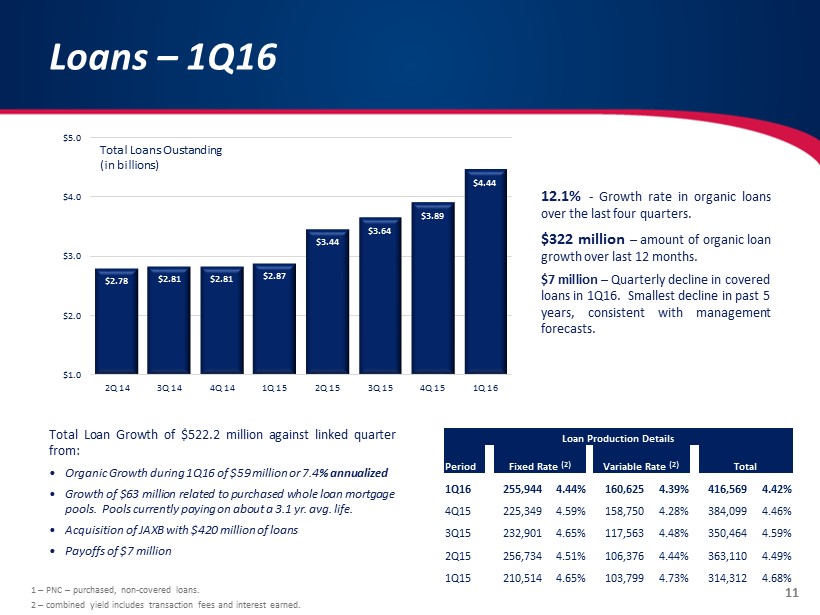
Loans – 1Q16 Total Loan Growth of $ 522 . 2 million against linked quarter from : • Organic Growth during 1 Q 16 of $ 59 million or 7 . 4 % annualized • Growth of $ 63 million related to purchased whole loan mortgage pools . Pools currently paying on about a 3 . 1 yr . avg . life . • Acquisition of JAXB with $ 420 million of loans • Payoffs of $ 7 million 1 – PNC – purchased, non - covered loans. 2 – combined yield includes transaction fees and interest earned. 12 . 1 % - Growth rate in organic loans over the last four quarters . $ 322 million – amount of organic loan growth over last 12 months . $ 7 million – Quarterly decline in covered loans in 1 Q 16 . Smallest decline in past 5 years, consistent with management forecasts . Loan Production Details Period Fixed Rate (2) Variable Rate (2) Total 1Q16 255,944 4.44% 160,625 4.39% 416,569 4.42% 4Q15 225,349 4.59% 158,750 4.28% 384,099 4.46% 3Q15 232,901 4.65% 117,563 4.48% 350,464 4.59% 2Q15 256,734 4.51% 106,376 4.44% 363,110 4.49% 1Q15 210,514 4.65% 103,799 4.73% 314,312 4.68% $2.78 $2.81 $2.81 $2.87 $3.44 $3.64 $3.89 $4.44 $1.0 $2.0 $3.0 $4.0 $5.0 2Q 14 3Q 14 4Q 14 1Q 15 2Q 15 3Q 15 4Q 15 1Q 16 Total Loans Oustanding (in billions) 11

Loan Portfolio - Diversified Dec - 2007 Loan Mix vs. Mar - 2016 Loan Mix 2007 Portfolio Characteristics • Concentrated in Commercial Real Estate, 42% of which was construction or development. • A&D was concentrated on the South Georgia Coast and the Florida Panhandle in economies that were not driven by industry. • Mortgage loans were concentrated in bank customers that did not or could not acquire secondary market financing. • Vast majority of the approval authority rested with our bank presidents and their regional executives. 1Q 2016 Loan Portfolio 2007 Loan Portfolio 2016 Portfolio Characteristics • Significantly better diversification with larger investments in Mortgage and Municipal credits. Only 20% of CRE is A&D oriented. • CRE assets concentrated in Atlanta, Jacksonville, Columbia, Savannah and Charleston. Construction assets are in high growth markets with large builders. • 61% of Mortgage assets are with secondary type assets (65%) with full doc underwriting. 14% of our mortgage assets have a guaranteed take out by super - regional purchasers. 47% of the assets are highly - marketable secondary ARM. • Approval authority rests with 5 regional credit officers. Credit admin team includes 22 portfolio managers, as well as credit support teams specifically for construction, CRE, and municipal assets. Comm'l Real Estate , 43.00% Mortgage , 37.00% Municipal & Ag , 9.00% Loss Share , 2.00% Other , 9.00% 12

Loan Portfolio – CRE Concentrations Dec - 2007 vs. Mar - 2016 • Only 8% of total loans are in Construction or A&D. • Nominally, we have less in Construction and A&D than we did in 2007, despite a loan portfolio 2.5x as large. • Construction portfolio is split 45% residential and 55% commercial. Average commercial construction commitment is $899,000. • Average CRE loan is $366,700 • 61% of our CRE portfolio is in Atlanta, Charleston, Jacksonville, Savannah or Columbia. 1Q 2016 Commercial Real Estate Portfolio 2007 Commercial Real Estate Portfolio Owner Occupied , 32% Investor , 44% Construction , 12% Acquisition & Development , 7% Multi - Family , 5% Owner Occupied , 24% Investor , 30% Construction , 14% Acquisition & Development , 28% Multi - Family , 4% 13

Loan Portfolio – Mortgage Pools • One past due loan at 3/31/16, representing a past due ratio of 0.11% • Selective purchases of higher quality mortgage pools • Yield pick - up of approximately 130bps compared to comparable mortgage backed securities with no OCI risk • Focused our underwriting and loan selection on four criteria: • Amortized LTVs under 70% (vs. at origination) • Lower DTI’s • FICOs over 720 • Strong cash reserves post closing Deal Principal at Purchase Date Current Bal of Pool (1) Avg Loan Size Avg Cash Reserves Wtd Avg Life (years) Wtd Avg Yield (2) LTV DTI FICO Pool 1 $41,308 $33,449 $861 $1,085 2.70 3.58% 59 38 759 Pool 2 $129,351 $113,844 $1,187 $892 2.60 3.76% 49 35 724 Pool 3 $93,100 $75,556 $980 $602 2.80 3.26% 71 37 747 Pool 4 $21,366 $14,127 $855 $275 2.20 3.01% 72 29 765 Pool 5 $132,606 $122,941 $1,153 $890 2.70 3.00% 68 32 749 Pool 6 $74,135 $70,409 $988 $535 3.00 3.02% 68 37 748 Pool 7 $82,736 $77,272 $803 $422 2.90 2.98% 64 33 761 Pool 8 $47,931 $47,301 $374 $336 2.60 3.03% 67 32 758 Pool 9 $88,462 $88,395 $1,041 $ 2,008 2.50 3.10% 58 31 767 Total $710,995 $643,296 $984 $870 2.71 3.21% 63 34 750 (1) – Current balance presented above does not include any purchase premiums or discounts (2) - Effective yield for the quarter ending March 31, 2016. 14

Credit Quality – 1Q16 • 42 % decline in legacy NPAs over the last 12 months • 23 % decline in total NPAs despite approximately $ 12 million in acquired NPAs through acquisitions/covered reclass . Net Charge - offs presented on a 4 quarter rolling average Non - Performing Assets to Total Assets Net Charge - offs to Loans • Net Charge - offs declining to levels management believes is sustainable • Significant level of diversification in portfolio allow Ameris Bank to outperform in weaker economic environments . 2.72% 2.55% 2.26% 2.20% 1.42% 1.06% 1.00% 2.00% 3.00% 1Q 13 3Q 13 1Q 14 3Q 14 1Q 15 3Q 15 1Q 16 1.26% 0.99% 0.72% 0.49% 0.33% 0.29% 0.22% 0.00% 0.50% 1.00% 1.50% 1Q 13 3Q 13 1Q 14 3Q 14 1Q 15 3Q 15 1Q 16 15

Top 300 Relationships Relative Size of our Top 300 Relationships • Top Relationships are small relative to our capital levels and our legal lending limit . • Looking for larger deals, but not making big bets especially on CRE . • 31 % of our top 50 relationship $ ’s have liquid collateral or are municipal credits backed by taxing authority . $26.21 $6.77 $4.83 $3.67 $2.87 $2.47 $2.22 $- $5 $10 $15 $20 $25 $30 Relationship Size (millions) Number of Relationships Relationship Groupings Total Principal (in millions) Percent of Total Portfolio Top 25 relationships $303.94 7.08% Top 50 relationships $473.47 11.02% Top 100 relationships $702.14 16.35% Top 250 relationships $1,133.93 26.40% Top 300 relationships $1,237.10 28.80% Individual Groupings Principal (millions) Largest Relationship $26.21 10th Largest Relationship $17.72 50th Largest Relationship $ 6.77 100th Largest Relationship $ 4.83 200th Largest Relationship $ 2.87 300th Largest Relationship $2.22 16

Deposits – 1Q16 • 95 % - Percentage of all fixed rate loans (including short - duration mortgage arms) funded with non - rate sensitive deposits at 12 / 31 / 15 (up from 96 . 0 % at EOY 2014 ) . • $ 1 . 02 Billion – Growth in low cost, non - rate sensitive deposits during last 12 months . • 23 . 6 % – 5 Year Compounded Growth Rate in low cost, non - rate sensitive deposits . Non - Rate Sensitive Deposits include NIB, NOW and Savings Accounts. • 0 . 075 % – weighted average cost of this group of low cost, non - rate sensitive deposits (down from 0 . 091 % a year ago) . $791 $817 $839 $967 $1,280 $1,276 $1,330 $1,529 $200 $600 $1,000 $1,400 $1,800 2Q 14 3Q 14 4Q 14 1Q 15 2Q 15 3Q 15 4Q 15 1Q 16 NIB Demand Deposits (in millions) 17

Capital and TBV – 1Q16 Last 3 M&A deals have been neutral or accretive to TBV Earnings less quarterly dividend grows TBV approximately 3.5% - 4.0% per quarter. Consistent Growth in TBV $10.26 $10.68 $10.99 $13.01 $11.81 $12.31 $12.65 $13.13 $7.00 $9.00 $11.00 $13.00 $15.00 2Q 14 3Q 14 4Q 14 1Q 15 2Q 15 3Q 15 4Q 15 1Q 16 Tangible Book Value 18

• Diversified loan portfolio . Only 40 % in CRE and only 7 % in Construction/A&D • Asset sensitive – over 100 % of fixed rate loans funded with non - rate sensitive deposits . • Capital levels – capital levels are adequate and building, ensuring no need for additional outside capital . Investment Rationale Strong & Stable Balance Sheet • Top Quartile ROA – Top Quartile Growth Rate • ROTCE greater than 15 % . • Diversified revenue sources ( 66 % spread, 34 % non - interest income) . Operating Performance M&A Opportunities • Disciplined Acquirer • Announced/Executed low risk deals • Enough conversations underway so that we can avoid auctions • Strong Capital Ratios support additional M&A • Regulatory reputation presents no hurdle 19