Attached files
| file | filename |
|---|---|
| 8-K - 8-K - INDUS REALTY TRUST, INC. | a16-10837_18k.htm |
Exhibit 99.1
MaY 2016 1 Annual meeting presentation
2 Forward-Looking Statements This presentation (the “Presentation”) contains forward-looking statements within the meaning of Section 27A of the Securities Act of 1933, as amended, and Section 21E of the Securities Exchange Act of 1934, as amended. For this purpose, any statements contained in this Presentation that relate to future events or conditions including, without limitation, the statements regarding the cost and timing of completion of a building currently under construction, construction of additional buildings, acquisitions of real estate assets and growth strategy, leasing of currently vacant space and the cash flows that would be generated from leasing currently vacant space, projected average cash on cash return over lease terms, industry prospects or Griffin’s plans, expectations, or prospective results of operations or financial position, may be deemed to be forward-looking statements. Without limiting the foregoing, the words “believes,” “anticipates,” “plans,” “expects” and similar expressions are intended to identify forward-looking statements. Such forward-looking statements represent management’s current expectations and are inherently uncertain. There are a number of important factors that could materially impact the value of Griffin’s common stock or cause actual results to differ materially from those indicated by such forward-looking statements. Such factors are described in Griffin’s Securities and Exchange Commission filings, including the “Business”, “Risk Factors” and “Forward-Looking Information” sections in Griffin’s Annual Report on Form 10-K for the fiscal year ended November 30, 2015. Although Griffin believes that its plans, intentions and expectations reflected in such forward-looking statements are reasonable, it can give no assurance that such plans, intentions or expectations will be achieved. The projected information disclosed in this Presentation is based on assumptions and estimates that, while considered reasonable by Griffin as of the date hereof, are inherently subject to significant business, economic, competitive and regulatory uncertainties and contingencies, many of which are beyond the control of Griffin and which could cause actual results and events to differ materially from those expressed or implied in the forward-looking statements. Griffin disclaims any obligation to update any forward-looking statements in this Presentation as a result of developments occurring after the date of this Presentation except as required by law.
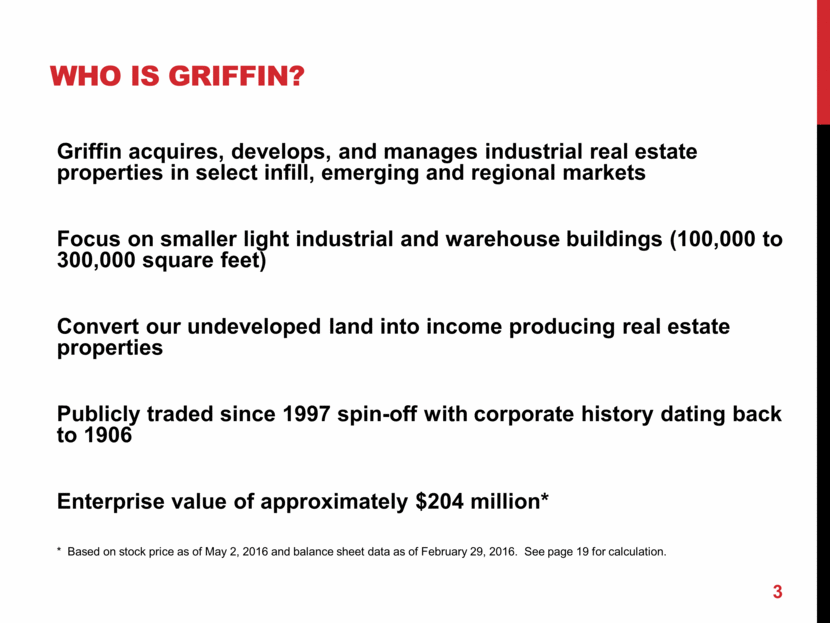
WHO IS GRIFFIN? Griffin acquires, develops, and manages industrial real estate properties in select infill, emerging and regional markets Focus on smaller light industrial and warehouse buildings (100,000 to 300,000 square feet) Convert our undeveloped land into income producing real estate properties Publicly traded since 1997 spin-off with corporate history dating back to 1906 Enterprise value of approximately $204 million* * Based on stock price as of May 2, 2016 and balance sheet data as of February 29, 2016. See page 19 for calculation. 3
Griffin’s portfolio is 3.3 million square feet (1) 87% of the portfolio is Industrial 36% of the portfolio is outside CT 33 buildings, the two largest are each less than 10% of the total square footage 4 Property Summary – Real Estate Includes the 252,000 square foot building being built on speculation in the Lehigh Valley expected to be completed by June 2016. Griffin Portfolio - Square Feet (1)
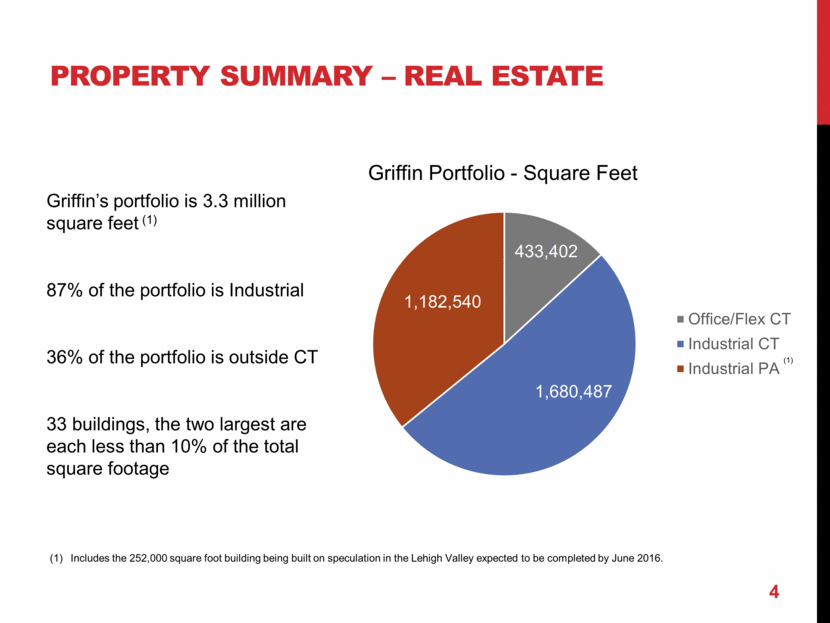
PROPERTY SUMMARY – UNDEVELOPED LAND * Includes all undeveloped acreage, certain portions of which may not be suitable for development or sale. ** As of February 29, 2016. Book value includes Land, Land Improvements and Development Costs. (1) Includes only the undeveloped portion of these projects. (2) Fully approved/entitled for 296 homes in Simsbury, CT. (3) Fully approved subdivision (with major infrastructure, utilities and roads built) with 20 remaining lots held for sale by Griffin. Nurseries in Connecticut (670 acres, $500,000/year in rent) and Florida (1,066 acres). Florida nursery currently marketed for sale or lease. Approximately 30 acres of this land is under agreement to be sold for approximately $3.25 million. Acres* Book Value (MM)** Significant Industrial Parcels Phoenix Crossing (1) 159 $3.3 NE Tradeport (1) 190 $4.5 Significant Commercial/Mixed Use Parcels Griffin Center N & S (1) (5) 275 $1.5 (5) Simsbury Route 10-202 310 $0.2 Significant Residential Meadowood (2) 270 $8.5 Stratton Farms (3) 20 $1.1 Land used for Nursery Operations (4) 1,736 $2.5 Other Land Holdings 1,194 $3.4 TOTAL 4,154 $25.0 5
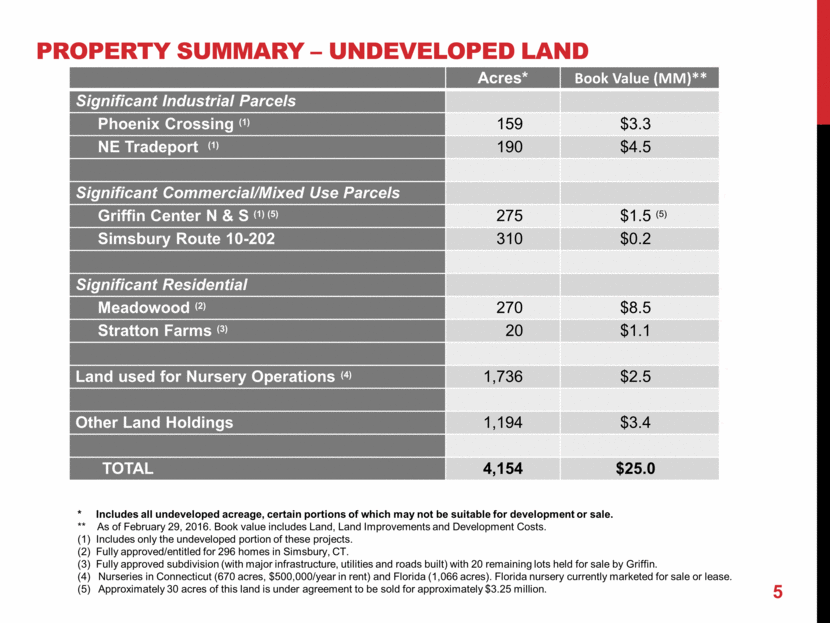
GRIFFIN SINCE 1997 6 1997 (1) Q1 2016 (2) Number of Buildings 14 33 Total Square Feet 386,000 3,296,000 LTM Profit From Leasing Activities(3) $1.8 million $17.7 million Net Book Value of Properties $29.9 million $135.3 million Capital Returned to Shareholders (4) N/A $20.4 million CT Industrial portfolio grew from 160,000 sf to almost 1.7 million sf, the majority of which was built on speculation Completed major land sales (Walgreen’s, Dollar Tree, Amazon) that helped identify the Hartford market as a premier distribution location Land sale proceeds supported speculative development and market expansion into the Lehigh Valley Simplified the company’s asset holdings and narrowed the strategic focus – positioned Griffin for future growth and expansion Includes pro rata square footage of two multi-story office buildings owned by a joint venture in which Griffin held a 30% interest. Griffin purchased the remaining 70% interest in fiscal 2003. Data as of February 29, 2016. Includes the 252,000 square foot building built on speculation in the Lehigh Valley expected to be completed by June 2016. Profit from leasing activities is not a measure calculated in accordance with GAAP. See the appendix for further information. Total of all dividends and share repurchases.
GRIFFIN STRATEGY 7
KEYS TO GROWING CASH FLOW AND increasING SHAREHOLDER VALUE Increase occupancy in existing portfolio Development on existing land holdings Converting owned land (through sale) into income (through development and acquisition) Focused niche acquisition strategy Leverage existing infrastructure/G&A 8
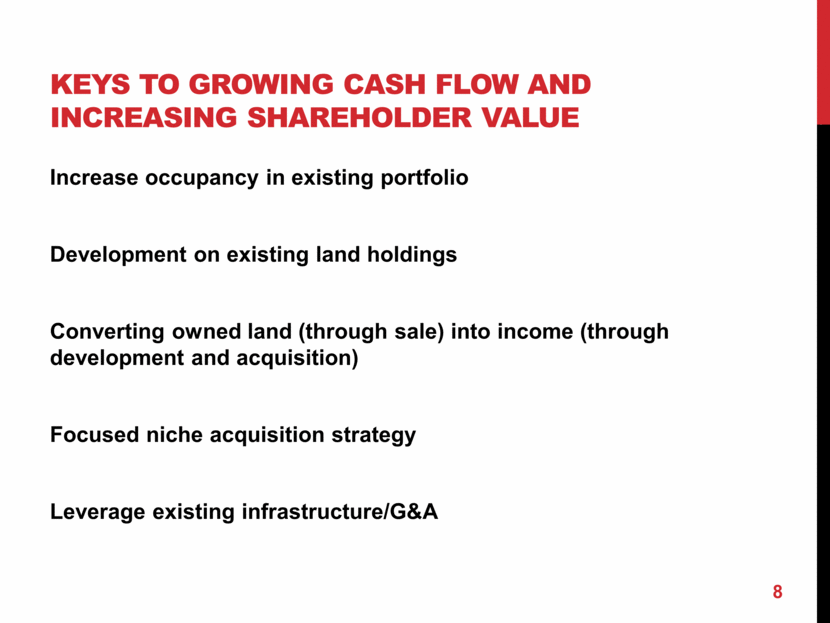
increase occupancy in existing portfolio 9 Square Footage Leased (millions) Note: Square footage and occupancy calculations do not include 252,000 sf from 5210 Jaindl Boulevard which is expected to be completed by June 2016. +56% 74% 79% 84% 89% 92% Occupancy CT/New England continue to be land constrained markets, especially for big box sites Griffin’s CT industrial portfolio was 91% occupied as of Q1 2016 Lehigh Valley market vacancy remains low at approximately 5.5% Griffin’s PA industrial portfolio is 100% leased (excluding spec. building to be completed June 2016) 1.8 1.9 2.3 2.7 2.8 2012 2013 2014 2015 Feb-16
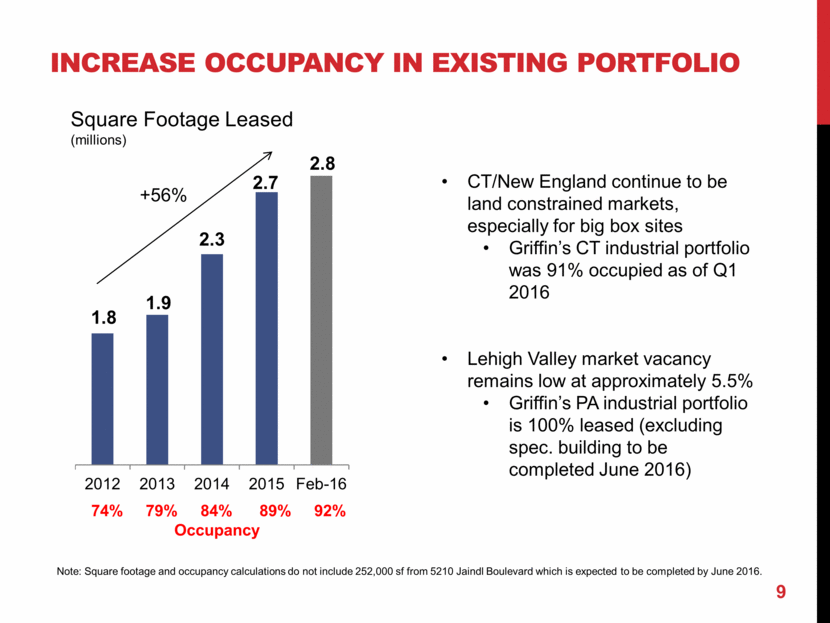
Purchased 51 acre development site in December 2012 for $14.36/buildable square foot or $150,000/acre 532,000 sf, 2 building development Priced below recent comparable sales due to certain in-place site development restrictions, covenants and zoning matters Griffin completed a difficult entitlement process including zoning variances Development on existing property – CASE STUDY: 5220 Jaindl Boulevard Commenced speculative construction of a 280,000 sf building in 2014; delivered in 2015 During site work, Griffin pre-leased the building to Ricoh which was consolidating several distribution/repair locations. Griffin provided Ricoh the flexibility they needed for its staged consolidation Ricoh leased 196,000 sf in July 2015 and had the option to lease the remaining 84,000 sf within a year, which Ricoh exercised Griffin mortgaged the building for $14.1 million in proceeds ($50/SF) - $11.5 million initially and received the balance upon Ricoh’s option exercise for a weighted average interest rate of 3.75%. Griffin’s net investment (after mortgage proceeds) was $5.8 million (including TI/leasing cost) (1) Average expected cash on cash return of 17.9% over the lease term (excluding year 1) At a 6.5% cap rate, building would be valued at $96/sf resulting in 2.2x Griffin’s net investment (1) See appendix for further information. 10 Picture of 5220 Jaindl
ACQUISITION/GROWTH STRATEGY Acquire smaller warehouse/industrial buildings between 100,000 to 300,000 square feet Key regional locations for national or international companies Provide last mile of distribution for users that cannot be accommodated by big box For smaller tenants, the property may be a tenant’s sole or mission critical location Targeted regional strategy Achieve critical mass in handful of targeted markets; initially Northeast and Middle Atlantic Grew Lehigh Valley properties from 120,000 sf to approximately 1.2 million sf Develop deep local market knowledge: leads to proprietary deal sourcing/ways to add value Types of Assets Core or Value-Add Opportunities with conservative underwriting and cap rate discipline Seek to buy at discount to replacement cost - Buy “buildings” (cost/foot) rather than leases Proximity to transportation infrastructure or irreplaceable location Functional and flexible assets – appeals to broad set of users and tenant sizes Acquisitions of Land Seek both entitled and unentitled land to take through approvals to develop warehouses that fit the above criteria (size, location, type) Not seeking to land bank for long term but rather buy parcels for nearer term development 11
CURRENT ACQUISITION/DEVELOPMENT ENVIRONMENT Ownership of industrial real estate assets has become much more concentrated Several large groups (non-traded public REIT, private equity firms) have been purchased by Public REITs or sovereign sponsored entities Entities are well-capitalized and continue to target acquisitions of all sizes Auctions remain very competitive with short due diligence periods and all cash required at closing Building acquisitions currently are expensive both on a cap rate basis and on $/SF Significant increase in pricing over the past 12 months - pricing at historical highs and well above replacement cost with very low cap rates High sales prices/low cap rates despite: (i) properties not under long term leases (5 years or less); (ii) multi-tenanted requiring lease-up costs; and/or (iii) older buildings requiring meaningful near-term/medium-term improvements We estimate levered IRRs in mid single digits with underlying rents already at market highs and assuming cap rates on exit comparable/slightly above current Most recent sales in Lehigh Valley at approx. $100/SF and cap rate of 5%(1) Based on two most recent sales (1H of 2016) of Class A, newly constructed and leased warehouse buildings in the Lehigh Valley (West Hills Business Park) as reported by CBRE, Inc. , JLL and property transaction records. 12
CURRENT ACQUISITION/DEVELOPMENT ENVIRONMENT (cont’d) While building acquisitions have been competitive for the last couple of years, a more recent trend has been the significant increase in land prices with intense competition, even for small parcels Pricing generally implies “fully-leased” yields(1) at well below 7% Includes significant development risk (i.e. unanticipated conditions during construction) Ignores costs for capital (real or implied) Ignores downtime costs until property is leased, and risk property takes a lot longer than expected to reach full occupancy Financing risk – mortgage rates may be materially different upon completion (18-24 months) as compared to today Griffin intends to be patient during the cycle to ensure capital is available to invest in strong cash on cash returning projects Defined as estimated rent at full occupancy divided by total cash investment. 13
FINANCIALS AND Valuation 14
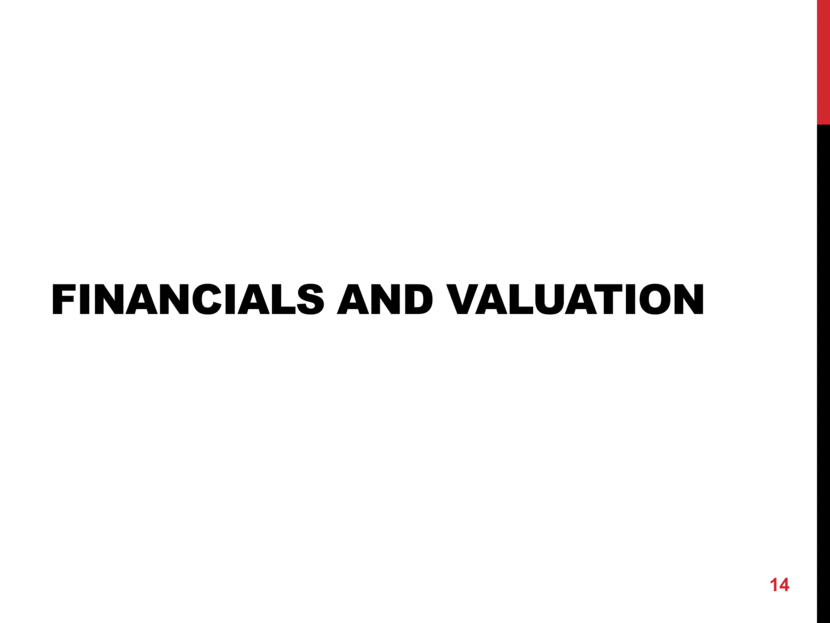
profit from Leasing activities 15 (1) See appendix for further information on Profit from Leasing Activities. Profit From Leasing Activities(1) Growth in overall portfolio square footage coupled with increase in occupancy led to meaningful growth in Profit from Leasing Activities At Q1 2016, Griffin had 238,000 square feet vacant in addition to the space in the nearly complete 252,000 sf building in the Lehigh Valley. Some incremental vacancy expected in the office/flex portfolio by fiscal year end 74% 79% 84% 89% 92% Occupancy $ millions $11.8 $12.6 $12.8 $16.2 $17.7 2012 2013 2014 2015 LTM 2/2016 +49%
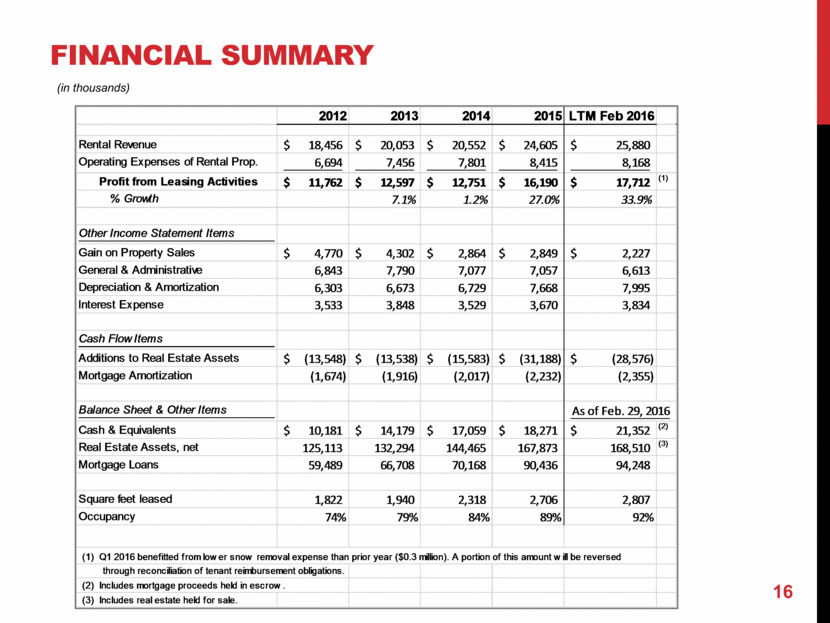
Financial summary 16 (in thousands) 2012 2013 2014 2015 LTM Feb 2016 Rental Revenue $ 18,456 $ 20,053 $ 20,552 $ 24,605 $ 25,880 Operating Expenses of Rental Prop. 6,694 7,456 7,801 8,415 8,168 Profit from Leasing Activities $ 11,762 $ 12,597 $ 12,751 $ 16,190 $ 17,712 (1) % Growth 7.1% 1.2% 27.0% 33.9% Other Income Statement Items Gain on Property Sales $ 4,770 $ 4,302 $ 2,864 $ 2,849 $ 2,227 General & Administrative 6,843 7,790 7,077 7,057 6,613 Depreciation & Amortization 6,303 6,673 6,729 7,668 7,995 Interest Expense 3,533 3,848 3,529 3,670 3,834 Cash Flow Items Additions to Real Estate Assets $ (13,548) $ (13,538) $ (15,583) $ (31,188) $ (28,576) Mortgage Amortization (1,674) (1,916) (2,017) (2,232) (2,355) Balance Sheet & Other Items As of Feb. 29, 2016 Cash & Equivalents $ 10,181 $ 14,179 $ 17,059 $ 18,271 $ 21,352 (2) Real Estate Assets, net 125,113 132,294 144,465 167,873 168,510 (3) Mortgage Loans 59,489 66,708 70,168 90,436 94,248 Square feet leased 1,822 1,940 2,318 2,706 2,807 Occupancy 74% 79% 84% 89% 92% (1) Q1 2016 benefitted from lower snow removal expense than prior year ($0.3 million). A portion of this amount will be reversed through reconciliation of tenant reimbursement obligations. (2) Includes mortgage proceeds held in escrow. (3) Includes real estate held for sale.
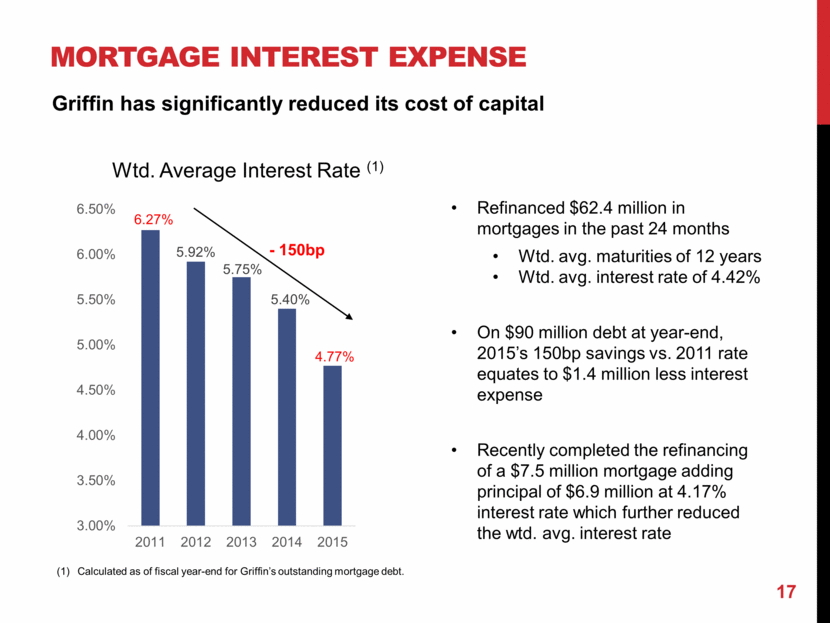
mortgage Interest Expense 17 Calculated as of fiscal year-end for Griffin’s outstanding mortgage debt. Wtd. Average Interest Rate (1) Refinanced $62.4 million in mortgages in the past 24 months Wtd. avg. maturities of 12 years Wtd. avg. interest rate of 4.42% On $90 million debt at year-end, 2015’s 150bp savings vs. 2011 rate equates to $1.4 million less interest expense Recently completed the refinancing of a $7.5 million mortgage adding principal of $6.9 million at 4.17% interest rate which further reduced the wtd. avg. interest rate Griffin has significantly reduced its cost of capital 3.00% 2011 6.27% 2012 5.92% 2013 5.75% 2014 5.40% 2015 4.77% - 150bp
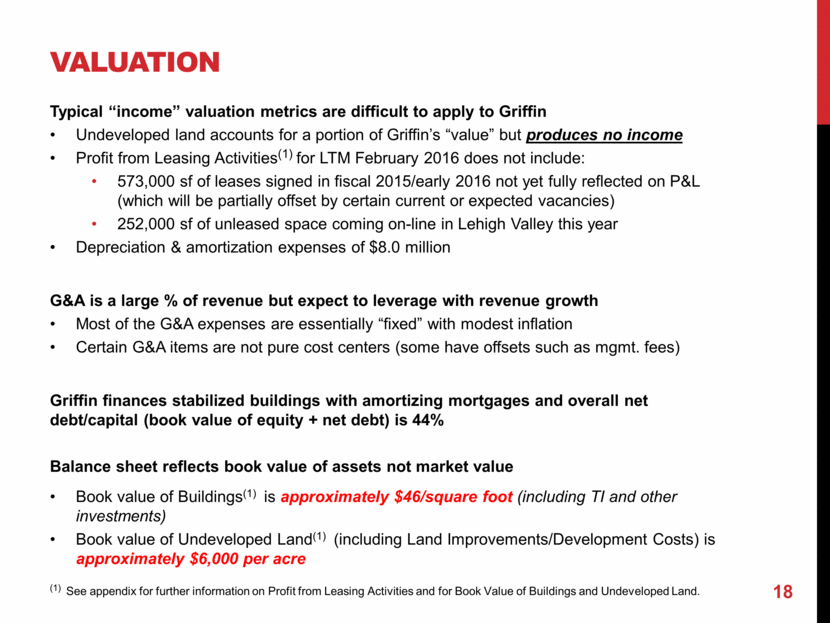
valuation Typical “income” valuation metrics are difficult to apply to Griffin Undeveloped land accounts for a portion of Griffin’s “value” but produces no income Profit from Leasing Activities(1) for LTM February 2016 does not include: 573,000 sf of leases signed in fiscal 2015/early 2016 not yet fully reflected on P&L (which will be partially offset by certain current or expected vacancies) 252,000 sf of unleased space coming on-line in Lehigh Valley this year Depreciation & amortization expenses of $8.0 million G&A is a large % of revenue but expect to leverage with revenue growth Most of the G&A expenses are essentially “fixed” with modest inflation Certain G&A items are not pure cost centers (some have offsets such as mgmt. fees) Griffin finances stabilized buildings with amortizing mortgages and overall net debt/capital (book value of equity + net debt) is 44% Balance sheet reflects book value of assets not market value Book value of Buildings(1) is approximately $46/square foot (including TI and other investments) Book value of Undeveloped Land(1) (including Land Improvements/Development Costs) is approximately $6,000 per acre (1) See appendix for further information on Profit from Leasing Activities and for Book Value of Buildings and Undeveloped Land. 18
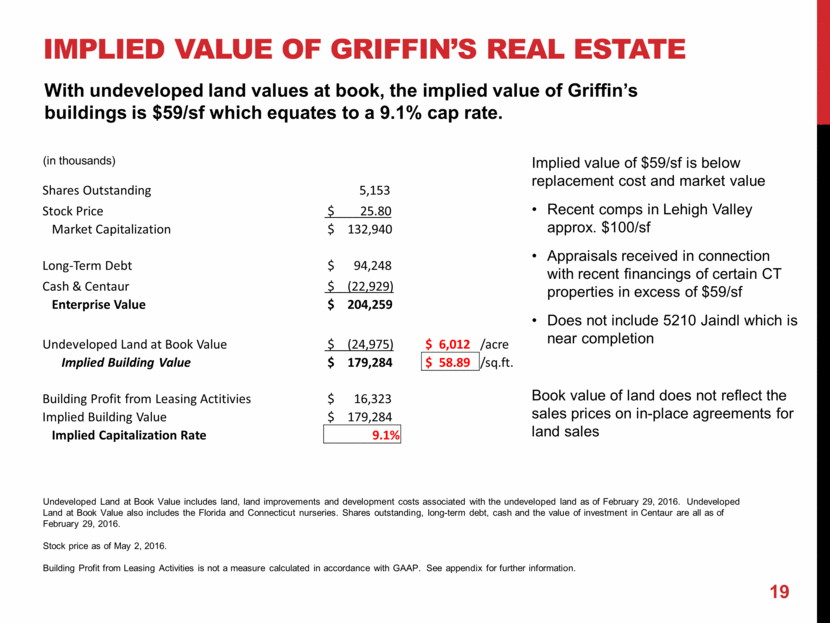
Implied value of $59/sf is below replacement cost and market value Recent comps in Lehigh Valley approx. $100/sf Appraisals received in connection with recent financings of certain CT properties in excess of $59/sf Does not include 5210 Jaindl which is near completion Book value of land does not reflect the sales prices on in-place agreements for land sales (in thousands) 19 Implied value of Griffin’s real estate Undeveloped Land at Book Value includes land, land improvements and development costs associated with the undeveloped land as of February 29, 2016. Undeveloped Land at Book Value also includes the Florida and Connecticut nurseries. Shares outstanding, long-term debt, cash and the value of investment in Centaur are all as of February 29, 2016. Stock price as of May 2, 2016. Building Profit from Leasing Activities is not a measure calculated in accordance with GAAP. See appendix for further information. With undeveloped land values at book, the implied value of Griffin’s buildings is $59/sf which equates to a 9.1% cap rate. Shares Outstanding 5,153 Stock Price $ 25.80 Market Capitalization $ 132,940 Long-Term Debt $ 94,248 Cash & Centaur $ (22,929) Enterprise Value $ 204,259 Undeveloped Land at Book Value $ (24,975) $ 6,012 /acre Implied Building Value $ 179,284 $ 58.89 /sq.ft. Building Profit from Leasing Actitivies $ 16,323 Implied Building Value $ 179,284 Implied Capitalization Rate 9.1%
FISCAL 2015 Year In review WHAT WE DID WELL Significant annual growth in 2015 profit from leasing activities (+27%) with continued increases so far in 2016 Significant improvement in occupancy – 92% overall with Lehigh Valley portfolio at 100% Continued execution of the Lehigh Valley market expansion – completed and fully leased 5220 Jaindl Boulevard (Ricoh) and nearing completion of 5210 Jaindl Boulevard Completed new mortgages and refinancings totaling $48.8 million since the start of 2015, extending maturities to up to 15 years and materially reducing Griffin's weighted average interest rate Continued to grow our capital available for acquisitions and development In recognition of our strong capital position, the current stock valuation and stock price performance over the past year, we announced a $5 million share repurchase plan 20
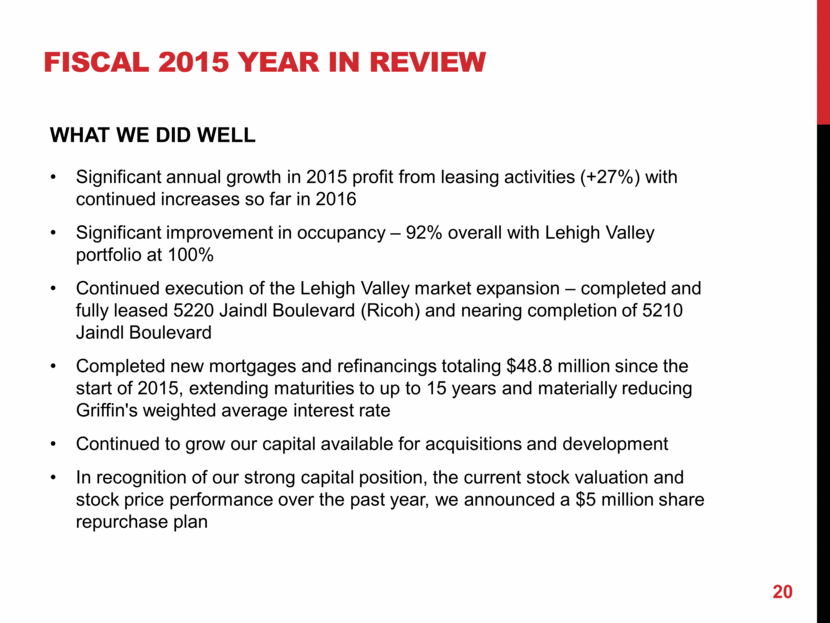
FISCAL 2015 Year In review WHERE WE WANT TO IMPROVE Monetizing land holdings. We did not sell the FL farm as originally expected last year (currently marketed for sale or lease) Limited interest in our residential developments We do have certain land sale agreements in-place We did not acquire any properties (building or land) and do not currently have any properties in our development pipeline We were active participants in several auctions, as well as off-market negotiations, for land and buildings but did not believe sale prices would generate acceptable returns We currently have two parcels in the Lehigh Valley under agreement (subject to due diligence and no certainty they close) Office/Flex portfolio in CT is currently 78% leased with 9% up for renewal in fiscal 2016 and market remains very competitive with limited absorption and high vacancy Stock price did not reflect the strong improvements in our operating results or our reduced cost of capital resulting from mortgage refinancings 21
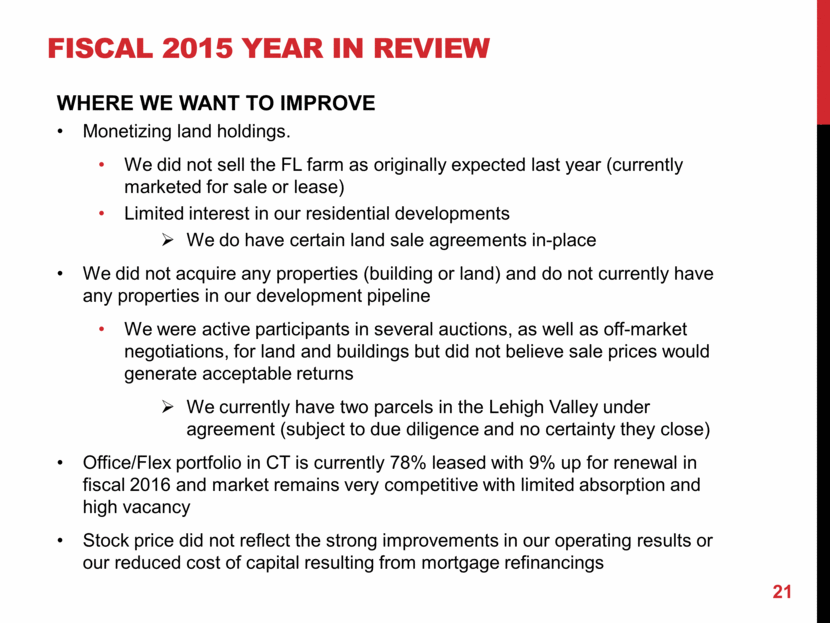
WHO IS GRIFFIN? Griffin acquires, develops, and manages industrial real estate properties in select infill, emerging and regional markets Focus on smaller light industrial and warehouse buildings (100,000 to 300,000 square feet) Convert our undeveloped land into income producing real estate properties Publicly traded since 1997 spin-off with corporate history dating back to 1906 Enterprise value of approximately $204 million* * Based on stock price as of May 2, 2016 and balance sheet data as of February 29, 2016. See page 19 for calculation. 22
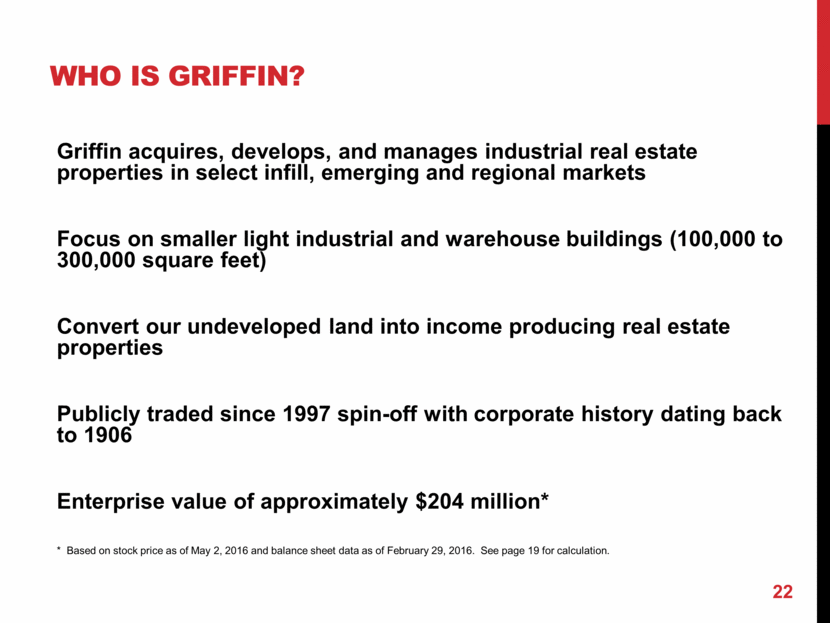
Appendix - NOTES Profit From Leasing Activities (pages 6, 15, 16 and 18) Profit From Leasing Activities is defined as the Rental Revenues less Operating Expenses of Rental Properties and does not include depreciation or general and administrative expenses. Building Profit From Leasing Activities is defined as Profit from Leasing Activities less the rental profit from leases of the Connecticut and Florida nurseries and leases of various parcels of land in Connecticut for use by local farmers (Nursery and Farm Rental Profit). Nursery & Farm Rental Profit is defined as Rental Revenues and Operating Expenses of Rental Properties from leases of the Connecticut Nursery, and various parcels of Connecticut land that Griffin owns which are leased to local farmers. Calculation of Building Profit from Leasing Activities Profit from Leasing Activities (LTM 2/29/2016) $17,712 CT and FL Nurseries and Farm Rental Profit (1,389) Building Profit from Leasing Activities $16,323 23 Book Value of Buildings and Book Value of Undeveloped Land (pages 5, 18 and 19) Calculation of Book Value of Buildings: Book Value of Buildings reflects the sum of: (i) $135.3 million for the net book value (after depreciation) of land, land improvements, buildings, building improvements and tenant improvements for Griffin’s buildings as of February 29, 2016; and (ii) $16.4 million for the expected book value of the land, land improvements, buildings, building improvements and tenant improvements for the 252,000 sf Lehigh Valley building currently under construction that is expected to be completed in June 2016. The Book Value of Buildings of $46.01 per square foot is calculated by dividing the Book Value of Buildings totaling $151.7 million by the 3.3 million square feet of buildings in Griffin’s portfolio, which includes the 252,000 sf Lehigh Valley building currently under construction. Calculation of Book Value of Undeveloped Land Undeveloped Land includes all acreage not associated with an existing building or a building currently under construction, and includes the CT and FL nurseries. Book Value of Undeveloped Land reflects the cost of the land, any land improvements (after depreciation), any development costs on undeveloped land and any equipment on the CT and FL nurseries. The Book Value of Undeveloped Land per acre of $6,012 is calculated by dividing the $25.0 million Book Value of Undeveloped Land (see pages 5 and 19) by Griffin’s total undeveloped acres of 4,154 (see page 5).
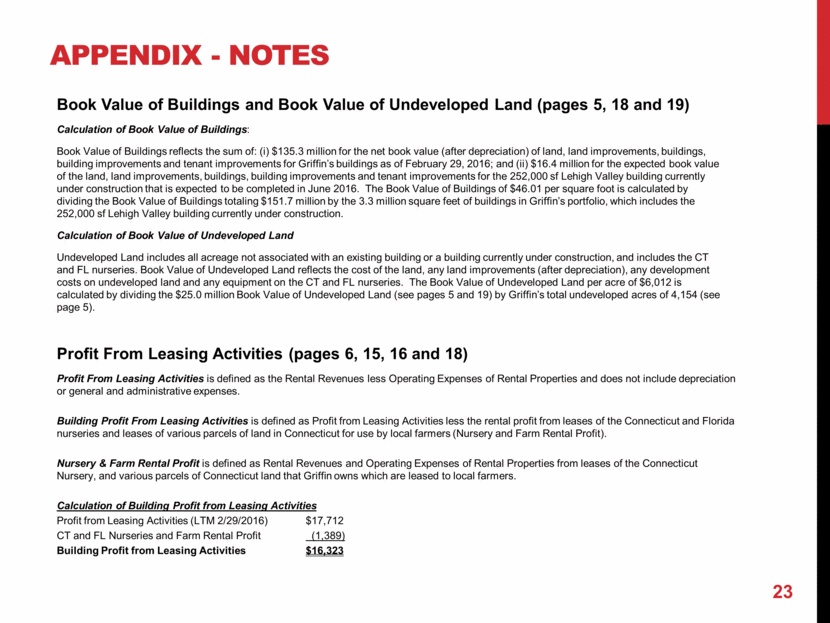
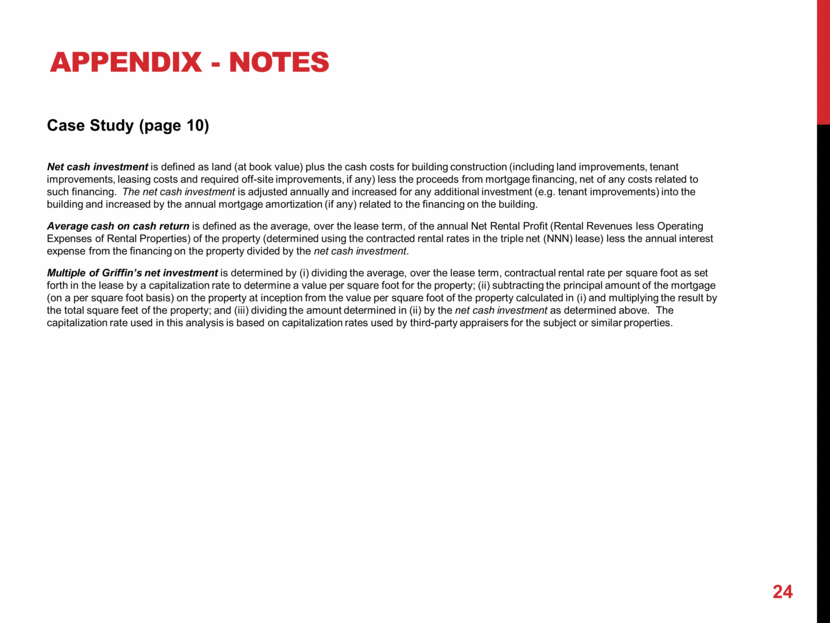
Appendix - NOTES 24 Case Study (page 10) Net cash investment is defined as land (at book value) plus the cash costs for building construction (including land improvements, tenant improvements, leasing costs and required off-site improvements, if any) less the proceeds from mortgage financing, net of any costs related to such financing. The net cash investment is adjusted annually and increased for any additional investment (e.g. tenant improvements) into the building and increased by the annual mortgage amortization (if any) related to the financing on the building. Average cash on cash return is defined as the average, over the lease term, of the annual Net Rental Profit (Rental Revenues less Operating Expenses of Rental Properties) of the property (determined using the contracted rental rates in the triple net (NNN) lease) less the annual interest expense from the financing on the property divided by the net cash investment. Multiple of Griffin’s net investment is determined by (i) dividing the average, over the lease term, contractual rental rate per square foot as set forth in the lease by a capitalization rate to determine a value per square foot for the property; (ii) subtracting the principal amount of the mortgage (on a per square foot basis) on the property at inception from the value per square foot of the property calculated in (i) and multiplying the result by the total square feet of the property; and (iii) dividing the amount determined in (ii) by the net cash investment as determined above. The capitalization rate used in this analysis is based on capitalization rates used by third-party appraisers for the subject or similar properties.
