Attached files
UNITED STATES
SECURITIES AND EXCHANGE COMMISSION
WASHINGTON, D.C. 20549
________________________________________
FORM 10-K
________________________________________
ý | ANNUAL REPORT PURSUANT TO SECTION 13 OR 15(d) OF THE SECURITIES EXCHANGE ACT OF 1934 |
For the fiscal year ended: March 31, 2016
or
¨ | TRANSITION REPORT PURSUANT TO SECTION 13 OR 15(d) OF THE SECURITIES EXCHANGE ACT OF 1934 |
For the transition period from | to | ||
Commission file number: 1-9344
________________________________________
AIRGAS, INC.
(Exact name of registrant as specified in its charter)
________________________________________
Delaware | 56-0732648 | |
(State or other jurisdiction of incorporation or organization) | (I.R.S. Employer Identification No.) | |
259 North Radnor-Chester Road, Suite 100 Radnor, PA | 19087-5283 | |
(Address of principal executive offices) | (ZIP code) | |
(610) 687-5253
(Registrant’s telephone number, including area code)
________________________________________
Securities registered pursuant to Section 12(b) of the Act:
Title of Each Class | Name of Each Exchange on Which Registered | |
Common Stock, par value $0.01 per share | New York Stock Exchange | |
Preferred Stock Purchase Rights | New York Stock Exchange | |
Securities registered pursuant to Section 12(g) of the Act: None. | ||
________________________________________
Indicate by check mark if the registrant is a well-known seasoned issuer, as defined in Rule 405 of the Securities Act.
Yes ý No ¨
Indicate by check mark if the registrant is not required to file reports pursuant to Section 13 or Section 15(d) of the Act.
Yes ¨ No ý
Indicate by check mark whether the registrant (1) has filed all reports required to be filed by Section 13 or 15(d) of the Securities Exchange Act of 1934 during the preceding 12 months (or for such shorter period that the registrant was required to file such reports), and (2) has been subject to such filing requirements for the past 90 days. Yes ý No ¨
Indicate by check mark whether the registrant has submitted electronically and posted on its corporate Web site, if any, every Interactive Data File required to be submitted and posted pursuant to Rule 405 of Regulation S-T during the preceding 12 months (or for such shorter period that the registrant was required to submit and post such files). Yes ý No ¨
Indicate by check mark if disclosure of delinquent filers pursuant to Item 405 of Regulation S-K is not contained herein, and will not be contained, to the best of the registrant’s knowledge, in definitive proxy or information statements incorporated by reference in Part III of this Form 10-K or any amendment to this Form 10-K. ý
Indicate by check mark whether the registrant is a large accelerated filer, an accelerated filer, a non-accelerated filer or a smaller reporting company. See the definitions of “large accelerated filer,” “accelerated filer” and “smaller reporting company” in Rule 12b-2 of the Exchange Act.
Large accelerated filer | ý | Accelerated filer | ¨ |
Non-accelerated filer | o | Smaller reporting company | ¨ |
Indicate by check mark whether the registrant is a shell company (as defined in Rule 12b-2 of the Exchange Act). Yes ¨ No ý
The aggregate market value of the 65,464,408 shares of voting stock held by non-affiliates of the registrant was approximately $5.8 billion computed by reference to the closing price of such stock on the New York Stock Exchange as of the last day of the registrant’s most recently completed second quarter, September 30, 2015. For purposes of this calculation, only executive officers and directors were deemed to be affiliates.
The number of shares of common stock outstanding as of May 6, 2016 was 72,807,594.
AIRGAS, INC.
FORM 10-K
March 31, 2016
TABLE OF CONTENTS
ITEM NO. | PAGE | |
1. | ||
1A. | ||
1B. | ||
2. | ||
3. | ||
4. | ||
5. | ||
6. | ||
7. | ||
7A. | ||
8. | ||
9. | ||
9A. | ||
9B. | ||
10. | ||
11. | ||
12. | ||
13. | ||
14. | ||
15. | ||
3
PART I
ITEM 1. | BUSINESS. |
GENERAL
Airgas, Inc., together with its subsidiaries (“Airgas,” the “Company,” “we,” “our” or “us”), became a publicly-traded company on the New York Stock Exchange (“NYSE”) in 1986. Through a combination of organic growth initiatives and acquisitions in both its core and adjacent lines of business, the Company has become one of the nation’s leading suppliers of industrial, medical and specialty gases, and hardgoods, such as welding equipment and related products. Airgas is a leading U.S. producer of atmospheric gases, carbon dioxide, dry ice and nitrous oxide, one of the largest U.S. suppliers of safety products, and a leading U.S. supplier of refrigerants, ammonia products and process chemicals. Airgas’ production network and supply agreements, full range of gas supply modes (from cylinders to truckload quantities to on-site pipeline supply) and national footprint make it one of the few fully-integrated industrial gas companies in the U.S. The Company also offers supply chain management services and solutions, and product and process technical support across many diverse customer segments.
The Company markets its products and services through multiple sales channels, including branch-based sales representatives, retail stores, strategic customer account programs, telesales, catalogs, e-Business and independent distributors. Products reach customers through an integrated network of approximately 17,000 associates and more than 1,100 locations, including branches, retail stores, gas fill plants, specialty gas labs, production facilities and distribution centers. The Company’s product and service offering, full range of supply modes, national scale and strong local presence offer a competitive edge to its diversified base of more than one million customers.
The Company’s consolidated net sales were $5.31 billion, $5.30 billion and $5.07 billion in the fiscal years ended March 31, 2016, 2015 and 2014, respectively. The Company’s operations are predominantly in the United States. While the Company does conduct operations outside of the United States in Canada, Mexico, Russia, Dubai and several European countries, revenues from foreign countries represent less than 2% of the Company’s net sales. Information on revenues derived from foreign countries as well as long-lived assets attributable to the Company’s foreign operations can be found in Note 22 to the Company’s consolidated financial statements under Item 8, “Financial Statements and Supplementary Data.”
Since its inception, the Company has made approximately 480 acquisitions. During fiscal 2016, the Company acquired 18 businesses with aggregate historical annual sales of approximately $85 million. The Company acquired these businesses in order to expand its geographic coverage to facilitate the sale of industrial, medical and specialty gases, and related supplies, the addition of businesses that offer products and services complementary to the Company’s existing portfolio, and enhanced geographical coverage abroad to strengthen the Company’s welder and generator rental business. See Note 4 to the Company’s consolidated financial statements under Item 8, “Financial Statements and Supplementary Data,” for a description of current and prior year acquisition activity.
The Company has two business segments, Distribution and All Other Operations. The businesses within the Distribution business segment offer a portfolio of related gas and hardgoods products and services to the end customers. The All Other Operations business segment consists of six business units which primarily manufacture and/or distribute carbon dioxide, dry ice, nitrous oxide, ammonia and refrigerant gases, along with a nitrogen services business. Financial information by business segment can be found in Item 7, “Management’s Discussion and Analysis of Financial Condition and Results of Operations” (“MD&A”), and in Note 22 to the Company’s consolidated financial statements under Item 8, “Financial Statements and Supplementary Data.” A more detailed description of the Company’s business segments follows.
On November 17, 2015, the Company announced that it had entered into a definitive agreement for the acquisition of the Company by L’Air Liquide, S.A. (“Air Liquide”) in a merger pursuant to an Agreement and Plan of Merger, dated as of November 17, 2015, by and among the Company, Air Liquide and AL Acquisition Corporation (“Merger Sub”), an indirect wholly owned subsidiary of Air Liquide (the “Merger Agreement”). The Merger Agreement provides that, among other things and subject to the terms and conditions thereof, Merger Sub will be merged with and into the Company (the “Merger”) with the Company continuing as the surviving corporation in the Merger as an indirect wholly owned subsidiary of Air Liquide. On February 23, 2016, at a special meeting of the Company’s stockholders, the stockholders voted to approve the Merger. See Note 2, “Merger Agreement,” to the Consolidated Financial Statements under Item 8, “Financial Statements and Supplementary Data,” for more information on the Merger Agreement.
DISTRIBUTION BUSINESS SEGMENT
The Distribution business segment accounted for approximately 90% of consolidated net sales in each of the fiscal years 2016, 2015 and 2014.
4
Principal Products and Services
The Distribution business segment’s principal products include industrial, medical and specialty gases sold in packaged and bulk quantities, as well as hardgoods. The Company’s air separation facilities and national specialty gas labs primarily produce gases that are sold by the various regional and other business units within the Distribution business segment as part of the complementary suite of similar products and services for the Company’s customers. Gas sales primarily include the following: atmospheric gases including nitrogen, oxygen and argon; helium; hydrogen; welding and fuel gases such as acetylene, propylene and propane; carbon dioxide; nitrous oxide; ultra high purity grades of various gases; special application blends; and process chemicals. Within the Distribution business segment, the Company also recognizes rent revenue derived from the rental of its gas cylinders, cryogenic liquid containers, bulk storage tanks, tube trailers and welding-related and other equipment. Gas and rent represented 61%, 59% and 60% of the Distribution business segment’s sales in fiscal years 2016, 2015 and 2014, respectively. Hardgoods consist of welding consumables and equipment, safety products, construction supplies, and maintenance, repair and operating supplies. Hardgoods sales represented 39%, 41% and 40% of the Distribution business segment’s sales in fiscal years 2016, 2015 and 2014, respectively.
Principal Markets and Methods of Distribution
The industry has three principal modes of gas distribution: on-site or pipeline supply, bulk or merchant supply, and cylinder or packaged supply. The on-site mode includes the supply of gaseous product to a customer facility via pipeline from a gas supplier’s plant located on or off the customer’s premises. The bulk mode consists of the supply of gases to customers in liquid form in full and partial truckload quantities or in gaseous form in tube trailers. The packaged gas mode includes the supply of gases to customers in gaseous form in cylinders, in liquid form in less-than-truckload quantities of bulk (also known as microbulk), or in liquid form in portable cryogenic vessels known as dewars. Generally, packaged gas distributors, including the Company and its competitors in the packaged gas market, also supply welding-related hardgoods required by customers to complement their use of gases.
The Company participates in all three modes of supply to varying degrees, with the packaged supply mode representing the most significant portion of its gas sales. The Company is one of the nation’s leading suppliers in the U.S. packaged gas and welding hardgoods market, with an estimated share of more than 25%. The Company’s competitors in this market include local and regional independent distributors, which are estimated to account for nearly half of the market’s annual revenues, and certain vertically-integrated gas producers, which account for the remainder of the market.
The Company markets its products and services through multiple sales channels, including branch-based representatives, retail stores, telesales, strategic customer account programs, catalogs, e-Business, and other distributors. Packaged gases and welding-related hardgoods are generally delivered to customers on Company-owned or leased trucks, although third-party carriers are also used in the delivery of welding-related hardgoods and safety products. Packaged gas distribution is a localized business because it is generally not economical to transport gas cylinders more than 50 to 100 miles from a plant or branch. The localized nature of the business makes these markets highly competitive, and competition is generally based on reliable product delivery and availability, technical support, quality and price.
Customer Base
The Company’s operations are predominantly in the United States. The Company’s customer base is diverse and sales are not dependent on a single or small group of customers. The Company’s largest customer accounts for less than 1% of total net sales. The Company estimates the following industry segments account for the approximate indicated percentages of its net sales:
• | Manufacturing & Metal Fabrication (29%) |
• | Non-Residential (Energy & Infrastructure) Construction (15%) |
• | Life Sciences & Healthcare (14%) |
• | Food, Beverage & Retail (13%) |
• | Energy & Chemical Production & Distribution (12%) |
• | Basic Materials & Services (11%) |
• | Government & Other (6%). |
Supply
The Company’s atmospheric gas production capacity includes 17 air separation plants that produce oxygen, nitrogen and argon, making Airgas the fifth largest U.S. producer of atmospheric gases. In addition, the Company purchases atmospheric and other gases pursuant to contracts with national and regional producers of industrial gases. The Company is a party to take-or-pay supply agreements under which Air Products and Chemicals, Inc. (“Air Products”) will supply the Company with bulk
5
nitrogen, oxygen, argon, hydrogen and helium. The Company is committed to purchase a minimum of approximately $61 million in bulk gases within the next fiscal year under the Air Products supply agreements. The agreements expire at various dates through 2020. The Company also has take-or-pay supply agreements with The Linde Group AG (“Linde”) to purchase oxygen, nitrogen, argon and helium. The agreements expire at various dates through 2025 and represent approximately $95 million in minimum bulk gas purchases for the next fiscal year. Additionally, the Company has take-or-pay supply agreements to purchase oxygen, nitrogen, argon, helium and ammonia from other major producers. Minimum purchases under these contracts for the next fiscal year are approximately $36 million and they expire at various dates through 2026. The level of annual purchase commitments under the Company’s supply agreements beyond the next fiscal year vary based on the expiration of agreements at different dates in the future, among other factors.
The Company’s annual purchase commitments under all of its supply agreements reflect estimates based on fiscal 2016 purchases. The Company’s supply agreements contain periodic pricing adjustments, most of which are based on certain economic indices and market analyses. The Company believes the minimum product purchases under the agreements are within the Company’s normal product purchases. Actual purchases in future periods under the supply agreements could differ materially from those presented due to fluctuations in demand requirements related to varying sales levels as well as changes in economic conditions. If a supply agreement with a major supplier of gases or other raw materials was terminated, the Company would attempt to locate alternative sources of supply to meet customer requirements, including utilizing excess internal production capacity for atmospheric gases. The Company purchases hardgoods from major manufacturers and suppliers. For certain products, the Company has negotiated national purchasing arrangements. The Company believes that if an arrangement with any supplier of hardgoods was terminated, it would be able to negotiate comparable alternative supply arrangements.
ALL OTHER OPERATIONS BUSINESS SEGMENT
The All Other Operations business segment consists of six business units, which in aggregate accounted for approximately 10% of sales in each of the fiscal years 2016, 2015 and 2014. The primary products produced and/or supplied are carbon dioxide, dry ice (carbon dioxide in solid form), nitrous oxide, ammonia and refrigerant gases, along with a nitrogen services business. The following sections describe the primary products and services offered by the Company through the business units within the All Other Operations business segment in further detail.
Carbon Dioxide & Dry Ice
Airgas is a leading U.S. producer of liquid carbon dioxide and dry ice. Customers for carbon dioxide and dry ice include food processors, food service businesses, various businesses in the pharmaceutical and biotech industries, and wholesale trade and grocery outlets, with food and beverage applications accounting for approximately 70% of the market. Some seasonality is experienced within these businesses, as the Company generally experiences a higher level of sales during the warmer months. With 14 dry ice plants (converting liquid carbon dioxide into dry ice), Airgas has the largest network of dry ice conversion plants in the U.S. Additionally, Airgas operates eight liquid carbon dioxide production facilities. The Company’s carbon dioxide production capacity is supplemented by take-or-pay supply contracts with other regional and national liquid carbon dioxide producers.
Nitrous Oxide
Airgas is the largest producer of nitrous oxide gas in the U.S. through its three nitrous oxide production facilities. Nitrous oxide is used as an anesthetic in the medical and dental fields, as a propellant in the packaged food industry and in certain manufacturing processes in the electronics industry. The raw materials utilized in nitrous oxide production are purchased under contracts with major manufacturers and suppliers.
Ammonia Products
Airgas is a leading U.S. distributor of anhydrous and aqua ammonia. Industrial ammonia applications primarily include the abatement of nitrogen oxide compounds (“DeNOx”) in the utilities industry, chemicals processing, commercial refrigeration, water treatment and metal treatment. The Company operates 29 distribution facilities across the U.S. and purchases ammonia from suppliers under agreements.
Refrigerants
Refrigerants are used in a wide variety of commercial and consumer freezing and cooling applications. Airgas purchases and distributes refrigerants and provides technical and refrigerant reclamation services. The primary focus of the refrigerants business is on the sale, distribution and reclamation of refrigerants, with a varied customer base that includes small and large HVAC contractors and distributors, facility owners, transportation companies, manufacturing facilities and government agencies. The refrigerants business typically experiences some seasonality, with higher sales levels during the warmer months as well as during the March and April time frame in preparation for the cooling season.
6
Nitrogen Services
Airgas provides nitrogen pumping services and solutions to the pipeline and energy processing industries. There are a broad range of industrial applications for these services at chemical plants, refineries, power plants, oilfield sites, and shipyards. The majority of revenues are generated from pipeline project work such as purging, pressure testing, cooling, and freezing.
AIRGAS GROWTH STRATEGIES
The Company’s primary objective is to maximize shareholder value by: driving market-leading sales growth through product and service offerings that leverage the Company’s infrastructure, technical expertise, and diverse customer base; executing on strategic organic growth initiatives; pursuing acquisitions in the Company’s core distribution business and in adjacent lines of business to increase customer density; providing outstanding customer service; and improving operational efficiencies. To meet this objective, the Company is focused on the following:
• | alignment of the sales and marketing organization with key customer segments, particularly within the strategic accounts program, to provide leadership and support throughout all sales channels in tailoring the Company’s broad product and service offerings to the unique needs of each customer segment; |
• | leveraging all sales channels, including branch-based sales representatives, product and industry specialists, retail stores, the strategic accounts program, telesales, catalogs, e-Business and independent distributors; |
• | fully leveraging the new District Manager structure to drive local sales and branch operations accountability, enhance depth of customer relationships, continuously improve transaction accuracy, and increase speed to deliver exceptional customer service through the Districts; |
• | enhancing the effectiveness of the field-based sales organization through improved sales management disciplines at the District and branch levels; |
• | driving customer adoption of the Company’s new Airgas.com e-Business platform; |
• | strategic products, which have strong growth profiles due to favorable customer segments, application development, increasing environmental regulation, strong cross-selling opportunities, or a combination thereof (e.g., bulk gases, specialty gases, medical products, carbon dioxide/dry ice and safety products); |
• | leveraging the Company’s enterprise information system (“SAP”) by capturing strategic pricing benefits, expanding the Airgas Total Access™ telesales platform, developing key metrics, analytics and tools for continuous improvement, optimizing sales channels and maximizing hardgoods and packaged gas distribution efficiencies; |
• | effective utilization of the Company’s divisional operating structure and Business Support Centers (“BSCs”) to leverage the full benefits of the SAP platform, maximize back-office efficiencies, ensure data integrity, and streamline customer relationship management; |
• | reducing costs associated with gaseous production, cylinder filling, gas asset utilization and maintenance and distribution logistics; and |
• | adding density through organic growth, acquisitions and growing share to complement and expand its business and to leverage its significant national platform. |
ENVIRONMENTAL MATTERS
The Company is subject to federal and state laws and regulations adopted for the protection of the environment and the health and safety of employees and users of the Company’s products. The Company has programs for the design and operation of its facilities to achieve compliance with applicable environmental regulations. The Company believes that it is in compliance, in all material respects, with such laws and regulations. Expenditures for environmental compliance purposes during fiscal 2016 were not material.
INSURANCE
The Company has established insurance programs to cover workers’ compensation, business automobile and general liability claims. During fiscal years 2016, 2015 and 2014, these programs had deductible limits of $1 million per occurrence and costs related to the programs were approximately 0.5% of sales during each of these years. For fiscal year 2017, the deductible limits are expected to remain at $1 million per occurrence. The Company accrues estimated losses using actuarial methods and assumptions based on the Company’s historical loss experience.
7
EMPLOYEES
As of March 31, 2016, the Company employed approximately 17,000 associates. Less than 5% of the Company’s associates were covered by collective bargaining agreements. The Company believes it has good relations with its employees and has not experienced a significant strike or work stoppage in over ten years.
PATENTS, TRADEMARKS AND LICENSES
The Company holds the following trademarks and service marks: “Airgas,” “National Carbonation,” “Airgas National Carbonation,” “Airgas Total Access,” “Airgas Retail Solutions,” “Airgas University,” “AcuGrav,” “AcuVend,” “AIR BOSS,” “Aspen,” “Aspen Refrigerants,” “Any Refrigerant, Any Place, Any Time,” “ChillRight,” “Cooler Than Ice,” “EZ-Vend,” “EasyLease,” “For All Your Refrigerant Needs,” “Radnor,” “Gold Gas,” “SteelMIX,” “StainMIX,” “AluMIX,” “OUTLOOK,” “Ny-Trous+,” “Red-D-Arc,” “RED-D-ARC WELDERENTALS,” “Gaspro,” “GAIN,” “MasterCut,” “Walk- O2 -Bout,” “Airgas Puritan Medical,” “Penguin Brand Dry Ice,” “Kangaroo Kart,” “National Farm and Shop,” “National/HEF,” “UNAMIX,” “UNAMIG Xtra,” “UNAMIG Six,” “FreezeRight,” “Reklaim,” “Refrigatron,” “RelEye,” “Safe-T-Cyl,” “StatusChecker,” “Smart-Logic,” “When You’re Ready To Weld,” “WelderHelper,” “Your Total Ammonia Solution,” “You’ll find it with us,” “Worry-Free Carbonation,” “Refreshingly Easy,” “QuartzSight,” “Saffire,” and “Panzer.” Additionally, the Company has registered U.S. Pat. No. 5,622,644.
The Company believes that its businesses as a whole are not materially dependent upon any single patent, trademark or license.
EXECUTIVE OFFICERS OF THE COMPANY
The executive officers of the Company are as follows:
Name | Age | Position |
Peter McCausland | 66 | Executive Chairman of the Board |
Michael L. Molinini | 65 | President, Chief Executive Officer and Director |
Robert M. McLaughlin | 59 | Senior Vice President and Chief Financial Officer |
Andrew R. Cichocki | 53 | Senior Vice President - Airgas, Inc. and President - Airgas USA, LLC |
Robert A. Dougherty | 58 | Senior Vice President and Chief Information Officer |
Leslie J. Graff | 55 | Senior Vice President - Corporate Development |
Ronald J. Stark | 52 | Senior Vice President - Sales and Marketing |
Nicole L. Kahny | 44 | Senior Vice President - Human Resources |
Robert H. Young, Jr. | 65 | Senior Vice President and General Counsel |
R. Jay Worley | 47 | Senior Vice President - Distribution Operations |
Thomas S. Thoman | 53 | Senior Vice President - Gases |
Douglas L. Jones | 60 | Division President - West |
Terry L. Lodge | 59 | Division President - Central |
Pamela J. Claypool | 62 | Division President - North |
John F. Sheehan | 57 | Division President - South |
Martin J. Wehner | 57 | Division President - Process Gases |
Thomas M. Smyth (1) | 62 | Vice President and Controller |
____________________
(1) Mr. Smyth serves as the Company’s Principal Accounting Officer, but he is not an executive officer.
Mr. McCausland has been Executive Chairman of the Board since August 2012. He previously served as Chairman of the Board from 1987 to September 2010 and from August 2011 to August 2012. Mr. McCausland also served as the Chief Executive Officer of Airgas from May 1987 to August 2012 and President of Airgas from June 1986 to August 1988, from April 1993 to November 1995, from April 1997 to January 1999 and from January 2005 to August 2012. Mr. McCausland serves as a director of the Independence Seaport Museum. Mr. McCausland also serves on the Board of Visitors of the Boston University School of Law and the College of Arts and Sciences of the University of South Carolina.
Mr. Molinini has been President, Chief Executive Officer and Director since August 2012. Prior to that time, Mr. Molinini served as Executive Vice President and Chief Operating Officer from January 2005 to August 2012, Senior Vice President - Hardgoods Operations from August 1999 to January 2005 and as Vice President - Airgas Direct Industrial from April 1997 to July 1999. Prior to joining Airgas, Mr. Molinini served as Vice President of Marketing of National Welders Supply Company, Inc. (“National Welders”) from 1991 to 1997.
8
Mr. McLaughlin has been Senior Vice President and Chief Financial Officer since October 2006 and served as Vice President and Controller from the time he joined Airgas in June 2001 to September 2006. Prior to joining Airgas, Mr. McLaughlin served as Vice President Finance for Asbury Automotive Group from 1999 to 2001, and was a Vice President and held various senior financial positions at Unisource Worldwide, Inc. from 1992 to 1999. Mr. McLaughlin also serves on the Board of Directors of Axalta Coating Systems Ltd.
Mr. Cichocki was named Senior Vice President - Airgas, Inc. effective August 2014 and President - Airgas USA, LLC effective April 2014. Airgas USA, LLC accounts for the majority of the Company’s consolidated net sales. Mr. Cichocki previously served as Senior Vice President - Distribution Operations and Business Process Improvement from August 2011 through March 2014. From July 2008 to July 2011, he was Division President - Process Gases and Chemicals. Prior to that time, Mr. Cichocki served as President of Airgas National Welders and Airgas’ joint venture, National Welders, from 2003. Prior to that, Mr. Cichocki served in key corporate roles for Airgas, including Senior Vice President of Human Resources, Senior Vice President of Business Operations and Planning, and for ten years as Vice President of Corporate Development.
Mr. Dougherty has been Senior Vice President and Chief Information Officer since joining Airgas in January 2001. Prior to joining Airgas, Mr. Dougherty served as Vice President and Chief Information Officer from 1998 to 2000 and as Director of Information Systems from 1993 to 1998 at Subaru of America, Inc.
Mr. Graff has been Senior Vice President - Corporate Development since August 2006. Prior to that, Mr. Graff held various management positions since joining the Company in 1989, including Director of Corporate Finance, Director of Corporate Development, Assistant Vice President - Corporate Development and Vice President - Corporate Development. He has directed the in-house acquisition department since 2001. Prior to joining Airgas, Mr. Graff worked for KPMG LLP from 1983 to 1989.
Mr. Stark was named Senior Vice President - Sales and Marketing in July 2009 and previously served as President, Airgas North Central, since joining Airgas in 2003. Mr. Stark began his career at Union Carbide - Linde Division (now Praxair) in 1985 and advanced through a series of positions in applications engineering and key account management. In 1992, he joined MVE, a Minnesota-based supplier of cryogenic storage and distribution technology, and advanced to vice president and general manager of the industrial gases market. After Chart Industries acquired MVE in 1999, Mr. Stark became president of Chart’s Distribution and Storage Group and held that post until joining Airgas.
Ms. Kahny was named Senior Vice President - Human Resources in August 2015. Previously, Ms. Kahny served as Vice President - Talent Management since joining Airgas in February 2014. Prior to joining Airgas, Ms. Kahny served as Vice President of Global Talent, Leadership & Organizational Development for Viacom from December 2012 to February 2014. Prior to that time, she served as Vice President, Global Talent & Organizational Capability at Pfizer from October 2009 until December 2011. Ms. Kahny has more than 20 years of experience in the human resources field, serving in various cross-functional and cross-industry roles.
Mr. Young has been Senior Vice President and General Counsel since October 2007. Prior to joining Airgas, Mr. Young was a shareholder of McCausland Keen & Buckman, which he joined in 1985, and served as outside counsel for the Company on many acquisitions and other corporate legal matters. At McCausland Keen & Buckman, Mr. Young focused his practice on general corporate law for both public and private corporations, mergers and acquisitions, and venture capital financing. Mr. Young began his legal career as an attorney at Drinker Biddle & Reath in Philadelphia.
Mr. Worley has served as Senior Vice President - Distribution Operations since February 2015. Prior to that, Mr. Worley served as Vice President - Strategic Pricing since the inception of Airgas’ strategic pricing program in January 2012, and as President of Airgas National Carbonation since October 2013. Previously, Mr. Worley held the position of Vice President - Communications and Investor Relations for Airgas from July 2008 to December 2011, as Director - Investor Relations from 2006 until July 2008 and as Chief Financial Officer of Airgas Southwest from 2001 until 2006. Mr. Worley began his career at Airgas in 1993 as Assistant Controller with what is now Airgas Intermountain and held a variety of roles in that organization, including in sales and human resources.
Mr. Thoman was named Senior Vice President - Gases in August 2015. Previously, Mr. Thoman served as Division President - Gases Production from July 2011 to August 2015 and from 2007 to 2011 he served as Senior Vice President - Tonnage and Merchant Gases and President - Airgas Merchant Gases. Prior to that time, Mr. Thoman served in key corporate roles including Vice President - Gases, which focused on the Company’s gases supply chains, product sourcing, marketing, product management and business development. He has been with Airgas nearly 15 years and in the industrial gas industry for 27 years.
Mr. Jones has been Division President - West since April 2013. Prior to this role, Mr. Jones was President of Airgas Intermountain from 2006 to April 2013, Vice President of Sales and Marketing from 2001 to 2006 and Director of Marketing from 1998 to 2001. Mr. Jones has served the Company in various other roles since joining Airgas in 1989 through the acquisition of Utah Welders Supply.
9
Mr. Lodge has been Division President - Central since July 2011. Prior to that time, Mr. Lodge was President of Airgas Mid South from November 2007, Vice President - Western Division from January 2005 to November 2007 and CFO for Airgas Mid South from August 1994 to January 2005. Prior to joining Airgas, Mr. Lodge was the CFO for The Jimmie Jones Company, an independent distributor acquired by Airgas in 1994 where he originally started his career in the industrial gas industry in 1979.
Ms. Claypool was named Division President - North in August 2015. From December 2013 to August 2015, Ms. Claypool served as Senior Vice President - Human Resources and from January 2013 to December 2013, as Vice President - Talent Management for Airgas. Prior to that time, she served as Vice President - Human Resources for Airgas’ North Division from November 2011 to January 2013. She joined Airgas in 2007 with the acquisition of Linde’s U.S. packaged gas business, serving as Vice President of Finance until May 2009, then Chief Financial Officer until November 2011 for Airgas Great Lakes, Inc. Prior to joining Airgas, Ms. Claypool spent three years in Linde’s U.S. group where she was responsible for business and financial analysis and sales compensation, and fourteen years with Commercial Intertech in multiple finance and management roles.
Mr. Sheehan was named Division President - South in October 2015. Previously, Mr. Sheehan served as an Area Vice President in the Airgas South Region, after selling his former business, TriTech, to Airgas in 2009, after nearly 15 years as President and Managing General Partner. Prior to that, Mr. Sheehan led AirTech Incorporated as President from 1991 to 1996 and launched the company’s packaged gas business. From 1981 to 1990, Mr. Sheehan served as Vice President and Chief Operational Officer of Bishop’s Welding Supply and was responsible for all facets of the business from accounting and sales to human resources and plant operations.
Mr. Wehner was named Division President - Process Gases in August 2015. Previously, Mr. Wehner served as Vice President - Process Gases and Chemicals from March 2015 to August 2015 and prior that served as President - Airgas Specialty Products since 2011. Mr. Wehner joined Airgas in 2005 as Vice President of Sales for Airgas Specialty Products when Airgas acquired LaRoche Industries. Prior to joining Airgas, Mr. Wehner spent six years as Business Manager of the Zeolite Division at UOP, a Honeywell company, and thirteen years at LaRoche Industries, where he held a number of sales, sales management, technical service and distribution management positions.
Mr. Smyth has been Vice President and Controller since November 2006. Prior to that, Mr. Smyth served as Director of Internal Audit since joining Airgas in February 2001 and became Vice President in August 2004. Prior to joining Airgas, Mr. Smyth served in internal audit, controller and chief accounting roles at Philadelphia Gas Works from 1997 to 2001. Prior to that, Mr. Smyth spent 12 years with Bell Atlantic, now Verizon, in a variety of internal audit and general management roles and in similar positions during eight years at Amtrak.
COMPANY INFORMATION
The Company’s Annual Report on Form 10-K, Quarterly Reports on Form 10-Q, Current Reports on Form 8-K and any amendments to those reports filed with or furnished to the Securities and Exchange Commission (“SEC”) are available free of charge on the Company’s website (www.airgas.com) under the “Financial Information” link in the “Investor Relations” section. The Company makes these documents available as soon as reasonably practicable after they are filed with or furnished to the SEC, but no later than the end of the day that they are filed with or furnished to the SEC.
Code of Ethics and Business Conduct
The Company has adopted a Code of Ethics and Business Conduct applicable to its employees, officers and directors. The Code of Ethics and Business Conduct is available on the Company’s website, under the “Corporate Governance” link in the “Investor Relations” section. Amendments to and waivers from the Code of Ethics and Business Conduct will also be disclosed promptly on the website. In addition, stockholders may request a printed copy of the Code of Ethics and Business Conduct, free of charge, by contacting the Company’s Investor Relations department at:
Airgas, Inc.
Attention: Investor Relations
259 N. Radnor-Chester Rd.
Radnor, PA 19087-5283
Telephone: (866) 816-4618
Email: investors@airgas.com
Corporate Governance Guidelines
The Company has Corporate Governance Guidelines as well as charters for its Audit Committee, Finance Committee and Governance & Compensation Committee. These documents are available on the Company’s website, noted above. Stockholders may also request a copy of these documents, free of charge, by contacting the Company’s Investor Relations department at the address and phone number noted above.
10
Certifications
The Company has filed certifications of its Executive Chairman of the Board, President and Chief Executive Officer, and Senior Vice President and Chief Financial Officer pursuant to Sections 302 and 906 of the Sarbanes-Oxley Act of 2002 as exhibits to its Annual Report on Form 10-K for each of the years ended March 31, 2016, 2015 and 2014.
ITEM 1A. | RISK FACTORS. |
In addition to risk factors discussed in MD&A under “Critical Accounting Estimates” and elsewhere in this report, we believe the following, which have not been sequenced in any particular order, are the most significant risks related to our business that could cause actual results to differ materially from those contained in any forward-looking statements.
Risk Factors Related to Our Business
We face risks related to general economic conditions, which may impact the demand for and supply of our products and our results of operations.
Demand for our products depends in part on the general economic conditions affecting the United States and, to a lesser extent, the rest of the world. Although our diverse product offering and customer base help provide some stability to our business in difficult times, a broad decline in general economic conditions or changes in other external factors including the price of commodities, such as crude oil, could result in customers postponing capital projects and could negatively impact the demand for our products and services as well as our customers’ ability to fulfill their obligations to us. The impact of a strong U.S. dollar could give rise to higher imports and reduce production activity for domestic customers that export, thereby reducing demand for our products. In addition, falling demand could lead to lower sales volumes, lower pricing and/or lower profit margins. It could also impact our ability to fulfill our volume purchase obligations under take-or-pay supply agreements, resulting in lower profit margins. A protracted period of lower product demand and profitability could result in diminished values for both tangible and intangible assets, increasing the possibility of future impairment charges. Further, suppliers could be impacted by an economic downturn, which could impact their ability to fulfill their obligations to us. If economic conditions deteriorate, our operating profit, financial condition and cash flows could be adversely affected.
Our financial results may be adversely affected by gas supply disruptions and supply/demand imbalances.
We are one of the nation’s leading suppliers of industrial, medical and specialty gases and have supply contracts with the major gas producers. Additionally, we operate 17 air separation units, 11 acetylene plants and eight liquid carbon dioxide production facilities, which provide us with substantial production capacity. Our supply contracts and our own production capacity mitigate supply disruptions to various degrees. However, natural disasters, plant shut-downs, labor strikes and other supply disruptions may occur within our industry. Regional supply disruptions may create shortages of raw materials and certain products. Consequently, we may not be able to obtain the products required to meet our customers’ demands or may incur significant costs to ship product from other regions of the country to meet customer requirements. Such additional costs may adversely impact operating results until product sourcing can be restored. When we experience supply shortages, we work to meet customer demand by arranging for alternative supplies and transporting product into an affected region, but we cannot guarantee that we will be successful in arranging alternative product supplies or passing the additional transportation or other costs on to customers in the event of future supply disruptions, which could negatively impact our operations, financial results or liquidity.
Interruptions in the proper functioning of our information systems could disrupt business and operational activities.
We rely on information systems for business and operational activities, including the processing and storage of proprietary and sensitive information. These systems are susceptible to disruptions as a result of events such as fires, natural disasters, hardware and software failures, network outages, power disruptions, and other problems. Although we maintain data center and network resiliency and recovery capabilities for our critical systems, interruptions in the proper functioning of these systems could adversely impact our ability to process orders, shipments, inventory receipts, vendor payments, and accounts receivable collections - any of which could negatively impact our operations or financial results.
Breaches of our information systems and e-Business platform could adversely impact our reputation, disrupt operations, and result in increased costs and loss of revenue.
Information security risks and threats have increased in recent years as a result of the interconnectedness of the systems, networks, and e-Business platform used to conduct business with our customers, suppliers and other third parties. Our business is also subject to complex and evolving U.S. and foreign laws and regulations regarding privacy, data protection and other matters. Despite maintaining and continuously improving our technologies and processes to mitigate these risks and comply with laws and regulations, sophisticated cyberattacks and security breaches could compromise our systems and data. Such events could expose us to reputational damage, business disruptions, regulatory and legal actions, and claims from customers,
11
suppliers, financial institutions, and employees - any of which could have a material adverse impact to our financial condition and results of operations.
Catastrophic events and operating failures may disrupt our business and adversely affect our operating results.
Although our operations are widely distributed across the U.S., and safety is a primary focus in all we do, we manage and distribute hazardous materials and a catastrophic event could result in significant property losses, injuries and third-party claims. Examples of such events include, but are not limited to, the following: a fire, explosion or release of hazardous materials at one of our facilities, a supplier’s facility or a customer’s facility; a natural disaster, such as a hurricane, tornado or earthquake; and an operating failure at one of our facilities or in connection with the delivery of our products. Additionally, such events may severely impact our regional customer base and supply sources resulting in lost revenues, higher product costs and increased bad debts.
Operational and execution risks may adversely impact our financial results.
Our operating results are reliant on the continued operation of our production and distribution facilities and delivery fleet, as well as our ability to meet customer requirements. Inherent in our operations are risks that require continuous oversight and control, such as risks related to mechanical failure, fire, explosion, toxic releases and vehicle accidents. We have policies, procedures and safety protocols in place requiring continuous training, oversight and control in order to address these risks to our operations. However, significant operating failures at our production, distribution or storage facilities, or vehicle transportation accidents, could result in loss of life, loss of production or distribution capabilities, and/or damage to the environment, thereby adversely impacting our operations and financial results. These factors could subject us to lost sales, litigation contingencies and reputational risk.
U.S. credit markets may impact our ability to obtain financing or increase the cost of future financing.
As of March 31, 2016, we had total consolidated debt of approximately $2.6 billion, which had an average length to maturity of approximately four years and includes $250 million of long-term debt obligations maturing during the year ending March 31, 2017. During periods of volatility and disruption in the U.S. credit markets, obtaining additional or replacement financing may be more difficult and costly. Higher cost of new debt may limit our ability to finance future acquisitions on terms that are acceptable to us. Additionally, although we actively manage our interest rate risk through the use of diversified debt obligations and occasional derivative instruments, approximately 30% of our debt has a variable interest rate. If interest rates increase, our interest expense could increase, affecting earnings and reducing cash flows available for working capital, capital expenditures and acquisitions. Based on our outstanding borrowings at March 31, 2016, for every 25 basis point increase in our average variable borrowing rates, we estimate that our annual interest expense would increase by approximately $2.0 million.
Finally, our cost of borrowing can be affected by debt ratings assigned by independent rating agencies which are based in large part on our performance as measured by certain liquidity metrics. An adverse change in these debt ratings could increase the cost of borrowing and make it more difficult to obtain financing on favorable terms.
We operate in a highly competitive environment and such competition could negatively impact us.
The U.S. industrial gas industry operates in a highly competitive environment. Competition is generally based on price, reliable product delivery, product availability, technical support, quality and service. If we are unable to compete effectively with our competitors, we may suffer lower revenue and/or a loss of customers, which could result in lower profits and adversely affect our financial condition and cash flows.
Volatility in product and energy costs could reduce our profitability.
The cost of industrial gases represents a significant percentage of our operating costs. The production of industrial gases requires significant amounts of electricity. Therefore, industrial gas prices have historically increased as the cost of electricity increases. Unforeseen increases in power fuel costs, namely natural gas prices and to a degree oil, can result in unanticipated higher electric prices and operating costs. Severe weather conditions can adversely impact both our sales and expenses, causing an impediment to fully and timely recoup such unanticipated costs from our customers. In addition, a significant portion of our product distribution expenses consists of fuel costs. Energy prices can be volatile and may rise in the future, resulting in an increase in the distribution costs of industrial gases. While we have historically been able to pass increases in operating expenses on to our customers, we cannot guarantee our ability to do so in the future, which could negatively impact our operations, financial results or liquidity.
We may not be successful in integrating acquisitions and achieving intended benefits and synergies.
We have successfully integrated approximately 480 acquisitions in our history and consider the acquisition and integration of businesses to be a core competency. However, the process of integrating acquired businesses into our operations may result in unexpected operating difficulties and may require significant financial and other resources. Unexpected
12
difficulties may impair our ability to achieve targeted synergies or planned operating results, which could diminish the value of acquired tangible and intangible assets resulting in future impairment charges. Acquisitions involve numerous risks, including:
• | acquired companies may not have internal control structures appropriate for a larger public company, resulting in a need for significant revisions; |
• | acquired operations, information systems and products may be difficult to integrate; |
• | acquired operations may not achieve targeted synergies; |
• | we may not be able to retain key employees, customers and business relationships of acquired companies; and |
• | our management team may have its attention and resources diverted from ongoing operations. |
We depend on our key personnel to manage our business effectively and they may be difficult to replace.
Our performance substantially depends on the efforts and abilities of our senior management team and key employees. Furthermore, much of our competitive advantage is based on the expertise, experience and know-how of our key personnel regarding our distribution infrastructure, systems and products. The loss of key employees could have a negative effect on our business, revenues, results of operations and financial condition.
We are subject to litigation and reputational risk as a result of the nature of our business, which may have a material adverse effect on our business.
From time-to-time, we are involved in lawsuits that arise from our business. Litigation may, for example, relate to product liability claims, personal injury, property damage, vehicle accidents, regulatory issues, contract disputes or employment matters. The occurrence of any of these matters could also create possible damage to our reputation and our operations. The defense and ultimate outcome of lawsuits against us may result in higher operating expenses. Higher operating expenses or reputational damage could have a material adverse effect on our business, including to our liquidity, results of operations or financial condition.
We have established insurance programs with significant deductibles and maximum coverage limits which could result in the recognition of significant losses.
We maintain insurance coverage for workers’ compensation, business automobile and general liability claims with significant per occurrence deductibles. In the past, we have incurred significant workers’ compensation, business automobile and general liability losses. Such losses could impact our profitability. Additionally, claims in excess of our insurance limits could have a material adverse effect on our financial condition, results of operations or liquidity.
We are subject to extensive government regulation relating to health, safety and environmental matters, as well as anti-corruption laws that generate ongoing compliance costs and could subject us to liability.
We are subject to laws and regulations relating to health, safety and the protection of the environment and natural resources, as well as regulations related to social policy. These include, among other things, reporting on chemical inventories and risk management plans, and management of hazardous substances and wastes, air emissions and water discharges. More recently, we have examined our supply chain with respect to certain products we manufacture or contract to manufacture as a result of new regulations around the use of conflict minerals. Violations of existing laws and enactment of future legislation and regulations could result in substantial penalties, temporary or permanent plant closures, restrictions on our operations caused by the temporary or permanent loss of our licenses and other legal consequences, as well as reputational and other risks. Moreover, the nature of our existing and historical operations exposes us to the risk of liabilities to third parties. These potential claims include property damage, personal injuries and cleanup obligations.
The issue of greenhouse gas emissions has been subject to increased scrutiny and public awareness, and may result in legislation, both internationally and in the U.S., to reduce its effects. Increased regulation of greenhouse gas emissions could impose additional costs on us, both directly through new compliance and reporting requirements as well as indirectly through increased industrial gas and energy costs. Until such time as any new legislation is passed, it will remain unclear as to what industries would be impacted, the period of time within which compliance would be required, the significance of the greenhouse gas emissions reductions and the costs of compliance. Although we do not believe that increased greenhouse gas emissions regulation will have a material adverse effect on our financial condition, results of operations or liquidity, we cannot provide assurance that such costs will not increase in the future or will not become material.
Although our operations are predominantly in the United States, we conduct operations internationally in Canada, Mexico, Russia, Dubai and several European countries. Our international operations are subject to U.S. and foreign anti-corruption laws and regulations, including the U.S. Foreign Corrupt Practices Act and anti-corruption laws of the various jurisdictions in which we operate. We maintain policies and procedures designed to comply with anti-corruption laws.
13
However, there can be no guarantee that these policies and procedures will effectively prevent violations by our employees or representatives in the future.
Risk Factors Related to the Merger
The proposed Merger may not be completed on a timely basis, or at all, and the failure to complete the Merger could adversely affect our business and the market price of our common stock.
On November 17, 2015, we entered into the Merger Agreement with Air Liquide and the Merger Sub. Completion of the Merger is subject to various conditions, including the receipt of necessary antitrust and regulatory approvals. Failure to complete the Merger could adversely affect our business and the market price of our common stock in a number of ways, including the following:
• | If the Merger is not completed, and there are no other parties willing and able to acquire the Company for consideration that is equivalent or more attractive than that in the Merger Agreement, on terms acceptable to us, our stock price may decline. |
• | We have incurred, and will continue to incur, significant costs, expenses and fees for professional services and other transaction costs in connection with the proposed Merger, for which we will have received little or no benefit if the Merger is not completed. Many of these fees and costs will be payable by us even if the Merger is not completed and may relate to activities that we would not have undertaken other than to complete the Merger. |
The prospective Merger could adversely affect our business, financial condition and results of operations.
The prospective Merger could cause disruptions in and create uncertainty surrounding our ongoing business operations, which could have an adverse effect on our financial condition and results of operations, regardless of whether the Merger is completed. These risks to our business include the following, all of which could be exacerbated by a delay in the completion of the Merger:
• | the diversion of significant management time and resources towards the completion of the Merger; |
• | the impairment of our ability to retain and hire key personnel, including our senior management; |
• | difficulties maintaining relationships with customers, suppliers and others with whom we conduct business; |
• | the impairment of our ability to execute on our strategy of growth through acquisitions; and |
• | potential litigation relating to the Merger and the costs related thereto. |
ITEM 1B. | UNRESOLVED STAFF COMMENTS. |
None.
ITEM 2. | PROPERTIES. |
The Company operates in all 50 U.S. states and in Canada, Mexico, Russia, Dubai and several European countries. The principal executive offices of the Company are located in leased space in Radnor, Pennsylvania.
The Company’s Distribution business segment operates a network of multiple use facilities consisting of approximately 900 branches, approximately 300 cylinder fill plants, 70 regional specialty gas laboratories, 11 national specialty gas laboratories, one research and development center, two specialty gas equipment centers, 11 acetylene plants and 17 air separation units, as well as six national hardgoods distribution centers, various customer call centers, buying centers and administrative offices. The Distribution business segment conducts business in all 50 states and internationally in Canada, Mexico, Russia, Dubai and several European countries. The Company owns approximately 47% of these facilities. The remaining facilities are primarily leased from unrelated third parties. A limited number of facilities are leased from employees, generally former owners of acquired businesses, and are on terms consistent with commercial rental rates prevailing in the surrounding rental markets.
The Company’s network of 17 air separation units that it owns and operates supports the Company’s full range of gas supply modes for its customers, making Airgas the fifth-largest producer of atmospheric gases in the U.S. During fiscal 2016, capacity utilization at the Company’s air separation units was approximately 80%, with additional capacity available upon demand. The Company is currently in the planning or construction phases for an additional two air separation units as well as a liquid hydrogen plant, all of which are expected to be on-stream at various points through calendar year 2018.
The Company’s All Other Operations business segment consists of businesses located throughout the U.S., which operate multiple use facilities consisting of approximately 90 branch/distribution locations, eight liquid carbon dioxide and 14 dry ice
14
production facilities, and three nitrous oxide production facilities. The Company owns approximately 32% of these facilities. The remaining facilities are leased from unrelated third parties.
The Company believes that its facilities are adequate for its present needs and that its properties are generally in good condition, well-maintained and suitable for their intended use.
ITEM 3. | LEGAL PROCEEDINGS. |
The Company is involved in various legal and regulatory proceedings that have arisen in the ordinary course of business and have not been fully adjudicated. These actions, when ultimately concluded and determined, will not, in the opinion of management, have a material adverse effect upon the Company’s consolidated financial condition, results of operations or liquidity. See Note 18, “Commitments and Contingencies,” to the Company’s consolidated financial statements under Part II, Item 8, “Financial Statements and Supplementary Data,” for additional information regarding the Company’s legal proceedings.
ITEM 4. | MINE SAFETY DISCLOSURES. |
Not applicable.
PART II
ITEM 5. | MARKET FOR REGISTRANT’S COMMON EQUITY, RELATED STOCKHOLDER MATTERS AND ISSUER PURCHASES OF EQUITY SECURITIES. |
Market Information, Dividends and Holders
The Company’s common stock is listed on the New York Stock Exchange (ticker symbol: ARG). The following table sets forth, for each quarter during the last two fiscal years, the high and low closing price per share for the common stock as reported by the New York Stock Exchange and cash dividends per share for the period from April 1, 2014 to March 31, 2016:
High | Low | Dividends Per Share | |||||||||
Fiscal 2016 | |||||||||||
First Quarter | $ | 107.97 | $ | 100.29 | $ | 0.60 | |||||
Second Quarter | 106.94 | 88.10 | 0.60 | ||||||||
Third Quarter | 138.93 | 87.97 | 0.60 | ||||||||
Fourth Quarter | 141.87 | 137.80 | 0.60 | ||||||||
Fiscal 2015 | |||||||||||
First Quarter | $ | 109.95 | $ | 102.35 | $ | 0.55 | |||||
Second Quarter | 113.19 | 106.78 | 0.55 | ||||||||
Third Quarter | 117.98 | 103.55 | 0.55 | ||||||||
Fourth Quarter | 118.90 | 103.89 | 0.55 | ||||||||
The closing sale price of the Company’s common stock on May 6, 2016, as reported by the New York Stock Exchange, was $142.60 per share. As of May 6, 2016, there were 271 stockholders of record, a number that by definition does not count those who hold the Company’s stock in street name including the many employee owners under the Amended and Restated Airgas, Inc. 2003 Employee Stock Purchase Plan (“Employee Stock Purchase Plan” or “ESPP”).
Future dividend declarations and associated amounts paid will depend upon the Company’s earnings, financial condition, loan covenants, capital requirements and other factors deemed relevant by management and the Company’s Board of Directors.
15
Stockholder Return Performance Presentation
Below is a graph comparing the yearly change in the cumulative total stockholder return on the Company’s common stock against the cumulative total return of the S&P 500 Index and the S&P 500 Chemicals Index for the five-year period that began April 1, 2011 and ended March 31, 2016.
The Company believes the use of the S&P 500 Index and the S&P 500 Chemicals Index for purposes of this performance comparison is appropriate because Airgas is a component of the indices and they include companies of similar size to Airgas.
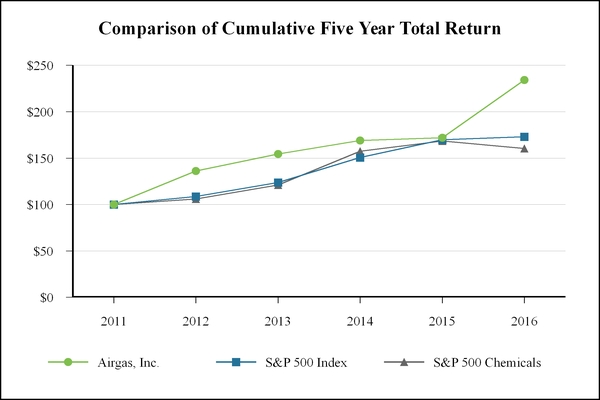
March 31, | 2011 | 2012 | 2013 | 2014 | 2015 | 2016 | ||||||
l | Airgas, Inc. | 100.00 | 136.22 | 154.58 | 169.11 | 171.86 | 234.26 | |||||
n | S&P 500 Index | 100.00 | 108.54 | 123.69 | 150.73 | 169.92 | 172.95 | |||||
Å | S&P 500 Chemicals | 100.00 | 106.03 | 121.01 | 157.35 | 168.56 | 160.42 | |||||
The graph above assumes that $100 was invested on April 1, 2011 in Airgas, Inc. common stock, the S&P 500 Index and the S&P 500 Chemicals Index and that all dividends have been reinvested.
16
Issuer Purchases of Equity Securities
During the three months ended March 31, 2016, the Company acquired the following shares of its common stock:
Period | (a) Total Number of Shares Purchased (1) | (b) Average Price Paid per Share (1) | (c) Total Number of Shares Purchased as Part of Publicly Announced Program (2) | (d) Maximum Dollar Value of Shares that May Yet Be Purchased Under the Program (2) | ||||||||||
1/1/16 - 1/31/16 | — | $ | — | — | $ | 125,294,139 | ||||||||
2/1/16 - 2/29/16 | 7,248 | $ | 141.81 | — | $ | 125,294,139 | ||||||||
3/1/16 - 3/31/16 | — | $ | — | — | $ | 125,294,139 | ||||||||
Total | 7,248 | $ | 141.81 | — | ||||||||||
____________________
(1) | Consists of shares that were attested to upon the exercise of stock options by participants of the Company’s Second Amended and Restated 2006 Equity Incentive Plan (“Equity Incentive Plan”) in satisfaction of the payment of the exercise of stock options under the plan. During the three months ended March 31, 2016, the Company acquired 7,248 shares of its common stock with an average fair market value per share of $141.81 for the exercise of 12,000 stock options. |
(2) | On May 28, 2015, the Company announced plans to purchase up to $500 million of Airgas, Inc. common stock under a stock repurchase program approved by the Company’s Board of Directors. Airgas may repurchase shares from time to time for cash in open market transactions or in privately-negotiated transactions in accordance with applicable federal securities laws. The Company will determine the timing and the amount of any repurchases based on its evaluation of market conditions, share price, and other factors. The stock repurchase program has no pre-established closing date. However, stock repurchases are currently suspended in accordance with the Merger Agreement. |
17
ITEM 6. | SELECTED FINANCIAL DATA. |
Selected financial data for the Company is presented in the following table and should be read in conjunction with MD&A included in Item 7 and the Company’s consolidated financial statements and accompanying notes included in Item 8.
Years Ended March 31, | |||||||||||||||||||
(In thousands, except per share amounts): | 2016 (1) | 2015 | 2014 (2) | 2013 (3) | 2012 (4) | ||||||||||||||
Operating Results: | |||||||||||||||||||
Net sales | $ | 5,313,777 | $ | 5,304,885 | $ | 5,072,537 | $ | 4,957,497 | $ | 4,746,283 | |||||||||
Depreciation and amortization | $ | 352,747 | $ | 329,058 | $ | 305,306 | $ | 288,900 | $ | 270,285 | |||||||||
Operating income | $ | 580,711 | $ | 641,278 | $ | 630,534 | $ | 596,417 | $ | 556,221 | |||||||||
Interest expense, net | 60,071 | 62,232 | 73,698 | 67,494 | 66,337 | ||||||||||||||
Losses on the extinguishment of debt | — | — | 9,150 | — | — | ||||||||||||||
Other income, net | 9,077 | 5,075 | 4,219 | 14,494 | 2,282 | ||||||||||||||
Income taxes | 192,217 | 216,035 | 201,121 | 202,543 | 178,792 | ||||||||||||||
Net earnings | $ | 337,500 | $ | 368,086 | $ | 350,784 | $ | 340,874 | $ | 313,374 | |||||||||
Net Earnings Per Common Share: | |||||||||||||||||||
Basic earnings per share | $ | 4.60 | $ | 4.93 | $ | 4.76 | $ | 4.45 | $ | 4.09 | |||||||||
Diluted earnings per share | $ | 4.54 | $ | 4.85 | $ | 4.68 | $ | 4.35 | $ | 4.00 | |||||||||
Dividends per common share declared and paid (5) | $ | 2.40 | $ | 2.20 | $ | 1.92 | $ | 1.60 | $ | 1.25 | |||||||||
Balance Sheet and Other Data at March 31: | |||||||||||||||||||
Working capital | $ | 236,364 | $ | 286,637 | $ | 68,312 | $ | 602,116 | $ | 344,157 | |||||||||
Total assets | 6,134,956 | 5,973,610 | 5,793,314 | 5,618,225 | 5,320,585 | ||||||||||||||
Short-term debt | 383,258 | 325,871 | 387,866 | — | 388,452 | ||||||||||||||
Current portion of long-term debt | 250,107 | 250,110 | 400,322 | 303,573 | 10,385 | ||||||||||||||
Long-term debt, excluding current portion | 1,954,820 | 1,748,662 | 1,706,774 | 2,304,245 | 1,761,902 | ||||||||||||||
Non-current deferred income tax liability, net | 894,344 | 854,574 | 825,897 | 825,612 | 793,957 | ||||||||||||||
Other non-current liabilities | 92,660 | 89,741 | 89,219 | 89,671 | 84,419 | ||||||||||||||
Stockholders’ equity | 2,045,298 | 2,151,586 | 1,840,649 | 1,536,983 | 1,750,258 | ||||||||||||||
Capital expenditures for years ended March 31, | 456,899 | 468,789 | 354,587 | 325,465 | 356,514 | ||||||||||||||
____________________
(1) | The results for fiscal 2016 include the following: $29.0 million ($18.0 million after tax) or $0.24 per diluted share for costs associated with the Air Liquide merger and $7.0 million (non-tax-deductible) or $0.09 per diluted share for costs accrued related to a Plea Agreement by Airgas Doral, Inc. (“Airgas Doral”), a wholly-owned subsidiary of Airgas, Inc., with the U.S. Attorney’s Office for the Southern District of Florida. See Note 18, “Commitments and Contingencies,” to the Company’s consolidated financial statements under Item 8, “Financial Statements and Supplementary Data” for additional information. During the fiscal year, long term debt increased primarily related to the issuance of the $400 million 3.05% senior notes maturing on August 1, 2020, partially offset by the repayment of the $250 million 3.25% senior notes on September 14, 2015 which were originally due to mature on October 1, 2015. |
(2) | The results for fiscal 2014 include the following: $9.1 million ($5.6 million after tax) or $0.08 per diluted share recorded for a loss on the early extinguishment of the Company’s $215 million of 7.125% senior subordinated notes, which were originally due to mature in October 2018 but were redeemed in full on October 2, 2013, as well as $3.3 million or $0.04 per diluted share of state income tax benefits recognized for changes to enacted state income tax rates and a change in a state income tax law. The proceeds from the Company’s commercial paper program were used in part for the early redemption of the senior subordinated notes and repayment of the Company’s $300 million 2.85% senior notes upon their maturity in October 2013, causing the $388 million increase to short-term debt. In addition, the Company reclassified its $400 million 4.5% senior notes maturing in September 2014 to the “Current portion of long-term debt” line item of the Company’s consolidated balance sheet based on the maturity date. |
18
(3) | The results for fiscal 2013 include the following: $8.1 million ($5.1 million after tax) or $0.07 per diluted share of net restructuring and other special charges and $6.8 million ($5.5 million after tax) or a benefit of $0.07 per diluted share of a gain on the sale of five branch locations in western Canada. The $6.8 million gain on sale of businesses was recorded in the “Other income, net” line item of the Company’s consolidated statement of earnings. Also during fiscal 2013, the Company’s $300 million 2.85% senior notes were reclassified to the “Current portion of long-term debt” line item of the Company’s consolidated balance sheet based on the maturity date. Additionally, during the three months ended March 31, 2013, proceeds from the issuance of an aggregate $600 million of senior notes in February 2013 were used to pay down the balance on the commercial paper program and, as a result, there were no outstanding borrowings under the program at March 31, 2013, resulting in a decrease to short-term debt and an increase in working capital in the table above. |
(4) | The results for fiscal 2012 include the following: $24.4 million ($15.6 million after tax) or $0.19 per diluted share of net restructuring and other special charges, $7.9 million ($5.0 million after tax) or $0.06 per diluted share in benefits from lower than previously estimated net costs related to a prior year unsolicited takeover attempt, $4.3 million ($2.7 million after tax) or $0.04 per diluted share in multi-employer pension plan withdrawal charges, and $4.9 million or $0.06 per diluted share of income tax benefits related to the LLC reorganization as well as a true-up of the Company’s foreign tax liabilities. Additionally, during fiscal 2012, the Company commenced a $750 million commercial paper program supported by its revolving credit facility. The Company has used proceeds under the commercial paper program to pay down amounts outstanding under its revolving credit facility and for general corporate purposes. Borrowings under the commercial paper program are classified as short-term debt on the Company’s consolidated balance sheet, which led to a $388 million decrease in both working capital and long-term debt in the table above. |
(5) | The Company’s quarterly cash dividends declared and paid to stockholders for the years presented above are disclosed in the following table: |
Years Ended March 31, | |||||||||||||||||||
2016 | 2015 | 2014 | 2013 | 2012 | |||||||||||||||
First Quarter | $ | 0.60 | $ | 0.55 | $ | 0.48 | $ | 0.40 | $ | 0.29 | |||||||||
Second Quarter | 0.60 | 0.55 | 0.48 | 0.40 | 0.32 | ||||||||||||||
Third Quarter | 0.60 | 0.55 | 0.48 | 0.40 | 0.32 | ||||||||||||||
Fourth Quarter | 0.60 | 0.55 | 0.48 | 0.40 | 0.32 | ||||||||||||||
Fiscal Year | $ | 2.40 | $ | 2.20 | $ | 1.92 | $ | 1.60 | $ | 1.25 | |||||||||
19
ITEM 7. | MANAGEMENT’S DISCUSSION AND ANALYSIS OF FINANCIAL CONDITION AND RESULTS OF OPERATIONS. |
RESULTS OF OPERATIONS: 2016 COMPARED TO 2015
OVERVIEW
Airgas, Inc. and its subsidiaries (“Airgas” or the “Company”) had net sales for the year ended March 31, 2016 (“fiscal 2016” or “current year”) of $5.3 billion, essentially flat compared to the year ended March 31, 2015 (“fiscal 2015” or “prior year”). Organic sales decreased 1% compared to the prior year, with gas and rent up 2% and hardgoods down 7%. Current and prior year acquisitions contributed sales growth of 1% in the current year. The Company’s organic sales continue to reflect the challenging industrial economy and in particular the pressure on sales to customers engaged in the energy and chemical and the manufacturing and metal fabrication sectors. The sluggish U.S. industrial economy, slowing global economy and strong dollar continue to challenge the Company’s customers across these and other sectors. Continued strength in certain sectors, such as non-residential construction, helped to mitigate these sales declines.
The consolidated gross profit margin (excluding depreciation) in the current year was 56.7%, an increase of 110 basis points from the prior year, primarily reflecting a sales mix shift toward higher margin gas and rent, and higher margins in the Company’s All Other Operations business segment.
The Company’s operating income margin in the current year was 10.9%, a decrease of 120 basis points from the prior year. The current year's operating income margin was burdened by 70 basis points of costs related to the Agreement and Plan of Merger with Air Liquide (see below for additional information) and other special charges. Excluding the merger-related costs and other special charges, the operating income margin was down 50 basis points, primarily reflecting challenging economic conditions and the impact of rising operating costs (including depreciation and amortization expenses) in the current negative organic sales growth environment, in the Company’s Distribution business segment.
Net earnings per diluted share was $4.54 in the current year versus $4.85 in the prior year. Net earnings per diluted share in the current year included a $0.24 per diluted share charge related to merger costs associated with the Air Liquide Merger and a non-tax-deductible $0.09 per diluted share charge related to a Plea Agreement by Airgas Doral, Inc. (“Airgas Doral”) with the U.S. Attorney’s Office for the Southern District of Florida.
Air Liquide Merger Agreement
On November 17, 2015, the Company announced that it had entered into a definitive agreement for the acquisition of the Company by L’Air Liquide, S.A. (“Air Liquide”) in a merger pursuant to an Agreement and Plan of Merger, dated as of November 17, 2015, by and among the Company, Air Liquide and AL Acquisition Corporation (“Merger Sub”), an indirect wholly owned subsidiary of Air Liquide (the “Merger Agreement”). The Merger Agreement provides that, among other things and subject to the terms and conditions thereof, Merger Sub will be merged with and into the Company (the “Merger”) with the Company continuing as the surviving corporation in the Merger as an indirect wholly owned subsidiary of Air Liquide. See Note 2, “Merger Agreement,” to the Consolidated Financial Statements under Item 8, “Financial Statements and Supplementary Data,” for more information on the Merger Agreement.
In connection with the Merger, the Company has incurred $29 million of merger-related costs during the year ended March 31, 2016, primarily consisting of legal, advisory and other professional fees in connection with the Merger. These costs are included in the “Merger costs and other special charges” line item of the Company’s consolidated statement of earnings.
Stock Repurchase Program
On May 28, 2015, the Company announced plans to repurchase up to $500 million of Airgas, Inc. common stock under a stock repurchase program approved by the Company’s Board of Directors. Airgas may repurchase shares from time to time for cash in open market transactions or in privately-negotiated transactions in accordance with applicable federal securities laws. The Company will determine the timing and the amount of any repurchases based on its evaluation of market conditions, share price, and other factors. The stock repurchase program has no pre-established closing date; however, stock repurchases are currently suspended in accordance with the Merger Agreement. See Note 2, “Merger Agreement,” to the Consolidated Financial Statements under Item 8, “Financial Statements and Supplementary Data,” for more information on the Merger Agreement.
From the announcement date of the program through September 30, 2015, the Company repurchased 3.8 million shares on the open market at an average price of $99.54. The Company did not repurchase any shares during the six-month period ended March 31, 2016. At March 31, 2016, $125 million was available for additional share repurchases under the program.
20
STATEMENT OF EARNINGS COMMENTARY - FISCAL YEAR ENDED MARCH 31, 2016 COMPARED TO FISCAL YEAR ENDED MARCH 31, 2015
Net Sales
Net sales of $5.3 billion for the current year were essentially flat compared to the prior year, with a decrease in organic sales of 1% offset by sales growth from current and prior year acquisitions of 1%. Gas and rent organic sales increased 2% in the current year, and hardgoods organic sales decreased 7%. Organic sales growth in the current year was driven by price increases of 1% and volume decreases of 2%.
Strategic products represent approximately 40% of net sales and are comprised of safety products and bulk, medical and specialty gases (and associated rent), which are sold to end customers through the Distribution business segment, and carbon dioxide (“CO2”) and dry ice, the vast majority of which is sold to end customers through the All Other Operations business segment. The Company has identified these products as strategic because it believes they have good long-term growth profiles relative to the Company’s core industrial gas and welding products due to favorable end customer markets, application development, increasing environmental regulation, strong cross-selling opportunities or a combination thereof. During the current year, sales of strategic products in aggregate increased 1% on an organic basis as compared to the prior year.
The Company’s strategic accounts program, which represents approximately 25% of net sales, is designed to deliver superior product and service offerings to larger, multi-location customers, and presents the Company with strong cross-selling and greater penetration opportunities. Sales to strategic accounts in the current year increased 1% compared to the prior year.
In the following table, the intercompany eliminations represent sales from the All Other Operations business segment to the Distribution business segment.
Years Ended | ||||||||||||||
Net Sales | March 31, | Increase/(Decrease) | ||||||||||||
(In thousands) | 2016 | 2015 | ||||||||||||
Distribution | $ | 4,716,228 | $ | 4,773,489 | $ | (57,261 | ) | (1 | )% | |||||
All Other Operations | 635,769 | 560,622 | 75,147 | 13 | % | |||||||||
Intercompany eliminations | (38,220 | ) | (29,226 | ) | (8,994 | ) | ||||||||
$ | 5,313,777 | $ | 5,304,885 | $ | 8,892 | — | % | |||||||
The Distribution business segment’s principal products and services include industrial, medical and specialty gases, and process chemicals; cylinder and equipment rental; and hardgoods. Industrial, medical and specialty gases are distributed in cylinders and bulk containers. Rental fees are generally charged on cylinders, dewars (cryogenic liquid cylinders), bulk and micro-bulk tanks, tube trailers and certain welding equipment. Hardgoods generally consist of welding consumables and equipment, safety products, construction supplies, and maintenance, repair and operating supplies.
Distribution business segment sales decreased 1% compared to the prior year, with a decrease in organic sales of 2%. Incremental sales from current and prior year acquisitions contributed sales growth of 1% in the current year. Higher pricing of 1% and volume decreases of 3% resulted in the 2% decrease in organic sales in the Distribution business segment. Gas and rent organic sales in the Distribution business segment increased 1%, with pricing up 1% and volumes flat. Hardgoods organic sales within the Distribution business segment decreased 7%, with pricing flat and volumes down 7%.
Within the Distribution business segment, organic sales of gas related strategic products and associated rent increased 4% over the prior year, comprised of the following: bulk gas and rent up 5%, on higher pricing and volumes; specialty gas, rent, and related equipment up 6%, on moderate growth in core specialty gas volumes; and medical gas and rent up 2%, as increases to physician and dental practices, as well as hospitals and surgery centers, were partially offset by weakness in wholesale sales to homecare distributors. In addition, organic sales in the Company’s Red-D-Arc business decreased 1% over the prior year, driven by weakness in generator rentals to oilfield services customers in the second half of the year.
Within the Distribution business segment’s hardgoods sales, sales of safety products decreased by 6% compared to the prior year on broad based moderation in core industrial activity. Sales of the Company’s Radnor® private-label product line, which includes certain safety products, consumables, and other hardgoods, decreased 4% in the current year, compared to the 7% decrease in total hardgoods organic sales in the Distribution business segment.
The All Other Operations business segment consists of six business units. The primary products manufactured and/or distributed are CO2, dry ice, nitrous oxide, ammonia and refrigerant gases, along with a nitrogen services business.
The All Other Operations business segment sales increased 13% compared to the prior year, with an increase in organic sales of 7%. Incremental sales from current and prior year acquisitions contributed sales growth of 6% in the current year. The strong organic growth in the All Other Operations business segment was driven by sales increases primarily in the Company’s
21
refrigerants, as well as dry ice businesses. Organic sales of CO2 and dry ice, the vast majority of which is sold to end customers through the All Other Operations business segment, increased 7% over the prior year on higher pricing and volumes.
Gross Profits (Excluding Depreciation)
Gross profits (excluding depreciation) do not reflect deductions related to depreciation expense and distribution costs. The Company reflects distribution costs as an element of the line item “Selling, distribution and administrative expenses” and recognizes depreciation on all of its property, plant and equipment in the line item “Depreciation” in its consolidated statements of earnings. Other companies may report certain or all of these costs as elements of their cost of products sold and, as such, the Company’s gross profits (excluding depreciation) discussed below may not be comparable to those of other companies.
Consolidated gross profits (excluding depreciation) increased 2% in the current year compared to the prior year, reflecting margin expansion on favorable sales mix. The consolidated gross profit margin (excluding depreciation) in the current year increased 110 basis points to 56.7% compared to 55.6% in the prior year. The increase in consolidated gross profit margin (excluding depreciation) primarily reflects the sales mix shift toward higher margin gas and rent and higher margins in the Company’s All Other Operations business segment, partially offset by a sales mix shift within gas toward lower margin refrigerants. Gas and rent represented 65.1% of the Company’s sales mix in the current year, up from 63.2% in the prior year.
Years Ended | ||||||||||||||
Gross Profits (ex. Depr.) | March 31, | Increase/(Decrease) | ||||||||||||
(In thousands) | 2016 | 2015 | ||||||||||||
Distribution | $ | 2,678,736 | $ | 2,681,023 | $ | (2,287 | ) | — | % | |||||
All Other Operations | 333,443 | 267,987 | 65,456 | 24 | % | |||||||||
$ | 3,012,179 | $ | 2,949,010 | $ | 63,169 | 2 | % | |||||||
The Distribution business segment’s gross profits (excluding depreciation) were down modestly compared to the prior year, primarily driven by the decline in the Distribution business segment’s sales, partially offset by higher margins. The Distribution business segment’s gross profit margin (excluding depreciation) increased 60 basis points to 56.8% in the current year from 56.2% in the prior year. The increase in the Distribution business segment’s gross profit margin (excluding depreciation) reflects a sales mix shift toward higher margin gas and rent, partially offset by margin pressure within gas and rent on higher helium costs and a sales mix shift toward lower margin bulk gas. Gas and rent represented 60.8% of the Distribution business segment’s sales in the current year, up from 59.1% in the prior year.
The All Other Operations business segment’s gross profits (excluding depreciation) increased 24% compared to the prior year, primarily driven by the increase in refrigerants and dry ice sales, margin expansion in the Company’s ammonia and refrigerants businesses, and the inclusion of the Priority Nitrogen acquisition. The All Other Operations business segment’s gross profit margin (excluding depreciation) increased 460 basis points to 52.4% in the current year from 47.8% in the prior year. The increase in the All Other Operations business segment’s gross profit margin (excluding depreciation) was primarily driven by margin expansion in the Company’s ammonia and refrigerants businesses plus the addition of the higher-margin Priority Nitrogen business.
Operating Expenses
Selling, Distribution and Administrative (“SD&A”) Expenses
SD&A expenses consist of labor and overhead associated with the purchasing, marketing and distribution of the Company’s products, as well as costs associated with a variety of administrative functions such as legal, treasury, accounting, tax and facility-related expenses. Additionally, the Company’s merger costs and other special charges are not allocated to the Company’s business segments. These costs are captured in a separate line item on the Company’s Consolidated Statements of Earnings and are reflected in the “Merger costs and other special charges” line item in the operating income table below.
Consolidated SD&A expenses increased $64 million, or 3%, in the current year as compared to the prior year. Contributing to the increase in SD&A expenses were approximately $28 million of incremental operating costs associated with acquired businesses, representing approximately 1.4% of the total increase in SD&A. The remaining increase is primarily related to normal inflation, as well as the incremental costs to support strong organic sales growth in the All Other Operations segment. As a percentage of consolidated gross profit, consolidated SD&A expenses increased 70 basis points to 67.8% in the current year, compared to 67.1% in the prior year.
22
Years Ended | ||||||||||||||
SD&A Expenses | March 31, | Increase/(Decrease) | ||||||||||||
(In thousands) | 2016 | 2015 | ||||||||||||
Distribution | $ | 1,828,814 | $ | 1,792,116 | $ | 36,698 | 2 | % | ||||||
All Other Operations | 213,940 | 186,558 | 27,382 | 15 | % | |||||||||
$ | 2,042,754 | $ | 1,978,674 | $ | 64,080 | 3 | % | |||||||
SD&A expenses in the Distribution business segment increased 2% compared to the prior year. Contributing to the increase in SD&A expenses in the Distribution business segment were approximately $17 million of incremental operating costs associated with acquired businesses, representing approximately 1% of the increase in SD&A. As a percentage of Distribution business segment gross profit, SD&A expenses in the Distribution business segment increased 150 basis points to 68.3% compared to 66.8% in the prior year.
SD&A expenses in the All Other Operations business segment increased 15% compared to the prior year. Contributing to the increase in SD&A expenses in the All Other Operations business segment were approximately $11 million of incremental operating costs associated with acquired businesses, representing approximately 6% of the increase in SD&A. Incremental costs to support strong organic sales growth in the All Other Operations business segment, also contributed to the increase. As a percentage of All Other Operations business segment gross profit, SD&A expenses in the All Other Operations business segment decreased 540 basis points to 64.2% compared to 69.6% in the prior year, primarily driven by strong sales and margin growth within the business segment.
Merger Costs and Other Special Charges
During the current year, the Company incurred $29 million of merger-related costs, primarily consisting of legal, advisory and other professional fees in connection with the Merger Agreement with Air Liquide. Additionally, during the current year, the Company accrued costs of $7 million related to a Plea Agreement by Airgas Doral with the U.S. Attorney’s Office for the Southern District of Florida, concerning past violations in connection with the handling, labeling and transportation of certain hazardous materials shipments from the Company’s Miami facilities to consignees located in South America. The Company’s merger costs and other special charges are captured in a separate line item on the Company’s Consolidated Statements of Earnings and not allocated to the Company’s business segments.
Depreciation and Amortization
Depreciation expense increased $21 million, or 7%, to $319 million in the current year as compared to the prior year. The increase primarily reflects the additional depreciation expense on capital investments in revenue generating assets to support customer demand (such as cylinders/bulk tanks and rental welders/generators), investments in the Company’s eBusiness platform and other system enhancements, and $2 million of additional depreciation expense on capital assets included in acquisitions. Amortization expense of $34 million in the current year increased by $3 million compared to the prior year, driven by acquisitions.
Operating Income
Consolidated operating income of $581 million decreased $61 million, 9%, in the current year compared to the prior year, with merger costs and other special charges of $36 million accounting for over half of the decline. The remaining decrease is primarily attributable to lower operating income in the Company’s Distribution business segment, partially offset by higher operating income in the Company’s All Other Operations business segment, as noted below. The consolidated operating income margin decreased 120 basis points to 10.9% from 12.1% in the prior year, of which 70 basis points of decline is due to merger-related costs and other special charges.
Years Ended | ||||||||||||||
Operating Income | March 31, | Increase/(Decrease) | ||||||||||||
(In thousands) | 2016 | 2015 | ||||||||||||
Distribution | $ | 531,815 | $ | 589,334 | $ | (57,519 | ) | (10 | )% | |||||
All Other Operations | 84,863 | 51,944 | 32,919 | 63 | % | |||||||||
Merger costs and other special charges | (35,967 | ) | — | (35,967 | ) | |||||||||
$ | 580,711 | $ | 641,278 | $ | (60,567 | ) | (9 | )% | ||||||
Operating income in the Distribution business segment decreased 10% compared to the prior year. The Distribution business segment’s operating income margin of 11.3% decreased by 100 basis points compared to the operating income margin of 12.3% in the prior year. The decline in the Distribution business segment’s operating income margin primarily reflects the
23
impact of rising operating costs (including depreciation and amortization expenses) in the current negative organic sales growth environment.
Operating income in the All Other Operations business segment increased 63% compared to the prior year, primarily driven by the increase in refrigerants and dry ice sales, margin expansion as described below, and the inclusion of the Priority Nitrogen acquisition. The All Other Operations business segment’s operating income margin of 13.3% increased by 400 basis points compared to the operating income margin of 9.3% in the prior year. The increase in the All Other Operations business segment’s operating income margin was primarily driven by margin expansion in the Company’s ammonia and refrigerants businesses.
Interest Expense, Net
Interest expense, net, was $60 million in the current year, representing a decrease of $2 million, or 3%, compared to the prior year. The overall decrease in interest expense, net resulted primarily from lower average borrowing rates, partially offset by higher average debt balances, in the current year as compared to the prior year.
Income Tax Expense
The effective income tax rate was 36.3% of pre-tax earnings in the current year compared to 37.0% in the prior year.
Net Earnings
Net earnings per diluted share decreased 6% to $4.54 in the current year compared to $4.85 per diluted share in the prior year. Net earnings were $338 million in the current year compared to $368 million in the prior year. Net earnings in the current year included costs of $18 million (net of tax) or a $0.24 per diluted share charge related to merger costs associated with the Merger and $7 million (non-tax-deductible) or a $0.09 per diluted share charge related to a Plea Agreement by Airgas Doral with the U.S. Attorney’s Office for the Southern District of Florida. Net earnings in the prior year were not impacted by special items.
RESULTS OF OPERATIONS: 2015 COMPARED TO 2014
OVERVIEW
Airgas had net sales for fiscal 2015 of $5.3 billion compared to $5.1 billion for the year ended March 31, 2014 (“fiscal 2014”), an increase of 5%. Organic sales increased 3% compared to fiscal 2014, with gas and rent up 3% and hardgoods up 4%. Acquisitions contributed sales growth of 2% in fiscal 2015. Through the first nine months of fiscal 2015, organic sales growth was 3%, with the third quarter showing the strongest year over year growth rate of 6%. The Company’s fiscal 2015 fourth quarter year over year organic growth rate fell to 2% as the energy & chemicals and manufacturing customer segments were negatively impacted by the significant and rapid decline in oil prices and the strong U.S. dollar.
The consolidated gross profit margin (excluding depreciation) in fiscal 2015 was 55.6%, a decrease of 10 basis points from fiscal 2014.
The Company’s operating income margin in fiscal 2015 was 12.1%, a decrease of 30 basis points from fiscal 2014, primarily reflecting the sales mix shift toward lower margin hardgoods, the impact of rising operating costs and the Company’s continued investments in strategic long-term growth initiatives in a low organic sales growth environment.
Net earnings per diluted share increased to $4.85 in fiscal 2015 versus $4.68 in fiscal 2014. Net earnings per diluted share in fiscal 2014 included $0.04 per diluted share in benefits related to changes in state income tax rates and law, and an $0.08 loss on the early extinguishment of debt.
STATEMENT OF EARNINGS COMMENTARY - FISCAL YEAR ENDED MARCH 31, 2015 COMPARED TO FISCAL YEAR ENDED MARCH 31, 2014
Net Sales
Net sales increased 5% to $5.3 billion for fiscal 2015 compared to fiscal 2014, driven by organic sales growth of 3% and sales growth from acquisitions of 2%. Gas and rent organic sales increased 3% and hardgoods organic sales increased 4%. Organic sales growth in fiscal 2015 was driven by price increases of 2% and volume increases of 1%.
For fiscal 2015, sales of strategic products increased 4% on an organic basis as compared to fiscal 2014. Sales to strategic accounts in fiscal 2015 grew 5% compared to fiscal 2014.
In the following table, the intercompany eliminations represent sales from the All Other Operations business segment to the Distribution business segment.
24
Years Ended | ||||||||||||||
Net Sales | March 31, | Increase/(Decrease) | ||||||||||||
(In thousands) | 2015 | 2014 | ||||||||||||
Distribution | $ | 4,773,489 | $ | 4,558,790 | $ | 214,699 | 5 | % | ||||||
All Other Operations | 560,622 | 544,154 | 16,468 | 3 | % | |||||||||
Intercompany eliminations | (29,226 | ) | (30,407 | ) | 1,181 | |||||||||
$ | 5,304,885 | $ | 5,072,537 | $ | 232,348 | 5 | % | |||||||
Distribution business segment sales increased 5% compared to fiscal 2014, with an increase in organic sales of 3% and incremental sales of 2% contributed by acquisitions. Higher pricing contributed 2% and volume increases contributed 1% to organic sales growth in the Distribution business segment. Gas and rent organic sales in the Distribution business segment increased 2%, with pricing up 3% and volumes down 1%. Hardgoods organic sales within the Distribution business segment increased 4%, with pricing up 1% and volumes up 3%.
Within the Distribution business segment, organic sales of gas related strategic products and associated rent increased 4% in fiscal 2015, comprised of the following: bulk gas and rent up 5% on higher pricing and volumes; specialty gas, rent, and related equipment up 3%, primarily driven by increases in core specialty gas prices and volumes; and medical gas and rent up 2%, as increases to physician and dental practices, as well as hospitals and surgery centers, were partially offset by weakness in wholesale sales to homecare distributors. In addition, organic sales in the Company’s Red-D-Arc business increased 14% in fiscal 2015, driven by increases in both welder and generator rentals in the non-residential construction and energy customer segments.
Within the Distribution business segment’s hardgoods sales, organic sales of equipment were up 8% year-over-year. Sales of Safety products increased 4% in fiscal 2015 driven by volume gains. Sales of the Company’s Radnor® private-label product line, which includes certain safety products, consumables, and other hardgoods, increased 4% in fiscal 2015, consistent with the 4% increase in total hardgoods organic sales in the Distribution business segment.
The All Other Operations business segment sales increased 3% in total and on an organic basis compared to fiscal 2014. Sales increases in the Company’s CO2, dry ice and ammonia businesses were partially offset by the decline in sales in its refrigerants business during fiscal 2015. Organic sales of CO2 and dry ice increased 3% over fiscal 2014.
Gross Profits (Excluding Depreciation)
Consolidated gross profits (excluding depreciation) increased 4% in fiscal 2015 compared to fiscal 2014, reflecting the overall growth in sales, margin expansion on price increases and surcharges related to power cost spikes in the fiscal 2014 fourth quarter, partially offset by supplier price and internal production cost increases and a sales mix shift toward lower margin hardgoods. The consolidated gross profit margin (excluding depreciation) in fiscal 2015 decreased 10 basis points to 55.6% compared to 55.7% in fiscal 2014. The decrease in consolidated gross profit margin (excluding depreciation) reflects margin expansion on price increases offset by a sales mix shift toward lower margin hardgoods. Gas and rent represented 63.2% of the Company’s sales mix in fiscal 2015, down from 63.6% in fiscal 2014.
Years Ended | ||||||||||||||
Gross Profits (ex. Depr.) | March 31, | Increase/(Decrease) | ||||||||||||
(In thousands) | 2015 | 2014 | ||||||||||||
Distribution | $ | 2,681,023 | $ | 2,562,725 | $ | 118,298 | 5 | % | ||||||
All Other Operations | 267,987 | 262,238 | 5,749 | 2 | % | |||||||||
$ | 2,949,010 | $ | 2,824,963 | $ | 124,047 | 4 | % | |||||||
The Distribution business segment’s gross profits (excluding depreciation) increased 5% compared to fiscal 2014. The Distribution business segment’s gross profit margin (excluding depreciation) remained consistent at 56.2% in fiscal 2015 and fiscal 2014. The Distribution business segment’s flat gross profit margin (excluding depreciation) reflects margin expansion on price increases and surcharges related to power cost spikes in the fiscal 2014 fourth quarter, offset by a sales mix shift toward lower margin hardgoods. Gas and rent represented 59.1% of the Distribution business segment’s sales in fiscal 2015, down from 59.6% in fiscal 2014.
The All Other Operations business segment’s gross profits (excluding depreciation) increased 2% compared to fiscal 2014. The All Other Operations business segment’s gross profit margin (excluding depreciation) decreased 40 basis points to 47.8% in fiscal 2015 from 48.2% in fiscal 2014. The decrease in the All Other Operations business segment’s gross profit margin (excluding depreciation) was primarily driven by a sales mix shift toward lower margin ammonia and slight margin pressure in the Company’s CO2, refrigerants and ammonia businesses, partially offset by a sales mix shift away from lower margin refrigerants.
25
Operating Expenses
SD&A Expenses
SD&A expenses consist of labor and overhead associated with the purchasing, marketing and distribution of the Company’s products, as well as costs associated with a variety of administrative functions such as legal, treasury, accounting, tax and facility-related expenses. Although corporate operating expenses are generally allocated to each business segment based on sales dollars, the Company reported expenses (excluding depreciation) related to the implementation of its SAP system as part of SD&A expenses in the “Other” line item in the SD&A expenses and operating income tables below.
Consolidated SD&A expenses increased $90 million, or 5%, in fiscal 2015 as compared to fiscal 2014. Contributing to the increase in SD&A expenses were approximately $27 million of incremental operating costs associated with acquired businesses, representing approximately 1.4% of the total increase in SD&A. Normal inflation, as well as expenses associated with the Company’s investments in long-term strategic growth initiatives, including its e-Business platform, continued expansion of its telesales business through Airgas Total Access™, and regional management structure changes, also contributed to the increase. As a percentage of consolidated gross profit, consolidated SD&A expenses increased 20 basis points to 67.1% in fiscal 2015, compared to 66.9% in fiscal 2014.
Years Ended | ||||||||||||||
SD&A Expenses | March 31, | Increase/(Decrease) | ||||||||||||
(In thousands) | 2015 | 2014 | ||||||||||||
Distribution | $ | 1,792,116 | $ | 1,705,408 | $ | 86,708 | 5 | % | ||||||
All Other Operations | 186,558 | 176,289 | 10,269 | 6 | % | |||||||||
Other | — | 7,426 | (7,426 | ) | ||||||||||
$ | 1,978,674 | $ | 1,889,123 | $ | 89,551 | 5 | % | |||||||
SD&A expenses in the Distribution business segment increased 5%, while SD&A expenses in the All Other Operations business segment increased 6%, compared to fiscal 2014. Contributing to the increase in SD&A expenses in the Distribution business segment were approximately $27 million of incremental operating costs associated with acquired businesses, representing approximately 1.5% of the increase in SD&A. Normal inflation, as well as expenses associated with the Company’s investments in long-term strategic growth initiatives, including its e-Business platform, continued expansion of its telesales business through Airgas Total Access™, and regional management structure changes, also contributed to the increase. As a percentage of Distribution business segment gross profit, SD&A expenses in the Distribution business segment increased 30 basis points to 66.8% compared to 66.5% in fiscal 2014. As a percentage of All Other Operations business segment gross profit, SD&A expenses in the All Other Operations business segment increased 240 basis points to 69.6% compared to 67.2% in fiscal 2014, primarily driven by margin pressure as noted above.
SD&A Expenses – Other
Enterprise Information System
As of March 31, 2013, the Company had successfully converted its Safety telesales and hardgoods infrastructure businesses, as well as all of its regional distribution businesses, to the SAP platform. The Company continued to incur some post-conversion support and training expenses related to the implementation of the new system through the end of fiscal 2014. SAP-related integration costs were $7.4 million in fiscal 2014, and were recorded as SD&A expenses and not allocated to the Company’s business segments.
Depreciation and Amortization
Depreciation expense increased $22 million, or 8%, to $298 million in fiscal 2015 as compared to fiscal 2014. The increase primarily reflects the additional depreciation expense on capital investments in revenue generating assets to support customer demand (such as cylinders/bulk tanks and rental welders/generators) and $3 million of additional depreciation expense on capital assets included in acquisitions. Amortization expense of $31 million in fiscal 2015 increased by $2 million compared to fiscal 2014, driven by acquisitions.
Operating Income
Consolidated operating income of $641 million increased 2% in fiscal 2015 compared to fiscal 2014, primarily driven by organic sales growth. The consolidated operating income margin increased 30 basis points to 12.1% compared to 12.4% in fiscal 2014, primarily reflecting a sales mix shift toward hardgoods.
26
Years Ended | ||||||||||||||
Operating Income | March 31, | Increase/(Decrease) | ||||||||||||
(In thousands) | 2015 | 2014 | ||||||||||||
Distribution | $ | 589,334 | $ | 579,476 | $ | 9,858 | 2 | % | ||||||
All Other Operations | 51,944 | 58,484 | (6,540 | ) | (11 | )% | ||||||||
Other | — | (7,426 | ) | 7,426 | ||||||||||
$ | 641,278 | $ | 630,534 | $ | 10,744 | 2 | % | |||||||
Operating income in the Distribution business segment increased 2% in fiscal 2015. The Distribution business segment’s operating income margin decreased 40 basis points to 12.3% from 12.7% in fiscal 2014. The decline in the Distribution business segment’s operating income margin primarily reflects the sales mix shift toward lower margin hardgoods and the impact of rising operating costs and the Company’s continued investments in strategic long-term growth initiatives in a low organic sales growth environment.
Operating income in the All Other Operations business segment decreased 11% compared to fiscal 2014, primarily driven by the decline in refrigerants sales. The All Other Operations business segment’s operating income margin of 9.3% decreased by 140 basis points compared to the operating income margin of 10.7% in fiscal 2014. The decrease in the All Other Operations business segment’s operating income margin was primarily driven by margin pressure in the Company’s refrigerants, CO2 and ammonia businesses.
Interest Expense, Net and Loss on the Extinguishment of Debt
Interest expense, net, was $62 million in fiscal 2015, representing a decrease of $11 million, or 16%, compared to fiscal 2014. The overall decrease in interest expense, net resulted primarily from lower average borrowing rates and, to a lesser extent, lower average debt balances in fiscal 2015 as compared to fiscal 2014.
On October 2, 2013, the Company redeemed all $215 million of its 7.125% senior subordinated notes originally due to mature on October 1, 2018 (the “2018 Senior Subordinated Notes”). A loss on the early extinguishment of debt of $9.1 million related to the redemption premium and write-off of unamortized debt issuance costs was recognized in fiscal 2014.
Income Tax Expense
The effective income tax rate was 37.0% of pre-tax earnings in fiscal 2015 compared to 36.4% in fiscal 2014. An aggregate $3.3 million in favorable state income tax items was recognized in fiscal 2014. During the three months ended September 30, 2013, the Company recognized a $1.5 million tax benefit related to a change in a state income tax law, allowing the Company to utilize additional net operating loss carryforwards. During the three months ended March 31, 2014, the Company recognized an additional $1.8 million of tax benefits related to enacted changes in state income tax rates.
Net Earnings
Net earnings per diluted share increased by 4% to $4.85 in fiscal 2015 compared to $4.68 per diluted share in fiscal 2014. Net earnings were $368 million in fiscal 2015 compared to $351 million in fiscal 2014. Fiscal 2015’s earnings were not impacted by special items, while net earnings per diluted share in fiscal 2014 included $0.04 per diluted share in benefits related to changes in state income tax rates and law, and an $0.08 loss on the early extinguishment of debt.
LIQUIDITY AND CAPITAL RESOURCES
Cash Flows
Net cash provided by operating activities was $744 million in fiscal 2016 compared to $718 million in fiscal 2015 and $745 million in fiscal 2014.
The following table provides a summary of the major items affecting the Company’s cash flows from operating activities for the years presented:
Years Ended March 31, | |||||||||||
(In thousands) | 2016 | 2015 | 2014 | ||||||||
Net earnings | $ | 337,500 | $ | 368,086 | $ | 350,784 | |||||
Non-cash and non-operating activities (1) | 402,661 | 388,789 | 335,284 | ||||||||
Changes in working capital | 6,655 | (26,192 | ) | 63,998 | |||||||
Other operating activities | (2,881 | ) | (12,646 | ) | (5,206 | ) | |||||
Net cash provided by operating activities | $ | 743,935 | $ | 718,037 | $ | 744,860 | |||||
27
____________________
(1) | Includes depreciation, amortization, deferred income taxes, gains on sales of plant and equipment, stock-based compensation expense, and losses on the extinguishment of debt. |
The cash inflow related to working capital in the current year was primarily driven by a lower required investment in working capital and a reduction in trade receivables, reflecting the overall negative organic sales growth environment as well as the timing and receipt of vendor rebate payments, partially offset by the increase in estimated income tax payments and timing of payments to vendors. The cash outflow related to working capital in fiscal 2015 was primarily driven by the timing of income tax payments due to changes in tax laws. The cash inflow related to working capital in fiscal 2014 was primarily driven by a lower required investment in working capital, reflecting a low organic sales growth environment, improved accounts receivable management following the Company’s SAP conversions and the timing of income tax payments.
Net earnings plus non-cash and non-operating activities provided cash of $740 million in fiscal 2016 versus $757 million in fiscal 2015 and $686 million in fiscal 2014.
As of March 31, 2016, $21 million of the Company’s $56 million cash balance was held by foreign subsidiaries. The Company does not believe it will be necessary to repatriate cash held outside of the U.S. and anticipates its domestic liquidity needs will be met through other funding sources such as cash flows generated from operating activities and external financing arrangements. Accordingly, the Company intends to permanently reinvest the cash in its foreign operations to support working capital needs, investing and financing activities, and future business development. Were the Company’s intention to change, the amounts held within its foreign operations could be repatriated to the U.S., although any repatriations under current U.S. tax laws would be subject to income taxes, net of applicable foreign tax credits.
The following table provides a summary of the major items affecting the Company’s cash flows from investing activities for the years presented:
Years Ended March 31, | |||||||||||
(In thousands) | 2016 | 2015 | 2014 | ||||||||
Capital expenditures | $ | (456,899 | ) | $ | (468,789 | ) | $ | (354,587 | ) | ||
Proceeds from sales of plant and equipment | 25,521 | 23,083 | 15,483 | ||||||||
Business acquisitions and holdback settlements | (101,704 | ) | (51,382 | ) | (203,529 | ) | |||||
Other investing activities | 2,556 | 325 | (951 | ) | |||||||
Net cash used in investing activities | $ | (530,526 | ) | $ | (496,763 | ) | $ | (543,584 | ) | ||
Capital expenditures as a percent of sales were 8.6%, 8.8% and 7.0%, respectively, for fiscal years 2016, 2015 and 2014. The capital expenditures in the current year compared to the prior year period reflects the Company’s continued higher investments in revenue generating assets, such as rental welding and generator equipment, cylinders and bulk tanks; the construction of new air separation units in Illinois, Kentucky and Alabama; and the purchase of various facilities previously operated under lease agreements related to the acquired Encompass Gas Group. Lease buyouts in fiscal 2016 were $45 million as compared to $3 million in fiscal 2015 and $4 million in fiscal 2014. The increase in capital expenditures in fiscal 2015 compared to fiscal 2014 reflects the Company’s higher investments in revenue generating assets, such as rental welding and generator equipment, cylinders and bulk tanks to support sales growth; the construction of new air separation units in Kentucky and Illinois and a new hardgoods distribution center in Wisconsin; and the development of the Company’s e-Business platform.
In fiscal 2016, the company paid $102 million to acquire eighteen businesses and to settle holdback liabilities, which excludes cash paid related to certain contingent consideration arrangements that are reflected as financing activities. In fiscal 2015, the company paid $51 million to acquire fourteen businesses and to settle holdback liabilities, which excludes cash paid related to certain contingent consideration arrangements that are reflected as financing activities. In fiscal 2014, the company paid $204 million to acquire eleven businesses and to settle holdback liabilities, which excludes cash paid related to certain contingent consideration arrangements that are reflected as financing activities.
Free cash flow* in fiscal 2016 was $403 million, compared to $309 million in fiscal 2015 and $441 million in fiscal 2014.
* Free cash flow is a financial measure calculated as net cash provided by operating activities minus capital expenditures, adjusted for the impacts of certain items. See Non-GAAP reconciliation and components of free cash flow at the end of this section.
The following table provides a summary of the major items affecting the Company’s cash flows from financing activities for the years presented:
28
Years Ended March 31, | |||||||||||
(In thousands) | 2016 | 2015 | 2014 | ||||||||
Net cash borrowings (repayments) | $ | 262,001 | $ | (161,260 | ) | $ | (113,374 | ) | |||
Purchase of treasury stock | (374,706 | ) | — | (8,127 | ) | ||||||
Dividends paid to stockholders | (175,384 | ) | (164,517 | ) | (141,461 | ) | |||||
Other financing activities | 79,765 | 85,666 | 44,861 | ||||||||
Net cash used in financing activities | $ | (208,324 | ) | $ | (240,111 | ) | $ | (218,101 | ) | ||
In fiscal 2016, net financing activities used cash of $208 million. Net cash repayments on debt obligations were $262 million, primarily related to the issuance of $400 million of 3.05% senior notes maturing on August 1, 2020, borrowings of $56 million under the commercial paper program, $21 million of net revolving credit borrowings and increased borrowings of $35 million under the Securitization Agreement, partially offset by the repayment of $250 million of 3.25% senior notes that would have matured on October 1, 2015. On May 28, 2015, the Company announced a $500 million stock repurchase program and during fiscal 2016, the Company repurchased 3.8 million shares in the open market for $375 million. The Company did not repurchase any shares during the six months ended March 31, 2016 as the program was suspended in accordance with the Merger Agreement. At March 31, 2016, $125 million was available for additional share repurchases under the program. Other financing activities, primarily comprised of proceeds and excess tax benefits related to the exercise of stock options and stock issued for the Employee Stock Purchase Plan, and the change in cash overdrafts, generated cash of $80 million during the current year.
In fiscal 2015, net financing activities used cash of $240 million. Net cash repayments on debt obligations were $161 million, primarily related to the repayment of $400 million of 4.50% senior notes that matured on September 15, 2014, partially offset by the June 2014 issuance of $300 million of 3.65% senior notes maturing on July 15, 2024 and repayment of $63 million under the commercial paper program. Other financing activities, primarily comprised of proceeds and excess tax benefits related to the exercise of stock options and stock issued for the Employee Stock Purchase Plan, generated cash of $86 million during the current year.
In fiscal 2014, net financing activities used cash of $218 million. Net cash repayments on debt obligations were $113 million, primarily related to the early redemption of the Company’s 2018 Senior Subordinated Notes and repayment of its 2013 Notes upon their maturity in October 2013. The note repayments were financed with proceeds from the Company’s commercial paper program, excess cash and borrowings under its trade receivables securitization facility. Other financing activities, primarily comprised of proceeds and excess tax benefits related to the exercise of stock options and stock issued for the Employee Stock Purchase Plan, and the change in cash overdrafts, generated cash of $45 million during the current year.
Dividends
In fiscal 2016, the Company paid its stockholders $175 million in dividends or $0.60 per share in all four quarters. During fiscal 2015, the Company paid dividends of $165 million or $0.55 per share in all four quarters. During fiscal 2014, the Company paid its stockholders $141 million in dividends or $0.48 per share in all four quarters. Future dividend declarations and associated amounts paid will depend upon the Company’s earnings, financial condition, loan covenants, capital requirements and other factors deemed relevant by management and the Company’s Board of Directors. Any future dividend increases would be subject to certain limitations as described in the Merger Agreement.
Financial Instruments and Sources of Liquidity
In addition to utilizing cash from operations, the Company has various liquidity resources available to meet its future cash requirements for working capital, capital expenditures and other financial commitments. See Note 10, “Indebtedness,” to the Company’s consolidated financial statements under Item 8, “Financial Statements and Supplementary Data” for additional information on the Company’s debt instruments.
Money Market Loans
The Company has two separate money market loan agreements with financial institutions to provide access to short-term advances not to exceed $35 million for each respective agreement. At March 31, 2016, there were no advances outstanding under the agreements.
Commercial Paper
The Company participates in a $1 billion commercial paper program supported by its Credit Facility (see below). This program allows the Company to obtain favorable short-term borrowing rates with maturities that vary, but will generally not exceed 90 days from the date of issue, and is classified as short-term debt. At maturity, the commercial paper balances are often rolled over rather than repaid or refinanced, depending on the Company’s cash and liquidity positions. The Company has used
29
proceeds from commercial paper issuances for general corporate purposes. At March 31, 2016, $383 million of borrowings were outstanding under the commercial paper program.
Trade Receivables Securitization
The Company participates in a securitization agreement with four commercial bank conduits to which it sells qualifying trade receivables on a revolving basis (the “Securitization Agreement”), up to a maximum amount of $330 million. The Company’s sale of qualified trade receivables is accounted for as a secured borrowing under which qualified trade receivables collateralize amounts borrowed from the commercial bank conduits. The maturity date of the Securitization Agreement is December 5, 2018. At March 31, 2016, the amount of outstanding borrowing under the Securitization Agreement was $330 million.
Senior Credit Facility
The Company participates in a $1 billion Amended and Restated Credit Facility (the “Credit Facility”). The Credit Facility consists of an $875 million U.S. dollar revolving credit line, with a $100 million letter of credit sublimit and a $75 million swingline sublimit, and a $125 million (U.S. dollar equivalent) multi-currency revolving credit line. The maturity date of the Credit Facility is November 18, 2019. Under circumstances described in the Credit Facility, the revolving credit line may be increased by an additional $500 million, provided that the multi-currency revolving credit line may not be increased by more than an additional $50 million.
At March 31, 2016, the financial covenant of the Credit Facility did not restrict the Company’s ability to borrow on the unused portion of the Credit Facility. The Credit Facility contains customary events of default including, without limitation, failure to make payments, a cross-default to certain other debt, breaches of covenants, breaches of representations and warranties, certain monetary judgments and bankruptcy and ERISA events. In the event of default, repayment of borrowings under the Credit Facility may be accelerated.
Senior Notes
In August 2015, the Company issued $400 million of 3.05% senior notes maturing on August 1, 2020 (the “2020 Notes”), which were principally used for general corporate purposes, including to fund acquisitions, to repay indebtedness and to repurchase shares pursuant to the Company’s stock repurchase program.
In September 2015, the Company redeemed in full its $250 million 3.25% senior notes originally due to mature on October 1, 2015 (the “2015 Notes”) at 100% of the principal amount of the notes plus accrued interest.
At March 31, 2016, the Company’s $250 million 2.95% senior notes maturing on June 15, 2016 (the “2016 Notes”) were included in the “Current portion of long-term debt” line item on the Company’s consolidated balance sheet. In April 2016, the Company announced it has elected to redeem the 2016 Notes maturing in June 2016. The 2016 Notes will be redeemed in full on May 15, 2016, at a price of 100%.
Total Borrowing Capacity
The Company believes that it has sufficient liquidity to meet its working capital, capital expenditure and other financial commitments, including its $250 million of 2.95% senior notes maturing on June 15, 2016. The sources of that liquidity include cash from operations, availability under the Company’s commercial paper program, Securitization Agreement and revolving credit facilities, and potential capital markets transactions. The financial covenant under the Company’s Credit Facility requires the Company to maintain a leverage ratio not higher than 3.5x Debt to EBITDA. The leverage ratio is a contractually defined amount principally reflecting debt and, historically, the amounts outstanding under the Securitization Agreement (“Debt”), divided by a contractually defined Earnings Before Interest, Taxes, Depreciation and Amortization (“EBITDA”) financial measure for the trailing twelve-month period with pro forma adjustments for acquisitions. The financial covenant calculations of the Credit Facility include the pro forma results of acquired businesses. Therefore, total borrowing capacity is not reduced dollar-for-dollar with acquisition financing. The leverage ratio measures the Company’s ability to meet current and future obligations. At March 31, 2016, the Company’s leverage ratio was 2.6x and $495 million remained available under the Company’s Credit Facility, after giving effect to the commercial paper program backstopped by the Credit Facility, the outstanding U.S. letters of credit and the borrowings under the multi-currency revolver.
The Company continually evaluates alternative financing arrangements and believes that it can obtain financing on reasonable terms. The terms of any future financing arrangements depend on market conditions and the Company’s financial position at that time. At March 31, 2016, the Company was in compliance with all covenants under all of its debt agreements.
Interest Rate Derivatives
The Company manages its exposure to changes in market interest rates through the occasional use of interest rate derivative instruments, when deemed appropriate. At March 31, 2016, the Company had no derivative instruments outstanding.
30
Interest Expense
Based on the Company’s fixed-to-variable interest rate ratio as of March 31, 2016, for every 25 basis point increase in the Company’s average variable borrowing rates, the Company estimates that its annual interest expense would increase by approximately $2.0 million.
Non-GAAP Reconciliations
Adjusted Cash from Operations, Adjusted Capital Expenditures, and Free Cash Flow
Years Ended March 31, | |||||||||
(In thousands) | 2016 | 2015 | 2014 | ||||||
Net cash provided by operating activities | $ | 743,935 | $ | 718,037 | $ | 744,860 | |||
Adjustments to net cash provided by operating activities: | |||||||||
Stock issued for the Employee Stock Purchase Plan | 19,615 | 17,940 | 17,313 | ||||||
Excess tax benefit realized from the exercise of stock options | 13,522 | 16,045 | 13,668 | ||||||
Cash expenditures related to merger | 12,467 | — | — | ||||||
Adjusted cash from operations | 789,539 | 752,022 | 775,841 | ||||||
Capital expenditures | (456,899 | ) | (468,789 | ) | (354,587 | ) | |||
Adjustments to capital expenditures: | |||||||||
Proceeds from sales of plant and equipment | 25,521 | 23,083 | 15,483 | ||||||
Operating lease buyouts | 45,327 | 3,159 | 4,420 | ||||||
Adjusted capital expenditures | (386,051 | ) | (442,547 | ) | (334,684 | ) | |||
Free cash flow | $ | 403,488 | $ | 309,475 | $ | 441,157 | |||
Net cash used in investing activities | $ | (530,526 | ) | $ | (496,763 | ) | $ | (543,584 | ) |
Net cash used in financing activities | $ | (208,324 | ) | $ | (240,111 | ) | $ | (218,101 | ) |
The Company believes its free cash flow financial measure provides investors meaningful insight into its ability to generate cash from operations, excluding the impact of cash expenditures related to the Air Liquide merger, which is available for servicing debt obligations and for the execution of its business strategies, including acquisitions, the prepayment of debt, the payment of dividends, or to support other investing and financing activities. The Company’s free cash flow financial measure has limitations and does not represent the residual cash flow available for discretionary expenditures. Certain non-discretionary expenditures such as payments on maturing debt obligations are excluded from the Company’s computation of its free cash flow financial measure. Non-GAAP financial measures should be read in conjunction with GAAP financial measures, as non-GAAP financial measures are merely a supplement to, and not a replacement for, GAAP financial measures. It should also be noted that the Company’s free cash flow financial measure may be different from free cash flow financial measures provided by other companies.
OTHER
Critical Accounting Estimates
The preparation of financial statements and related disclosures in conformity with U.S. generally accepted accounting principles requires management to make judgments, assumptions and estimates that affect the amounts reported in the consolidated financial statements and accompanying notes. Note 1 to the consolidated financial statements included under Item 8, “Financial Statements and Supplementary Data,” describes the significant accounting policies and methods used in the preparation of the consolidated financial statements. Estimates are used for, but not limited to, determining the net carrying value of trade receivables, inventories, goodwill, business insurance reserves and deferred income tax assets. Uncertainties about future events make these estimates susceptible to change. Management evaluates these estimates regularly and believes they are the best estimates, appropriately made, given the known facts and circumstances. For the three years ended March 31, 2016, there were no material changes in the valuation methods or assumptions used by management. However, actual results could differ from these estimates under different assumptions and circumstances. The Company believes the following accounting estimates are critical due to the subjectivity and judgment necessary to account for these matters, their susceptibility to change and the potential impact that different assumptions could have on operating performance or financial position.
31
Trade Receivables
The Company maintains an allowance for doubtful accounts, which includes sales returns, sales allowances and bad debts. The allowance adjusts the carrying value of trade receivables for the estimate of accounts that will ultimately not be collected. An allowance for doubtful accounts is generally established as trade receivables age beyond their due dates, whether as bad debts or as sales returns and allowances. As past due balances age, higher valuation allowances are established, thereby lowering the net carrying value of receivables. The amount of valuation allowance established for each past-due period reflects the Company’s historical collections experience, including that related to sales returns and allowances, as well as current economic conditions and trends. The Company also qualitatively establishes valuation allowances for specific problem accounts and bankruptcies, and other accounts that the Company deems relevant for specifically identified allowances. The amounts ultimately collected on past due trade receivables are subject to numerous factors including general economic conditions, the condition of the receivable portfolios assumed in acquisitions, the financial condition of individual customers and the terms of reorganization for accounts exiting bankruptcy. Changes in these conditions impact the Company’s collection experience and may result in the recognition of higher or lower valuation allowances. Management evaluates the allowance for doubtful accounts monthly. Historically, bad debt expense reflected in the Company’s financial results has generally been in the range of 0.3% to 0.5% of net sales. The Company has a low concentration of credit risk due to its broad and diversified customer base across multiple industries and geographic locations, and its relatively low average order size. The Company’s largest customer accounts for less than 1% of total net sales.
Inventories
The Company’s inventories are stated at the lower of cost or market. The majority of the products the Company carries in inventory have long shelf lives and are not subject to technological obsolescence. The Company writes its inventory down to its estimated market value when it believes the market value is below cost. The Company estimates its ability to recover the costs of items in inventory by product type based on factors including the age of the products, the rate at which the product line is turning in inventory, the products’ physical condition and assumptions about future demand and market conditions. The ability of the Company to recover the cost of products in inventory can be affected by factors such as future customer demand, general market conditions and the Company’s relationships with significant suppliers. Management evaluates the recoverability of its inventory at least quarterly. In aggregate, inventory turns four-to-five times per year on average.
Goodwill
The Company is required to test goodwill associated with each of its reporting units for impairment at least annually and whenever events or circumstances indicate that it is more likely than not that goodwill may be impaired. The Company performs its annual goodwill impairment test as of October 31 of each year.
Goodwill is tested for impairment at the reporting unit level. The Company has determined that its reporting units for goodwill impairment testing purposes are equivalent to the operating segments used in the Company’s segment reporting (see Note 22 to the consolidated financial statements). In performing tests for goodwill impairment, the Company is permitted to first perform a qualitative assessment about the likelihood of the carrying value of a reporting unit exceeding its fair value. If an entity determines that it is more likely than not that the fair value of a reporting unit is less than its carrying amount based on the qualitative assessment, it is required to perform the two-step goodwill impairment test described below to identify the potential goodwill impairment and measure the amount of the goodwill impairment loss, if any, to be recognized for that reporting unit. However, if an entity concludes otherwise based on the qualitative assessment, the two-step goodwill impairment test is not required. The option to perform the qualitative assessment can be utilized at the Company’s discretion, and the qualitative assessment need not be applied to all reporting units in a given goodwill impairment test. For an individual reporting unit, if the Company elects not to perform the qualitative assessment, or if the qualitative assessment indicates that it is more likely than not that the fair value of a reporting unit is less than its carrying amount, then the Company must perform the two-step goodwill impairment test for the reporting unit.
In applying the two-step process, the first step used to identify potential impairment involves comparing the reporting unit’s estimated fair value to its carrying value, including goodwill. For this purpose, the Company uses a discounted cash flow approach to develop the estimated fair value of each reporting unit. Management judgment is required in developing the assumptions for the discounted cash flow model. These assumptions include revenue growth rates, profit margins, future capital expenditures, working capital needs, discount rates and perpetual growth rates. If the estimated fair value of a reporting unit exceeds its carrying value, goodwill is not impaired. If the carrying value exceeds the estimated fair value, there is an indication of potential impairment and the second step is performed to measure the amount of impairment, if any.
The second step of the process involves the calculation of an implied fair value of goodwill for each reporting unit for which step one indicated potential impairment. The implied fair value of goodwill is determined in a manner similar to how goodwill is calculated in a business combination. That is, the estimated fair value of the reporting unit, as calculated in step one, is allocated to the individual assets and liabilities as if the reporting unit was being acquired in a business combination. If the implied fair value of goodwill exceeds the carrying value of goodwill assigned to the reporting unit, there is no impairment. If the carrying value of goodwill assigned to a reporting unit exceeds the implied fair value of the goodwill, an impairment charge
32
is recorded to write down the carrying value. An impairment loss cannot exceed the carrying value of goodwill assigned to a reporting unit and the loss establishes a new basis in the goodwill. Subsequent reversal of an impairment loss is not permitted.
The discount rate, sales growth and profitability assumptions, and perpetual growth rate are the material assumptions utilized in the discounted cash flow model used to estimate the fair value of each reporting unit. The Company’s discount rate reflects a weighted average cost of capital (“WACC”) for a peer group of companies in the chemical manufacturing industry with an equity size premium added, as applicable, for each reporting unit. The WACC is calculated based on observable market data. Some of this data (such as the risk-free or Treasury rate and the pre-tax cost of debt) are based on market data at a point in time. Other data (such as beta and the equity risk premium) are based upon market data over time.
The discounted cash flow analysis requires estimates, assumptions and judgments about future events. The Company’s analysis uses internally generated budgets and long-range forecasts. The Company’s discounted cash flow analysis uses the assumptions in these budgets and forecasts about sales trends, inflation, working capital needs and forecasted capital expenditures along with an estimate of the reporting unit’s terminal value (the value of the reporting unit at the end of the forecast period) to determine the fair value of each reporting unit. The Company’s assumptions about working capital needs and capital expenditures are based on historical experience. The perpetual growth rate assumed in the discounted cash flow model is consistent with the long-term growth rate as measured by the U.S. Gross Domestic Product and the industry’s long-term rate of growth.
The Company believes the assumptions used in its discounted cash flow analysis are appropriate and result in reasonable estimates of the fair value of each reporting unit. However, the Company may not meet its sales growth and profitability targets, working capital needs and capital expenditures may be higher than forecast, changes in credit markets may result in changes to the Company’s discount rate and general business conditions may result in changes to the Company’s terminal value assumptions for its reporting units.
In performing the October 31, 2015 annual goodwill impairment test, the Company elected to bypass the qualitative assessment for all of its reporting units as a periodic refresh of its reporting units’ fair values from the application of the qualitative Step 0 assessment in prior years. The determination to proceed to the first step of the two-step goodwill impairment test at October 31, 2015 was based on an evaluation of relevant events and circumstances, including the length of time since the Company’s most recent calculation of the fair value of its reporting units. The assessment for all reporting units indicated that the fair values of all of its reporting units substantially exceeded their respective carrying amounts. See Note 8, “Goodwill and Other Intangible Assets,” to the Company’s consolidated financial statements included in Item 8, “Financial Statements and Supplementary Data,” for details of the annual goodwill impairment test.
Business Insurance Reserves
The Company has established insurance programs to cover workers’ compensation, business automobile and general liability claims. During fiscal years 2016, 2015 and 2014, these programs had deductible limits of $1 million per occurrence. For fiscal 2017, the deductible limits are expected to remain at $1 million per occurrence. The Company reserves for its deductible based on individual claim evaluations, establishing loss estimates for known claims based on the current facts and circumstances. These known claims are then “developed” through actuarial computations to reflect the expected ultimate loss for the known claims as well as incurred but not reported claims. Actuarial computations use the Company’s specific loss history, payment patterns and insurance coverage, plus industry trends and other factors to estimate the required reserve for all open claims by policy year and loss type. Reserves for the Company’s deductible are evaluated monthly. Semi-annually, the Company obtains a third-party actuarial report to validate that the computations and assumptions used are consistent with actuarial standards. Certain assumptions used in the actuarial computations are susceptible to change. Loss development factors are influenced by items such as medical inflation, changes in workers’ compensation laws and changes in the Company’s loss payment patterns, all of which can have a significant influence on the estimated ultimate loss related to the Company’s deductible. Accordingly, the ultimate resolution of open claims may be for amounts that differ from the reserve balances. The Company’s operations are spread across a significant number of locations, which helps to mitigate the potential impact of any given event that could give rise to an insurance-related loss. Over the last three years, business insurance expense has been approximately 0.5% of net sales.
Income Taxes
At March 31, 2016, the Company had deferred tax assets of $149 million (net of an immaterial valuation allowance), deferred tax liabilities of $973 million and $21 million of unrecognized income tax benefits associated with uncertain tax positions (see Note 6 to the consolidated financial statements included in Item 8, “Financial Statements and Supplementary Data”).
The Company estimates income taxes based on diverse legislative and regulatory structures that exist in various jurisdictions where the Company conducts business. Deferred tax assets and liabilities are recognized for the future tax consequences attributable to differences between the financial statement carrying amounts of assets and liabilities and their respective tax bases, and operating loss carryforwards. The Company evaluates deferred tax assets each period to ensure that
33
estimated future taxable income will be sufficient in character (e.g., capital gain versus ordinary income treatment), amount and timing to result in their recovery. Valuation allowances are recorded to reduce deferred tax assets when it is more likely than not that a tax benefit will not be realized. Considerable judgments are required in establishing deferred tax valuation allowances and in assessing exposures related to tax matters. The ultimate realization of deferred tax assets is dependent upon the generation of future taxable income during the periods in which those temporary differences and carryforward deferred tax assets become deductible or utilized. Management considers the reversal of taxable temporary differences and projected future taxable income in making this assessment. As events and circumstances change, related reserves and valuation allowances are adjusted to income at that time. Based upon the level of historical taxable income and projections for future taxable income over the periods during which the deferred tax assets reverse, at March 31, 2016, management believes it is more likely than not that the Company will realize the benefits of these deductible differences, net of the existing valuation allowances.
Unrecognized income tax benefits represent income tax positions taken on income tax returns that have not been recognized in the consolidated financial statements. The Company recognizes the benefit of an income tax position only if it is more likely than not (greater than 50%) that the tax position will be sustained upon tax examination, based solely on the technical merits of the tax position. Otherwise, no benefit is recognized. The tax benefits recognized are measured based on the largest benefit that has a greater than 50% likelihood of being realized upon ultimate settlement. Additionally, the Company accrues interest and related penalties, if applicable, on all tax exposures for which reserves have been established consistent with jurisdictional tax laws. Interest and penalties are classified as income tax expense in the consolidated statements of earnings. The Company does not anticipate significant changes in the amount of unrecognized income tax benefits over the next year.
Contractual Obligations
The following table presents the Company’s contractual obligations as of March 31, 2016:
(In thousands) | Payments Due or Commitment Expiration by Period | ||||||||||||||||||
Contractual Obligations (b) | Total | Less Than 1 Year (a) | 1 to 3 Years (a) | 4 to 5 Years (a) | More than 5 Years (a) | ||||||||||||||
Long-term debt (1) | $ | 2,206,645 | $ | 250,118 | $ | 655,179 | $ | 751,348 | $ | 550,000 | |||||||||
Estimated interest payments on long-term debt (2) | 244,327 | 49,202 | 88,020 | 59,280 | 47,825 | ||||||||||||||
Non-compete agreements (3) | 14,571 | 6,794 | 6,752 | 625 | 400 | ||||||||||||||
Letters of credit (4) | 50,847 | 50,847 | — | — | — | ||||||||||||||
Operating leases (5) | 412,502 | 112,059 | 166,941 | 88,851 | 44,651 | ||||||||||||||
Purchase obligations: | |||||||||||||||||||
Liquid bulk gas supply agreements (6) | 739,033 | 191,871 | 288,707 | 124,918 | 133,537 | ||||||||||||||
Liquid carbon dioxide supply agreements (7) | 121,772 | 20,341 | 24,146 | 12,753 | 64,532 | ||||||||||||||
Construction commitments (8) | 48,112 | 45,900 | 2,212 | — | — | ||||||||||||||
Other purchase commitments (9) | 2,676 | 2,676 | — | — | — | ||||||||||||||
Total Contractual Obligations | $ | 3,840,485 | $ | 729,808 | $ | 1,231,957 | $ | 1,037,775 | $ | 840,945 | |||||||||
____________________
(a) | The “Less Than 1 Year” column relates to obligations due in the fiscal year ending March 31, 2017. The “1 to 3 Years” column relates to obligations due in fiscal years ending March 31, 2018 and 2019. The “4 to 5 Years” column relates to obligations due in fiscal years ending March 31, 2020 and 2021. The “More than 5 Years” column relates to obligations due beyond March 31, 2021. |
(b) | At March 31, 2016, the Company had $24 million related to unrecognized income tax benefits, including accrued interest and penalties. These liabilities are not included in the above table, as the Company cannot make reasonable estimates with respect to the timing of their ultimate resolution. See Note 6 to the Company’s consolidated financial statements under Item 8, “Financial Statements and Supplementary Data,” for further information on the Company’s unrecognized income tax benefits. |
(1) | Aggregate long-term debt instruments are reflected in the consolidated balance sheet as of March 31, 2016. The Senior Notes are presented at their maturity values rather than their carrying values, which are net of aggregate discounts of $1.7 million at March 31, 2016. Long-term debt includes capital lease obligations, which were not material and therefore, did not warrant separate disclosure. |
(2) | The future interest payments on the Company’s long-term debt obligations were estimated based on the current outstanding principal reduced by scheduled maturities in each period presented and interest rates as of March 31, 2016. |
34
The actual interest payments may differ materially from those presented above based on actual amounts of long-term debt outstanding and actual interest rates in future periods.
(3) | Non-compete agreements are obligations of the Company to make scheduled future payments, generally to former owners of acquired businesses, contingent upon their compliance with the covenants of the non-compete agreements. |
(4) | Letters of credit are guarantees of payment to third parties. The Company’s letters of credit principally back obligations associated with the Company’s deductible on workers’ compensation, business automobile and general liability claims. The letters of credit are supported by the Company’s Credit Facility. |
(5) | The Company’s operating leases at March 31, 2016 include approximately $330 million in fleet vehicles under long-term operating leases. The Company guarantees a residual value of $32 million related to its leased vehicles. |
(6) | In addition to the gas volumes produced internally, the Company purchases industrial, medical and specialty gases pursuant to requirements under contracts from national and regional producers of industrial gases. The Company is a party to take-or-pay supply agreements under which Air Products will supply the Company with bulk nitrogen, oxygen, argon, hydrogen and helium. The Company is committed to purchase a minimum of approximately $61 million in bulk gases within the next fiscal year under the Air Products supply agreements. The agreements expire at various dates through 2020. The Company also has take-or-pay supply agreements with Linde to purchase oxygen, nitrogen, argon and helium. The agreements expire at various dates through 2025 and represent approximately $95 million in minimum bulk gas purchases for the next fiscal year. Additionally, the Company has take-or-pay supply agreements to purchase oxygen, nitrogen, argon, helium and ammonia from other major producers. Minimum purchases under these contracts for the next fiscal year are approximately $36 million and they expire at various dates through 2026. The level of annual purchase commitments under the Company’s supply agreements beyond the next fiscal year vary based on the expiration of agreements at different dates in the future, among other factors. |
The Company’s annual purchase commitments under all of its supply agreements reflect estimates based on fiscal 2016 purchases. The Company’s supply agreements contain periodic pricing adjustments, most of which are based on certain economic indices and market analyses. The Company believes the minimum product purchases under the agreements are within the Company’s normal product purchases. Actual purchases in future periods under the supply agreements could differ materially from those presented due to fluctuations in demand requirements related to varying sales levels as well as changes in economic conditions.
(7) | The Company is a party to take-or-pay supply agreements for the purchase of liquid carbon dioxide with twelve suppliers that expire at various dates through 2044 and represent minimum purchases of approximately $20 million for the next fiscal year. The purchase commitments for future periods contained in the table above reflect estimates based on fiscal 2016 purchases. The Company believes the minimum product purchases under the agreements are within the Company’s normal product purchases. Actual purchases in future periods under the liquid carbon dioxide supply agreements could differ materially from those presented in the table due to fluctuations in demand requirements related to varying sales levels as well as changes in economic conditions. Certain of the liquid carbon dioxide supply agreements contain market pricing subject to certain economic indices. |
(8) | Construction commitments represent long-term agreements with two customers to construct on-site air separation units. The units are located in Calvert City, KY and Tuscaloosa, AL. |
(9) | Other purchase commitments represent agreements to purchase property, plant and equipment. |
Accounting Pronouncements Issued But Not Yet Adopted
See Note 3 to the Company’s consolidated financial statements under Item 8, “Financial Statements and Supplementary Data,” for information concerning new accounting guidance and the potential impact on the Company’s financial statements.
Forward-looking Statements
This report contains statements that are forward looking within the meaning of the Private Securities Litigation Reform Act of 1995. These statements include, but are not limited to, the Company’s expectations regarding the completion of the Merger with Air Liquide and statements regarding the future operations of Airgas' business; the Company’s belief that it will not be necessary to repatriate cash held outside of the U.S. by its foreign subsidiaries; the Company’s belief that it has sufficient liquidity from cash from operations and under its revolving credit facilities to meet its working capital, capital expenditure and other financial commitments; the Company’s belief that it can obtain financing on reasonable terms; the Company’s future dividend declarations; the Company’s estimate that for every 25 basis point increase in the Company’s average variable borrowing rates, the Company estimates that its annual interest expense would increase by approximately $2.0 million; the estimate of future interest payments on the Company’s long-term debt obligations; and the Company’s exposure to foreign currency exchange fluctuations.
35
Forward-looking statements also include any statement that is not based on historical fact, including statements containing the words “believes,” “may,” “plans,” “will,” “could,” “should,” “estimates,” “continues,” “anticipates,” “intends,” “expects,” and similar expressions. The Company intends that such forward-looking statements be subject to the safe harbors created thereby. All forward-looking statements are based on current expectations regarding important risk factors and should not be regarded as a representation by the Company or any other person that the results expressed therein will be achieved. Airgas assumes no obligation to revise or update any forward-looking statements for any reason, except as required by law. Important factors that could cause actual results to differ materially from those contained in any forward-looking statement include: the occurrence of any event, change or other circumstance that could give rise to the termination of the Merger Agreement with Air Liquide, including a termination of the Merger Agreement under circumstances that could require Airgas to pay a termination fee; the failure to obtain required regulatory clearances, or the failure to satisfy any of the other closing conditions to the Merger, and any delay in connection with the foregoing; risks related to disruption of management’s attention from the Company’s ongoing business operations due to the pendency of the Merger; the effect of the pendency of the Merger on the ability of the Company to retain and hire key personnel, maintain relationships with its customers and suppliers, and maintain its operating results and business generally; the outcome of any legal proceedings that have been or may be instituted against the Company and others relating to the Merger Agreement; the possible adverse effect on Airgas’ business and the price of Airgas common stock if the Merger is not completed in a timely manner or at all; the parties’ ability to complete the transactions contemplated by the Merger Agreement in a timely manner or at all; limitations placed on Airgas’ ability to operate its business under the Merger Agreement; the impact from the decline in oil prices on our customers; adverse changes in customer buying patterns or weakening in the operating and financial performance of the Company’s customers, any of which could negatively impact the Company’s sales and ability to collect its accounts receivable; postponement of projects due to economic conditions and uncertainty in the energy sector; the impact of the strong dollar on the Company’s manufacturer customers that export; customer acceptance of price increases; increases in energy costs and other operating expenses at a faster rate than the Company’s ability to increase prices; changes in customer demand resulting in the Company’s inability to meet minimum product purchase requirements under long-term supply agreements and the inability to negotiate alternative supply arrangements; supply cost pressures, including cost pressure related to the Company’s helium diversification and supply initiatives; shortages and/or disruptions in the supply chain of certain gases; the ability of the Company to pass on to its customers its increased costs of selling helium; EPA rulings and the impact in the marketplace of U.S. compliance with the Montreal Protocol as related to the production and import of Refrigerant-22 (also known as HCFC-22 or R-22); the Company’s ability to successfully build, complete in a timely manner and operate its new facilities; higher than expected expenses associated with the expansion of the Company’s telesales business, e-Business platform, the adjustment of its regional management structures, its strategic pricing initiatives and other strategic growth initiatives; increased industry competition; the Company’s ability to successfully identify, consummate, and integrate acquisitions; the Company’s ability to achieve anticipated acquisition synergies; operating costs associated with acquired businesses; the Company’s continued ability to access credit markets on satisfactory terms; significant fluctuations in interest rates; the impact of changes in credit market conditions on the Company’s customers; the Company’s ability to effectively leverage its SAP system to improve the operating and financial performance of its business; changes in tax and fiscal policies and laws, including the increase in interest rates; increased expenditures relating to compliance with environmental and other regulatory initiatives; the impact of new environmental, healthcare, tax, accounting, and other regulations; the overall U.S. industrial economy; catastrophic events and/or severe weather conditions; and political and economic uncertainties associated with current world events.
36
ITEM 7A. | QUANTITATIVE AND QUALITATIVE DISCLOSURES ABOUT MARKET RISK. |
Interest Rate Risk
The Company manages its exposure to changes in market interest rates through the occasional use of interest rate derivative instruments, when deemed appropriate. The interest rate exposure arises primarily from the interest payment terms of the Company’s borrowing agreements. Interest rate derivatives are used to adjust the interest rate risk exposures that are inherent in its portfolio of funding sources. The Company has not established, and will not establish, any interest rate risk positions for purposes other than managing the risk associated with its portfolio of funding sources or anticipated funding sources. The counterparties to interest rate derivatives are major financial institutions. The Company has established counterparty credit guidelines and only enters into transactions with financial institutions with long-term credit ratings of at least a single ‘A’ rating by one of the major credit rating agencies. In addition, the Company monitors its position and the credit ratings of its counterparties, thereby minimizing the risk of non-performance by the counterparties. The Company had no interest rate derivative instruments outstanding at March 31, 2016.
The following table summarizes the Company’s market risks associated with debt obligations at March 31, 2016. The table presents cash flows related to payments of principal and interest by fiscal year of maturity. Fair values were computed using market quotes, if available, or based on discounted cash flows using market interest rates as of the end of the period.
(In millions) | 3/31/2017 | 3/31/2018 | 3/31/2019 | 3/31/2020 | 3/31/2021 | Thereafter | Total | Fair Value | |||||||||||||||||||||||
Fixed Rate Debt: | |||||||||||||||||||||||||||||||
Senior notes due 6/15/2016 | $ | 250.0 | $ | — | $ | — | $ | — | $ | — | $ | — | $ | 250.0 | $ | 250.5 | |||||||||||||||
Interest expense | 1.5 | — | — | — | — | — | 1.5 | ||||||||||||||||||||||||
Interest rate | 2.95 | % | — | — | — | — | — | ||||||||||||||||||||||||
Senior notes due 2/15/2018 | $ | — | $ | 325.0 | $ | — | $ | — | $ | — | $ | — | $ | 325.0 | $ | 324.9 | |||||||||||||||
Interest expense | 5.4 | 4.7 | — | — | — | — | 10.1 | ||||||||||||||||||||||||
Interest rate | 1.65 | % | 1.65 | % | — | — | — | — | |||||||||||||||||||||||
Senior notes due 2/15/2020 | $ | — | $ | — | $ | — | $ | 275.0 | $ | — | $ | — | $ | 275.0 | $ | 276.9 | |||||||||||||||
Interest expense | 6.5 | 6.5 | 6.5 | 5.7 | — | — | 25.2 | ||||||||||||||||||||||||
Interest rate | 2.38 | % | 2.38 | % | 2.38 | % | 2.38 | % | — | — | |||||||||||||||||||||
Senior notes due 8/1/2020 | $ | — | $ | — | $ | — | $ | — | $ | 400.0 | $ | — | $ | 400.0 | $ | 410.4 | |||||||||||||||
Interest expense | 12.2 | 12.2 | 12.2 | 12.2 | 4.1 | — | 52.9 | ||||||||||||||||||||||||
Interest rate | 3.05 | % | 3.05 | % | 3.05 | % | 3.05 | % | 3.05 | % | — | ||||||||||||||||||||
Senior notes due 11/15/2022 | $ | — | $ | — | $ | — | $ | — | $ | — | $ | 250.0 | $ | 250.0 | $ | 250.6 | |||||||||||||||
Interest expense | 7.3 | 7.3 | 7.3 | 7.3 | 7.3 | 11.8 | 48.3 | ||||||||||||||||||||||||
Interest rate | 2.90 | % | 2.90 | % | 2.90 | % | 2.90 | % | 2.90 | % | 2.90 | % | |||||||||||||||||||
Senior notes due 7/15/2024 | $ | — | $ | — | $ | — | $ | — | $ | — | $ | 300.0 | $ | 300.0 | $ | 308.1 | |||||||||||||||
Interest expense | 11.0 | 11.0 | 11.0 | 11.0 | 11.0 | 36.0 | 91.0 | ||||||||||||||||||||||||
Interest rate | 3.65 | % | 3.65 | % | 3.65 | % | 3.65 | % | 3.65 | % | 3.65 | % | |||||||||||||||||||
37
(In millions) | 3/31/2017 | 3/31/2018 | 3/31/2019 | 3/31/2020 | 3/31/2021 | Thereafter | Total | Fair Value | |||||||||||||||||||||||
Variable Rate Debt: | |||||||||||||||||||||||||||||||
Commercial paper | $ | 383.3 | $ | — | $ | — | $ | — | $ | — | $ | — | $ | 383.3 | $ | 383.3 | |||||||||||||||
Interest expense | 0.3 | — | — | — | — | — | 0.3 | ||||||||||||||||||||||||
Interest rate | 0.79 | % | — | — | — | — | — | ||||||||||||||||||||||||
Revolving credit borrowings - Multi-currency | $ | — | $ | — | $ | — | $ | 70.3 | $ | — | $ | — | $ | 70.3 | $ | 70.3 | |||||||||||||||
Interest expense | 1.4 | 1.4 | 1.4 | 0.9 | — | — | 5.1 | ||||||||||||||||||||||||
Interest rate (a) | 1.90 | % | 1.90 | % | 1.90 | % | 1.90 | % | — | — | |||||||||||||||||||||
Revolving credit borrowings - France | $ | — | $ | — | $ | — | $ | 6.1 | $ | — | $ | — | $ | 6.1 | $ | 6.1 | |||||||||||||||
Interest expense | 0.1 | 0.1 | 0.1 | — | — | — | 0.3 | ||||||||||||||||||||||||
Interest rate (b) | 1.25 | % | 1.25 | % | 1.25 | % | 1.25 | % | — | — | |||||||||||||||||||||
Trade receivables securitization | $ | — | $ | — | $ | 330.0 | $ | — | $ | — | $ | — | $ | 330.0 | $ | 330.0 | |||||||||||||||
Interest expense | 3.9 | 3.9 | 2.7 | — | — | — | 10.5 | ||||||||||||||||||||||||
Interest rate | 1.18 | % | 1.18 | % | 1.18 | % | — | — | — | ||||||||||||||||||||||
____________________
(a) | The interest rate on the revolving credit facilities is the weighted average of the variable interest rates on the multi-currency revolving credit line. The variable interest rates on the multi-currency revolving credit line are based on a spread over the Euro currency rate applicable to each foreign currency borrowing under the multi-currency credit line. |
(b) | The variable interest rates on the French revolving credit borrowings are based on a spread over the Euro currency rate. |
Limitations of the Tabular Presentation
As the table incorporates only those interest rate risk exposures that exist as of March 31, 2016, it does not consider those exposures or positions that could arise after that date. In addition, actual cash flows of financial instruments in future periods may differ materially from prospective cash flows presented in the table due to future fluctuations in variable interest rates, debt levels and the Company’s credit rating.
Foreign Currency Rate Risk
Canadian subsidiaries and the European operations of the Company are funded in part with local currency debt. The Company does not otherwise hedge its exposure to translation gains and losses relating to foreign currency net asset exposures. The Company considers its exposure to foreign currency exchange fluctuations to be immaterial to its financial position and results of operations.
ITEM 8. | FINANCIAL STATEMENTS AND SUPPLEMENTARY DATA. |
The consolidated financial statements, supplementary information and financial statement schedule of the Company are set forth at pages F-1 to F-42 of this report.
ITEM 9. | CHANGES IN AND DISAGREEMENTS WITH ACCOUNTANTS ON ACCOUNTING AND FINANCIAL DISCLOSURE. |
None.
ITEM 9A. | CONTROLS AND PROCEDURES. |
(a) Evaluation of Disclosure Controls and Procedures
The Company carried out an evaluation, under the supervision and with the participation of the Company’s Executive Chairman of the Board, Chief Executive Officer and Chief Financial Officer, of the effectiveness of the Company’s “disclosure controls and procedures” (as defined in the Securities Exchange Act of 1934 Rules 13a-15(e) and 15d-15(e)) as of March 31, 2016. Based on that evaluation, the Company’s Executive Chairman of the Board, Chief Executive Officer and Chief Financial Officer have concluded that, as of such date, the Company’s disclosure controls and procedures were effective to provide reasonable assurance that the information required to be disclosed in the Company’s SEC reports is (i) recorded, processed, summarized and reported within the time periods specified in the SEC rules and forms, and (ii) accumulated and communicated
38
to the Company’s management, including the Company’s Executive Chairman of the Board, Chief Executive Officer and Chief Financial Officer, as appropriate to allow timely decisions regarding disclosure.
(b) Management’s Report on Internal Control over Financial Reporting
The Company’s management is responsible for establishing and maintaining an adequate system of internal control over financial reporting, as defined in Exchange Act Rule 13a-15(f). The Company’s management conducted an assessment of the Company’s internal control over financial reporting based on the framework established by the Committee of Sponsoring Organizations of the Treadway Commission in Internal Control - Integrated Framework (2013). Based on this assessment, management concluded that, as of March 31, 2016, the Company’s internal control over financial reporting was effective. See Management’s Report on Internal Control Over Financial Reporting preceding the consolidated financial statements under Item 8, “Financial Statements and Supplementary Data.”
KPMG LLP, an independent registered public accounting firm, issued an audit report on the effectiveness of the Company’s internal control over financial reporting as of March 31, 2016, included under Item 8, “Financial Statements and Supplementary Data.”
(c) Changes in Internal Control
There were no changes in the Company’s internal control over financial reporting that occurred during the quarter ended March 31, 2016 that have materially affected, or are reasonably likely to materially affect, the Company’s internal control over financial reporting.
ITEM 9B. | OTHER INFORMATION. |
None.
PART III
ITEM 10. | DIRECTORS, EXECUTIVE OFFICERS AND CORPORATE GOVERNANCE. |
Item 401 Information
The biographical information for the Company’s Board of Directors including the names, ages, terms of office, directorships in other companies and business experience is set forth below. The biographical information relating to the Company’s executive officers set forth in Item 1 of Part I of this Form 10-K report is incorporated herein by reference.
Name | Age | |
Peter McCausland | 66 | Mr. McCausland has been an Airgas director from June 1986 until September 15, 2010 and from September 23, 2010 to the present and has served as Executive Chairman since August 2012. Prior to that, he served as Chairman of the Board from 1987 to September 15, 2010 and from August 29, 2011 to August 2012. Mr. McCausland also served as the Chief Executive Officer of Airgas from May 1987 to August 2012 and President of Airgas from June 1986 to August 1988, from April 1993 to November 1995, from April 1997 to January 1999 and from January 2005 to August 2012. Mr. McCausland serves as a director of the Independence Seaport Museum. Mr. McCausland also serves on the Board of Visitors of the Boston University School of Law and the College of Arts and Sciences of the University of South Carolina. Mr. McCausland brings to the Board leadership, and extensive business, operating, acquisition, finance, business strategy development and policy experience, and tremendous knowledge of our company and the industrial gas industry. In addition, Mr. McCausland brings his strategic vision for Airgas to the Board. His service as a director and as the CEO of Airgas has contributed to the effectiveness of the Board and creates a critical link between management and the Board, enabling the Board to perform its oversight function with the benefits of management’s perspectives on the business. Furthermore, Mr. McCausland provides Airgas with effective leadership. |
39
John C. van Roden, Jr. | 67 | Mr. van Roden served as Executive Vice President and Chief Financial Officer of P.H. Glatfelter Company, a diversified global manufacturer of specialty papers and engineered products, from 2003 to 2006. Prior to that, he served as Senior Vice President and Chief Financial Officer for Conectiv from 1998 to 2003, and as the Senior Vice President and Chief Financial Officer of Lukens Inc. from 1982 to 1998. Mr. van Roden also serves on the boards of H.B. Fuller Company and Horsehead Holding Corp. Mr. van Roden has served as an Airgas director since October 2006. Mr. van Roden brings to the Board over 20 years of experience in strategic and financial management from his senior leadership positions at P.H. Glatfelter, Conectiv and Lukens, where he served in significant financial leadership positions. From his extensive experience as a financial executive, Mr. van Roden provides leadership in the financial area and serves as the Chairman of our Audit Committee and as an audit committee financial expert. |
John P. Clancey | 71 | John P. Clancey served as Chairman of Maersk Inc. and Maersk Line Limited, a division of the A.P. Moller-Maersk Group, from 1999 to January 2010. Maersk is one of the world’s largest shipping companies. Since January 2010, Mr. Clancey has been a Principal and founder of Hospitality Logistics, International, a furniture, fixtures and equipment logistics services provider serving customers in the hotel industry. Since July 2010, Mr. Clancey has been Chairman and a member of the Board of Directors of Livingston International Inc., a major international customs house and freight forwarding company, and an advisor to Sterling Partners, a private equity firm and since January 1, 2011, he has served on the Infrastructure Advisory Committee of Brookfield Asset Management, a global asset management company. Mr. Clancey has been an Airgas director since 2010. Mr. Clancey brings to our Board more than 22 years of experience as both chief executive officer and chairman of international businesses, and 16 years of experience serving on the boards of large public companies in a range of industries. Mr. Clancey’s board experience includes his service as a member of the board of directors of UST Inc. from 1997 to 2009, and as a member of the board of directors of Foster Wheeler AG from 2000 to 2005. In addition, Mr. Clancey served as a member of the board of directors of AT&T Capital from 1993 to 1998, when the company was sold to Nomura Securities. |
James W. Hovey | 70 | Mr. Hovey served as President of The Fox Companies, a diversified real estate development firm, from 1972 to December 2013, where he was responsible for the development of numerous housing units and office buildings, and of a sports arena. Mr. Hovey serves as a member of the Board of Trustees of Eisenhower Fellowships, Inc. and also serves on the board of TSI Group. Mr. Hovey has been an Airgas director since 1999. Mr. Hovey brings senior-level management experience to the Board through his 40-year career as an executive of a real estate development firm. Mr. Hovey’s experience enables him to provide insight and guidance on real estate and finance matters facing the company. Mr. Hovey also brings to the Board his leadership skills from his extensive non-profit experience. |
Richard C. Ill | 73 | Mr. Ill has been a director of the Triumph Group, Inc., a company that designs, manufactures, repairs and overhauls aircraft components and assemblies, since 1993 and served as the President and Chief Executive Officer from April 2015 until January 2016 and from 1993 until July 2012. He also served as Executive Chairman of Triumph from July 2012 until April 2015. Mr. Ill serves as a director of P.H. Glatfelter Company and Mohawk Industries and as a member of the Drexel University Board of Trustees. Mr. Ill has been an Airgas director since 2013 and previously served as an Airgas director from 2004 until 2010. Mr. Ill has over 45 years of public company experience in management, manufacturing and operations. From his tenure as CEO of Triumph Group, and from his service on other public company boards, he provides a strong operational, financial and strategic background and has valuable business leadership and management experience and insights into many aspects of our business and the current business climate. |
40
Ted B. Miller, Jr. | 64 | Mr. Miller has been the President of 4M Investments, LLC, an international private investment company, since 2001. He is also the founder, Chairman and majority shareholder of Visual Intelligence, a privately held imaging technologies company founded in 2001 and Executive Chairman of 4M HR Logistics, LLC. Mr. Miller has been an Airgas director since 2010. Mr. Miller brings to our Board extensive executive, financial and governance experience as a significant shareholder, executive officer and director of both start-up companies and large public companies. His extensive business and leadership experience includes his positions as the founder, Chairman and majority shareholder of Intercomp Technologies, LLC from 1994 until October 2013, when it was sold to Elbrus Capital; of M7 Aerospace, LP, a privately held aerospace service, manufacturing and technology company, from 2003 until 2010, when it was sold to Elbit Systems of America; and his positions, from 1996 to 2002, as the Chairman and Chief Executive Officer of Crown Castle International Corp., a publicly-held global wireless communications infrastructure company he founded in 1995. In addition, Mr. Miller served as a member of the board of directors of Affiliated Computer Services, Inc., a global business process outsourcing company employing over 70,000 employees, from November 2008 until the acquisition of the company by Xerox Corporation in February 2010. |
Michael L. Molinini | 65 | Mr. Molinini has been President and Chief Executive Officer of Airgas since August 2012. Prior to that time, Mr. Molinini served as Executive Vice President and Chief Operating Officer of Airgas from January 2005 until August 2012. Prior to that time, Mr. Molinini served as Senior Vice President — Hardgoods Operations from August 1999 to January 2005 and as Vice President — Airgas Direct Industrial from April 1997 to July 1999. Prior to joining Airgas, Mr. Molinini served as Vice President of Marketing for National Welders Supply Company, Inc. (“National Welders”) from 1991 to 1997. Mr. Molinini has been a director since May 1, 2012. Mr. Molinini brings to the Board his extensive knowledge of, and experience in, Airgas’ business and the industrial gas industry, in addition to the leadership capabilities he gained through the senior management positions he has held during his career. Mr. Molinini has more than 40 years of experience in management positions in the industrial gas industry. As Chief Executive Officer, his insight into the operations and management of Airgas is invaluable to the Board in carrying out its oversight functions. |
Paula A. Sneed | 68 | Ms. Sneed is the Chairman and CEO of Phelps Prescott Group, LLC, a strategy and management consulting firm. She served as Executive Vice President of Global Marketing Resources and Initiatives for Kraft Foods, Inc. from June 2005 until her retirement in December 2006. She was responsible for leading Kraft’s approximately 700-person Global Marketing Services organization (advertising, media, promotions, marketing research, packaging, digital and interactive marketing, CRM and other marketing disciplines) serving more than 100 major food brands. Ms. Sneed joined General Foods Corporation (which later merged with Kraft Foods, Inc.) in 1977, and served in various executive positions since 1986. She is a member of the National Board of Directors of Teach for America. Ms. Sneed is also a member of the board of directors of The Charles Schwab Corporation and TE Connectivity Ltd. Ms. Sneed has been an Airgas director since 1999. Ms. Sneed has a broad range of leadership experience in general management and functional management roles from her tenure at General Foods and Kraft Foods, where, among other things, she led several business divisions and company-wide functions. Ms. Sneed brings valuable marketing and global management skills and extensive leadership experience to the Board. She also provides our Board with useful insights on best governance practices from her service on other public company boards of directors and on audit, governance and compensation committees of profit and non-profit organizations. |
41
David M. Stout | 62 | Mr. Stout served as President, Pharmaceuticals, GlaxoSmithKline, with responsibility for global pharmaceutical operations, from January 2003 to February 2008. Prior to that, he served as President, U.S. Pharmaceuticals from 1999 to January 2003. He served as Senior Vice President and Director, Sales and Marketing-U.S., for SmithKline Beecham from October 1996 until 1998. Mr. Stout was President of Schering Laboratories, a division of Schering-Plough Corporation, from 1994 until 1996. He held various executive and sales and marketing positions with Schering-Plough from 1979, when he joined the company, until 1994. Mr. Stout is also a member of the board of directors of NanoBio Corporation, a privately-held company, Jabil Circuit, Inc. and Actelion Pharmaceuticals Ltd, a Swiss company. Mr. Stout has been an Airgas director since 1999. With over 20 years of senior management experience in the pharmaceutical industry, Mr. Stout brings to our Board valuable business, manufacturing, research and development, and global operations experience. In his roles, Mr. Stout gained valuable experience dealing with governments, distributors and suppliers and the complexities related to operating in a regulated industry. His service on boards of directors and committees of other public companies has given him valuable insight on best practices in the corporate governance and compensation areas. |
Lee M. Thomas | 72 | Mr. Thomas served as President and Chief Executive Officer of Rayonier, Inc. from March 2007 until July 2007, as Chairman, President and Chief Executive Officer from July 2007 to October 2010, as Chairman and Chief Executive Officer from October 2010 until January 2012, as Chairman of the company until May 2012, and as a director from March 2006 until May 2012. Previously, he served as President of Georgia-Pacific Corporation, beginning in September 2002, and as President and Chief Operating Officer, beginning in March 2003, until his retirement in December 2005. Mr. Thomas held these and other senior executive positions within Georgia-Pacific Corporation since 1993. Prior to that, he was Chairman and Chief Executive Officer of Law Companies Environmental Group Inc. and has held numerous federal and state government positions, including positions with the U.S. Environmental Protection Agency, the Federal Emergency Management Agency and the Office of the Governor of South Carolina. Mr. Thomas is a director of Regal Entertainment Group and DuPont Corporation. Mr. Thomas has served as an Airgas director since 1998. Mr. Thomas brings to our Board an extensive knowledge of the environmental regulatory process from his senior positions in industry and government. His tenure at Rayonier and Georgia-Pacific and as Administrator of the U.S. Environmental Protection Agency and Deputy Director of the Federal Emergency Management Agency provide valuable business, leadership and management experience, including expertise on governmental relations in environmental regulatory areas. |
Ellen C. Wolf | 62 | Ms. Wolf served as Senior Vice President and Chief Financial Officer of American Water Works Company, Inc., the largest investor-owned U.S. water and wastewater company, from 2006 until May 2013. Previously, she served as Senior Vice President and CFO of USEC, Inc. beginning in December 2003 and as Vice President and CFO of American Water from 1999 to 2003. Prior to that, Ms. Wolf held various positions with increasing responsibility in corporate accounting, finance and business development since beginning her career in 1979. She also serves on the board of Premier, Inc., InfraREIT, Inc., Connecticut Water Co. and one privately-held company and is a vice chairman of the board of the Philadelphia Zoo. Ms. Wolf has been an Airgas director since 2008. Ms. Wolf brings to the Board her strong financial, corporate accounting, business development and leadership experience through her corporate senior executive positions and her current and previous service on the audit committees and nominating and governance committee of other public companies and her current service on the audit and compensation committees of two public companies. Ms. Wolf’s financial expertise provides her with a deep understanding of our financial statements, corporate finance matters and accounting issues, and enables her to serve on our Audit Committee as an audit committee financial expert. |
Item 405 Information
Section 16(a) of the Securities Exchange Act of 1934, as amended, requires our executive officers and directors, and persons who own more than 10% of a registered class of our equity securities, to file reports of ownership and changes in ownership of the securities with the SEC and the NYSE. Such persons are also required to furnish us with copies of all Section 16(a) forms they file.
Based solely on our review of the copies of such reports furnished to us, or written representations from certain reporting persons that no other reports were required, we believe that all of our officers and directors complied with all filing requirements applicable to them for the fiscal year ended March 31, 2016.
42
Item 406 Information
Airgas’ Code of Ethics and Business Conduct ensures that our business is conducted in a consistently legal and ethical manner. Our General Counsel oversees compliance with the Code of Ethics and Business Conduct. Airgas’ Code of Ethics and Business Conduct is available on our website at www.airgas.com and is available in print to any stockholder who requests it from our Secretary. All of our employees, including our Executive Chairman, Chief Executive Officer, Chief Financial Officer and Controller, are required to comply with the Code of Ethics and Business Conduct. The Code of Ethics and Business Conduct covers all areas of professional conduct, including compliance with laws, conflicts of interest, confidentiality, corporate opportunities, use of company assets and reporting illegal or unethical behavior. The Code of Ethics and Business Conduct describes our procedures to receive, retain and address complaints regarding accounting, internal controls and auditing matters, and other illegal or unethical behavior.
Item 407(c)(3) Information
There are no material changes to the procedure followed to nominate persons to the Company’s Board of Directors.
Items 407(d)(4) and 407(d)(5) Information
The Company’s separately designated Audit Committee of the Board of Directors was established in accordance with Section 3(a)(58)(A) of the Securities Exchange Act of 1934, as amended (the “Exchange Act”). The members of the Audit Committee are John P. Clancey, James W. Hovey, Paula A. Sneed, John C. van Roden, Jr. and Ellen C. Wolf. Each member of the Audit Committee is independent from Airgas and its management. In addition, the Board of Directors has determined that Mr. van Roden and Ms. Wolf are each an “audit committee financial expert” as defined in Item 407(d)(5)(ii) and (iii) of Regulation S-K under the Exchange Act.
ITEM 11. | EXECUTIVE COMPENSATION. |
COMPENSATION OF DIRECTORS
Only directors who are not employees of Airgas receive compensation for their services as directors. Our compensation package for non-employee directors for the 2016 fiscal year was composed of cash, which consisted of an annual retainer of $53,333, plus a fee of $1,500 for each in-person Board, committee or any other meeting on behalf of the Company attended during the 2016 fiscal year, $1,000 for each Board, or committee telephonic meeting and stock option grants under the Second Amended and Restated 2006 Equity Incentive Plan, referred to in this report as the 2006 Equity Plan. The cash component of the directors’ compensation is set by the Board following review and recommendation by the Governance and Compensation Committee. We also reimburse our non-employee directors for their out-of-pocket expenses incurred in connection with attendance at Board, committee and stockholder meetings, and other company business. Non-employee directors are eligible to participate in the 2006 Equity Plan and the Airgas, Inc. Deferred Compensation Plan II, referred to in this report as the Deferred Compensation Plan II, and some of our directors have participated in the Airgas, Inc. Deferred Compensation Plan I, referred to in this report as the Deferred Compensation Plan I, and more fully described under the heading “Retirement and Other Plans and Programs” found later in this report.
In order to closely align the interests of directors with those of our stockholders, a substantial portion of the directors’ compensation is in the form of stock options. The number of shares under each option granted is determined annually by the Board following review and recommendation by the Governance and Compensation Committee. The exercise price of each option is equal to the closing price of our common stock on the date of grant and each option is exercisable immediately. Options granted to non-employee directors expire after eight years. On August 4, 2015, each non-employee Board member serving on the Board as of that date was granted options to acquire 6,300 shares of our common stock with an exercise price of $102.70 per share.
The Presiding Director receives an additional $5,000 annual retainer, the Chairman of the Audit Committee receives an additional $15,000 annual retainer, the Chairman of the Governance and Compensation Committee receives an additional $15,000 annual retainer and the Chairman of the Finance Committee receives an additional $5,000 annual retainer.
Each year, non-employee directors may elect to defer, under the Deferred Compensation Plan II, all or a portion of his or her director’s fees. The amount deferred is credited to an account that tracks valuation funds selected by the participant from a family of funds under the plan, one of which tracks Airgas common stock. Each participating director elects when the balance will be paid within the alternatives offered under the plan, and the unpaid account balance accrues interest based on earnings in the selected valuation funds. In addition, one of our current directors maintains a balance in the Deferred Compensation Plan I.
We believe that directors should be stockholders and should have a financial stake in the company. The Governance and Compensation Committee revised the ownership guidelines in August 2011. Under the revised guidelines, the non-employee directors are expected to maintain at least 25,000 shares of Airgas common stock (which may include up to 22,500 shares under options) or shares having a value equal to five times the director’s annual Board retainer (which may include 60% of the
in‑the‑money options). Compliance with these guidelines is expected by the director’s fifth anniversary on the Board. Each of the current non-employee directors satisfies these ownership requirements at the present time.
Director Compensation Table
The following table shows the compensation earned by each non-employee director in the 2016 fiscal year.
Director | Fees Earned or Paid in Cash ($)(1) | Option Awards ($)(2) | All Other Compensation ($) | Total ($) |
John P. Clancey | 69,333 | 120,860 | — | 190,193 |
James W. Hovey | 79,833 | 120,860 | — | 200,693 |
Richard C. Ill | 73,833 | 120,860 | — | 194,693 |
Ted B. Miller, Jr. | 71,333 | 120,860 | — | 192,193 |
Paula A. Sneed | 79,833 | 120,860 | — | 200,693 |
David M. Stout | 79,083 | 120,860 | — | 199,943 |
Lee M. Thomas | 80,083 | 120,860 | — | 200,943 |
John C. van Roden, Jr. | 91,833 | 120,860 | — | 212,693 |
Ellen C. Wolf | 73,833 | 120,860 | — | 194,693 |
____________________
(1) | Consists of the aggregate amount of all fees earned or paid in cash for services as a director, consisting of annual Board and committee chair retainers and Board and committee meeting fees earned by non-employee directors, as described above. During the 2016 fiscal year, Mr. Clancey chose to defer his cash compensation as a director under the Deferred Compensation Plan II. |
(2) | The amounts shown reflect the grant date fair value of stock options granted during the 2016 fiscal year, computed in accordance with FASB ASC Topic 718. These dollar amounts do not correspond to the actual value that may be realized by the non-employee directors. For information on the valuation assumptions made in the calculation of these amounts, refer to Note 14 to Airgas’ consolidated financial statements for the fiscal year ended March 31, 2016, included in this report. Each non-employee director on the Board at the time was granted an option under the 2006 Equity Plan to purchase 6,300 shares on August 4, 2015 with an exercise price of $102.70 per share. As of March 31, 2016, the following non-employee directors held options to purchase the following number of shares: |
a. | Mr. Clancey held 31,682 |
b. | Mr. Hovey held 45,182 |
c. | Mr. Ill held 15,800 |
d. | Mr. Miller held 31,682 |
e. | Ms. Sneed held 45,182 |
f. | Mr. Stout held 45,182 |
g. | Mr. Thomas held 38,682 |
h. | Mr. van Roden held 45,182 |
i. | Ms. Wolf held 20,400 |
43
COMPENSATION DISCUSSION AND ANALYSIS
Overview of Compensation Program
The Governance and Compensation Committee of our Board of Directors has responsibility for establishing and implementing our compensation philosophy, and for continually monitoring our adherence to that philosophy. The Committee reviews and approves compensation levels for all Airgas executive officers as well as all of our corporate compensation, retirement, perquisite and insured benefit programs, including programs applicable to our executive officers, which includes our named executive officers. With respect to our Executive Chairman and our Chief Executive Officer, the Committee annually evaluates their accomplishments and performance against established objectives and sets their compensation levels based upon such evaluation. The Committee may choose to award additional annual cash incentive compensation to our Executive Chairman and the CEO based upon the Committee’s evaluation of the Executive Chairman’s and the CEO’s performance. These functions are set forth in the Committee’s Charter, which appears on our website (www.airgas.com) and is reviewed annually by the Committee. The Committee seeks to ensure that the total compensation paid to our executives, a significant portion of which is related to performance, is fair, reasonable and competitive and consistent with our compensation philosophy. Generally, the types of compensation and benefits provided to our named executive officers are similar to those provided to other Airgas management associates.
The Committee reviews whether compensation policies and practices create incentives for risk-taking that could have a material adverse effect on Airgas. In January 2016, the Committee conducted an assessment of all the incentive compensation programs across Airgas to consider whether they encourage excessive risk-taking. The Committee determined that Airgas compensation practices provide reasonable assurance against, and do not encourage, excessive risk-taking due to:
• | the balance between short-term and long-term incentives; |
• | accounting standards and testing; |
• | the relatively low ratio of incentive pay to the associated financial achievement; |
• | separation of duties regarding authority over sales decisions; and |
• | incentive compensation limits. |
There have been no material changes in compensation plans since the January 2016 review, other than the transition to a calendar year bonus year as discussed later in this report.
The following individuals, included in the “Summary Compensation Table for the 2016 Fiscal Year” found later in this report, are referred to as our “named executive officers” throughout this report:
• | Andrew R. Cichocki, Senior Vice President; President-Airgas USA, LLC; |
• | Robert A. Dougherty, Senior Vice President and Chief Information Officer; |
• | Peter McCausland, Executive Chairman; |
• | Robert M. McLaughlin, Senior Vice President and Chief Financial Officer; |
• | Michael L. Molinini, President and Chief Executive Officer; and |
• | Robert H. Young, Jr., Senior Vice President and General Counsel. |
Compensation Philosophy and Objectives
Our goal is to maintain compensation and benefit plans that will allow us to attract and retain highly qualified employees while motivating and rewarding performance that will lead to sustained increases in the value of our stockholders’ investment in Airgas. We also seek to align the interests of our named executive officers with those of our stockholders by evaluating performance primarily on the basis of key financial measures. Given these goals, our compensation philosophy has been, and continues to be, to emphasize “pay for performance” programs designed to reward superior financial performance and long-term enhancement of stockholder value, while maintaining competitive base pay, retirement, healthcare and other fixed compensation programs. We set base salary, annual cash incentive opportunities and long-term equity incentive opportunities to reflect an individual executive’s level of responsibility and performance against established objectives, and we rely on our judgment and discretion after reviewing Airgas’ performance and evaluating the executive’s performance.
Role of the Committee and Executive Officers in Compensation Decisions
The Committee oversees the design, development and implementation of the compensation program for the Executive Chairman, the CEO and the other executives, including the named executive officers. The Committee evaluates the performance of the Executive Chairman and the CEO and determines the Executive Chairman’s and the CEO’s compensation in light of the goals and objectives of the compensation program. Mr. McCausland and Mr. Molinini, as appropriate, assess the performance of our other executives, including the other named executive officers, and the Committee approves their compensation considering recommendations from Mr. McCausland and Mr. Molinini. Neither the Committee nor management
44
sought advice from compensation consultants during the 2016 fiscal year. Management relied on a service from Equilar Inc., a compensation research firm, to provide peer executive compensation data from proxies. However, the Committee did not receive advice from Equilar in setting our executive compensation.
The Committee’s work is accomplished through a series of meetings, following a regular calendar schedule, to ensure that all major elements of compensation are addressed and compensation and benefit programs are properly designed, implemented and monitored. Occasionally, special meetings are called to address matters that require attention outside of the regular compensation cycle. Working with the Committee Chair, the Senior Vice President and General Counsel and the Senior Vice President-Human Resources, prepare an agenda and supporting materials for each meeting, which are provided to Committee members two-to-four days in advance of the meeting. The Senior Vice President and General Counsel and the Senior Vice President-Human Resources, along with Mr. McCausland and Mr. Molinini, generally attend Committee meetings by invitation, but are excused for executive sessions. As requested, Mr. McCausland, Mr. Molinini, the Senior Vice President and General Counsel and the Senior Vice President-Human Resources offer their opinions and recommendations to the Committee. The Committee may invite other members of management to attend meetings to discuss items within their specific areas of responsibility. The Senior Vice President-Human Resources periodically provides the Committee with peer and survey information concerning executive compensation, including for her own position. Otherwise, no executive plays a role in his or her own compensation determination, other than discussing individual performance objectives with the Committee, Mr. McCausland or Mr. Molinini, as appropriate.
Consideration of Stockholder Advisory Vote to Approve Executive Compensation
Our Board submitted a proposal for an advisory vote to approve our executive compensation program to our stockholders at our 2015 Annual Meeting of Stockholders. Due to the 97% vote in favor of our executive compensation program at our 2015 Annual Meeting of Stockholders, we believe that our stockholders view our executive compensation program as effective in achieving our objectives. Thus, after considering the outcome of the vote, we decided to continue our current compensation philosophy and programs, while continuously monitoring developments in executive compensation, especially among our peer companies. We have not made any specific changes to our executive compensation program as a result of our stockholder advisory vote last year.
Setting Executive Compensation
Elements of Executive Compensation
Consistent with our compensation philosophy, the Committee has structured our annual and long-term executive compensation programs to motivate executives to achieve the business goals set by our Board of Directors, and these programs reward the executives for achieving and exceeding those goals. The key elements of our executive compensation program are:
• | base salary; |
• | annual cash incentive awards; and |
• | long-term incentive compensation. |
These key elements are addressed separately below. In determining each component of compensation, the Committee takes into account all other elements of an executive’s compensation package.
Our compensation programs for executive officers are designed to reflect their success in attaining key objectives, both individually and as a management team. Depending on each executive’s plan, 85% to 100% of our target annual cash incentive payments are calculated based on Airgas’ performance with regard to certain key financial metrics versus budgeted levels. For certain executives, 15% of those target payments are calculated based on the executive’s attainment of strategic goals and on individual performance and contributions. There are two levels of approval for each award and the Committee has final approval for awards to executive officers. Our equity-based compensation program is intended to reward the management team’s success in delivering value to our stockholders. Specifically, stock option grants reward our executives for their contributions that result in increases in our stock price over time. In each case, we strive to ensure that our compensation program provides rewards based on meaningful measures of performance, and the Committee may make adjustments to the incentive programs annually in light of past experience, changes in strategic focus, regulatory requirements and other relevant factors.
Benchmarking Compensation Against Our Peers
Periodically, the Senior Vice President-Human Resources provides the Committee with data comparing our elements of compensation and levels of executive compensation against relevant companies in the chemicals and industrial distribution industries, including a comparison of compensation elements of individual executives where the positions are sufficiently similar to make comparison meaningful. Currently, the peer group for compensation comparisons is:
45
Air Products & Chemicals, Inc. | International Flavors & Fragrances Inc. |
Albemarle Corporation | MRC Global Inc. |
Anixter International, Inc. | MSC Industrial Direct Company, Inc. |
Ashland Inc. | PolyOne Corporation |
Axiall Corporation | Praxair Inc. |
Cabot Corporation | Rockwood Holdings, Inc. |
Celanese Corporation | RPM International, Inc. |
CF Industries Holdings, Inc. | The Scotts Miracle-Gro Company |
Cliffs Natural Resources Inc. | The Sherwin-Williams Company |
Clorox Company | Sigma-Aldrich Corporation |
Eastman Chemical Company | The Valspar Corporation |
Fastenal Company | Wesco International Inc. |
FMC Corporation | Grainger W Inc. |
Henry Schein Inc. | Westlake Chemical Corporation |
For executive positions that are not typically named executive officer positions in our peer companies, the peer group includes a broader group of chemicals industry and industrial distribution companies that participate in executive compensation surveys available to Airgas management.
The most recent benchmarking of executive compensation levels was performed by our then current Senior Vice President - Human Resources, in the beginning of the 2013 calendar year. The benchmarking compared compensation of our named executive officers to the median base salary, total cash compensation and total “direct” compensation of similar positions in the peer group companies. “Direct” compensation adds the Black-Scholes value of stock option grants to the total cash compensation. We believe that periodic reviews of outside compensation practices are appropriate to determine if any compensation levels require adjustments or if the mix of compensation components requires rebalancing.
Given the nature of our businesses, we compete with companies across the two broad industry groups mentioned above for top executive-level talent. As such, in setting total compensation levels for our executives, the Committee gives serious consideration to the median level of compensation paid to similarly-situated executives of chemicals and industrial distribution companies of comparable size to Airgas. An individual executive’s targeted compensation may vary from the median of peers based upon expertise, experience and local market factors.
Compensation of our Executive Chairman and our Chief Executive Officer
The compensation of our Executive Chairman and our CEO is reviewed by our Governance and Compensation Committee and our Board and determined solely by our Governance and Compensation Committee. The compensation of our Executive Chairman and our CEO is based on factors similar to those utilized for the other named executive officers, but also includes consideration of the overall responsibilities of our Executive Chairman and our CEO for achievement of corporate‑wide responsibilities, including the achievement of our operational goals for our CEO, and responsibility for our strategic vision for our Executive Chairman. The specific elements of compensation for our Executive Chairman and our CEO and any differences in their compensation as compared to the other named executive officers are discussed below.
Components of Executive Compensation for the 2016 Fiscal Year
Given our philosophy of “pay for performance,” a significant percentage of total compensation is allocated to performance-based incentives. As a general matter, we recognize that, as employees progress to higher levels within our organization, they assume more responsibility for our overall performance and returns to stockholders. Consequently, we seek to link greater portions of executive compensation to criteria and metrics that are tied to the creation of stockholder value. Looking at the named executive officers as a group, 65% of their target total compensation (including the Black-Scholes value of stock option grants) for the 2016 fiscal year was allocated to performance-based, or “at-risk,” components consisting of annual cash incentives and stock options, with the remaining 35% allocated to base salary. To date, we have only granted stock options under our equity incentive plans. We have always balanced the value of the grants to the executive (measured using the Black-Scholes Option Pricing Model) and the potential dilution to existing stockholders that can result from such grants (measured using the burn rate, or the shares granted as a percentage of shares outstanding). Our policy for allocating value between long-term and currently-paid compensation is to ensure adequate base compensation to attract and retain personnel, while providing strong incentives for our executives to maintain an “ownership” mindset, matching long-term value creation for them and our stockholders. The ownership mindset our compensation policy encourages also serves to reduce risk taking by our executives because of their focus on long-term value creation.
46
For Mr. McCausland, his performance-based compensation for the 2016 fiscal year was targeted at 59% of total target compensation, and 49% of his actual total compensation was allocated to performance-based compensation. His actual cash incentive compensation was 26% and his non-cash incentive compensation was 23% of his total compensation. For Mr. Molinini, his performance based compensation for the 2016 year was targeted at 74%, and 70% of his actual total compensation was allocated to performance-based compensation. His actual cash incentive compensation was 15% and his non-cash incentive compensation was 55% of his total compensation. The incentive compensation for each of Messrs. McCausland and Molinini is less than the targeted percentage because it reflects under plan achievement related to EBITDA and ROC targets and a prorated bonus for the 2016 fiscal year, as discussed below.
Combined target cash and non-cash incentive compensation for the four named executive officers other than Mr. McCausland and Mr. Molinini for the 2016 fiscal year ranged from 50% to 71% of total target compensation. Their combined actual cash and non-cash incentive compensation for the 2016 fiscal year ranged from 44% to 68% of total compensation.
• | Actual cash incentive compensation ranged from 12% to 15% of total compensation. |
• | Actual non-cash incentive compensation ranged from 29% to 56%. |
We believe these mixes are both competitive within the marketplace and consistent with our stated compensation philosophy.
The Committee believes that the relatively larger component of Mr. McCausland’s and Mr. Molinini’s compensation that is performance-based reflects their greater focus on company-wide operational and strategic initiatives that have a direct and significant impact on Airgas’ overall performance. This has historically resulted in higher compensation for the CEO and the Executive Chairman, than for our other executive officers.
Base Salary
Base salary is the component of compensation that is fixed and intended to compensate our executives based on their experience, expertise, job responsibilities and the performance of their responsibilities during the fiscal year. While base salaries must be competitive in order to recruit and retain qualified executives, we generally do not pay base salaries at levels exceeding the market median among peer companies. Our review of base salaries paid to our executives’ peers indicates that the base salaries of our named executive officers generally are below the median for comparably-sized chemical industry and industrial distribution companies. Consistent with our compensation philosophy that we offer compensation opportunity based on superior performance, we strive to use incentive compensation, rather than base salary, to provide executives with an above-market compensation opportunity if we exceed budgeted financial performance metrics and drive increases in stockholder value. Mr. McCausland and Mr. Molinini are paid a higher base salary than the other named executive officers because they are our most senior officers, have direct accountability to our Board and have broader responsibilities than our other executive officers. The difference in base salaries is consistent with relative base salaries reflected in peer-company comparisons of executives with like responsibilities.
Each year, our Governance and Compensation Committee reviews the base salary of Mr. McCausland, Mr. Molinini and all other executive officers. In making adjustments to base salary levels, the Committee considers:
• | the executive’s level of responsibilities; |
• | the executive’s experience and breadth of knowledge; |
• | the executive’s individual performance as assessed through annual performance reviews; |
• | the executive’s role in management continuity and development plans; |
• | internal equity factors, meaning relative pay differences for different jobs; and |
• | on a periodic basis, benchmark data on the compensation practices of peer companies, from available salary survey data and as reported in public company proxy statements. |
The normal interval between salary reviews for most executive officers and most other employees is 12 months, usually completed in the quarter following the fiscal year end. Mr. McCausland’s salary increases have been less frequent, as the Committee prefers to consider the factors listed above over a more than one‑year period and adjust his salary in larger increments. Mr. McCausland did not receive a base salary increase during the 2016 fiscal year. Mr. Molinini did not receive a base salary increase during the 2016 fiscal year. None of the other executive officers received a salary increase during the 2016 fiscal year.
Annual Cash Incentive Awards - Management Bonus Plans
Annual cash incentive awards for our executive officers are intended to promote the achievement of our corporate and division financial performance goals, as well as individual performance goals. Each of our named executive officers participated in our Executive Bonus Plan. In addition, each named executive officer participated in the following Airgas annual
47
cash incentive plan for which executive officers and other management employees may be eligible, which plans, together with our Executive Bonus Plan, are referred to in this report as our Management Bonus Plans:
• | the Management Bonus Plan for Corporate Management, in which Messrs. Cichocki, Dougherty, McCausland, McLaughlin, Molinini and Young participated during the 2016 fiscal year, is available to all management-level employees who have corporate-wide responsibility. |
The overall cash incentive award paid to each executive officer is composed of (1) a cash incentive award under our Executive Bonus Plan that is based on financial performance goals and (2) a cash incentive award under the applicable Management Bonus Plan that is based on strategic and individual performance goals. In addition, the Committee may, in its discretion, grant to any executive officer a cash award outside of any of our plans described above.
Transition to a Calendar Year Bonus Year
In January 2016, the Executive Bonus Plan and the Management Bonus Plan covering our named executive officers were amended in connection with a company-wide transition from a fiscal year bonus year to a calendar year bonus year. The amendments to the plans provided that, in lieu of the performance period commencing on April 1, 2015 and ending on March 31, 2016, the plans would be in effect for a performance period commencing on April 1, 2015 and ending on December 31, 2015 (referred to in this report as the “2015 bonus year”), and thereafter, for a performance period commencing on January 1, 2016 and ending on December 31, 2016. Further, with respect to the 2015 bonus year, the amendments provided that (i) of the financial performance targets originally established for the four quarters covered by the period April 1, 2015 through March 31, 2016, the targets relating to the three quarters covered by the period April 1, 2015 through December 31, 2015 would apply to the 2015 bonus year, and (ii) bonuses would be calculated based on the level of achievement of the applicable performance targets, and by applying each participant's target bonus opportunity percentage to the portion of such participant's base salary attributable to such performance period.
Corporate Performance Goals. Within 90 days after the beginning of each bonus year, the Committee (1) reviews our performance during the prior bonus year, (2) analyzes anticipated value drivers in our industry and within our company and proposed performance objectives for the current bonus year and (3) determines the specific performance criteria for each executive officer and the metrics that will be used for the current bonus year under our Executive Bonus Plan, based on such review and analysis. Examples of performance criteria that the Committee may consider are a cash flow measure, such as: earnings before interest, taxes, depreciation, amortization (EBITDA) and special gains (charges), or Adjusted EBITDA; sales; earnings per share; gross profit; return on capital, or ROC; and transaction processing accuracy. After selecting the performance criteria, the Committee establishes performance metrics within the selected criteria and assigns to each of our executive officers a target award. The target award, expressed as a percentage of the executive officer’s annual base salary, is determined based upon the executive’s position in the company.
In addition, each of the pre-determined performance criteria (e.g., ROC) is weighted by the Committee, in its judgment, to reflect its relative importance, and becomes a separate component of the executive officer’s cash incentive award. The Committee also sets a target payout, expressed as a percentage for each component. Our executive officers will receive cash incentive awards under the Executive Bonus Plan if, at the end of the bonus year, Airgas has achieved the performance metrics established within the criteria selected by the Committee at the beginning of the bonus year. Actual cash award payments will vary based upon Airgas’ level of achievement of the pre-determined corporate performance metrics and the different weights assigned to each performance criteria component for each executive officer.
The annual cash incentive award targets are set for each executive officer as a percentage of base salary with regard to the relative responsibilities of each executive officer and with regard to the total cash compensation opportunity for comparable positions in peer companies. For the 2015 bonus year, Mr. McCausland’s target for his annual cash incentive award was 100% of his base salary. For the 2015 bonus year, Mr. Molinini’s target annual cash incentive award was 100% of his base salary. We believe that Mr. McCausland’s and Mr. Molinini’s target awards were generally comparable to the target annual cash incentive award for chief executive officers in our peer companies. For the 2015 bonus year, Mr. Cichocki’s target for his cash incentive award was 70% of his base salary. We believe that Mr. Cichocki’s target awards were generally comparable to the target annual cash incentive award for others with similar responsibility in our peer companies. For the 2015 bonus year, all other named executive officers had target cash incentive awards set at 50% of their annual base salary, which reflects their responsibilities relative to Mr. McCausland and Mr. Molinini and generally reflects the total cash compensation opportunity for the other named executive officers in our peer companies.
Adjusted EBITDA and ROC were chosen as the plan performance criteria for executives with corporate-wide responsibility (i.e., Messrs. Cichocki, Dougherty, McCausland, McLaughlin, Molinini and Young). Adjusted EBITDA was most heavily weighted at 70% of the annual cash incentive award target because the Committee believes that it motivates growth, gross margin performance and expense management, and because of the direct correlation of earnings performance with share valuation. ROC was weighted at 15% of the annual cash incentive award target and was intended to drive discipline around long-term capital deployment and debt reduction, also important performance measures to stockholders. The remaining 15% of
48
the target annual cash incentive award was based on individual performance and payout was based on performance against objectives set and agreed upon in the first quarter of the 2016 fiscal year.
The threshold and maximum of each performance criterion of the award was determined separately. For the 2015 bonus year, the Adjusted EBITDA threshold for both corporate and the divisions was 32% of the target award for achievement at 90% of budget. The Adjusted EBITDA target opportunity (100%) was earned for achievement of 100% of our budget for Adjusted EBITDA for the 2015 bonus year. The maximum Adjusted EBITDA award opportunity was set at 105% of Adjusted EBITDA budget, which awarded 140% of the target opportunity and reflected the Committee’s judgment of reasonable compensation for superior performance.
The ROC target opportunity was set at achievement within 98% to 102% of our budget. The threshold bonus opportunity for both corporate and division ROC was set at 90% of budget, which awarded 20% of award target, and the maximum was set at 107% of budget, which awarded 150% of award target. That range was intended to recognize an adequate level of performance below budget while still improving ROC, and was intended to pay reasonable compensation above target for superior performance.
The Corporate Adjusted EBITDA target (budget) for the 2015 bonus year was $774 million and the ROC target (budget) was 11.9%. All targets reflect adjustments during the bonus year to account for budgeted results from acquisitions completed during the year. We calculate Adjusted EBITDA by adding our depreciation and amortization expenses to our operating income, in addition to merger costs and other special charges. Note that the Adjusted EBITDA used to calculate annual cash incentive awards differs immaterially from the Adjusted EBITDA we report to investors in financial presentations due to the inclusion of an immaterial amount of income generated from Airgas’ joint ventures. We calculate ROC by dividing our operating income adjusted for merger costs and other special charges by average capital employed, which we define as average total assets less average current liabilities (excluding debt).
Individual Performance Goals. In addition to the corporate financial performance goals described above, under the Management Bonus Plan for Corporate Management, a portion of each of Messrs. Cichocki’s, Dougherty’s, McCausland’s, McLaughlin’s, Molinini’s, and Young’s annual cash incentive award is based on individual performance measured against personal objectives. The Committee established individual performance objectives for Mr. McCausland after consultation with him at the beginning of the bonus year regarding his priorities for the 2015 bonus year. Mr. McCausland established individual performance objectives with Mr. Molinini. Mr. Molinini established individual performance objectives with Mr. McLaughlin, Mr. Cichocki, Mr. Dougherty and Mr. Young. The Committee reviewed, and based upon its evaluation, determined the scores for Messrs. McCausland and Molinini, and approved the scores for Messrs. Cichocki, Dougherty, McLaughlin, and Young. For the 2015 bonus year, individual performance goals under the Management Bonus Plan for Corporate Management represented 15% of the overall annual potential cash incentive award available for Messrs. Cichocki, Dougherty, McCausland, McLaughlin, Molinini, and Young. The individual performance goals of the forgoing named executive officers were as follows:
• | Mr. Cichocki’s goals: deliver improvement in personal safety and preventable vehicle accident rates and enhance the Company’s safety and compliance culture; drive gases and rental growth across all modes and all segments; continue multi-year initiative to optimize the four primary Airgas sales channels, consisting of strategic accounts, field sales, telesales, and e-commerce; effectively plan and execute business process improvement initiatives to improve cost and quality of transactional processes; drive acquisitions in the core business; and effectively plan and manage organizational succession changes. |
• | Mr. Dougherty’s goals: execute the Security Framework Roadmap to improve the company’s information systems security capabilities; support ongoing SAP and e-commerce platform enhancements; effectively plan and manage organizational succession changes. |
• | Mr. McCausland’s goals: deliver improvement in personal safety and preventable vehicle accident rates and enhance the Company’s safety and compliance culture; work with the CEO and President of Airgas USA, LLC to facilitate gases and rental growth; drive business process improvement initiatives; support acquisitions in the core business; and execute on plans for preparing for the senior management succession plan. |
• | Mr. McLaughlin’s goals: continue to drive improvement in order-to-cash processes and the effectiveness of the credit and collection functions at the BSCs; deliver SAP enabled benefits; provide leadership to continue to leverage best practices and drive standardization in all areas of financial processing and reporting; and effectively plan and manage organizational succession changes. |
• | Mr. Molinini’s goals: deliver improvement in personal safety and preventable vehicle accident rates and enhance the Company’s safety and compliance culture; drive gases and rental growth across all modes and all segments; execute plans to generate benefits from business process improvement initiatives; drive acquisitions in the core business; and effectively plan and manage organizational succession changes. |
49
• | Mr. Young’s goals: continue to develop and expand the risk management efforts, assuring proper evaluation and reporting of risks; assure compliance with antitrust, foreign corrupt practices, US Department of Transportation and US Food and Drug Administration laws and regulations; assure Airgas is well positioned to remain compliant with federal, state, and local laws and regulations governing Airgas operations; support company efforts to explore growth opportunities through acquisitions; and effectively plan and manage organizational succession changes. |
Calculation of the Cash Awards. A participant’s target incentive award is multiplied by the weight for each component to determine the target payout for each component. Each performance score as a percentage (e.g., meeting the goal equals a 100% score) is multiplied by the target payout for the specific component to determine the actual incentive award for each component. Performance scores for each component utilizing performance criteria may range between 0% and 150% (140% for Adjusted EBITDA). Performance scores for the individual objectives may range between 0% and 100%. The total incentive award is the sum of the components. The aggregate scores for bonus metrics are limited to 135.5% for each of Messrs. Cichocki, Dougherty, McCausland, McLaughlin, Molinini, and Young. Extraordinary performance may be recognized with an additional bonus amount, but the total award opportunity is capped so that the maximum possible award is the lower of $1,500,000 and 200% of target.
For the 2015 bonus year, the Corporate Adjusted EBITDA achievement was 94.8% of our 2015 bonus year budget, which translated into an Adjusted EBITDA award of 63.6% of the target opportunity. The Corporate ROC achievement was 94.4% of our 2015 bonus year budget, which translated into a 63.9% ROC award.
The following example explains the mechanics of the bonus plan. We have assumed that the executive earned 100% achievement on his individual objectives and was paid 100% of the award for individual objectives. The formula is illustrated below:
Adjusted EBITDA Award = 70% Weight X 63.6% Award = 44.5% of the Total Award Target
ROC Award = 15% Weight X 63.9% Award = 9.6% of the Total Award Target
Individual Performance Award = 15% Weight X 100% Award = 15% of the Total Award Target
The Total Award = 44.5% + 9.6% + 15.0% = 69.1% of the executive’s target award.
Based on individual and Company performance during the 2015 bonus year and the calculation methodology described above, the Committee awarded the following amounts to the named executive officers under the Management Bonus Plans:
Name | Total ($) |
Mr. Cichocki | 145,740 |
Mr. Dougherty | 89,732 |
Mr. McCausland | 468,450 |
Mr. McLaughlin | 127,972 |
Mr. Molinini | 455,698 |
Mr. Young | 108,066 |
Discretionary Annual Bonuses Under the Management Bonus Plans. Following the 2015 bonus year-end, the Committee evaluated Mr. McCausland’s and Mr. Molinini’s performance against their pre-determined individual objectives, and Mr. Molinini evaluated Messrs. Cichocki’s, Dougherty’s, Young’s and McLaughlin’s performance against their pre-determined individual objectives. For a more detailed description of the annual incentive compensation awards received by the named executive officers, see “Summary Compensation Table for the 2016 Fiscal Year” found later in this report.
Mr. McCausland, Mr. Molinini and all of the other named executive officers received their annual cash incentive awards for the 2015 bonus year in March 2016 following Committee approval at its regular January meeting. Annual cash incentive awards earned by our named executive officers for performance during the 2015 bonus year appear later in this report in the “Summary Compensation Table for the 2016 Fiscal Year”, under the headings “Non-Equity Incentive Plan Compensation” and “Bonus.”
Long-Term Equity Incentive Compensation
The Committee’s objective in granting equity awards is to provide a strong incentive to our executives and key employees to focus on the ongoing creation of stockholder value by offering significant compensation opportunities for superior performance. These award opportunities not only allow us to offer a competitive overall compensation package, but also allow for further opportunities for stock ownership by our employees in order to increase their proprietary interest in Airgas and, as a result, their interest in our long-term success and their commitment to creating stockholder value.
50
Although long-term equity incentives under our 2006 Equity Plan may consist of nonqualified stock options, incentive stock options (ISOs), stock appreciation rights (SARs), restricted stock, restricted stock units or any combination of the above, as the Committee may determine, the Committee historically has only granted nonqualified stock options as the exclusive form of equity-based compensation. The table below provides certain information regarding our use of stock options during the last 10 fiscal years.
Fiscal Year-End | Total Shares Underlying Options Granted to Employees | Weighted Average Option Exercise Price ($) | No. of Employees Granted Options in Fiscal Year | Employee Options Granted in Fiscal Year as a % of Outstanding Shares at Fiscal Year-End | Employee Options Fair Value on Date of Grant ($)(1) | Total Outstanding Employee Options as a % of Outstanding Shares at Fiscal Year-End |
3/31/2007 | 933,900 | 36.19 | 472 | 1.2 | 12,838,558 | 8.1 |
3/31/2008 | 1,030,550 | 43.80 | 419 | 1.3 | 15,694,311 | 8.1 |
3/31/2009 | 1,070,000 | 59.87 | 438 | 1.3 | 19,498,530 | 8.1 |
3/31/2010 | 1,369,650 | 43.11 | 474 | 1.6 | 19,811,583 | 7.6 |
3/31/2011 | 997,800 | 62.31 | 435 | 1.3 | 22,638,901 | 8.7 |
3/31/2012 | 943,000 | 66.52 | 426 | 1.2 | 21,587,522 | 8.6 |
3/31/2013 | 924,900 | 91.91 | 418 | 1.3 | 27,320,159 | 6.9 |
3/31/2014 | 919,200 | 102.85 | 422 | 1.2 | 29,721,796 | 6.9 |
3/31/2015 | 932,000 | 104.64 | 633 | 1.2 | 26,988,483 | 6.6 |
3/31/2016 | 962,975 | 103.62 | 656 | 1.3 | 19,171,484 | 7.0 |
Average Per Year | 1,008,398 | 479 | 1.3 | 7.7 | ||
____________________
(1) The amounts shown reflect the grant date fair value of stock options granted during the last 10 fiscal years, computed in accordance with FASB ASC Topic 718.
In granting long-term equity incentive awards, the Committee determines:
• | the executive officers to receive awards; |
• | the number of shares in each grant to an executive officer; |
• | the aggregate number of shares available for Mr. McCausland to grant in stock options to non-executive officers pursuant to his delegated authority; and |
• | the terms and conditions of each award. |
Long-term equity incentive awards for the 2016 fiscal year were determined and approved at the Committee’s regularly scheduled May 2015 meeting and are reflected in this report, including in the “Summary Compensation Table for the 2016 Fiscal Year” and the “Grants of Plan-Based Awards in the 2016 Fiscal Year” table found later in this report.
In determining the size of long-term equity incentive awards to the named executive officers for the 2016 fiscal year, the Committee considered the burn rate, historical grants to the executive officers, value per share as determined by using the Black-Scholes valuation model for stock options, the value of equity-based compensation to top executives in comparable chemical and industrial distribution companies and grant sizes relative to the executive’s peers at Airgas.
Our aim is to focus our executives on providing superior returns to our stockholders and driving for sustained increases in Airgas’ stock price. We believe that nonqualified stock options effectively focus our executives on these goals and are an efficient use of shares available under the plan.
Our stock option award program helps us to:
• | motivate and reward superior performance on the part of executives and key employees; |
• | enhance the link between the creation of stockholder value and long-term executive incentive compensation; |
• | encourage increased stock ownership in Airgas by executives; and |
• | maintain competitive levels of total compensation. |
Option Grant Practices. The Committee makes decisions on stock option grants based solely on our compensation and retention objectives and our established measurements of the value of these awards. Each May, at its regularly scheduled meeting, the Committee approves the annual stock option awards for executive officers and the total shares available for stock option grants to our other key employees throughout the remainder of the fiscal year. The grant date for executive officers and
51
the date for setting the exercise price is the date of the meeting. In addition, we do not plan to coordinate grants of options so that they are made before announcement of favorable information, or after announcement of unfavorable information. For the 2016 fiscal year, options to purchase 275,410 shares in the aggregate were granted to 16 executive officers, which includes the principal accounting officer.
Mr. McCausland granted annual stock option awards on May 19, 2015, the second day of the Committee’s regularly scheduled May meeting, to 639 non-executive employees to purchase 687,000 shares in the aggregate.
The only other times stock options are typically granted are in connection with a new hire or in recognition of a special achievement. The exercise price for these grants for new hires is set on the date of employment or the date of approval, whichever is later, and the exercise price for a grant in recognition of a special achievement is set on the date of approval. For the 2016 fiscal year, the Committee approved a stock option grant to Mr. McCausland relating to 20,000 shares which was granted on May 19, 2015. The Committee delegated authority to Mr. McCausland to make stock option grants to employees, other than to executive officers, subject to an aggregate limit in the 2016 fiscal year of 16,520 shares. For the 2016 fiscal year, one grant totaling 565 shares was granted by Mr. McCausland to a non-executive officer employee.
The exercise price of all awarded stock options under the 2006 Equity Plan is equal to the closing selling price of Airgas shares on the NYSE on the date of grant. Employee stock option awards made in the 2016 fiscal year vest and become exercisable in equal 25% increments on each of the first four anniversaries of the grant date and expire on the eighth anniversary of the grant date, or earlier upon certain terminations of employment.
Airgas has not granted equity awards to employees other than through the grant of stock options.
Retirement and Other Plans and Programs
We maintain the following plans and programs to provide retirement benefits to salaried employees, including Mr. McCausland and each of the named executive officers:
• | the Airgas, Inc. 401(k) Plan, referred to as the 401(k) Plan; |
• | the Deferred Compensation Plan I; and |
• | the Deferred Compensation Plan II. |
We maintained the following plan, which was suspended in fiscal year 2016 in connection with the execution of the Merger Agreement, to provide additional benefits to salaried employees, including Mr. Molinini and the four named executive officers, other than Mr. McCausland:
• | the Airgas, Inc. Amended and Restated 2003 Employee Stock Purchase Plan, referred to as the Employee Stock Purchase Plan. |
The benefits available under these plans are intended to provide income replacement after retirement, either through withdrawals from the 401(k) Plan, the Deferred Compensation Plan I and the Deferred Compensation Plan II, or dividend income and sales of shares acquired through the Employee Stock Purchase Plan.
The 401(k) Plan is a qualified 401(k) defined contribution plan designed to encourage salaried employees to save and invest for retirement. Under the 401(k) Plan, employees may contribute up to the annual IRS limits on a pre-tax basis. After the completion of one year of service, we match employee contributions at a rate of $0.50 for each $1.00 contributed by the employee, up to 4% of the employee’s base salary. Our matching contributions vest 100% immediately after we make the match, and are made in the 401(k) funds in the same weightings per fund as the employee’s contributions. One choice available to participants is an investment in a fund that holds Airgas common stock.
The Deferred Compensation Plan I is a nonqualified, unfunded plan. In May 2004, our Board authorized the termination of the plan for new participants and the discontinuance of further deferrals by existing participants after May 31, 2004. The plan provided employees the opportunity to defer all or any portion of their base salaries and annual cash incentive awards and non-employee directors the opportunity to defer all or a portion of their annual cash compensation. Amounts deferred are unsecured, but earn a return equal to the performance of selected mutual funds. See the table and discussion entitled “Nonqualified Deferred Compensation for the 2016 Fiscal Year” in this report for an additional discussion of the Deferred Compensation Plan I. The purpose of the salary and incentive award deferral program was to provide “highly-compensated” employees and non-employee directors with a convenient and efficient opportunity to save for retirement or other future events, such as college expenses, while deferring applicable income taxes until withdrawal. All named executive officers were eligible, but only Mr. Molinini held a balance in the plan during the 2016 fiscal year.
The Deferred Compensation Plan II is a nonqualified, unfunded plan, which became effective on July 1, 2006. The plan provides our non-employee directors and a select group of highly compensated employees, including the named executive officers, the opportunity to defer up to 75% of their base salary and all or any portion of their annual incentive awards (or director fees, for non-employee directors). Amounts deferred are unsecured, but earn a return equal to the performance of selected mutual funds, one of which tracks the Airgas common stock price. See the table and discussion entitled “Nonqualified
52
Deferred Compensation for the 2016 Fiscal Year” in this report for an additional discussion of the Deferred Compensation Plan II. The purpose of the program is to provide “highly-compensated” employees and non-employee directors with a convenient and efficient opportunity to save for retirement or other future events, such as college expenses, while deferring applicable income taxes until withdrawal. All named executive officers were eligible, but no named executive officers contributed to the plan during the 2016 fiscal year.
The Employee Stock Purchase Plan is a Section 423(b) plan. The purpose of the plan is to encourage and assist employees to acquire an equity interest in Airgas through the purchase of Airgas common stock at a discount by payroll deduction. For those enrolled, purchases are made on the first business day of each quarter. The discounted purchase price is 85% of the lower of the closing price per share of common stock on the purchase date or the closing price per share on the first business day of up to four previous quarters in a fiscal year. Messrs. McLaughlin, Molinini and Young purchased shares in the plan during the 2016 fiscal year. Mr. McCausland is not eligible to participate in the plan.
Severance Arrangements and Change of Control Agreements
Airgas maintains the Airgas, Inc. Severance Pay Plan which provides severance benefits to all of our employees, including the named executive officers, in the event their employment is terminated (other than “for cause” and other non-qualifying terminations defined in the plan). Mr. McCausland is also party to an Amended and Restated Executive Severance Agreement, as discussed below, that provides for severance benefits in the event of a qualifying termination of employment. These arrangements are intended to attract and retain qualified executives who may have other employment alternatives that may appear to them to be less risky absent these arrangements. For a more detailed description of the benefits which our named executive officers may be eligible to receive under the Severance Pay Plan and the benefits which Mr. McCausland may be eligible to receive under his Amended and Restated Executive Severance Agreement, see “Severance Benefits” found later in this report.
Airgas has entered into “change of control” agreements with Messrs. Cichocki, Dougherty, McCausland, McLaughlin, Molinini and Young and four other senior employees. These agreements provide salary and benefit continuation if (1) there is a change of control of Airgas, and (2) a qualifying termination of a covered executive’s employment within three years following a change of control. These arrangements are designed to preserve our human resources in the event of a change of control. For more detail regarding the “change of control” agreements, see “Potential Change of Control Payments.”
Under an arrangement originally entered into in 1992, which was amended in the Amended and Restated Executive Severance Agreement, in the event of the termination of Mr. McCausland’s employment for any reason, other than for “material dishonesty,” including a change of control, Mr. McCausland is entitled to a payment equal to two times his annual salary, the continuation of health insurance and other employee benefits for a three-year period and automatic vesting of all of his stock options. The limitation under Mr. McCausland’s change of control agreement would include the amount payable under his severance agreement for determining whether benefits would be reduced under his change of control agreement to comply with the limitation of 2.99 times his average annual compensation for the preceding five years.
Perquisites and Personal Benefits
Mr. McCausland received an automobile allowance, reimbursement for shipping costs, and a company-paid physical examination during the 2016 fiscal year. In addition, Airgas owns and operates one corporate aircraft to allow employees to travel safely and efficiently for business purposes. This corporate aircraft enables our employees to be more productive by providing a secure environment to conduct confidential business and avoid the scheduling constraints associated with commercial air travel. The company allowed Mr. McCausland personal use of our corporate aircraft in order to enable him to take advantage of these efficiencies so long as he reimbursed Airgas for incremental costs associated with his personal use. In determining the incremental costs for personal use, we considered fuel, supplies, contracted pilot fees, hangar and landing/ramp fees, excise tax and travel expenses for the flight crew. This amount does not include fixed costs that would have been incurred regardless of personal use, such as pilot salaries, exterior paint, interior refurbishment and regularly scheduled inspections. The amount of such reimbursement for the 2016 fiscal year was $5,808
Mr. Dougherty received an allowance for airline club fees during the 2016 fiscal year.
There were no other perquisites for executive officers during the 2016 fiscal year, except those benefits generally available to all management employees. For a more detailed description of the perquisites and personal benefits received by our named executive officers, see the table in this report entitled “All Other Compensation for the 2016 Fiscal Year.”
Other Matters
Stock Ownership Guidelines
We believe that stock ownership guidelines help to further focus our management team on the long-term success of our business and the interests of our stockholders. All Executive Officers, other key executives, and all presidents of our business units are expected to acquire and hold, within five years after accepting their positions, the lesser of a fixed number of Airgas shares or Airgas shares with a value equal to a designated multiple of their base salary. The Governance and Compensation
53
Committee of the Board revised the guidelines in August 2011. There are five tiers within our management team covered by ownership guidelines. For the Chief Executive Officer and the Executive Chairman, the minimum level is the lesser of 200,000 shares or a value equal to five times base salary; for the Chief Financial Officer, 75,000 shares or a value equal to three times base salary; for the other executive officers, 40,000 shares or a value equal to three times base salary; for selected other corporate officers, 40,000 shares or a value equal to two times base salary; and for business unit Presidents and certain key employees, 25,000 shares or a value equal to one times base salary. In each case, shares under vested options are counted to satisfy 90% of the number of shares guidelines, and 60% of in‑the‑money value of vested options is included to satisfy the value guidelines.
Under the guidelines, our executives are expected to satisfy their designated ownership levels as of the fifth anniversary of the date on which the executive became covered by the applicable ownership guideline tier. All of our named executive officers and all but four other executive officers, who are not yet required to satisfy the stock ownership guidelines, have already met their expected ownership levels.
Policy Against Hedging with regard to our Common Stock
In order to avoid the appearance of improper or inappropriate conduct and to better align the company’s interests and our directors and executive officers, directors and executive officers may not engage in the following transactions with regard to our common stock, unless otherwise approved by independent members of the Governance and Compensation Committee:
1. Transactions in puts, calls or other derivative transactions on any exchange, in any market or through any over the counter transaction;
2. Hedging or monetization transactions, such as zero-cost collars and forward sale contracts; and
3. Short sales of our common stock (i.e., the sale of securities not owned by the seller or, if owned, not delivered).
Executive Compensation Clawback Policy
In May 2015, our Board approved a clawback policy that allows the Governance and Compensation Committee to seek recovery of performance-based compensation that was paid to an executive officer prior to any restatement of the company’s financial statements, if it is determined (i) that the compensation would have been lower had it been calculated based on the restated results, and (ii) that the restatement was the result of intentional or unlawful misconduct on the part of such executive officer that materially contributed to the need for the restatement. The Committee will not seek recovery to the extent it determines (i) that to do so would be unreasonable or (ii) that it would be better for the company not to do so. For purposes of the policy, the term “performance-based compensation” means all bonuses and other incentive and equity compensation awarded to each of our executive officers, the amount, payment and/or vesting of which was calculated based wholly or in part on the application of objective performance criteria measured during any part of the period covered by the restatement.
Implications of Tax and Accounting Matters
Deductibility of Executive Compensation. Airgas takes deductions in excess of $1 million for certain performance-based incentives, including incentives provided under certain plans approved by our stockholders, paid to the persons identified in Section 162(m) of the Internal Revenue Code of 1986, as amended, referred to in this report as the Code. Under Section 162(m), corporations may not deduct, when computing taxable income, salary and non-performance based compensation exceeding $1 million paid to a single executive. While Airgas seeks to structure compensation it pays so that it is eligible for deduction, if compliance with the terms of Section 162(m) conflicts with our compensation philosophy, or with actions that the Committee believes are in the best interests of Airgas and our stockholders, the Committee may conclude that payment of non-deductible compensation is appropriate under the circumstances to allow us to pay competitive compensation to our executive officers.
Nonqualified Deferred Compensation. On October 22, 2004, the American Jobs Creation Act of 2004 became law, changing tax rules applicable to “nonqualified deferred compensation arrangements.” A more detailed discussion of our nonqualified deferred compensation arrangements is provided later in this report under the heading “Nonqualified Deferred Compensation for the 2016 Fiscal Year.”
54
REPORT OF THE GOVERNANCE AND COMPENSATION COMMITTEE
The Governance and Compensation Committee of our Board of Directors has reviewed and discussed the Compensation Discussion and Analysis required by Item 402(b) of Regulation S-K with management and, based on such review and discussion, the Committee recommended to the Board that the Compensation Discussion and Analysis be included in this report.
Governance and Compensation Committee
David M. Stout, Chair
Lee M. Thomas
Paula A. Sneed
Ted B. Miller, Jr.
Richard C. Ill
EXECUTIVE COMPENSATION
Executive Compensation Tables
The following table sets forth certain information concerning the compensation earned during the fiscal year ended March 31, 2016 by our named executive officers.
Summary Compensation Table for the 2016 Fiscal Year
Name and Principal Position(1) | Fiscal Year | Salary ($)(1) | Bonus ($) | Option Awards ($)(2) | Non-Equity Incentive Plan Compensation ($)(3) | Change in Pension Value and Nonqualified Deferred Compensation Earnings (Loss)(4) | All Other Compensation ($)(5) | Total ($) |
Andrew R. Cichocki (6) | 2016 | 400,000 | — | 696,801 | 145,740 | — | 4,967 | 1,247,508 |
Senior Vice President; | 2015 | 374,318 | — | 1,013,516 | 190,064 | — | 5,692 | 1,583,590 |
President-Airgas USA, LLC | 2014 | 296,936 | — | 969,954 | 103,516 | — | 65,438 | 1,435,844 |
Robert A. Dougherty | 2016 | 344,793 | — | 215,013 | 89,732 | — | 5,463 | 655,001 |
Senior Vice President | 2015 | 344,793 | — | 312,742 | 117,023 | — | 6,787 | 781,345 |
and Chief Information Officer | 2014 | 334,750 | — | 387,982 | 95,832 | — | 5,194 | 823,758 |
Peter McCausland | 2016 | 900,000 | — | 398,172 | 468,450 | — | 13,929 | 1,780,551 |
Executive Chairman | 2015 | 900,000 | — | 142,734 | 610,920 | — | 12,399 | 1,666,053 |
2014 | 900,000 | — | 969,954 | 525,000 | — | 13,164 | 2,408,118 | |
Robert M. McLaughlin | 2016 | 491,727 | — | 447,944 | 127,972 | — | 4,917 | 1,072,560 |
Senior Vice President | 2015 | 484,566 | — | 651,546 | 166,892 | — | 5,272 | 1,308,276 |
and Chief Financial Officer | 2014 | 470,453 | — | 808,295 | 136,672 | — | 5,169 | 1,420,589 |
Michael L. Molinini | 2016 | 875,500 | — | 1,612,597 | 455,698 | (43,488) | 3,975 | 2,904,282 |
President and | 2015 | 875,500 | — | 2,345,566 | 594,290 | 99,724 | 5,200 | 3,920,280 |
Chief Executive Officer | 2014 | 862,750 | — | 2,909,862 | 525,000 | 154,951 | 5,195 | 4,457,758 |
Robert H. Young, Jr. | 2016 | 415,237 | — | 215,013 | 108,066 | — | 4,954 | 743,270 |
Senior Vice President | 2015 | 409,190 | — | 312,742 | 140,931 | — | 5,260 | 868,123 |
and General Counsel | 2014 | 397,272 | — | 387,982 | 115,412 | — | 5,163 | 905,829 |
____________________
(1) | Each of the named executive officers contributed a portion of his salary to our 401(k) Plan. |
(2) | The amounts shown reflect the aggregate grant date fair value of stock options granted during the 2014, 2015 and 2016 fiscal years, computed in accordance with FASB ASC Topic 718. These dollar amounts do not correspond to the actual value that may be realized by the named executive officers. For information on the valuation assumptions made in the calculation of these amounts, refer to Note 14 to Airgas’ consolidated financial statements for the fiscal |
55
year ended March 31, 2016, included in this report. See the table under “Grants of Plan-Based Awards in the 2016 Fiscal Year” for information on the options granted in the 2016 fiscal year to the named executive officers.
(3) | The amounts shown reflect cash incentive awards earned by our named executive officers under the stockholder-approved Executive Bonus Plan for performance in fiscal years 2014, 2015 and 2016, based on performance criteria established at the beginning of the 2014, 2015 and 2016 fiscal years by the Governance and Compensation Committee. For officers with corporate-wide responsibilities, including Messrs. Cichocki, Dougherty, McCausland, McLaughlin, Molinini and Young, the Committee established two formulaic performance criteria for the fiscal year - earnings before interest, taxes, depreciation, amortization and special charges (Adjusted EBITDA), and return on capital (ROC). In addition to the awards earned under the stockholder-approved Executive Bonus Plan, a portion of each of their awards is based on achievement of individual performance goals set at the beginning of each fiscal year, and does not rely on formulas for determining the attainment levels. The individual performance goals are related to significant projects or strategic milestones and achievement is assessed following the end of the fiscal year. The amounts shown reflect cash incentive awards earned for the performance period commencing on April 1, 2015 and ending on December 31, 2015, referred to as the 2015 bonus year. Our named executive officers are also eligible to earn a cash incentive award for a performance period commencing on January 1, 2016 and ending on December 31, 2016, the amount of which is not calculable as of the date of this report and is expected to be determined in early 2017 following completion of the applicable performance period. |
(4) | Airgas offers its executive officers an opportunity to defer earnings pursuant to the Deferred Compensation Plan II. Until May 31, 2004, Airgas offered its executive officers an opportunity to defer earnings pursuant to the Deferred Compensation Plan I. Under each plan, earnings are calculated in the same manner and at the same rate as earnings on externally-managed, publicly-available mutual funds or on an externally-managed fund tracking Airgas’ common stock. We believe earnings in the deferred compensation plans are not considered above-market or preferential earnings for the purposes of this Summary Compensation Table. Airgas does not offer its executive officers a defined benefit pension plan. See the table under “Nonqualified Deferred Compensation for the 2016 Fiscal Year” later in this report for additional information. |
(5) | The amounts shown consist of the following items detailed in the table under “All Other Compensation for the 2016 Fiscal Year”: |
•contributions by the company to the named executive officer’s 401(k) plan account;
•automobile allowances;
•airline club memberships;
•a company-paid physical examination; and
•shipping costs;
(6) | Mr. Cichocki was named Senior Vice President effective August 2014 and has served as President of Airgas USA, LLC since April 2014. Prior to that he served as Senior Vice President of Operations and Business Process Improvement. |
All Other Compensation for the 2016 Fiscal Year
The table below presents an itemized account of “All Other Compensation” provided to our named executive officers during the 2016 fiscal year, regardless of the amount and any minimum thresholds provided under SEC rules and regulations. Consistent with our philosophy of “pay for performance,” perquisites and other compensation are limited in scope and amount.
Name | Matching Contributions to 401(k) ($) | Airline Club ($) | Auto Allowance ($) | Physical Exam ($) | Shipping Costs ($) | Total All Other Compensation ($) |
Andrew R. Cichocki | 4,967 | — | — | — | — | 4,967 |
Robert A. Dougherty | 5,013 | 450 | — | — | — | 5,463 |
Peter McCausland (1) | 3,750 | — | 7,200 | 1,524 | 1,455 | 13,929 |
Robert M. McLaughlin | 4,917 | — | — | — | — | 4,917 |
Michael L. Molinini | 3,975 | — | — | — | — | 3,975 |
Robert H. Young, Jr. | 4,954 | — | — | — | — | 4,954 |
____________________
(1) | Mr. McCausland reimbursed Airgas $5,808 for incremental costs associated with his personal use of the corporate aircraft. The amount reimbursed reflects the aggregate incremental cost to Airgas as recognized under SEC Regulation S-K. In determining the incremental costs for personal use, we considered fuel, supplies, contracted pilot fees, hangar and landing/ramp fees, excise tax and travel expenses for the flight crew. This amount does not include |
56
fixed costs that would have been incurred regardless of personal use, such as pilot salaries, exterior paint, interior refurbishment and regularly scheduled inspections.
Grants of Plan-Based Awards in the 2016 Fiscal Year
The following table sets forth information about equity awards and potential future non-equity incentive payouts provided to our named executive officers during the 2016 fiscal year under the 2006 Equity Plan and the Management Bonus Plans.
Name | Grant Date | Estimated Future Payouts Under Non-Equity Incentive Plan Awards(1) | All Other Option Awards: Number of Securities Underlying Options | Exercise or Base Price of Option Awards($/share)(2) | Grant Date Fair Value of Option Awards ($) | ||
Threshold ($) | Target ($) | Maximum ($) | |||||
Andrew R. Cichocki | 5/19/2015 | 71,120 | 280,000 | 379,400 | 35,000 | 103.62 | 696,801 |
Robert A. Dougherty | 5/19/2015 | 43,789 | 172,397 | 233,597 | 10,800 | 103.62 | 215,013 |
Peter McCausland | 5/19/2015 | 228,600 | 900,000 | 1,219,500 | 20,000 | 103.62 | 398,172 |
Robert M. McLaughlin | 5/19/2015 | 62,449 | 245,864 | 333,146 | 22,500 | 103.62 | 447,944 |
Michael L. Molinini | 5/19/2015 | 222,377 | 875,500 | 1,186,303 | 81,000 | 103.62 | 1,612,597 |
Robert H. Young, Jr. | 5/19/2015 | 52,735 | 207,619 | 281,323 | 10,800 | 103.62 | 215,013 |
____________________
(1) | These columns show the potential value of the payouts for each named executive officer under the Management Bonus Plan for the 2016 fiscal year if the threshold, target or maximum goals had been satisfied for all performance goals. The potential payouts are performance-driven and therefore completely at risk. The performance criteria, performance goals and salary and incentive award percentages for determining the payouts are described under “Compensation Discussion and Analysis - Components of Executive Compensation for the 2016 Fiscal Year - Annual Cash Incentive Awards - Management Bonus Plans” earlier in this report. |
(2) | The Governance and Compensation Committee met and approved the grants of stock options under our 2006 Equity Plan to our named executive officers on May 19, 2015. Each of the grants has an exercise price equal to the closing price of our common stock on such date. All of the stock options detailed in the table have a term of eight years. |
57
Outstanding Equity Awards at 2016 Fiscal Year-End
Number of Securities Underlying Unexercised Options | ||||
Name | Exercisable (#) | Unexercisable (#) | Option Exercise Price ($) | Option Expiration Date (1) |
Andrew R. Cichocki | 16,800 | — | 43.06 | 5/19/2017 |
12,300 | — | 62.23 | 5/25/2018 | |
14,000 | — | 66.50 | 5/17/2019 | |
9,525 | 3,175 | 91.92 | 5/8/2020 | |
15,000 | 15,000 | 102.85 | 5/21/2021 | |
8,750 | 26,250 | 104.64 | 5/20/2022 | |
— | 35,000 | 103.62 | 5/19/2023 | |
Robert A. Dougherty | 16,200 | — | 43.06 | 5/19/2017 |
12,100 | — | 62.23 | 5/25/2018 | |
13,000 | — | 66.50 | 5/17/2019 | |
8,850 | 2,950 | 91.92 | 5/8/2020 | |
6,000 | 6,000 | 102.85 | 5/21/2021 | |
2,700 | 8,100 | 104.64 | 5/20/2022 | |
— | 10,800 | 103.62 | 5/19/2023 | |
Peter McCausland | 27,500 | — | 66.50 | 5/17/2019 |
17,500 | 17,500 | 91.92 | 5/8/2020 | |
15,000 | 15,000 | 102.85 | 5/21/2021 | |
1,125 | 3,375 | 104.64 | 5/20/2022 | |
125 | 375 | 107.17 | 8/5/2022 | |
— | 20,000 | 103.62 | 5/19/2023 | |
Robert M. McLaughlin | 25,000 | — | 62.23 | 5/25/2018 |
25,000 | — | 66.50 | 5/17/2019 | |
17,025 | 5,675 | 91.92 | 5/8/2020 | |
12,500 | 12,500 | 102.85 | 5/21/2021 | |
5,625 | 16,875 | 104.64 | 5/20/2022 | |
— | 22,500 | 103.62 | 5/19/2023 | |
Michael L. Molinini | 60,000 | — | 43.06 | 5/19/2017 |
40,000 | — | 62.23 | 5/25/2018 | |
40,000 | — | 66.50 | 5/17/2019 | |
60,000 | 20,000 | 91.92 | 5/8/2020 | |
45,000 | 45,000 | 102.85 | 5/21/2021 | |
20,250 | 60,750 | 104.64 | 5/20/2022 | |
— | 81,000 | 103.62 | 5/19/2023 | |
Robert H. Young, Jr. | 13,900 | — | 43.06 | 5/19/2017 |
10,300 | — | 62.23 | 5/25/2018 | |
11,000 | — | 66.50 | 5/17/2019 | |
7,500 | 2,500 | 91.92 | 5/8/2020 | |
6,000 | 6,000 | 102.85 | 5/21/2021 | |
2,700 | 8,100 | 104.64 | 5/20/2022 | |
— | 10,800 | 103.62 | 5/19/2023 | |
(1) | The stock options listed above vest in 25% increments per year over four years. Stock options granted to the named executive officers have eight-year terms, subject to earlier termination or expiration in the event of termination of service or as otherwise set forth in the 2006 Equity Plan. |
58
Option Exercises During the 2016 Fiscal Year
Option Awards | ||
Name | Number of Shares Acquired on Exercise | Value Realized on Exercise ($) |
Andrew R. Cichocki | 25,500 | 1,866,127 |
Robert A. Dougherty | 12,000 | 738,608 |
Peter McCausland | — | — |
Robert M. McLaughlin | 29,000 | 1,829,924 |
Michael L. Molinini | 30,000 | 2,414,505 |
Robert H. Young, Jr. | 12,000 | 971,640 |
Equity Compensation Plan Information
The following table sets forth information as of March 31, 2016 with respect to the shares of our common stock that may be issued upon the exercise of options, warrants and rights under our equity compensation plans which were approved by our stockholders.
Plan Category | (a) Number of securities to be issued upon exercise of outstanding options, warrants and rights | (b) Weighted-average exercise price of outstanding options, warrants and rights | (c) Number of securities remaining available for future issuance under equity compensation plans (excluding securities reflected in column (a)) |
Equity compensation plans approved by security holders (1)(2) | |||
Employee Stock Purchase Plan | — | — | 901,017 |
2006 Equity Plan | 5,064,340 | 87.08 | 2,266,518 |
Equity compensation plans not approved by security holders | — | — | — |
Total | 5,064,340 | 87.08 | 3,167,535 |
____________________
(1) | The Employee Stock Purchase Plan, which was approved by our stockholders at the 2003 Annual Meeting of Stockholders and as amended and restated was approved at our 2006 Annual Meeting of Stockholders and as further amended and restated was approved at our 2010 Annual Meeting of Stockholders, encourages and assists employees in acquiring an equity interest in Airgas by allowing eligible employees to purchase common stock at a discount. The Employee Stock Purchase Plan was suspended in fiscal year 2016 in accordance with the terms of the Merger Agreement. |
(2) | The 2006 Equity Plan, which was approved by our stockholders at our 2006 Annual Meeting of Stockholders and as amended and restated was approved at our 2009 Annual Meeting of Stockholders, and as further amended and restated was approved at our 2012 Annual Meeting. As of March 31, 2016, only stock options have been granted under the 2006 Equity Plan. |
Nonqualified Deferred Compensation for the 2016 Fiscal Year
The Deferred Compensation Plan I is a nonqualified, unfunded plan. In May 2004, our Board authorized the termination of the plan for new participants and the discontinuance of further deferrals by existing participants after May 31, 2004. The Deferred Compensation Plan I provided employees the opportunity to defer base salary and all or any portion of their annual bonus. Amounts deferred are unsecured, but earn a return equal to the performance of selected mutual funds. All named executive officers were eligible, but only Mr. Molinini held a balance in the Deferred Compensation Plan I during the 2016 fiscal year.
The Deferred Compensation Plan II is a nonqualified, unfunded plan available for contribution since July 1, 2006. The Deferred Compensation Plan II provides employees the opportunity to defer base salary and all or any portion of their annual bonus. Amounts deferred are unsecured, but earn a return equal to the performance of selected mutual funds and a choice to track Airgas common stock. There are no Airgas contributions to the Deferred Compensation Plan II. The purpose of the salary and bonus deferral program is to provide “highly compensated” employees with a convenient and efficient opportunity to save for retirement or other future events, such as college expenses, while deferring applicable income taxes until withdrawal. All named executive officers were eligible, but none participated in the Deferred Compensation Plan II during the 2016 fiscal year.
59
Name | Executive Contributions in FY 2016 ($) | Registrant Contributions in FY 2016 ($) | Aggregate Earnings (Loss) in FY 2016 ($)(1) | Aggregate Withdrawals/ Distributions in FY 2016 ($) | Aggregate Balance at 3/31/16 ($) |
Andrew R. Cichocki | — | — | — | — | — |
Robert A. Dougherty | — | — | — | — | — |
Peter McCausland | — | — | — | — | — |
Robert M. McLaughlin | — | — | — | — | — |
Michael L. Molinini | — | — | (43,488) | — | 890,550 |
Robert H. Young, Jr. | — | — | — | — | — |
____________________
(1) | Reflects earnings (loss) on balances in the Deferred Compensation Plan I and the Deferred Compensation Plan II. Earnings are from tracking the results of mutual funds and a fund tracking Airgas common stock as selected by the named executive officer from the fund choices offered in each plan. |
Potential Payments upon Termination
Mr. McCausland is eligible to receive benefits in the event his employment is terminated (1) by Airgas without cause, (2) upon his retirement, disability or death or (3) in certain circumstances following a change in control. The amount of benefits will vary based on the reason for the termination. Our other named executive officers, and certain other officers, are eligible to receive benefits in the event their employment is terminated (1) by Airgas due to relocation or elimination of the officer’s position, (2) upon their retirement, disability or death or (3) in certain circumstances following a change in control.
The following sections present calculations as of March 31, 2016 of the estimated benefits our named executive officers would receive in these situations. Although the calculations are intended to provide reasonable estimates of the potential benefits, they are based on numerous assumptions and may not represent the actual amount a named executive officer would receive if an eligible termination event were to occur.
In addition to the amounts disclosed in the following sections, each named executive officer would retain the amounts which he has earned or accrued over the course of his employment prior to the termination event, such as the named executive officer’s balances under our deferred compensation plans, accrued retirement benefits and previously vested stock options. For further information about previously earned and accrued amounts, see the tables entitled “Summary Compensation Table for the 2016 Fiscal Year,” “Outstanding Equity Awards at 2016 Fiscal Year-End,” “Option Exercises During the 2016 Fiscal Year” and “Nonqualified Deferred Compensation for the 2016 Fiscal Year.”
Severance Benefits
If the employment of a named executive officer, other than Mr. McCausland, is terminated due to (1) a lack of work, (2) a reorganization of our business, (3) the closing of all or a portion of the named executive officer’s principal workplace or (4) economic conditions, and not as a result of a “change of control,” the named executive officer may be entitled to receive benefits under our Severance Pay Plan. Messrs. Cichocki, Dougherty, McLaughlin, Molinini and Young participate in our severance plan, which is generally available to other employees. Severance-related benefits under the plan are provided only if the participant executes a separation agreement prepared by Airgas, which includes a release of claims in consideration of the payments.
Under Mr. McCausland’s Amended and Restated Executive Severance Agreement, as amended, in the event that Mr. McCausland’s employment is terminated by Airgas for reasons other than “cause,” he would receive a lump-sum payment equal to two times his annual salary that was in effect at the end of his active employment, payments equal to the premium cost that Mr. McCausland would pay at COBRA rates for health and welfare benefits for 36 months following active employment and immediate vesting of all unvested stock options and restricted stock. We have never granted any restricted stock under the 2006 Equity Plan. All stock options held by Mr. McCausland on his termination date would remain exercisable until the option’s expiration date.
The following table presents the estimated separation benefits that would have been required to be paid to Mr. McCausland under the terms of his severance agreement if his employment had been terminated, other than for “cause,” as of March 31, 2016.
Named Executive Officer | Severance Payments ($)(1) | Vesting of Unvested Stock Options ($)(2) | Health & Welfare Benefits ($)(3) | Total ($) |
Peter McCausland | 1,800,000 | 2,350,151 | 55,256 | 4,205,407 |
____________________
(1) | Represents a lump-sum payment equal to two times Mr. McCausland’s annual salary. |
60
(2) | The value of accelerated vesting of stock options is estimated using the in-the-money value as of March 31, 2016, based on a stock price of $141.64. |
(3) | The estimated total cost (using COBRA as an example) to Airgas of medical and dental benefits continued for 36 months, including the cost for dependents if covered under the plans at the time of separation. Actual cost may vary. |
Retirement, Disability and Death
Death or Retirement
To be eligible for retirement, an executive officer must be at least age 65 or have combined age and Airgas service at least equal to 75 years. Messrs. Cichocki, McCausland, Molinini and Young are the named executive officers who are eligible for retirement as of March 31, 2016. In the event of retirement or termination of employment due to death if the executive is eligible for retirement, an executive or his beneficiary is entitled to vesting of an additional year of unvested stock options, and upon termination due to death or retirement, the executive or his or her beneficiary has the right to exercise the vested stock options under the same terms as an active employee (i.e., until the original expiration dates unless terminated earlier under the terms of the applicable equity plan). Additionally, the named executive officer or his or her beneficiary is entitled to the executive’s annual incentive cash bonus award, prorated based upon the number of days the executive was an active employee with Airgas during the fiscal year, on the next bonus payment date. In the event of a named executive officer’s death, his or her beneficiary also would receive payouts under Airgas-funded life insurance policies.
The following table presents the estimated benefits payable, based on death or retirement on March 31, 2016.
Named Executive Officer | Bonus Payment ($)(1) | Vesting of Unvested Stock Options ($)(2) | Total ($) |
Andrew R. Cichocki | 70,000 | 1,105,211 | 1,175,211 |
Robert A. Dougherty | 43,099 | — | 43,099 |
Peter McCausland | 225,000 | 1,397,059 | 1,622,059 |
Robert M. McLaughlin | 61,466 | — | 61,466 |
Michael L. Molinini | 218,875 | 3,386,330 | 3,605,205 |
Robert H. Young, Jr. | 51,905 | 443,224 | 495,129 |
____________________
(1) | Represents the estimated amount of the named executive officer’s prorated bonus for the 2016 calendar year payable in early 2017. Estimate is based on target as actual bonus amount is not calculable as of the date of this report. |
(2) | The value of accelerating the vesting of the next tranche of each stock option is estimated using the in-the-money value as of March 31, 2016, based on a stock price of $141.64. If the termination is due to the death of an executive officer, this amount would only be payable if the executive were eligible for retirement at the time of death. |
Disability
Upon an executive’s termination of employment due to disability, the named executive officer would receive the stock option benefits described above, if the executive is eligible for retirement.
The following table presents the estimated benefits payable upon disability as of March 31, 2016.
Named Executive Officer | Vesting of Unvested Stock Options ($)(1) |
Andrew R. Cichocki | 1,105,211 |
Robert A. Dougherty | — |
Peter McCausland | 1,397,059 |
Robert M. McLaughlin | — |
Michael L. Molinini | 3,386,330 |
Robert H. Young, Jr. | 443,224 |
____________________
(1) | The value of accelerating the vesting of the next tranche of each stock option is estimated using the in-the-money value as of March 31, 2016, based on a stock price of $141.64. |
61
Potential Change of Control Payments
We have agreements with all the named executive officers, which take effect only if a “change of control” occurs. The severance and other benefits payable to the named executive officers under their agreements are due only if (1) there is a change of control and (2) we terminate their employment other than for cause, or if they terminate their employment for good reason within three years following a change of control, commonly referred to as a “Double Trigger.” Good reason includes a material diminution of position, a material decrease in base compensation, a material breach of any employment agreement or a material change in location.
The change of control agreements entitle the executive officers to a lump-sum payment equal to two times their annual base salary prior to the executive’s separation from service or change of control (whichever is greater) plus two times their annual cash incentive bonus last paid to them prior to the change of control. Mr. McCausland also is entitled to a lump-sum payment equal to two times his annual base salary, as described above under “Severance Benefits.” The agreements also accelerate vesting of all outstanding unvested stock options and restricted stock grants and entitle the named executive officer to continuation of health and welfare benefits for up to 36 months. In the aggregate, the benefits under these agreements are capped at 2.99 times the average base compensation as defined in Section 280G of the Code.
A “change of control” is defined in the agreements to include a change in a majority of the Board, consummation of certain mergers and the sale of all or substantially all of Airgas’ assets. The “change of control” definition also includes events in which a party (other than Mr. McCausland) acquires 20% or more of the combined voting power of our then-outstanding securities, or in which Mr. McCausland, together with all affiliates and associates, acquires 30% or more of the combined voting power of our then-outstanding securities.
The following table assumes that each named executive officer is terminated after a change of control for reasons other than cause, retirement, disability or death. These values are estimated as of March 31, 2016.
Named Executive Officer | Severance Payments ($) | Vesting of Unvested Stock Options ($)(2) | Health & Welfare Benefits ($)(3) | Total ($) |
Andrew R. Cichocki | 1,180,128 | 3,041,661 | 63,311 | 4,285,100 |
Robert A. Dougherty | 923,632 | 1,089,730 | 42,143 | 2,055,505 |
Peter McCausland (1) | 4,821,840 | 2,350,151 | 55,256 | 7,227,247 |
Robert M. McLaughlin | 1,317,238 | 2,246,861 | 42,143 | 3,606,242 |
Michael L. Molinini | 2,939,580 | 8,067,320 | 42,143 | 11,049,043 |
Robert H. Young, Jr. | 1,112,336 | 1,067,356 | 63,311 | 2,243,003 |
____________________
(1) | Mr. McCausland would have received the severance payment under his severance agreement (two times his annual base salary) in addition to the severance payment under his change of control agreement (two times his annual base salary plus two times his annual cash incentive bonus last paid to him prior to the change of control). |
(2) | The value of accelerated vesting of stock options is estimated using the in-the-money value as of March 31, 2016, based on a stock price of $141.64. |
(3) | The estimated total cost (using COBRA as an example) to Airgas of medical and dental benefits continued for 36 months, including the cost for dependents if covered under the plans at the time of separation. Actual costs may vary. |
COMPENSATION COMMITTEE INTERLOCKS AND INSIDER PARTICIPATION
No member of our Governance and Compensation Committee has ever been an officer or employee of Airgas. No member of our Governance and Compensation Committee had any relationship with Airgas during fiscal 2016 requiring disclosure under Item 404 of Regulation S-K. None of our executive officers serves, or has served during the past fiscal year, as a member of the board of directors or compensation committee of any other company that has one or more executive officers serving as a member of our Board or Governance and Compensation Committee.
62
ITEM 12. | SECURITY OWNERSHIP OF CERTAIN BENEFICIAL OWNERS AND MANAGEMENT AND RELATED STOCKHOLDER MATTERS. |
Security Ownership
The following table sets forth certain information regarding the beneficial ownership of our common stock as of March 31, 2016 by: (1) each director; (2) each of our named executive officers; (3) all of our directors and current executive officers as a group; and (4) each person, or group of affiliated persons, known by us to beneficially own more than 5% of our common stock. Unless otherwise indicated, the persons or entities identified in the table have sole voting and investment power with respect to all shares shown as beneficially owned by them, subject to applicable community property laws.
Information with respect to beneficial ownership has been furnished by each director and executive officer. With respect to beneficial owners of more than 5% of our common stock, information is based on information filed with the SEC. We have determined beneficial ownership in accordance with the rules of the SEC. These rules generally attribute beneficial ownership of securities to persons who possess sole or shared voting power or investment power with respect to those securities. In addition, the rules require inclusion of shares of common stock issuable pursuant to the exercise of stock options or warrants that are either immediately exercisable or exercisable within 60 days after March 31, 2016, which is May 30, 2016. These shares are deemed to be outstanding and beneficially owned by the person holding the options or warrants for the purpose of computing the percentage ownership of that person, but they are not treated as outstanding for the purpose of computing the percentage ownership of any other person.
Name of Beneficial Owner (1) | Amount and Nature of Beneficial Ownership (2) | Percentage of Shares Outstanding | |
Peter McCausland | 6,066,129 (3)(4)(5)(6) | 8.3 | % |
Bonnie F. McCausland | 5,907,284 (6)(7) | 8.1 | % |
John P. Clancey | 32,182 (3) | * | |
James W. Hovey | 127,915 (3)(8) | * | |
Richard C. Ill | 23,300 (3) | * | |
Ted B. Miller, Jr. | 41,682 (3) | * | |
Paula A. Sneed | 87,123 (3) | * | |
David M. Stout | 80,080 (3) | * | |
Lee M. Thomas | 98,930 (3)(9) | * | |
John C. van Roden, Jr. | 1,870,287 (3)(10)(11) | 2.6 | % |
Ellen C. Wolf | 27,549 (3) | * | |
Andrew R. Cichocki | 195,850 (3)(12) | * | |
Robert A. Dougherty | 77,123 (3)(5) | * | |
Robert M. McLaughlin | 139,531 (3)(5) | * | |
Michael L. Molinini | 401,371 (3)(13) | * | |
Robert H. Young, Jr. | 80,871 (3) | * | |
L’Air Liquide, S.A. 75 quai d’Orsay 75321 Paris Cedex 07 France | 6,735,975 (14) | 9.3 | % |
The Vanguard Group, Inc. 100 Vanguard Blvd. Malvern, PA 19355 | 6,080,621 (15) | 8.4 | % |
All directors and current executive officers as a group (25 persons) | 8,007,837 (3)(4)(5)(6)(8)(9)(10)(11)(12)(13)(16) | 10.8 | % |
____________________
* Less than 1% of our outstanding common stock.
(1) | The address for all of the directors and executive officers set forth above and Mrs. McCausland is c/o Airgas, Inc., 259 North Radnor-Chester Road, Suite 100, Radnor, Pennsylvania 19087. |
(2) | Includes all options and other rights to acquire shares exercisable on or within 60 days of March 31, 2016. |
(3) | Includes the following number of shares of our common stock which may be acquired by certain directors, executive officers and 5% stockholders through the exercise of options that were exercisable as of March 31, 2016 or became |
63
exercisable within 60 days of that date: Mr. McCausland, 92,375 shares; Mr. Clancey, 31,682 shares; Mr. Hovey, 45,182 shares; Mr. Ill, 15,800 shares; Mr. Miller, 31,682 shares; Ms. Sneed, 45,182 shares; Mr. Stout, 45,182 shares; Mr. Thomas, 38,682 shares; Mr. van Roden, 45,182 shares; Ms. Wolf, 20,400 shares; Mr. Cichocki, 104,550 shares; Mr. Dougherty, 70,200 shares; Mr. McLaughlin, 108,325 shares; Mr. Molinini, 348,250 shares; Mr. Young, 62,300 shares; and all directors and current executive officers as a group, 1,498,650 shares.
(4) | Investment and/or voting power with respect to 4,629,535 of such shares are shared with, or under the control of, Mr. McCausland’s spouse, Bonnie McCausland, 1,276,249 shares are held by a charitable foundation of which Mr. McCausland is an officer and director, and 15,700 shares are held in Mr. McCausland’s individual IRA account. |
(5) | Includes the following shares of our common stock held under our 401(k) Plan as of March 31, 2016: Mr. McCausland, 52,270 shares; Mr. Dougherty, 1,225 shares; Mr. McLaughlin, 769 shares; and all executive officers as a group, 67,052 shares. |
(6) | 2,118,045 of such shares, together with other non-Airgas marketable securities, having an approximate aggregate value of $300 million as of March 31, 2016, are pledged as collateral for a $150 million line of credit (which had, on March 31, 2016, an approximate principal balance of approximately $118 million) with a brokerage firm. |
(7) | Investment and/or voting power with respect to 4,629,535 of such shares are shared with, or under the control of, Mrs. McCausland’s spouse, Peter McCausland, 1,276,249 shares are held by a charitable foundation of which Mrs. McCausland is an officer and director, and 1,500 shares are held in Mrs. McCausland’s individual IRA account. |
(8) | Includes 69,240 shares held by an irrevocable defective grantor trust under which he holds voting and dispositive power and 10 shares held in two accounts under the Pennsylvania Uniform Transfer to Minors Act, for which Mr. Hovey is the custodian. |
(9) | Includes 16,250 shares held by a charitable foundation of which Mr. Thomas and his spouse are directors/trustees and over which Mr. Thomas and his spouse share investment and voting power. |
(10) | Includes 3,000 shares owned by a general partnership of which Mr. van Roden is a 0.5% owner and a general partner. |
(11) | Includes 813,020 shares held in two trusts of which Mr. van Roden is a co-trustee; 500,000 shares held by a grantor retained annuity trust of which Mr. McCausland is the settlor and of which Mr. van Roden is a co-trustee; and 500,000 shares held by a grantor retained annuity trust of which Mrs. McCausland is the settlor and of which Mr. van Roden is a co-trustee. |
(12) | Investment and/or voting power with respect to 70,369 of such shares are shared with, or under the control of, Mr. Cichocki’s spouse. |
(13) | 49,159 of such shares are pledged as collateral for a $2,578,000 line of credit in a loan management account (for which, on March 31, 2016, there was no outstanding balance) with a brokerage firm. |
(14) | On December 21, 2015, Air Liquide filed a Schedule 13D/A in connection with entering into the amended and restated voting and support agreement, dated December 17, 2015, with Peter McCausland, Bonnie McCausland and certain other Airgas stockholders identified in the agreement (the “Stockholders”). As a result of entering into the agreement, Air Liquide may be deemed to have acquired beneficial ownership of 6,735,975 shares of our common stock, which are either owned directly by the Stockholders or over which they have the power to vote or dispose. Air Liquide disclaims that it constitutes a “group” (within the meaning of Section 13(d)(3) of the Exchange Act) with any of the Stockholders and, pursuant to Rule 13d-4 under the Exchange Act, disclaims beneficial ownership of any shares of our common stock beneficially owned by the Stockholders or any of their affiliates including, without limitation, the shares of common stock subject to the amended and restated voting and support agreement. |
(15) | Vanguard Fiduciary Trust Company, a wholly-owned subsidiary of The Vanguard Group, Inc. (“VFTC”), Vanguard Investments Australia, Ltd. a wholly-owned subsidiary of The Vanguard Group, Inc. (“VIA”) and The Vanguard Group, Inc. jointly filed a Schedule 13G/A on February 10, 2016. Airgas has relied upon the beneficial ownership disclosed therein in making this disclosure. VFTC is the beneficial owner of 101,147 shares of Airgas common stock as a result of its serving as an investment manager of Vanguard-related collective trust accounts and VIA is the beneficial owner of 47,800 shares of Airgas common stock as a result of its serving as investment manager of Vanguard-related Australian investment offerings. The Vanguard Group, Inc. has sole voting power as to 121,647 shares, shared voting power as to 6,100 shares, sole dispositive power as to 5,952,174 shares and shared dispositive power as to 128,447 shares. |
(16) | In addition to shares pledged by named executive officers and beneficial owners of more than 5% of our common stock, 21,022 of such shares are pledged as collateral for outstanding loans under cash management (margin) accounts with brokerage firms. |
64
Related Stockholder Matters
The information required by Item 201(d) of Regulation S-K regarding the number of securities issuable under equity compensation plans is set forth under “Equity Compensation Plan Information” in Item 11 and is incorporated herein by reference.
65
ITEM 13. | CERTAIN RELATIONSHIPS AND RELATED TRANSACTIONS, AND DIRECTOR INDEPENDENCE. |
Certain Relationships and Related Transactions
Review and Approval of Related Person Transactions
We review all relationships and transactions in which Airgas and our directors and executive officers or their immediate family members are participants to determine whether such persons have a direct or indirect material interest. Our legal staff is primarily responsible for the development and implementation of processes and controls to obtain information from the directors and executive officers with respect to related person transactions and for then determining, based on the facts and circumstances, whether Airgas or a related person has a direct or indirect material interest in the transaction. As required under SEC rules, transactions that are determined to be directly or indirectly material to Airgas or a related person are disclosed in this annual report on Form 10-K. In addition, the Audit Committee reviews and approves or ratifies any related person transaction that is required to be disclosed. In the course of its review and approval or ratification of a disclosable related party transaction, the Committee considers:
• | the nature of the related person’s interest in the transaction; |
• | the material terms of the transaction, including, without limitation, the amount and type of transaction; |
• | the importance of the transaction to the related person; |
• | the importance of the transaction to Airgas; |
• | whether the transaction would impair the judgment of a director or executive officer to act in the best interest of Airgas; and |
• | any other matters the Committee deems appropriate. |
Transactions
Except as discussed below, since the beginning of the 2016 fiscal year, we have not engaged in any transaction or series of similar transactions, or any currently proposed transaction or series of similar transactions, that require disclosure, to which Airgas or any of its subsidiaries was or is to be a participant (1) in which the amount involved exceed $120,000 and (2) in which any of our directors, executive officers or persons known to us to be beneficial owners of more than 5% of our common stock, or members of the immediate families of those individuals, had or will have, a direct or indirect material interest.
We do have business relationships with corporations or other organizations in which a director or executive officer of Airgas may also be a director, executive officer, investor or trustee, or have some other similar direct or indirect relationship with the other corporation or organization. For example, we provide goods and services to, and purchase goods and services from, companies such as Triumph Group, Inc. (of which Richard C. Ill, one of our directors, was President and Chief Executive Officer from April 2015 until January 2016). In all instances, including that described above but excluding the leases described below which were negotiated as part of an acquisition, we enter into these arrangements in the ordinary course of business and each party provides to or receives from the other the relevant goods and services on a non-exclusive basis at arms-length negotiated rates. In addition, none of our directors or officers is directly involved with the negotiation or consummation of any such arrangement, except as described below. While any revenue, profits or other aspects of a business relationship with us may, of course, affect the individual’s overall compensation or value of his or her investments in the other corporation or organization, we do not believe that in any of these cases the relevant director or (except as described below) officer receives or has received any compensation from the other corporation that is directly linked to an Airgas-related business arrangement. Except as described below, none of these arrangements is material to us or to the other corporation or organization involved, and we do not believe that any indirect interest that our directors or officers may have with respect to such an arrangement is material.
In October 2009, in connection with our acquisition of Tri-Gas Technologies (“Tri-Tech”), we entered into leases with four entities, of which the direct or indirect majority owner is John Sheehan, our Division President-South. The leases are for seven branch locations. Pursuant to the leases, Airgas paid a total of approximately $723,000 for the use of the leased premises during fiscal 2016. Except for one lease that was amended in 2010 to extend its term, the terms and conditions of the leases, which terminate in 2019, have not been modified since they were entered into in 2009. Mr. Sheehan had been the majority owner, and served as President and Managing General Partner, of Tri-Tech prior to its acquisition by Airgas. Subsequent to the acquisition, Mr. Sheehan became an employee of Airgas and, in September 2015, he became an executive officer when he was named Division President-South. The board of directors approved the leases at the time of the Tri-Tech acquisition.
66
Board Independence
Board and Committee Independence
The Board of Directors is composed of nine independent outside directors, the Executive Chairman, and the
President and Chief Executive Officer. The committees of the Board are entirely composed of independent outside directors, with the exception of the Executive Committee, of which Mr. McCausland and Mr. Molinini are members. The Board of Directors has determined that the following directors, comprising all of the directors other than the Executive Chairman and the Chief Executive Officer, are “independent” under the listing standards of the NYSE: John P. Clancey; James W. Hovey; Richard C. Ill; Ted B. Miller, Jr.; Paula A. Sneed; David M. Stout; Lee M. Thomas; John C. van Roden, Jr.; and Ellen C. Wolf. In order to assist the Board in making this determination, the Board has adopted “Director Independence Standards”, which are included below under the same heading. These standards identify material relationships that a director may have with Airgas that might interfere with the director’s ability to exercise independent judgment. Each of the directors identified above meets the standards set forth in the Director Independence Standards. In the course of determining the independence of each outside director, the Board considered all transactions, relationships and arrangements, as required by our Director Independence Standards.
Audit Committee and Governance and Compensation Committee Independence
The Board of Directors, in its business judgment, has determined that each of the members of the Audit Committee meets the independence requirements of the SEC and the NYSE. The Audit Committee regularly holds separate executive sessions with (1) Airgas’ independent registered public accounting firm, without management present, (2) our Chief Financial Officer and (3) our Vice President of Internal Audit. The Board has also determined that each of the members of the Governance and Compensation Committee satisfies the independence requirements of the SEC and NYSE for compensation committee members.
Director Independence Standards
No director of Airgas will be considered “independent” unless the board of directors affirmatively determines that the director has no material relationship with the Company (either directly or as a partner, stockholder or officer of an organization that has a relationship with the Company). When making “independence” determinations, the Board broadly considers all relevant facts and circumstances, as well as any other rules, interpretations and considerations of the NYSE, or any rule or regulation of any other regulatory body or self-regulatory body applicable to the Company. The Board has established the following standards, based upon those set forth in the NYSE Listing Standards, to assist it in determining director independence. These standards shall be interpreted in accordance with interpretations of the NYSE Listing Standards.
A director will not be independent if:
• | the director is a current partner or employee of the Company’s independent auditor; |
• | an immediate family member of the director is a current partner of the Company’s independent auditor; or |
• | an immediate family member of the director is a current employee of the Company’s independent auditor and participates in the firm’s audit, assurance or tax compliance (but not tax planning) practice. |
A director will not be independent if within the preceding three years:
• | the director was employed by the Company; |
• | an immediate family member of the director was employed by the Company as an executive officer; |
• | the director, or an immediate family member of the director, received more than $100,000 per year in direct compensation from the Company (other than director’s fees and pension or other forms of deferred compensation for prior service with the Company); |
• | the director was (but is not currently) a partner with or employed by the Company’s independent auditor and worked on the Company’s audit within such three years; |
• | an immediate family member of the director was (but is not currently) a partner with or employed by the Company’s independent auditor and worked on the Company’s audit within such three years; or |
• | an executive officer of the Company was on the compensation committee of the board of directors of a company that employed either the director or an immediate family member of the director as an executive officer. |
None of the following relationships shall disqualify any director from being considered “independent” and such relationships shall be deemed to be immaterial relationships with the Company:
• | a director is a current employee, or a director’s immediate family member is a current executive officer, of another company that has made payments to, or received payments from, the Company for property or services in an amount |
67
which, in any of the last three fiscal years, did not exceed the greater of (a) $1,000,000 or (b) 2% of such other company’s consolidated gross revenues;
• | a director or a director’s immediate family member is an executive officer of another company in which the Company owns a common stock interest, and the amount of the common stock interest is less than 5% of the total shareholders’ equity of the company for which the director serves as an executive officer; or |
• | a director or a director’s immediate family member serves as an officer, director or trustee of a tax exempt organization, and the Company’s contributions to the organization in any single fiscal year are less than the greater of (a) $1,000,000 or (b) 2% of that organization’s gross revenues. |
ITEM 14. | PRINCIPAL ACCOUNTANT FEES AND SERVICES. |
Audit and Non-Audit Fees
The following table shows the fees that we paid to the independent registered public accounting firm for services provided to us during the 2016 and 2015 fiscal years:
2016 | 2015 | ||||||
Audit Fees | $ | 2,959,400 | $ | 2,162,500 | |||
Audit-Related Fees | 345,600 | 211,100 | |||||
Tax Fees | 37,269 | 19,100 | |||||
All Other Fees | — | — | |||||
Audit Fees consist of fees billed for professional services rendered for the audit of our annual consolidated financial statements, the audit of the effectiveness of our internal control over financial reporting and reviews of the consolidated financial statements included in our quarterly report on Forms 10-Q, statutory audits and the “comfort letters” provided in connection with our notes offerings.
Audit-Related Fees consist of services that are reasonably related to the performance of the audit or review of our consolidated financial statements and are not reported under “Audit Fees.” The fees disclosed under this category for the 2016 fiscal year consist of fees primarily for employee benefit plan audits and services associated with the Air Liquide merger. For the 2015 fiscal year, the fees consist of services for employee benefit plan audits and acquisition-related due diligence.
Tax Fees consist of professional services rendered by our independent registered public accounting firm for tax compliance, tax return review and tax advice.
The Audit Committee considered whether the services provided above are compatible with maintaining our independent registered public accounting firm’s independence.
Pre-Approval of Audit and Non-Audit Services
Under the Audit Committee’s audit and non-audit services pre-approval policy, as adopted by the Audit Committee in 2003, the Audit Committee must pre-approve all audit and non-audit services provided by the independent registered public accounting firm. The policy, as described below, sets forth the procedures and conditions for such pre-approval of services to be performed by the independent registered public accounting firm. The policy utilizes both a framework of general pre-approval for certain specified services and specific pre-approval for all other services.
Prior to engagement of the independent registered public accounting firm for the next year’s audit, the Audit Committee is asked to preapprove the engagement of the accounting firm, and the projected fees for audit services and audit-related services (assurance and related services that are reasonably related to the performance of the independent registered public accounting firm’s audit or review of the consolidated financial statements). The fee amounts approved for the audit and audit-related services are updated to the extent necessary at the regularly scheduled meetings of the Audit Committee during the year.
In addition, pursuant to its policy, the Audit Committee has pre-approved certain categories of non-audit services to be performed by the independent registered public accounting firm and an aggregate maximum amount of fees to be paid for such services. The Audit Committee receives updates from management and reviews these services at each of its quarterly meetings. Additional pre-approval is required for any of these services if the fees exceed the originally pre-approved annual aggregate amount. If we desire to engage the independent registered public accounting firm for other services that are not within the pre-approved categories, the Audit Committee must approve such specific engagement as well as the projected fees, prior to the commencement of the services.
In the 2016 fiscal year, there were no fees paid to KPMG LLP under a de minimis exception to the rules that waives pre-approval for certain non-audit services.
PART IV
ITEM 15. | EXHIBITS AND FINANCIAL STATEMENT SCHEDULES. |
(a) The following documents are filed as part of this report:
(1) and (2) The response to this portion of Item 15 is submitted as a separate section of this report beginning on page F-1. All other schedules have been omitted as inapplicable or are not required, or because the required information is included in the consolidated financial statements or accompanying notes.
(3) The exhibits filed as part of this report are listed in the accompanying index.
Exhibit No. | Description |
2.1 | Agreement and Plan of Merger, dated as of November 17, 2015, among Airgas, Inc., L’Air Liquide, S.A. and AL Acquisition Corporation. (Incorporated by reference to Exhibit 2.1 to the Company’s November 19, 2015 Current Report on Form 8-K.) |
3.1 | Amended and Restated Certificate of Incorporation of Airgas, Inc., amended through May 8, 2007. (Incorporated by reference to Exhibit 3.1 to the Company’s March 31, 2012 Annual Report on Form 10-K.) |
3.2 | Airgas, Inc. By-Laws, amended through April 8, 2014. (Incorporated by reference to Exhibit 3.1 to the Company’s April 11, 2014 Current Report on Form 8-K.) |
4.1 | Rights Agreement, dated May 8, 2007, between Airgas, Inc. and The Bank of New York, as Rights Agent, which includes as Exhibits thereto the Form of Certificate of Designation, the Form of Right Certificate and the Summary of Rights attached thereto as Exhibits A, B and C, respectively. (Incorporated by reference to Exhibit 4.1 to the Company’s May 10, 2007 Current Report on Form 8-K.) |
4.2 | Amendment to Rights Plan dated as of November 17, 2015, between Airgas, Inc. and Wells Fargo Bank, N.A. as Rights Agent. (Incorporated by reference to Exhibit 4.1 to the Company’s November 19, 2015 Current Report on Form 8-K.) |
4.3 | Indenture dated May 27, 2010, between Airgas, Inc. and U.S. Bank National Association, as Trustee. (Incorporated by reference to Exhibit 4 to the Company’s Registration Statement on Form S-3 No. 333-167140.) |
4.4 | Second Supplemental Indenture dated June 3, 2011 to the Indenture dated May 27, 2010, between Airgas, Inc. and U.S. Bank National Association, as Trustee, related to the 2.95% Senior Notes due 2016. (Incorporated by reference to Exhibit 4.2 to the Company’s June 3, 2011 Current Report on Form 8-K.) |
4.5 | Third Supplemental Indenture dated November 26, 2012 to the Indenture dated May 27, 2010, between Airgas, Inc. and U.S. Bank National Association, as Trustee, related to the 2.90% Senior Notes due 2022. (Incorporated by reference to Exhibit 4.2 to the Company’s November 26, 2012 Current Report on Form 8-K.) |
4.6 | Fourth Supplemental Indenture dated February 14, 2013 to the Indenture dated May 27, 2010, between Airgas, Inc. and U.S. Bank National Association, as Trustee, related to the 1.65% Senior Notes due 2018 and the 2.375% Senior Notes due 2020. (Incorporated by reference to Exhibit 4.2 to the Company’s February 14, 2013 Current Report on Form 8-K.) |
4.7 | Fifth Supplemental Indenture dated June 17, 2014 to the Indenture dated May 27, 2010, between Airgas, Inc. and U.S. Bank National Association, as Trustee, related to the 3.65% Senior Notes due 2024. (Incorporated by reference to Exhibit 4.2 to the Company’s June 17, 2014 Current Report on Form 8-K.) |
4.8 | Sixth Supplemental Indenture dated August 11, 2015 to the Indenture dated May 27, 2010, between Airgas, Inc. and U.S. Bank National Association, as Trustee, related to the 3.05% Senior Notes due 2020. (Incorporated by reference to Exhibit 4.1 to the Company’s August 11, 2015 Current Report on Form 8-K.) |
4.9 | Second Amended and Restated Credit Agreement, dated as of November 18, 2014, among Airgas, Inc., the subsidiary borrowers referred to therein, Bank of America, N.A. as administrative agent and the lenders party thereto. (Incorporated by reference to Exhibit 10.1 to the Company’s November 20, 2014 Current Report on Form 8-K.) |
There are no other instruments with respect to long-term debt of the Company that involve indebtedness or securities exceeding ten percent of the total assets of the Company and its subsidiaries on a consolidated basis. The Company agrees to file a copy of any instrument or agreement defining the rights of holders of long-term debt of the Company upon request of the Securities and Exchange Commission. | |
68
*10.1 | 1997 Stock Option Plan, as amended through May 7, 2002, and approved by the Company’s stockholders on July 31, 2002. (Incorporated by reference to Exhibit 10.1 to the Company’s June 30, 2002 Quarterly Report on Form 10-Q.) |
*10.2 | 1997 Directors’ Stock Option Plan, as amended through August 4, 2004. (Incorporated by reference to Exhibit 4 to the Company’s Registration Statement on Form S-8 No. 333-117965 dated August 5, 2004.) |
*10.3 | Airgas, Inc. Deferred Compensation Plan dated December 17, 2001. (Incorporated by reference to Exhibit 4 to the Company’s Registration Statement on Form S-8 No. 333-75258 dated December 17, 2001.) |
*10.4 | Amended and Restated Airgas, Inc. Deferred Compensation Plan II dated September 1, 2015. |
*10.5 | First Amendment to the Amended and Restated Airgas, Inc. Deferred Compensation Plan II dated April 5, 2016. |
*10.6 | Airgas, Inc. Executive Bonus Plan. (Incorporated by reference to Exhibit 10.1 to the Company’s January 26, 2016 Current Report on Form 8-K.) |
*10.7 | Airgas, Inc. Management Bonus Plan. (Incorporated by reference to Exhibit 10.1 to the Company’s January 26, 2016 Current Report on Form 8-K.) |
*10.8 | Amended and Restated Change of Control Agreement between Airgas, Inc. and Michael L. Molinini dated December 31, 2008. (Incorporated by reference to Exhibit 10.1 to the Company’s January 7, 2009 Current Report on Form 8-K.) Eight other executive officers and two additional associates are parties to substantially identical agreements in all material respects. |
*10.9 | Amended and Restated Executive Severance Agreement between Airgas, Inc. and Peter McCausland dated May 29, 2009. (Incorporated by reference to Exhibit 10.12 to the Company’s March 31, 2009 Annual Report on Form 10-K.) |
*10.10 | First Amendment to Amended and Restated Executive Severance Agreement between Airgas, Inc. and Peter McCausland dated June 27, 2013. (Incorporated by reference to Exhibit 10.1 to the Company’s June 30, 2013 Quarterly Report on Form 10-Q.) |
*10.11 | Airgas, Inc. Second Amended and Restated 2006 Equity Incentive Plan dated July 2, 2012, and approved by the Company’s stockholders on August 14, 2012. (Incorporated by reference to Exhibit 10.1 to the Company’s August 15, 2012 Current Report on Form 8-K.) |
*10.12 | Amended and Restated Airgas, Inc. 2003 Employee Stock Purchase Plan dated June 18, 2010, and approved by the Company’s stockholders on September 15, 2010. (Incorporated by reference to Exhibit 99.1 to the Company’s September 21, 2010 Current Report on Form 8-K.) |
*10.13 | First Amendment to the Amended and Restated Airgas, Inc. 2003 Employee Stock Purchase Plan dated January 29, 2013. (Incorporated by reference to Exhibit 10.11 to the Company’s March 31, 2014 Annual Report on Form 10-K.) |
*10.14 | Second Amendment to the Amended and Restated Airgas, Inc. 2003 Employee Stock Purchase Plan dated December 31, 2015. |
10.15 | Third Amended and Restated Receivables Purchase Agreement, dated as of March 17, 2010, among Airgas, Inc., as Servicer, Radnor Funding Corp., as Seller, the members of the various purchaser groups from time to time party thereto and the Administrator. (Incorporated by reference to Exhibit 10.1 to the Company’s March 22, 2011 Current Report on Form 8-K.) |
10.16 | First Amendment to the Third Amended and Restated Receivables Purchase Agreement, dated as of March 16, 2011, among Airgas, Inc., as Servicer, Radnor Funding Corp., as Seller, the members of the various purchaser groups from time to time party thereto and the Administrator. (Incorporated by reference to Exhibit 10.2 to the Company’s March 22, 2011 Current Report on Form 8-K.) |
10.17 | Second Amendment to the Third Amended and Restated Receivables Purchase Agreement, dated as of December 21, 2011, among Airgas, Inc., as Servicer, Radnor Funding Corp., as Seller, the members of the various purchaser groups from time to time party thereto and the Administrator. (Incorporated by reference to Exhibit 10.1 to the Company’s December 22, 2011 Current Report on Form 8-K.) |
10.18 | Third Amendment to the Third Amended and Restated Receivables Purchase Agreement, dated as of December 5, 2012, among Airgas, Inc., as Servicer, Radnor Funding Corp., as Seller, the members of the various purchaser groups from time to time party thereto and the Administrator. (Incorporated by reference to Exhibit 10.1 to the Company’s December 6, 2012 Current Report on Form 8-K.) |
69
10.19 | Fourth Amendment to the Third Amended and Restated Receivables Purchase Agreement, dated as of December 5, 2013, among Airgas, Inc., as Servicer, Radnor Funding Corp., as Seller, the members of the various purchaser groups from time to time party thereto and the Administrator. (Incorporated by reference to Exhibit 10.1 to the Company’s December 9, 2013 Current Report on Form 8-K.) |
10.20 | Fifth Amendment to the Third Amended and Restated Receivables Purchase Agreement, dated as of December 5, 2014, among Airgas, Inc., as Servicer, Radnor Funding Corp., as Seller, the members of the various purchaser groups from time to time party thereto and the Administrator. (Incorporated by reference to Exhibit 10.1 to the Company’s December 5, 2014 Current Report on Form 8-K.) |
10.21 | Sixth Amendment and Joinder to the Third Amended and Restated Receivables Purchase Agreement, dated as of July 24, 2015, among Airgas, Inc., as Servicer, Radnor Funding Corp., as Seller, the members of the various purchaser groups from time to time party thereto and the Administrator. (Incorporated by reference to Exhibit 10.1 to the Company’s July 24, 2015 Current Report on Form 8-K.) |
10.22 | Seventh Amendment to the Third Amended and Restated Receivables Purchase Agreement, dated as of December 4, 2015, among Airgas, Inc., as Servicer, Radnor Funding Corp., as Seller, the members of the various purchaser groups from time to time party thereto and the Administrator. (Incorporated by reference to Exhibit 10.1 to the Company’s December 4, 2015 Current Report on Form 8-K.) |
10.23 | Eighth Amendment to the Third Amended and Restated Receivables Purchase Agreement, dated as of March 23, 2016, among Airgas, Inc., as Servicer, Radnor Funding Corp., as Seller, the members of the various purchaser groups from time to time party thereto and the Administrator. (Incorporated by reference to Exhibit 10.1 to the Company’s March 23, 2016 Current Report on Form 8-K.) |
10.24 | Amended and Restated Voting and Support Agreement, dated as of December 17, 2015, by and among L’Air Liquide, S.A. and each stockholder listed on Schedule I thereto. (Incorporated by reference to Exhibit 10.1 to the Company’s December 31, 2015 Quarterly Report on Form 10-Q.) |
12 | Computation of the Ratio of Earnings to Fixed Charges. |
21 | Subsidiaries of the Company. |
23 | Consent of Independent Registered Public Accounting Firm. |
31.1 | Certification of Peter McCausland as Executive Chairman of Airgas, Inc. pursuant to Section 302 of the Sarbanes-Oxley Act of 2002. |
31.2 | Certification of Michael L. Molinini as President and Chief Executive Officer of Airgas, Inc. pursuant to Section 302 of the Sarbanes-Oxley Act of 2002. |
31.3 | Certification of Robert M. McLaughlin as Senior Vice President and Chief Financial Officer of Airgas, Inc. pursuant to Section 302 of the Sarbanes-Oxley Act of 2002. |
32.1 | Certification of Peter McCausland as Executive Chairman of Airgas, Inc. pursuant to 18 U.S.C. Section 1350, as adopted pursuant to Section 906 of the Sarbanes-Oxley Act of 2002. |
32.2 | Certification of Michael L. Molinini as President and Chief Executive Officer of Airgas, Inc. pursuant to 18 U.S.C. Section 1350, as adopted pursuant to Section 906 of the Sarbanes-Oxley Act of 2002. |
32.3 | Certification of Robert M. McLaughlin as Senior Vice President and Chief Financial Officer of Airgas, Inc. pursuant to 18 U.S.C. Section 1350, as adopted pursuant to Section 906 of the Sarbanes-Oxley Act of 2002. |
101.INS | XBRL Instance Document. |
101.SCH | XBRL Taxonomy Extension Schema Document. |
101.CAL | XBRL Taxonomy Extension Calculation Linkbase Document. |
101.DEF | XBRL Taxonomy Definition Linkbase Document. |
101.LAB | XBRL Taxonomy Extension Label Linkbase Document. |
101.PRE | XBRL Taxonomy Extension Presentation Linkbase Document. |
____________________
* | Indicates a management contract or compensatory plan. |
70
SIGNATURES
Pursuant to the requirements of Section 13 or 15(d) of the Securities Exchange Act of 1934, the registrant has duly caused this report to be signed on its behalf by the undersigned, thereunto duly authorized.
Date: May 10, 2016
Airgas, Inc. | |
(Registrant) | |
By: | /S/ PETER McCAUSLAND |
Peter McCausland | |
Executive Chairman | |
By: | /S/ MICHAEL L. MOLININI |
Michael L. Molinini | |
President and Chief Executive Officer | |
71
Pursuant to the requirements of the Securities Exchange Act of 1934, this report has been signed below by the following persons on behalf of the registrant and in the capacities and on the dates indicated.
Signature | Title | Date |
/S/ PETER McCAUSLAND (Peter McCausland) | Executive Chairman (Co-Principal Executive Officer) | May 10, 2016 |
/S/ MICHAEL L. MOLININI (Michael L. Molinini) | Director, President and Chief Executive Officer (Co-Principal Executive Officer) | May 10, 2016 |
/S/ ROBERT M. McLAUGHLIN (Robert M. McLaughlin) | Senior Vice President and Chief Financial Officer (Principal Financial Officer) | May 10, 2016 |
/S/ THOMAS M. SMYTH (Thomas M. Smyth) | Vice President and Controller (Principal Accounting Officer) | May 10, 2016 |
/S/ JOHN P. CLANCEY (John P. Clancey) | Director | May 10, 2016 |
/S/ JAMES W. HOVEY (James W. Hovey) | Director | May 10, 2016 |
/S/ RICHARD C. ILL (Richard C. Ill) | Director | May 10, 2016 |
/S/ TED B. MILLER, JR. (Ted B. Miller, Jr.) | Director | May 10, 2016 |
/S/ PAULA A. SNEED (Paula A. Sneed) | Director | May 10, 2016 |
/S/ DAVID M. STOUT (David M. Stout) | Director | May 10, 2016 |
/S/ LEE M. THOMAS (Lee M. Thomas) | Director | May 10, 2016 |
/S/ JOHN C. VAN RODEN, JR. (John C. van Roden, Jr.) | Director | May 10, 2016 |
/S/ ELLEN C. WOLF (Ellen C. Wolf) | Director | May 10, 2016 |
72
AIRGAS, INC. AND SUBSIDIARIES
INDEX TO CONSOLIDATED FINANCIAL STATEMENTS
AND FINANCIAL STATEMENT SCHEDULE
Page Reference In Annual Report On Form 10-K | |
Financial Statements: | |
Financial Statement Schedule: | |
All other schedules for which provision is made in the applicable accounting regulations promulgated by the Securities and Exchange Commission are not required under the related instructions or are inapplicable and therefore have been omitted.
STATEMENT OF MANAGEMENT’S FINANCIAL RESPONSIBILITY
Management of Airgas, Inc. and subsidiaries (the “Company”) prepared and is responsible for the consolidated financial statements and related financial information in this Annual Report on Form 10-K. The consolidated financial statements are prepared in conformity with U.S. generally accepted accounting principles. The consolidated financial statements reflect management’s informed judgment and estimation as to the effect of events and transactions that are accounted for or disclosed.
Management maintains a system of internal control, which includes internal control over financial reporting, at each business unit. The Company’s system of internal control is designed to provide reasonable assurance that records are maintained in reasonable detail to properly reflect transactions and permit the preparation of financial statements in accordance with U.S. generally accepted accounting principles, that transactions are executed in accordance with management’s and the Board of Directors’ authorization, and that unauthorized transactions are prevented or detected on a timely basis such that they could not materially affect the financial statements. The Company also maintains a staff of internal auditors who review and evaluate the system of internal control on a continual basis. In determining the extent of the system of internal control, management recognizes that the cost should not exceed the benefits derived. The evaluation of these factors requires judgment by management.
Management evaluated the effectiveness of the Company’s internal control over financial reporting as of March 31, 2016, based on criteria established in Internal Control - Integrated Framework (2013) issued by the Committee of Sponsoring Organizations of the Treadway Commission. KPMG LLP, an independent registered public accounting firm, as stated in their report appearing on page F-3, issued their opinion on the effectiveness of the Company’s internal control over financial reporting as of March 31, 2016 and an opinion on the fair presentation of the financial position of the Company as of March 31, 2016 and 2015, and the results of the Company’s operations and cash flows for each of the years in the three-year period ended March 31, 2016.
The Audit Committee of the Board of Directors, consisting solely of independent directors, meets regularly (jointly and separately) with the independent registered public accounting firm, the internal auditors and management to satisfy itself that they are properly discharging their responsibilities. The independent registered public accounting firm has direct access to the Audit Committee.
Airgas, Inc. | Airgas, Inc. | Airgas, Inc. | ||
/s/ PETER McCAUSLAND | /s/ MICHAEL L. MOLININI | /S/ ROBERT M. MCLAUGHLIN | ||
Peter McCausland Executive Chairman | Michael L. Molinini President and Chief Executive Officer | Robert M. McLaughlin Senior Vice President and Chief Financial Officer | ||
May 10, 2016
F-1
MANAGEMENT’S REPORT ON INTERNAL CONTROL OVER FINANCIAL REPORTING
Management of Airgas, Inc. and subsidiaries (the “Company”) is responsible for establishing and maintaining an adequate system of internal control over financial reporting. Under the supervision and with the participation of the Company’s Executive Chairman of the Board, Chief Executive Officer and Chief Financial Officer, management conducted an assessment of the Company’s internal control over financial reporting based on the framework established by the Committee of Sponsoring Organizations of the Treadway Commission in Internal Control - Integrated Framework (2013). Based on this assessment, management concluded that, as of March 31, 2016, the Company’s internal control over financial reporting was effective. KPMG LLP, an independent registered public accounting firm, has issued an audit report on the effectiveness of the Company’s internal control over financial reporting as of March 31, 2016.
Airgas, Inc. | Airgas, Inc. | Airgas, Inc. | ||
/s/ PETER MCCAUSLAND | /s/ MICHAEL L. MOLININI | /S/ ROBERT M. MCLAUGHLIN | ||
Peter McCausland Executive Chairman | Michael L. Molinini President and Chief Executive Officer | Robert M. McLaughlin Senior Vice President and Chief Financial Officer | ||
May 10, 2016
F-2
Report of Independent Registered Public Accounting Firm
The Board of Directors and Stockholders
Airgas, Inc.:
We have audited the accompanying consolidated financial statements of Airgas, Inc. and subsidiaries as listed in the Index to Consolidated Financial Statements and Financial Statement Schedule (Accompanying Index). In connection with our audits of the consolidated financial statements, we also have audited the financial statement schedule as listed in the Accompanying Index. We also have audited Airgas, Inc.’s internal control over financial reporting as of March 31, 2016, based on criteria established in Internal Control - Integrated Framework (2013) issued by the Committee of Sponsoring Organizations of the Treadway Commission (COSO). Airgas, Inc.’s management is responsible for these consolidated financial statements and financial statement schedule, for maintaining effective internal control over financial reporting, and for its assessment of the effectiveness of internal control over financial reporting, included in the accompanying Management’s Report on Internal Control Over Financial Reporting. Our responsibility is to express an opinion on these consolidated financial statements and financial statement schedule and an opinion on the Company’s internal control over financial reporting based on our audits.
We conducted our audits in accordance with the standards of the Public Company Accounting Oversight Board (United States). Those standards require that we plan and perform the audits to obtain reasonable assurance about whether the financial statements are free of material misstatement and whether effective internal control over financial reporting was maintained in all material respects. Our audits of the consolidated financial statements included examining, on a test basis, evidence supporting the amounts and disclosures in the financial statements, assessing the accounting principles used and significant estimates made by management, and evaluating the overall financial statement presentation. Our audit of internal control over financial reporting included obtaining an understanding of internal control over financial reporting, assessing the risk that a material weakness exists, and testing and evaluating the design and operating effectiveness of internal control based on the assessed risk. Our audits also included performing such other procedures as we considered necessary in the circumstances. We believe that our audits provide a reasonable basis for our opinions.
A company’s internal control over financial reporting is a process designed to provide reasonable assurance regarding the reliability of financial reporting and the preparation of financial statements for external purposes in accordance with generally accepted accounting principles. A company’s internal control over financial reporting includes those policies and procedures that (1) pertain to the maintenance of records that, in reasonable detail, accurately and fairly reflect the transactions and dispositions of the assets of the company; (2) provide reasonable assurance that transactions are recorded as necessary to permit preparation of financial statements in accordance with generally accepted accounting principles, and that receipts and expenditures of the company are being made only in accordance with authorizations of management and directors of the company; and (3) provide reasonable assurance regarding prevention or timely detection of unauthorized acquisition, use, or disposition of the company’s assets that could have a material effect on the financial statements.
Because of its inherent limitations, internal control over financial reporting may not prevent or detect misstatements. Also, projections of any evaluation of effectiveness to future periods are subject to the risk that controls may become inadequate because of changes in conditions, or that the degree of compliance with the policies or procedures may deteriorate.
In our opinion, the consolidated financial statements referred to above present fairly, in all material respects, the financial position of Airgas, Inc. and subsidiaries as of March 31, 2016 and 2015, and the results of their operations and their cash flows for each of the years in the three-year period ended March 31, 2016, in conformity with U.S. generally accepted accounting principles. Also in our opinion, the related financial statement schedule, when considered in relation to the basic consolidated financial statements taken as a whole, presents fairly, in all material respects, the information set forth therein. Also in our opinion, Airgas, Inc. maintained, in all material respects, effective internal control over financial reporting as of March 31, 2016, based on criteria established in Internal Control - Integrated Framework (2013) issued by the Committee of Sponsoring Organizations of the Treadway Commission (COSO).
/s/ KPMG LLP
Philadelphia, Pennsylvania
May 10, 2016
F-3
AIRGAS, INC. AND SUBSIDIARIES
CONSOLIDATED STATEMENTS OF EARNINGS
Years Ended March 31, | |||||||||||
(In thousands, except per share amounts) | 2016 | 2015 | 2014 | ||||||||
Net Sales | $ | 5,313,777 | $ | 5,304,885 | $ | 5,072,537 | |||||
Costs and Expenses: | |||||||||||
Cost of products sold (excluding depreciation) | 2,301,598 | 2,355,875 | 2,247,574 | ||||||||
Selling, distribution and administrative expenses | 2,042,754 | 1,978,674 | 1,889,123 | ||||||||
Merger costs and other special charges (Notes 2 and 18) | 35,967 | — | — | ||||||||
Depreciation | 318,552 | 297,710 | 275,461 | ||||||||
Amortization (Note 8) | 34,195 | 31,348 | 29,845 | ||||||||
Total costs and expenses | 4,733,066 | 4,663,607 | 4,442,003 | ||||||||
Operating Income | 580,711 | 641,278 | 630,534 | ||||||||
Interest expense, net (Note 15) | (60,071 | ) | (62,232 | ) | (73,698 | ) | |||||
Loss on the extinguishment of debt (Note 10) | — | — | (9,150 | ) | |||||||
Other income, net | 9,077 | 5,075 | 4,219 | ||||||||
Earnings before income taxes | 529,717 | 584,121 | 551,905 | ||||||||
Income taxes (Note 6) | (192,217 | ) | (216,035 | ) | (201,121 | ) | |||||
Net Earnings | $ | 337,500 | $ | 368,086 | $ | 350,784 | |||||
Net Earnings Per Common Share (Note 16): | |||||||||||
Basic earnings per share | $ | 4.60 | $ | 4.93 | $ | 4.76 | |||||
Diluted earnings per share | $ | 4.54 | $ | 4.85 | $ | 4.68 | |||||
Weighted Average Shares Outstanding: | |||||||||||
Basic | 73,422 | 74,702 | 73,623 | ||||||||
Diluted | 74,377 | 75,851 | 74,910 | ||||||||
See accompanying notes to consolidated financial statements.
F-4
AIRGAS, INC. AND SUBSIDIARIES
CONSOLIDATED STATEMENTS OF COMPREHENSIVE INCOME
Years Ended March 31, | |||||||||||
(In thousands) | 2016 | 2015 | 2014 | ||||||||
Net earnings | $ | 337,500 | $ | 368,086 | $ | 350,784 | |||||
Other comprehensive income (loss), before tax: | |||||||||||
Foreign currency translation adjustments | (3,712 | ) | (15,708 | ) | (4,235 | ) | |||||
Reclassification of hedging loss included in net earnings (Note 11) | 259 | 517 | 517 | ||||||||
Other comprehensive income (loss), before tax | (3,453 | ) | (15,191 | ) | (3,718 | ) | |||||
Net tax expense of other comprehensive income items | (96 | ) | (191 | ) | (191 | ) | |||||
Other comprehensive income (loss), net of tax | (3,549 | ) | (15,382 | ) | (3,909 | ) | |||||
Comprehensive income | $ | 333,951 | $ | 352,704 | $ | 346,875 | |||||
See accompanying notes to consolidated financial statements.
F-5
AIRGAS, INC. AND SUBSIDIARIES
CONSOLIDATED BALANCE SHEETS
(In thousands, except per share amounts) | March 31, 2016 | March 31, 2015 | |||||
ASSETS | |||||||
Current Assets | |||||||
Cash | $ | 55,809 | $ | 50,724 | |||
Trade receivables, less allowances for doubtful accounts of $26,959 and $27,016 at March 31, 2016 and 2015, respectively | 667,399 | 708,227 | |||||
Inventories, net (Note 5) | 459,521 | 474,070 | |||||
Deferred income tax asset, net (Note 6) | 69,908 | 58,072 | |||||
Prepaid expenses and other current assets | 131,561 | 124,591 | |||||
Total current assets | 1,384,198 | 1,415,684 | |||||
Plant and equipment at cost (Note 7) | 5,559,041 | 5,305,059 | |||||
Less accumulated depreciation | (2,468,498 | ) | (2,353,293 | ) | |||
Plant and equipment, net | 3,090,543 | 2,951,766 | |||||
Goodwill (Note 8) | 1,364,770 | 1,313,644 | |||||
Other intangible assets, net (Note 8) | 248,172 | 244,519 | |||||
Other non-current assets | 47,273 | 47,997 | |||||
Total assets | $ | 6,134,956 | $ | 5,973,610 | |||
LIABILITIES AND STOCKHOLDERS’ EQUITY | |||||||
Current Liabilities | |||||||
Accounts payable, trade | $ | 165,781 | $ | 206,187 | |||
Accrued expenses and other current liabilities (Note 9) | 348,688 | 346,879 | |||||
Short-term debt (Note 10) | 383,258 | 325,871 | |||||
Current portion of long-term debt (Note 10) | 250,107 | 250,110 | |||||
Total current liabilities | 1,147,834 | 1,129,047 | |||||
Long-term debt, excluding current portion (Note 10) | 1,954,820 | 1,748,662 | |||||
Deferred income tax liability, net (Note 6) | 894,344 | 854,574 | |||||
Other non-current liabilities | 92,660 | 89,741 | |||||
Commitments and contingencies (Notes 17 and 18) | |||||||
Stockholders’ Equity (Note 13) | |||||||
Preferred stock, 20,030 shares authorized, no shares issued or outstanding at March 31, 2016 and 2015 | — | — | |||||
Common stock, par value $0.01 per share, 200,000 shares authorized, 87,795 and 87,554 shares issued at March 31, 2016 and 2015, respectively | 878 | 876 | |||||
Capital in excess of par value | 914,692 | 853,800 | |||||
Retained earnings | 2,377,843 | 2,231,026 | |||||
Accumulated other comprehensive loss | (18,402 | ) | (14,853 | ) | |||
Treasury stock, 15,151 and 12,197 shares at cost at March 31, 2016 and 2015, respectively | (1,229,713 | ) | (919,263 | ) | |||
Total stockholders’ equity | 2,045,298 | 2,151,586 | |||||
Total liabilities and stockholders’ equity | $ | 6,134,956 | $ | 5,973,610 | |||
See accompanying notes to consolidated financial statements.
F-6
AIRGAS, INC. AND SUBSIDIARIES
CONSOLIDATED STATEMENTS OF STOCKHOLDERS’ EQUITY
Years Ended March 31, 2016, 2015 and 2014 | |||||||||||||||||||||||||||||
(In thousands, except per share amounts) | Shares of Common Stock | Common Stock | Capital in Excess of Par Value | Retained Earnings | Accumulated Other Comprehensive Income (Loss) | Shares of Treasury Stock | Treasury Stock | Total Stockholders’ Equity | |||||||||||||||||||||
Balance - April 1, 2013 | 87,135 | $ | 871 | $ | 729,850 | $ | 1,861,395 | $ | 4,438 | (14,077) | $ | (1,059,571 | ) | $ | 1,536,983 | ||||||||||||||
Net earnings | 350,784 | 350,784 | |||||||||||||||||||||||||||
Foreign currency translation adjustments | (4,235 | ) | (4,235 | ) | |||||||||||||||||||||||||
Reclassification of hedging loss included in net earnings (Note 11) | 517 | 517 | |||||||||||||||||||||||||||
Net tax expense of other comprehensive income items | (191 | ) | (191 | ) | |||||||||||||||||||||||||
Treasury stock reissuances in connection with stock options exercised (Note 14) | — | (22,875 | ) | 813 | 61,185 | 38,310 | |||||||||||||||||||||||
Dividends paid on common stock ($1.92 per share) (Note 13) | (141,461 | ) | (141,461 | ) | |||||||||||||||||||||||||
Excess tax benefit associated with the exercise of stock options | 13,668 | 13,668 | |||||||||||||||||||||||||||
Shares issued in connection with the Employee Stock Purchase Plan (Note 14) | 218 | 3 | 17,310 | 17,313 | |||||||||||||||||||||||||
Stock-based compensation expense (Note 14) | 28,961 | 28,961 | |||||||||||||||||||||||||||
Balance - March 31, 2014 | 87,353 | $ | 874 | $ | 789,789 | $ | 2,047,843 | $ | 529 | (13,264) | $ | (998,386 | ) | $ | 1,840,649 | ||||||||||||||
Net earnings | 368,086 | 368,086 | |||||||||||||||||||||||||||
Foreign currency translation adjustments | (15,708 | ) | (15,708 | ) | |||||||||||||||||||||||||
Reclassification of hedging loss included in net earnings (Note 11) | 517 | 517 | |||||||||||||||||||||||||||
Net tax expense of other comprehensive income items | (191 | ) | (191 | ) | |||||||||||||||||||||||||
Treasury stock reissuances in connection with stock options exercised (Note 14) | (1,368 | ) | (20,386 | ) | 1,026 | 76,033 | 54,279 | ||||||||||||||||||||||
Reissuance of treasury stock for acquisition (Note 4) | 1,368 | 41 | 3,090 | 4,458 | |||||||||||||||||||||||||
Dividends paid on common stock ($2.20 per share) (Note 13) | (164,517 | ) | (164,517 | ) | |||||||||||||||||||||||||
Excess tax benefit associated with the exercise of stock options | 16,045 | 16,045 | |||||||||||||||||||||||||||
Shares issued in connection with the Employee Stock Purchase Plan (Note 14) | 201 | 2 | 17,939 | 17,941 | |||||||||||||||||||||||||
Stock-based compensation expense (Note 14) | 30,027 | 30,027 | |||||||||||||||||||||||||||
Balance - March 31, 2015 | 87,554 | $ | 876 | $ | 853,800 | $ | 2,231,026 | $ | (14,853 | ) | (12,197 | ) | $ | (919,263 | ) | $ | 2,151,586 | ||||||||||||
F-7
AIRGAS, INC. AND SUBSIDIARIES CONSOLIDATED STATEMENTS OF STOCKHOLDERS’ EQUITY - Continued | |||||||||||||||||||||||||||||
Years Ended March 31, 2016, 2015 and 2014 | |||||||||||||||||||||||||||||
(In thousands, except per share amounts) | Shares of Common Stock | Common Stock | Capital in Excess of Par Value | Retained Earnings | Accumulated Other Comprehensive Income (Loss) | Shares of Treasury Stock | Treasury Stock | Total Stockholders’ Equity | |||||||||||||||||||||
Net earnings | 337,500 | 337,500 | |||||||||||||||||||||||||||
Foreign currency translation adjustments | (3,712 | ) | (3,712 | ) | |||||||||||||||||||||||||
Reclassification of hedging loss included in net earnings (Note 11) | 259 | 259 | |||||||||||||||||||||||||||
Net tax expense of other comprehensive income items | (96 | ) | (96 | ) | |||||||||||||||||||||||||
Treasury stock reissuances in connection with stock options exercised (Note 14) | — | (15,299 | ) | 810 | 64,256 | 48,957 | |||||||||||||||||||||||
Dividends paid on common stock ($2.40 per share) (Note 13) | (175,384 | ) | (175,384 | ) | |||||||||||||||||||||||||
Excess tax benefit associated with the exercise of stock options | 13,522 | 13,522 | |||||||||||||||||||||||||||
Shares issued in connection with the Employee Stock Purchase Plan (Note 14) | 241 | 2 | 19,613 | 19,615 | |||||||||||||||||||||||||
Stock-based compensation expense (Note 14) | 27,757 | 27,757 | |||||||||||||||||||||||||||
Purchase of treasury stock (Note 13) | (3,764 | ) | (374,706 | ) | (374,706 | ) | |||||||||||||||||||||||
Balance - March 31, 2016 | 87,795 | $ | 878 | $ | 914,692 | $ | 2,377,843 | $ | (18,402 | ) | (15,151 | ) | $ | (1,229,713 | ) | $ | 2,045,298 | ||||||||||||
See accompanying notes to consolidated financial statements.
F-8
AIRGAS, INC. AND SUBSIDIARIES
CONSOLIDATED STATEMENTS OF CASH FLOWS
Years Ended March 31, | |||||||||||
(In thousands) | 2016 | 2015 | 2014 | ||||||||
CASH FLOWS FROM OPERATING ACTIVITIES | |||||||||||
Net earnings | $ | 337,500 | $ | 368,086 | $ | 350,784 | |||||
Adjustments to reconcile net earnings to net cash provided by operating activities: | |||||||||||
Depreciation | 318,552 | 297,710 | 275,461 | ||||||||
Amortization | 34,195 | 31,348 | 29,845 | ||||||||
Deferred income taxes | 27,190 | 32,841 | (6,869 | ) | |||||||
Gain on sales of plant and equipment | (5,033 | ) | (3,137 | ) | (1,264 | ) | |||||
Stock-based compensation expense | 27,757 | 30,027 | 28,961 | ||||||||
Loss on the extinguishment of debt | — | — | 9,150 | ||||||||
Changes in assets and liabilities, excluding effects of business acquisitions and divestitures: | |||||||||||
Trade receivables, net | 42,867 | (925 | ) | 20,030 | |||||||
Inventories, net | 18,983 | 5,091 | 2,291 | ||||||||
Prepaid expenses and other current assets | (8,753 | ) | (31,935 | ) | 41,408 | ||||||
Accounts payable, trade | (42,852 | ) | 4,954 | 4,732 | |||||||
Accrued expenses and other current liabilities | (3,590 | ) | (3,377 | ) | (4,463 | ) | |||||
Other, net | (2,881 | ) | (12,646 | ) | (5,206 | ) | |||||
Net cash provided by operating activities | 743,935 | 718,037 | 744,860 | ||||||||
CASH FLOWS FROM INVESTING ACTIVITIES | |||||||||||
Capital expenditures | (456,899 | ) | (468,789 | ) | (354,587 | ) | |||||
Proceeds from sales of plant and equipment | 25,521 | 23,083 | 15,483 | ||||||||
Business acquisitions and holdback settlements | (101,704 | ) | (51,382 | ) | (203,529 | ) | |||||
Other, net | 2,556 | 325 | (951 | ) | |||||||
Net cash used in investing activities | (530,526 | ) | (496,763 | ) | (543,584 | ) | |||||
CASH FLOWS FROM FINANCING ACTIVITIES | |||||||||||
Net increase (decrease) in short-term debt | 55,756 | (62,776 | ) | 387,352 | |||||||
Proceeds from borrowings of long-term debt | 472,659 | 317,423 | 135,861 | ||||||||
Repayment of long-term debt | (266,414 | ) | (415,907 | ) | (636,587 | ) | |||||
Financing costs | (3,311 | ) | (5,445 | ) | — | ||||||
Premium paid on redemption of senior subordinated notes | — | — | (7,676 | ) | |||||||
Purchase of treasury stock | (374,706 | ) | — | (8,127 | ) | ||||||
Proceeds from the exercise of stock options | 49,521 | 54,280 | 38,310 | ||||||||
Stock issued for the Employee Stock Purchase Plan | 19,615 | 17,940 | 17,313 | ||||||||
Excess tax benefit realized from the exercise of stock options | 13,522 | 16,045 | 13,668 | ||||||||
Dividends paid to stockholders | (175,384 | ) | (164,517 | ) | (141,461 | ) | |||||
Change in cash overdraft and other | 418 | 2,846 | (16,754 | ) | |||||||
Net cash used in financing activities | (208,324 | ) | (240,111 | ) | (218,101 | ) | |||||
Change in cash | $ | 5,085 | $ | (18,837 | ) | $ | (16,825 | ) | |||
Cash – Beginning of period | 50,724 | 69,561 | 86,386 | ||||||||
Cash – End of period | $ | 55,809 | $ | 50,724 | $ | 69,561 | |||||
For supplemental cash flow disclosures, see Note 21.
See accompanying notes to consolidated financial statements.
F-9
(1) SUMMARY OF SIGNIFICANT ACCOUNTING POLICIES
(a) Description of the Business
Airgas, Inc., together with its subsidiaries (“Airgas” or the “Company”), became a publicly traded company on the New York Stock Exchange in 1986. Since its inception, the Company has made approximately 480 acquisitions to become one of the nation’s leading suppliers of industrial, medical and specialty gases, and hardgoods, such as welding equipment and related products. Airgas is a leading U.S. producer of atmospheric gases, carbon dioxide, dry ice and nitrous oxide, one of the largest U.S. suppliers of safety products, and a leading U.S. supplier of refrigerants, ammonia products and process chemicals. The Company markets its products and services through multiple sales channels, including branch-based sales representatives, retail stores, strategic customer account programs, telesales, catalogs, e-Business and independent distributors. Approximately 17,000 associates work in more than 1,100 locations, including branches, retail stores, gas fill plants, specialty gas labs, production facilities and distribution centers.
(b) Basis of Presentation
The consolidated financial statements include the accounts of Airgas, Inc. and its subsidiaries. Intercompany accounts and transactions are eliminated in consolidation.
The Company has made estimates and assumptions relating to the reporting of assets and liabilities and disclosure of contingent assets and liabilities to prepare these consolidated financial statements in conformity with U.S. generally accepted accounting principles (“GAAP”). Estimates are used for, but not limited to, determining the net carrying value of trade receivables, inventories, plant and equipment, goodwill, other intangible assets, asset retirement obligations, business and health insurance reserves, loss contingencies and deferred tax assets. Actual results could differ from those estimates.
(c) Cash and Cash Overdraft
On a daily basis, available funds are swept from depository accounts into a concentration account and used to repay borrowings under the Company’s commercial paper program. Cash principally represents the balance of customer checks that have not yet cleared through the banking system and become available to be swept into the concentration account, and deposits made subsequent to the daily cash sweep. The Company does not fund its disbursement accounts for checks it has written until the checks are presented to the bank for payment. Cash overdrafts represent the balance of outstanding checks and are classified with other current liabilities. There are no compensating balance requirements or other restrictions on the transfer of cash associated with the Company’s depository accounts.
(d) Allowance for Doubtful Accounts
The Company maintains an allowance for doubtful accounts, which includes sales returns, sales allowances and bad debts. The allowance adjusts the carrying value of trade receivables for the estimate of accounts that will ultimately not be collected. An allowance for doubtful accounts is generally established as trade receivables age beyond their due dates, whether as bad debts or as sales returns and allowances. As past due balances age, higher valuation allowances are established, thereby lowering the net carrying value of receivables. The amount of valuation allowance established for each past-due period reflects the Company’s historical collections experience, including that related to sales returns and allowances, as well as current economic conditions and trends. The Company also qualitatively establishes valuation allowances for specific problem accounts and bankruptcies, and other accounts that the Company deems relevant for specifically identified allowances. The amounts ultimately collected on past due trade receivables are subject to numerous factors including general economic conditions, the condition of the receivable portfolios assumed in acquisitions, the financial condition of individual customers and the terms of reorganization for accounts exiting bankruptcy. Changes in these conditions impact the Company’s collection experience and may result in the recognition of higher or lower valuation allowances.
(e) Inventories
Inventories are stated at the lower of cost or net realizable value. Cost is determined using the first-in, first-out (“FIFO”) and average-cost methods. Substantially all of the inventories are finished goods.
F-10
AIRGAS, INC. AND SUBSIDIARIES
NOTES TO CONSOLIDATED FINANCIAL STATEMENTS—(Continued)
(f) Plant and Equipment
Plant and equipment are initially stated at cost. Long-lived assets, including plant and equipment, are reviewed for impairment whenever events or changes in circumstances indicate that the recorded values cannot be recovered from the undiscounted future cash flows. For impairment testing purposes, long-lived assets are grouped with other assets and liabilities at the lowest level for which independent identifiable cash flows are determinable. When the book value of an asset or group of assets exceeds the associated undiscounted expected future cash flows, it is considered to be potentially impaired and is written down to fair value, which is determined based on either discounted future cash flows or appraised values. The Company also leases property, plant and equipment, principally under operating leases. Rent expense for operating leases, which may have escalating rentals or rent holidays, is recorded on a straight-line basis over the respective lease terms.
The Company determines depreciation expense using the straight-line method based on the estimated useful lives of the related assets. The Company uses accelerated depreciation methods for tax purposes where appropriate. Depreciation expense is recognized on the Company’s plant and equipment in the consolidated statement of earnings line item “Depreciation.”
The Company capitalizes the interest cost associated with the development and construction of significant new plant and equipment and depreciates that amount over the lives of the related assets. Capitalized interest recorded for construction in progress during each of the years in the three-year period ended March 31, 2016 was not material.
(g) Computer Software
The Company capitalizes certain costs incurred to purchase or develop computer software for internal use. These costs include purchased software packages, payments to vendors and consultants for the development, implementation or modification of purchased software packages for Company use, payroll and related costs for employees associated with internal-use software projects, interest costs incurred in developing software for internal use, and software costs that allow for access or conversion of old data by new internal-use software. Capitalized computer software costs are included within plant and equipment on the Company’s consolidated balance sheets and depreciated over the estimated useful life of the computer software, which is generally three to ten years.
(h) Goodwill and Other Intangible Assets
Goodwill is an asset representing the future economic benefits arising from other assets acquired in a business combination that are not individually identified and separately recognized. The Company is required to test goodwill associated with each of its reporting units for impairment at least annually and whenever events or circumstances indicate that it is more likely than not that goodwill may be impaired. The Company performs its annual goodwill impairment test as of October 31 of each year.
Other intangible assets primarily consist of non-competition agreements and customer relationships resulting from business acquisitions. Both non-competition agreements and customer relationships are recorded based on their acquisition date fair values. Non-competition agreements are amortized using the straight-line method over the respective terms of the agreements. Customer relationships are amortized using the straight-line method over their estimated useful lives, which range from seven to 25 years. The determination of the estimated benefit periods associated with customer relationships is based on an analysis of historical customer sales attrition information and other customer-related factors at the date of acquisition. There are no expected residual values related to the Company’s other intangible assets.
The Company evaluates the estimated benefit periods and recoverability of its other intangible assets when facts and circumstances indicate that the lives may not be appropriate and/or the carrying values of the asset group containing other intangible assets may not be recoverable through the projected undiscounted future cash flows of the group. If the carrying value of the asset group containing other intangible assets is not recoverable, impairment is measured as the amount by which the carrying value exceeds its estimated fair value. Fair value is determined using discounted cash flows or other techniques.
(i) Deferred Financing Costs
Financing costs related to the issuance of long-term debt are deferred and included in prepaid expenses and other current assets or in other non-current assets, depending upon the classification of the debt to which the costs relate. Deferred financing costs are amortized as interest expense over the term of the related debt instrument.
F-11
AIRGAS, INC. AND SUBSIDIARIES
NOTES TO CONSOLIDATED FINANCIAL STATEMENTS—(Continued)
(j) Asset Retirement Obligations
The fair value of a liability for an asset retirement obligation is recognized in the period during which the asset is placed in service. The fair value of the liability is estimated using projected discounted cash flows. In subsequent periods, the retirement obligation is accreted to its future value, which is the estimate of the obligation at the asset retirement date. When the asset is placed in service, a corresponding retirement asset equal to the fair value of the retirement obligation is also recorded as part of the carrying amount of the related long-lived asset and depreciated over the asset’s useful life. The majority of the Company’s asset retirement obligations are related to the restoration costs associated with returning plant and bulk tank sites to their original condition upon termination of long-term leases or supply agreements. The Company’s asset retirement obligations totaled $22.8 million and $20.4 million at March 31, 2016 and 2015, respectively, and are reflected within other non-current liabilities on the Company’s consolidated balance sheets.
(k) Loss Contingencies
Liabilities for loss contingencies arising from claims, assessments, litigation and other sources are recorded when it is probable that a liability has been incurred and the amount of the claim, assessment or damages can be reasonably estimated.
The Company maintains business insurance programs with deductible limits, which cover workers’ compensation, business automobile and general liability claims. The Company accrues estimated losses using actuarial models and assumptions based on historical loss experience. The actuarial calculations used to estimate business insurance reserves are based on numerous assumptions, some of which are subjective. The Company will adjust its business insurance reserves, if necessary, in the event future loss experience differs from historical loss patterns.
(l) Income Taxes
Income taxes are accounted for under the asset and liability method. Deferred tax assets and liabilities are recognized for the future tax consequences attributable to differences between the financial statement carrying amounts of assets and liabilities and their respective tax bases, and operating loss carryforwards. Deferred tax assets and liabilities are measured using enacted tax rates expected to apply to taxable income in the years in which those temporary differences and operating loss carryforwards are expected to be recovered, settled or utilized. The effect on deferred tax assets and liabilities of a change in tax rates is recognized in income in the period that includes the enactment date. Valuation allowances are recorded to reduce deferred tax assets when it is more likely than not that a tax benefit will not be realized.
The Company recognizes the benefit of an income tax position only if it is more likely than not (greater than 50%) that the tax position will be sustained upon tax examination, based solely on the technical merits of the tax position. Otherwise, no benefit is recognized. The tax benefits recognized are measured based on the largest benefit that has a greater than 50% likelihood of being realized upon ultimate settlement. Additionally, the Company accrues interest and related penalties, if applicable, on all tax exposures for which reserves have been established consistent with jurisdictional tax laws. Interest and penalties are classified as income tax expense in the consolidated statements of earnings.
(m) Foreign Currency Translation
The functional currency of the Company’s foreign operations is the applicable local currency. The translation of foreign currencies into U.S. dollars is performed for balance sheet accounts using current exchange rates in effect at the balance sheet date and for revenue and expense accounts using average exchange rates during each reporting period. The gains or losses resulting from such translations are included in stockholders’ equity as a component of accumulated other comprehensive loss. Gains and losses arising from foreign currency transactions are reflected in the consolidated statements of earnings as incurred.
(n) Treasury Stock
The Company records repurchases of its common stock for treasury at cost. Upon the reissuance of the Company’s common stock from treasury, differences between the proceeds from reissuance and the average cost of the treasury stock are credited or charged to capital in excess of par value to the extent of prior credits related to the reissuance of treasury stock. If no such credits exist, the differences are charged to retained earnings.
(o) Concentrations of Credit Risk
Financial instruments that potentially subject the Company to concentrations of credit risk consist principally of trade receivables. Concentrations of credit risk are limited due to the Company’s large number of customers and their dispersion across many industries primarily throughout North America. Credit terms granted to customers are generally net 30 days.
F-12
AIRGAS, INC. AND SUBSIDIARIES
NOTES TO CONSOLIDATED FINANCIAL STATEMENTS—(Continued)
(p) Derivative Instruments and Hedging Activities
The Company manages its exposure to changes in market interest rates through the occasional use of interest rate derivative instruments, when deemed appropriate. The Company’s involvement with derivative instruments has been limited to interest rate swap and treasury rate lock agreements used to manage well-defined interest rate risk exposures. An interest rate swap is a contractual exchange of interest payments between two parties. A standard interest rate swap involves the payment of a fixed rate times a notional amount by one party in exchange for receiving a floating rate times the same notional amount from the other party. As interest rates change, the difference to be paid or received is accrued and recognized as interest expense or income over the life of the agreement. Treasury rate lock agreements are used to fix the interest rate related to forecasted debt issuances. Interest rate swap and treasury rate lock agreements are not entered into for trading purposes.
When the Company has derivative instruments outstanding, it monitors its positions as well as the credit ratings of its counterparties, including the potential for non-performance by the counterparties. The Company recognizes outstanding derivative instruments as either assets or liabilities at fair value on the consolidated balance sheet. Interest rate contracts have traditionally been designated as hedges and recorded at fair value, with changes in fair value recognized in either accumulated other comprehensive income or in the carrying value of the hedged portions of fixed-rate debt, as applicable. Gains and losses on derivative instruments representing hedge ineffectiveness were recognized immediately in the respective year’s earnings.
(q) Revenue Recognition
Revenue from sales of gases and hardgoods products is recognized when the product is shipped, the sales price is fixed or determinable and collectability is reasonably assured. Rental fees on cylinders, cryogenic liquid containers, bulk gas storage tanks and other equipment are recognized when earned. For contracts that contain multiple deliverables, principally product supply agreements for gases and container rental, revenue is recognized for each deliverable as a separate unit of accounting, with selling prices derived from Company specific or third-party evidence. For cylinder lease agreements in which rental fees are collected in advance, revenues are deferred and recognized over the respective terms of the lease agreements. Amounts billed for sales tax, value added tax or other transactional taxes imposed on revenue-producing transactions are presented on a net basis and are not recognized as revenue.
(r) Cost of Products Sold (Excluding Depreciation)
Cost of products sold (excluding depreciation) for the Distribution business segment includes the cost of direct materials, freight-in and maintenance costs associated with cylinders, cryogenic liquid containers and bulk tanks. Cost of products sold (excluding depreciation) related to gases produced by the Company’s air separation facilities includes direct manufacturing expenses, such as direct labor, power and overhead.
Cost of products sold (excluding depreciation) for the All Other Operations business segment principally consists of direct material costs, freight-in and direct manufacturing expenses, such as direct labor, power and overhead.
(s) Selling, Distribution and Administrative Expenses
Selling, distribution and administrative expenses consist of labor and overhead associated with the purchasing, marketing and distribution of the Company’s products, as well as costs associated with a variety of administrative functions such as legal, treasury, accounting and tax, and facility-related expenses.
(t) Shipping and Handling Fees and Distribution Costs
The Company recognizes delivery and freight charges to customers as elements of net sales. Costs of third-party freight-in are recognized as cost of products sold (excluding depreciation). The majority of the costs associated with the distribution of the Company’s products, which include labor and overhead associated with filling, warehousing and delivery by Company and third-party vehicles, are reflected in selling, distribution and administrative expenses and were $918 million, $889 million and $850 million for the fiscal years ended March 31, 2016, 2015 and 2014, respectively. The Company conducts multiple operations out of the same facilities and does not allocate facility-related expenses to each operational function. Accordingly, there is no facility-related expense in the distribution costs disclosed above. Depreciation expense associated with the Company’s delivery fleet of $33 million, $32 million and $32 million was recognized in depreciation for the fiscal years ended March 31, 2016, 2015 and 2014, respectively.
F-13
AIRGAS, INC. AND SUBSIDIARIES
NOTES TO CONSOLIDATED FINANCIAL STATEMENTS—(Continued)
(u) Stock-based Compensation
The Company grants stock-based compensation awards in connection with its equity incentive and employee stock purchase plans. Stock-based compensation expense is generally recognized on a straight-line basis over the stated vesting period for each award, with accelerated vesting for retirement-eligible employees in accordance with the provisions of the equity incentive plan. See Note 14 for additional disclosures relating to stock-based compensation.
(2) MERGER AGREEMENT
On November 17, 2015, the Company announced that it had entered into a definitive agreement for the acquisition of the Company by L’Air Liquide, S.A. (“Air Liquide”) in a merger pursuant to an Agreement and Plan of Merger, dated as of November 17, 2015, by and among the Company, Air Liquide and AL Acquisition Corporation (“Merger Sub”), an indirect wholly owned subsidiary of Air Liquide (the “Merger Agreement”). The Merger Agreement provides that, among other things and subject to the terms and conditions thereof, Merger Sub will be merged with and into the Company (the “Merger”) with the Company continuing as the surviving corporation in the Merger as an indirect wholly owned subsidiary of Air Liquide. As consideration for the Merger, each outstanding share of common stock of the Company, par value $0.01 (the “Common Stock”), will automatically be converted into the right to receive $143 in cash at the effective time of the Merger (the “Effective Time”), excluding treasury stock owned by the Company or shares owned by Air Liquide or any of its subsidiaries, which will be canceled.
The closing of the Merger is subject to customary closing conditions, including the adoption of the Merger Agreement by the affirmative vote of the holders of at least a majority of all outstanding shares of Common Stock, which occurred on February 23, 2016, and the receipt of antitrust approval, which is yet to be received.
In connection with the Merger, the Company has incurred $29 million of merger-related costs during fiscal 2016, primarily consisting of legal, advisory and other professional fees in connection with the Merger. These costs are included in the “Merger costs and other special charges” line item of the Company’s consolidated statement of earnings.
(3) ACCOUNTING AND DISCLOSURE CHANGES
In April 2014, the Financial Accounting Standards Board (“FASB”) issued new guidance on the reporting of discontinued operations. The new guidance limits the presentation of discontinued operations to disposals that represent a strategic shift with a major effect on an entity’s operations and financial results. In contrast, many disposals under previous standards, which may have been more routine in nature and not changed an entity’s strategy, were reported in discontinued operations. The new guidance also requires disclosures around both disposals qualifying for discontinued operations as well as significant disposals that are not considered discontinued operations. The Company adopted the new guidance effective April 1, 2015. The guidance did not have an impact on the Company’s consolidated financial statements and related disclosures upon adoption.
In July 2015, the FASB issued new guidance that changes the measurement principle for inventory from the lower of cost or market to the lower of cost or net realizable value. The amendments in this guidance do not apply to inventory that is measured using last-in, first-out (“LIFO”) or the retail inventory method; rather, the amendments apply to all other inventory, which includes inventory that is measured using first-in, first-out (“FIFO”) or average cost. Within the scope of this new guidance, an entity should measure inventory at the lower of cost or net realizable value. Net realizable value is defined as the estimated selling prices in the ordinary course of business, less reasonably predictable costs of completion, disposal and transportation, which is consistent with existing GAAP. The Company early adopted the new guidance effective July 1, 2015. The guidance did not have a material impact on the Company’s consolidated financial statements and related disclosures upon adoption.
In September 2015, the FASB issued new guidance simplifying the accounting for measurement-period adjustments with respect to business combinations. The amendments in this guidance eliminate the requirement for an acquirer to retrospectively account for adjustments that occur to provisional amounts recognized at the acquisition date during the measurement period following an acquisition. The new guidance requires that an acquirer recognize adjustments to provisional amounts identified during the measurement period in the reporting period in which the adjustment amounts are determined, with disclosure of the amounts recognized in the current period that would have been recognized in prior reporting periods based on the date of the acquisition. The Company early adopted the new guidance effective September 30, 2015. The guidance did not have a material impact on the Company’s consolidated financial statements and related disclosures upon adoption.
In May 2014, the FASB issued new guidance on the accounting for revenue from contracts with customers, which requires an entity to recognize the amount of revenue to which it expects to be entitled for the transfer of promised goods or services to customers. The new guidance will replace most existing GAAP revenue recognition guidance when it becomes effective. In August 2015, the FASB deferred the effective date of the new guidance by one year to December 15, 2017 for
F-14
AIRGAS, INC. AND SUBSIDIARIES
NOTES TO CONSOLIDATED FINANCIAL STATEMENTS—(Continued)
annual reporting periods beginning after that date and permitted early adoption of the standard, but not before the original effective date of December 15, 2016. With the deferral, the new standard is effective for the Company for annual and interim reporting periods beginning on April 1, 2018, with early adoption permitted one year prior. The standard permits the use of either the retrospective or cumulative effect transition method. The Company is evaluating the transition method alternatives and the effect that the new guidance will have on its consolidated financial statements and related disclosures.
In February 2015, the FASB issued new guidance changing the analysis that a reporting entity must perform to determine whether it should consolidate certain types of legal entities. The new guidance changes the way reporting enterprises evaluate whether (a) they should consolidate limited partnerships and similar entities, (b) fees paid to a decision maker or service provider are variable interests in a variable interest entity (“VIE”), and (c) variable interests in a VIE held by related parties of the reporting enterprise require the reporting enterprise to consolidate the VIE. The Company adopted the new guidance effective April 1, 2016. The guidance did not impact the Company’s consolidated financial statements upon adoption.
In April 2015, the FASB issued new guidance simplifying the financial statement presentation of debt issuance costs. The new guidance specifies that debt issuance costs related to a recognized term debt obligation shall be presented in the balance sheet as a direct deduction from the carrying amount of that debt liability, consistent with debt discounts. The existing recognition and measurement guidance for debt issuance costs is not affected by the new guidance. In August 2015, the FASB issued a clarification that debt issuance costs related to line-of-credit arrangements can continue to be reflected as deferred assets in the balance sheet consistent with existing GAAP, or can be presented net of the associated debt obligations. The Company adopted the new guidance effective April 1, 2016 and will apply the guidance on a retrospective basis in its future financial statements. The adoption of the new guidance did not have a material impact on the Company’s consolidated financial statements.
In April 2015, the FASB issued new guidance on customer’s accounting for fees paid in a cloud computing arrangement. The amendments to existing GAAP provide guidance to customers about whether a cloud computing arrangement includes a software license. The new guidance clarifies that if a cloud computing arrangement includes a software license, the customer should account for the software license element of the arrangement consistent with the acquisition of other software licenses. If the arrangement does not include a software license, the customer should account for the arrangement as a service contract. The Company adopted the new guidance effective April 1, 2016 on a prospective basis. The new guidance may be applied either prospectively to all arrangements entered into or materially modified after the effective date, or on a retrospective basis. The adoption of the new guidance did not have a material impact on the Company’s consolidated financial statements.
In November 2015, the FASB issued new guidance simplifying the balance sheet classification of deferred taxes. The new guidance requires that deferred tax liabilities and assets be classified as noncurrent in a classified statement of financial position. The current requirement that deferred tax liabilities and assets of a tax-paying component of an entity be offset and presented as a single amount is not affected by the new guidance. The new guidance is effective for the Company on April 1, 2017, with early adoption permitted as of the beginning of an interim or annual reporting period. The new guidance may be applied either prospectively to all deferred tax liabilities and assets or retrospectively to all periods presented. The Company is evaluating the impact that the new guidance will have on its consolidated financial statements and related disclosures.
In January 2016, the FASB issued new guidance related to the recognition and measurement of financial assets and liabilities. The new guidance makes targeted improvements to GAAP impacting equity investments (other than those accounted for under the equity method or consolidated), financial liabilities accounted for under the fair value election, and presentation and disclosure requirements for financial instruments, among other changes. The new guidance is effective for the Company on April 1, 2018, with early adoption prohibited other than for certain provisions. The Company is evaluating the impact that the new guidance will have on its consolidated financial statements and related disclosures.
In February 2016, the FASB issued new guidance related to the recognition of lease assets and lease liabilities. The new guidance requires lessees to recognize almost all leases on their balance sheet as a right-of-use asset and a lease liability, other than leases that meet the definition of a short- term lease, and requires expanded disclosures about leasing arrangements. The recognition, measurement, and presentation of expenses and cash flows arising from a lease by a lessee have not significantly changed from the current guidance. Lessor accounting is similar to the current guidance, but updated to align with certain changes to the lessee model and the new revenue recognition standard. The new guidance is effective for the Company on April 1, 2019, with early adoption permitted. The Company is evaluating the impact that the new guidance will have on its consolidated financial statements and related disclosures.
F-15
AIRGAS, INC. AND SUBSIDIARIES
NOTES TO CONSOLIDATED FINANCIAL STATEMENTS—(Continued)
In March 2016, the FASB issued new guidance that includes targeted improvements to the accounting for employee stock-based compensation. The updates in the guidance include changes in the income tax consequences, balance sheet classification and cash flow statement reporting of stock-based payment transactions. The new guidance will impact the Company’s accounting for awards under its equity incentive plan (see Note 14). Among other changes, excess tax benefits that are currently recognized as part of stockholders’ equity will impact income tax expense in the statement of earnings under the new guidance, and will also be classified with other income tax cash flows in operating activities in the statement of cash flows rather than as currently reported in financing activities. The new guidance is effective for the Company on April 1, 2017, with early adoption permitted. The Company is evaluating the impact that the new guidance will have on its consolidated financial statements and related disclosures.
(4) ACQUISITIONS
Acquisitions are recorded using the acquisition method of accounting and accordingly, results of their operations are included in the Company’s consolidated financial statements from the effective date of each respective acquisition. The Company negotiates the respective purchase prices of acquired businesses based on the expected cash flows to be derived from their operations after integration into the Company’s existing distribution, production and service networks. The acquisition purchase price for each business is allocated based on the fair values of the assets acquired and liabilities assumed. Management estimates the fair values of acquired intangible assets other than goodwill using the income approach (i.e. discounted cash flows), and plant and equipment using either the cost or market approach, depending on the type of fixed asset.
Fiscal 2016
During fiscal 2016, the Company acquired 18 businesses with historical annual sales of approximately $85 million. Transaction and other integration costs incurred in fiscal 2016 were $2.3 million and were included in selling, distribution and administrative expenses in the Company’s consolidated statement of earnings. These acquisitions contributed approximately $45 million in net sales in fiscal 2016.
Purchase price allocations for certain businesses most recently acquired during fiscal 2016 are primarily based on provisional fair values and are subject to revision as the Company finalizes appraisals and other analyses. Final determination of the fair values may result in further adjustments to the values presented below. The following table summarizes the consideration transferred and the estimated fair values of the assets acquired and liabilities assumed for fiscal 2016 acquisitions, as well as adjustments to finalize the valuations of certain prior year acquisitions. Valuation adjustments related to prior year acquisitions were not significant.
(In thousands) | Distribution Business Segment | All Other Operations Business Segment | Total | ||||||||
Consideration | |||||||||||
Cash (a) | $ | 58,018 | $ | 44,014 | $ | 102,032 | |||||
Recognized amounts of identifiable assets acquired and liabilities assumed | |||||||||||
Current assets, net | $ | 8,532 | $ | 2,228 | $ | 10,760 | |||||
Plant and equipment | 11,701 | 13,246 | 24,947 | ||||||||
Other intangible assets | 24,057 | 12,769 | 36,826 | ||||||||
Current liabilities | (7,216 | ) | (4,247 | ) | (11,463 | ) | |||||
Non-current liabilities | (3,856 | ) | (3,997 | ) | (7,853 | ) | |||||
Total identifiable net assets | 33,218 | 19,999 | 53,217 | ||||||||
Goodwill | 24,800 | 24,015 | 48,815 | ||||||||
$ | 58,018 | $ | 44,014 | $ | 102,032 | ||||||
____________________
(a) | Includes cash paid, net of cash acquired, for current year acquisitions as well as payments for the settlement of holdback liabilities and contingent consideration arrangements associated with prior year acquisitions. |
F-16
AIRGAS, INC. AND SUBSIDIARIES
NOTES TO CONSOLIDATED FINANCIAL STATEMENTS—(Continued)
The fair value of trade receivables acquired with fiscal 2016 acquisitions was $6.1 million, with gross contractual amounts receivable of $6.9 million. Goodwill associated with fiscal 2016 acquisitions was $48.6 million, of which $44.4 million is deductible for income tax purposes. Goodwill largely consists of expected synergies resulting from the acquisitions, including increased distribution density and enhanced capabilities that will facilitate the sale of industrial, medical and specialty gases, and related supplies, the addition of businesses that offer products and services complementary to the Company’s existing portfolio, and enhanced geographical coverage abroad to strengthen the Company’s welder and generator rental business. Other intangible assets related to fiscal 2016 acquisitions represent customer relationships and non-competition agreements and amounted to $29.3 million and $7.6 million, respectively. See Note 8 for further information on goodwill and other intangible assets.
Pro Forma Operating Results
The following table provides unaudited pro forma results of operations for fiscal 2016 and 2015, as if fiscal 2016 acquisitions had occurred on April 1, 2014. The pro forma results were prepared from financial information obtained from the sellers of the businesses, as well as information obtained during the due diligence process associated with the acquisitions. The unaudited pro forma results reflect certain adjustments related to the acquisitions, such as increased depreciation and amortization expense resulting from the stepped-up basis to fair value of assets acquired and adjustments to reflect the Company’s borrowing and tax rates. The pro forma operating results do not include any anticipated synergies related to combining the businesses. Accordingly, such pro forma operating results were prepared for comparative purposes only and do not purport to be indicative of what would have occurred had the acquisitions been made as of April 1, 2014 or of results that may occur in the future.
Unaudited | |||||||
Years Ended March 31, | |||||||
(In thousands, except per share amounts) | 2016 | 2015 | |||||
Net sales | $ | 5,335,812 | $ | 5,388,313 | |||
Net earnings | 338,408 | 372,975 | |||||
Diluted earnings per share | $ | 4.55 | $ | 4.92 | |||
Fiscal 2015
During fiscal 2015, the Company acquired 14 businesses with historical annual sales of approximately $55 million. Transaction and other integration costs incurred in fiscal 2015 were $1.7 million and were included in selling, distribution and administrative expenses in the Company’s consolidated statement of earnings. These acquisitions contributed approximately $27 million in net sales in fiscal 2015.
The following table summarizes, as of March 31, 2015, the consideration transferred and the estimated fair values of the assets acquired and liabilities assumed for fiscal 2015 acquisitions, as well as adjustments to finalize the valuations of certain prior year acquisitions. Valuation adjustments related to prior year acquisitions were not significant.
F-17
AIRGAS, INC. AND SUBSIDIARIES
NOTES TO CONSOLIDATED FINANCIAL STATEMENTS—(Continued)
(In thousands) | Distribution Business Segment | All Other Operations Business Segment | Total | ||||||||
Consideration | |||||||||||
Cash (a) | $ | 50,774 | $ | 1,053 | $ | 51,827 | |||||
Airgas, Inc. common stock (b) | 4,458 | — | 4,458 | ||||||||
Fair value of total consideration transferred | $ | 55,232 | $ | 1,053 | $ | 56,285 | |||||
Recognized amounts of identifiable assets acquired and liabilities assumed | |||||||||||
Current assets, net | $ | 9,705 | $ | 3 | $ | 9,708 | |||||
Plant and equipment | 13,824 | — | 13,824 | ||||||||
Other intangible assets | 15,122 | 1,040 | 16,162 | ||||||||
Current liabilities | (5,765 | ) | (50 | ) | (5,815 | ) | |||||
Non-current liabilities | (4,526 | ) | — | (4,526 | ) | ||||||
Total identifiable net assets | 28,360 | 993 | 29,353 | ||||||||
Goodwill | 26,872 | 60 | 26,932 | ||||||||
$ | 55,232 | $ | 1,053 | $ | 56,285 | ||||||
__________________
(a) | Includes cash paid, net of cash acquired, for current year acquisitions as well as payments for the settlement of holdback liabilities and contingent consideration arrangements associated with prior year acquisitions. |
(b) | Represents 41,060 shares of Airgas, Inc. common stock issued in connection with a single acquisition. The fair value of the shares issued as part of the consideration for the acquisition was determined based on the closing sales price of Airgas, Inc. common stock on the acquisition date. |
The fair value of trade receivables acquired with fiscal 2015 acquisitions was $6.2 million, with gross contractual amounts receivable of $7.0 million. Goodwill associated with fiscal 2015 acquisitions was $25.1 million, of which $20.9 million is deductible for income tax purposes. Goodwill largely consists of expected synergies resulting from the acquisitions, including increased distribution density and enhanced capabilities that will facilitate the sale of industrial, medical and specialty gases and related supplies. Other intangible assets related to fiscal 2015 acquisitions represent customer relationships and non-competition agreements, and amounted to $11.3 million and $4.8 million, respectively.
Pro Forma Operating Results
The following table provides unaudited pro forma results of operations for fiscal 2015 and 2014, as if fiscal 2015 acquisitions had occurred on April 1, 2013. The pro forma operating results were prepared for comparative purposes only and do not purport to be indicative of what would have occurred had the acquisitions been made as of April 1, 2013 or of results that may occur in the future.
Unaudited | |||||||
Years Ended March 31, | |||||||
(In thousands, except per share amounts) | 2015 | 2014 | |||||
Net sales | $ | 5,327,458 | $ | 5,123,949 | |||
Net earnings | 368,305 | 351,941 | |||||
Diluted earnings per share | $ | 4.86 | $ | 4.70 | |||
Fiscal 2014
During fiscal 2014, the Company acquired eleven businesses with historical annual sales of approximately $82 million.The largest of these businesses was The Encompass Gas Group, Inc. (“Encompass”), headquartered in Rockford, Illinois. With eleven locations in Illinois, Wisconsin, and Iowa, Encompass was one of the largest privately-owned suppliers of industrial, medical, and specialty gases and related hardgoods in the United States, generating approximately $55 million in sales in calendar 2012. Transaction and other integration costs incurred in fiscal 2014 were $1.5 million and were included in selling, distribution and administrative expenses in the Company’s consolidated statement of earnings. These acquisitions contributed approximately $33 million in net sales in fiscal 2014.
F-18
AIRGAS, INC. AND SUBSIDIARIES
NOTES TO CONSOLIDATED FINANCIAL STATEMENTS—(Continued)
The following table summarizes, as of March 31, 2014, the consideration transferred and the estimated fair values of the assets acquired and liabilities assumed for fiscal 2014 acquisitions, as well as adjustments to finalize the valuations of certain prior year acquisitions. Valuation adjustments related to prior year acquisitions were not significant.
(In thousands) | Distribution Business Segment | All Other Operations Business Segment | Total | ||||||||
Consideration | |||||||||||
Cash (a) | $ | 204,957 | $ | 413 | $ | 205,370 | |||||
Recognized amounts of identifiable assets acquired and liabilities assumed | |||||||||||
Current assets, net | $ | 14,631 | $ | 9 | $ | 14,640 | |||||
Plant and equipment | 48,919 | (746 | ) | 48,173 | |||||||
Other intangible assets | 60,190 | — | 60,190 | ||||||||
Current liabilities | (6,088 | ) | 1,366 | (4,722 | ) | ||||||
Non-current liabilities | (8,321 | ) | — | (8,321 | ) | ||||||
Total identifiable net assets | 109,331 | 629 | 109,960 | ||||||||
Goodwill | 95,626 | (216 | ) | 95,410 | |||||||
$ | 204,957 | $ | 413 | $ | 205,370 | ||||||
________________
(a) | Includes cash paid, net of cash acquired, for current year acquisitions as well as payments for the settlement of holdback liabilities and contingent consideration arrangements associated with prior year acquisitions. |
The fair value of trade receivables acquired with fiscal 2014 acquisitions was $8.9 million, with gross contractual amounts receivable of $9.4 million. Goodwill associated with fiscal 2014 acquisitions was $93.3 million, of which $89.7 million is deductible for income tax purposes. Goodwill largely consists of expected synergies resulting from the acquisitions, including the expansion of geographical coverage that will facilitate the sale of industrial, medical and specialty gases and related supplies. Other intangible assets related to fiscal 2014 acquisitions represent customer relationships and non-competition agreements, and amounted to $55.8 million and $4.3 million, respectively.
(5) INVENTORIES, NET
Inventories, net, consist of:
(In thousands) | March 31, 2016 | March 31, 2015 | |||||
Hardgoods | $ | 309,897 | $ | 311,453 | |||
Gases | 149,624 | 162,617 | |||||
$ | 459,521 | $ | 474,070 | ||||
(6) INCOME TAXES
Earnings before income taxes were derived from the following sources:
Years Ended March 31, | |||||||||||
(In thousands) | 2016 | 2015 | 2014 | ||||||||
United States | $ | 527,100 | $ | 572,182 | $ | 539,063 | |||||
Foreign | 2,617 | 11,939 | 12,842 | ||||||||
$ | 529,717 | $ | 584,121 | $ | 551,905 | ||||||
F-19
AIRGAS, INC. AND SUBSIDIARIES
NOTES TO CONSOLIDATED FINANCIAL STATEMENTS—(Continued)
Income tax expense consists of:
Years Ended March 31, | |||||||||||
(In thousands) | 2016 | 2015 | 2014 | ||||||||
Current: | |||||||||||
Federal | $ | 148,585 | $ | 163,774 | $ | 184,308 | |||||
Foreign | 1,029 | 2,010 | 4,561 | ||||||||
State | 15,413 | 17,410 | 19,121 | ||||||||
165,027 | 183,194 | 207,990 | |||||||||
Deferred: | |||||||||||
Federal | 30,792 | 24,499 | (4,722 | ) | |||||||
Foreign | (197 | ) | 2,604 | (1,127 | ) | ||||||
State | (3,405 | ) | 5,738 | (1,020 | ) | ||||||
27,190 | 32,841 | (6,869 | ) | ||||||||
$ | 192,217 | $ | 216,035 | $ | 201,121 | ||||||
Significant differences between taxes computed at the federal statutory rate and the provision for income taxes were:
Years Ended March 31, | ||||||||
2016 | 2015 | 2014 | ||||||
Taxes at U.S. federal statutory rate | 35.0 | % | 35.0 | % | 35.0 | % | ||
Increase (decrease) in income taxes resulting from: | ||||||||
State income taxes, net of federal benefit | 1.5 | % | 2.6 | % | 2.1 | % | ||
Domestic production activities deduction | (1.2 | )% | (1.0 | )% | (1.0 | )% | ||
Other, net | 1.0 | % | 0.4 | % | 0.3 | % | ||
36.3 | % | 37.0 | % | 36.4 | % | |||
The tax effects of cumulative temporary differences and carryforwards that gave rise to the significant portions of the deferred tax assets and liabilities were as follows:
March 31, | |||||||
(In thousands) | 2016 | 2015 | |||||
Deferred Tax Assets: | |||||||
Inventories | $ | 25,936 | $ | 27,697 | |||
Deferred rental income | 17,670 | 17,986 | |||||
Insurance reserves | 12,410 | 14,157 | |||||
Litigation settlement and other reserves | 2,330 | 3,132 | |||||
Asset retirement obligations | 8,279 | 7,553 | |||||
Stock-based compensation | 36,357 | 33,538 | |||||
Other | 35,787 | 19,876 | |||||
Net operating loss carryforwards | 11,070 | 12,061 | |||||
Valuation allowance | (1,141 | ) | (671 | ) | |||
148,698 | 135,329 | ||||||
Deferred Tax Liabilities: | |||||||
Plant and equipment | (732,503 | ) | (711,840 | ) | |||
Intangible assets | (227,809 | ) | (207,690 | ) | |||
Other | (12,822 | ) | (12,301 | ) | |||
(973,134 | ) | (931,831 | ) | ||||
Net deferred tax liability | $ | (824,436 | ) | $ | (796,502 | ) | |
F-20
AIRGAS, INC. AND SUBSIDIARIES
NOTES TO CONSOLIDATED FINANCIAL STATEMENTS—(Continued)
Current deferred tax assets and current deferred tax liabilities have been netted for presentation purposes. Non-current deferred tax assets and non-current deferred tax liabilities have also been netted. Deferred tax assets and liabilities are reflected in the Company’s consolidated balance sheets as follows:
March 31, | |||||||
(In thousands) | 2016 | 2015 | |||||
Current deferred income tax asset, net | $ | 69,908 | $ | 58,072 | |||
Non-current deferred income tax liability, net | (894,344 | ) | (854,574 | ) | |||
Net deferred tax liability | $ | (824,436 | ) | $ | (796,502 | ) | |
The Company has recorded tax benefits amounting to $13.5 million, $16.0 million and $13.7 million in the years ended March 31, 2016, 2015 and 2014, respectively, resulting from the exercise of stock options. This benefit has been recorded in capital in excess of par value.
The Company has recorded deferred tax assets related to the expected future tax benefits of net operating losses of $11.1 million and $12.1 million as of March 31, 2016 and 2015, respectively. State net operating loss carryforwards expire at various times through 2036. Foreign net operating losses are available to offset future income taxes over an indefinite period.
U.S. income taxes have not been provided on approximately $97 million of undistributed earnings of non-U.S. subsidiaries because it is the Company’s intention to continue to reinvest these earnings in those subsidiaries to support their growth. Due to the timing and circumstances of repatriation of such earnings, if any, it is not practicable to determine the unrecognized deferred tax liability relating to such amounts.
As of March 31, 2016, the Company has unrecognized state tax benefits of approximately $20.9 million, which were recorded in other non-current liabilities, and a related $8.3 million of federal tax assets associated with those state tax benefits recorded in non-current deferred tax assets. If recognized, all of the unrecognized tax benefits and related interest and penalties would reduce tax expense. The Company does not anticipate significant changes in the amount of unrecognized income tax benefits over the next year.
A reconciliation of the beginning and ending amount of unrecognized net income tax benefits, including penalties associated with uncertain tax positions, is as follows:
March 31, | |||||||
(In thousands) | 2016 | 2015 | |||||
Beginning unrecognized net income tax benefits | $ | 20,983 | $ | 18,224 | |||
Additions for current year tax positions | 3,845 | 3,565 | |||||
Additions for tax positions of prior years | 187 | 1,288 | |||||
Reductions for tax positions of prior years | (3,306 | ) | (1,646 | ) | |||
Reductions for settlements with taxing authorities | — | (234 | ) | ||||
Reductions as a result of expiration of applicable statutes of limitations | (787 | ) | (214 | ) | |||
Ending unrecognized net income tax benefits | $ | 20,922 | $ | 20,983 | |||
Interest and penalties recognized for the years ended March 31, 2016, 2015 and 2014 were classified as income tax expense in the Company’s consolidated statements of earnings and were not material. Consistent with past practice, the Company will continue to record interest and penalties associated with uncertain tax positions in income tax expense. The Company had approximately $3.8 million and $4.7 million for the payment of interest and penalties accrued at March 31, 2016 and 2015, respectively.
The Company files income tax returns in the United States and foreign jurisdictions. The Company also files income tax returns in every state which imposes corporate income tax. The Company is not under examination by the IRS or in any significant foreign, state or local tax jurisdictions. With limited exceptions, the Company is no longer subject to U.S. federal, state and local, or foreign income tax examinations by tax authorities for years before fiscal 2012.
F-21
AIRGAS, INC. AND SUBSIDIARIES
NOTES TO CONSOLIDATED FINANCIAL STATEMENTS—(Continued)
(7) PLANT AND EQUIPMENT
The major classes of plant and equipment, at cost, are as follows:
March 31, | |||||||||
Depreciable Lives (Yrs) | 2016 | 2015 | |||||||
(In thousands) | |||||||||
Land and land improvements | — | $ | 246,820 | $ | 225,721 | ||||
Buildings and improvements | 25 | 634,816 | 581,076 | ||||||
Cylinders | 30 | 1,504,566 | 1,461,600 | ||||||
Bulk tank stations | 10 to 30 (Average 17) | 846,344 | 789,881 | ||||||
Rental equipment | 2 to 10 | 496,383 | 466,833 | ||||||
Machinery and equipment | 7 to 10 | 1,057,142 | 988,857 | ||||||
Computers, furniture and fixtures | 3 to 10 | 296,408 | 338,316 | ||||||
Transportation equipment | 3 to 15 | 366,221 | 369,034 | ||||||
Construction in progress | — | 110,341 | 83,741 | ||||||
$ | 5,559,041 | $ | 5,305,059 | ||||||
(8) GOODWILL AND OTHER INTANGIBLE ASSETS
Goodwill
Goodwill is an asset representing the future economic benefits arising from other assets acquired in a business combination that are not individually identified and separately recognized. The valuations of assets acquired and liabilities assumed from certain recent acquisitions are based on preliminary estimates of fair value and are subject to revision as the Company finalizes appraisals and other analysis. Changes in the carrying amount of goodwill by business segment for fiscal 2016 and 2015 were as follows:
(In thousands) | Distribution Business Segment | All Other Operations Business Segment | Total | ||||||||
Balance at March 31, 2014 | $ | 1,092,728 | $ | 197,168 | $ | 1,289,896 | |||||
Acquisitions (a) | 26,872 | 60 | 26,932 | ||||||||
Other adjustments, including foreign currency translation | (3,031 | ) | (153 | ) | (3,184 | ) | |||||
Balance at March 31, 2015 | 1,116,569 | 197,075 | 1,313,644 | ||||||||
Acquisitions (a) | 24,800 | 24,015 | 48,815 | ||||||||
Other adjustments, including foreign currency translation | 2,337 | (26 | ) | 2,311 | |||||||
Balance at March 31, 2016 | $ | 1,143,706 | $ | 221,064 | $ | 1,364,770 | |||||
____________________
(a) | Includes acquisitions completed during the respective year and adjustments made to prior year acquisitions. |
Annual Test for Goodwill Impairment
The Company is required to test goodwill associated with each of its reporting units for impairment at least annually and whenever events or circumstances indicate that it is more likely than not that goodwill may be impaired. The Company performs its annual goodwill impairment test as of October 31 of each year. At October 31, 2015, the Company had 21 reporting units in the Distribution business segment and 6 reporting units in the All Other Operations business segment, each of which constitutes an operating segment for purposes of the Company’s segment reporting.
F-22
AIRGAS, INC. AND SUBSIDIARIES
NOTES TO CONSOLIDATED FINANCIAL STATEMENTS—(Continued)
GAAP provides that prior to performing the traditional two-step goodwill impairment test, the Company is permitted to first perform a qualitative assessment about the likelihood of the carrying value of a reporting unit exceeding its fair value, referred to as the “Step 0” assessment. The Step 0 assessment requires the evaluation of certain events and circumstances such as macroeconomic conditions, industry and market considerations, cost factors and overall financial performance, as well as company and reporting unit-specific items. After performing the Step 0 assessment, should the Company determine that it is more likely than not that the fair value of a reporting unit is less than its carrying amount, it is required to perform the prescribed two-step goodwill impairment test to identify the potential goodwill impairment and measure the amount of the goodwill impairment loss, if any, to be recognized for that reporting unit. However, if the Company concludes otherwise based on the Step 0 assessment, the two-step goodwill impairment test is not required. The Step 0 assessment can be applied to none, some or all of the Company’s reporting units in any period, and the Company may also bypass the Step 0 assessment for any reporting unit in any period and proceed directly to performing the first step of the two-step goodwill impairment test for the given reporting unit.
For the October 31, 2015 goodwill impairment test, the Company bypassed the option to perform the Step 0 assessment for all of its reporting units as a periodic refresh of its reporting units’ fair values from the application of the qualitative Step 0 assessment in prior years. The determination to proceed to the first step of the two-step goodwill impairment test at October 31, 2015 was based on an evaluation of relevant events and circumstances, including the length of time since the Company’s most recent calculation of the fair value of its reporting units. The fair values of the Company’s reporting units evaluated using the qualitative Step 0 assessment in the prior year were all substantially in excess of their respective carrying amounts in the Company’s prior Step 1 analysis.
The Company determined the estimated fair value of each of its reporting units as of October 31, 2015 using a discounted cash flow model and compared those values to the carrying value of each of the respective reporting units. Significant assumptions used in the cash flow model include sales growth rates and profit margins based on specific reporting unit business plan, future capital expenditures, working capital needs, and discount and perpetual growth rates. The discount rates used to estimate the fair value of the individual reporting unit exceeded the Company’s weighted average cost of capital as a whole, as the discount rate used for this purpose assigns a higher risk premium to the smaller individual reporting units. The perpetual growth rate assumed in the discounted cash flow model was in line with the long-term growth rate as measured by the U.S. Gross Domestic Product and the industry’s long-term rate of growth. In addition to Company and reporting unit-specific growth targets, general economic conditions, the long-term economic outlook for the U.S. economy, and market conditions affecting borrowing costs and returns on equity all influence the estimated fair value of each of the Company’s reporting units. The Company’s methodology used for valuing its reporting units for the purpose of its goodwill impairment test is consistent with prior valuations.
The Company’s annual goodwill impairment test at October 31, 2015 indicated that the fair values of all of its reporting units substantially exceeded their respective carrying amounts.
Other Intangible Assets
Other intangible assets by major class are as follows:
March 31, 2016 | March 31, 2015 | ||||||||||||||||||||||||||
(In thousands) | Weighted Average Amortization Period (Years) | Gross Carrying Amount | Accumulated Amortization | Net Carrying Amount | Weighted Average Amortization Period (Years) | Gross Carrying Amount | Accumulated Amortization | Net Carrying Amount | |||||||||||||||||||
Customer relationships | 17 | $ | 368,096 | $ | (138,467 | ) | $ | 229,629 | 17 | $ | 345,805 | $ | (120,321 | ) | $ | 225,484 | |||||||||||
Non-competition agreements | 6 | 45,171 | (26,776 | ) | 18,395 | 6 | 43,204 | (24,335 | ) | 18,869 | |||||||||||||||||
Other | 200 | (52 | ) | 148 | 200 | (34 | ) | 166 | |||||||||||||||||||
$ | 413,467 | $ | (165,295 | ) | $ | 248,172 | $ | 389,209 | $ | (144,690 | ) | $ | 244,519 | ||||||||||||||
As the Company’s other intangible assets amortize and reach the end of their respective amortization periods, the fully amortized balances are removed from the gross carrying and accumulated amortization amounts. Amortization expense related to the Company’s other intangible assets for fiscal 2016 and 2015 was $32.7 million and $30.0 million, respectively. Estimated future amortization expense by fiscal year is as follows: fiscal 2017 - $31.8 million; 2018 - $29.5 million; 2019 - $27.4 million; 2020 - $25.9 million; 2021 - $22.2 million; and $111.4 million thereafter.
F-23
AIRGAS, INC. AND SUBSIDIARIES
NOTES TO CONSOLIDATED FINANCIAL STATEMENTS—(Continued)
(9) ACCRUED EXPENSES AND OTHER CURRENT LIABILITIES
Accrued expenses and other current liabilities include:
(In thousands) | March 31, 2016 | March 31, 2015 | |||||
Accrued payroll and employee benefits | $ | 81,107 | $ | 98,547 | |||
Business insurance reserves (a) | 48,176 | 49,934 | |||||
Taxes other than income taxes | 22,160 | 22,863 | |||||
Cash overdraft | 72,282 | 71,537 | |||||
Deferred rental revenue | 34,440 | 34,538 | |||||
Accrued interest | 10,855 | 12,860 | |||||
Other accrued expenses and current liabilities | 79,668 | 56,600 | |||||
$ | 348,688 | $ | 346,879 | ||||
____________________
(a) | With respect to the business insurance reserves above, the Company had corresponding insurance receivables of $9.9 million at March 31, 2016 and $11.6 million at March 31, 2015, which are included within the “Prepaid expenses and other current assets” line item on the Company’s consolidated balance sheets. The insurance receivables represent the balance of probable claim losses in excess of the Company’s deductible for which the Company is fully insured. |
(10) INDEBTEDNESS
Total debt consists of:
(In thousands) | March 31, 2016 | March 31, 2015 | |||||
Short-term | |||||||
Money market loans | $ | — | $ | — | |||
Commercial paper | 383,258 | 325,871 | |||||
Short-term debt | $ | 383,258 | $ | 325,871 | |||
Long-term | |||||||
Trade receivables securitization | $ | 330,000 | $ | 295,000 | |||
Revolving credit borrowings - U.S. | — | — | |||||
Revolving credit borrowings - Multi-currency | 70,259 | 48,332 | |||||
Revolving credit borrowings - France | 6,088 | 6,277 | |||||
Senior notes, net | 1,798,282 | 1,648,608 | |||||
Other long-term debt | 298 | 555 | |||||
Total long-term debt | 2,204,927 | 1,998,772 | |||||
Less current portion of long-term debt | (250,107 | ) | (250,110 | ) | |||
Long-term debt, excluding current portion | $ | 1,954,820 | $ | 1,748,662 | |||
Total debt | $ | 2,588,185 | $ | 2,324,643 | |||
Money Market Loans
The Company has an agreement with a financial institution to provide access to short-term advances not to exceed $35 million that expires on December 27, 2016. The agreement may be further extended subject to renewal provisions contained in the agreement. The advances may be for one to six months with rates at a fixed spread over the corresponding London Interbank Offering Rate (“LIBOR”). At March 31, 2016, there were no advances outstanding under the agreement.
F-24
AIRGAS, INC. AND SUBSIDIARIES
NOTES TO CONSOLIDATED FINANCIAL STATEMENTS—(Continued)
The Company also has an agreement with another financial institution that provides access to additional short-term advances not to exceed $35 million that expires on July 31, 2016. The agreement may be extended subject to renewal provisions contained in the agreement. The advances are generally overnight or for up to seven days. The amount, term and interest rate of an advance are established through mutual agreement with the financial institution when the Company requests such an advance. At March 31, 2016, there were no advances outstanding under the agreement.
Commercial Paper
The Company participates in a $1 billion commercial paper program supported by its $1 billion Credit Facility (see below). This program allows the Company to obtain favorable short-term borrowing rates with maturities that vary, but will generally not exceed 90 days from the date of issue, and is classified as short-term debt. At maturity, the commercial paper balances are often rolled over rather than repaid or refinanced, depending on the Company’s cash and liquidity positions. The Company has used proceeds from commercial paper issuances for general corporate purposes. At March 31, 2016, $383 million was outstanding under the commercial paper program and the average interest rate on these borrowings was 0.79%. There was $326 million outstanding under the commercial paper program at March 31, 2015.
Trade Receivables Securitization
The Company participates in a securitization agreement with four commercial bank conduits to which it sells qualifying trade receivables on a revolving basis (the “Securitization Agreement”). The Company’s sale of qualified trade receivables is accounted for as a secured borrowing under which qualified trade receivables collateralize amounts borrowed from the commercial bank conduits. Trade receivables that collateralize the Securitization Agreement are held in a bankruptcy-remote special purpose entity, which is consolidated for financial reporting purposes and represents the Company’s only variable interest entity. Qualified trade receivables in the amount of the outstanding borrowing under the Securitization Agreement are not available to the general creditors of the Company. The maximum amount available under the Securitization Agreement is $330 million, with the outstanding borrowings bearing interest at a rate of approximately LIBOR plus 75 basis points.
On July 24, 2015, the Company entered into the Sixth Amendment and Joinder (the “Sixth Amendment”) to the Third Amended and Restated Receivables Purchase Agreement (the “Securitization Agreement”), which increased the maximum amount of borrowings available under the Securitization Agreement from $295 million to $330 million. The Sixth Amendment also increased the number of participating banks from three to four.
On December 4, 2015, the Company entered into the Seventh Amendment to the Securitization Agreement which extended the expiration date of the Securitization Agreement from December 5, 2017 to December 5, 2018. There were no other material changes to the Securitization Agreement as a result of the Seventh Amendment.
On March 23, 2016, the Company entered into the Eighth Amendment to the Securitization Agreement which revises the change in control provisions contained in the Securitization Agreement to exclude the previously-announced proposed acquisition of the Company by L’Air Liquide, S.A., and makes certain other changes to the financial reporting requirements of the Company contained in the Securitization Agreement in anticipation of the Proposed Acquisition. The maximum amount of borrowings available to the Company under the Securitization Agreement remained unchanged as a result of the Eighth Amendment.
Senior Credit Facility
The Company participates in a $1 billion Amended and Restated Credit Facility (the “Credit Facility”). The Credit Facility consists of an $875 million U.S. dollar revolving credit line, with a $100 million letter of credit sublimit and a $75 million swingline sublimit, and a $125 million (U.S. dollar equivalent) multi-currency revolving credit line. The maturity date of the Credit Facility is November 18, 2019. Under the circumstances described in the Credit Facility, the revolving credit line may be increased by an additional $500 million, provided that the multi-currency revolving credit line may not be increased by more than an additional $50 million.
As of March 31, 2016, the Company had $70 million of borrowings under the Credit Facility, all of which were under the multi-currency revolver. There were no borrowings under the U.S. dollar revolver at March 31, 2016. The Company also had outstanding U.S. letters of credit of $51 million issued under the Credit Facility. U.S. dollar revolver borrowings bear interest at the LIBOR plus 125 basis points. The multi-currency revolver bears interest based on a rate of 125 basis points over the Euro currency rate applicable to each foreign currency borrowing. As of March 31, 2016, the average interest rate on the multi-currency revolver was 1.9%. In addition to the borrowing spread of 125 basis points for U.S. dollar and multi-currency revolver borrowings, the Company pays a commitment (or unused) fee on the undrawn portion of the Credit Facility equal to 15 basis points per annum.
F-25
AIRGAS, INC. AND SUBSIDIARIES
NOTES TO CONSOLIDATED FINANCIAL STATEMENTS—(Continued)
At March 31, 2016, the financial covenant of the Credit Facility did not restrict the Company’s ability to borrow on the unused portion of the Credit Facility. The Credit Facility contains customary events of default including, without limitation, failure to make payments, a cross-default to certain other debt, breaches of covenants, breaches of representations and warranties, certain monetary judgments and bankruptcy and ERISA events. At March 31, 2016, the Company was in compliance with all covenants under all of its debt agreements. In the event of default, repayment of borrowings under the Credit Facility may be accelerated. As of March 31, 2016, $495 million remained available under the Company’s Credit Facility, after giving effect to the borrowings under the commercial paper program backstopped by the Credit Facility, the outstanding U.S. letters of credit and the borrowings under the multi-currency revolver.
The Company also maintains a committed revolving line of credit of up to €8.0 million (U.S. $9.1 million) to fund its operations in France. These revolving credit borrowings are outside of the Company’s Credit Facility. At March 31, 2016, these revolving credit borrowings were €5.3 million (U.S. $6.1 million). The variable interest rates on these revolving credit borrowings are based on the Euro currency rate plus 125 basis points. This revolving credit agreement matures on November 18, 2019.
Senior Notes
The Company’s senior notes consisted of the following:
(In thousands) | Principal | ||||||||||||||||
Description | Coupon | Yield | Maturity Date | Semi-annual Interest Payment Dates | March 31, 2016 | March 31, 2015 | |||||||||||
2015 Notes (a) | 3.25% | 3.283% | 10/01/2015 | April 1 and October 1 | $ | — | $ | 250,000 | |||||||||
2016 Notes (c) | 2.95% | 2.980% | 06/15/2016 | June 15 and December 15 | 250,000 | 250,000 | |||||||||||
2018 Notes | 1.65% | 1.685% | 02/15/2018 | February 15 and August 15 | 325,000 | 325,000 | |||||||||||
2020 A Notes | 2.375% | 2.392% | 02/15/2020 | February 15 and August 15 | 275,000 | 275,000 | |||||||||||
2020 B Notes (b) | 3.05% | 3.092% | 08/01/2020 | February 1 and August 1 | 400,000 | — | |||||||||||
2022 Notes | 2.90% | 2.913% | 11/15/2022 | May 15 and November 15 | 250,000 | 250,000 | |||||||||||
2024 Notes | 3.65% | 3.673% | 07/15/2024 | January 15 and July 15 | 300,000 | 300,000 | |||||||||||
1,800,000 | 1,650,000 | ||||||||||||||||
Less: unamortized discount | (1,718 | ) | (1,392 | ) | |||||||||||||
Senior notes, net | $ | 1,798,282 | $ | 1,648,608 | |||||||||||||
____________________
(a) | On September 14, 2015, the Company redeemed in full its 2015 Notes senior notes originally due to mature on October 1, 2015. |
(b) | On August 11, 2015, the Company issued the 2020 B Notes. The net proceeds from the sale of the 2020 Notes were used for general corporate purposes, including to fund acquisitions, to repay indebtedness and to repurchase shares pursuant to the Company’s stock repurchase program. Interest payments on the 2020 Notes commenced on February 1, 2016. |
(c) | The 2016 Notes are included within the “Current portion of long-term debt” line item on the Company’s consolidated balance sheet based on the maturity date. |
The 2016, 2018, 2020 A, 2020 B, 2022 and 2024 Notes (collectively, the “Senior Notes”) contain covenants that could restrict the incurrence of liens and limit sale and leaseback transactions. Additionally, the Company has the option to redeem the Senior Notes prior to their maturity, in whole or in part, at 100% of the principal plus any accrued but unpaid interest or at the applicable make-whole premium.
Debt Extinguishment Charge
On October 2, 2013, the Company redeemed its $215 million 7.125% senior subordinated notes originally due to mature on October 1, 2018 in full at a price of 103.563%. A loss on the early extinguishment of debt of $9.1 million was recognized during the year ended March 31, 2014 related to the redemption premium and the write-off of unamortized debt issuance costs.
F-26
AIRGAS, INC. AND SUBSIDIARIES
NOTES TO CONSOLIDATED FINANCIAL STATEMENTS—(Continued)
Aggregate Long-term Debt Maturities
The aggregate maturities of long-term debt at March 31, 2016 are as follows:
(In thousands) | Debt Maturities (a) | ||
Years Ending March 31, | |||
2017 | $ | 250,118 | |
2018 | 325,175 | ||
2019 | 330,004 | ||
2020 | 351,348 | ||
2021 | 400,000 | ||
Thereafter | 550,000 | ||
$ | 2,206,645 | ||
____________________
(a) | Outstanding borrowings under the Securitization Agreement at March 31, 2016 are reflected as maturing at the agreement’s expiration in December 2018. |
The Senior Notes are reflected in the debt maturity schedule at their maturity values rather than their carrying values, which are net of aggregate discounts of $1.7 million at March 31, 2016.
(11) DERIVATIVE INSTRUMENTS AND HEDGING ACTIVITIES
Cash Flow Hedges
In anticipation of the issuance of the 2015 Notes, the Company entered into a treasury rate lock agreement in July 2010 with a notional amount of $100 million that matured in September 2010. The treasury rate lock agreement was designated as a cash flow hedge of the semi-annual interest payments associated with the forecasted issuance of the 2015 Notes. When the treasury rate lock agreement matured, the Company realized a loss of $2.6 million ($1.6 million after tax) which was reported as a component within accumulated other comprehensive income (“AOCI”) and is being reclassified into earnings over the term of the 2015 Notes. For the years ended March 31, 2016, 2015 and 2014, $259 thousand, $517 thousand and $517 thousand respectively, of the loss on the treasury rate lock was reclassified to interest expense during each period (see Note 13 for details). At March 31, 2016, there was no remaining estimated loss recorded in AOCI on the treasury rate lock agreement as the 2015 Notes matured in October 2015.
Fair Value Hedges
The Company previously had five variable interest rate swap agreements outstanding with a notional amount of $300 million, which were designated as fair value hedges. These variable interest rates swaps were used to effectively convert the Company’s $300 million of fixed rate 2.85% senior notes (the “2013 Notes”) to variable rate debt. The swap agreements matured on October 1, 2013, coinciding with the maturity date of the Company’s 2013 Notes. For these derivative instruments designated as fair value hedges, the Company recorded the gain or loss on the derivatives (interest rate swaps) as well as the offsetting gain or loss on the hedged item attributable to the hedged risk (the 2013 Notes) in interest expense in the consolidated statements of earnings for the respective years. The net gain or loss recorded in earnings as a result of hedge ineffectiveness related to the designated fair value hedges was immaterial for the year ended March 31, 2014.
F-27
AIRGAS, INC. AND SUBSIDIARIES
NOTES TO CONSOLIDATED FINANCIAL STATEMENTS—(Continued)
Tabular Disclosure
There were no outstanding derivative instruments on the Company’s consolidated balance sheets at March 31, 2016 or 2015, nor any derivative instruments used by the Company during the years ended March 31, 2016 or 2015. The following table illustrates the effect of derivative instruments in fair value hedging relationships on the Company’s earnings. See Note 13 for the tabular presentation of derivative instruments in cash flow hedging relationships related to the treasury rate lock agreement.
Location of Gain (Loss) Recognized in Pre-tax Income | Amount of Gain (Loss) Recognized in Pre-Tax Income | ||||
(In thousands) | Year Ended March 31, 2014 | ||||
Derivatives in Fair Value Hedging Relationships | |||||
Change in fair value of variable interest rate swaps | Interest expense, net | $ | (2,490 | ) | |
Change in carrying value of 2013 Notes | Interest expense, net | 2,496 | |||
Net effect | Interest expense, net | $ | 6 | ||
(12) FAIR VALUE MEASUREMENTS
Fair value is defined as the price that would be received to sell an asset or paid to transfer a liability in an orderly transaction between market participants at the measurement date. Assets and liabilities recorded at fair value are classified based upon the level of judgment associated with the inputs used to measure their fair value. The hierarchical levels related to the subjectivity of the valuation inputs are defined as follows:
• | Level 1 inputs are quoted prices (unadjusted) in active markets for identical assets or liabilities at the measurement date. |
• | Level 2 inputs are inputs, other than quoted prices included within Level 1, that are observable, directly or indirectly through corroboration with observable market data at the measurement date. |
• | Level 3 inputs are unobservable inputs that reflect management’s best estimate of the assumptions (including assumptions about risk) that market participants would use in pricing the asset or liability at the measurement date. |
The carrying value of cash, trade receivables, other current receivables, trade payables and other current liabilities (e.g., deposit liabilities, cash overdrafts, etc.) approximates fair value based on the short-term maturity of these financial instruments.
Assets and Liabilities Measured at Fair Value on a Recurring Basis
Assets and liabilities measured at fair value on a recurring basis at March 31, 2016 and 2015 are categorized in the tables below based on the lowest level of significant input to the valuation. During the periods presented, there were no transfers between fair value hierarchical levels.
Balance at | Quoted prices in active markets Level 1 | Significant other observable inputs Level 2 | Significant unobservable inputs Level 3 | ||||||||||||
(In thousands) | March 31, 2016 | ||||||||||||||
Assets: | |||||||||||||||
Deferred compensation plan assets | $ | 17,731 | $ | 17,731 | $ | — | $ | — | |||||||
Liabilities: | |||||||||||||||
Deferred compensation plan liabilities | $ | 17,731 | $ | 17,731 | $ | — | $ | — | |||||||
Balance at | Quoted prices in active markets Level 1 | Significant other observable inputs Level 2 | Significant unobservable inputs Level 3 | ||||||||||||
(In thousands) | March 31, 2015 | ||||||||||||||
Assets: | |||||||||||||||
Deferred compensation plan assets | $ | 16,288 | $ | 16,288 | $ | — | $ | — | |||||||
Liabilities: | |||||||||||||||
Deferred compensation plan liabilities | $ | 16,288 | $ | 16,288 | $ | — | $ | — | |||||||
F-28
AIRGAS, INC. AND SUBSIDIARIES
NOTES TO CONSOLIDATED FINANCIAL STATEMENTS—(Continued)
The following is a general description of the valuation methodologies used for financial assets and liabilities measured at fair value:
Deferred compensation plan assets and corresponding liabilities — The Company’s deferred compensation plan assets consist of open-ended mutual funds (Level 1) and are included within other non-current assets on the consolidated balance sheets. The Company’s deferred compensation plan liabilities are equal to the plan’s assets and are included within other non-current liabilities on the consolidated balance sheets. Gains or losses on the deferred compensation plan assets are recognized as other income, net, while gains or losses on the deferred compensation plan liabilities are recognized as compensation expense in the consolidated statements of earnings. See Note 19 for additional information on the Company’s deferred compensation plan.
Fair Value of Debt
The carrying value of debt, which is reported on the Company’s consolidated balance sheets, generally reflects the cash proceeds received upon its issuance, net of subsequent repayments, plus the impact of the Company’s fair value hedges as applicable. The fair values of the fixed rate notes disclosed in the following table were determined based on quoted prices from the broker/dealer market, observable market inputs for similarly termed treasury notes adjusted for the Company’s credit spread and inputs management believes a market participant would use in determining imputed interest for obligations without a stated interest rate (Level 2). The fair values of the revolving credit borrowings, securitized receivables and commercial paper approximate their carrying values (see Note 10).
Carrying Value at | Fair Value at | Carrying Value at | Fair Value at | ||||||||||||
(In thousands) | March 31, 2016 | March 31, 2016 | March 31, 2015 | March 31, 2015 | |||||||||||
3.25% senior notes due 2015 | $ | — | $ | — | $ | 249,962 | $ | 252,520 | |||||||
2.95% senior notes due 2016 | 249,988 | 250,543 | 249,918 | 254,953 | |||||||||||
1.65% senior notes due 2018 | 324,796 | 324,942 | 324,688 | 323,921 | |||||||||||
2.375% senior notes due 2020 | 274,834 | 276,859 | 274,791 | 274,821 | |||||||||||
3.05% senior notes due 2020 | 399,328 | 410,416 | — | — | |||||||||||
2.90% senior notes due 2022 | 249,815 | 250,555 | 249,787 | 249,028 | |||||||||||
3.65% senior notes due 2024 | 299,520 | 308,082 | 299,462 | 310,500 | |||||||||||
(13) STOCKHOLDERS’ EQUITY
Common Stock
The Company is authorized to issue up to 200 million shares of common stock with a par value of $0.01 per share. At March 31, 2016, the number of shares of common stock outstanding was 72.6 million, excluding 15.2 million shares of common stock held as treasury stock. At March 31, 2015, the number of shares of common stock outstanding was 75.4 million, excluding 12.2 million shares of common stock held as treasury stock.
Preferred Stock and Redeemable Preferred Stock
The Company is authorized to issue up to 20 million shares of preferred stock. Of the 20 million shares authorized, 200 thousand shares have been designated as Series A Junior Participating Preferred Stock, 200 thousand shares have been designated as Series B Junior Participating Preferred Stock and 200 thousand shares have been designated as Series C Junior Participating Preferred Stock (see Stockholder Rights Plan below). At March 31, 2016 and 2015, no shares of the preferred stock were issued or outstanding. The preferred stock may be issued from time to time by the Company’s Board of Directors in one or more series. The Board of Directors is authorized to fix the dividend rights and terms, conversion rights, voting rights, rights and terms of redemption, liquidation preferences, and any other rights, preferences, privileges and restrictions of any series of preferred stock, and the number of shares constituting such series and designation thereof.
Additionally, the Company is authorized to issue 30 thousand shares of redeemable preferred stock. At March 31, 2016 and 2015, no shares of redeemable preferred stock were issued or outstanding.
F-29
AIRGAS, INC. AND SUBSIDIARIES
NOTES TO CONSOLIDATED FINANCIAL STATEMENTS—(Continued)
Dividends
The Company paid its stockholders regular quarterly cash dividends of $0.60, $0.55 and $0.48 per share at the end of each of its fiscal quarters during the years ended March 31, 2016, 2015 and 2014, respectively. Future dividend declarations and associated amounts paid will depend upon the Company’s earnings, financial condition, loan covenants, capital requirements and other factors deemed relevant by management and the Company’s Board of Directors. Any future dividend increases would be subject to certain limitations as described in the Merger Agreement.
Stockholder Rights Plan
Effective May 8, 2007, the Company’s Board of Directors adopted a stockholder rights plan (the “2007 Rights Plan”). Pursuant to the 2007 Rights Plan, the Board of Directors declared a dividend distribution of one right for each share of common stock. Each right entitles the holder to purchase from the Company one ten-thousandth of a share of Series C Junior Participating Preferred Stock at an initial exercise price of $230 per share. The 2007 Rights Plan is intended to assure that all of the Company’s stockholders receive fair and equal treatment in the event of any proposed takeover of the Company and to protect stockholders’ interests in the event the Company is confronted with partial tender offers or other coercive or unfair takeover tactics.
Rights become exercisable after ten days following the acquisition by a person or group of 15% (or 20% in the case of Peter McCausland and certain of his affiliates) or more of the Company’s outstanding common stock, or ten business days (or later if determined by the Board of Directors in accordance with the plan) after the announcement of a tender offer or exchange offer to acquire 15% (or 20%in the case of Peter McCausland and certain of his affiliates) or more of the outstanding common stock. If such a person or group acquires 15% or more (or 20% or more, as the case may be) of the common stock, each right (other than such person’s or group’s rights, which will become void) will entitle the holder to purchase, at the exercise price, common stock having a market value equal to twice the exercise price. In certain circumstances, the rights may be redeemed by the Company at an initial redemption price of 0.0001 per right. If not redeemed, the rights will expire on May 8, 2017.
On November 17, 2015, the Company entered into an amendment (the “Rights Amendment”) to the stockholder rights plan (the “Rights Plan”) originally dated May 8, 2007. The Rights Amendment modifies the existing terms of the Rights Plan by lowering the beneficial ownership threshold for triggering the Rights Plan from 15% of Airgas’ common stock to 10%. Any party that beneficially owns 10% or more of the Company’s common stock at the time of the public announcement of the Rights Amendment will not trigger the Rights Plan unless that party increases its beneficial ownership in the Company’s common stock or exercises any options, rights, warrants, etc. for shares of the Company’s common stock. Additionally, the Rights Amendment modifies and amends the Rights Plan to provide that the Merger Agreement and any agreements or transactions associated with the foregoing will not result in a stock acquisition date (as defined therein), a distribution date (as defined therein) or any other separation of rights from the underlying common stock. There were no other significant changes to the Company’s Rights Plan as a result of the Rights Amendment.
Stock Repurchase Program
On May 28, 2015, the Company announced plans to purchase up to $500 million of Airgas, Inc. common stock under a stock repurchase program approved by the Company’s Board of Directors. Airgas may repurchase shares from time to time for cash in open market transactions or in privately-negotiated transactions in accordance with applicable federal securities laws. The Company will determine the timing and the amount of any repurchases based on its evaluation of market conditions, share price, and other factors. The stock repurchase program has no pre-established closing date. However, stock repurchases are currently suspended in accordance with the Merger Agreement (see Note 2).
From the announcement date of the program through March 31, 2016, the Company repurchased 3.8 million shares on the open market at an average price of $99.54, but did not repurchase any shares during the six months ended March 31, 2016. At March 31, 2016, $125 million was available for additional share repurchases under the program.
F-30
AIRGAS, INC. AND SUBSIDIARIES
NOTES TO CONSOLIDATED FINANCIAL STATEMENTS—(Continued)
Comprehensive Income
The Company’s comprehensive income was $334 million, $353 million and $347 million for the years ended March 31, 2016, 2015 and 2014, respectively. Comprehensive income consists of net earnings, foreign currency translation adjustments, net gain or loss on derivative instruments and the net tax expense or benefit of other comprehensive income items. Net tax expense or benefit of comprehensive income items pertains to the Company’s derivative instruments only, as foreign currency translation adjustments relate to permanent investments in foreign subsidiaries. The net gain or loss on derivative instruments reflects valuation adjustments for changes in interest rates, as well as cash settlements with the counterparties and reclassification adjustments to income. See Note 11 for further information on derivative instruments. The following table presents the gross and net changes in the balances within each component of AOCI for each of the years in the three-year period ended March 31, 2016.
(In thousands) | Foreign Currency Translation Adjustments | Treasury Rate Lock Agreement | Total Accumulated Other Comprehensive Income (Loss) | ||||||||
Balance at March 31, 2013 | $ | 5,253 | $ | (815 | ) | $ | 4,438 | ||||
Other comprehensive income (loss) before reclassifications | (4,235 | ) | — | (4,235 | ) | ||||||
Amounts reclassified from AOCI (a) | — | 517 | 517 | ||||||||
Tax effect of other comprehensive income items | — | (191 | ) | (191 | ) | ||||||
Other comprehensive income (loss), net of tax | (4,235 | ) | 326 | (3,909 | ) | ||||||
Balance at March 31, 2014 | 1,018 | (489 | ) | 529 | |||||||
Other comprehensive income (loss) before reclassifications | (15,708 | ) | — | (15,708 | ) | ||||||
Amounts reclassified from AOCI (a) | — | 517 | 517 | ||||||||
Tax effect of other comprehensive income items | — | (191 | ) | (191 | ) | ||||||
Other comprehensive income (loss), net of tax | (15,708 | ) | 326 | (15,382 | ) | ||||||
Balance at March 31, 2015 | (14,690 | ) | (163 | ) | (14,853 | ) | |||||
Other comprehensive income (loss) before reclassifications | (3,712 | ) | — | (3,712 | ) | ||||||
Amounts reclassified from AOCI (a) | — | 259 | 259 | ||||||||
Tax effect of other comprehensive income items | — | (96 | ) | (96 | ) | ||||||
Other comprehensive income (loss), net of tax | (3,712 | ) | 163 | (3,549 | ) | ||||||
Balance at March 31, 2016 | $ | (18,402 | ) | $ | — | $ | (18,402 | ) | |||
___________________
(a) | The reclassifications out of AOCI were associated with a loss on a treasury rate lock agreement from July 2010 related to the issuance of the Company’s 2015 Notes, which was being reclassified into earnings (interest expense) over the term of the 2015 Notes until their redemption in September 2015. The effects on the respective line items of the consolidated statements of earnings impacted by the reclassifications were not material for the twelve months ended March 31, 2016, 2015 and 2014. |
F-31
AIRGAS, INC. AND SUBSIDIARIES
NOTES TO CONSOLIDATED FINANCIAL STATEMENTS—(Continued)
(14) STOCK-BASED COMPENSATION
The Company recognizes stock-based compensation expense for its equity incentive plan and employee stock purchase plan. The following table summarizes stock-based compensation expense recognized by the Company in each of the years in the three-year period ended March 31, 2016.
Years Ended March 31, | |||||||||||
(In thousands) | 2016 | 2015 | 2014 | ||||||||
Stock-based compensation expense related to: | |||||||||||
Equity Incentive Plan | $ | 24,464 | $ | 25,935 | $ | 24,892 | |||||
Employee Stock Purchase Plan - options to purchase stock | 3,293 | 4,092 | 4,069 | ||||||||
27,757 | 30,027 | 28,961 | |||||||||
Tax benefit | (9,850 | ) | (10,624 | ) | (10,392 | ) | |||||
Stock-based compensation expense, net of tax | $ | 17,907 | $ | 19,403 | $ | 18,569 | |||||
2006 Equity Incentive Plan
On August 14, 2012, the Company’s stockholders approved the Second Amended and Restated 2006 Equity Incentive Plan (the “2006 Equity Plan”), which included, among other things, a 4.0 million increase in the maximum number of shares available for issuance under the plan. At March 31, 2016, a total of 11.9 million shares were authorized under the 2006 Equity Plan, as amended, for grants of stock options, stock appreciation rights, restricted stock and restricted stock units to employees, directors and consultants of the Company, of which 2.3 million shares of common stock were available for issuance.
Stock options granted to employees vest 25% annually and have a maximum term of eight years. Stock options granted to directors vest and are fully exercisable immediately upon being granted.
Fair Value
The Company utilizes the Black-Scholes option pricing model to determine the fair value of stock options. The weighted-average grant date fair value of stock options granted during the fiscal years ended March 31, 2016, 2015 and 2014 was $19.87, $28.72 and $32.41, respectively. The following assumptions were used by the Company in valuing the stock options grants issued in each fiscal year:
Fiscal 2016 | Fiscal 2015 | Fiscal 2014 | ||||||
Expected volatility | 24.8 | % | 34.3 | % | 40.5 | % | ||
Expected dividend yield | 2.31 | % | 2.06 | % | 1.95 | % | ||
Expected term | 5.6 years | 5.6 years | 5.6 years | |||||
Risk-free interest rate | 1.7 | % | 1.7 | % | 1.0 | % | ||
The expected volatility assumption used in valuing stock options was determined based on anticipated changes in the underlying stock price over the expected term using historical daily changes of the Company’s closing stock price. The expected dividend yield was based on the Company’s history and expectation of future dividend payouts. The expected term represents the period of time that the options are expected to be outstanding prior to exercise or forfeiture. The expected term was determined based on historical exercise patterns. The risk-free interest rate was based on U.S. Treasury rates in effect at the time of grant commensurate with the expected term.
F-32
AIRGAS, INC. AND SUBSIDIARIES
NOTES TO CONSOLIDATED FINANCIAL STATEMENTS—(Continued)
Summary of Stock Option Activity
The following table summarizes the stock option activity during the three years ended March 31, 2016:
Number of Stock Options | Weighted-Average Exercise Price | Aggregate Intrinsic Value (In thousands) | ||||||||
Outstanding at March 31, 2013 | 5,052,016 | $ | 60.26 | |||||||
Granted | 959,700 | $ | 102.96 | |||||||
Exercised | (817,016 | ) | $ | 47.38 | ||||||
Forfeited | (90,276 | ) | $ | 85.04 | ||||||
Outstanding at March 31, 2014 | 5,104,424 | $ | 69.91 | $ | 186,816 | |||||
Granted | 977,500 | $ | 104.80 | |||||||
Exercised | (1,034,325 | ) | $ | 53.49 | ||||||
Forfeited | (73,929 | ) | $ | 98.24 | ||||||
Outstanding at March 31, 2015 | 4,973,670 | $ | 79.76 | $ | 131,135 | |||||
Granted | 1,019,675 | $ | 103.57 | |||||||
Exercised | (837,455 | ) | $ | 62.06 | ||||||
Forfeited | (91,550 | ) | $ | 101.83 | ||||||
Outstanding at March 31, 2016 | 5,064,340 | $ | 87.08 | $ | 276,296 | |||||
Vested or expected to vest at March 31, 2016 | 5,051,024 | $ | 87.04 | $ | 275,798 | |||||
Exercisable at March 31, 2016 | 2,911,622 | $ | 75.47 | $ | 192,649 | |||||
The aggregate intrinsic value represents the difference between the Company’s closing stock price on the last trading day of each fiscal year and the exercise price of in-the-money stock options multiplied by the number of stock options outstanding or exercisable as of that date. The total intrinsic value of stock options exercised during the years ended March 31, 2016, 2015 and 2014 was $52.5 million, $60.8 million and $47.0 million, respectively. The weighted-average remaining contractual term of stock options outstanding as of March 31, 2016 was 4.6 years. Common stock to be issued in conjunction with future stock option exercises will be obtained from either new shares or shares from treasury stock.
As of March 31, 2016, $35.3 million of unrecognized non-cash compensation expense related to non-vested stock options is expected to be recognized over a weighted-average vesting period of 1.6 years.
Under the terms of the Merger Agreement (see Note 2), all of the stock options outstanding upon the closing of the Merger under the Equity Incentive Plan, whether vested or unvested, would be canceled in consideration for the right of each stock option holder to receive a cash payment equal to the number of stock options held multiplied by the excess of the Merger consideration of $143 per share over the exercise price per share of the Company’s common stock subject to the stock options.
Employee Stock Purchase Plan
The Amended and Restated Airgas, Inc. 2003 Employee Stock Purchase Plan (“Employee Stock Purchase Plan” or “ESPP”) encourages and assists employees in acquiring an equity interest in the Company. As of March 31, 2016, the ESPP was authorized to issue up to 5.5 million shares of Company common stock, of which 900 thousand shares were available for issuance at March 31, 2016.
Under the terms of the ESPP, eligible employees may elect to have up to 15% of their annual gross earnings withheld to purchase common stock at 85% of the market value. Employee purchases are limited in any calendar year to an aggregate market value of $25 thousand. Market value under the ESPP is defined as either the closing share price on the New York Stock Exchange as of an employee’s enrollment date or the closing price on the first business day of a fiscal quarter when the shares are purchased, whichever is lower. An employee may lock-in a purchase price for up to 12 months. The ESPP effectively resets at the beginning of each fiscal year at which time employees are re-enrolled in the plan and a new 12-month purchase price is established. The ESPP is designed to comply with the requirements of Sections 421 and 423 of the Internal Revenue Code.
F-33
AIRGAS, INC. AND SUBSIDIARIES
NOTES TO CONSOLIDATED FINANCIAL STATEMENTS—(Continued)
Fair Value
Compensation expense is measured based on the fair value of the employees’ option to purchase shares of common stock at the grant date and is recognized over the future periods in which the related employee service is rendered. The fair value per share of employee options to purchase shares under the ESPP was $17.59, $20.44 and $19.27 for the years ended March 31, 2016, 2015 and 2014, respectively. The fair value of the employees’ option to purchase shares of common stock was estimated using the Black-Scholes model. The following assumptions were used by the Company in valuing the employees’ option to purchase shares of common stock under the ESPP:
Fiscal 2016 | Fiscal 2015 | Fiscal 2014 | ||||||
Expected volatility | 17.9 | % | 17.1 | % | 19.5 | % | ||
Expected dividend yield | 2.60 | % | 2.07 | % | 1.96 | % | ||
Expected term | 3 to 9 months | 3 to 9 months | 3 to 9 months | |||||
Risk-free interest rate | 0.04 | % | 0.06 | % | 0.08 | % | ||
ESPP - Purchase Option Activity
The following table summarizes the activity of the ESPP during the three years ended March 31, 2016:
Number of Purchase Options | Weighted-Average Exercise Price | Aggregate Intrinsic Value (In thousands) | ||||||||
Outstanding at March 31, 2013 | 62,137 | $ | 68.74 | |||||||
Granted | 211,093 | $ | 82.88 | |||||||
Exercised | (218,109 | ) | $ | 79.38 | ||||||
Outstanding at March 31, 2014 | 55,121 | $ | 80.77 | $ | 1,419 | |||||
Granted | 200,030 | $ | 90.82 | |||||||
Exercised | (201,037 | ) | $ | 89.24 | ||||||
Outstanding at March 31, 2015 | 54,114 | $ | 86.47 | $ | 1,063 | |||||
Granted | 187,265 | $ | 78.93 | |||||||
Exercised | (241,379 | ) | $ | 81.26 | ||||||
Outstanding at March 31, 2016 | — | $ | — | $ | — | |||||
In accordance with the terms of the Merger Agreement, there were no outstanding purchase options at March 31, 2016 as the January 2016 purchase represented the final purchase under the ESPP, with no further grants of options to purchase common stock under the ESPP. As a result, all compensation expense related to the outstanding purchase options under the ESPP was recognized in full at December 31, 2015, and no additional expense was incurred related to the Company’s ESPP for the remainder of fiscal 2016.
(15) INTEREST EXPENSE, NET
Interest expense, net, consists of:
Years Ended March 31, | |||||||||||
(In thousands) | 2016 | 2015 | 2014 | ||||||||
Interest expense | $ | 62,100 | $ | 64,191 | $ | 75,361 | |||||
Interest and finance charge income | (2,029 | ) | (1,959 | ) | (1,663 | ) | |||||
$ | 60,071 | $ | 62,232 | $ | 73,698 | ||||||
(16) EARNINGS PER SHARE
Basic earnings per share is calculated by dividing net earnings by the weighted average number of shares of the Company’s common stock outstanding during the period. Outstanding shares consist of issued shares less treasury stock. Diluted earnings per share is calculated by dividing net earnings by the weighted average common shares outstanding adjusted for the dilutive effect of common stock equivalents related to stock options and the Company’s ESPP.
F-34
AIRGAS, INC. AND SUBSIDIARIES
NOTES TO CONSOLIDATED FINANCIAL STATEMENTS—(Continued)
Outstanding stock options that are anti-dilutive are excluded from the Company’s diluted earnings per share computation. There were approximately 1.9 million, 1.7 million and 1.5 million shares covered by outstanding stock options that were not dilutive for the years ended March 31, 2016, 2015 and 2014, respectively.
The table below presents the computation of basic and diluted weighted average common shares outstanding for the years ended March 31, 2016, 2015 and 2014:
(In thousands, except per share amounts) | Years Ended March 31, | ||||||||||
Basic Earnings per Share Computation | 2016 | 2015 | 2014 | ||||||||
Numerator: | |||||||||||
Net earnings | $ | 337,500 | $ | 368,086 | $ | 350,784 | |||||
Denominator: | |||||||||||
Basic shares outstanding | 73,422 | 74,702 | 73,623 | ||||||||
Basic earnings per share | $ | 4.60 | $ | 4.93 | $ | 4.76 | |||||
(In thousands, except per share amounts) | Years Ended March 31, | ||||||||||
Diluted Earnings per Share Computation | 2016 | 2015 | 2014 | ||||||||
Numerator: | |||||||||||
Net earnings | $ | 337,500 | $ | 368,086 | $ | 350,784 | |||||
Denominator: | |||||||||||
Basic shares outstanding | 73,422 | 74,702 | 73,623 | ||||||||
Incremental shares from assumed exercises and conversions: | |||||||||||
Stock options and options under the Employee Stock Purchase Plan | 955 | 1,149 | 1,287 | ||||||||
Diluted shares outstanding | 74,377 | 75,851 | 74,910 | ||||||||
Diluted earnings per share | $ | 4.54 | $ | 4.85 | $ | 4.68 | |||||
(17) LEASES
The Company leases certain facilities, fleet vehicles and equipment under long-term operating leases with varying terms. Most leases contain renewal options and in some instances, purchase options. Rentals under these operating leases for the years ended March 31, 2016, 2015 and 2014 totaled approximately $130 million, $121 million and $110 million, respectively. Outstanding capital lease obligations and the related capital assets are not material to the consolidated balance sheets at March 31, 2016 and 2015. In connection with the fleet vehicle operating leases, the Company guarantees a residual value of $32 million, representing approximately 9.8% of the original cost of the equipment currently under lease.
At March 31, 2016, future minimum lease payments under non-cancelable operating leases were as follows:
(In thousands) | |||
Years Ending March 31, | |||
2017 | $ | 112,059 | |
2018 | 94,419 | ||
2019 | 72,522 | ||
2020 | 53,725 | ||
2021 | 35,126 | ||
Thereafter | 44,651 | ||
$ | 412,502 | ||
F-35
AIRGAS, INC. AND SUBSIDIARIES
NOTES TO CONSOLIDATED FINANCIAL STATEMENTS—(Continued)
(18) COMMITMENTS AND CONTINGENCIES
Litigation
On May 5, 2016, Airgas Doral, Inc. (“Airgas Doral”), a wholly-owned subsidiary of Airgas, Inc. and the operator of the Doral, Florida fill plant and export business, entered a guilty plea pursuant to a Plea Agreement with the United States Attorney’s Office for the Southern District of Florida. Under the terms of the Plea Agreement, Airgas Doral pled guilty to 14 counts of violating various Department of Transportation regulations in connection with eight international shipments of argon in 2008. After accepting Airgas Doral’s plea, the Court scheduled a sentencing hearing for May 26, 2016, at which time the Court will impose a sentence, including a fine, a term of probation, and possibly an award of restitution. Under the Plea Agreement, the United States Attorney’s Office for the Southern District of Florida and Airgas Doral jointly recommended, among other things, that the Court should impose a fine totaling $7 million, although the Court is not obligated to follow that joint recommendation. The Company has accrued that recommended amount at March 31, 2016. The Company does not believe that the expected resolution of this matter will have a material impact on the Company’s financial position, nor does Airgas Doral expect it to affect any of its business licensing, negotiations, or qualifications to operate under the Department of Transportation, Food and Drug Administration, or other regulatory agency standards.
In addition, the Company is involved in various other legal and regulatory proceedings that have arisen in the ordinary course of business and have not been fully adjudicated. These actions, when ultimately concluded and determined, will not, in the opinion of management, have a material adverse effect upon the Company’s consolidated financial condition, results of operations or liquidity.
Merger Agreement
As described in Note 2, the Company has incurred $29 million of merger-related costs during fiscal 2016, primarily consisting of legal, advisory and other professional fees in connection with the Merger. The Company expects to incur additional costs in the future related to the Merger.
Insurance Coverage
The Company has established insurance programs to cover workers’ compensation, business automobile and general liability claims. During fiscal 2016, 2015 and 2014, these programs had deductible limits of $1 million per occurrence. For fiscal 2017, the deductible limits are expected to remain at $1 million per occurrence. The Company believes its business insurance reserves are adequate (see Note 9). The Company accrues estimated losses using actuarial models and assumptions based on historical loss experience. The nature of the Company’s business may subject it to product and general liability lawsuits. To the extent that the Company is subject to claims that exceed its liability insurance coverage, such suits could have a material adverse effect on the Company’s financial position, results of operations or liquidity.
The Company maintains a self-insured health benefits plan, which provides medical benefits to employees electing coverage under the plan. The Company maintains a reserve for incurred but not reported medical claims and claim development. The reserve is an estimate based on historical experience and other assumptions, some of which are subjective. The Company adjusts its self-insured medical benefits reserve as the Company’s loss experience changes due to medical inflation, changes in the number of plan participants and an aging employee base. The Company’s self-insured medical benefits reserve was $14.0 million and $13.8 million at March 31, 2016 and 2015, respectively.
Supply Agreements
The Company purchases bulk quantities of industrial gases under take-or-pay supply agreements. The Company is a party to take-or-pay supply agreements under which Air Products and Chemicals, Inc. (“Air Products”) will supply the Company with bulk nitrogen, oxygen, argon, hydrogen and helium. The Company is committed to purchase a minimum of approximately $61 million in bulk gases within the next fiscal year under the Air Products supply agreements. The agreements expire at various dates through 2020. The Company also has take-or-pay supply agreements with The Linde Group AG to purchase oxygen, nitrogen, argon and helium. The agreements expire at various dates through 2025 and represent approximately $95 million in minimum bulk gas purchases for the next fiscal year. Additionally, the Company has take-or-pay supply agreements to purchase oxygen, nitrogen, argon, helium and ammonia from other major producers. Minimum purchases under these contracts for the next fiscal year are approximately $36 million and they expire at various dates through 2026. The Company also purchases liquid carbon dioxide under take-or-pay supply agreements with twelve suppliers that expire at various dates through 2044 and represent minimum purchases of approximately $20 million for the next fiscal year. The level of annual purchase commitments under the Company’s supply agreements beyond the next fiscal year vary based on the expiration of agreements at different dates in the future, among other factors.
F-36
AIRGAS, INC. AND SUBSIDIARIES
NOTES TO CONSOLIDATED FINANCIAL STATEMENTS—(Continued)
The Company’s annual purchase commitments under all of its supply agreements reflect estimates based on fiscal 2016 purchases. The Company’s supply agreements contain periodic pricing adjustments, most of which are based on certain economic indices and market analyses. The Company believes the minimum product purchases under the agreements are within the Company’s normal product purchases. Actual purchases in future periods under the supply agreements could differ materially from those presented due to fluctuations in demand requirements related to varying sales levels as well as changes in economic conditions. If a supply agreement with a major supplier of gases or other raw materials was terminated, the Company would attempt to locate alternative sources of supply to meet customer requirements, including utilizing excess internal production capacity for atmospheric gases. The Company purchases hardgoods from major manufacturers and suppliers. For certain products, the Company has negotiated national purchasing arrangements. The Company believes that if an arrangement with any supplier of hardgoods was terminated, it would be able to negotiate comparable alternative supply arrangements.
At March 31, 2016, future commitments under take-or-pay supply agreements were as follows:
(In thousands) | |||
Years Ending March 31, | |||
2017 | $ | 212,212 | |
2018 | 176,650 | ||
2019 | 136,203 | ||
2020 | 92,058 | ||
2021 | 45,613 | ||
Thereafter | 198,069 | ||
$ | 860,805 | ||
Construction Commitments
Construction commitments of approximately $48 million at March 31, 2016 represent outstanding commitments to complete authorized construction projects. At March 31, 2016, the Company had long-term agreements with two customers to construct on-site air separation units. The units are located in Calvert City, KY and Tuscaloosa, AL.
Letters of Credit
At March 31, 2016, the Company had outstanding letters of credit of $51 million. Letters of credit are guarantees of payment to third parties. The Company’s letters of credit principally back obligations associated with the Company’s deductible on workers’ compensation, business automobile and general liability claims. The letters of credit are supported by the Company’s Credit Facility.
(19) BENEFIT PLANS
The Company has a defined contribution 401(k) plan (the “401(k) plan”) covering substantially all full-time employees. Under the terms of the 401(k) plan, the Company makes matching contributions of up to two percent of participant wages. Amounts expensed under the 401(k) plan for fiscal 2016, 2015 and 2014 were $14.0 million, $13.0 million and $12.3 million, respectively.
The Company has a deferred compensation plan that is a non-qualified plan. The deferred compensation plan allows eligible employees and non-employee directors, who elect to participate in the plan, to defer the receipt of taxable compensation. Participants may set aside up to a maximum of 75% of their base salary and up to a maximum of 100% of their bonus compensation or directors’ fees in tax-deferred investments. The Company’s deferred compensation plan liabilities are funded through an irrevocable rabbi trust. The assets of the trust, which consist of open-ended mutual funds, cannot be reached by the Company or its creditors except in the event of the Company’s insolvency or bankruptcy. Assets held in the rabbi trust were $17.7 million and $16.3 million at March 31, 2016 and 2015, respectively, and are included within other non-current assets on the consolidated balance sheets. The Company’s deferred compensation plan liabilities were $17.7 million and $16.3 million at March 31, 2016 and 2015, respectively, and are included within other non-current liabilities on the consolidated balance sheets. Gains or losses on the deferred compensation plan assets are recognized as other income, net, while gains or losses on the deferred compensation plan liabilities are recognized as compensation expense in the consolidated statements of earnings.
F-37
AIRGAS, INC. AND SUBSIDIARIES
NOTES TO CONSOLIDATED FINANCIAL STATEMENTS—(Continued)
(20) RELATED PARTIES
The Company purchases and sells goods and services in the ordinary course of business with certain corporations in which some of its directors and an officer are officers or directors. The Company also leases certain operating facilities from employees and an officer who were previous owners of businesses acquired. Payments made to related parties for fiscal 2016, 2015 and 2014 were $5.0 million, $4.2 million and $4.1 million, respectively.
(21) SUPPLEMENTAL CASH FLOW INFORMATION
Cash Paid for Interest and Income Taxes
Cash paid for interest and income taxes was as follows:
Years Ended March 31, | |||||||||||
(In thousands) | 2016 | 2015 | 2014 | ||||||||
Interest paid | $ | 64,992 | $ | 62,986 | $ | 86,479 | |||||
Income taxes, net of refunds | 170,840 | 194,161 | 164,482 | ||||||||
Noncash Investing and Financing Activities
Liabilities assumed and stock issued as a result of acquisitions were as follows:
Years Ended March 31, | |||||||||||
(In thousands) | 2016 | 2015 | 2014 | ||||||||
Fair value of assets acquired | $ | 121,348 | $ | 66,626 | $ | 218,413 | |||||
Net cash paid for acquisitions (a) | (102,032 | ) | (51,827 | ) | (205,370 | ) | |||||
Stock issued for acquisition (b) | — | (4,458 | ) | — | |||||||
Liabilities assumed | $ | 19,316 | $ | 10,341 | $ | 13,043 | |||||
____________________
(a) | Includes cash paid, net of cash acquired, for current year acquisitions as well as payments for the settlement of holdback liabilities and contingent consideration arrangements associated with prior year acquisitions. |
(b) | Represents shares of Airgas, Inc. common stock issued in connection with a single prior year acquisition. |
(22) SUMMARY BY BUSINESS SEGMENT
The Company identifies its businesses as separate operating segments for reporting purposes based on the review of discrete financial results for each of the businesses by the Company’s chief operating decision maker for performance assessment and resource allocation purposes. The Company aggregates its operating segments, based on products and services, into two business segments, Distribution and All Other Operations. The Distribution business segment represents the Company’s only reportable segment under GAAP, while the All Other Operations business segment represents the aggregation of all other operating segments of the Company not considered reportable under GAAP. The Distribution business segment consists of 21 operating segments, including fourteen regional gas and hardgoods distribution businesses, four gas companies that either produce or market gas products sold primarily through the Company’s regional distribution businesses, two companies that sell or provide safety-related products and services, and the Company’s rental welder business. The aggregation of the operating segments that form the Distribution business segment is based on the segment’s foundation as a national integrated distribution business providing a broad array of gas products and supporting services offered in all modes of gas distribution, from large bulk quantities to smaller quantities in cylinder or packaged form, as well as a broad complementary hardgoods product line. Although there have been minor internal organizational changes in certain operating segments that comprise the Distribution business segment, there were no changes to this reportable segment from the prior year.
The Distribution business segment’s principal products include industrial, medical and specialty gases sold in packaged and bulk quantities, as well as hardgoods. The Company’s air separation facilities and national specialty gas labs primarily produce gases that are sold by the regional distribution businesses. Gas sales include nitrogen, oxygen, argon, helium, hydrogen, welding and fuel gases such as acetylene, propylene and propane, carbon dioxide, nitrous oxide, ultra high purity grades, special application blends and process chemicals. Business units in the Distribution business segment also recognize rental revenue, derived from gas cylinders, cryogenic liquid containers, bulk storage tanks, tube trailers and welding and welding related equipment. Gas and rent represented 61%, 59% and 60% of the Distribution business segment’s sales in fiscal years 2016, 2015 and 2014, respectively. Hardgoods consist of welding consumables and equipment, safety products,
F-38
AIRGAS, INC. AND SUBSIDIARIES
NOTES TO CONSOLIDATED FINANCIAL STATEMENTS—(Continued)
construction supplies, and maintenance, repair and operating supplies. Hardgoods sales represented 39%, 41% and 40% of the Distribution business segment’s sales in fiscal years 2016, 2015 and 2014, respectively. The Distribution business segment accounted for approximately 90% of consolidated sales in each of the fiscal years 2016, 2015 and 2014.
The All Other Operations business segment consists of six business units which primarily manufacture and/or distribute carbon dioxide, dry ice, nitrous oxide, ammonia and refrigerant gases, along with a nitrogen services business.The operating segments reflected in the All Other Operations business segment individually do not meet the thresholds to be reported as separate reportable segments. Elimination entries represent intercompany sales from the Company’s All Other Operations business segment to its Distribution business segment.
The Company’s operations are predominantly in the United States. While the Company does conduct operations outside of the United States in Canada, Mexico, Russia, Dubai and several European countries, revenues from foreign countries represent less than 2% of the Company’s net sales. Revenues derived from foreign countries, based on the point of sale, were $88 million, $93 million and $88 million in the fiscal years ended March 31, 2016, 2015 and 2014, respectively. Long-lived assets attributable to the Company’s foreign operations represent less than 5% of the consolidated total long-lived assets of the Company and were $137 million, $143 million and $148 million at March 31, 2016, 2015 and 2014, respectively. Long-lived assets primarily consist of plant and equipment, net. The Company’s customer base is diverse with its largest customer accounting for less than 1% of total net sales.
Business segment information for the Company’s Distribution and All Other Operations business segments is presented in the following tables for the years ended March 31, 2016, 2015 and 2014. The accounting policies of the business segments are the same as those described in the Summary of Significant Accounting Policies (Note 1). Although corporate operating expenses are generally allocated to each business segment based on sales dollars, the Company reported expenses related to the Air Liquide merger under selling, distribution and administrative expenses in the “Eliminations and Other” column. Additionally, the Company’s other special charges are not allocated to the Company’s business segments, and are also reflected in the “Eliminations and Other” column. Corporate assets have been allocated to the Distribution business segment, intercompany sales are recorded on the same basis as sales to third parties, and intercompany transactions are eliminated in consolidation. See Note 4 for the impact of acquisitions on the operating results of each business segment. Management utilizes more than one measurement and multiple views of data to measure segment performance and to allocate resources to the segments. However, the predominant measurements are consistent with the Company’s consolidated financial statements and, accordingly, are reported on the same basis in the following tables.
F-39
AIRGAS, INC. AND SUBSIDIARIES
NOTES TO CONSOLIDATED FINANCIAL STATEMENTS—(Continued)
Year Ended | |||||||||||||||
March 31, 2016 | |||||||||||||||
(In thousands) | Distribution | All Other Ops. | Eliminations and Other | Total | |||||||||||
Gas and rent | $ | 2,866,065 | $ | 631,646 | $ | (38,209 | ) | $ | 3,459,502 | ||||||
Hardgoods | 1,850,163 | 4,123 | (11 | ) | 1,854,275 | ||||||||||
Net sales (a) | 4,716,228 | 635,769 | (38,220 | ) | 5,313,777 | ||||||||||
Cost of products sold (excluding depreciation) (a) | 2,037,492 | 302,326 | (38,220 | ) | 2,301,598 | ||||||||||
Selling, distribution and administrative expenses | 1,828,814 | 213,940 | — | 2,042,754 | |||||||||||
Merger costs and other special charges | — | — | 35,967 | 35,967 | |||||||||||
Depreciation | 288,704 | 29,848 | — | 318,552 | |||||||||||
Amortization | 29,403 | 4,792 | — | 34,195 | |||||||||||
Total costs and expenses | 4,184,413 | 550,906 | (2,253 | ) | 4,733,066 | ||||||||||
Operating income | $ | 531,815 | $ | 84,863 | $ | (35,967 | ) | $ | 580,711 | ||||||
Assets | $ | 5,531,042 | $ | 603,914 | $ | — | $ | 6,134,956 | |||||||
Capital expenditures | $ | 426,290 | $ | 30,609 | $ | — | $ | 456,899 | |||||||
Year Ended | |||||||||||||||
March 31, 2015 | |||||||||||||||
(In thousands) | Distribution | All Other Ops. | Eliminations and Other | Total | |||||||||||
Gas and rent | $ | 2,823,297 | $ | 556,941 | $ | (29,219 | ) | $ | 3,351,019 | ||||||
Hardgoods | 1,950,192 | 3,681 | (7 | ) | 1,953,866 | ||||||||||
Net sales (a) | 4,773,489 | 560,622 | (29,226 | ) | 5,304,885 | ||||||||||
Cost of products sold (excluding depreciation) (a) | 2,092,466 | 292,635 | (29,226 | ) | 2,355,875 | ||||||||||
Selling, distribution and administrative expenses | 1,792,116 | 186,558 | — | 1,978,674 | |||||||||||
Depreciation | 272,200 | 25,510 | — | 297,710 | |||||||||||
Amortization | 27,373 | 3,975 | — | 31,348 | |||||||||||
Total costs and expenses | 4,184,155 | 508,678 | (29,226 | ) | 4,663,607 | ||||||||||
Operating income | $ | 589,334 | $ | 51,944 | $ | — | $ | 641,278 | |||||||
Assets | $ | 5,397,535 | $ | 576,075 | $ | — | $ | 5,973,610 | |||||||
Capital expenditures | $ | 438,867 | $ | 29,922 | $ | — | $ | 468,789 | |||||||
Year Ended | |||||||||||||||
March 31, 2014 | |||||||||||||||
(In thousands) | Distribution | All Other Ops. | Eliminations and Other | Total | |||||||||||
Gas and rent | $ | 2,717,272 | $ | 539,954 | $ | (30,404 | ) | $ | 3,226,822 | ||||||
Hardgoods | 1,841,518 | 4,200 | (3 | ) | 1,845,715 | ||||||||||
Net sales (a) | 4,558,790 | 544,154 | (30,407 | ) | 5,072,537 | ||||||||||
Cost of products sold (excluding depreciation) (a) | 1,996,065 | 281,916 | (30,407 | ) | 2,247,574 | ||||||||||
Selling, distribution and administrative expenses | 1,705,408 | 176,289 | 7,426 | 1,889,123 | |||||||||||
Depreciation | 252,329 | 23,132 | — | 275,461 | |||||||||||
Amortization | 25,512 | 4,333 | — | 29,845 | |||||||||||
Total costs and expenses | 3,979,314 | 485,670 | (22,981 | ) | 4,442,003 | ||||||||||
Operating income | $ | 579,476 | $ | 58,484 | $ | (7,426 | ) | $ | 630,534 | ||||||
Assets | $ | 5,222,781 | $ | 570,533 | $ | — | $ | 5,793,314 | |||||||
Capital expenditures | $ | 317,066 | $ | 37,521 | $ | — | $ | 354,587 | |||||||
____________________
(a) | Amounts in the “Eliminations and Other” column represent the elimination of intercompany sales and associated gross profit on sales from the Company’s All Other Operations business segment to its Distribution business segment. |
F-40
AIRGAS, INC. AND SUBSIDIARIES
NOTES TO CONSOLIDATED FINANCIAL STATEMENTS—(Continued)
(23) SUPPLEMENTARY INFORMATION (UNAUDITED)
The following table summarizes the unaudited results of operations for each quarter of fiscal 2016 and 2015:
(In thousands, except per share amounts) | First | Second | Third | Fourth | |||||||||||
2016 | |||||||||||||||
Net sales | $ | 1,349,710 | $ | 1,374,569 | $ | 1,295,414 | $ | 1,294,084 | |||||||
Operating income (b) | 152,578 | 170,145 | 125,587 | 132,401 | |||||||||||
Net earnings | 88,235 | 98,034 | 73,864 | 77,367 | |||||||||||
Basic earnings per share (a) | $ | 1.17 | $ | 1.33 | $ | 1.02 | $ | 1.07 | |||||||
Diluted earnings per share (a) | $ | 1.16 | $ | 1.31 | $ | 1.01 | $ | 1.05 | |||||||
2015 | |||||||||||||||
Net sales | $ | 1,313,587 | $ | 1,357,755 | $ | 1,331,820 | $ | 1,301,723 | |||||||
Operating income | 155,081 | 175,781 | 162,886 | 147,530 | |||||||||||
Net earnings | 88,852 | 98,312 | 93,199 | 87,723 | |||||||||||
Basic earnings per share (a) | $ | 1.20 | $ | 1.32 | $ | 1.25 | $ | 1.17 | |||||||
Diluted earnings per share (a) | $ | 1.18 | $ | 1.30 | $ | 1.23 | $ | 1.15 | |||||||
____________________
(a) | Earnings per share calculations for each of the quarters are based on the weighted average number of shares outstanding in each quarter. Therefore, the sum of the quarterly earnings per share does not necessarily equal the full year earnings per share disclosed on the consolidated statements of earnings. |
(b) | Operating income includes the following items: |
(In thousands) | First | Second | Third | Fourth | |||||||||||
2016 | |||||||||||||||
Merger costs (Note 2) | $ | — | $ | — | $ | 21,393 | $ | 7,574 | |||||||
Special charges (Note 18) | — | — | — | 7,000 | |||||||||||
(24) SUBSEQUENT EVENTS
On April 15, 2016, the Company announced it has elected to redeem all $250 million of its outstanding 2.95% Notes maturing in June 2016 (“2016 Notes”). The notes will be redeemed in full on May 15, 2016, at a price of 100%.
On April 26, 2016, the Company announced the commencement of a consent solicitation, at the request and expense of Air Liquide, relating to all of its outstanding senior notes, excluding its 2016 Notes which the Company has elected to redeem on May 15, 2016, (“Affected Notes”) in connection with the previously announced merger with Air Liquide (see Note 2). The Company solicited the consents of holders of Affected Notes to amend the indenture dated as of May 27, 2010 between the Company and U.S. Bank National Association, as trustee, as amended and supplemented from time to time (the "Indenture"), to modify the reporting covenants with respect to the Affected Notes so that, following the closing of the Merger, in the event that (and for so long as) Air Liquide provides an unconditional guarantee of the Company's payment obligations under the Indenture and the Affected Notes, Air Liquide will provide its periodic and current reporting (under applicable French law) in lieu of the Company's existing periodic and current reporting obligations. Air Liquide has no obligation to guarantee the Affected Notes, and there can be no assurance that Air Liquide will do so. On May 10, 2016 the Company announced that holders of a majority in aggregate principal amount of Affected Notes have delivered valid consents in connection with the Company’s proposed amendments (the “Amendments”) to the Indenture. The terms and conditions of the Amendments are set forth in the consent solicitation statement dated April 26, 2016, as supplemented by a supplement dated May 2, 2016 (together, the “Statement”). The Company will, subject to the satisfaction or waiver of certain conditions described in the Statement, including the closing of the Merger, promptly pay to each holder of Affected Notes who delivered (and did not revoke) a valid consent in favor of the Amendments prior to 5:00 p.m., New York City time, on May 9, 2016, a cash payment of $1.50 for each $1,000 principal amount of Affected Notes in respect of which such holder delivered (and did not revoke) a valid consent.
F-41
SCHEDULE II
AIRGAS, INC. AND SUBSIDIARIES
Valuation and Qualifying Accounts
for the Years Ended March 31, 2016, 2015 and 2014
(In thousands) | Additions | ||||||||||||||||||
Description | Balance at Beginning of Period | Charged to Costs and Expenses | Charged to Other Accounts (a) | Deductions (b) | Balance at End of Period | ||||||||||||||
2016 | |||||||||||||||||||
Accounts receivable - allowances for doubtful accounts | $ | 27,016 | $ | 16,680 | $ | 4,349 | $ | (21,086 | ) | $ | 26,959 | ||||||||
2015 | |||||||||||||||||||
Accounts receivable - allowances for doubtful accounts | $ | 31,757 | $ | 15,843 | $ | 3,228 | $ | (23,812 | ) | $ | 27,016 | ||||||||
2014 | |||||||||||||||||||
Accounts receivable - allowances for doubtful accounts | $ | 28,650 | $ | 20,310 | $ | 7,163 | $ | (24,366 | ) | $ | 31,757 | ||||||||
____________________
(a) Principally reflects subsequent collections of accounts previously written-off.
(b) Write-off of uncollectible accounts.
F-42