Attached files
| file | filename |
|---|---|
| 8-K - 8-K - MUTUALFIRST FINANCIAL INC | v439193_8k.htm |
| EX-99.2 - EXHIBIT 99.2 - MUTUALFIRST FINANCIAL INC | v439193_ex99-2.htm |
Exhibit 99.1

2016 Annual Meeting

FORWARD LOOKING STATEMENT This presentation contains statements which constitute forward looking statements within the meaning of the Private Securities Litigation Reform Act of 1995. These statements may appear in a number of places in this presentation and include statements regarding the intent, belief, outlook, estimate or expectations of the company, its directors or its officers primarily with respect to future events and the future financial performance of the company, including but not limited to preliminary estimated ProForma combined financial information. Readers of this presentation are cautioned that any such forward looking statements are not guarantees of future events or performance and involve risk and uncertainties, and that actual results may differ materially from those in the forward looking statements as a result of various factors. These factors include, but are not limited to, the loss of deposits and loan demand to competitors; substantial changes in financial markets; changes in real estate values and the real estate market; regulatory changes; or other risk factors discussed in the latest SEC form 10 - k. The Company does not undertake – and specifically disclaims any obligation – to publicly release the result of any revisions which may be made to any forward - looking statements to reflect events or circumstances after the date of such statements or to reflect the occurrence of anticipated or unanticipated events.

FOOTPRINT Lending Office MutualWealth Office Full - Service Financial Centers Symbol: MFSF

2015 ADDITIONS Symbol: MFSF

2015 ADDITIONS Symbol: MFSF

2015 NON - RE CONSUMER LOAN GROWTH 26.7 % Symbol: MFSF

2015 COMMERCIAL LOAN GROWTH 17.5 % Symbol: MFSF

2015 NET CHARGE OFFS .06 % Symbol: MFSF

2015 TANGIBLE BOOK VALUE $0.99 to $18.11 per share Symbol: MFSF

2015 COMMON STOCK DIVIDEND 50.0 % Symbol: MFSF

2016 ADDITIONS Symbol: MFSF

2016 UPDATE Jon Kintner Board Member Symbol: MFSF

Momentum

MOMENTUM (YEAR - END) 2011 2012 2013 2014 2015 ROA 0.24% 0.50% 0.66% 0.79% 0.85% ROE 1.39% 5.47% 7.42% 9.42% 9.49% Margin 3.16% 3.05% 3.13% 3.26% 3.22% TCE 7.05% 7.62% 7.91% 8.72% 9.11% Diluted EPS $0.20 $0.82 $1.09 $1.49 $1.62 Common Stock Dividend $0.24 $0.24 $0.24 $0.32 $0.48 Stock Price $7.07 $11.43 $17.13 $21.88 $24.80 TBV $14.38 $15.33 $15.46 $17.12 $18.11 NPA 2.75% 2.21% 1.22% 0.75% 0.65% Symbol: MFSF

MOMENTUM (1 ST QTR) 2011 2012 2013 2014 2015 2016 ROA - 0.19% 0.40% 0.56% 0.58% 0.70% 0.63% ROE - 4.86% 4.17% 5.95% 7.18% 7.91% 6.92% Margin 3.14% 3.03% 3.07% 3.26% 3.20% 3.13% TCE 6.72% 7.14% 7.72% 8.11% 8.95% 9.24% Diluted EPS $( 0.17) $0.15 $0.22 $0.27 $0.33 $0.31 Quarterly Dividend $0.06 $0.06 $0.06 $0.06 $0.12 $0.14 Stock Price $9.20 $9.76 $14.35 $19.00 $23.05 $25.20 TBV $13.51 $14.68 $15.40 $15.76 $17.33 $18.54 NPA 2.69% 2.62% 2.25% 1.12% 0.72% 0.59% Symbol: MFSF

LOAN MIX (YEAR - END) (IN THOUSANDS) 2014 2015 Balance Mix % Balance Mix % Growth Mortgage 511,361 50.3% 488,901 45.2% - 4.4% Commercial 319,595 31.4% 375,682 34.8% 17.5% Non - RE Consumer 114,657 11.3% 145,272 13.4% 26.7% RE Consumer 71,073 7.0% 70,990 6.6% - 0.1% Total 1,016,686 1,080,845 6.3% Symbol: MFSF
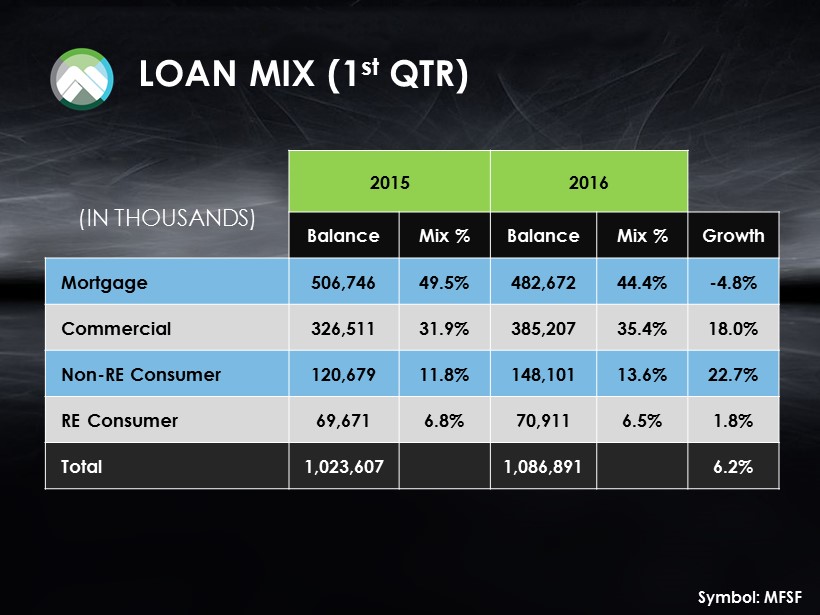
LOAN MIX (1 st QTR) (IN THOUSANDS) 2015 2016 Balance Mix % Balance Mix % Growth Mortgage 506,746 49.5% 482,672 44.4% - 4.8% Commercial 326,511 31.9% 385,207 35.4% 18.0 % Non - RE Consumer 120,679 11.8% 148,101 13.6% 22.7% RE Consumer 69,671 6.8% 70,911 6.5% 1.8% Total 1,023,607 1,086,891 6.2% Symbol: MFSF

DEPOSIT MIX (YEAR - END) (IN THOUSANDS) 2014 2015 Balance Mix % Balance Mix % Growth Non - Interest Checking 154,178 14.3% 179,542 16.5% 16.5% Savings 124,051 11.5% 131,578 12.1% 6.1% Interest Bearing Checking 253,041 23.4% 267,089 24.5% 5.6% Money Markets 146,768 13.6% 162,551 14.9% 10.8% Certificates 401,281 37.2% 350,622 32.1% - 12.6% Total 1,079,319 1,091,382 1.1% Symbol: MFSF
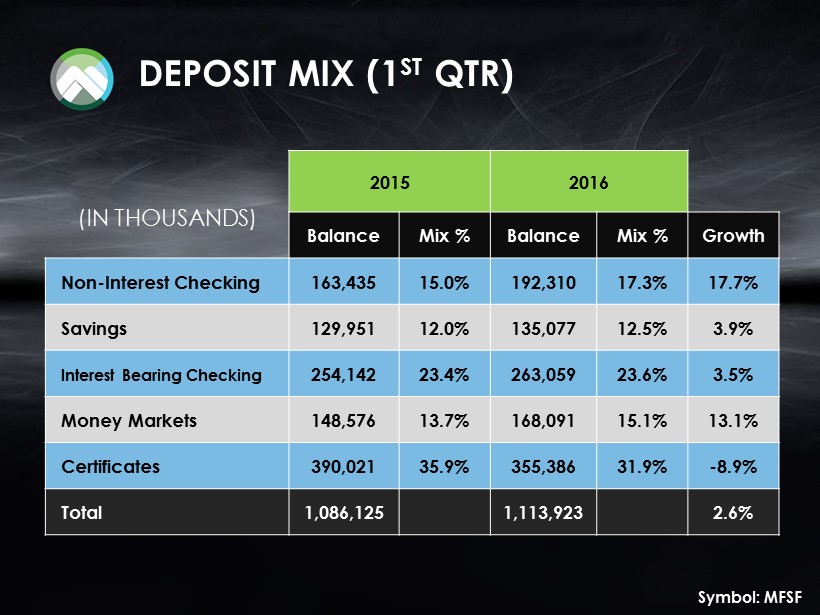
DEPOSIT MIX (1 ST QTR) (IN THOUSANDS) 2015 2016 Balance Mix % Balance Mix % Growth Non - Interest Checking 163,435 15.0% 192,310 17.3% 17.7% Savings 129,951 12.0% 135,077 12.5% 3.9% Interest Bearing Checking 254,142 23.4% 263,059 23.6% 3.5% Money Markets 148,576 13.7% 168,091 15.1% 13.1% Certificates 390,021 35.9% 355,386 31.9% - 8.9% Total 1,086,125 1,113,923 2.6% Symbol: MFSF

YEAR ONE RESULTS Symbol: MFSF

Focus Area Goals COMMERCIAL & BUSINESS BANKING Symbol: MFSF

Commercial Loan Balances Symbol: MFSF 2014 2015 2016 Actual $319,595 $375,682 $385,207 Budget $348,210 $431,237 Strategic Plan Projection $348,210 $390,343 (IN THOUSANDS)

Commercial Loan Balances – Year One Symbol: MFSF 17.5%

Focus Area Goals PERSONAL BANKING Symbol: MFSF

Consumer Loan Balances Symbol: MFSF 2014 2015 2016 Actual $185,730 $216,262 $219,012 Budget $205,730 $246,262 Strategic Plan Projection $205,730 $225,730 (IN THOUSANDS)

Consumer Loan Balances – Year One Symbol: MFSF 16.4%

Mortgage Market Share Symbol: MFSF 2013 2014 Allen 4.76% 5.03% Delaware 13.27% 14.53% Elkhart 2.26% 1.69% Grant 13.92% 12.74% Kosciusko 5.86% 5.82% Randolph 10.66% 8.26% St. Joseph 4.53% 3.17% Wabash 2.43% 1.47%

Checking Accounts Symbol: MFSF 2014 2015 2016 Actual 44,025 46,484 47,234 Budget 46,226 48,734 Strategic Plan Projection 46,226 48,427

Checking Accounts – Year One Symbol: MFSF 5.6%

MutualFinancial Revenue Symbol: MFSF 2014 2015 Actual $1,252,000 $982,475 Budget $1,400,000 Strategic Plan Projection $1,400,000

Focus Area Goals WEALTH MANAGEMENT Strategic Plan

MutualWealth Revenue Symbol: MFSF 2014 2015 Actual $3,494,000 $3,510,167 Budget $3,675,000 Strategic Plan Projection $3,675,000
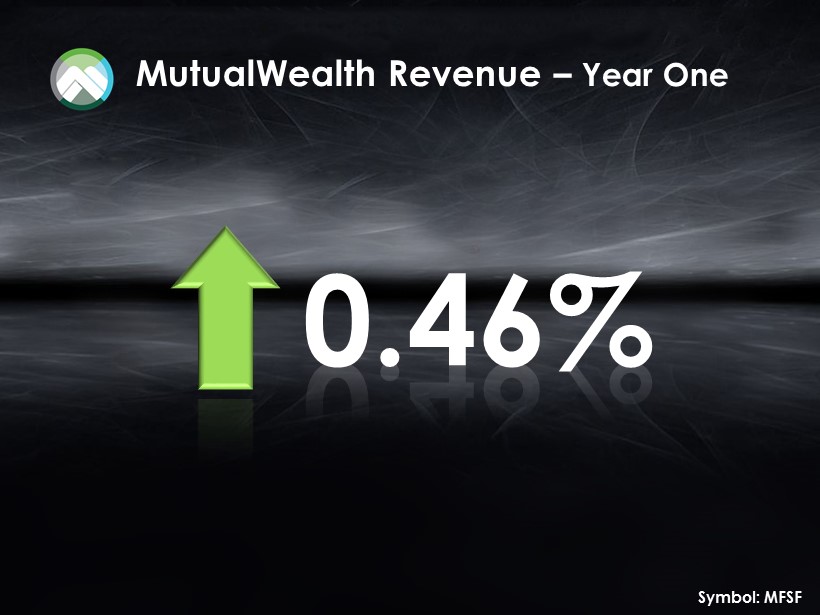
MutualWealth Revenue – Year One Symbol: MFSF 0.46%

MutualWealth Operating Margin greater than 30% 27.54% 2015 Actual Symbol: MFSF

Earnings Per Share Symbol: MFSF

Basic Earnings Per Share (EPS) Symbol: MFSF 2012 2013 2014 2015 Actual $0.83 $1.12 $1.51 $1.66 Budget $0.80 $0.88 $1.15 $1.47 Strategic Plan Projection $1.47

Thank You