Attached files
| file | filename |
|---|---|
| 8-K - 8-K - NELNET INC | nni5516form8-k.htm |
| EX-99.1 - EXHIBIT 99.1 - NELNET INC | exhibit9915516earningsrele.htm |
For Release: May 5, 2016
Investor Contact: Phil Morgan, 402.458.3038
Nelnet, Inc. supplemental financial information for the first quarter 2016
(All dollars are in thousands, except per share amounts, unless otherwise noted)
The following information should be read in connection with Nelnet, Inc.'s (the “Company's”) press release for first quarter 2016 earnings, dated May 5, 2016, and the Company's Quarterly Report on Form 10-Q for the quarter ended March 31, 2016 .
This report contains forward-looking statements and information that are based on management's current expectations as of the date of this document. Statements that are not historical facts, including statements about the Company's plans and expectations for future financial condition, results of operations or economic performance, or that address management's plans and objectives for future operations, and statements that assume or are dependent upon future events, are forward-looking statements. The words “may,” “should,” “could,” “would,” “predict,” “potential,” “continue,” “expect,” “anticipate,” “future,” “intend,” “plan,” “believe,” “estimate,” “assume,” “forecast,” “will,” and similar expressions, as well as statements in future tense, are intended to identify forward-looking statements.
The forward-looking statements are based on assumptions and analyses made by management in light of management's experience and its perception of historical trends, current conditions, expected future developments, and other factors that management believes are appropriate under the circumstances. These statements are subject to known and unknown risks, uncertainties, assumptions, and other factors that may cause the actual results and performance to be materially different from any future results or performance expressed or implied by such forward-looking statements. These factors include, among others, the risks and uncertainties set forth in the “Risk Factors” section of the Company's Annual Report on Form 10-K for the year ended December 31, 2015 (the "2015 Annual Report") and elsewhere in this report, and include such risks and uncertainties as:
• | student loan portfolio risks such as interest rate basis and repricing risk resulting from the fact that the interest rate characteristics of the student loan assets do not match the interest rate characteristics of the funding for those assets, the risk of loss of floor income on certain student loans originated under the Federal Family Education Loan Program (the "FFEL Program" or "FFELP"), risks related to the use of derivatives to manage exposure to interest rate fluctuations, uncertainties regarding the expected benefits from purchased securitized and unsecuritized FFELP student loans and initiatives to purchase additional FFELP and private education loans, and risks from changes in levels of student loan prepayment or default rates; |
• | financing and liquidity risks, including risks of changes in the general interest rate environment and in the securitization and other financing markets for student loans, including adverse changes resulting from slower than expected payments on student loans in FFELP securitization trusts, which may increase the costs or limit the availability of financings necessary to purchase, refinance, or continue to hold student loans; |
• | risks from changes in the educational credit and services markets resulting from changes in applicable laws, regulations, and government programs and budgets, such as the expected decline over time in FFELP loan interest income and fee-based revenues due to the discontinuation of new FFELP loan originations in 2010 and potential government initiatives or legislative proposals to consolidate existing FFELP loans to the Federal Direct Loan Program or otherwise allow FFELP loans to be refinanced with Federal Direct Loan Program loans, risks related to reduced government payments to guaranty agencies to rehabilitate defaulted FFELP loans and services in support of those activities, including potential adverse effects on the Company's guaranty servicing contracts, risks related to adverse changes in the Company's volumes allocated under the Company's loan servicing contract with the Department, which accounted for approximately 15 percent of the Company's revenue in 2015 and for which the loan allocation performance metrics comparison group was modified effective March 1, 2016 in a manner which resulted in decreased volumes allocated to the Company, risks related to the Department's initiative to procure a new contract for federal student loan servicing to acquire a single servicing solution to service all loans owned by the Department, and risks related to the Company's ability to comply with agreements with third-party customers for the servicing of FFELP, Federal Direct Loan Program, and private education loans; |
• | risks related to a breach of or failure in the Company's operational or information systems or infrastructure, or those of third-party vendors, including cybersecurity risks related to the potential disclosure of confidential student loan borrower and other customer information; |
• | uncertainties inherent in forecasting future cash flows from student loan assets and related asset-backed securitizations; |
• | the uncertain nature of the expected benefits from the acquisition of Allo Communications LLC and the ability to integrate its communications operations and successfully expand its fiber network in existing service areas and additional communities; |
• | risks and uncertainties related to initiatives to pursue additional strategic investments and acquisitions, including investments and acquisitions that are intended to diversify the Company both within and outside of its historical core education-related businesses; and |
• | risks and uncertainties associated with litigation matters and with maintaining compliance with the extensive regulatory requirements applicable to the Company's businesses, reputational and other risks, including the risk of increased regulatory compliance costs, resulting from the recent politicization of student loan servicing, and uncertainties inherent in the estimates and assumptions about future events that management is required to make in the preparation of the Company's consolidated financial statements. |
All forward-looking statements contained in this report are qualified by these cautionary statements and are made only as of the date of this document. Although the Company may from time to time voluntarily update or revise its prior forward-looking statements to reflect actual results or changes in the Company's expectations, the Company disclaims any commitment to do so except as required by securities laws.
1
Consolidated Statements of Income
(Dollars in thousands, except share data)
(unaudited)
Three months ended | |||||||||
March 31, 2016 | December 31, 2015 | March 31, 2015 | |||||||
Interest income: | |||||||||
Loan interest | $ | 189,988 | 190,778 | 171,944 | |||||
Investment interest | 2,029 | 2,303 | 2,205 | ||||||
Total interest income | 192,017 | 193,081 | 174,149 | ||||||
Interest expense: | |||||||||
Interest on bonds and notes payable | 90,408 | 80,866 | 71,554 | ||||||
Net interest income | 101,609 | 112,215 | 102,595 | ||||||
Less provision for loan losses | 2,500 | 3,000 | 2,000 | ||||||
Net interest income after provision for loan losses | 99,109 | 109,215 | 100,595 | ||||||
Other income (expense): | |||||||||
Loan and guaranty servicing revenue | 52,330 | 56,694 | 57,811 | ||||||
Tuition payment processing, school information, and campus commerce revenue | 38,657 | 27,560 | 34,680 | ||||||
Communications revenue | 4,346 | — | — | ||||||
Enrollment services revenue | 4,326 | 11,279 | 13,373 | ||||||
Other income | 13,796 | 11,587 | 11,408 | ||||||
Gain on sale of loans and debt repurchases | 101 | 166 | 2,875 | ||||||
Derivative market value and foreign currency adjustments, net | (22,154 | ) | 39,350 | 2,137 | |||||
Derivative settlements, net | (6,537 | ) | (7,715 | ) | (5,215 | ) | |||
Total other income | 84,865 | 138,921 | 117,069 | ||||||
Operating expenses: | |||||||||
Salaries and benefits | 63,242 | 64,862 | 61,050 | ||||||
Depreciation and amortization | 7,640 | 7,203 | 5,662 | ||||||
Loan servicing fees | 6,928 | 7,384 | 7,616 | ||||||
Cost to provide communication services | 1,703 | — | — | ||||||
Cost to provide enrollment services | 3,623 | 9,190 | 10,799 | ||||||
Other expenses | 28,376 | 28,584 | 30,101 | ||||||
Total operating expenses | 111,512 | 117,223 | 115,228 | ||||||
Income before income taxes | 72,462 | 130,913 | 102,436 | ||||||
Income tax expense | 24,433 | 47,395 | 37,630 | ||||||
Net income | 48,029 | 83,518 | 64,806 | ||||||
Net income attributable to noncontrolling interest | 68 | 168 | 41 | ||||||
Net income attributable to Nelnet, Inc. | $ | 47,961 | 83,350 | 64,765 | |||||
Earnings per common share: | |||||||||
Net income attributable to Nelnet, Inc. shareholders - basic and diluted | $ | 1.11 | 1.86 | 1.40 | |||||
Weighted average common shares outstanding - basic and diluted | 43,088,092 | 44,834,662 | 46,290,590 | ||||||
2
Condensed Consolidated Balance Sheets
(Dollars in thousands)
(unaudited)
As of | As of | As of | |||||||
March 31, 2016 | December 31, 2015 | March 31, 2015 | |||||||
Assets: | |||||||||
Student loans receivable, net | $ | 27,519,052 | 28,324,552 | 27,897,949 | |||||
Cash, cash equivalents, investments, and notes receivable | 324,485 | 367,210 | 376,950 | ||||||
Restricted cash and investments | 1,010,730 | 977,395 | 866,587 | ||||||
Goodwill and intangible assets, net | 196,139 | 197,062 | 166,383 | ||||||
Other assets | 538,941 | 552,925 | 576,459 | ||||||
Total assets | $ | 29,589,347 | 30,419,144 | 29,884,328 | |||||
Liabilities: | |||||||||
Bonds and notes payable | $ | 27,349,891 | 28,105,921 | 27,743,858 | |||||
Other liabilities | 352,530 | 421,065 | 358,977 | ||||||
Total liabilities | 27,702,421 | 28,526,986 | 28,102,835 | ||||||
Equity: | |||||||||
Total Nelnet, Inc. shareholders' equity | 1,878,254 | 1,884,432 | 1,781,222 | ||||||
Noncontrolling interest | 8,672 | 7,726 | 271 | ||||||
Total equity | 1,886,926 | 1,892,158 | 1,781,493 | ||||||
Total liabilities and equity | $ | 29,589,347 | 30,419,144 | 29,884,328 | |||||
3
Overview
The Company is a diverse company with a focus on delivering education-related products and services and student loan asset management. The largest operating businesses engage in student loan servicing, tuition payment processing and school information systems, and communications. A significant portion of the Company's revenue is net interest income earned on a portfolio of federally insured student loans. The Company also makes investments to further diversify the Company both within and outside of its historical core education-related businesses, including, but not limited to, investments in real estate and start-up ventures.
A reconciliation of the Company's GAAP net income to net income, excluding derivative market value and foreign currency adjustments, is provided below.
Three months ended | |||||||||
March 31, 2016 | December 31, 2015 | March 31, 2015 | |||||||
GAAP net income attributable to Nelnet, Inc. | $ | 47,961 | 83,350 | 64,765 | |||||
Derivative market value and foreign currency adjustments, net of tax | 13,736 | (24,397 | ) | (1,325 | ) | ||||
Net income, excluding derivative market value and foreign currency adjustments (a) | $ | 61,697 | 58,953 | 63,440 | |||||
Earnings per share: | |||||||||
GAAP net income attributable to Nelnet, Inc. | $ | 1.11 | 1.86 | 1.40 | |||||
Derivative market value and foreign currency adjustments, net of tax | 0.32 | (0.55 | ) | (0.03 | ) | ||||
Net income, excluding derivative market value and foreign currency adjustments (a) | $ | 1.43 | 1.31 | 1.37 | |||||
(a) | The Company provides non-GAAP information that reflects specific items management believes to be important in the evaluation of its financial position and performance. "Derivative market value and foreign currency adjustments" include (i) the unrealized gains and losses that are caused by changes in fair values of derivatives which do not qualify for "hedge treatment" under GAAP; and (ii) the foreign currency transaction gains or losses caused by the re-measurement of the Company's Euro-denominated bonds to U.S. dollars. The Company believes these point-in-time estimates of asset and liability values related to these financial instruments that are subject to interest and currency rate fluctuations affect the period-to-period comparability of the results of operations. Accordingly, the Company provides operating results excluding these items for comparability purposes. |
Operating Results
The Company earns net interest income on its FFELP student loan portfolio in its Asset Generation and Management ("AGM") operating segment. This segment is expected to generate a stable net interest margin and significant amounts of cash as the FFELP portfolio amortizes. As of March 31, 2016, the Company had a $27.5 billion student loan portfolio that will amortize over the next approximately 25 years. The Company actively seeks to acquire additional FFELP loan portfolios to leverage its servicing scale and expertise to generate incremental earnings and cash flow.
In addition, the Company earns fee-based revenue through the following reportable operating segments:
• | Student Loan and Guaranty Servicing ("LGS") - referred to as Nelnet Diversified Solutions ("NDS") |
• | Tuition Payment Processing and Campus Commerce ("TPP&CC") - referred to as Nelnet Business Solutions ("NBS") |
• | Communications - referred to as Allo Communications ("Allo") |
Other business activities and operating segments that are not reportable are combined and included in Corporate and Other Activities ("Corporate"). Corporate and Other Activities also includes income earned on certain investments and interest expense incurred on unsecured debt transactions.
Prior to January 1, 2016, the Company allocated certain corporate overhead expenses that are incurred within the Corporate and Other Activities segment to the other operating segments. These expenses included certain corporate activities related to executive management, internal audit, enterprise risk management, and other costs incurred by the Company due to corporate-wide initiatives. Effective January 1, 2016, internal reporting to executive management (the "chief operating decision maker") changed to eliminate the allocation of these expenses to the other segments. Management believes the change in its allocation methodology results in a better reflection of the operating results of each of the reportable segments as if they each operated as a standalone business entity, which also reflects how management evaluates the performance of the segments. Prior period segment operating results have been restated to conform to the current period presentation.
4
The information below provides the operating results for each reportable operating segment and Corporate and Other Activities for the three months ended March 31, 2016 and 2015 (dollars in millions).
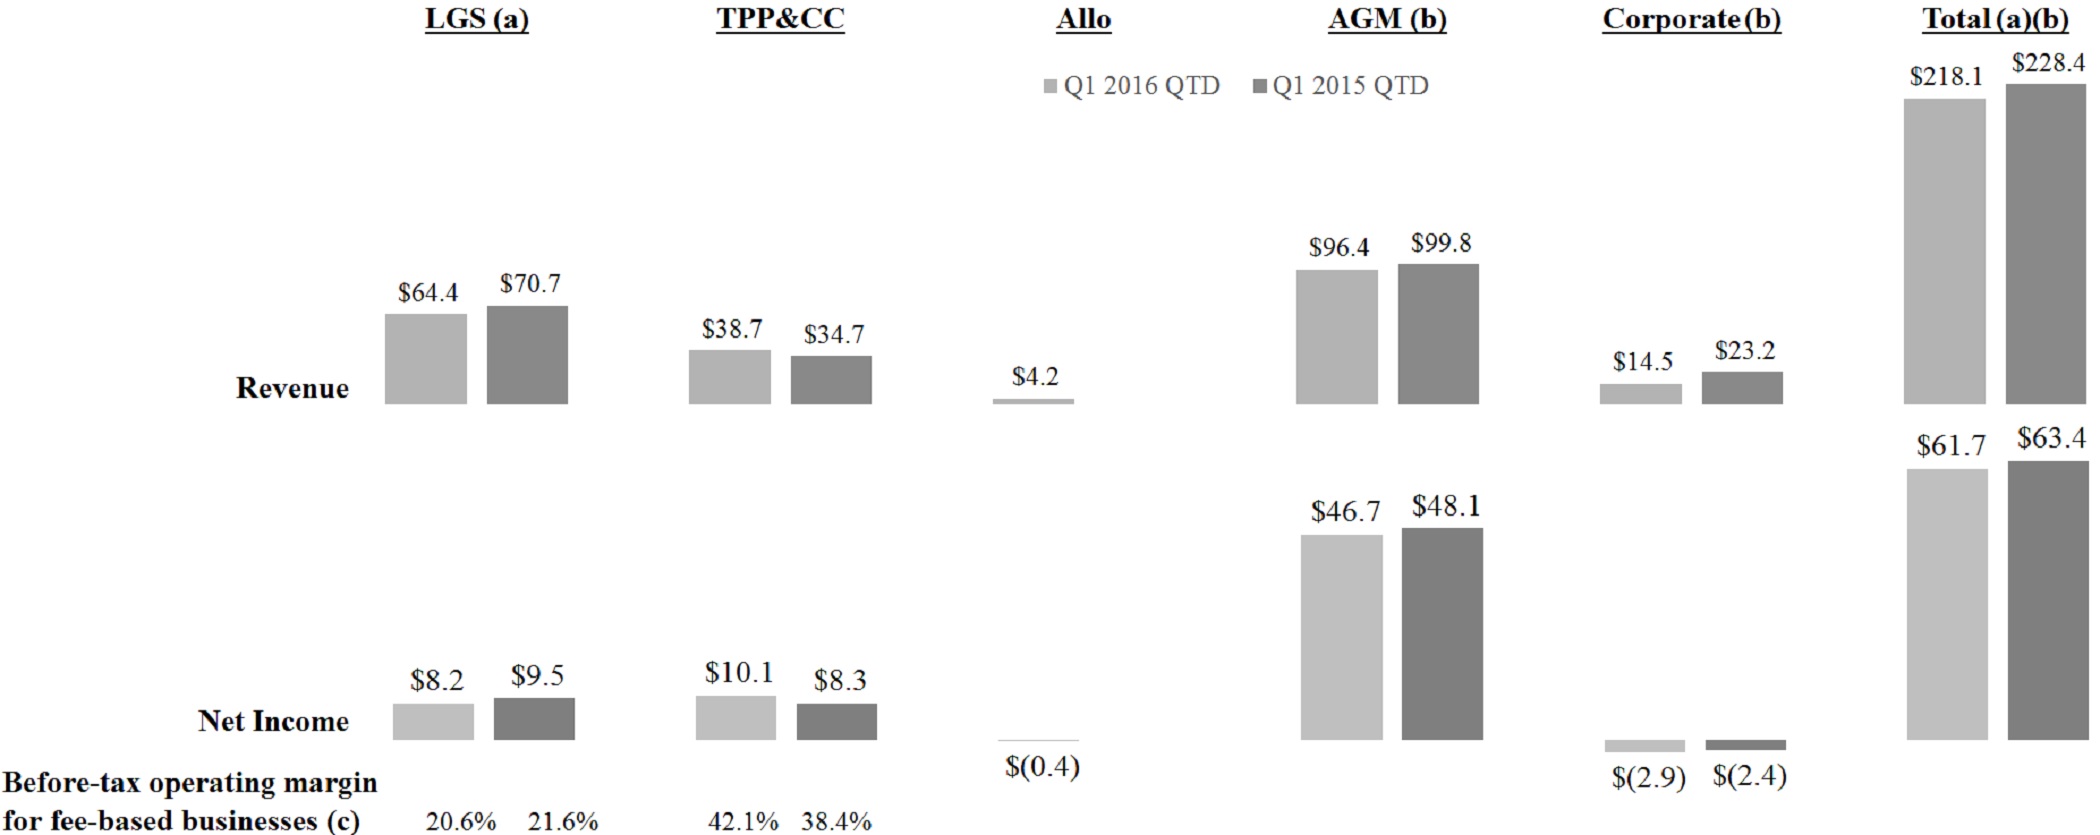
(a) | Revenue includes intersegment revenue earned by LGS as a result of servicing loans for AGM. |
(b) | Total revenue includes "net interest income after provision for loan losses" and "total other income" from the Company's segment statements of income, excluding the impact from changes in fair values of derivatives and foreign currency transaction adjustments. Net income excludes changes in fair values of derivatives and foreign currency transaction adjustments, net of tax. |
(c) | Computed as income before income taxes divided by total revenue. |
A summary of the results and financial highlights for each reportable operating segment and a summary of the Company's liquidity and capital resources follows.
Student Loan and Guaranty Servicing
• | As of March 31, 2016, the Company was servicing $182.2 billion in FFELP, private, and government owned student loans, as compared with $168.8 billion of loans as of March 31, 2015. |
• | Revenue decreased in the first quarter of 2016 compared to the same period in 2015 due to a decrease in guaranty servicing revenue. A significant amount of the Company's guaranty servicing revenue came from a single guaranty servicing client. The contract with this client expired on October 31, 2015. FFELP guaranty servicing and FFELP guaranty collection revenue recognized by the Company from this client for the three months ended March 31, 2015 was $8.7 million. |
• | Revenue from the government servicing contract increased to $35.2 million for the three months ended March 31, 2016 compared to $32.4 million for the same period in 2015. This increase was due to the shift in the portfolio of loans serviced to a greater portion of loans in higher paying repayment statuses. |
• | Before tax operating margin was 20.6% and 21.6% for the three months ended March 31, 2016 and 2015, respectively. This decrease was due to a decrease in guaranty servicing and collection revenue due to the loss of a significant guaranty client discussed above. |
• | In April 2016, the Department's Office of Federal Student Aid released information regarding a new contract procurement process for the Department to acquire a single servicing solution to support the management of federal student financial aid, including the servicing of all student loans owned by the Department. The contract solicitation process is divided into two phases. Responses for Phase 1 are due on May 9, 2016. |
Tuition Payment Processing and Campus Commerce
• | Revenue increased in the three months ended March 31, 2016 compared to the same period in 2015 due to increases in the number of managed tuition payment plans, campus commerce customer transaction and payments volume, and new school customers. |
5
• | Before tax operating margin was 42.1% and 38.4% for the three months ended March 31, 2016 and 2015, respectively. The increase in margin is attributable to increased operating leverage. |
• | This segment is subject to seasonal fluctuations. Based on the timing of when revenue is recognized and when expenses are incurred, revenue and operating margin are higher in the first quarter as compared to the remainder of the year. |
Communications
• | On December 31, 2015, the Company purchased 92.5 percent of the ownership interests of Allo for total cash consideration of $46.25 million. On January 1, 2016, the Company sold a 1.0 percent ownership interest in Allo to a non-related third-party for $0.5 million. The remaining 7.5 percent of the ownership interests of Allo is owned by members of Allo management, who have the opportunity to earn an additional 11.5 percent (up to 19 percent) of the total ownership interests based on the financial performance of Allo. The Allo assets acquired and liabilities assumed were recorded by the Company at their respective estimated fair values at the date of acquisition, and such assets and liabilities were included in the Company's balance sheet as of December 31, 2015. However, Allo had no impact on the consolidated statement of income for 2015. On January 1, 2016, the Company began to reflect the operations of Allo in the consolidated statements of income. |
• | For the three months ended March 31, 2016, the operating segment recorded a net loss of $0.4 million. The Company anticipates this operating segment will be dilutive to consolidated earnings in 2016 due to large upfront capital expenditures and associated depreciation. |
• | The Company currently plans to spend approximately $50 million in network capital expenditures during 2016. However, such amount could change based on customer demand for Allo's services. For the three months ended March 31, 2016, Allo's capital expenditures were $2.9 million. |
Asset Generation and Management
• | Core student loan spread was 1.34% for the three months ended March 31, 2016, compared to 1.41% for the same period in 2015 and 1.45% for the three month period ended December 31, 2015. The decrease in core student loan spread for the three month period ended March 31, 2016 compared to the three month period ended December 31, 2015 was due to the following items: |
◦ | A decrease in fixed rate floor income; |
◦ | An increase in consolidation rebate fees as a result of an increase in the average consolidation loan portfolio as a percent of the entire loan portfolio; |
◦ | A widening in the basis between the asset and debt indices in which the Company earns interest on its loans and funds such loans; and |
◦ | An increase in settlement costs related to non-fixed rate floor income derivatives. |
• | Due to historically low interest rates, the Company continues to earn significant fixed rate floor income. During the three months ended March 31, 2016 and 2015, the Company earned $40.6 million and $46.2 million, respectively, of fixed rate floor income (net of $5.2 million and $5.0 million of derivative settlements, respectively, used to hedge such loans). |
Corporate and Other Activities
• | On February 1, 2016, the Company sold 100 percent of the membership interests in Sparkroom LLC, which includes the majority of the Company's inquiry management products and services within Nelnet Enrollment Solutions. The Company retained the digital marketing and content solution products and services under the brand name Peterson's within the Nelnet Enrollment Solutions business, which include test preparation study guides, school directories and databases, career exploration guides, on-line courses, scholarship search and selection data, career planning information and guides, and on-line information about colleges and universities. The Company reclassified the revenue and cost of goods sold attributable to the Peterson's products and services from "enrollment services revenue" and "cost to provide enrollment services" to "other income" and "other expenses," respectively, on the consolidated statements of income. After this reclassification, "enrollment services revenue" and "cost to provide enrollment services" include the operating results of the products and services sold as part of the Sparkroom disposition for all periods presented. These reclassifications had no effect on consolidated net income. The Company recognized a gain of approximately $3.0 million from this sale. |
6
Liquidity and Capital Resources
• | As of March 31, 2016, the Company had cash and cash equivalents of $51.0 million. In addition, the Company had a portfolio of available-for-sale and trading investments, consisting primarily of student loan asset-backed securities, with a fair value of $127.2 million as of March 31, 2016. |
• | For the three months ended March 31, 2016, the Company generated $104.5 million in net cash provided by operating activities. |
• | Forecasted future cash flows from the Company's FFELP student loan portfolio financed in asset-backed securitization transactions are estimated to be approximately $2.36 billion as of March 31, 2016. |
• | During the three months ended March 31, 2016, the Company repurchased a total of 1,599,099 shares of Class A common stock for $52.1 million ($32.56 per share). |
• | During the three months ended March 31, 2016, the Company paid cash dividends of $5.1 million ($0.12 per share). |
• | The Company intends to use its liquidity position to capitalize on market opportunities, including FFELP and private education loan acquisitions; strategic acquisitions and investments; and capital management initiatives, including stock repurchases, debt repurchases, and dividend distributions. The timing and size of these opportunities will vary and will have a direct impact on the Company's cash and investment balances. |
Operating Segments
The Company has four reportable operating segments. The Company's reportable operating segments include:
• Student Loan and Guaranty Servicing
• Tuition Payment Processing and Campus Commerce
• Communications
• Asset Generation and Management
The Company earns fee-based revenue through its Student Loan and Guaranty Servicing, Tuition Payment Processing, and Communications operating segments. In addition, the Company earns interest income on its student loan portfolio in its Asset Generation and Management operating segment. The Company’s operating segments are defined by the products and services they offer and the types of customers they serve, and they reflect the manner in which financial information is currently evaluated by management. See note 1 of the notes to consolidated financial statements included in the 2015 Annual Report for a description of each operating segment, including the primary products and services offered.
The management reporting process measures the performance of the Company’s operating segments based on the management structure of the Company, as well as the methodology used by management to evaluate performance and allocate resources. Executive management (the "chief operating decision maker") evaluates the performance of the Company’s operating segments based on their financial results prepared in conformity with U.S. GAAP.
Corporate and Other Activities
Other business activities and operating segments that are not reportable are combined and included in Corporate and Other Activities. Corporate and Other Activities includes the following items:
• | Income earned on certain investment activities |
• | Interest expense incurred on unsecured debt transactions |
• | Other product and service offerings that are not considered reportable operating segments including, but not limited to, WRCM, the SEC-registered investment advisory subsidiary, and the Enrollment Services business |
Corporate and Other Activities also includes certain corporate activities and overhead functions related to human resources, accounting, legal, occupancy, information technology, and marketing. These costs are allocated to each operating segment based on estimated use of such activities and services.
7
Prior to January 1, 2016, the Company also allocated other types of corporate overhead expenses that are incurred within the Corporate and Other Activities segment to the other operating segments. These expenses included certain corporate activities related to executive management, internal audit, enterprise risk management, and other costs incurred by the Company due to corporate-wide initiatives. Effective January 1, 2016, internal reporting to executive management changed to eliminate the allocation of these overhead expenses to the other segments. Management believes the change in its allocation methodology results in a better reflection of the operating results of each of the reportable segments as if they each operated as a standalone business entity, which also reflects how management evaluates the performance of the segments. Prior period segment operating results have been restated to conform to the current period presentation.
Segment Results of Operations
The following tables include the results of each of the Company's operating segments reconciled to the consolidated financial
statements.
Three months ended March 31, 2016 | |||||||||||||||||||||
Student Loan and Guaranty Servicing | Tuition Payment Processing and Campus Commerce | Communications | Asset Generation and Management | Corporate and Other Activities | Eliminations | Total | |||||||||||||||
Total interest income | $ | 21 | 3 | — | 190,723 | 2,093 | (823 | ) | 192,017 | ||||||||||||
Interest expense | — | — | 147 | 89,877 | 1,206 | (823 | ) | 90,408 | |||||||||||||
Net interest income | 21 | 3 | (147 | ) | 100,846 | 887 | — | 101,609 | |||||||||||||
Less provision for loan losses | — | — | — | 2,500 | — | — | 2,500 | ||||||||||||||
Net interest income (loss) after provision for loan losses | 21 | 3 | (147 | ) | 98,346 | 887 | — | 99,109 | |||||||||||||
Other income: | |||||||||||||||||||||
Loan and guaranty servicing revenue | 52,330 | — | — | — | — | — | 52,330 | ||||||||||||||
Intersegment servicing revenue | 12,007 | — | — | — | — | (12,007 | ) | — | |||||||||||||
Tuition payment processing, school information, and campus commerce revenue | — | 38,657 | — | — | — | — | 38,657 | ||||||||||||||
Communications revenue | — | — | 4,346 | — | — | — | 4,346 | ||||||||||||||
Enrollment services revenue | — | — | — | — | 4,326 | — | 4,326 | ||||||||||||||
Other income | — | — | — | 4,263 | 9,532 | — | 13,796 | ||||||||||||||
Gain on sale of loans and debt repurchases | — | — | — | 101 | — | — | 101 | ||||||||||||||
Derivative market value and foreign currency adjustments, net | — | — | — | (19,897 | ) | (2,256 | ) | — | (22,154 | ) | |||||||||||
Derivative settlements, net | — | — | — | (6,304 | ) | (232 | ) | — | (6,537 | ) | |||||||||||
Total other income | 64,337 | 38,657 | 4,346 | (21,837 | ) | 11,370 | (12,007 | ) | 84,865 | ||||||||||||
Operating expenses: | |||||||||||||||||||||
Salaries and benefits | 32,967 | 14,435 | 1,089 | 519 | 14,231 | — | 63,242 | ||||||||||||||
Depreciation and amortization | 438 | 2,271 | 1,129 | — | 3,802 | — | 7,640 | ||||||||||||||
Loan servicing fees | — | — | — | 6,928 | — | — | 6,928 | ||||||||||||||
Cost to provide communication services | — | — | 1,703 | — | — | — | 1,703 | ||||||||||||||
Cost to provide enrollment services | — | — | — | — | 3,623 | — | 3,623 | ||||||||||||||
Other expenses | 11,470 | 4,159 | 753 | 1,516 | 10,477 | — | 28,376 | ||||||||||||||
Intersegment expenses, net | 6,241 | 1,512 | 144 | 12,107 | (7,997 | ) | (12,007 | ) | — | ||||||||||||
Total operating expenses | 51,116 | 22,377 | 4,818 | 21,070 | 24,136 | (12,007 | ) | 111,512 | |||||||||||||
Income (loss) before income taxes | 13,242 | 16,283 | (619 | ) | 55,439 | (11,879 | ) | — | 72,462 | ||||||||||||
Income tax (expense) benefit | (5,032 | ) | (6,188 | ) | 235 | (21,066 | ) | 7,617 | — | (24,433 | ) | ||||||||||
Net income (loss) | 8,210 | 10,095 | (384 | ) | 34,373 | (4,262 | ) | — | 48,029 | ||||||||||||
Net income attributable to noncontrolling interests | — | — | — | — | 68 | — | 68 | ||||||||||||||
Net income (loss) attributable to Nelnet, Inc. | $ | 8,210 | 10,095 | (384 | ) | 34,373 | (4,330 | ) | — | 47,961 | |||||||||||
8
Three months ended December 31, 2015 (a) | ||||||||||||||||||
Student Loan and Guaranty Servicing | Tuition Payment Processing and Campus Commerce | Asset Generation and Management | Corporate and Other Activities | Eliminations | Total | |||||||||||||
Total interest income | $ | 15 | 1 | 191,300 | 2,334 | (568 | ) | 193,081 | ||||||||||
Interest expense | — | — | 79,604 | 1,830 | (568 | ) | 80,866 | |||||||||||
Net interest income | 15 | 1 | 111,696 | 504 | — | 112,215 | ||||||||||||
Less provision for loan losses | — | — | 3,000 | — | — | 3,000 | ||||||||||||
Net interest income after provision for loan losses | 15 | 1 | 108,696 | 504 | — | 109,215 | ||||||||||||
Other income (expense): | ||||||||||||||||||
Loan and guaranty servicing revenue | 56,314 | — | — | — | 380 | 56,694 | ||||||||||||
Intersegment servicing revenue | 13,233 | — | — | — | (13,233 | ) | — | |||||||||||
Tuition payment processing, school information, and campus commerce revenue | — | 27,560 | — | — | — | 27,560 | ||||||||||||
Enrollment services revenue | — | — | — | 11,279 | — | 11,279 | ||||||||||||
Other income, net | — | (925 | ) | 4,101 | 8,411 | — | 11,587 | |||||||||||
Gain on sale of loans and debt repurchases | — | — | 34 | 132 | — | 166 | ||||||||||||
Derivative market value and foreign currency adjustments, net | — | — | 38,579 | 771 | — | 39,350 | ||||||||||||
Derivative settlements, net | — | — | (7,463 | ) | (252 | ) | — | (7,715 | ) | |||||||||
Total other income | 69,547 | 26,635 | 35,251 | 20,341 | (12,853 | ) | 138,921 | |||||||||||
Operating expenses: | ||||||||||||||||||
Salaries and benefits | 34,821 | 14,636 | 549 | 14,856 | — | 64,862 | ||||||||||||
Depreciation and amortization | 474 | 2,400 | — | 4,329 | — | 7,203 | ||||||||||||
Loan servicing fees | — | — | 7,384 | — | — | 7,384 | ||||||||||||
Cost to provide enrollment services | — | — | — | 9,190 | — | 9,190 | ||||||||||||
Other expenses | 13,221 | 3,668 | 1,255 | 10,440 | — | 28,584 | ||||||||||||
Intersegment expenses, net | 7,506 | 2,173 | 12,986 | (9,811 | ) | (12,853 | ) | — | ||||||||||
Total operating expenses | 56,022 | 22,877 | 22,174 | 29,004 | (12,853 | ) | 117,223 | |||||||||||
Income before income taxes | 13,540 | 3,759 | 121,773 | (8,159 | ) | — | 130,913 | |||||||||||
Income tax (expense) benefit | (5,145 | ) | (1,429 | ) | (46,273 | ) | 5,452 | — | (47,395 | ) | ||||||||
Net income | 8,395 | 2,330 | 75,500 | (2,707 | ) | — | 83,518 | |||||||||||
Net income attributable to noncontrolling interest | (15 | ) | — | — | 183 | — | 168 | |||||||||||
Net income attributable to Nelnet, Inc. | $ | 8,410 | 2,330 | 75,500 | (2,890 | ) | — | 83,350 | ||||||||||
(a) | Does not include the Communications segment, which was initiated as a result of the acquisition of Allo on December 31, 2015. |
9
Three months ended March 31, 2015 (a) | ||||||||||||||||||
Student Loan and Guaranty Servicing | Tuition Payment Processing and Campus Commerce | Asset Generation and Management | Corporate and Other Activities | Eliminations | Total | |||||||||||||
Total interest income | $ | 7 | 2 | 172,423 | 2,153 | (436 | ) | 174,149 | ||||||||||
Interest expense | — | — | 70,540 | 1,450 | (436 | ) | 71,554 | |||||||||||
Net interest income | 7 | 2 | 101,883 | 703 | — | 102,595 | ||||||||||||
Less provision for loan losses | — | — | 2,000 | — | — | 2,000 | ||||||||||||
Net interest income after provision for loan losses | 7 | 2 | 99,883 | 703 | — | 100,595 | ||||||||||||
Other income: | ||||||||||||||||||
Loan and guaranty servicing revenue | 57,811 | — | — | — | — | 57,811 | ||||||||||||
Intersegment servicing revenue | 12,871 | — | — | — | (12,871 | ) | — | |||||||||||
Tuition payment processing, school information, and campus commerce revenue | — | 34,680 | — | — | — | 34,680 | ||||||||||||
Enrollment services revenue | — | — | — | 13,373 | — | 13,373 | ||||||||||||
Other income | — | — | 4,576 | 6,831 | — | 11,408 | ||||||||||||
Gain on sale of loans and debt repurchases | — | — | 351 | 2,524 | — | 2,875 | ||||||||||||
Derivative market value and foreign currency adjustments, net | — | — | 3,590 | (1,453 | ) | — | 2,137 | |||||||||||
Derivative settlements, net | — | — | (4,963 | ) | (252 | ) | — | (5,215 | ) | |||||||||
Total other income | 70,682 | 34,680 | 3,554 | 21,023 | (12,871 | ) | 117,069 | |||||||||||
Operating expenses: | ||||||||||||||||||
Salaries and benefits | 33,703 | 13,321 | 541 | 13,485 | — | 61,050 | ||||||||||||
Depreciation and amortization | 446 | 2,195 | — | 3,022 | — | 5,662 | ||||||||||||
Loan servicing fees | — | — | 7,616 | — | — | 7,616 | ||||||||||||
Cost to provide enrollment services | — | — | — | 10,799 | — | 10,799 | ||||||||||||
Other expenses | 14,601 | 3,802 | 1,135 | 10,562 | — | 30,101 | ||||||||||||
Intersegment expenses, net | 6,642 | 2,034 | 13,008 | (8,813 | ) | (12,871 | ) | — | ||||||||||
Total operating expenses | 55,392 | 21,352 | 22,300 | 29,055 | (12,871 | ) | 115,228 | |||||||||||
Income (loss) before income taxes | 15,297 | 13,330 | 81,137 | (7,329 | ) | — | 102,436 | |||||||||||
Income tax (expense) benefit | (5,813 | ) | (5,065 | ) | (30,831 | ) | 4,080 | — | (37,630 | ) | ||||||||
Net income (loss) | 9,484 | 8,265 | 50,306 | (3,249 | ) | — | 64,806 | |||||||||||
Net income attributable to noncontrolling interests | — | — | — | 41 | — | 41 | ||||||||||||
Net income (loss) attributable to Nelnet, Inc. | $ | 9,484 | 8,265 | 50,306 | (3,290 | ) | — | 64,765 | ||||||||||
(a) | Does not include the Communications segment, which was initiated as a result of the acquisition of Allo on December 31, 2015. |
Net Interest Income, Net of Settlements on Derivatives
The Company maintains an overall risk management strategy that incorporates the use of derivative instruments to reduce the economic effect of interest rate volatility. Derivative settlements for each applicable period should be evaluated with the Company's net interest income.
The following table summarizes the components of “net interest income” and “derivative settlements, net” included in the attached consolidated statements of income.
Three months ended | |||||||||
March 31, 2016 | December 31, 2015 | March 31, 2015 | |||||||
Variable student loan interest margin, net of settlements on derivatives | $ | 53,856 | 59,075 | 50,633 | |||||
Fixed rate floor income, net of settlements on derivatives | 40,639 | 45,204 | 46,244 | ||||||
Investment interest | 2,029 | 2,303 | 2,205 | ||||||
Non-portfolio related derivative settlements | (232 | ) | (252 | ) | (252 | ) | |||
Corporate debt interest expense | (1,220 | ) | (1,830 | ) | (1,450 | ) | |||
Net interest income (net of settlements on derivatives) | $ | 95,072 | 104,500 | 97,380 | |||||
10
Student Loan Servicing Volumes (dollars in millions)
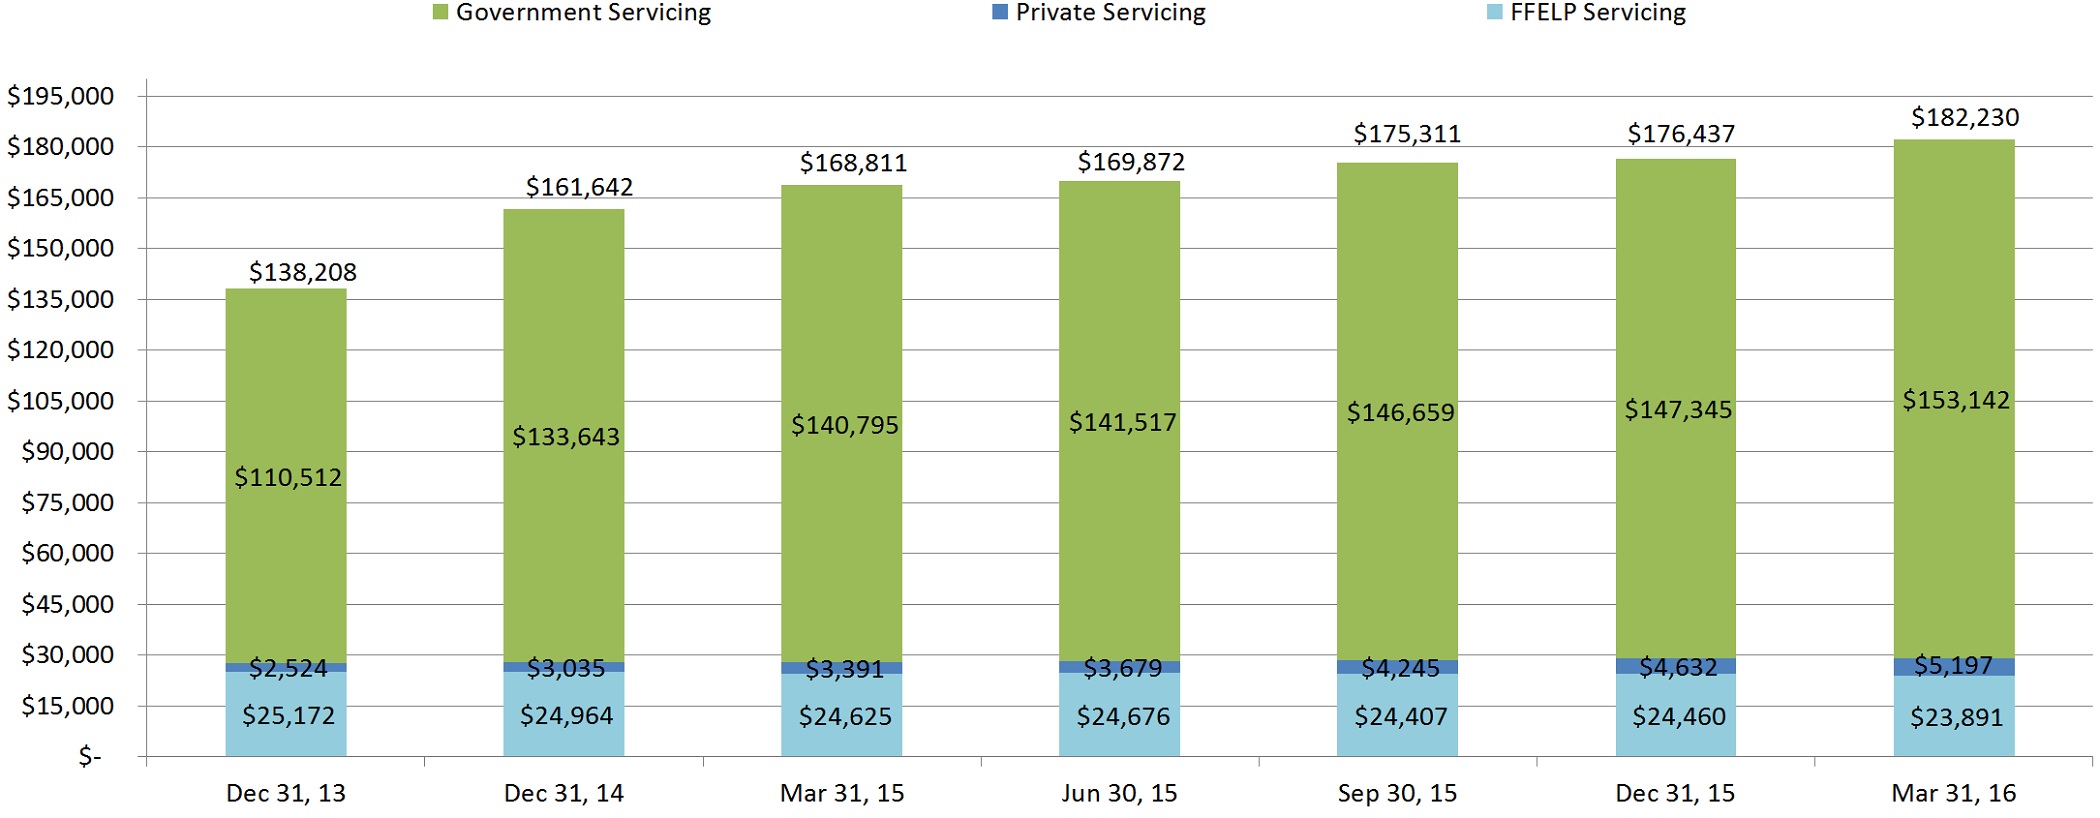
Company owned | $21,397 | $19,742 | $19,369 | $18,934 | $18,593 | $18,886 | $18,433 | ||||||||||||||
% of total | 15.5% | 12.2% | 11.5% | 11.1% | 10.6% | 10.7% | 10.1% | ||||||||||||||
Number of servicing borrowers: | |||||||||||||||||||||
Government servicing: | 5,305,498 | 5,915,449 | 5,882,446 | 5,817,078 | 5,886,266 | 5,842,163 | 5,786,545 | ||||||||||||||
FFELP servicing: | 1,462,122 | 1,397,295 | 1,358,551 | 1,353,785 | 1,339,307 | 1,335,538 | 1,298,407 | ||||||||||||||
Private servicing: | 195,580 | 202,529 | 205,926 | 209,854 | 230,403 | 245,737 | 250,666 | ||||||||||||||
Total: | 6,963,200 | 7,515,273 | 7,446,923 | 7,380,717 | 7,455,976 | 7,423,438 | 7,335,618 | ||||||||||||||
Number of remote hosted borrowers: | 1,915,203 | 1,611,654 | 1,592,813 | 1,559,573 | 1,710,577 | 1,755,341 | 1,796,783 | ||||||||||||||
Communications Financial and Operating Data
Certain financial and operating data for Allo is summarized in the tables below.
Three months ended March 31, 2016 | |||
Residential revenue | $ | 2,523 | |
Business revenue | 1,628 | ||
Other revenue | 195 | ||
Total revenue | $ | 4,346 | |
EBITDA (a) | $ | 657 | |
Capital expenditures | 2,877 | ||
Revenue contribution: | |||
Internet | 38.2 | % | |
Telephone | 27.7 | ||
Television | 32.8 | ||
Other | 1.3 | ||
100.0 | % | ||
11
As of March 31, 2016 | As of December 31, 2015 | ||||
Residential customer information: | |||||
Households served | 7,909 | 7,600 | |||
Households passed (b) | 21,274 | 21,274 | |||
Total households in current markets | 137,500 | 137,500 | |||
(a) | Earnings before interest, taxes, depreciation, and amortization ("EBITDA") is a non-GAAP performance measure that is frequently used in capital-intensive industries such as telecommunications. Allo's management has historically used EBITDA to compare Allo's performance to that of its competitors and to eliminate certain non-cash and non-operating items in order to consistently measure performance from period to period. EBITDA excludes interest expense and income taxes because these items are associated with a company's particular capitalization and tax structures. EBITDA also excludes depreciation and amortization expense because these non-cash expenses primarily reflect the impact of historical capital investments, as opposed to the cash impacts of capital expenditures made in recent periods, which may be evaluated through cash flow measures. There are limitations to using EBITDA as a performance measure, including the difficulty associated with comparing companies that use similar performance measures whose calculations may differ from Allo's calculations. In addition, EBITDA should not be considered a substitute for other measures of financial performance reported in accordance with GAAP. A reconciliation of Allo's net income (loss) to EBITDA is presented in the table below. |
Net income (loss) | $ | (384 | ) |
Interest expense | 147 | ||
Income tax benefit | (235 | ) | |
Depreciation and amortization | 1,129 | ||
Net income, excluding interest expense, income taxes, depreciation, and amortization | $ | 657 | |
(b) | Represents the estimated number of single residence homes, apartments, and condominiums that Allo already serves and those in which Allo has the capacity to connect to its network distribution system without further material extensions to the transmission lines, but have not been connected. |
Other Income
The following table summarizes the components of "other income."
Three months ended | |||||||||
March 31, 2016 | December 31, 2015 | March 31, 2015 | |||||||
Borrower late fee income | $ | 3,646 | 3,335 | 4,131 | |||||
Investment advisory fees | 818 | 2,135 | 657 | ||||||
Realized and unrealized gains/(losses) on investments classified as available-for-sale and trading, net | 1,050 | (1,088 | ) | 523 | |||||
Peterson's revenue (a) | 3,282 | 4,902 | 4,490 | ||||||
Other (b) | 5,000 | 2,303 | 1,607 | ||||||
Other income | $ | 13,796 | 11,587 | 11,408 | |||||
(a)Represents revenue previously included in "Enrollment services revenue" on the consolidated statements of income.
(b) | The operating results for the three months ended March 31, 2016 include a gain of approximately $3.0 million related to the Company's sale of Sparkroom, LLC. |
12
Derivative Settlements
The following table summarizes the components of "derivative settlements, net" included in the attached consolidated statements of income.
Three months ended | |||||||||
March 31, 2016 | December 31, 2015 | March 31, 2015 | |||||||
1:3 basis swaps | $ | (329 | ) | 491 | 266 | ||||
Interest rate swaps - floor income hedges | (5,243 | ) | (7,551 | ) | (5,015 | ) | |||
Interest rate swaps - hybrid debt hedges | (232 | ) | (252 | ) | (252 | ) | |||
Cross-currency interest rate swaps | (733 | ) | (403 | ) | (214 | ) | |||
Total settlements - expense | $ | (6,537 | ) | (7,715 | ) | (5,215 | ) | ||
Derivative Market Value and Foreign Currency Adjustments
"Derivative market value and foreign currency adjustments" include (i) the unrealized gains and losses that are caused by changes in fair values of derivatives which do not qualify for "hedge treatment" under GAAP; and (ii) the foreign currency transaction gains or losses caused by the re-measurement of the Company's Euro-denominated bonds to U.S. dollars.
The following table summarizes the components of “derivative market value and foreign currency adjustments” included in the attached consolidated statements of income.
Three months ended | |||||||||
March 31, 2016 | December 31, 2015 | March 31, 2015 | |||||||
Change in fair value of derivatives - (expense) income | $ | (3,674 | ) | 28,030 | (46,072 | ) | |||
Foreign currency transaction adjustment - (expense) income | (18,480 | ) | 11,320 | 48,209 | |||||
Derivative market value and foreign currency adjustments - (expense) income | $ | (22,154 | ) | 39,350 | 2,137 | ||||
Student Loans Receivable
The table below outlines the components of the Company’s student loan portfolio:
As of | As of | As of | |||||||
March 31, 2016 | December 31, 2015 | March 31, 2015 | |||||||
Federally insured loans | |||||||||
Stafford and other | $ | 5,934,834 | 6,202,064 | 6,287,829 | |||||
Consolidation | 21,514,363 | 22,086,043 | 21,687,746 | ||||||
Total | 27,449,197 | 28,288,107 | 27,975,575 | ||||||
Private education loans | 294,621 | 267,642 | 131,513 | ||||||
27,743,818 | 28,555,749 | 28,107,088 | |||||||
Loan discount, net of unamortized loan premiums and deferred origination costs | (174,682 | ) | (180,699 | ) | (157,978 | ) | |||
Allowance for loan losses – federally insured loans | (34,441 | ) | (35,490 | ) | (38,021 | ) | |||
Allowance for loan losses – private education loans | (15,643 | ) | (15,008 | ) | (13,140 | ) | |||
$ | 27,519,052 | 28,324,552 | 27,897,949 | ||||||
13
Loan Activity
The following table sets forth the activity of loans:
Three months ended March 31, | ||||||
2016 | 2015 | |||||
Beginning balance | $ | 28,555,749 | 28,223,908 | |||
Loan acquisitions | 110,959 | 836,112 | ||||
Repayments, claims, capitalized interest, and other | (592,020 | ) | (628,360 | ) | ||
Consolidation loans lost to external parties | (286,132 | ) | (320,576 | ) | ||
Loans sold | (44,738 | ) | (3,996 | ) | ||
Ending balance | $ | 27,743,818 | 28,107,088 | |||
Student Loan Spread
The following table analyzes the student loan spread on the Company’s portfolio of student loans, which represents the spread between the yield earned on student loan assets and the costs of the liabilities and derivative instruments used to fund those assets.
Three months ended | |||||||||
March 31, 2016 | December 31, 2015 | March 31, 2015 | |||||||
Variable student loan yield, gross | 2.82 | % | 2.66 | % | 2.53 | % | |||
Consolidation rebate fees | (0.83 | ) | (0.82 | ) | (0.84 | ) | |||
Discount accretion, net of premium and deferred origination costs amortization | 0.06 | 0.06 | 0.04 | ||||||
Variable student loan yield, net | 2.05 | 1.90 | 1.73 | ||||||
Student loan cost of funds - interest expense | (1.27 | ) | (1.07 | ) | (0.98 | ) | |||
Student loan cost of funds - derivative settlements | (0.02 | ) | — | — | |||||
Variable student loan spread | 0.76 | 0.83 | 0.75 | ||||||
Fixed rate floor income, net of settlements on derivatives | 0.58 | 0.62 | 0.66 | ||||||
Core student loan spread | 1.34 | % | 1.45 | % | 1.41 | % | |||
Average balance of student loans | $ | 28,232,489 | 28,892,571 | 28,289,420 | |||||
Average balance of debt outstanding | 28,099,821 | 28,881,167 | 28,460,627 | ||||||
14
A trend analysis of the Company's core and variable student loan spreads is summarized below.
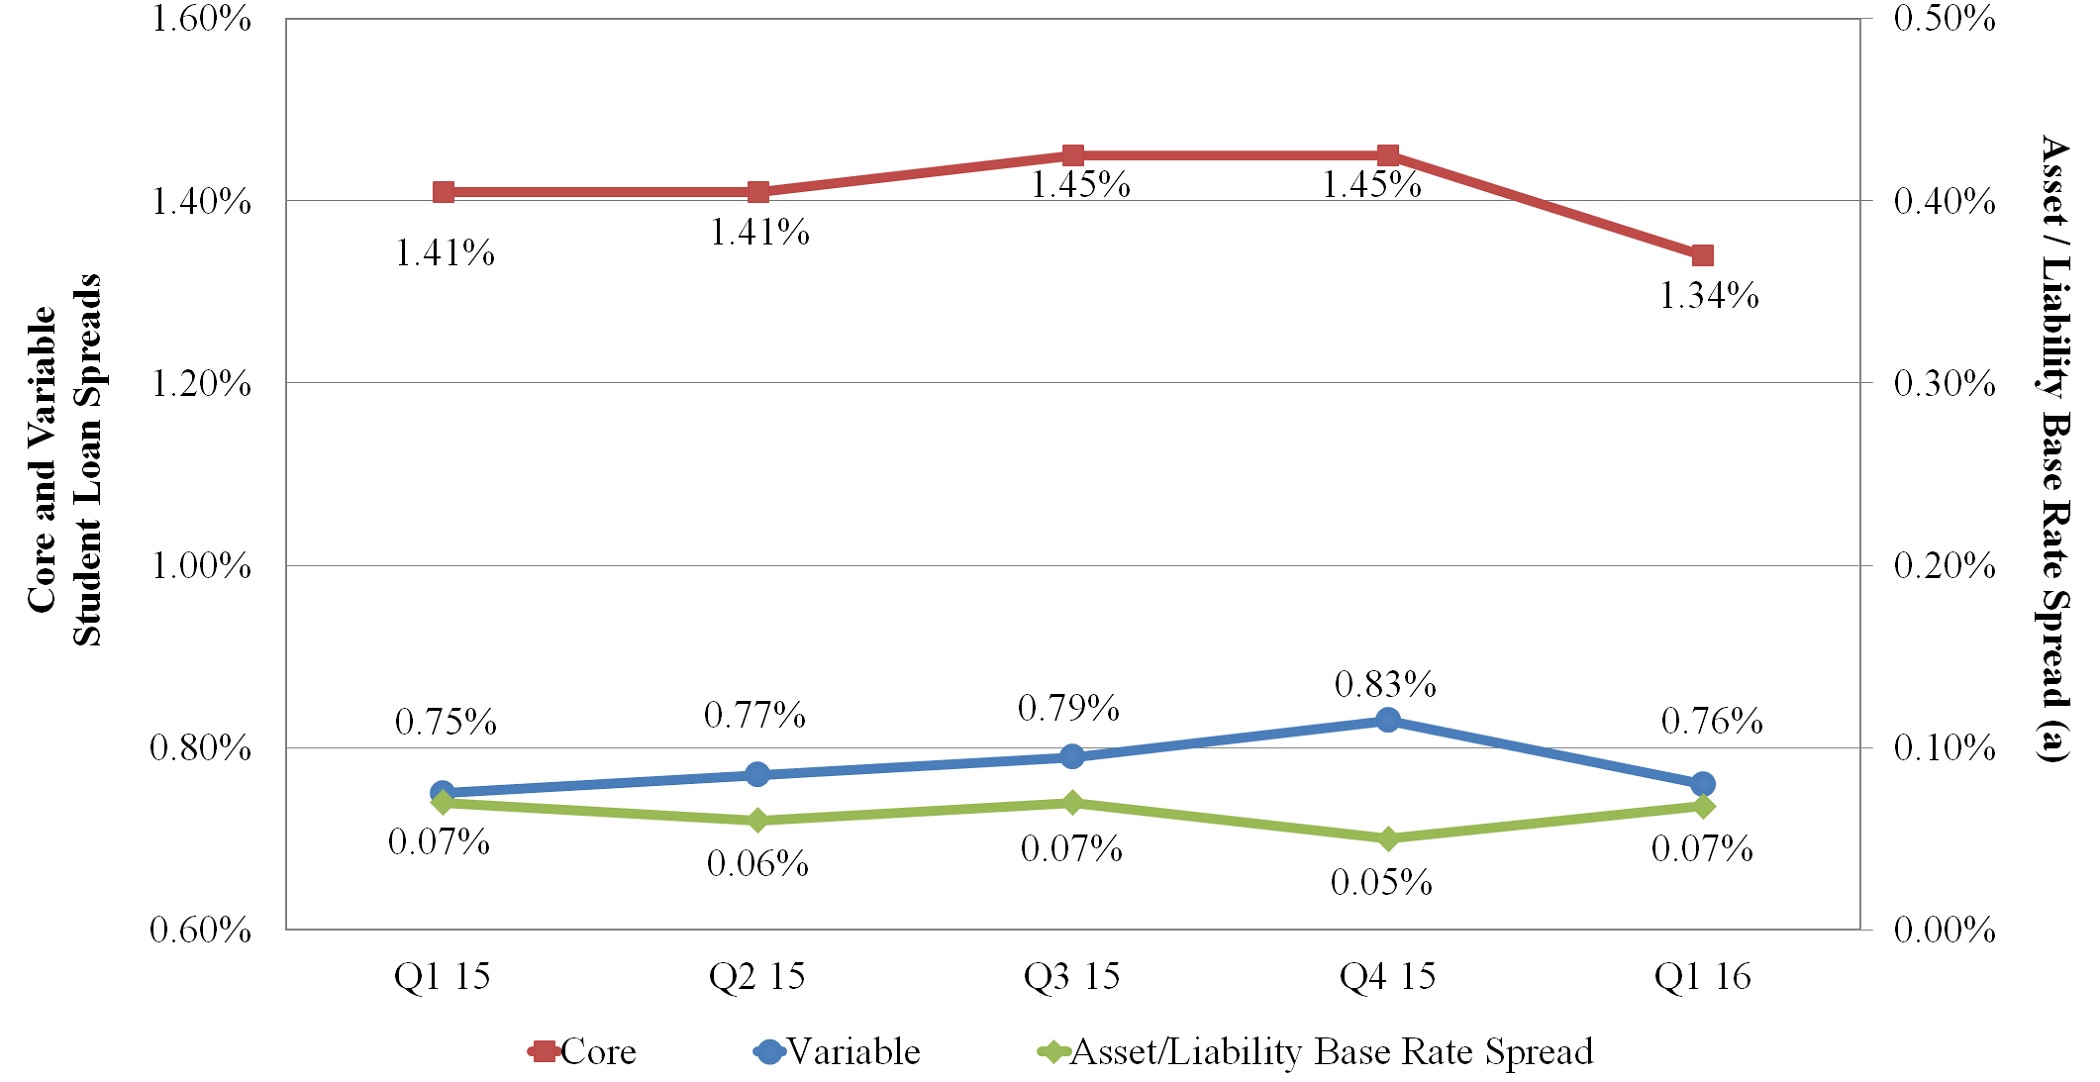
(a) | The interest earned on a large portion of the Company's FFELP student loan assets is indexed to the one-month LIBOR rate. The Company funds the majority of its assets with three-month LIBOR indexed floating rate securities. The relationship between the indices in which the Company earns interest on its loans and funds such loans has a significant impact on student loan spread. This table (the right axis) shows the difference between the Company's liability base rate and the one-month LIBOR rate by quarter. |
Variable student loan spread decreased during the three months ended March 31, 2016 as compared to the three months ended December 31, 2015 as a result of the following items:
• | An increase in consolidation rebate fees as a result of an increase in the average consolidation loan portfolio as a percent of the entire loan portfolio; |
• | A widening in the basis between the asset and debt indices in which the Company earns interest on its loans and funds such loans (as reflected in the table above); and |
• | An increase in settlement costs related to derivatives. |
The primary difference between variable student loan spread and core student loan spread is fixed rate floor income. A summary of fixed rate floor income and its contribution to core student loan spread follows:
Three months ended | |||||||||
March 31, 2016 | December 31, 2015 | March 31, 2015 | |||||||
Fixed rate floor income, gross | $ | 45,882 | 52,754 | 51,259 | |||||
Derivative settlements (a) | (5,243 | ) | (7,551 | ) | (5,015 | ) | |||
Fixed rate floor income, net | $ | 40,639 | 45,203 | 46,244 | |||||
Fixed rate floor income contribution to spread, net | 0.58 | % | 0.62 | % | 0.66 | % | |||
(a) | Includes settlement payments on derivatives used to hedge student loans earning fixed rate floor income. |
15
Fixed Rate Floor Income
The following table shows the Company’s federally insured student loan assets that were earning fixed rate floor income as of March 31, 2016.
Fixed interest rate range | Borrower/lender weighted average yield | Estimated variable conversion rate (a) | Loan balance | |||||
3.0 - 3.49% | 3.28% | 0.64% | $ | 1,580,967 | ||||
3.5 - 3.99% | 3.65% | 1.01% | 2,282,073 | |||||
4.0 - 4.49% | 4.20% | 1.56% | 1,699,928 | |||||
4.5 - 4.99% | 4.72% | 2.08% | 1,033,752 | |||||
5.0 - 5.49% | 5.22% | 2.58% | 651,405 | |||||
5.5 - 5.99% | 5.67% | 3.03% | 454,152 | |||||
6.0 - 6.49% | 6.19% | 3.55% | 526,810 | |||||
6.5 - 6.99% | 6.70% | 4.06% | 517,101 | |||||
7.0 - 7.49% | 7.17% | 4.53% | 181,621 | |||||
7.5 - 7.99% | 7.71% | 5.07% | 304,691 | |||||
8.0 - 8.99% | 8.18% | 5.54% | 711,293 | |||||
> 9.0% | 9.05% | 6.41% | 246,881 | |||||
$ | 10,190,674 | |||||||
(a) | The estimated variable conversion rate is the estimated short-term interest rate at which loans would convert to a variable rate. As of March 31, 2016, the weighted average estimated variable conversion rate was 2.26% and the short-term interest rate was 44 basis points. |
The following table summarizes the outstanding derivative instruments as of March 31, 2016 used by the Company to economically hedge loans earning fixed rate floor income.
Maturity | Notional amount | Weighted average fixed rate paid by the Company (a) | |||||
2016 | $ | 1,000,000 | 0.76 | % | |||
2017 | 1,000,000 | 0.97 | |||||
2018 | 1,600,000 | 1.08 | |||||
2019 | 2,250,000 | 0.99 | |||||
2020 | 500,000 | 1.02 | |||||
2025 | 100,000 | 2.32 | |||||
$ | 6,450,000 | 0.99 | % | ||||
(a) | For all interest rate derivatives, the Company receives discrete three-month LIBOR. |
16