Attached files
| file | filename |
|---|---|
| EXCEL - IDEA: XBRL DOCUMENT - NELNET INC | Financial_Report.xls |
| EX-32 - EXHIBIT 32 - NELNET INC | nni-33115xex_32.htm |
| EX-31.1 - EXHIBIT 31.1 - NELNET INC | nni-33115xex_311.htm |
| EX-31.2 - EXHIBIT 31.2 - NELNET INC | nni-33115xex_312.htm |
UNITED STATES
SECURITIES AND EXCHANGE COMMISSION
WASHINGTON, D.C. 20549
FORM 10-Q
(Mark One)
ý | QUARTERLY REPORT PURSUANT TO SECTION 13 OR 15(d) OF THE SECURITIES EXCHANGE ACT OF 1934 |
For the quarterly period ended March 31, 2015
or
¨ | TRANSITION REPORT PURSUANT TO SECTION 13 OR 15(d) OF THE SECURITIES EXCHANGE ACT OF 1934 |
For the transition period from to .
COMMISSION FILE NUMBER 001-31924
NELNET, INC.
(Exact name of registrant as specified in its charter)
NEBRASKA (State or other jurisdiction of incorporation or organization) | 84-0748903 (I.R.S. Employer Identification No.) |
121 SOUTH 13TH STREET SUITE 100 LINCOLN, NEBRASKA (Address of principal executive offices) | 68508 (Zip Code) |
(402) 458-2370
(Registrant’s telephone number, including area code)
Indicate by check mark whether the registrant (1) has filed all reports required to be filed by Section 13 or 15(d) of the Securities Exchange Act of 1934 during the preceding 12 months (or for such shorter period that the registrant was required to file such reports), and (2) has been subject to such filing requirements for the past 90 days. Yes [X] No [ ]
Indicate by check mark whether the registrant has submitted electronically and posted on its corporate Web site, if any, every Interactive Data File required to be submitted and posted pursuant to Rule 405 of Regulation S-T (§232.405 of this chapter) during the preceding 12 months (or for such shorter period that the registrant was required to submit and post such files). Yes [X] No [ ]
Indicate by check mark whether the registrant is a large accelerated filer, an accelerated filer, a non-accelerated filer, or a smaller reporting company. See the definitions of “large accelerated filer,” “accelerated filer” and “smaller reporting company” in Rule 12b-2 of the Exchange Act.
Large accelerated filer [X] Accelerated filer [ ]
Non-accelerated filer [ ] Smaller reporting company [ ]
Indicate by check mark whether the registrant is a shell company (as defined in Rule 12b-2 of the Exchange Act). Yes[ ] No[X]
As of April 30, 2015, there were 34,592,926 and 11,486,932 shares of Class A Common Stock and Class B Common Stock, par value $0.01 per share, outstanding, respectively (excluding 11,317,364 shares of Class A Common Stock held by wholly owned subsidiaries).
NELNET, INC.
FORM 10-Q
INDEX
March 31, 2015
Item 1. | |||
Item 2. | |||
Item 3. | |||
Item 4. | |||
Item 1. | |||
Item 1A. | |||
Item 2. | |||
Item 6. | |||
PART I. FINANCIAL INFORMATION
ITEM 1. FINANCIAL STATEMENTS
NELNET, INC. AND SUBSIDIARIES | |||||||
CONSOLIDATED BALANCE SHEETS | |||||||
(Dollars in thousands, except share data) | |||||||
(unaudited) | |||||||
As of | As of | ||||||
March 31, 2015 | December 31, 2014 | ||||||
Assets: | |||||||
Student loans receivable (net of allowance for loan losses of $51,161 and $48,900, respectively) | $ | 27,897,949 | 28,005,195 | ||||
Cash and cash equivalents: | |||||||
Cash and cash equivalents - not held at a related party | 38,071 | 37,781 | |||||
Cash and cash equivalents - held at a related party | 61,975 | 92,700 | |||||
Total cash and cash equivalents | 100,046 | 130,481 | |||||
Investments and notes receivable | 276,904 | 235,709 | |||||
Restricted cash and investments | 866,587 | 850,440 | |||||
Restricted cash - due to customers | 71,890 | 118,488 | |||||
Accrued interest receivable | 355,372 | 351,588 | |||||
Accounts receivable (net of allowance for doubtful accounts of $1,908 and $1,656, respectively) | 55,968 | 50,552 | |||||
Goodwill | 126,200 | 126,200 | |||||
Intangible assets, net | 40,183 | 42,582 | |||||
Property and equipment, net | 51,003 | 45,894 | |||||
Other assets | 77,097 | 76,622 | |||||
Fair value of derivative instruments | 36,595 | 64,392 | |||||
Total assets | $ | 29,955,794 | 30,098,143 | ||||
Liabilities: | |||||||
Bonds and notes payable | $ | 27,815,324 | 28,027,350 | ||||
Accrued interest payable | 27,275 | 25,904 | |||||
Other liabilities | 174,248 | 167,881 | |||||
Due to customers | 71,890 | 118,488 | |||||
Fair value of derivative instruments | 85,564 | 32,842 | |||||
Total liabilities | 28,174,301 | 28,372,465 | |||||
Commitments and contingencies | |||||||
Equity: | |||||||
Nelnet, Inc. shareholders' equity: | |||||||
Preferred stock, $0.01 par value. Authorized 50,000,000 shares; no shares issued or outstanding | — | — | |||||
Common stock: | |||||||
Class A, $0.01 par value. Authorized 600,000,000 shares; issued and outstanding 34,713,065 shares and 34,756,384 shares, respectively | 347 | 348 | |||||
Class B, convertible, $0.01 par value. Authorized 60,000,000 shares; issued and outstanding 11,486,932 shares | 115 | 115 | |||||
Additional paid-in capital | 13,177 | 17,290 | |||||
Retained earnings | 1,762,711 | 1,702,560 | |||||
Accumulated other comprehensive earnings | 4,872 | 5,135 | |||||
Total Nelnet, Inc. shareholders' equity | 1,781,222 | 1,725,448 | |||||
Noncontrolling interest | 271 | 230 | |||||
Total equity | 1,781,493 | 1,725,678 | |||||
Total liabilities and equity | $ | 29,955,794 | 30,098,143 | ||||
Supplemental information - assets and liabilities of consolidated variable interest entities: | |||||||
Student loans receivable | $ | 27,965,879 | 28,181,244 | ||||
Restricted cash and investments | 850,890 | 846,199 | |||||
Fair value of derivative instruments, net | (70,261 | ) | (20,455 | ) | |||
Other assets | 355,015 | 351,934 | |||||
Bonds and notes payable | (28,119,030 | ) | (28,391,530 | ) | |||
Other liabilities | (295,163 | ) | (280,233 | ) | |||
Net assets of consolidated variable interest entities | $ | 687,330 | 687,159 | ||||
See accompanying notes to consolidated financial statements.
2
NELNET, INC. AND SUBSIDIARIES | ||||||
CONSOLIDATED STATEMENTS OF INCOME | ||||||
(Dollars in thousands, except share data) | ||||||
(unaudited) | ||||||
Three months | ||||||
ended March 31, | ||||||
2015 | 2014 | |||||
Interest income: | ||||||
Loan interest | $ | 171,944 | 156,896 | |||
Investment interest | 2,205 | 1,979 | ||||
Total interest income | 174,149 | 158,875 | ||||
Interest expense: | ||||||
Interest on bonds and notes payable | 71,554 | 60,004 | ||||
Net interest income | 102,595 | 98,871 | ||||
Less provision for loan losses | 2,000 | 2,500 | ||||
Net interest income after provision for loan losses | 100,595 | 96,371 | ||||
Other income (expense): | ||||||
Loan and guaranty servicing revenue | 57,811 | 64,757 | ||||
Tuition payment processing, school information, and campus commerce revenue | 34,680 | 25,235 | ||||
Enrollment services revenue | 17,863 | 22,011 | ||||
Other income | 6,918 | 18,131 | ||||
Gain on sale of loans and debt repurchases | 2,875 | 39 | ||||
Derivative market value and foreign currency adjustments and derivative settlements, net | (3,078 | ) | (4,265 | ) | ||
Total other income | 117,069 | 125,908 | ||||
Operating expenses: | ||||||
Salaries and benefits | 61,050 | 52,484 | ||||
Cost to provide enrollment services | 11,702 | 14,475 | ||||
Loan servicing fees | 7,685 | 5,421 | ||||
Depreciation and amortization | 5,662 | 4,783 | ||||
Other | 29,129 | 30,206 | ||||
Total operating expenses | 115,228 | 107,369 | ||||
Income before income taxes | 102,436 | 114,910 | ||||
Income tax expense | 37,630 | 40,611 | ||||
Net income | 64,806 | 74,299 | ||||
Net income attributable to noncontrolling interest | 41 | 513 | ||||
Net income attributable to Nelnet, Inc. | $ | 64,765 | 73,786 | |||
Earnings per common share: | ||||||
Net income attributable to Nelnet, Inc. shareholders - basic and diluted | $ | 1.40 | 1.59 | |||
Weighted average common shares outstanding - basic and diluted | 46,290,590 | 46,527,917 | ||||
See accompanying notes to consolidated financial statements.
3
NELNET, INC. AND SUBSIDIARIES | ||||||
CONSOLIDATED STATEMENTS OF COMPREHENSIVE INCOME | ||||||
(Dollars in thousands) | ||||||
(unaudited) | ||||||
Three months | ||||||
ended March 31, | ||||||
2015 | 2014 | |||||
Net income | $ | 64,806 | 74,299 | |||
Other comprehensive income (loss): | ||||||
Available-for-sale securities: | ||||||
Unrealized holding (losses) gains arising during period, net | (213 | ) | 3,675 | |||
Less reclassification adjustment for gains recognized in net income, net of losses | (205 | ) | (7,073 | ) | ||
Income tax effect | 155 | 1,258 | ||||
Total other comprehensive loss | (263 | ) | (2,140 | ) | ||
Comprehensive income | 64,543 | 72,159 | ||||
Comprehensive income attributable to noncontrolling interest | 41 | 513 | ||||
Comprehensive income attributable to Nelnet, Inc. | $ | 64,502 | 71,646 | |||
See accompanying notes to consolidated financial statements.
4
NELNET, INC. AND SUBSIDIARIES | |||||||||||||||||||||||||||||||||
CONSOLIDATED STATEMENTS OF SHAREHOLDERS' EQUITY | |||||||||||||||||||||||||||||||||
(Dollars in thousands, except share data) | |||||||||||||||||||||||||||||||||
(unaudited) | |||||||||||||||||||||||||||||||||
Nelnet, Inc. Shareholders | |||||||||||||||||||||||||||||||||
Preferred stock shares | Common stock shares | Preferred stock | Class A common stock | Class B common stock | Additional paid-in capital | Retained earnings | Accumulated other comprehensive earnings | Noncontrolling interest | Total equity | ||||||||||||||||||||||||
Class A | Class B | ||||||||||||||||||||||||||||||||
Balance as of December 31, 2013 | — | 34,881,338 | 11,495,377 | $ | — | 349 | 115 | 24,887 | 1,413,492 | 4,819 | 328 | 1,443,990 | |||||||||||||||||||||
Issuance of noncontrolling interest | — | — | — | — | — | — | — | — | — | 201 | 201 | ||||||||||||||||||||||
Net income | — | — | — | — | — | — | — | 73,786 | — | 513 | 74,299 | ||||||||||||||||||||||
Other comprehensive loss | — | — | — | — | — | — | — | — | (2,140 | ) | — | (2,140 | ) | ||||||||||||||||||||
Distribution to noncontrolling interest | — | — | — | — | — | — | — | — | — | (287 | ) | (287 | ) | ||||||||||||||||||||
Cash dividends on Class A and Class B common stock - $0.10 per share | — | — | — | — | — | — | — | (4,641 | ) | — | — | (4,641 | ) | ||||||||||||||||||||
Issuance of common stock, net of forfeitures | — | 155,705 | — | — | 2 | — | 2,244 | — | — | — | 2,246 | ||||||||||||||||||||||
Compensation expense for stock based awards | — | — | — | — | — | — | 875 | — | — | — | 875 | ||||||||||||||||||||||
Repurchase of common stock | — | (20,564 | ) | — | — | (1 | ) | — | (868 | ) | — | — | — | (869 | ) | ||||||||||||||||||
Conversion of common stock | — | 3,445 | (3,445 | ) | — | — | — | — | — | — | — | — | |||||||||||||||||||||
Balance as of March 31, 2014 | — | 35,019,924 | 11,491,932 | $ | — | 350 | 115 | 27,138 | 1,482,637 | 2,679 | 755 | 1,513,674 | |||||||||||||||||||||
Balance as of December 31, 2014 | — | 34,756,384 | 11,486,932 | $ | — | 348 | 115 | 17,290 | 1,702,560 | 5,135 | 230 | 1,725,678 | |||||||||||||||||||||
Net income | — | — | — | — | — | — | — | 64,765 | — | 41 | 64,806 | ||||||||||||||||||||||
Other comprehensive loss | — | — | — | — | — | — | — | — | (263 | ) | — | (263 | ) | ||||||||||||||||||||
Cash dividends on Class A and Class B common stock - $0.10 per share | — | — | — | — | — | — | — | (4,614 | ) | — | — | (4,614 | ) | ||||||||||||||||||||
Issuance of common stock, net of forfeitures | — | 132,479 | — | — | 1 | — | 2,467 | — | — | — | 2,468 | ||||||||||||||||||||||
Compensation expense for stock based awards | — | — | — | — | — | — | 1,357 | — | — | — | 1,357 | ||||||||||||||||||||||
Repurchase of common stock | — | (175,798 | ) | — | — | (2 | ) | — | (7,937 | ) | — | — | — | (7,939 | ) | ||||||||||||||||||
Balance as of March 31, 2015 | — | 34,713,065 | 11,486,932 | $ | — | 347 | 115 | 13,177 | 1,762,711 | 4,872 | 271 | 1,781,493 | |||||||||||||||||||||
See accompanying notes to consolidated financial statements.
5
NELNET, INC. AND SUBSIDIARIES | ||||||
CONSOLIDATED STATEMENTS OF CASH FLOWS | ||||||
(Dollars in thousands) | ||||||
(unaudited) | ||||||
Three months | ||||||
ended March 31, | ||||||
2015 | 2014 | |||||
Net income attributable to Nelnet, Inc. | $ | 64,765 | 73,786 | |||
Net income attributable to noncontrolling interest | 41 | 513 | ||||
Net income | 64,806 | 74,299 | ||||
Adjustments to reconcile net income to net cash provided by operating activities, net of acquisitions: | ||||||
Depreciation and amortization, including debt discounts and student loan premiums and deferred origination costs | 30,225 | 21,999 | ||||
Student loan discount accretion | (10,746 | ) | (10,023 | ) | ||
Provision for loan losses | 2,000 | 2,500 | ||||
Derivative market value adjustment | 46,072 | (2,916 | ) | |||
Foreign currency transaction adjustment | (48,209 | ) | 952 | |||
Proceeds from termination of derivative instruments | 34,447 | — | ||||
Gain on sale of loans | (351 | ) | — | |||
Gain from debt repurchases | (2,524 | ) | (39 | ) | ||
Gain from sales of available-for-sale securities, net | (205 | ) | (7,073 | ) | ||
Proceeds (payments) from sales (purchases) of trading securities, net | 1,304 | (731 | ) | |||
Deferred income tax expense | 224 | 2,497 | ||||
Other | 3,115 | 2,285 | ||||
(Increase) decrease in accrued interest receivable | (3,784 | ) | 8,881 | |||
Increase in accounts receivable | (5,416 | ) | (5,758 | ) | ||
Decrease in other assets | 605 | 1,303 | ||||
Increase in accrued interest payable | 1,371 | 613 | ||||
Increase (decrease) in other liabilities | 16,414 | (185 | ) | |||
Net cash provided by operating activities | 129,348 | 88,604 | ||||
Cash flows from investing activities, net of acquisitions: | ||||||
Purchases of student loans | (844,120 | ) | (386,100 | ) | ||
Net proceeds from student loan repayments, claims, capitalized interest, participations, and other | 940,907 | 686,908 | ||||
Proceeds from sale of student loans | 3,996 | — | ||||
Purchases of available-for-sale securities | (512 | ) | (69,930 | ) | ||
Proceeds from sales of available-for-sale securities | 1,317 | 99,799 | ||||
Purchases of investments and issuance of notes receivable | (49,953 | ) | (14,467 | ) | ||
Proceeds from investments and notes receivable | 4,709 | — | ||||
Purchases of property and equipment, net | (8,372 | ) | (3,146 | ) | ||
(Increase) decrease in restricted cash and investments, net | (16,147 | ) | 29,356 | |||
Business acquisition, net of cash acquired | — | (1,909 | ) | |||
Net cash provided by investing activities | 31,825 | 340,511 | ||||
Cash flows from financing activities: | ||||||
Payments on bonds and notes payable | (1,459,807 | ) | (1,347,517 | ) | ||
Proceeds from issuance of bonds and notes payable | 1,285,760 | 972,384 | ||||
Payments of debt issuance costs | (5,256 | ) | (4,700 | ) | ||
Dividends paid | (4,614 | ) | (4,641 | ) | ||
Repurchases of common stock | (7,939 | ) | (869 | ) | ||
Proceeds from issuance of common stock | 248 | 149 | ||||
Issuance of noncontrolling interest | — | 201 | ||||
Distribution to noncontrolling interest | — | (287 | ) | |||
Net cash used in financing activities | (191,608 | ) | (385,280 | ) | ||
Net (decrease) increase in cash and cash equivalents | (30,435 | ) | 43,835 | |||
Cash and cash equivalents, beginning of period | 130,481 | 63,267 | ||||
Cash and cash equivalents, end of period | $ | 100,046 | 107,102 | |||
Cash disbursements made for: | ||||||
Interest | $ | 53,235 | 48,750 | |||
Income taxes, net of refunds | $ | 45 | 13,378 | |||
See accompanying notes to consolidated financial statements.
6
NELNET, INC. AND SUBSIDIARIES
NOTES TO CONSOLIDATED FINANCIAL STATEMENTS
(Dollars in thousands, except per share amounts, unless otherwise noted)
(unaudited)
1. Basis of Financial Reporting
The accompanying unaudited consolidated financial statements of Nelnet, Inc. and subsidiaries (the “Company”) as of March 31, 2015 and for the three months ended March 31, 2015 and 2014 have been prepared on the same basis as the audited consolidated financial statements for the year ended December 31, 2014 and, in the opinion of the Company’s management, the unaudited consolidated financial statements reflect all adjustments, consisting of normal recurring adjustments, necessary for a fair presentation of results of operations for the interim periods presented. The preparation of financial statements in conformity with U.S. generally accepted accounting principles requires management to make estimates and assumptions that affect the amounts reported in the consolidated financial statements and accompanying notes. Actual results could differ from those estimates. Operating results for the three months ended March 31, 2015 are not necessarily indicative of the results for the year ending December 31, 2015. The unaudited consolidated financial statements should be read in conjunction with the Company’s Annual Report on Form 10-K for the year ended December 31, 2014 (the "2014 Annual Report").
Reclassifications
Certain amounts previously reported within the Company's consolidated balance sheet and statements of income have been reclassified to conform to the current period presentation. These reclassifications include:
• | Reclassifying certain investments and notes receivable, which were previously included in "other assets" to "investments and notes receivable." |
• | Reclassifying third-party loan servicing fees, which were previously included in "other" operating expenses to "loan servicing fees." |
The reclassifications had no effect on consolidated net income or consolidated assets and liabilities.
2. Student Loans Receivable and Allowance for Loan Losses
Student loans receivable consisted of the following:
As of | As of | |||||
March 31, 2015 | December 31, 2014 | |||||
Federally insured loans | ||||||
Stafford and other | $ | 6,287,829 | 6,030,825 | |||
Consolidation | 21,687,746 | 22,165,605 | ||||
Total | 27,975,575 | 28,196,430 | ||||
Private education loans | 131,513 | 27,478 | ||||
28,107,088 | 28,223,908 | |||||
Loan discount, net of unamortized loan premiums and deferred origination costs (a) | (157,978 | ) | (169,813 | ) | ||
Allowance for loan losses – federally insured loans | (38,021 | ) | (39,170 | ) | ||
Allowance for loan losses – private education loans | (13,140 | ) | (9,730 | ) | ||
$ | 27,897,949 | 28,005,195 | ||||
(a) | As of March 31, 2015 and December 31, 2014, "loan discount, net of unamortized loan premiums and deferred origination costs" included $32.4 million and $28.8 million, respectively, of non-accretable discount associated with purchased loans of $8.9 billion and $8.5 billion, respectively. |
7
On February 5, 2015, the Company entered into an agreement with CommonBond, Inc. ("CommonBond"), a student lending company that provides private education loans to graduate students, under which the Company committed to purchase up to $150.0 million of private education loans. As of March 31, 2015, the Company had purchased $15.2 million in private loans from CommonBond pursuant to this agreement.
Activity in the Allowance for Loan Losses
The provision for loan losses represents the periodic expense of maintaining an allowance sufficient to absorb losses, net of recoveries, inherent in the portfolio of student loans. Activity in the allowance for loan losses is shown below.
Three months ended March 31, | ||||||
2015 | 2014 | |||||
Balance at beginning of period | $ | 48,900 | 55,122 | |||
Provision for loan losses: | ||||||
Federally insured loans | 2,000 | 3,000 | ||||
Private education loans | — | (500 | ) | |||
Total provision for loan losses | 2,000 | 2,500 | ||||
Charge-offs: | ||||||
Federally insured loans | (3,149 | ) | (3,631 | ) | ||
Private education loans | (676 | ) | (421 | ) | ||
Total charge-offs | (3,825 | ) | (4,052 | ) | ||
Recoveries - private education loans | 254 | 371 | ||||
Purchase (sale) of federally insured and private education loans, net | (230 | ) | 100 | |||
Transfer from repurchase obligation related to private education loans repurchased | 4,062 | 587 | ||||
Balance at end of period | $ | 51,161 | 54,628 | |||
Allocation of the allowance for loan losses: | ||||||
Federally insured loans | $ | 38,021 | 42,909 | |||
Private education loans | 13,140 | 11,719 | ||||
Total allowance for loan losses | $ | 51,161 | 54,628 | |||
Repurchase Obligation
The Company has sold various portfolios of private education loans to third-parties. Per the terms of the servicing agreements, the Company’s servicing operations are obligated to repurchase loans subject to the sale agreements in the event such loans become 60 or 90 days delinquent. As of March 31, 2015 and December 31, 2014, the balance of loans subject to these repurchase obligations was $57.7 million and $155.3 million, respectively, and the associated obligation related to these loans was $3.9 million and $11.8 million, respectively. The Company repurchased $94.1 million of private education loans during the three month period ended March 31, 2015. The Company's estimate related to its obligation to repurchase these loans is included in "other liabilities" in the Company's consolidated balance sheets.
8
Student Loan Status and Delinquencies
Delinquencies have the potential to adversely impact the Company’s earnings through increased servicing and collection costs and account charge-offs. The table below shows the Company’s loan delinquency amounts.
As of March 31, 2015 | As of December 31, 2014 | As of March 31, 2014 | ||||||||||||||||||
Federally insured loans: | ||||||||||||||||||||
Loans in-school/grace/deferment | $ | 2,781,537 | $ | 2,805,228 | $ | 2,879,382 | ||||||||||||||
Loans in forbearance | 3,244,255 | 3,288,412 | 3,213,638 | |||||||||||||||||
Loans in repayment status: | ||||||||||||||||||||
Loans current | 18,672,471 | 85.0 | % | 18,460,279 | 83.5 | % | 16,498,560 | 83.9 | % | |||||||||||
Loans delinquent 31-60 days | 911,653 | 4.2 | 1,043,119 | 4.8 | 832,381 | 4.2 | ||||||||||||||
Loans delinquent 61-90 days | 571,759 | 2.6 | 588,777 | 2.7 | 522,699 | 2.7 | ||||||||||||||
Loans delinquent 91-120 days | 346,857 | 1.6 | 404,905 | 1.8 | 344,143 | 1.8 | ||||||||||||||
Loans delinquent 121-270 days | 1,030,645 | 4.7 | 1,204,405 | 5.4 | 984,648 | 5.0 | ||||||||||||||
Loans delinquent 271 days or greater | 416,398 | 1.9 | 401,305 | 1.8 | 470,204 | 2.4 | ||||||||||||||
Total loans in repayment | 21,949,783 | 100.0 | % | 22,102,790 | 100.0 | % | 19,652,635 | 100.0 | % | |||||||||||
Total federally insured loans | $ | 27,975,575 | $ | 28,196,430 | $ | 25,745,655 | ||||||||||||||
Private education loans: | ||||||||||||||||||||
Loans in-school/grace/deferment | $ | 5,006 | $ | 905 | $ | 2,612 | ||||||||||||||
Loans in forbearance | 20 | — | 24 | |||||||||||||||||
Loans in repayment status: | ||||||||||||||||||||
Loans current | 118,278 | 93.5 | % | 18,390 | 69.2 | % | 57,115 | 86.6 | % | |||||||||||
Loans delinquent 31-60 days | 1,200 | 0.9 | 1,078 | 4.1 | 1,223 | 1.9 | ||||||||||||||
Loans delinquent 61-90 days | 1,753 | 1.4 | 1,035 | 3.9 | 1,748 | 2.7 | ||||||||||||||
Loans delinquent 91 days or greater | 5,256 | 4.2 | 6,070 | 22.8 | 5,818 | 8.8 | ||||||||||||||
Total loans in repayment | 126,487 | 100.0 | % | 26,573 | 100.0 | % | 65,904 | 100.0 | % | |||||||||||
Total non-federally insured loans | $ | 131,513 | $ | 27,478 | $ | 68,540 | ||||||||||||||
9
3. Bonds and Notes Payable
The following tables summarize the Company’s outstanding debt obligations by type of instrument:
As of March 31, 2015 | |||||||
Carrying amount | Interest rate range | Final maturity | |||||
Variable-rate bonds and notes issued in asset-backed securitizations: | |||||||
Bonds and notes based on indices | $ | 25,850,638 | 0.16% - 6.90% | 8/26/19 - 8/26/52 | |||
Bonds and notes based on auction | 1,197,065 | 0.64% - 2.16% | 3/22/32 - 11/26/46 | ||||
Total variable-rate bonds and notes | 27,047,703 | ||||||
FFELP warehouse facilities | 1,010,258 | 0.17% - 0.29% | 1/17/16 - 12/17/17 | ||||
Unsecured line of credit | — | — | 6/30/19 | ||||
Unsecured debt - Junior Subordinated Hybrid Securities | 59,837 | 3.65% | 9/15/61 | ||||
Other borrowings | 82,305 | 1.68% - 5.10% | 11/11/15 - 12/31/18 | ||||
28,200,103 | |||||||
Discount on bonds and notes payable | (384,779 | ) | |||||
Total | $ | 27,815,324 | |||||
As of December 31, 2014 | |||||||
Carrying amount | Interest rate range | Final maturity | |||||
Variable-rate bonds and notes issued in asset-backed securitizations: | |||||||
Bonds and notes based on indices | $ | 25,713,431 | 0.19% - 6.90% | 5/25/18 - 8/26/52 | |||
Bonds and notes based on auction | 1,311,669 | 0.47% - 2.17% | 3/22/32 - 11/26/46 | ||||
Total variable-rate bonds and notes | 27,025,100 | ||||||
FFELP warehouse facilities | 1,241,665 | 0.16% - 0.26% | 1/17/16 - 6/11/17 | ||||
Unsecured line of credit | — | — | 6/30/19 | ||||
Unsecured debt - Junior Subordinated Hybrid Securities | 71,688 | 3.63% | 9/15/61 | ||||
Other borrowings | 81,969 | 1.67% - 5.10% | 11/11/15 - 12/31/18 | ||||
28,420,422 | |||||||
Discount on bonds and notes payable | (393,072 | ) | |||||
Total | $ | 28,027,350 | |||||
10
FFELP Warehouse Facilities
The Company funds a portion of its FFELP loan acquisitions using its FFELP warehouse facilities. Student loan warehousing allows the Company to buy and manage student loans prior to transferring them into more permanent financing arrangements.
As of March 31, 2015, the Company had three FFELP warehouse facilities as summarized below.
NHELP-III (a) | NFSLW-I (b) | NHELP-II | Total | ||||||||||
Maximum financing amount | $ | 750,000 | 750,000 | 500,000 | 2,000,000 | ||||||||
Amount outstanding | 537,005 | 404,020 | 69,233 | 1,010,258 | |||||||||
Amount available | $ | 212,995 | 345,980 | 430,767 | 989,742 | ||||||||
Expiration of liquidity provisions | May 5, 2015 | June 11, 2015 | December 17, 2015 | ||||||||||
Final maturity date | January 17, 2016 | June 11, 2017 | December 17, 2017 | ||||||||||
Maximum advance rates | 92.2 - 95.0% | 92.0 - 98.0% | 91.0 - 97.0% | ||||||||||
Minimum advance rates | 92.2 - 95.0% | 84.0 - 90.0% | 91.0 - 97.0% | ||||||||||
Advanced as equity support | $ | 32,515 | 19,001 | 3,640 | 55,156 | ||||||||
(a) | On April 30, 2015, the Company amended the agreement for this warehouse facility to change the expiration date for the liquidity provisions to April 29, 2016, and to change the final maturity date to April 29, 2018. |
(b) | On January 27, 2015, the Company amended the agreement for this warehouse facility to temporarily increase the maximum financing amount to $1.2 billion. On March 26, 2015, the Company reduced the maximum financing amount from $1.2 billion to $750 million. |
Asset-backed Securitizations
The following table summarizes the asset-backed securitization transactions completed during the three months ended March 31, 2015.
2015-1 | 2015-2 | Total | |||||||||||||||
Class A-1 notes | Class A-2 notes | 2015-2 total | |||||||||||||||
Date securities issued | 2/27/15 | 3/26/15 | 3/26/15 | 3/26/15 | |||||||||||||
Total original principal amount | $ | 566,346 | 122,500 | 584,500 | 722,000 | $ | 1,288,346 | ||||||||||
Class A senior notes: | |||||||||||||||||
Total original principal amount | $ | 553,232 | 122,500 | 584,500 | 707,000 | 1,260,232 | |||||||||||
Bond discount | — | — | — | — | — | ||||||||||||
Issue price | $ | 553,232 | 122,500 | 584,500 | 707,000 | 1,260,232 | |||||||||||
Cost of funds (1-month LIBOR plus:) | 0.59 | % | 0.27 | % | 0.60 | % | |||||||||||
Final maturity date | 4/25/41 | 3/25/20 | 9/25/42 | ||||||||||||||
Class B subordinated notes: | |||||||||||||||||
Total original principal amount | $ | 13,114 | 15,000 | 28,114 | |||||||||||||
Bond discount | (1,157 | ) | (1,793 | ) | (2,950 | ) | |||||||||||
Issue price | $ | 11,957 | 13,207 | 25,164 | |||||||||||||
Cost of funds (1-month LIBOR plus:) | 1.50 | % | 1.50 | % | |||||||||||||
Final maturity date | 6/25/46 | 5/25/49 | |||||||||||||||
Unsecured Line of Credit
The Company has a $350.0 million line of credit that has a maturity date of June 30, 2019. As of March 31, 2015, the $350.0 million unsecured line of credit had no amount outstanding and $350.0 million was available for future use.
11
Debt Repurchases
During the three months ended March 31, 2015 and 2014, the Company repurchased $11.9 million (par value) of its Junior Subordinated Hybrid Securities unsecured debt and $1.4 million (par value) of its own asset-backed debt securities and recognized gains on such purchases of $2.5 million and approximately $39,000, respectively.
4. Derivative Financial Instruments
The Company uses derivative financial instruments primarily to manage interest rate risk and foreign currency exchange risk. Derivative instruments used as part of the Company's risk management strategy are further described in note 5 of the notes to consolidated financial statements included in the 2014 Annual Report. A tabular presentation of such derivatives outstanding as of March 31, 2015 and December 31, 2014 is presented below.
Basis Swaps
The following table summarizes the Company’s basis swaps outstanding as of March 31, 2015 and December 31, 2014 in which the Company receives three-month LIBOR set discretely in advance and pays one-month LIBOR plus or minus a spread as defined in the agreements (the "1:3 Basis Swaps").
As of March 31, | As of December 31, | |||||||||
2015 | 2014 | |||||||||
Maturity | Notional amount | Notional amount | ||||||||
2016 | $ | 1,000,000 | $ | — | ||||||
2021 | — | 250,000 | ||||||||
2022 | 1,900,000 | 1,900,000 | ||||||||
2023 | 2,400,000 | 3,650,000 | ||||||||
2024 | — | 250,000 | ||||||||
2026 | 800,000 | 800,000 | ||||||||
2028 | — | 100,000 | ||||||||
2036 | — | 700,000 | ||||||||
2039 | — | 150,000 | ||||||||
$ | 6,100,000 | $ | 7,800,000 | |||||||
The weighted average rate paid by the Company on the 1:3 Basis Swaps as of March 31, 2015 and December 31, 2014 was one-month LIBOR plus 6.0 basis points and 3.5 basis points, respectively.
Interest Rate Swaps – Floor Income Hedges
The following table summarizes the outstanding derivative instruments used by the Company to economically hedge loans earning fixed rate floor income.
As of March 31, 2015 | As of December 31, 2014 | |||||||||||||
Maturity | Notional amount | Weighted average fixed rate paid by the Company (a) | Notional amount | Weighted average fixed rate paid by the Company (a) | ||||||||||
2015 | $ | 1,100,000 | 0.89 | % | $ | 1,100,000 | 0.89 | % | ||||||
2016 | 750,000 | 0.85 | 750,000 | 0.85 | ||||||||||
2017 | 1,350,000 | 0.85 | 1,250,000 | 0.86 | ||||||||||
2018 | 100,000 | 1.02 | — | — | ||||||||||
2025 | 100,000 | 2.32 | — | — | ||||||||||
2045 | 25,000 | 2.46 | — | — | ||||||||||
$ | 3,425,000 | 0.92 | % | $ | 3,100,000 | 0.87 | % | |||||||
(a) | For all interest rate derivatives, the Company receives discrete three-month LIBOR. |
12
On August 20, 2014, the Company paid $9.1 million for an interest rate swap option to economically hedge loans earning fixed rate floor income. The interest rate swap option gives the Company the right, but not the obligation, to enter into a $250 million notional interest rate swap in which the Company would pay a fixed amount of 3.30% and receive discrete one-month LIBOR. If the interest rate swap option is exercised, the swap would become effective in 2019 and mature in 2024.
Interest Rate Swaps – Unsecured Debt Hedges
The Company had the following derivatives outstanding as of March 31, 2015 and December 31, 2014 that are used to effectively convert the variable interest rate on a portion of the Junior Subordinated Hybrid Securities to a fixed rate.
Maturity | Notional amount | Weighted average fixed rate paid by the Company (a) | |||||
2036 | $ | 25,000 | 4.28 | % | |||
(a) | For all interest rate derivatives, the Company receives discrete three-month LIBOR. |
Foreign Currency Exchange Risk
In 2006, the Company issued €352.7 million of student loan asset-backed Euro Notes (the "Euro Notes") with an interest rate based on a spread to the EURIBOR index. As a result of the Euro Notes, the Company is exposed to market risk related to fluctuations in foreign currency exchange rates between the U.S. dollar and Euro. The principal and accrued interest on these notes are re-measured at each reporting period and recorded in the Company’s consolidated balance sheet in U.S. dollars based on the foreign currency exchange rate on that date.
The Company entered into a cross-currency interest rate swap in connection with the issuance of the Euro Notes. Under the terms of the cross-currency interest rate swap, the Company receives from the counterparty a spread to the EURIBOR index based on a notional amount of €352.7 million and pays a spread to the LIBOR index based on a notional amount of $450.0 million. In addition, under the terms of this agreement, all principal payments on the Euro Notes will effectively be paid at the exchange rate in effect between the U.S. dollar and Euro as of the issuance of the notes.
The following table shows the income statement impact as a result of the re-measurement of the Euro Notes and the change in the fair value of the related derivative instrument.
Three months ended March 31, | ||||||
2015 | 2014 | |||||
Re-measurement of Euro Notes | $ | 48,209 | (952 | ) | ||
Change in fair value of cross-currency interest rate swap | (49,805 | ) | (39 | ) | ||
Total impact to consolidated statements of income - income (expense) (a) | $ | (1,596 | ) | (991 | ) | |
(a) | The financial statement impact of the above items is included in "Derivative market value and foreign currency adjustments and derivative settlements, net" in the Company's consolidated statements of income. |
The re-measurement of the Euro-denominated bonds generally correlates with the change in fair value of the corresponding cross-currency interest rate swap. However, the Company will experience unrealized gains or losses related to the cross-currency interest rate swap if the two underlying indices (and related forward curve) do not move in parallel.
13
Consolidated Financial Statement Impact Related to Derivatives
The following table summarizes the fair value of the Company’s derivatives as reflected in the consolidated balance sheets:
Fair value of asset derivatives | Fair value of liability derivatives | |||||||||||
As of | As of | As of | As of | |||||||||
March 31, 2015 | December 31, 2014 | March 31, 2015 | December 31, 2014 | |||||||||
1:3 basis swaps | $ | 30,072 | 53,549 | — | — | |||||||
Interest rate swaps - floor income hedges | 1,756 | 5,165 | 6,498 | 5,034 | ||||||||
Interest rate swap option - floor income hedge | 4,767 | 5,678 | — | — | ||||||||
Interest rate swaps - hybrid debt hedges | — | — | 8,805 | 7,353 | ||||||||
Cross-currency interest rate swap | — | — | 70,261 | 20,455 | ||||||||
Total | $ | 36,595 | 64,392 | 85,564 | 32,842 | |||||||
During the three months ended March 31, 2015, the Company terminated a total notional amount of $2.7 billion of 1:3 Basis Swaps for gross proceeds of $34.4 million.
Offsetting of Derivative Assets/Liabilities
The Company records derivative instruments in the consolidated balance sheets on a gross basis as either an asset or liability measured at its fair value. Certain of the Company's derivative instruments are subject to right of offset provisions with counterparties. The following tables include the gross amounts related to the Company's derivative portfolio recognized in the consolidated balance sheets, reconciled to the net amount when excluding derivatives subject to enforceable master netting arrangements and cash collateral received/pledged:
Gross amounts not offset in the consolidated balance sheets | |||||||||||||
Derivative assets | Gross amounts of recognized assets presented in the consolidated balance sheets | Derivatives subject to enforceable master netting arrangement | Cash collateral pledged (received) | Net asset (liability) | |||||||||
Balance as of March 31, 2015 | $ | 36,595 | (9,761 | ) | 5,556 | 32,390 | |||||||
Balance as of December 31, 2014 | 64,392 | (12,387 | ) | — | 52,005 | ||||||||
Gross amounts not offset in the consolidated balance sheets | |||||||||||||
Derivative liabilities | Gross amounts of recognized liabilities presented in the consolidated balance sheets | Derivatives subject to enforceable master netting arrangement | Cash collateral pledged (received) | Net asset (liability) | |||||||||
Balance as of March 31, 2015 | $ | (85,564 | ) | 9,761 | 6,400 | (69,403 | ) | ||||||
Balance as of December 31, 2014 | (32,842 | ) | 12,387 | (1,454 | ) | (21,909 | ) | ||||||
14
The following table summarizes the effect of derivative instruments in the consolidated statements of income.
Three months ended March 31, | ||||||
2015 | 2014 | |||||
Settlements: | ||||||
1:3 basis swaps | $ | 266 | 881 | |||
Interest rate swaps - floor income hedges | (5,015 | ) | (6,950 | ) | ||
Interest rate swaps - hybrid debt hedges | (252 | ) | (252 | ) | ||
Cross-currency interest rate swap | (214 | ) | 92 | |||
Total settlements - (expense) income | (5,215 | ) | (6,229 | ) | ||
Change in fair value: | ||||||
1:3 basis swaps | 10,969 | 1,110 | ||||
Interest rate swaps - floor income hedges | (4,872 | ) | 3,358 | |||
Interest rate swap option - floor income hedge | (912 | ) | — | |||
Interest rate swaps - hybrid debt hedges | (1,452 | ) | (1,513 | ) | ||
Cross-currency interest rate swap | (49,805 | ) | (39 | ) | ||
Total change in fair value - (expense) income | (46,072 | ) | 2,916 | |||
Re-measurement of Euro Notes (foreign currency transaction adjustment) - income (expense) | 48,209 | (952 | ) | |||
Derivative market value and foreign currency adjustments and derivative settlements, net - income (expense) | $ | (3,078 | ) | (4,265 | ) | |
5. Investments and Notes Receivable
A summary of the Company's investments and notes receivable follows:
As of March 31, 2015 | As of December 31, 2014 | ||||||||||||||||||||||||
Amortized cost | Gross unrealized gains | Gross unrealized losses (a) | Fair value | Amortized cost | Gross unrealized gains | Gross unrealized losses | Fair value | ||||||||||||||||||
Investments (at fair value): | |||||||||||||||||||||||||
Available-for-sale investments: | |||||||||||||||||||||||||
Student loan asset-backed and other debt securities (b) | $ | 130,754 | 5,998 | (484 | ) | 136,268 | 131,589 | 6,204 | (236 | ) | 137,557 | ||||||||||||||
Equity securities | 1,787 | 2,268 | (48 | ) | 4,007 | 1,553 | 2,216 | (33 | ) | 3,736 | |||||||||||||||
Total available-for-sale investments | $ | 132,541 | 8,266 | (532 | ) | 140,275 | 133,142 | 8,420 | (269 | ) | 141,293 | ||||||||||||||
Trading investments: | |||||||||||||||||||||||||
Student loan asset-backed securities | 6,526 | 7,830 | |||||||||||||||||||||||
Total available-for-sale and trading investments | 146,801 | 149,123 | |||||||||||||||||||||||
Other Investments and Notes Receivable (not measured at fair value): | |||||||||||||||||||||||||
Investments accounted for under the cost and equity methods | 81,912 | 36,991 | |||||||||||||||||||||||
Notes receivable | 31,806 | 30,643 | |||||||||||||||||||||||
Other | 16,385 | 18,952 | |||||||||||||||||||||||
Total investments and notes receivable | $ | 276,904 | 235,709 | ||||||||||||||||||||||
(a) | As of March 31, 2015, the Company considered the decline in market value of its available-for-sale investments to be temporary in nature and did not consider any of its investments other-than-temporarily impaired. |
(b) | As of March 31, 2015, the stated maturities of the majority of the Company's student loan asset-backed and other debt securities classified as available-for-sale were greater than 10 years. |
15
The amounts reclassified from accumulated other comprehensive income related to the realized gains and losses on available-for-sale-securities are summarized below.
Three months ended March 31, | |||||||
Affected line item in the consolidated statements of income - income (expense): | 2015 | 2014 | |||||
Other income | $ | 205 | 7,073 | ||||
Income tax expense | (76 | ) | (2,617 | ) | |||
Net | $ | 129 | 4,456 | ||||
6. Intangible Assets and Goodwill
Intangible assets consist of the following:
Weighted average remaining useful life as of March 31, 2015 (months) | As of March 31, 2015 | As of December 31, 2014 | ||||||
Amortizable intangible assets: | ||||||||
Customer relationships (net of accumulated amortization of $18,820 and $17,361, respectively) | 211 | $ | 25,871 | 27,330 | ||||
Computer software (net of accumulated amortization of $2,472 and $1,896, respectively) | 39 | 6,393 | 6,969 | |||||
Trade names (net of accumulated amortization of $403 and $272, respectively) | 230 | 6,019 | 6,150 | |||||
Content (net of accumulated amortization of $225 and $0, respectively) | 21 | 1,575 | 1,800 | |||||
Covenants not to compete (net of accumulated amortization of $30 and $21, respectively) | 110 | 325 | 333 | |||||
Total - amortizable intangible assets | 178 | $ | 40,183 | 42,582 | ||||
The Company recorded amortization expense on its intangible assets of $2.4 million and $1.0 million during the three months ended March 31, 2015 and 2014, respectively. The Company will continue to amortize intangible assets over their remaining useful lives. As of March 31, 2015, the Company estimates it will record amortization expense as follows:
2015 (April 1 - December 31) | $ | 7,196 | |
2016 | 6,249 | ||
2017 | 3,752 | ||
2018 | 3,533 | ||
2019 | 2,861 | ||
2020 and thereafter | 16,592 | ||
$ | 40,183 | ||
There were no changes in the carrying amount of goodwill during the three months ended March 31, 2015. The carrying amount of goodwill by reportable operating segment as of March 31, 2015 and December 31, 2014 is shown in the table below.
Student Loan and Guaranty Servicing | Tuition Payment Processing and Campus Commerce | Asset Generation and Management | Corporate and Other Activities | Total | |||||||||||
Balance as of December 31, 2014 and March 31, 2015 | $ | 8,596 | 67,168 | 41,883 | 8,553 | 126,200 | |||||||||
16
7. Earnings per Common Share
Presented below is a summary of the components used to calculate basic and diluted earnings per share. The Company applies the two-class method in computing both basic and diluted earnings per share, which requires the calculation of separate earnings per share amounts for common stock and unvested share based awards. Unvested share-based awards that contain nonforfeitable rights to dividends are considered securities which participate in undistributed earnings with common stock.
Three months ended March 31, | ||||||||||||||||||
2015 | 2014 | |||||||||||||||||
Common shareholders | Unvested restricted stock shareholders | Total | Common shareholders | Unvested restricted stock shareholders | Total | |||||||||||||
Numerator: | ||||||||||||||||||
Net income attributable to Nelnet, Inc. | $ | 64,078 | 687 | 64,765 | 73,125 | 661 | 73,786 | |||||||||||
Denominator: | ||||||||||||||||||
Weighted-average common shares outstanding - basic and diluted | 45,799,873 | 490,717 | 46,290,590 | 46,110,952 | 416,965 | 46,527,917 | ||||||||||||
Earnings per share - basic and diluted | $ | 1.40 | 1.40 | 1.40 | 1.59 | 1.59 | 1.59 | |||||||||||
Unvested restricted stock awards are the Company's only potential common shares and, accordingly, there were no awards that were antidilutive and not included in average shares outstanding for the diluted earnings per share calculation.
17
8. Segment Reporting
See note 14 of the notes to consolidated financial statements included in the 2014 Annual Report for a description of the Company's operating segments. The following tables include the results of each of the Company's operating segments reconciled to the consolidated financial statements.
Effective January 1, 2015, internal reporting to executive management (the "chief operating decision maker") changed to reflect operational changes made within the organization. The operational and internal reporting changes included moving the majority of information technology infrastructure personnel and related functions to Corporate and Other Activities. The associated costs are allocated to the other operating segments based on those segments' actual use of information technology related products and services. Information technology infrastructure personnel and related functions were historically included within the Student Loan and Guaranty Servicing operating segment, and associated costs were allocated to the other operating segments based on those segments' actual use of the related products and services. Prior period segment operating results have been reclassified to reflect these changes; however, the reclassifications had no effect on any operating segment's net income.
Three months ended March 31, 2015 | ||||||||||||||||||
Student Loan and Guaranty Servicing | Tuition Payment Processing and Campus Commerce | Asset Generation and Management | Corporate and Other Activities | Eliminations | Total | |||||||||||||
Total interest income | $ | 7 | 2 | 172,423 | 2,153 | (436 | ) | 174,149 | ||||||||||
Interest expense | — | — | 70,540 | 1,450 | (436 | ) | 71,554 | |||||||||||
Net interest income | 7 | 2 | 101,883 | 703 | — | 102,595 | ||||||||||||
Less provision for loan losses | — | — | 2,000 | — | — | 2,000 | ||||||||||||
Net interest income after provision for loan losses | 7 | 2 | 99,883 | 703 | — | 100,595 | ||||||||||||
Other income: | ||||||||||||||||||
Loan and guaranty servicing revenue | 57,811 | — | — | — | — | 57,811 | ||||||||||||
Intersegment servicing revenue | 12,871 | — | — | — | (12,871 | ) | — | |||||||||||
Tuition payment processing, school information, and campus commerce revenue | — | 34,680 | — | — | — | 34,680 | ||||||||||||
Enrollment services revenue | — | — | — | 17,863 | — | 17,863 | ||||||||||||
Other income | — | — | 4,576 | 2,342 | — | 6,918 | ||||||||||||
Gain on sale of loans and debt repurchases | — | — | 351 | 2,524 | — | 2,875 | ||||||||||||
Derivative market value and foreign currency adjustments, net | — | — | 3,590 | (1,453 | ) | — | 2,137 | |||||||||||
Derivative settlements, net | — | — | (4,963 | ) | (252 | ) | — | (5,215 | ) | |||||||||
Total other income | 70,682 | 34,680 | 3,554 | 21,024 | (12,871 | ) | 117,069 | |||||||||||
Operating expenses: | ||||||||||||||||||
Salaries and benefits | 33,703 | 13,321 | 541 | 13,485 | — | 61,050 | ||||||||||||
Cost to provide enrollment services | — | — | — | 11,702 | — | 11,702 | ||||||||||||
Loan servicing fees | — | — | 7,685 | — | — | 7,685 | ||||||||||||
Depreciation and amortization | 446 | 2,195 | — | 3,021 | — | 5,662 | ||||||||||||
Other | 14,600 | 3,802 | 1,068 | 9,659 | — | 29,129 | ||||||||||||
Intersegment expenses, net | 9,700 | 2,614 | 13,040 | (12,483 | ) | (12,871 | ) | — | ||||||||||
Total operating expenses | 58,449 | 21,932 | 22,334 | 25,384 | (12,871 | ) | 115,228 | |||||||||||
Income (loss) before income taxes and corporate overhead allocation | 12,240 | 12,750 | 81,103 | (3,657 | ) | — | 102,436 | |||||||||||
Corporate overhead allocation | (2,153 | ) | (862 | ) | (1,078 | ) | 4,093 | — | — | |||||||||
Income before income taxes | 10,087 | 11,888 | 80,025 | 436 | — | 102,436 | ||||||||||||
Income tax (expense) benefit | (3,834 | ) | (4,518 | ) | (30,409 | ) | 1,131 | — | (37,630 | ) | ||||||||
Net income | 6,253 | 7,370 | 49,616 | 1,567 | — | 64,806 | ||||||||||||
Net income attributable to noncontrolling interest | — | — | — | 41 | — | 41 | ||||||||||||
Net income attributable to Nelnet, Inc. | $ | 6,253 | 7,370 | 49,616 | 1,526 | — | 64,765 | |||||||||||
18
Three months ended March 31, 2014 | ||||||||||||||||||
Student Loan and Guaranty Servicing | Tuition Payment Processing and Campus Commerce | Asset Generation and Management | Corporate and Other Activities | Eliminations | Total | |||||||||||||
Total interest income | $ | 11 | — | 157,003 | 2,658 | (797 | ) | 158,875 | ||||||||||
Interest expense | — | — | 59,476 | 1,325 | (797 | ) | 60,004 | |||||||||||
Net interest income | 11 | — | 97,527 | 1,333 | — | 98,871 | ||||||||||||
Less provision for loan losses | — | — | 2,500 | — | — | 2,500 | ||||||||||||
Net interest income after provision for loan losses | 11 | — | 95,027 | 1,333 | — | 96,371 | ||||||||||||
Other income: | ||||||||||||||||||
Loan and guaranty servicing revenue | 64,757 | — | — | — | — | 64,757 | ||||||||||||
Intersegment servicing revenue | 14,221 | — | — | — | (14,221 | ) | — | |||||||||||
Tuition payment processing, school information, and campus commerce revenue | — | 25,235 | — | — | — | 25,235 | ||||||||||||
Enrollment services revenue | — | — | — | 22,011 | — | 22,011 | ||||||||||||
Other income | — | — | 4,164 | 13,967 | — | 18,131 | ||||||||||||
Gain on sale of loans and debt repurchases | — | — | 39 | — | — | 39 | ||||||||||||
Derivative market value and foreign currency adjustments, net | — | — | 3,477 | (1,513 | ) | — | 1,964 | |||||||||||
Derivative settlements, net | — | — | (5,977 | ) | (252 | ) | — | (6,229 | ) | |||||||||
Total other income | 78,978 | 25,235 | 1,703 | 34,213 | (14,221 | ) | 125,908 | |||||||||||
Operating expenses: | ||||||||||||||||||
Salaries and benefits | 29,398 | 10,027 | 609 | 12,450 | — | 52,484 | ||||||||||||
Cost to provide enrollment services | — | — | — | 14,475 | — | 14,475 | ||||||||||||
Loan servicing fees | — | — | 5,421 | — | — | 5,421 | ||||||||||||
Depreciation and amortization | 419 | 1,428 | — | 2,936 | — | 4,783 | ||||||||||||
Other | 15,651 | 2,647 | 1,725 | 10,183 | — | 30,206 | ||||||||||||
Intersegment expenses, net | 9,163 | 1,420 | 14,371 | (10,733 | ) | (14,221 | ) | — | ||||||||||
Total operating expenses | 54,631 | 15,522 | 22,126 | 29,311 | (14,221 | ) | 107,369 | |||||||||||
Income before income taxes and corporate overhead allocation | 24,358 | 9,713 | 74,604 | 6,235 | — | 114,910 | ||||||||||||
Corporate overhead allocation | (1,860 | ) | (620 | ) | (1,329 | ) | 3,809 | — | — | |||||||||
Income before income taxes | 22,498 | 9,093 | 73,275 | 10,044 | — | 114,910 | ||||||||||||
Income tax (expense) benefit | (8,549 | ) | (3,455 | ) | (27,844 | ) | (763 | ) | — | (40,611 | ) | |||||||
Net income | 13,949 | 5,638 | 45,431 | 9,281 | — | 74,299 | ||||||||||||
Net income attributable to noncontrolling interest | — | — | — | 513 | — | 513 | ||||||||||||
Net income attributable to Nelnet, Inc. | $ | 13,949 | 5,638 | 45,431 | 8,768 | — | 73,786 | |||||||||||
9. Major Customer
The Company earns loan servicing revenue from a servicing contract with the U.S. Department of Education that currently expires on June 16, 2019. Revenue earned by the Company's Student Loan and Guaranty Servicing operating segment related to this contract was $32.4 million and $29.9 million for the three months ended March 31, 2015 and 2014, respectively.
10. Related Parties
The Company has entered into certain contractual arrangements with related parties as described in note 20 of the notes to consolidated financial statements included in the 2014 Annual Report. The following provides an update for a related party transaction that occurred during the first three months of 2015.
On March 17, 2015, the Company made a $40.5 million equity investment in Agile Sports Technologies, Inc. (doing business as "Hudl"). David Graff, who has served on the Company's Board of Directors since May 2014, is CEO, co-founder, and a director of Hudl. Prior to the 2015 investment, the Company and Michael Dunlap, the Company's Executive Chairman and a principal shareholder, made separate equity investments in Hudl. As of March 31, 2015, the Company and Mr. Dunlap hold combined direct and indirect equity ownership interests in Hudl of 18.7% and 2.8%, respectively. The Company's investment in Hudl is included in "investments and notes receivable" in the Company's consolidated balance sheet.
19
11. Fair Value
The following tables present the Company’s financial assets and liabilities that are measured at fair value on a recurring basis. There were no transfers into or out of level 1, level 2, or level 3 for the three months ended March 31, 2015.
As of March 31, 2015 | As of December 31, 2014 | |||||||||||||||||
Level 1 | Level 2 | Total | Level 1 | Level 2 | Total | |||||||||||||
Assets: | ||||||||||||||||||
Investments (available-for-sale and trading): | ||||||||||||||||||
Student loan asset-backed securities | $ | — | 142,429 | 142,429 | — | 145,000 | 145,000 | |||||||||||
Equity securities | 4,007 | — | 4,007 | 3,736 | — | 3,736 | ||||||||||||
Debt securities | 365 | — | 365 | 387 | — | 387 | ||||||||||||
Total investments (available-for-sale and trading) | 4,372 | 142,429 | 146,801 | 4,123 | 145,000 | 149,123 | ||||||||||||
Fair value of derivative instruments | — | 36,595 | 36,595 | — | 64,392 | 64,392 | ||||||||||||
Total assets | $ | 4,372 | 179,024 | 183,396 | 4,123 | 209,392 | 213,515 | |||||||||||
Liabilities: | ||||||||||||||||||
Fair value of derivative instruments | $ | — | 85,564 | 85,564 | — | 32,842 | 32,842 | |||||||||||
Total liabilities | $ | — | 85,564 | 85,564 | — | 32,842 | 32,842 | |||||||||||
The following table summarizes the fair values of all of the Company’s financial instruments on the consolidated balance sheets:
As of March 31, 2015 | |||||||||||||||
Fair value | Carrying value | Level 1 | Level 2 | Level 3 | |||||||||||
Financial assets: | |||||||||||||||
Student loans receivable | $ | 28,922,872 | 27,897,949 | — | — | 28,922,872 | |||||||||
Cash and cash equivalents | 100,046 | 100,046 | 100,046 | — | — | ||||||||||
Investments (available-for-sale and trading) | 146,801 | 146,801 | 4,372 | 142,429 | — | ||||||||||
Notes receivable | 29,476 | 31,806 | — | 29,476 | — | ||||||||||
Restricted cash | 856,715 | 856,715 | 856,715 | — | — | ||||||||||
Restricted cash – due to customers | 71,890 | 71,890 | 71,890 | — | — | ||||||||||
Restricted investments | 9,872 | 9,872 | 9,872 | — | — | ||||||||||
Accrued interest receivable | 355,372 | 355,372 | — | 355,372 | — | ||||||||||
Derivative instruments | 36,595 | 36,595 | — | 36,595 | — | ||||||||||
Financial liabilities: | |||||||||||||||
Bonds and notes payable | 27,695,072 | 27,815,324 | — | 27,695,072 | — | ||||||||||
Accrued interest payable | 27,275 | 27,275 | — | 27,275 | — | ||||||||||
Due to customers | 71,890 | 71,890 | 71,890 | — | — | ||||||||||
Derivative instruments | 85,564 | 85,564 | — | 85,564 | — | ||||||||||
As of December 31, 2014 | |||||||||||||||
Fair value | Carrying value | Level 1 | Level 2 | Level 3 | |||||||||||
Financial assets: | |||||||||||||||
Student loans receivable | $ | 28,954,226 | 28,005,195 | — | — | 28,954,226 | |||||||||
Cash and cash equivalents | 130,481 | 130,481 | 130,481 | — | — | ||||||||||
Investments (available-for-sale and trading) | 149,123 | 149,123 | 4,123 | 145,000 | — | ||||||||||
Notes receivable | 28,832 | 30,643 | — | 28,832 | — | ||||||||||
Restricted cash | 800,164 | 800,164 | 800,164 | — | — | ||||||||||
Restricted cash – due to customers | 118,488 | 118,488 | 118,488 | — | — | ||||||||||
Restricted investments | 50,276 | 50,276 | 50,276 | — | — | ||||||||||
Accrued interest receivable | 351,588 | 351,588 | — | 351,588 | — | ||||||||||
Derivative instruments | 64,392 | 64,392 | — | 64,392 | — | ||||||||||
Financial liabilities: | |||||||||||||||
Bonds and notes payable | 27,809,997 | 28,027,350 | — | 27,809,997 | — | ||||||||||
Accrued interest payable | 25,904 | 25,904 | — | 25,904 | — | ||||||||||
Due to customers | 118,488 | 118,488 | 118,488 | — | — | ||||||||||
Derivative instruments | 32,842 | 32,842 | — | 32,842 | — | ||||||||||
20
The methodologies for estimating the fair value of financial assets and liabilities are described in note 21 of the notes to consolidated financial statements included in the 2014 Annual Report.
12. Legal Proceedings and Regulatory Matters
Legal Proceedings
Grant Keating v. Peterson's Nelnet, LLC et al
On August 6, 2012, an Amended Complaint was served on Peterson's Nelnet, LLC, a subsidiary of Nelnet, Inc. ("Nelnet"), CUnet, LLC, a subsidiary of Nelnet, and on Nelnet (collectively, the "Keating Defendants"), in connection with a lawsuit by Grant Keating in the U.S. Federal District Court for the Northern District of Ohio (the “Ohio District Court”). The lawsuit was originally instituted on August 24, 2011, and alleges that the Keating Defendants sent an advertising text message to the named plaintiff in June 2011 using an automatic telephone dialing system, and without the plaintiff's express consent. The complaint also alleges that this text message violated the Telephone Consumer Protection Act, purportedly entitling the plaintiff to $500, trebled for a willful violation. The complaint further alleges that the Keating Defendants sent putative class members similar text messages using an automatic telephone dialing system, without such purported class members' consent. The complaint seeks to establish a class action. On August 29, 2013, the Keating Defendants filed motions for summary judgment, and the named plaintiff filed a motion for class certification. On May 12, 2014, the Ohio District Court granted the Keating Defendants' motion for summary judgment, dismissing the case. On September 8, 2014, the named plaintiff filed an appeal brief with the Circuit Court of Appeals and on October 22, 2014, the Keating Defendants filed a responsive brief. As of the filing date of this report, the Ohio District Court has not established, recognized, or certified a class. The Keating Defendants intend to continue to defend themselves vigorously in this lawsuit.
Due to the uncertainty and risks inherent in class determination and the overall litigation process, the Company believes that a meaningful estimate of a reasonably possible loss, if any, or range of reasonably possible losses, if any, for this lawsuit cannot currently be made.
Regulatory Matters
Consumer Financial Protection Bureau Examination
The Dodd-Frank Wall Street Reform and Consumer Protection Act established the Consumer Financial Protection Bureau (the "CFPB"), which has broad authority to regulate a wide range of consumer financial products and services. On December 3, 2013, the CFPB issued a rule that allows the CFPB to supervise nonbank student loan servicers that handle more than one million borrowers, including the Company, thus giving the CFPB broad authority to examine, investigate, supervise, and otherwise regulate the Company's businesses, including the authority to impose fines and require changes with respect to any practices that the CFPB finds to be unfair, deceptive, or abusive.
The CFPB is currently conducting its initial supervisory examination of the large nonbank student loan servicers, including the Company. If the CFPB were to determine the Company was not in compliance, it is possible that this could result in material adverse consequences, including, without limitation, settlements, fines, penalties, adverse regulatory actions, changes in the Company's practices, or other actions. However, the Company is unable to estimate at this time any potential financial or other impact that could result from the CFPB's examination, in the event that any adverse regulatory actions occur.
ITEM 2. MANAGEMENT’S DISCUSSION AND ANALYSIS OF FINANCIAL CONDITION AND RESULTS OF OPERATIONS
(Management’s Discussion and Analysis of Financial Condition and Results of Operations is for the three months ended March 31, 2015 and 2014. All dollars are in thousands, except per share amounts, unless otherwise noted.)
The following discussion and analysis provides information that the Company’s management believes is relevant to an assessment and understanding of the consolidated results of operations and financial condition of the Company. The discussion should be read in conjunction with the Company’s consolidated financial statements included in the 2014 Annual Report.
21
Forward-looking and cautionary statements
This report contains forward-looking statements and information that are based on management's current expectations as of the date of this document. Statements that are not historical facts, including statements about the Company's plans and expectations for future financial condition, results of operations or economic performance, or that address management's plans and objectives for future operations, and statements that assume or are dependent upon future events, are forward-looking statements. The words “may,” “should,” “could,” “would,” “predict,” “potential,” “continue,” “expect,” “anticipate,” “future,” “intend,” “plan,” “believe,” “estimate,” “assume,” “forecast,” “will,” and similar expressions, as well as statements in future tense, are intended to identify forward-looking statements.
The forward-looking statements are based on assumptions and analyses made by management in light of management's experience and its perception of historical trends, current conditions, expected future developments, and other factors that management believes are appropriate under the circumstances. These statements are subject to known and unknown risks, uncertainties, assumptions, and other factors that may cause the actual results and performance to be materially different from any future results or performance expressed or implied by such forward-looking statements. These factors include, among others, the risks and uncertainties set forth in the “Risk Factors” section of the 2014 Annual Report and elsewhere in this report, and include such risks and uncertainties as:
• | student loan portfolio risks such as interest rate basis and repricing risk resulting from the fact that the interest rate characteristics of the student loan assets do not match the interest rate characteristics of the funding for those assets, the risk of loss of floor income on certain student loans originated under the Federal Family Education Loan Program (the "FFEL Program" or "FFELP"), risks related to the use of derivatives to manage exposure to interest rate fluctuations, uncertainties regarding the expected benefits from recently purchased securitized and unsecuritized FFELP student loans and initiatives to purchase additional FFELP and private education loans, and risks from changes in levels of student loan prepayment or default rates; |
• | financing and liquidity risks, including risks of changes in the general interest rate environment and in the securitization and other financing markets for student loans, which may increase the costs or limit the availability of financings necessary to purchase, refinance, or continue to hold student loans; |
• | risks from changes in the educational credit and services markets resulting from changes in applicable laws, regulations, and government programs and budgets, such as the expected decline over time in FFELP loan interest income and fee-based revenues due to the discontinuation of new FFELP loan originations in 2010 and potential government initiatives or legislative proposals to consolidate existing FFELP loans to the Federal Direct Loan Program or otherwise allow FFELP loans to be refinanced with Federal Direct Loan Program loans, risks related to reduced government payments to guaranty agencies to rehabilitate defaulted FFELP loans and services in support of those activities, risks related to the Company's ability to maintain or increase volumes under the Company's loan servicing contract with the U.S. Department of Education (the "Department"), which accounted for approximately 10 percent of the Company's revenue in 2014 and for which the loan allocation metrics were modified effective September 1, 2014, and risks related to the Company's ability to comply with agreements with third-party customers for the servicing of FFELP, Federal Direct Loan Program, and private education loans; |
• | risks related to a breach of or failure in the Company's operational or information systems or infrastructure, or those of third-party vendors; |
• | uncertainties inherent in forecasting future cash flows from student loan assets and related asset-backed securitizations; and |
• | risks and uncertainties associated with litigation matters and with maintaining compliance with the extensive regulatory requirements applicable to the Company's businesses, and uncertainties inherent in the estimates and assumptions about future events that management is required to make in the preparation of the Company's consolidated financial statements. |
All forward-looking statements contained in this report are qualified by these cautionary statements and are made only as of the date of this document. Although the Company may from time to time voluntarily update or revise its prior forward-looking statements to reflect actual results or changes in the Company's expectations, the Company disclaims any commitment to do so except as required by securities laws.
22
OVERVIEW
The Company provides educational products and services in loan servicing, payment processing, education planning, and asset management. These products and services help students and families plan, prepare, and pay for their education and make the administrative and financial processes more efficient for schools and financial organizations. In addition, the Company earns interest income on a portfolio of federally insured student loans.
A reconciliation of the Company's GAAP net income to net income, excluding derivative market value and foreign currency adjustments, is provided below.
Three months ended March 31, | ||||||
2015 | 2014 | |||||
GAAP net income attributable to Nelnet, Inc. | $ | 64,765 | 73,786 | |||
Derivative market value and foreign currency adjustments, net of tax | (1,325 | ) | (1,218 | ) | ||
Net income, excluding derivative market value and foreign currency adjustments (a) | $ | 63,440 | 72,568 | |||
Earnings per share: | ||||||
GAAP net income attributable to Nelnet, Inc. | $ | 1.40 | 1.59 | |||
Derivative market value and foreign currency adjustments, net of tax | (0.03 | ) | (0.03 | ) | ||
Net income, excluding derivative market value and foreign currency adjustments (a) | $ | 1.37 | 1.56 | |||
(a) | The Company provides non-GAAP information that reflects specific items management believes to be important in the evaluation of its financial position and performance. "Derivative market value and foreign currency adjustments" include (i) the unrealized gains and losses that are caused by changes in fair values of derivatives which do not qualify for "hedge treatment" under GAAP; and (ii) the foreign currency transaction gains or losses caused by the re-measurement of the Company's Euro-denominated bonds to U.S. dollars. The Company believes these point-in-time estimates of asset and liability values related to these financial instruments that are subject to interest and currency rate fluctuations affect the period-to-period comparability of the results of operations. Accordingly, the Company provides operating results excluding these items for comparability purposes. |
The Company earns net interest income on its FFELP student loan portfolio in its Asset Generation and Management ("AGM") operating segment. This segment is expected to generate a stable net interest margin and significant amounts of cash as the FFELP portfolio amortizes. As of March 31, 2015, the Company had a $27.9 billion student loan portfolio that will amortize over the next approximately 25 years. The Company actively seeks to acquire additional FFELP loan portfolios to leverage its servicing scale and expertise to generate incremental earnings and cash flow.
In addition, the Company earns fee-based revenue through the following reportable operating segments:
• | Student Loan and Guaranty Servicing ("LGS") - referred to as Nelnet Diversified Solutions ("NDS") |
• | Tuition Payment Processing and Campus Commerce ("TPP&CC") - referred to as Nelnet Business Solutions ("NBS") |
Other business activities and operating segments that are not reportable are combined and included in Corporate and Other Activities. Corporate and Other Activities also includes income earned on certain investments and interest expense incurred on unsecured debt transactions.
23
The information below provides the operating results for each reportable operating segment and Corporate and Other Activities ("Corporate") for the three months ended March 31, 2015 and 2014 (dollars in millions).
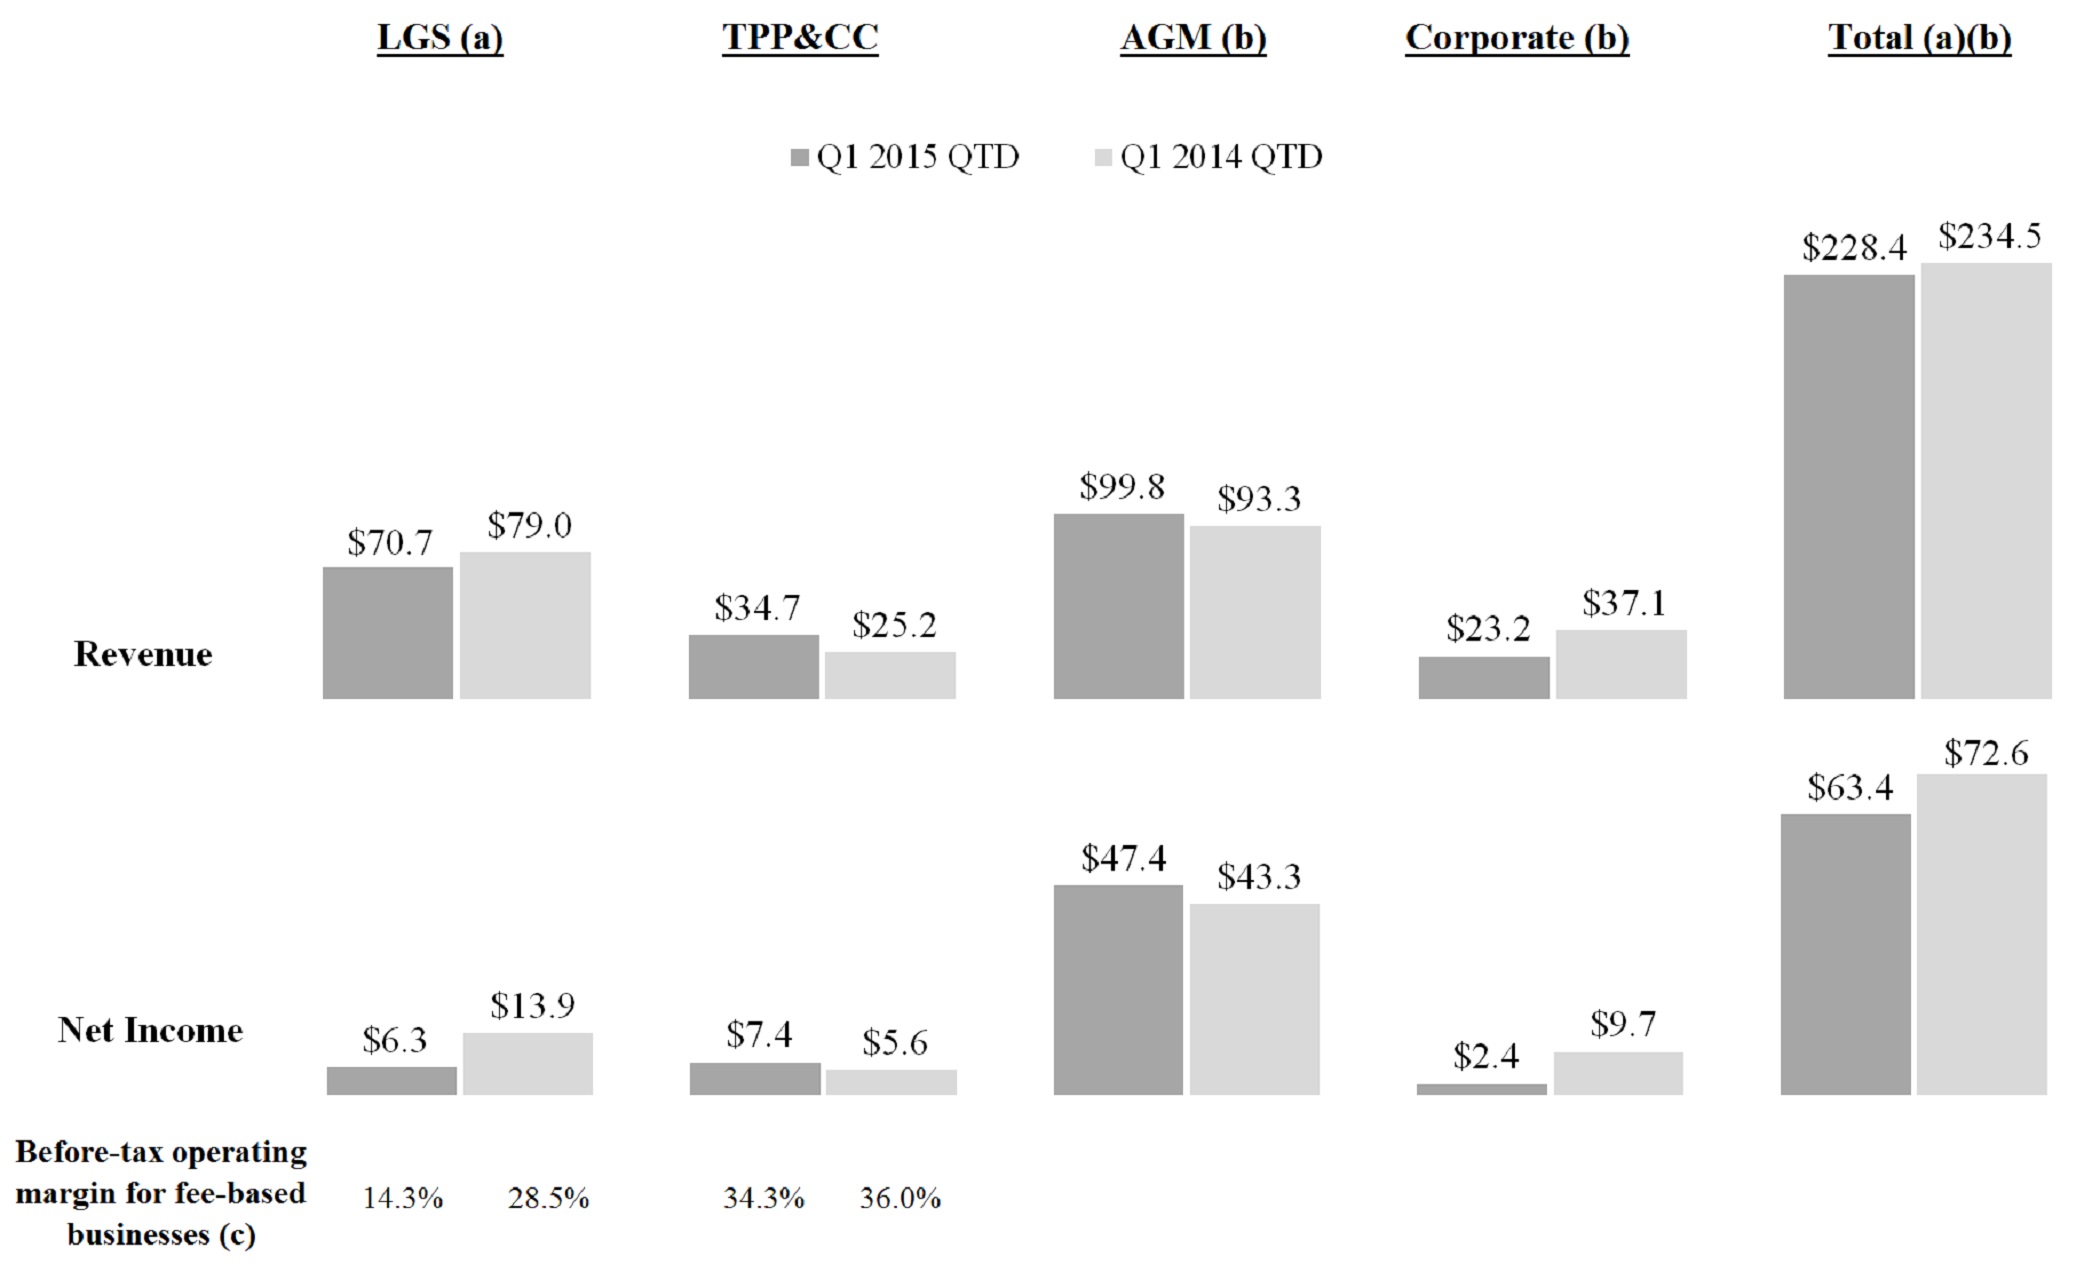
(a) | Revenue includes intersegment revenue earned by LGS as a result of servicing loans for AGM. |
(b) | Total revenue includes "net interest income after provision for loan losses" and "total other income" from the Company's segment statements of income, excluding the impact from changes in fair values of derivatives and foreign currency transaction adjustments. Net income excludes changes in fair values of derivatives and foreign currency transaction adjustments, net of tax. |
(c) | Computed as income before income taxes divided by total revenue. |
Student Loan and Guaranty Servicing
• | As of March 31, 2015, the Company was servicing $168.8 billion in FFELP, private, and government owned student loans, as compared with $147.9 billion of loans as of March 31, 2014. |
• | Revenue decreased in the first quarter of 2015 compared to the same period in 2014 due primarily to a decrease in rehabilitation collection revenue. Federal budget provisions that became effective July 1, 2014 have reduced payments by the Department to guaranty agencies for assisting student loan borrowers with the rehabilitation of defaulted loans under FFELP, and as a result, rehabilitation revenue has been negatively affected. Rehabilitation collection revenue recognized by the Company was $7.4 million and $13.4 million for the three months ended March 31, 2015 and 2014, respectively. |
• | Revenue from the Department servicing contract increased to $32.4 million for the three months ended March 31, 2015, compared to $29.9 million for the same period in 2014. As of March 31, 2015, the Company was servicing $140.8 billion of loans for 5.9 million borrowers under this contract. |
• | Before tax operating margin was 14.3% and 28.5% for the three months ended March 31, 2015 and 2014, respectively. Operating margin decreased as a result of the implementation of federal budget reductions for guaranty agencies revenue. In addition, as the volume of loans serviced under the Department servicing contract continues to grow and loans serviced under the legacy commercial programs continue to run off, the Company expects operating margins to tighten accordingly. |
24
Tuition Payment Processing and Campus Commerce
• | Revenue increased in the three months ended March 31, 2015 compared to the same period in 2014 due to the acquisition of RenWeb in the second quarter of 2014 and due to increases in the number of managed tuition payment plans, campus commerce customer transaction volume, and new school customers. |
• | Excluding the amortization of intangibles, before tax operating margin was 40.5% and 40.1% for the three months ended March 31, 2015 and 2014, respectively. |
• | This segment is subject to seasonal fluctuations. Based on the timing of when revenue is recognized and when expenses are incurred, revenue and operating margin are higher in the first quarter as compared to the remainder of the year. |
Asset Generation and Management
• | The Company acquired $836.1 million of student loans during the first three months of 2015. The average loan portfolio balance for the three months ended March 31, 2015 and 2014 was $28.3 billion and $25.9 billion, respectively. |
• | Core student loan spread decreased to 1.41% for the three months ended March 31, 2015, compared to 1.49% and 1.44% for the three months ended December 31, 2014 and March 31, 2014, respectively. This decrease was the result of recent acquisitions of consolidation loans, which have lower margins but longer terms. |
• | Due to historically low interest rates, the Company continues to earn significant fixed rate floor income. During the three months ended March 31, 2015 and 2014, the Company earned $46.2 million and $37.8 million, respectively, of fixed rate floor income (net of $5.0 million and $7.0 million of derivative settlements, respectively, used to hedge such loans). |
Corporate and Other Activities
• | The Company recognized $0.5 million in net gains from investment activity during the three months ended March 31, 2015, compared to $7.2 million for the same period in 2014. The majority of gains recognized in 2014 were from sales of student loan asset-backed security investments. |
• | Whitetail Rock Capital Management, LLC ("WRCM"), the Company's SEC-registered investment advisory subsidiary, recognized investment advisory revenue of $0.7 million for the three months ended March 31, 2015, compared to $5.2 million for the three months ended March 31, 2014. The decrease was the result of the reduction in performance fees earned in 2015. |
• | During the three months ended March 31, 2015, the Company repurchased $11.9 million (par value) of its Junior Subordinated Hybrid Securities for a gain of $2.5 million. Gains from debt repurchases in the first quarter of 2014 were approximately $39,000. |
Liquidity and Capital Resources
• | As of March 31, 2015, the Company had cash and cash equivalents of $100.0 million. In addition, the Company had a portfolio of available-for-sale and trading investments, consisting primarily of student loan asset-backed securities, with a fair value of $146.8 million as of March 31, 2015. |
• | For the three months ended March 31, 2015, the Company generated $129.3 million in net cash provided by operating activities. |
• | Forecasted future cash flows from the Company's FFELP student loan portfolio financed in asset-backed securitization transactions are estimated to be approximately $2.27 billion as of March 31, 2015. |
• | As of March 31, 2015, no amounts were outstanding on the Company's unsecured line of credit and $350.0 million was available for future use. The unsecured line of credit has a maturity date of June 30, 2019. |
• | During the three months ended March 31, 2015, the Company repurchased a total of 175,798 shares of Class A common stock for $7.9 million ($45.16 per share). |
25
• | During the three months ended March 31, 2015, the Company paid cash dividends of $4.6 million ($0.10 per share). |
• | The Company intends to use its liquidity position to capitalize on market opportunities, including FFELP and private education loan acquisitions; strategic acquisitions and investments; and capital management initiatives, including stock repurchases, debt repurchases, and dividend distributions. Dependent upon the timing and size of the opportunities, the Company may continue to accumulate additional cash and investments. |
CONSOLIDATED RESULTS OF OPERATIONS
Analysis of the Company's operating results for the three months ended March 31, 2015 compared to the same period in 2014 is summarized below.
The Company’s operating results are primarily driven by the performance of its existing portfolio and the revenues generated by its fee-based businesses and the costs to provide their products and services. The performance of the Company’s portfolio is driven by net interest income (which includes financing costs) and losses related to credit quality of the assets, along with the cost to administer and service the assets and related debt.
The Company operates in distinct operating segments as described previously. For a reconciliation of the segment operating results to the consolidated results of operations, see note 8 of the notes to consolidated financial statements included under Part I, Item 1 of this report. Since the Company monitors and assesses its operations and results based on these segments, the discussion following the consolidated results of operations is presented on a segment basis.
26
Three months | ||||||||
ended March 31, | ||||||||
2015 | 2014 | Additional information | ||||||
Loan interest | $ | 171,944 | 156,896 | Increase was due to an increase in the average student loan portfolio balance and gross fixed rate floor income, partially offset by an increase in consolidation rebate fees. | ||||
Investment interest | 2,205 | 1,979 | Includes income from unrestricted interest-earning deposits and investments and funds in asset-backed securitizations. | |||||
Total interest income | 174,149 | 158,875 | ||||||
Interest expense | 71,554 | 60,004 | Increase due to an increase in average debt outstanding and an increase in the Company's cost of funds. | |||||
Net interest income | 102,595 | 98,871 | See table below for additional analysis. | |||||
Less provision for loan losses | 2,000 | 2,500 | Represents the periodic expense of maintaining an allowance appropriate to absorb losses inherent in the portfolio of student loans. See AGM operating segment - results of operations. | |||||
Net interest income after provision for loan losses | 100,595 | 96,371 | ||||||
Other income: | ||||||||
LGS revenue | 57,811 | 64,757 | See LGS operating segment - results of operations. | |||||
TPP&CC revenue | 34,680 | 25,235 | See TPP&CC operating segment - results of operations. | |||||
NES revenue | 17,863 | 22,011 | See table below for additional analysis. | |||||
Other income | 6,918 | 18,131 | See table below for the components of "other income." | |||||
Gain on sale of loans and debt repurchases | 2,875 | 39 | Gains in the first quarter of 2015 include a $2.5 million gain from the repurchase of $11.9 million (par value) of the Company's Junior Subordinated Hybrid Securities. | |||||
Derivative settlements, net | (5,215 | ) | (6,229 | ) | The Company maintains an overall risk management strategy that incorporates the use of derivative instruments to reduce the economic effect of interest rate volatility. Derivative settlements for each applicable period should be evaluated with the Company's net interest income. See table below for additional analysis. | |||
Derivative market value and foreign currency adjustments, net | 2,137 | 1,964 | Includes (i) the unrealized gains and losses that are caused by changes in fair values of derivatives which do not qualify for "hedge treatment" under GAAP; and (ii) the foreign currency transaction gains or losses caused by the re-measurement of the Company's Euro-denominated bonds to U.S. dollars. | |||||
Total other income | 117,069 | 125,908 | ||||||
Operating expenses: | ||||||||
Salaries and benefits | 61,050 | 52,484 | Increase was due to additional personnel to support increased LGS servicing volume and TPP&CC revenue. | |||||
Cost to provide enrollment services | 11,702 | 14,475 | See table below for additional analysis. | |||||
Loan servicing fees | 7,685 | 5,421 | Increase was due to an increase in third party loan servicing fees incurred by AGM as volume at third parties has grown with recent loan purchases. | |||||
Depreciation and amortization | 5,662 | 4,783 | Increase was due to additional expense from the amortization of intangible assets. Intangible amortization expense was $2.4 million and $1.0 million for the three months ended March 31, 2015 and 2014, respectively. | |||||
Other | 29,129 | 30,206 | Decrease was due to a decrease in collection costs directly related to the decrease in FFELP guaranty collection revenue, partially offset by an increase in other costs to support increased LGS servicing volume and TPP&CC revenue. | |||||
Total operating expenses | 115,228 | 107,369 | ||||||
Income before income taxes | 102,436 | 114,910 | ||||||
Income tax expense | 37,630 | 40,611 | The effective tax rate was 36.75% and 35.50% in the three months ended March 31, 2015 and 2014 respectively. The effective tax rate increased during the first quarter of 2015 due to an increase in the state effective tax rate. | |||||
Net income | 64,806 | 74,299 | ||||||
Net income attributable to noncontrolling interest | 41 | 513 | ||||||
Net income attributable to Nelnet, Inc. | $ | 64,765 | 73,786 | |||||
Additional information: | ||||||||
Net income attributable to Nelnet, Inc. | $ | 64,765 | 73,786 | The Company provides non-GAAP information that reflects specific items management believes to be important in the evaluation of its operating results. The Company believes the point-in-time estimates of asset and liability values related to its derivatives and Euro-denominated bonds that are subject to interest and currency rate fluctuations affect the period-to-period comparability of the results of operations. These items are excluded here for comparability purposes. | ||||
Derivative market value and foreign currency adjustments | (2,137 | ) | (1,964 | ) | ||||
Tax effect | 812 | 746 | ||||||
Net income attributable to Nelnet, Inc., excluding derivative market value and foreign currency adjustments | $ | 63,440 | 72,568 | |||||
27
The following table summarizes the components of "net interest income" and "derivative settlements, net."
Three months ended March 31, | ||||||||
2015 | 2014 | Additional information | ||||||
Variable student loan interest margin, net of settlements on derivatives | $ | 50,633 | 54,396 | Represents the yield the Company receives on its student loan portfolio less the cost of funding these loans. Variable student loan spread is also impacted by the amortization/accretion of loan premiums and discounts, the 1.05% per year consolidation loan rebate fee paid to the Department, and yield adjustments from borrower benefit programs. See AGM operating segment - results of operations. | ||||
Fixed rate floor income, net of settlements on derivatives | 46,244 | 37,844 | The Company has a portfolio of student loans that are earning interest at a fixed borrower rate which exceeds the statutorily defined variable lender rates, generating fixed rate floor income. See Item 3, "Quantitative and Qualitative Disclosures About Market Risk - Interest Rate Risk" for additional information. | |||||
Investment interest | 2,205 | 1,979 | ||||||
Non-portfolio related derivative settlements | (252 | ) | (252 | ) | ||||
Corporate debt interest expense | (1,450 | ) | (1,325 | ) | Includes interest expense on the Junior Subordinated Hybrid Securities and unsecured and secured lines of credit. | |||
Net interest income (net of settlements on derivatives) | $ | 97,380 | 92,642 | |||||
The following table summarizes the components of "Enrollment services revenue" and "cost to provide enrollment services."
Inquiry management (marketing) (a) | Inquiry management (software) | Inquiry generation (b) | Digital marketing | Content solutions | Total | |||||||||||||
Three months ended March 31, 2015 | ||||||||||||||||||
Enrollment services revenue | $ | 12,209 | 1,118 | — | 1,236 | 3,300 | 17,863 | |||||||||||
Cost to provide enrollment services | 10,799 | — | — | 121 | 782 | 11,702 | ||||||||||||
Gross profit | $ | 1,410 | 1,118 | — | 1,115 | 2,518 | 6,161 | |||||||||||
Gross profit % | 11.5% | |||||||||||||||||
Three months ended March 31, 2014 | ||||||||||||||||||
Enrollment services revenue | $ | 13,537 | 1,069 | 2,845 | 1,068 | 3,492 | 22,011 | |||||||||||
Cost to provide enrollment services | 11,954 | — | 1,785 | 88 | 648 | 14,475 | ||||||||||||
Gross profit | $ | 1,583 | 1,069 | 1,060 | 980 | 2,844 | 7,536 | |||||||||||
Gross profit % | 11.7% | |||||||||||||||||
(a) | Inquiry management (marketing) revenue decreased $1.3 million (9.8%) for the three months ended March 31, 2015 compared to the same period in 2014 as a result of a decrease in spending on marketing efforts by school clients. |
(b) | Effective August 29, 2014, the Company stopped providing inquiry generation services. |
The following table summarizes the components of "other income."
Three months ended March 31, | ||||||
2015 | 2014 | |||||
Borrower late fee income | $ | 4,131 | 3,688 | |||
Investment advisory fees (a) | 657 | 5,228 | ||||
Realized and unrealized gains/(losses) on investments, net | 516 | 7,210 | ||||
Other | 1,614 | 2,005 | ||||
Other income | $ | 6,918 | 18,131 | |||
(a) | WRCM earns annual fees of up to 25 basis points on the outstanding balance of investments and up to 50 percent of the gains from the sale of securities for which it provides advisory services. Due to improvements in the capital markets, the opportunities to earn performance fees on the sale of securities are becoming more limited. As of March 31, 2015, WRCM was managing an investment portfolio of $933.2 million for third-party entities. |
28
STUDENT LOAN AND GUARANTY SERVICING OPERATING SEGMENT – RESULTS OF OPERATIONS
Student Loan Servicing Volumes (dollars in millions)
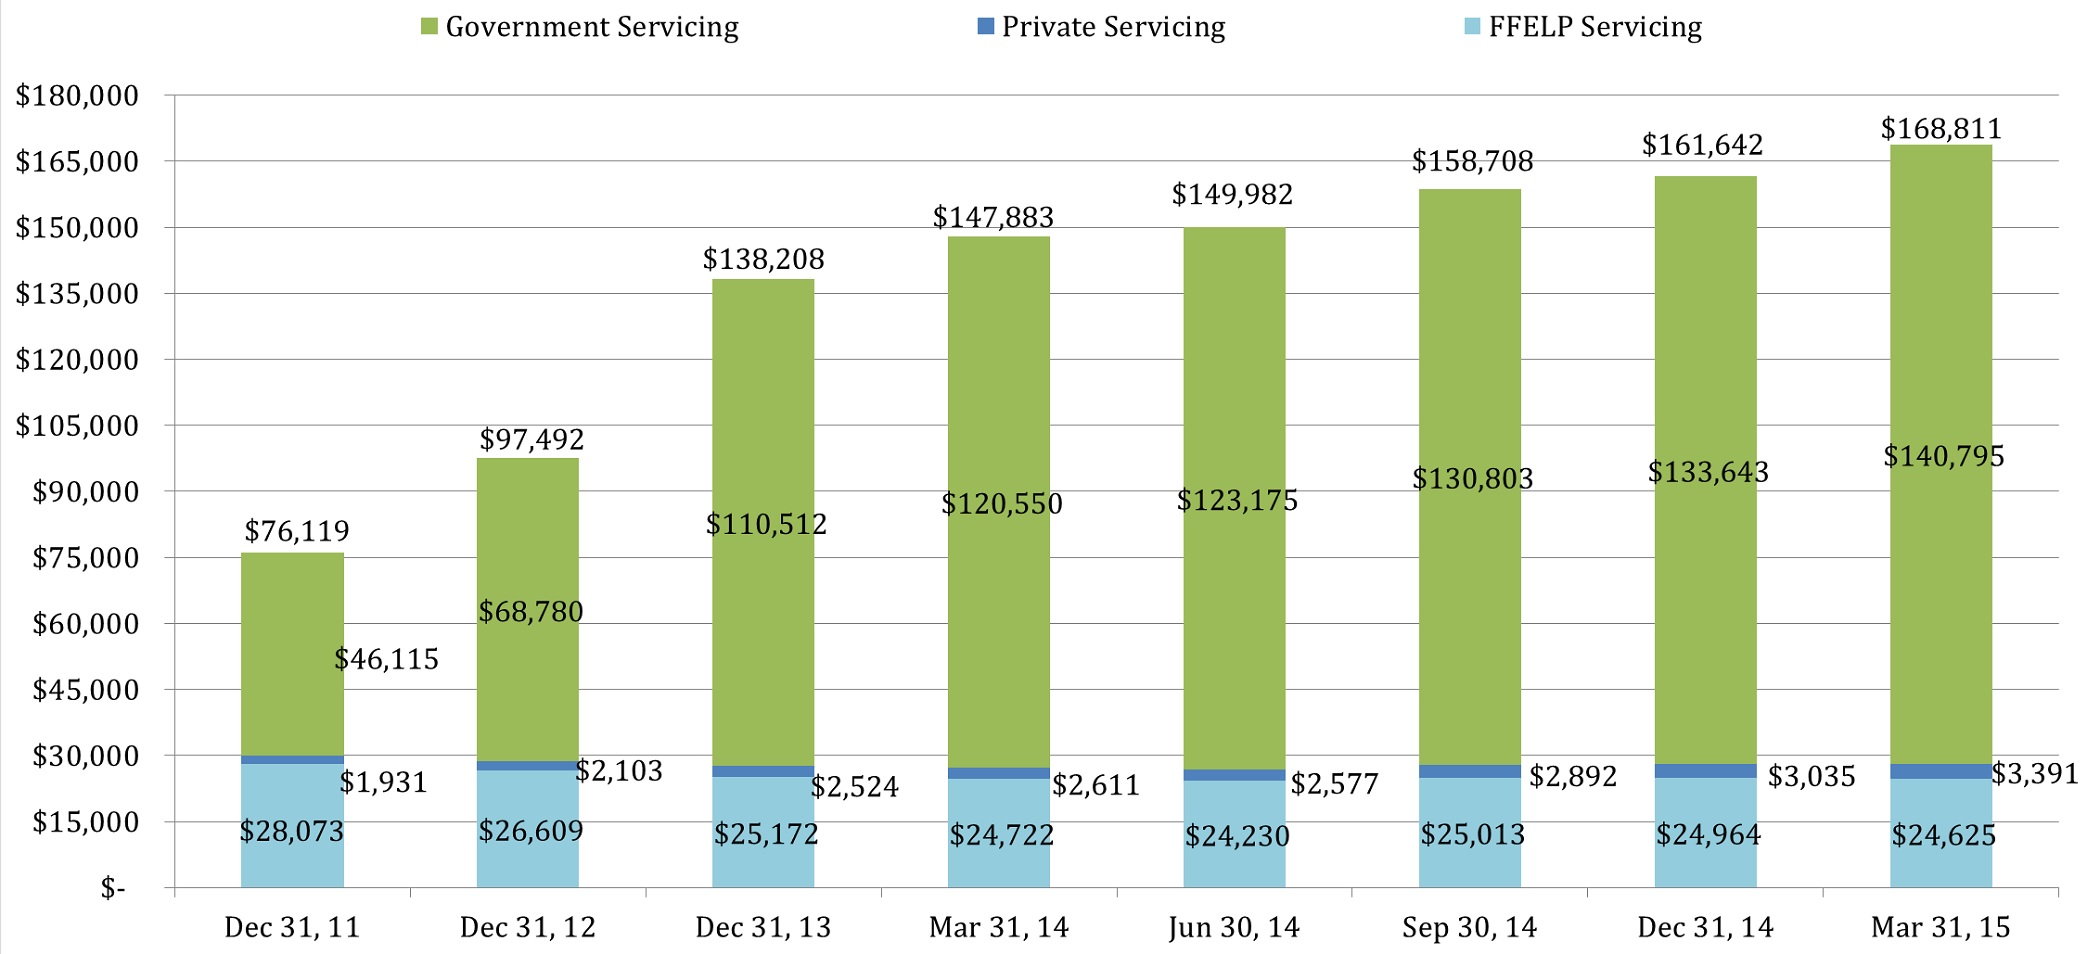
Company owned | $22,650 | $21,237 | $21,397 | $21,192 | $21,110 | $20,511 | $19,742 | $19,369 | ||||||||||||||||
% of total | 29.8% | 21.8% | 15.5% | 14.3% | 14.1% | 12.9% | 12.2% | 11.5% | ||||||||||||||||
Number of servicing borrowers: | ||||||||||||||||||||||||
Government servicing: | 3,036,534 | 3,892,929 | 5,305,498 | 5,438,933 | 5,465,395 | 5,824,743 | 5,915,449 | 5,882,446 | ||||||||||||||||
FFELP servicing: | 1,799,484 | 1,626,146 | 1,462,122 | 1,426,435 | 1,390,541 | 1,404,619 | 1,397,295 | 1,358,551 | ||||||||||||||||
Private servicing: | 164,554 | 173,948 | 195,580 | 191,606 | 186,863 | 200,095 | 202,529 | 205,926 | ||||||||||||||||
Total: | 5,000,572 | 5,693,023 | 6,963,200 | 7,056,974 | 7,042,799 | 7,429,457 | 7,515,273 | 7,446,923 | ||||||||||||||||
Number of remote hosted borrowers: | 9,566,296 | 6,912,204 | 1,915,203 | 1,796,287 | 1,735,594 | 1,677,547 | 1,611,654 | 1,592,813 | ||||||||||||||||
29
Summary and Comparison of Operating Results
Three months ended March 31, | Additional information | |||||||
2015 | 2014 | |||||||
Net interest income | $ | 7 | 11 | |||||
Loan and guaranty servicing revenue | 57,811 | 64,757 | See table below for additional analysis. | |||||
Intersegment servicing revenue | 12,871 | 14,221 | Represents revenue earned by the LGS operating segment as a result of servicing loans for the AGM operating segment. Decrease was due to portfolio run-off. | |||||
Total other income | 70,682 | 78,978 | ||||||
Salaries and benefits | 33,703 | 29,398 | Increase due to additional personnel to support the increase in volume under the Department servicing contract. | |||||
Depreciation and amortization | 446 | 419 | ||||||
Other expenses | 14,600 | 15,651 | Decrease was due to a decrease in guaranty collection costs directly related to the decrease in guaranty collection revenue (see table below for additional information), partially offset by an increase in other costs to support the increase in volume under the Department servicing contract. | |||||
Intersegment expenses, net | 9,700 | 9,163 | ||||||
Total operating expenses | 58,449 | 54,631 | ||||||
Income before income taxes and corporate overhead allocation | 12,240 | 24,358 | ||||||
Corporate overhead allocation | (2,153 | ) | (1,860 | ) | ||||
Income before income taxes | 10,087 | 22,498 | ||||||
Income tax expense | (3,834 | ) | (8,549 | ) | ||||
Net income | $ | 6,253 | 13,949 | |||||
Before tax operating margin | 14.3 | % | 28.5 | % | This segment experienced a reduction in operating margin as a result of the implementation of previously announced federal budget reductions for guaranty agencies revenue. In addition, as the volume of loans serviced under the Department servicing contract continues to grow and loans serviced under the legacy commercial programs continue to run off, the Company expects operating margins to tighten accordingly. | |||
The following table summarizes the components of "Loan and guaranty servicing revenue."
Three months ended March 31, | Additional information | |||||||
2015 | 2014 | |||||||
Government servicing | $ | 32,407 | 29,859 | Increase due to an increase in the number of borrowers serviced under the Department servicing contract. | ||||
FFELP servicing | 3,544 | 3,416 | Over time, FFELP servicing revenue will decrease as third-party customers' FFELP portfolios run off. | |||||
Private servicing | 3,039 | 2,484 | Increase due to an increase in private loan servicing volume. | |||||
FFELP guaranty servicing | 2,481 | 3,122 | Decrease will continue as FFELP portfolios run off and guaranty volume decreases. | |||||
FFELP guaranty collection | 10,906 | 17,653 | The Company earns revenue from rehabilitating defaulted FFELP loans on behalf of guaranty agencies. Over time, this FFELP-related revenue source will decrease as FFELP portfolios continue to run off. Also, federal budget provisions that became effective July 1, 2014 have reduced payments by the Department to guaranty agencies for assisting student loan borrowers with the rehabilitation of defaulted loans under FFELP. Rehabilitation collection revenue was $7.4 million and $13.4 million for the three months ended March 31, 2015 and 2014, respectively. This revenue was negatively impacted in 2015 as a result of these federal budget provisions. The Company anticipates this revenue will continue to be negatively impacted as a result of these federal budget provisions. | |||||
Software services | 4,868 | 7,631 | During the first quarter of 2014, the Company settled a billing dispute related to a prior period and recognized revenue of $2.2 million. Excluding revenue from this customer, software services revenue decreased in 2015 compared to 2014 due to a decrease in the number of borrowers from remote hosted customers. | |||||
Other | 566 | 592 | ||||||
Loan and guaranty servicing revenue | $ | 57,811 | 64,757 | |||||
30
TUITION PAYMENT PROCESSING AND CAMPUS COMMERCE OPERATING SEGMENT – RESULTS OF OPERATIONS
This segment of the Company’s business is subject to seasonal fluctuations which correspond, or are related to, the traditional school year. Tuition management revenue is recognized over the course of the academic term, but the peak operational activities take place in summer and early fall. Higher amounts of revenue are typically recognized during the first quarter due to fees related to grant and aid applications as well as online applications and enrollment services of RenWeb. The Company’s operating expenses do not follow the seasonality of the revenues. This is primarily due to generally fixed year-round personnel costs and seasonal marketing costs. Based on the timing of revenue recognition and when expenses are incurred, revenue and pre-tax operating margin are higher in the first quarter as compared to the remainder of the year.
On June 3, 2014, the Company purchased RenWeb. The results of operations of RenWeb are reported in the Company's consolidated financial statements from the date of acquisition. RenWeb's revenue for the three months ended March 31, 2015 was $5.9 million.
Summary and Comparison of Operating Results
Three months ended March 31, | Additional information | |||||||
2015 | 2014 | |||||||
Net interest income | $ | 2 | — | |||||
Tuition payment processing, school information, and campus commerce revenue | 34,680 | 25,235 | In addition to the acquisition of RenWeb referred to above, the remaining increase was due to an increase in the number of managed tuition payment plans, campus commerce customer transaction and payments volume, and new school customers. | |||||
Salaries and benefits | 13,321 | 10,027 | Increase due primarily to the acquisition of RenWeb referred to above. | |||||
Depreciation and amortization | 2,195 | 1,428 | Increase due to the additional amortization of intangibles from the acquisition of RenWeb referred to above. Amortization of intangible assets for the three months ended March 31, 2015 and 2014 was $2.2 million and $1.0 million, respectively. | |||||
Other expenses | 3,802 | 2,647 | Increase due primarily to the acquisition of RenWeb referred to above. | |||||
Intersegment expenses, net | 2,614 | 1,420 | ||||||
Total operating expenses | 21,932 | 15,522 | ||||||
Income before income taxes and corporate overhead allocation | 12,750 | 9,713 | ||||||
Corporate overhead allocation | (862 | ) | (620 | ) | ||||
Income before income taxes | 11,888 | 9,093 | ||||||
Income tax expense | (4,518 | ) | (3,455 | ) | ||||
Net income | $ | 7,370 | 5,638 | |||||
Before tax operating margin | 34.3 | % | 36.0 | % | Excluding the amortization of intangibles, before tax operating margin was 40.5% and 40.1% for the three months ended March 31, 2015 and 2014, respectively. | |||
31
ASSET GENERATION AND MANAGEMENT OPERATING SEGMENT – RESULTS OF OPERATIONS
Student Loan Portfolio
As of March 31, 2015, the Company had a $27.9 billion student loan portfolio that will amortize over the next approximately 25 years. For a summary of the Company’s student loan portfolio as of March 31, 2015 and December 31, 2014, see note 2 of the notes to consolidated financial statements included under Part I, Item 1 of this report.
Loan Activity
The following table sets forth the activity of loans:
Three months ended March 31, | ||||||
2015 | 2014 | |||||
Beginning balance | $ | 28,223,908 | 26,121,306 | |||
Loan acquisitions | 836,112 | 387,258 | ||||
Repayments, claims, capitalized interest, participations, and other | (628,360 | ) | (548,705 | ) | ||
Consolidation loans lost to external parties | (320,576 | ) | (145,664 | ) | ||
Loans sold | (3,996 | ) | — | |||
Ending balance | $ | 28,107,088 | 25,814,195 | |||
Allowance for Loan Losses and Loan Delinquencies
The Company maintains an allowance appropriate to absorb losses, net of recoveries, inherent in the portfolio of student loans, which results in periodic expense provisions for loan losses. Delinquencies have the potential to adversely impact the Company’s earnings through increased servicing and collection costs and account charge-offs.
For a summary of the activity in the allowance for loan losses for the three months ended March 31, 2015 and 2014, and a summary of the Company's student loan delinquency amounts as of March 31, 2015, December 31, 2014, and March 31, 2014, see note 2 of the notes to consolidated financial statements included under Part I, Item 1 of this report.
The Company's provision for loan losses and charge-offs of federally insured loans has decreased during the first three months of 2015 as compared to the same period in 2014. The Company’s primary driver for loan growth has been acquiring student loan portfolios. The Company records loans acquired net of any credit exposure through a credit discount, separate from the allowance for loan losses. This credit discount is non-accretable to interest income. The Company continues to evaluate credit losses associated with purchased loans based on current information and changes in expectations to determine the need for any additional allowance for loan losses. The recent purchases of large loan portfolios have resulted in an increase in the non-accretable discount balance, but no additional allowance for loan losses associated with these recent loan portfolios has been necessary. In addition, as the Company’s overall federally insured student loan portfolio continues to season with the length of time that loans are in active repayment, credit performance continues to improve.
32
Student Loan Spread Analysis
The following table analyzes the student loan spread on the Company’s portfolio of student loans, which represents the spread between the yield earned on student loan assets and the costs of the liabilities and derivative instruments used to fund the assets.
Three months ended | |||||||||
March 31, 2015 | December 31, 2014 | March 31, 2014 | |||||||
Variable student loan yield, gross | 2.53 | % | 2.56 | % | 2.50 | % | |||
Consolidation rebate fees | (0.84 | ) | (0.84 | ) | (0.80 | ) | |||
Discount accretion, net of premium and deferred origination costs amortization | 0.04 | 0.05 | 0.05 | ||||||
Variable student loan yield, net | 1.73 | 1.77 | 1.75 | ||||||
Student loan cost of funds - interest expense | (0.98 | ) | (0.97 | ) | (0.92 | ) | |||
Student loan cost of funds - derivative settlements | — | 0.01 | 0.02 | ||||||
Variable student loan spread | 0.75 | 0.81 | 0.85 | ||||||
Fixed rate floor income, net of settlements on derivatives | 0.66 | 0.68 | 0.59 | ||||||
Core student loan spread | 1.41 | % | 1.49 | % | 1.44 | % | |||
Average balance of student loans | $ | 28,289,420 | 28,738,887 | 25,915,053 | |||||
Average balance of debt outstanding | 28,460,627 | 28,877,939 | 25,826,656 | ||||||
A trend analysis of the Company's core and variable student loan spreads is summarized below.
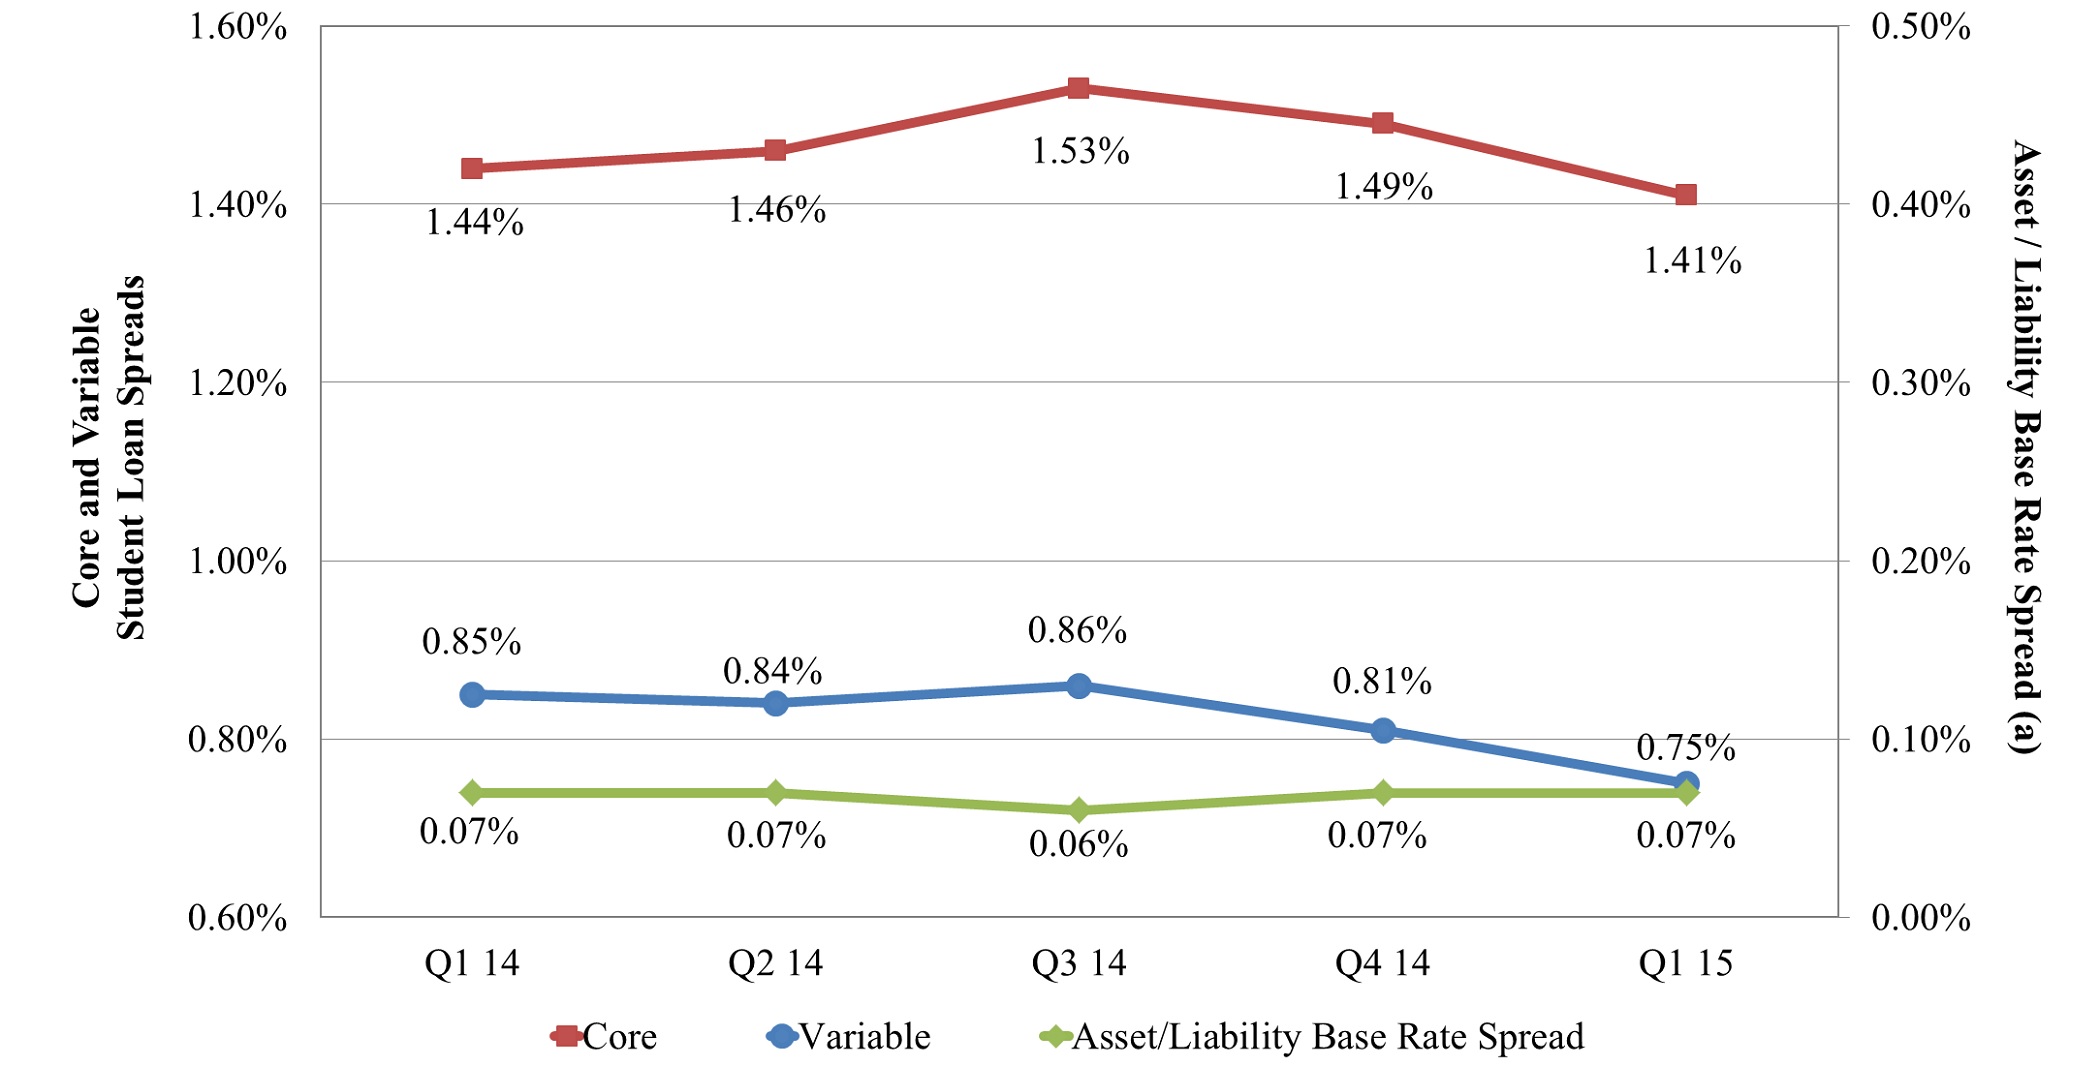
(a) | The interest earned on a large portion of the Company's FFELP student loan assets is indexed to the one-month LIBOR rate. The Company funds the majority of its assets with three-month LIBOR indexed floating rate securities. The relationship between the indices in which the Company earns interest on its loans and funds such loans has a significant impact on student loan spread. This table (the right axis) shows the difference between the Company's liability base rate and the one-month LIBOR rate by quarter. |
Variable student loan spread decreased during the three months ended March 31, 2015 as compared to the same period in 2014 as a result of recent acquisitions of consolidation loans, which have lower margins but longer terms.
33
The primary difference between variable student loan spread and core student loan spread is fixed rate floor income. A summary of fixed rate floor income and its contribution to core student loan spread follows:
Three months ended | |||||||||
March 31, 2015 | December 31, 2014 | March 31, 2014 | |||||||
Fixed rate floor income, gross | $ | 51,259 | 54,248 | 44,794 | |||||
Derivative settlements (a) | (5,015 | ) | (5,035 | ) | (6,950 | ) | |||
Fixed rate floor income, net | $ | 46,244 | 49,213 | 37,844 | |||||
Fixed rate floor income contribution to spread, net | 0.66 | % | 0.68 | % | 0.59 | % | |||
(a) | Includes settlement payments on derivatives used to hedge student loans earning fixed rate floor income. |
The high levels of fixed rate floor income earned during 2015 and 2014 are due to historically low interest rates. If interest rates remain low, the Company anticipates continuing to earn significant fixed rate floor income in future periods. See Item 3, “Quantitative and Qualitative Disclosures About Market Risk,” which provides additional detail on the Company’s portfolio earning fixed rate floor income and the derivatives used by the Company to hedge these loans.
Fixed rate floor income increased during the three months ended March 31, 2015, compared to the same period in 2014, due to purchases of loans earning fixed rate floor income. In addition, as derivative instruments used to hedge student loans earning fixed rate floor income continue to expire, the Company is paying less in derivative settlements.
34
Summary and Comparison of Operating Results
Three months ended March 31, | Additional information | |||||||
2015 | 2014 | |||||||
Net interest income after provision for loan losses | $ | 99,883 | 95,027 | See table below for additional analysis. | ||||
Other income | 4,576 | 4,164 | The primary component of other income is borrower late fees, which were $4.1 million and $3.7 million for the three months ended March 31, 2015 and 2014, respectively. | |||||
Gain on sale of loans and debt repurchases | 351 | 39 | ||||||
Derivative market value and foreign currency adjustments, net | 3,590 | 3,477 | Includes (i) the unrealized gains and losses that are caused by changes in fair values of derivatives which do not qualify for "hedge treatment" under GAAP; and (ii) the foreign currency transaction gains or losses caused by the re-measurement of the Company's Euro-denominated bonds to U.S. dollars. | |||||
Derivative settlements, net | (4,963 | ) | (5,977 | ) | The Company maintains an overall risk management strategy that incorporates the use of derivative instruments to reduce the economic effect of interest rate volatility. Derivative settlements for each applicable period should be evaluated with the Company's net interest income as reflected in the table below. | |||
Total other income | 3,554 | 1,703 | ||||||
Salaries and benefits | 541 | 609 | ||||||
Loan servicing fees | 7,685 | 5,421 | Third party servicing fees have increased due to recent purchases of a significant amount of loans serviced at third parties. | |||||
Other expenses | 1,068 | 1,725 | ||||||
Intersegment expenses, net | 13,040 | 14,371 | Amount includes fees paid to the LGS operating segment for the servicing of the Company’s student loan portfolio. Decrease due to run off of the portfolio serviced by LGS. | |||||
Total operating expenses | 22,334 | 22,126 | ||||||
Income before income taxes and corporate overhead allocation | 81,103 | 74,604 | ||||||
Corporate overhead allocation | (1,078 | ) | (1,329 | ) | ||||
Income before income taxes | 80,025 | 73,275 | ||||||
Income tax expense | (30,409 | ) | (27,844 | ) | ||||
Net income | $ | 49,616 | 45,431 | |||||
Additional information: | ||||||||
Net income | $ | 49,616 | 45,431 | The Company provides non-GAAP information that reflects specific items management believes to be important in the evaluation of its operating results. The Company believes the point-in-time estimates of asset and liability values related to its derivatives and Euro-denominated bonds that are subject to interest and currency rate fluctuations affect the period-to-period comparability of the results of operations. These items are excluded here for comparability purposes. | ||||
Derivative market value and foreign currency adjustments, net | (3,590 | ) | (3,477 | ) | ||||
Tax effect | 1,364 | 1,321 | ||||||
Net income, excluding derivative market value and foreign currency adjustments | $ | 47,390 | 43,275 | |||||
35
The following table summarizes the components of "net interest income after provision for loan losses" and "derivative settlements, net."
Three months ended March 31, | Additional information | |||||||
2015 | 2014 | |||||||
Variable interest income, net of settlements on derivatives | $ | 176,477 | 160,949 | Increase due to an increase in the average student loan portfolio and an increase in the gross yield earned on student loans, net of settlements on derivatives. | ||||
Consolidation rebate fees | (58,871 | ) | (51,323 | ) | Increase due to an increase in the average consolidation loan balance. | |||
Discount accretion, net of premium and deferred origination costs amortization | 3,131 | 3,449 | ||||||
Interest on bonds and notes payable | (70,104 | ) | (58,679 | ) | Increase due to an increase in the average debt outstanding and increase in cost of funds. | |||
Variable student loan interest margin, net of settlements on derivatives | 50,633 | 54,396 | ||||||
Fixed rate floor income, net of settlements on derivatives | 46,244 | 37,844 | The high levels of fixed rate floor income earned are due to historically low interest rates. Fixed rate floor income has increased year over year due to recent purchases of loans earning fixed rate floor income. | |||||
Investment interest | 479 | 107 | ||||||
Intercompany interest | (436 | ) | (797 | ) | ||||
Provision for loan losses - federally insured | (2,000 | ) | (3,000 | ) | ||||
Recovery of loan losses - private education loans | — | 500 | ||||||
Net interest income after provision for loan losses (net of settlements on derivatives) | $ | 94,920 | 89,050 | |||||
LIQUIDITY AND CAPITAL RESOURCES
The Company’s fee generating businesses are non-capital intensive and all produce positive operating cash flows. As such, a minimal amount of debt and equity capital is allocated to the fee-based segments and any liquidity or capital needs are satisfied using cash flow from operations. Therefore, the Liquidity and Capital Resources discussion is concentrated on the Company’s liquidity and capital needs to meet existing debt obligations in the Asset Generation and Management operating segment.
Sources of Liquidity Currently Available
The Company has historically generated positive cash flow from operations. For the three months ended March 31, 2015 and the year ended December 31, 2014, the Company's net cash provided by operating activities was $129.3 million and $357.4 million, respectively.
As of March 31, 2015, the Company had cash and cash equivalents of $100.0 million. The Company also had a portfolio of available-for-sale and trading investments, consisting primarily of student loan asset-backed securities, with a fair value of $146.8 million as of March 31, 2015.
In addition, the Company has a $350.0 million unsecured line of credit that matures on June 30, 2019. As of March 31, 2015, nothing was outstanding on the unsecured line of credit and $350.0 million was available for future use.
As part of the Company’s asset-backed securitizations, the Company has purchased certain of the Class B subordinated note tranches. In addition, the Company has repurchased certain of its own asset-backed securities (bonds and notes payable) in the secondary market. For accounting purposes, these notes are effectively retired and are not included on the Company’s consolidated balance sheet. However, these securities are legally outstanding at the trust level and the Company could sell these notes to third parties or redeem the notes at par as cash is generated by the trust estate. Upon a sale of these notes to third parties, the Company would obtain cash proceeds equal to the market value of the notes on the date of such sale. As of March 31, 2015, the Company holds $61.1 million (par value) of its own asset-backed securities that are not included in the consolidated financial statements.
36
The Company intends to use its liquidity position to capitalize on market opportunities, including FFELP and private education loan acquisitions; strategic acquisitions and investments; and capital management initiatives, including stock repurchases, debt repurchases, and dividend distributions. Dependent upon the timing and size of the opportunities, the Company may continue to accumulate additional cash and investments.
Cash Flows
During the three months ended March 31, 2015, the Company generated $129.3 million from operating activities, compared to $88.6 million for the same period in 2014. The increase in cash provided by operating activities reflects changes in the adjustments to net income for non-cash depreciation and amortization, non-cash fair value adjustments for derivatives, proceeds from terminating certain derivative instrument contracts, and an increase in other liabilities during the three months ended March 31, 2015. These factors were partially offset by the non-cash foreign currency transaction adjustment related to the Company's Euro denominated bonds payable. Accrued interest on loans purchased is included in cash flows from operating activities in the respective period. Net purchased accrued interest was $24.1 million and $3.8 million for the three months ended March 31, 2015 and 2014, respectively.
The primary items included in the statement of cash flows for investing activities are the purchase and repayment of student loans. The primary items included in financing activities are the proceeds from the issuance of and payments on bonds and notes payable used to fund student loans. Cash provided by investing activities for the three months ended March 31, 2015 and 2014 was $31.8 million and $340.5 million, respectively, and cash used in financing activities was $191.6 million and $385.3 million for the three months ended March 31, 2015 and 2014, respectively. Investing and financing activities are further addressed in the discussion that follows.
Liquidity Needs and Sources of Liquidity Available to Satisfy Debt Obligations Secured by Student Loan Assets and Related Collateral
The following table shows the Company's debt obligations outstanding that are secured by student loan assets and related collateral.
As of March 31, 2015 | |||||
Carrying amount | Final maturity | ||||
Bonds and notes issued in asset-backed securitizations | $ | 27,047,703 | 8/26/19 - 8/26/52 | ||
FFELP warehouse facilities | 1,010,258 | 1/17/16 - 12/17/17 | |||
Other borrowings | 82,305 | 11/11/15 - 12/31/18 | |||
$ | 28,140,266 | ||||
Bonds and Notes Issued in Asset-backed Securitizations
The majority of the Company’s portfolio of student loans is funded in asset-backed securitizations that are structured to substantially match the maturity of the funded assets, thereby minimizing liquidity risk. In addition, due to (i) the difference between the yield the Company receives on the loans and cost of financing within these transactions, and (ii) the servicing and administration fees the Company earns from these transactions, the Company has created a portfolio that will generate earnings and significant cash flow over the life of these transactions.
As of March 31, 2015, based on cash flow models developed to reflect management’s current estimate of, among other factors, prepayments, defaults, deferment, forbearance, and interest rates, the Company currently expects future undiscounted cash flows from its portfolio to be approximately $2.27 billion as detailed below. The $2.27 billion includes approximately $588.5 million (as of March 31, 2015) of overcollateralization included in the asset-backed securitizations. These excess net asset positions are reflected variously in the following balances in the consolidated balance sheet: "student loans receivable," "restricted cash and investments," and "accrued interest receivable."
The forecasted cash flow presented below includes all loans funded in asset-backed securitizations as of March 31, 2015. As of March 31, 2015, the Company had $26.9 billion of loans included in asset-backed securitizations, which represented 96.3 percent of its total FFELP student loan portfolio. The forecasted cash flow does not include cash flows that the Company expects to receive related to loans funded in its warehouse facilities as of March 31, 2015 or loans acquired subsequent to March 31, 2015.
37
FFELP Asset-backed Securitization Cash Flow Forecast
$2.27 billion
(dollars below in millions)
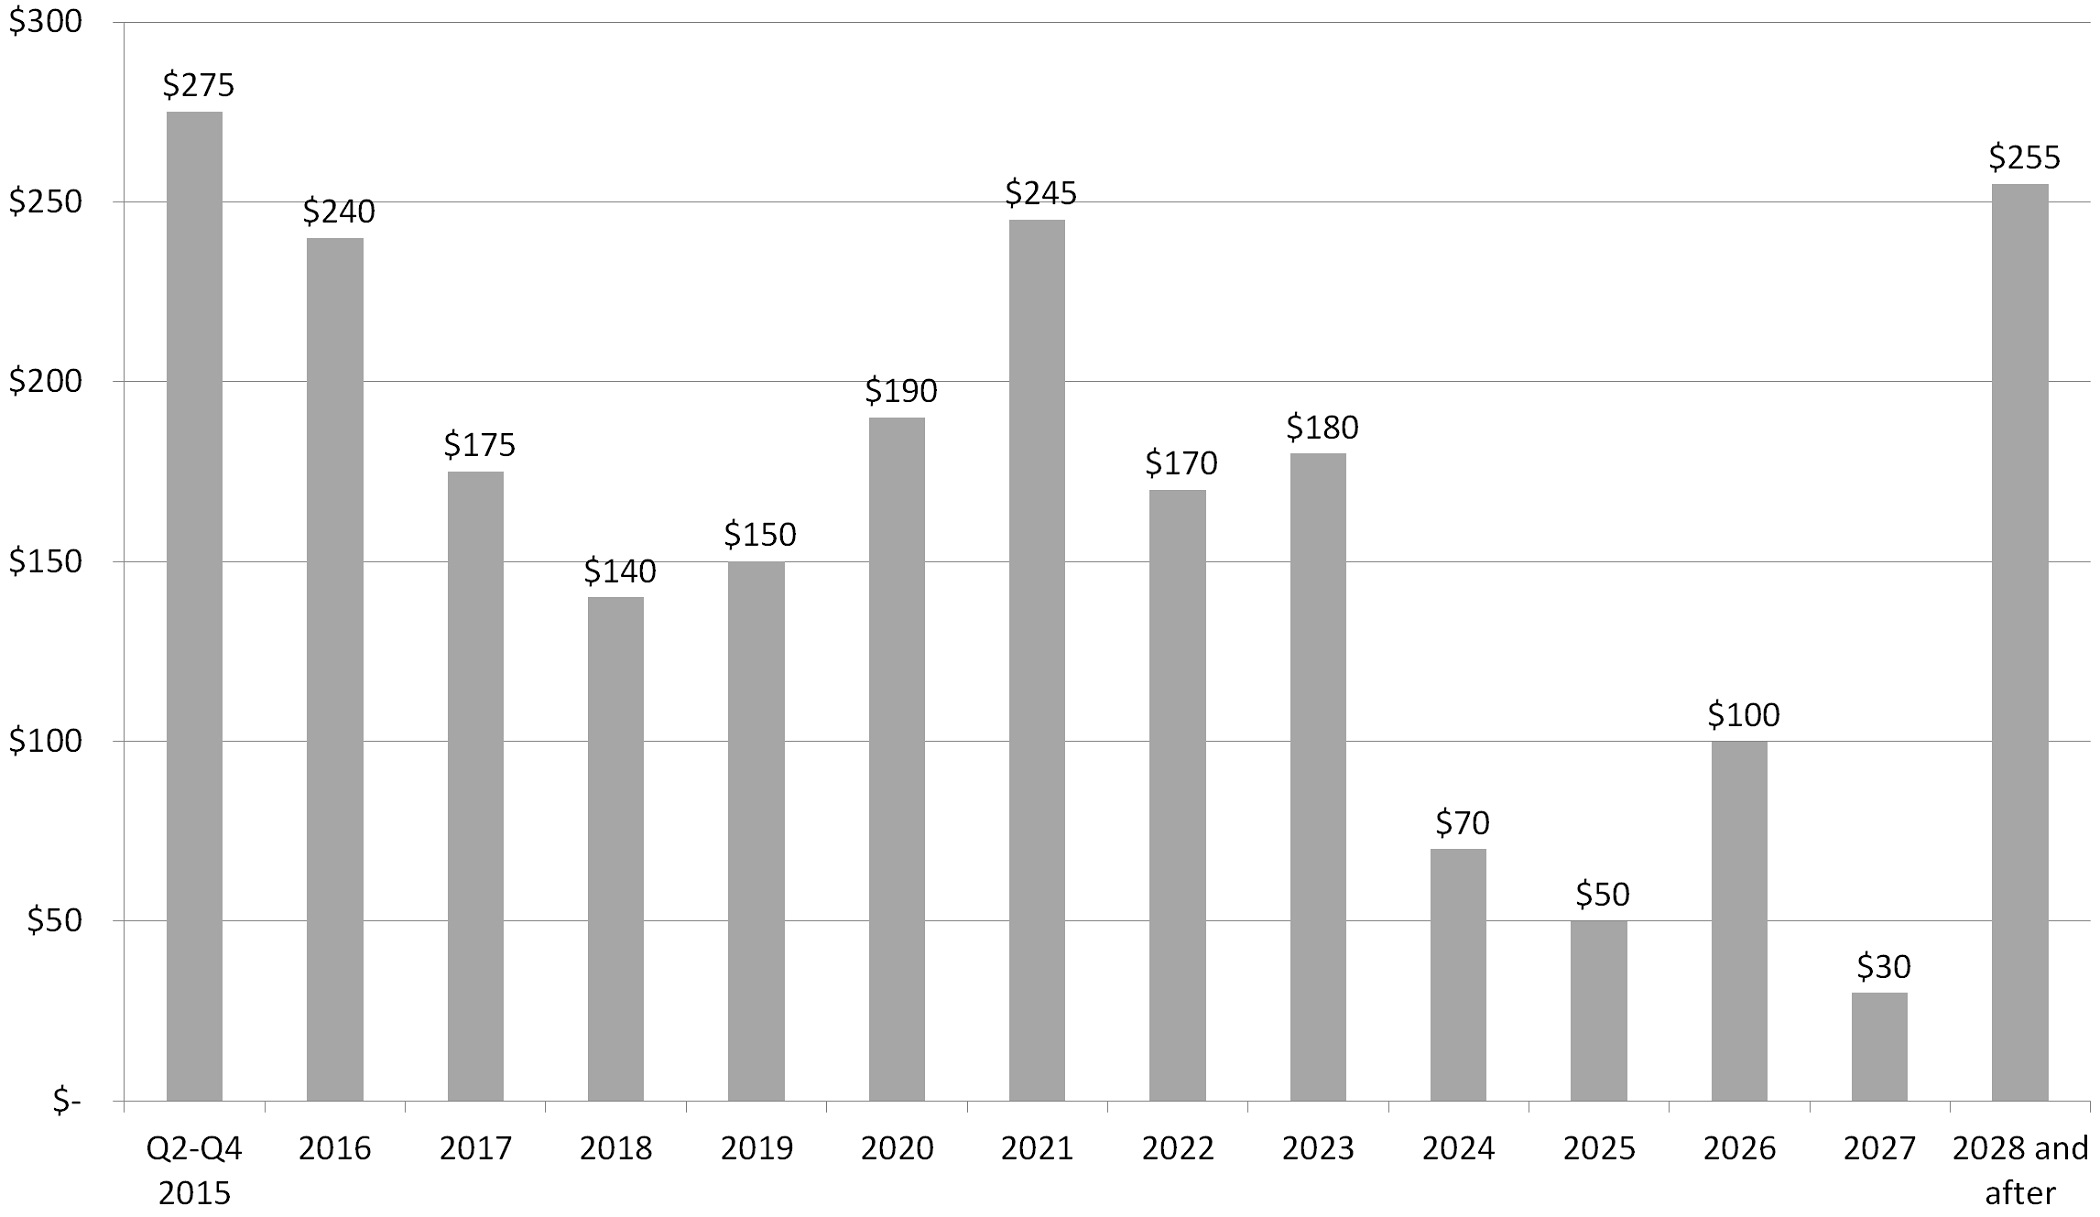
The Company uses various assumptions, including prepayments and future interest rates, when preparing its cash flow forecast. These assumptions are further discussed below.
Prepayments: The primary variable in establishing a life of loan estimate is the level and timing of prepayments. Prepayment rates equal the amount of loans that prepay annually as a percentage of the beginning of period balance, net of scheduled principal payments. A number of factors can affect estimated prepayment rates, including the level of consolidation activity and default rates. Should any of these factors change, management may revise its assumptions, which in turn would impact the projected future cash flow. The Company’s cash flow forecast above assumes prepayment rates that are generally consistent with those utilized in the Company’s recent asset-backed securitization transactions. If management used a prepayment rate assumption two times greater than what was used to forecast the cash flow, the cash flow forecast would be reduced by approximately $250 million to $310 million.
Interest rates: The Company funds a large portion of its student loans with three-month LIBOR indexed floating rate securities. Meanwhile, the interest earned on the Company’s student loan assets is indexed primarily to a one-month LIBOR rate. The different interest rate characteristics of the Company’s loan assets and liabilities funding these assets result in basis risk. The Company’s cash flow forecast assumes three-month LIBOR will exceed one-month LIBOR by 12 basis points for the life of the portfolio, which approximates the historical relationship between these indices. If the forecast is computed assuming a spread of 24 basis points between three-month and one-month LIBOR for the life of the portfolio, the cash flow forecast would be reduced by approximately $120 million to $160 million.
The Company uses the current forward interest rate yield curve to forecast cash flows. A change in the forward interest rate curve would impact the future cash flows generated from the portfolio. An increase in future interest rates will reduce the amount of fixed rate floor income the Company is currently receiving. The Company attempts to mitigate the impact of a rise in short-term rates by hedging interest rate risks. As of March 31, 2015, the net fair value of the Company’s interest rate derivatives used to hedge loans earning fixed rate floor income was a net liability of $4.7 million. See Item 3, "Quantitative and Qualitative Disclosures About Market Risk — Interest Rate Risk."
38
FFELP Warehouse Facilities
The Company funds a portion of its FFELP loan acquisitions using its FFELP warehouse facilities. Student loan warehousing allows the Company to buy and manage student loans prior to transferring them into more permanent financing arrangements. As of March 31, 2015, the Company had three FFELP warehouse facilities with an aggregate maximum financing amount available of $2.0 billion, of which $1.0 billion was outstanding, and $1.0 billion was available for future use. Of the three facilities, one facility provides for formula-based advance rates, depending on FFELP loan type, up to a maximum of the principal and interest of loans financed. The advance rate for collateral may increase or decrease based on market conditions. The other two FFELP warehouse facilities have static advance rates that require initial equity for loan funding, but do not require increased equity based on market movements. As of March 31, 2015, the Company had $55.2 million advanced as equity support on its FFELP warehouse facilities. For further discussion of the Company's FFELP warehouse facilities outstanding at March 31, 2015, see note 3 of the notes to consolidated financial statements included under Part I, Item 1 of this report.
Upon termination or expiration of the warehouse facilities, the Company would expect to access the securitization market, obtain replacement warehouse facilities, use operating cash, consider the sale of assets, or transfer collateral to satisfy any remaining obligations.
Other Uses of Liquidity
Effective July 1, 2010, no new loan originations can be made under the FFEL Program and all new federal loan originations must be made through the Federal Direct Loan Program. As a result, the Company no longer originates new FFELP loans, but continues to acquire FFELP loan portfolios from third parties and believes additional loan purchase opportunities exist.
The Company plans to fund future FFELP student loan acquisitions using current cash and investments; using its Union Bank participation agreement (as described below); using its FFELP warehouse facilities (as described above); and continuing to access the asset-backed securitization market.
In addition, the Company has entered into an agreement in which it is committed to purchase private education loans. On February 5, 2015, the Company entered into an agreement with CommonBond, Inc. ("CommonBond"), a student lending company that provides private education loans to graduate students, under which the Company committed to purchase up to $150.0 million of private education loans. As of March 31, 2015, the Company had purchased $15.2 million in private education loans from CommonBond pursuant to this agreement. The Company intends to use operating cash and its unsecured line of credit to initially fund these private education loans. The Company is currently forming a private education loan warehouse facility to be used to pool loans before financing them under more permanent securitization financing arrangements. If the Company is not successful in establishing specific financing facilities for private education loans, the Company's liquidity could be adversely affected and the Company's opportunities to purchase additional such loans could be limited.
Union Bank Participation Agreement
The Company maintains an agreement with Union Bank, as trustee for various grantor trusts, under which Union Bank has agreed to purchase from the Company participation interests in student loans. As of March 31, 2015, $523.4 million of loans were subject to outstanding participation interests held by Union Bank, as trustee, under this agreement. The agreement automatically renews annually and is terminable by either party upon five business days notice. This agreement provides beneficiaries of Union Bank’s grantor trusts with access to investments in interests in student loans, while providing liquidity to the Company. The Company can participate loans to Union Bank to the extent of availability under the grantor trusts, up to $750 million or an amount in excess of $750 million if mutually agreed to by both parties. Loans participated under this agreement have been accounted for by the Company as loan sales. Accordingly, the participation interests sold are not included in the Company’s consolidated balance sheets.
Asset-backed Securitization Transactions
During the first quarter of 2015, the Company completed two asset-backed securitizations totaling $1.3 billion. Depending on market conditions, the Company anticipates continuing to access the asset-backed securitization market. Asset-backed securitization transactions would be used to refinance student loans included in the FFELP warehouse facilities, including additional purchased FFELP loans, and/or existing asset-backed securitizations.
39
Liquidity Impact Related to Hedging Activities
The Company utilizes derivative instruments to manage interest rate sensitivity. By using derivative instruments, the Company is exposed to market risk which could impact its liquidity. Based on the derivative portfolio outstanding as of March 31, 2015, the Company does not currently anticipate any movement in interest rates having a material impact on its capital or liquidity profile, nor does the Company expect that any movement in interest rates would have a material impact on its ability to meet potential collateral deposits with its counterparties. However, if interest rates move materially and negatively impact the fair value of the Company's derivative portfolio or if the Company enters into additional derivatives for which the fair value becomes negative, the Company could be required to deposit additional collateral with its derivative instrument counterparties and/or a third-party clearinghouse. The collateral deposits, if significant, could negatively impact the Company's liquidity and capital resources. As of March 31, 2015, the fair value of the Company's derivatives which were subject to collateral exposure with counterparties and/or a clearinghouse and had a negative fair value (a liability in the Company's balance sheet), was $15.3 million. As of March 31, 2015, the Company had $12.0 million of collateral deposited with counterparties or a clearinghouse related to its derivative portfolio.
Other Debt Facilities
As previously discussed, the Company has a $350.0 million unsecured line of credit with a maturity date of June 30, 2019. As of March 31, 2015, nothing was outstanding on the unsecured line of credit and $350.0 million was available for future use.
The Company has issued Hybrid Securities that have a final maturity of September 15, 2061. The Hybrid Securities are unsecured obligations of the Company. As of March 31, 2015, $59.8 million of Hybrid Securities were outstanding.
Debt Repurchases
Due to the Company's positive liquidity position and opportunities in the capital markets, the Company has repurchased its own debt over the last several years, and may continue to do so in the future. Gains recorded by the Company from the repurchase of debt are included in "gain on sale of loans and debt repurchases" on the Company’s consolidated statements of income. For the three months ended March 31, 2015, the Company recognized a gain of approximately $2.5 million from the repurchase of $11.9 million (par value) of its own Hybrid Securities.
Stock Repurchases
The Board of Directors has authorized a stock repurchase program to repurchase up to a total of five million shares of the Company's Class A common stock during the three-year period ending May 24, 2015. Shares may be repurchased from time to time depending on various factors, including share prices and other potential uses of liquidity. Shares repurchased by the Company during the first three months of 2015 are shown below. For additional information on stock repurchases during the first quarter of 2015, see "Stock Repurchases" under Part II, Item 2 of this report.
Total shares repurchased | Purchase price (in thousands) | Average price of shares repurchased (per share) | |||||||
Quarter ended March 31, 2015 | 175,798 | $ | 7,939 | 45.16 | |||||
As of March 31, 2015, 3,370,612 shares remain authorized for repurchase under this stock repurchase program. In March 2015, the Board of Directors authorized a new stock repurchase program to repurchase up to a total of five million shares of the Company's Class A common stock during the three-year period ending May 24, 2018. The five million shares authorized under the new program include the remaining un-repurchased shares from the current program, which the new program will replace.
Dividends
On March 13, 2015, the Company paid a first quarter 2015 cash dividend on the Company's Class A and Class B common stock of $0.10 per share. In addition, the Company's Board of Directors has declared a second quarter 2015 cash dividend on the Company's outstanding shares of Class A and Class B common stock of $0.10 per share. The second quarter cash dividend will be paid on June 15, 2015, to shareholders of record at the close of business on June 1, 2015.
The Company currently plans to continue making regular quarterly dividend payments, subject to future earnings, capital requirements, financial condition, and other factors. In addition, the payment of dividends is subject to the terms of the Company’s
40
outstanding Hybrid Securities, which generally provide that if the Company defers interest payments on those securities it cannot pay dividends on its capital stock.
Off-Balance Sheet Arrangements
The Company does not have any off-balance sheet arrangements that have or are reasonably likely to have a current or future effect on its financial condition, revenues or expenses, results of operations, liquidity, capital expenditures, or capital resources that are material to investors.
RECENT ACCOUNTING PRONOUNCEMENTS
In May 2014, the FASB issued accounting guidance regarding the recognition of revenue from contracts with customers, which requires an entity to recognize the amount of revenue to which it expects to be entitled for the transfer of promised goods or services to customers. This guidance will replace most existing revenue recognition guidance once it becomes effective on January 1, 2017, subject to a proposal by the FASB in April 2015 to defer the effective date by one year. Early application is not permitted, and the standard allows the use of either the retrospective or cumulative effect transition method. The Company is evaluating the impact this standard will have on its ongoing financial reporting, and has not yet selected a method of transition.
In February 2015, the FASB issued accounting guidance regarding consolidation analysis, which amends current guidance and changes the way reporting entities evaluate whether (i) the entity should consolidate limited partnerships and similar entities, (ii) fees paid to a decision maker or service provider are variable interests in a variable interest entity ("VIE"), and (iii) variable interests in a VIE held by related parties of the reporting entity require the reporting entity to consolidate the VIE. This guidance is effective for the Company beginning January 1, 2016; however, early adoption is permitted. The Company is evaluating the impact this standard will have on its ongoing financial reporting.
In April 2015, the FASB issued accounting guidance regarding the presentation of debt issuance costs, which are currently recognized as a separate asset on the Company's balance sheet. The new guidance requires that entities present debt issuance costs related to a debt liability as a direct deduction from that liability on the balance sheet. This guidance will be effective for the Company beginning January 1, 2016. Early adoption of the new standard is permitted for financial statements that have not yet been issued, and adoption should be applied retrospectively. As of March 31, 2015, the Company had $71.5 million of debt issuance costs that is included in "other assets" on the consolidated balance sheet. This pronouncement will not have a material impact on the Company's financial position or results of operations.
ITEM 3. QUANTITATIVE AND QUALITATIVE DISCLOSURES ABOUT MARKET RISK
(All dollars are in thousands, except share amounts, unless otherwise noted)
Interest Rate Risk
The Company’s primary market risk exposure arises from fluctuations in its borrowing and lending rates, the spread between which could impact the Company due to shifts in market interest rates.
The following table sets forth the Company’s loan assets and debt instruments by interest rate characteristics:
As of March 31, 2015 | As of December 31, 2014 | ||||||||||||
Dollars | Percent | Dollars | Percent | ||||||||||
Fixed-rate loan assets | $ | 12,398,756 | 44.1 | % | $ | 12,700,494 | 45.0 | % | |||||
Variable-rate loan assets | 15,708,332 | 55.9 | 15,523,414 | 55.0 | |||||||||
Total | $ | 28,107,088 | 100.0 | % | $ | 28,223,908 | 100.0 | % | |||||
Fixed-rate debt instruments | $ | — | — | % | $ | — | — | % | |||||
Variable-rate debt instruments | 28,200,103 | 100.0 | 28,420,422 | 100.0 | |||||||||
Total | $ | 28,200,103 | 100.0 | % | $ | 28,420,422 | 100.0 | % | |||||
FFELP loans originated prior to April 1, 2006 generally earn interest at the higher of the borrower rate, which is fixed over a period of time, or a floating rate based on the Special Allowance Payments ("SAP") formula set by the Department. The SAP rate is based on an applicable index plus a fixed spread that depends on loan type, origination date, and repayment status. The Company generally finances its student loan portfolio with variable rate debt. In low and/or certain declining interest rate environments, when the fixed borrower rate is higher than the SAP rate, these student loans earn at a fixed rate while the interest on the variable
41
rate debt typically continues to reflect the low and/or declining interest rates. In these interest rate environments, the Company may earn additional spread income that it refers to as floor income.
Depending on the type of loan and when it was originated, the borrower rate is either fixed to term or is reset to an annual rate each July 1. As a result, for loans where the borrower rate is fixed to term, the Company may earn floor income for an extended period of time, which the Company refers to as fixed rate floor income, and for those loans where the borrower rate is reset annually on July 1, the Company may earn floor income to the next reset date, which the Company refers to as variable rate floor income. All FFELP loans first originated on or after April 1, 2006 effectively earn at the SAP rate, since lenders are required to rebate fixed rate floor income and variable rate floor income for those loans to the Department.
No variable-rate floor income was earned by the Company during 2014 and 2015. A summary of fixed rate floor income earned by the Company follows.
Three months ended March 31, | ||||||
2015 | 2014 | |||||
Fixed rate floor income, gross | $ | 51,259 | 44,794 | |||
Derivative settlements (a) | (5,015 | ) | (6,950 | ) | ||
Fixed rate floor income, net | $ | 46,244 | 37,844 | |||
(a) | Includes settlement payments on derivatives used to hedge student loans earning fixed rate floor income. |
The high levels of fixed rate floor income earned during 2015 and 2014 are due to historically low interest rates. If interest rates remain low, the Company anticipates continuing to earn significant fixed rate floor income in future periods.
Fixed rate floor income has increased during the three months ended March 31, 2015 compared to the same period in 2014 due to recent purchases of loans earning fixed rate floor income. In addition, as derivative instruments used to hedge student loans earning fixed rate floor income continue to expire, the Company is paying less in derivative settlements.
Absent the use of derivative instruments, a rise in interest rates may reduce the amount of floor income received and this may have an impact on earnings due to interest margin compression caused by increasing financing costs, until such time as the federally insured loans earn interest at a variable rate in accordance with their SAP formulas. In higher interest rate environments, where the interest rate rises above the borrower rate and fixed rate loans effectively become variable rate loans, the impact of the rate fluctuations is reduced.
The following graph depicts fixed rate floor income for a borrower with a fixed rate of 6.75% and a SAP rate of 2.64%:
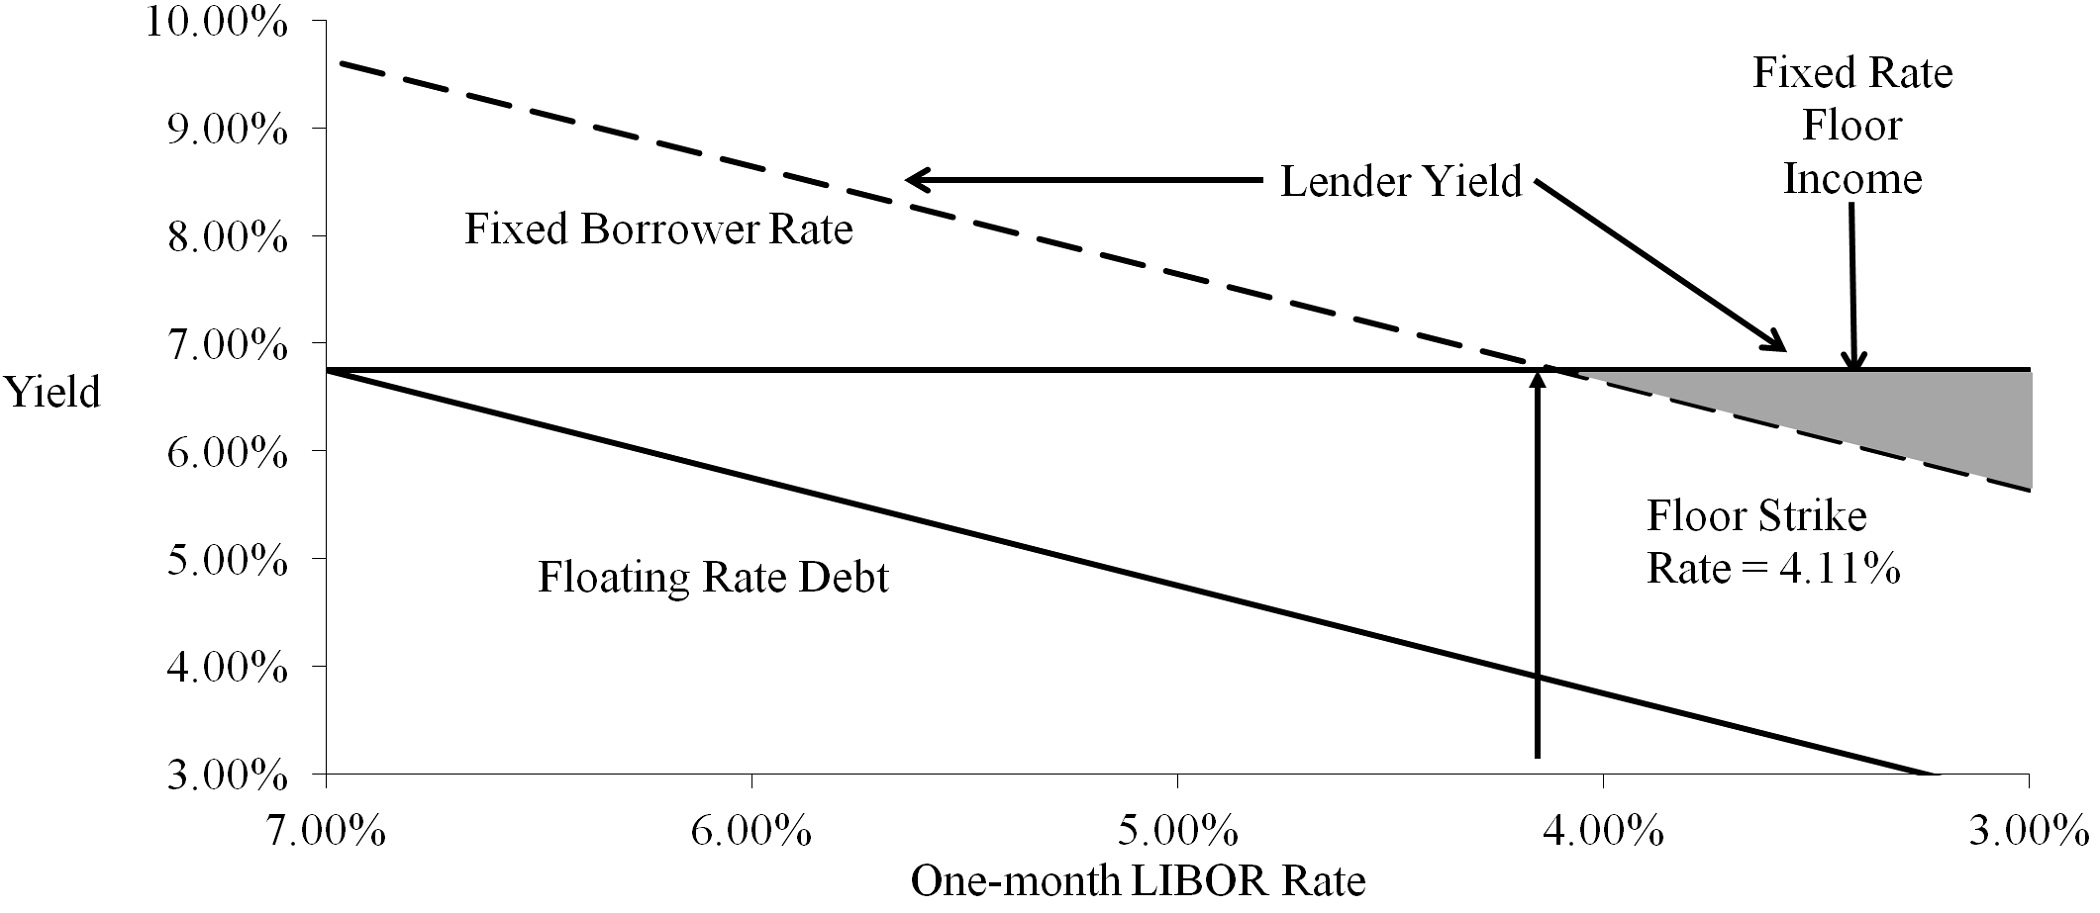
42
The following table shows the Company’s student loan assets that were earning fixed rate floor income as of March 31, 2015.
Borrower/ | Estimated | |||||||
Fixed | lender | variable | ||||||
interest | weighted | conversion | Loan | |||||
rate range | average yield | rate (a) | balance | |||||
< 3.0% | 2.88% | 0.24% | $ | 1,805,151 | ||||
3.0 - 3.49% | 3.19% | 0.55% | 2,266,800 | |||||
3.5 - 3.99% | 3.65% | 1.01% | 2,219,177 | |||||
4.0 - 4.49% | 4.20% | 1.56% | 1,696,214 | |||||
4.5 - 4.99% | 4.72% | 2.08% | 1,050,092 | |||||
5.0 - 5.49% | 5.22% | 2.58% | 661,683 | |||||
5.5 - 5.99% | 5.67% | 3.03% | 383,874 | |||||
6.0 - 6.49% | 6.18% | 3.54% | 447,053 | |||||
6.5 - 6.99% | 6.70% | 4.06% | 426,004 | |||||
7.0 - 7.49% | 7.17% | 4.53% | 178,772 | |||||
7.5 - 7.99% | 7.71% | 5.07% | 305,639 | |||||
8.0 - 8.99% | 8.18% | 5.54% | 689,526 | |||||
> 9.0% | 9.04% | 6.40% | 268,771 | |||||
$ | 12,398,756 | |||||||
(a) | The estimated variable conversion rate is the estimated short-term interest rate at which loans would convert to a variable rate. As of March 31, 2015, the weighted average estimated variable conversion rate was 1.84% and the short-term interest rate was 17 basis points. |
The following table summarizes the outstanding derivative instruments as of March 31, 2015 used by the Company to economically hedge loans earning fixed rate floor income.
Maturity | Notional amount | Weighted average fixed rate paid by the Company (a) | |||||
2015 | $ | 1,100,000 | 0.89 | % | |||
2016 | 750,000 | 0.85 | |||||
2017 | 1,350,000 | 0.85 | |||||
2018 | 100,000 | 1.02 | |||||
2025 | 100,000 | 2.32 | |||||
2045 | 25,000 | 2.46 | |||||
$ | 3,425,000 | 0.92 | % | ||||
(a) | For all interest rate derivatives, the Company receives discrete three-month LIBOR. |
43
The Company is also exposed to interest rate risk in the form of basis risk and repricing risk because the interest rate characteristics of the Company’s assets do not match the interest rate characteristics of the funding for those assets. The following table presents the Company’s FFELP student loan assets and related funding for those assets arranged by underlying indices as of March 31, 2015:
Index | Frequency of variable resets | Assets | Debt outstanding that funded student loan assets | ||||||
1 month LIBOR (a) | Daily | $ | 27,078,886 | — | |||||
3 month Treasury bill | Daily | 896,689 | — | ||||||
3 month LIBOR (a) (b) | Quarterly | — | 15,715,523 | ||||||
1 month LIBOR | Monthly | — | 10,672,120 | ||||||
Auction-rate (c) | Varies | — | 1,197,065 | ||||||
Asset-backed commercial paper (d) | Varies | — | 473,253 | ||||||
Other (e) | 164,691 | 82,305 | |||||||
$ | 28,140,266 | 28,140,266 | |||||||
(a) | The Company has certain basis swaps outstanding in which the Company receives three-month LIBOR and pays one-month LIBOR plus or minus a spread as defined in the agreements (the "1:3 Basis Swaps"). The Company entered into these derivative instruments to better match the interest rate characteristics on its student loan assets and the debt funding such assets. The following table summarizes these derivatives as of March 31, 2015: |
Maturity | Notional amount | |||||
2016 | $ | 1,000,000 | ||||
2022 | 1,900,000 | |||||
2023 | 2,400,000 | |||||
2026 | 800,000 | |||||
$ | 6,100,000 | (1) | ||||
(1) | The weighted average rate paid by the Company on the 1:3 Basis Swaps as of March 31, 2015 was one-month LIBOR plus 6.0 basis points. |
(b) | The Company has Euro-denominated notes that reprice on the EURIBOR index. The Company has entered into a derivative instrument (cross-currency interest rate swap) that converts the EURIBOR index to three-month LIBOR. As a result, these notes are reflected in the three-month LIBOR category in the above table. See “Foreign Currency Exchange Risk.” |
(c) | The interest rates on certain of the Company's asset-backed securities are set and periodically reset via a "dutch auction" (“Auction Rate Securities”). As of March 31, 2015, the Company was sponsor for $1.2 billion of Auction Rate Securities. Since February 2008, problems in the auction rate securities market as a whole have led to failures of the auctions pursuant to which the Company's Auction Rate Securities' interest rates are set. As a result, the Auction Rate Securities generally pay interest to the holder at a maximum rate as defined by the indenture. While these rates will vary, they will generally be based on a spread to LIBOR or Treasury Securities, or the Net Loan Rate as defined in the financing documents. |
(d) | The interest rates on certain of the Company's warehouse facilities are indexed to asset-backed commercial paper rates. |
(e) | Assets include restricted cash and investments and other assets. Debt outstanding includes other debt obligations secured by student loan assets and related collateral. |
44
Sensitivity Analysis
The following tables summarize the effect on the Company’s earnings, based upon a sensitivity analysis performed by the Company assuming hypothetical increases in interest rates of 100 basis points and 300 basis points while funding spreads remain constant. In addition, a sensitivity analysis was performed assuming the funding index increases 10 basis points and 30 basis points while holding the asset index constant, if the funding index is different than the asset index. The sensitivity analysis was performed on the Company’s variable rate assets (including loans earning fixed rate floor income) and liabilities. The analysis includes the effects of the Company’s interest rate and basis swaps in existence during these periods.
Interest rates | Asset and funding index mismatches | ||||||||||||||||||||||||||
Change from increase of 100 basis points | Change from increase of 300 basis points | Increase of 10 basis points | Increase of 30 basis points | ||||||||||||||||||||||||
Dollars | Percent | Dollars | Percent | Dollars | Percent | Dollars | Percent | ||||||||||||||||||||
Three months ended March 31, 2015 | |||||||||||||||||||||||||||
Effect on earnings: | |||||||||||||||||||||||||||
Decrease in pre-tax net income before impact of derivative settlements | $ | (19,784 | ) | (19.3 | )% | $ | (34,067 | ) | (33.3 | )% | $ | (4,207 | ) | (4.1 | )% | $ | (12,622 | ) | (12.3 | )% | |||||||
Impact of derivative settlements | 8,000 | 7.8 | 24,000 | 23.4 | 1,562 | 1.5 | 4,687 | 4.6 | |||||||||||||||||||
Increase (decrease) in net income before taxes | $ | (11,784 | ) | (11.5 | )% | $ | (10,067 | ) | (9.9 | )% | $ | (2,645 | ) | (2.6 | )% | $ | (7,935 | ) | (7.7 | )% | |||||||
Increase (decrease) in basic and diluted earnings per share | $ | (0.16 | ) | $ | (0.13 | ) | $ | (0.04 | ) | $ | (0.11 | ) | |||||||||||||||
Three months ended March 31, 2014 | |||||||||||||||||||||||||||
Effect on earnings: | |||||||||||||||||||||||||||
Decrease in pre-tax net income before impact of derivative settlements | $ | (16,934 | ) | (14.7 | )% | $ | (28,643 | ) | (24.9 | )% | $ | (4,076 | ) | (3.5 | )% | $ | (12,228 | ) | (10.6 | )% | |||||||
Impact of derivative settlements | 11,959 | 10.4 | 35,877 | 31.2 | 1,886 | 1.6 | 5,659 | 4.9 | |||||||||||||||||||
Increase (decrease) in net income before taxes | $ | (4,975 | ) | (4.3 | )% | $ | 7,234 | 6.3 | % | $ | (2,190 | ) | (1.9 | )% | $ | (6,569 | ) | (5.7 | )% | ||||||||
Increase (decrease) in basic and diluted earnings per share | $ | (0.07 | ) | $ | 0.10 | $ | (0.03 | ) | $ | (0.09 | ) | ||||||||||||||||
Foreign Currency Exchange Risk
The Company has issued €352.7 million Euro Notes with interest rates based on a spread to the EURIBOR index. As a result, the Company is exposed to the market risk related to fluctuations in foreign currency exchange rates between the U.S. dollar and Euro. The Company has entered into a cross-currency interest rate swap in connection with the issuance of the Euro Notes. See note 4 of the notes to consolidated financial statements included under Part I, Item 1 of this report for additional information, including a summary of the terms of this derivative instrument agreement and the related financial statement impact.
Financial Statement Impact – Derivatives and Foreign Currency Transaction Adjustments
For a table summarizing the effect of derivative instruments in the consolidated statements of income, including the components of "derivative market value and foreign currency adjustments and derivative settlements, net" included in the consolidated statements of income, see note 4 of the notes to consolidated financial statements included under Part I, Item 1 of this report.
ITEM 4. CONTROLS AND PROCEDURES
Disclosure Controls and Procedures
Under supervision and with the participation of certain members of the Company’s management, including the chief executive and chief financial officers, the Company completed an evaluation of the effectiveness of the design and operation of its disclosure controls and procedures (as defined in SEC Rules 13a-15(e) and 15d-15(e) under the Securities Exchange Act of 1934). Based on this evaluation, the Company’s principal executive and principal financial officers concluded that the disclosure controls and
45
procedures were effective as of the end of the period covered by this report to provide reasonable assurance that information required to be disclosed in reports the Company files or submits under the Securities Exchange Act of 1934 is recorded, processed, summarized, and reported, within the time periods specified in the SEC's rules and forms, and is accumulated and communicated to the Company's management, including the chief executive and chief financial officers, as appropriate to allow timely decisions regarding required disclosure.
Changes in Internal Control over Financial Reporting
There was no change in the Company’s internal control over financial reporting during the Company’s last fiscal quarter that has materially affected, or is reasonably likely to materially affect, the Company’s internal control over financial reporting.
PART II. OTHER INFORMATION
ITEM 1. LEGAL PROCEEDINGS
The information required by this Item is incorporated herein by reference to the information set forth under "Legal Proceedings and Regulatory Matters - Legal Proceedings" in note 12 of the notes to consolidated financial statements included under Part I, Item 1 of this report.
ITEM 1A. RISK FACTORS
There have been no material changes from the risk factors described in the Company’s Annual Report on Form 10-K for the year ended December 31, 2014 in response to Item 1A of Part I of such Form 10-K.
ITEM 2. UNREGISTERED SALES OF EQUITY SECURITIES AND USE OF PROCEEDS
Stock Repurchases
The following table summarizes the repurchases of Class A common stock during the first quarter of 2015 by the Company or any “affiliated purchaser” of the Company, as defined in Rule 10b-18(a)(3) under the Securities Exchange Act of 1934. Certain share repurchases included in the table below were made pursuant to a trading plan adopted by the Company in accordance with Rule 10b5-1 under the Securities Exchange Act of 1934.
Period | Total number of shares purchased (a) | Average price paid per share | Total number of shares purchased as part of publicly announced plans or programs (b) | Maximum number of shares that may yet be purchased under the plans or programs (b) | |||||||||
January 1 - January 31, 2015 | 84,676 | $ | 44.30 | 83,613 | 3,437,353 | ||||||||
February 1 - February 28, 2015 | 26,008 | 44.00 | 25,217 | 3,412,136 | |||||||||
March 1 - March 31, 2015 | 65,114 | 46.73 | 41,524 | 3,370,612 | |||||||||
Total | 175,798 | $ | 45.16 | 150,354 | |||||||||
(a) | The total number of shares includes: (i) shares repurchased pursuant to the stock repurchase program discussed in footnote (b) below; and (ii) shares owned and tendered by employees to satisfy tax withholding obligations upon the vesting of restricted shares. Shares of Class A common stock tendered by employees to satisfy tax withholding obligations included 1,063 shares, 791 shares, and 23,590 shares in January, February, and March 2015, respectively. Unless otherwise indicated, shares owned and tendered by employees to satisfy tax withholding obligations were purchased at the closing price of the Company’s shares on the date of vesting. |
(b) | On May 9, 2012, the Company announced that its Board of Directors had authorized a stock repurchase program to repurchase up to a total of five million shares of the Company's Class A common stock during the three-year period ending May 24, 2015. On May 7, 2015, the Company announced that its Board of Directors had authorized a new stock repurchase program to repurchase up to a total of five million shares of the Company's Class A common stock during the three-year period ending May 24, 2018. The five million shares authorized under the new program include the remaining un-repurchased shares from the current program, which the new program will replace. |
46
Working capital and dividend restrictions/limitations
The Company’s credit facilities, including its revolving line of credit which is available through June 30, 2019, impose restrictions with respect to the Company’s minimum consolidated net worth, the ratio of the Company’s adjusted EBITDA to corporate debt interest, the indebtedness of the Company's subsidiaries, and the ratio of non-FFELP loans to all loans in the Company's portfolio. In addition, trust indentures and other financing agreements governing debt issued by the Company's education lending subsidiaries may have general limitations on the amounts of funds that can be transferred to the Company by its subsidiaries through cash dividends.
The supplemental indenture for the Company’s Hybrid Securities issued in September 2006 provides that so long as any Hybrid Securities remain outstanding, if the Company gives notice of its election to defer interest payments but the related deferral period has not yet commenced or a deferral period is continuing, then the Company will not, and will not permit any of its subsidiaries to:
• | declare or pay any dividends or distributions on, or redeem, purchase, acquire or make a liquidation payment regarding, any of the Company’s capital stock. |
• | except as required in connection with the repayment of principal, and except for any partial payments of deferred interest that may be made through the alternative payment mechanism described in the Hybrid Securities indenture, make any payment of principal of, or interest or premium, if any, on, or repay, repurchase, or redeem any of the Company’s debt securities that rank pari passu with or junior to the Hybrid Securities. |
• | make any guarantee payments regarding any guarantee by the Company of the subordinated debt securities of any of the Company’s subsidiaries if the guarantee ranks pari passu with or junior in interest to the Hybrid Securities. |
In addition, if any deferral period lasts longer than one year, the limitation on the Company’s ability to redeem or repurchase any of its securities that rank pari passu with or junior in interest to the Hybrid Securities will continue until the first anniversary of the date on which all deferred interest has been paid or canceled.
If the Company is involved in a business combination where immediately after its consummation more than 50% of the surviving entity’s voting stock is owned by the shareholders of the other party to the business combination, then the immediately preceding sentence will not apply to any deferral period that is terminated on the next interest payment date following the date of consummation of the business combination.
However, at any time, including during a deferral period, the Company will be permitted to:
• | pay dividends or distributions in additional shares of the Company’s capital stock. |
• | declare or pay a dividend in connection with the implementation of a shareholders’ rights plan, or issue stock under such a plan, or redeem or repurchase any rights distributed pursuant to such a plan. |
• | purchase common stock for issuance pursuant to any employee benefit plans. |
47
ITEM 6. EXHIBITS
10.1 | Amendment No. 4 dated as of February 13, 2015 to Credit Agreement dated as of February 17, 2012, by and among Nelnet, Inc., U.S. Bank National Association, as Agent for the Lenders, and various lender parties thereto, filed as Exhibit 10.34 to the registrant's Annual Report on Form 10-K for the year ended December 31, 2014 and incorporated by reference herein. |
31.1* | Certification Pursuant to Section 302 of the Sarbanes-Oxley Act of 2002 of Chief Executive Officer Jeffrey R. Noordhoek. |
31.2* | Certification Pursuant to Section 302 of the Sarbanes-Oxley Act of 2002 of Chief Financial Officer James D. Kruger. |
32** | Certification Pursuant to 18 U.S.C. Section 1350, as Adopted Pursuant to Section 906 of the Sarbanes-Oxley Act of 2002. |
101.INS* | XBRL Instance Document |
101.SCH* | XBRL Taxonomy Extension Schema Document |
101.CAL* | XBRL Taxonomy Extension Calculation Linkbase Document |
101.DEF* | XBRL Taxonomy Extension Definition Linkbase Document |
101.LAB* | XBRL Taxonomy Extension Label Linkbase Document |
101.PRE* | XBRL Taxonomy Extension Presentation Linkbase Document |
* Filed herewith | |
** Furnished herewith | |
48
SIGNATURES
Pursuant to the requirements of the Securities Exchange Act of 1934, the registrant has duly caused this report to be signed on its behalf by the undersigned thereunto duly authorized.
NELNET, INC. | ||||
Date: | May 7, 2015 | By: | /s/ JEFFREY R. NOORDHOEK | |
Name: | Jeffrey R. Noordhoek | |||
Title: | Chief Executive Officer Principal Executive Officer | |||
By: | /s/ JAMES D. KRUGER | |||
Date: | May 7, 2015 | Name: | James D. Kruger | |
Title: | Chief Financial Officer Principal Financial Officer and Principal Accounting Officer | |||
49